Article

Otolith Image-Based Age Classification of Japanese Jack Mackerel Trachurus japonicus Using Convolutional Neural Networks


1
Department of Industry 4.0 Convergence Bionics Engineering, Pukyong National University, Busan 48513, Republic of Korea
2
Department of Marine Biology, Pukyong National University, Busan 48513, Republic of Korea
*
Author to whom correspondence should be addressed.
J. Mar. Sci. Eng. 2026, 14(12), 1145; https://doi.org/10.3390/jmse14121145
Submission received: 22 May 2026 / Revised: 15 June 2026 / Accepted: 18 June 2026 / Published: 22 June 2026
(This article belongs to the Section Marine Biology)

Abstract

Reliable age information is needed for fisheries assessment, but conventional otolith reading requires trained readers and considerable time. This study evaluated whether convolutional neural networks could classify reader-assigned age classes of Japanese jack mackerel Trachurus japonicus directly from sagittal otolith images. Otolith images from fish aged 0 to 4 years were used to compare three image-only backbones: Inception v3, Xception, and EfficientNet B4. The models were trained under the same data split, preprocessing, augmentation, and evaluation framework. In Stage 1, Inception v3 showed the highest validation macro F1 score (0.933) and was selected as the image-only baseline. After additional optimization, the selected model reached a validation macro F1 score of 0.944, validation exact accuracy of 0.935, and validation agreement within one age class of 1.000. On the independent test set, the optimized image-only model achieved exact accuracy of 0.866, macro F1 score of 0.873, and agreement within one year of 1.000. These results indicate that otolith images contain useful age-related visual information. Convolutional neural networks may support age class screening in T. japonicus, although they should complement rather than replace expert otolith reading. These findings apply to the initial screening of T. japonicus within the 0 to 4 age range represented in commercial purse seine catches, and performance for ages older than 4 was not evaluated.

1. Introduction

Age information is one of the basic requirements in fisheries science. It is used to estimate growth, mortality, recruitment, and age composition. These estimates are then used in stock assessment and fisheries management [1,2]. In many teleost fishes, age is still determined by counting annual increments in sagittal otoliths. This method remains the standard approach, but it is not simple. It requires trained readers, careful preparation of otoliths, and repeated checking when growth marks are unclear [3,4]. When many samples are collected for monitoring programs, this process can become slow and labor-intensive.
The Japanese jack mackerel Trachurus japonicus is an important small pelagic fish in Korean waters and adjacent seas. It is distributed in the East China Sea, the Yellow Sea, the southern coast of Korea, and waters around Japan [5]. In Korea, this species is one of the major species caught by large purse seine fisheries and is included in fisheries monitoring and management programs [6]. Reliable age information is therefore needed to describe its age structure and to support stock assessment. Previous studies have estimated age and growth of T. japonicus using sagittal otolith annuli in Korean and Japanese waters [6,7,8]. Even so, routine otolith reading still requires considerable time and reader experience.
Image-based approaches have been explored as a way to support fish age estimation. Early methods often relied on manually selected image features, image processing, or statistical learning [9,10]. These approaches showed that otolith images contain age-related information, but their performance often depended on how the image features were selected. Deep learning offers a different approach. Convolutional neural networks (CNNs) can learn image features directly from otolith images, without requiring all relevant features to be defined in advance [11,12]. Recent studies have reported promising results for otolith-based age estimation in several commercially important fishes, including Greenland halibut, Atlantic cod, red mullet, hoki, and snapper [13,14,15,16,17].
The choice of CNN architecture may affect model performance. The backbone refers to the main feature extraction part of a CNN that transforms an otolith image into a numerical feature representation used for classification. Inception-based models use convolutional filters at different spatial scales and can capture image patterns with different local resolutions [18]. Intuitively, this resembles inspecting the otolith through several lenses of different magnification at once, so that both fine increment detail and broader shape can contribute to the prediction. Xception uses depthwise separable convolutions and can provide efficient feature extraction from image data [19]. This design separates the search for patterns within each channel from the way the channels are subsequently combined, which reduces the number of parameters the network must learn. EfficientNet models use compound scaling of network depth, width, and input resolution. Rather than enlarging the network along a single dimension, compound scaling increases depth, width, and input resolution together in a balanced way, aiming to improve accuracy without unnecessary computation. EfficientNet B4 has also shown useful performance in recent otolith age interpretation studies [14,20]. However, no single architecture can be assumed to be optimal for all otolith datasets. Performance may depend on species, image quality, age range, sample size, and the visual structure of the otolith increments.
For T. japonicus, it remains unclear whether reader-assigned age classes can be classified directly from sagittal otolith images using CNNs. It is also not known which commonly used backbone architecture provides the most suitable image-only baseline for this species. Establishing this baseline is useful before adding other biological or morphometric information. It also allows the image-based signal to be evaluated separately from measured otolith size or shape variables.
The aim of this study was to compare the performance of three CNN backbones for age class classification of T. japonicus using sagittal otolith images only. Inception v3, Xception, and EfficientNet B4 were trained and evaluated under the same preprocessing, augmentation, and validation framework. The purpose was not to replace expert otolith reading. Instead, this study tested whether otolith image-based deep learning can provide a practical support tool for screening reader-assigned age classes in this commercially important pelagic fish. We hypothesized that sagittal otolith images contain sufficient age-related information for CNNs to classify reader-assigned age classes of T. japonicus, and that a suitable image-only baseline could be identified by benchmarking the three backbones under a common framework.

2. Materials and Methods

2.1. Otolith Image Dataset and Age Labels

Digital images of sagittal otoliths from T. japonicus were used in this study. The age classes were not newly assigned for the deep learning analysis. Instead, they were linked to the conventional otolith readings obtained from sagittal otolith annuli. The model task was therefore to classify reader-assigned age classes from otolith images.
All age readings were performed by a single experienced reader. Extracted otoliths of T. japonicus were cleaned in 5% KOH for 1–2 h, rinsed, and air-dried; only the right sagittal otolith was used and was ground and polished to improve annulus visibility before being imaged under a binocular microscope (Zeiss SteREO Discovery V8; Carl Zeiss Microscopy GmbH, Jena, Germany) fitted with a digital camera (Zeiss AxioCam ICc1; Carl Zeiss Microscopy GmbH, Jena, Germany). Ages were read from the digital images by direct observation along the post-rostrum axis, where annuli are more distinct and less prone to split or false rings than in the rostral region [6]. The reading axis and the otolith radius (R) and successive annual marks are illustrated in Figure 1, and representative otoliths for each age class (0–4 years) are shown in Figure 2. The boundary from a translucent zone to the subsequent opaque zone was treated as one annual mark, consistent with the once-yearly (March–April) translucent-zone formation reported for this species in Korean waters [6]; otoliths with unclear rings or severe edge damage were excluded. To quantify reading reproducibility, a randomly selected, age-stratified subsample of 10% of the otoliths (n = 144) was re-aged by the same reader on a separate occasion, without reference to the first reading. Within-reader precision was summarized using the exact percent agreement between the two readings, the linear and quadratic weighted Cohen’s kappa [21], the coefficient of variation (CV) [22], and the average percent error (APE) [23], computed following standard methods for assessing age-reading consistency [24]. Exact agreement was 84.0% (100% within one age class), and the linear and quadratic weighted kappa were 0.87 and 0.94, respectively, indicating almost perfect agreement [25]. The CV and APE were 8.41% and 5.95%; the comparatively higher CV partly reflects the inclusion of age-0 fish, for which the small mean age inflates the per-otolith CV, whereas the weighted kappa and percent agreement are not distorted by low ages. This residual reading uncertainty is consistent with the precision reported for otolith-based aging of comparable pelagic species [2], and represents an inherent source of uncertainty in the age labels used to train the model.
A total of 1444 otolith images were retained for age class analysis. The dataset included age classes 0 to 4. The number of samples was 134 at age 0, 270 at age 1, 567 at age 2, 265 at age 3, and 208 at age 4 (Table 1). Each retained sample consisted of one otolith image and one age label. Samples with incomplete image information or unclear image quality were not used in the analysis. The available age range (0 to 4 years) reflected the age composition of the commercial purse-seine and set-net landings off the southern coast of Korea from which the otoliths were obtained. The sampled catch was dominated by young T. japonicus, and individuals older than 4 years were too scarce to support model training; this reflects the gear selectivity, fishing area, and season of the sampled fishery rather than necessarily the true age structure of the stock.

2.2. Dataset Partitioning

The full dataset was divided into training, validation, and test sets. The training set contained 70% of the data, and the validation and test sets each contained 15%. Stratified random sampling was used so that the relative proportions of age classes were preserved across all subsets.
The data split was generated once and then fixed for all experiments. This was done so that the benchmark models were evaluated on the same training, validation, and test subsets. Under this design, differences in performance could be interpreted mainly as differences among model architectures or training settings rather than differences in dataset composition.

2.3. Image Preprocessing and Data Augmentation

All otolith images were preprocessed in a standardized way before they were passed to the CNNs. Each image was padded to a square format while preserving the original aspect ratio. Padding was used because simple resizing could distort the otolith outline. The padded images were then resized according to the expected input size of each backbone. The complete image standardization procedure is summarized in Figure 3.
The image size was 299 × 299 pixels for Inception v3 and Xception, and 380 × 380 pixels for EfficientNet B4. Images were converted to tensors and normalized using the ImageNet mean and standard deviation because all networks were initialized with ImageNet pretrained weights [13,14,20].
During training only, mild image augmentation was applied. This included random rotation within ±10° and small random changes in brightness and contrast. Flipping was not applied because otolith orientation was treated as meaningful. The augmentation strategy was deliberately conservative and was intended to reflect plausible variation in image acquisition while preserving age-related structures (Table 2).

2.4. Convolutional Neural Network Backbones

Three image-only CNN backbones were compared: Inception v3, Xception, and EfficientNet B4. In this study, each backbone received an otolith image and transformed it into a feature vector for age classification.
Inception v3 was included because it is a well-established image classification architecture that uses factorized convolutions and multi-scale feature extraction [18]. Xception was included because it replaces standard convolutional operations with depthwise separable convolutions, which can improve parameter efficiency [19]. EfficientNet B4 was included because EfficientNet models use compound scaling of network depth, width, and input resolution, and this family has shown strong performance in image analysis tasks [20].
All three backbones were initialized with ImageNet pretrained weights and then fine-tuned on the otolith image dataset. Transfer learning was used because pretrained visual features can provide a more stable starting point than random initialization when the target dataset is much smaller than large computer vision datasets [26,27].

2.5. Image Classification Model

The original classification layer of each backbone was removed and replaced with the same task-specific classifier head. This allowed the three backbones to be compared under a common output structure. Let h denote the image feature vector extracted by the backbone. The feature vector was passed to a fully connected classifier with one hidden layer, a rectified linear unit activation function, dropout, and a final output layer.
The output logits were converted to class probabilities using a softmax function. The number of classes was five, corresponding to age classes 0, 1, 2, 3, and 4. The model used only the otolith image as input. No morphometric or tabular variables were included in this manuscript.

2.6. Model Training and Optimization

All models were implemented in Python (v3.11.15) using the PyTorch framework (v2.7.1), and backbone architectures were loaded through the timm library (v1.0.26). Training was conducted on a Windows-based personal computer with GPU acceleration using an NVIDIA GeForce RTX 3060 graphics card (NVIDIA Corporation, Santa Clara, CA, USA), with CUDA 11.8. Random seeds for Python, NumPy (v2.4.3), and PyTorch were fixed before model fitting to improve reproducibility.
Models were trained using weighted cross-entropy loss to reduce the effect of class imbalance. The network parameters were optimized using AdamW, which applies decoupled weight decay to adaptive gradient-based optimization [28,29]. The maximum number of training epochs was 50 for each experiment. Model performance was monitored using validation macro F1 score.
Hyperparameter tuning was conducted in two stages. In Stage 1, the three backbones were compared under three learning rates: 3 × 10⁻⁵, 1 × 10⁻⁴, and 3 × 10⁻⁴. The backbone with the highest validation macro F1 score was selected as the image-only baseline. In Stage 2, the selected backbone was further optimized by searching combinations of learning rate, weight decay, and dropout. The learning rate was reduced when validation macro F1 did not improve for three consecutive epochs. Early stopping was applied when no improvement was observed for seven consecutive epochs. The model state with the highest validation macro F1 was retained.

2.7. Model Evaluation

Model selection was based primarily on validation macro F1 score. Macro F1 was used because the age class distribution was not uniform and because this metric gives equal weight to each class [30,31]. Validation exact accuracy, validation loss, and validation agreement within one age class were also examined.
After model selection, the optimized image-only model was evaluated on the independent test set. Test performance was summarized using exact accuracy, macro F1 score, and agreement within one year. Agreement within one year was included because age classes are ordered and misclassification to an adjacent age class has a different practical meaning from misclassification to a distant age class.

3. Results

3.1. Dataset Composition

The retained dataset consisted of 1444 otolith images from fish aged 0 to 4 years (Table 1). Age 2 was the most frequent class, followed by age 1, age 3, age 4, and age 0. The stratified split preserved this age structure across the training, validation, and test subsets.

3.2. Stage 1 Backbone Comparison

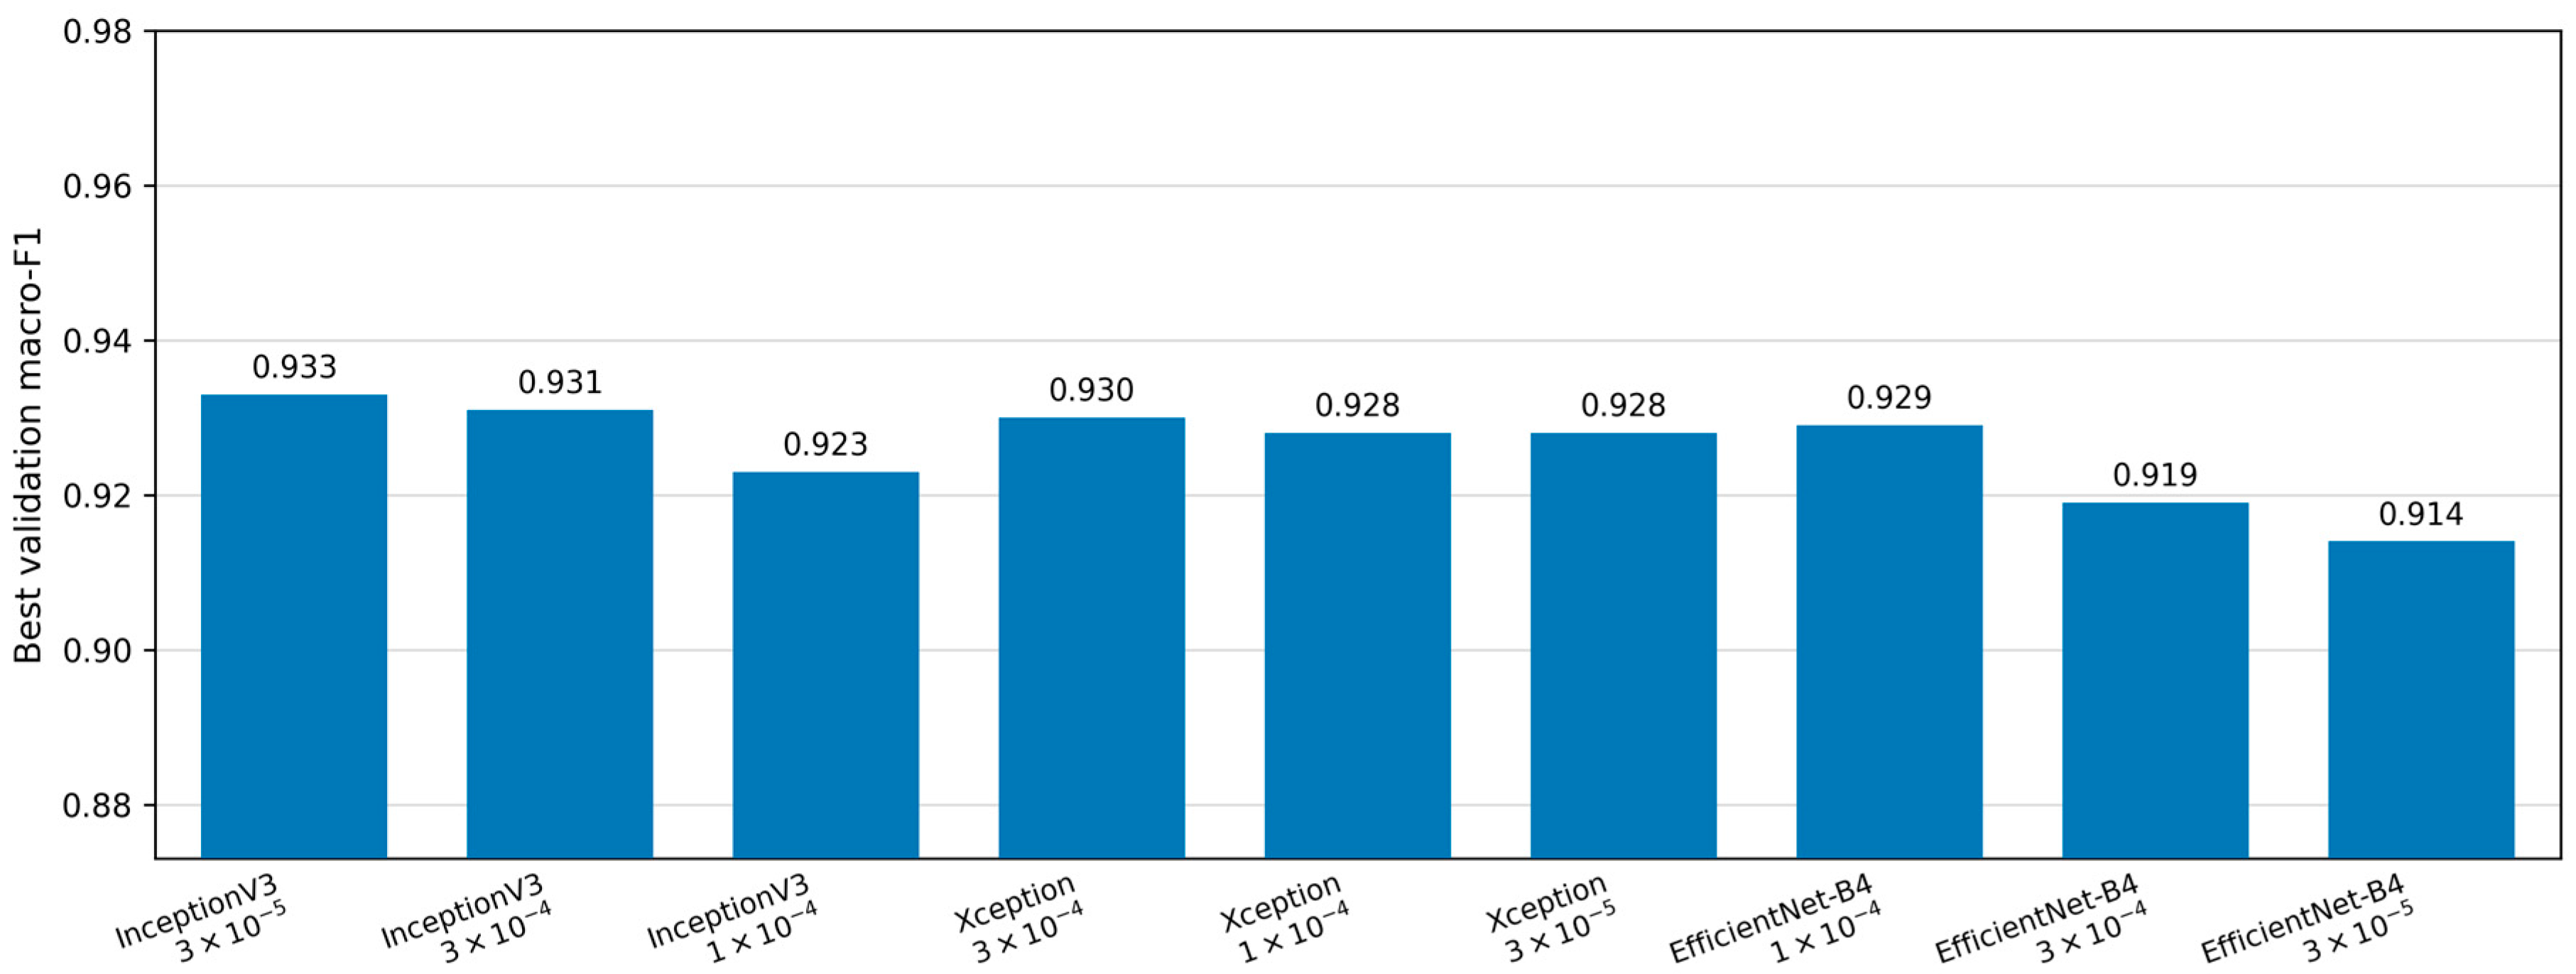
In Stage 1, Inception v3, Xception, and EfficientNet B4 were compared under three learning rate settings. Performance differences among the best-performing settings were relatively small, but Inception v3 achieved the highest validation macro F1 score among all Stage 1 trials (Table 3; Figure 4). The best result was obtained by Inception v3 at a learning rate of 3 × 10⁻⁵, which reached a validation macro F1 score of 0.933 at epoch 15.
Inception v3 also showed stable performance at 3 × 10⁻⁴, with a validation macro F1 score of 0.931 at epoch 14. Xception showed competitive performance across all learning rates. Its best result was obtained at 3 × 10⁻⁴, where the validation macro F1 score reached 0.930 at epoch 18. EfficientNet B4 showed its best performance at 1 × 10⁻⁴, reaching a validation macro F1 score of 0.929 at epoch 21. The other two learning rate settings for EfficientNet B4 showed lower scores, suggesting greater sensitivity to the tested optimization scale.
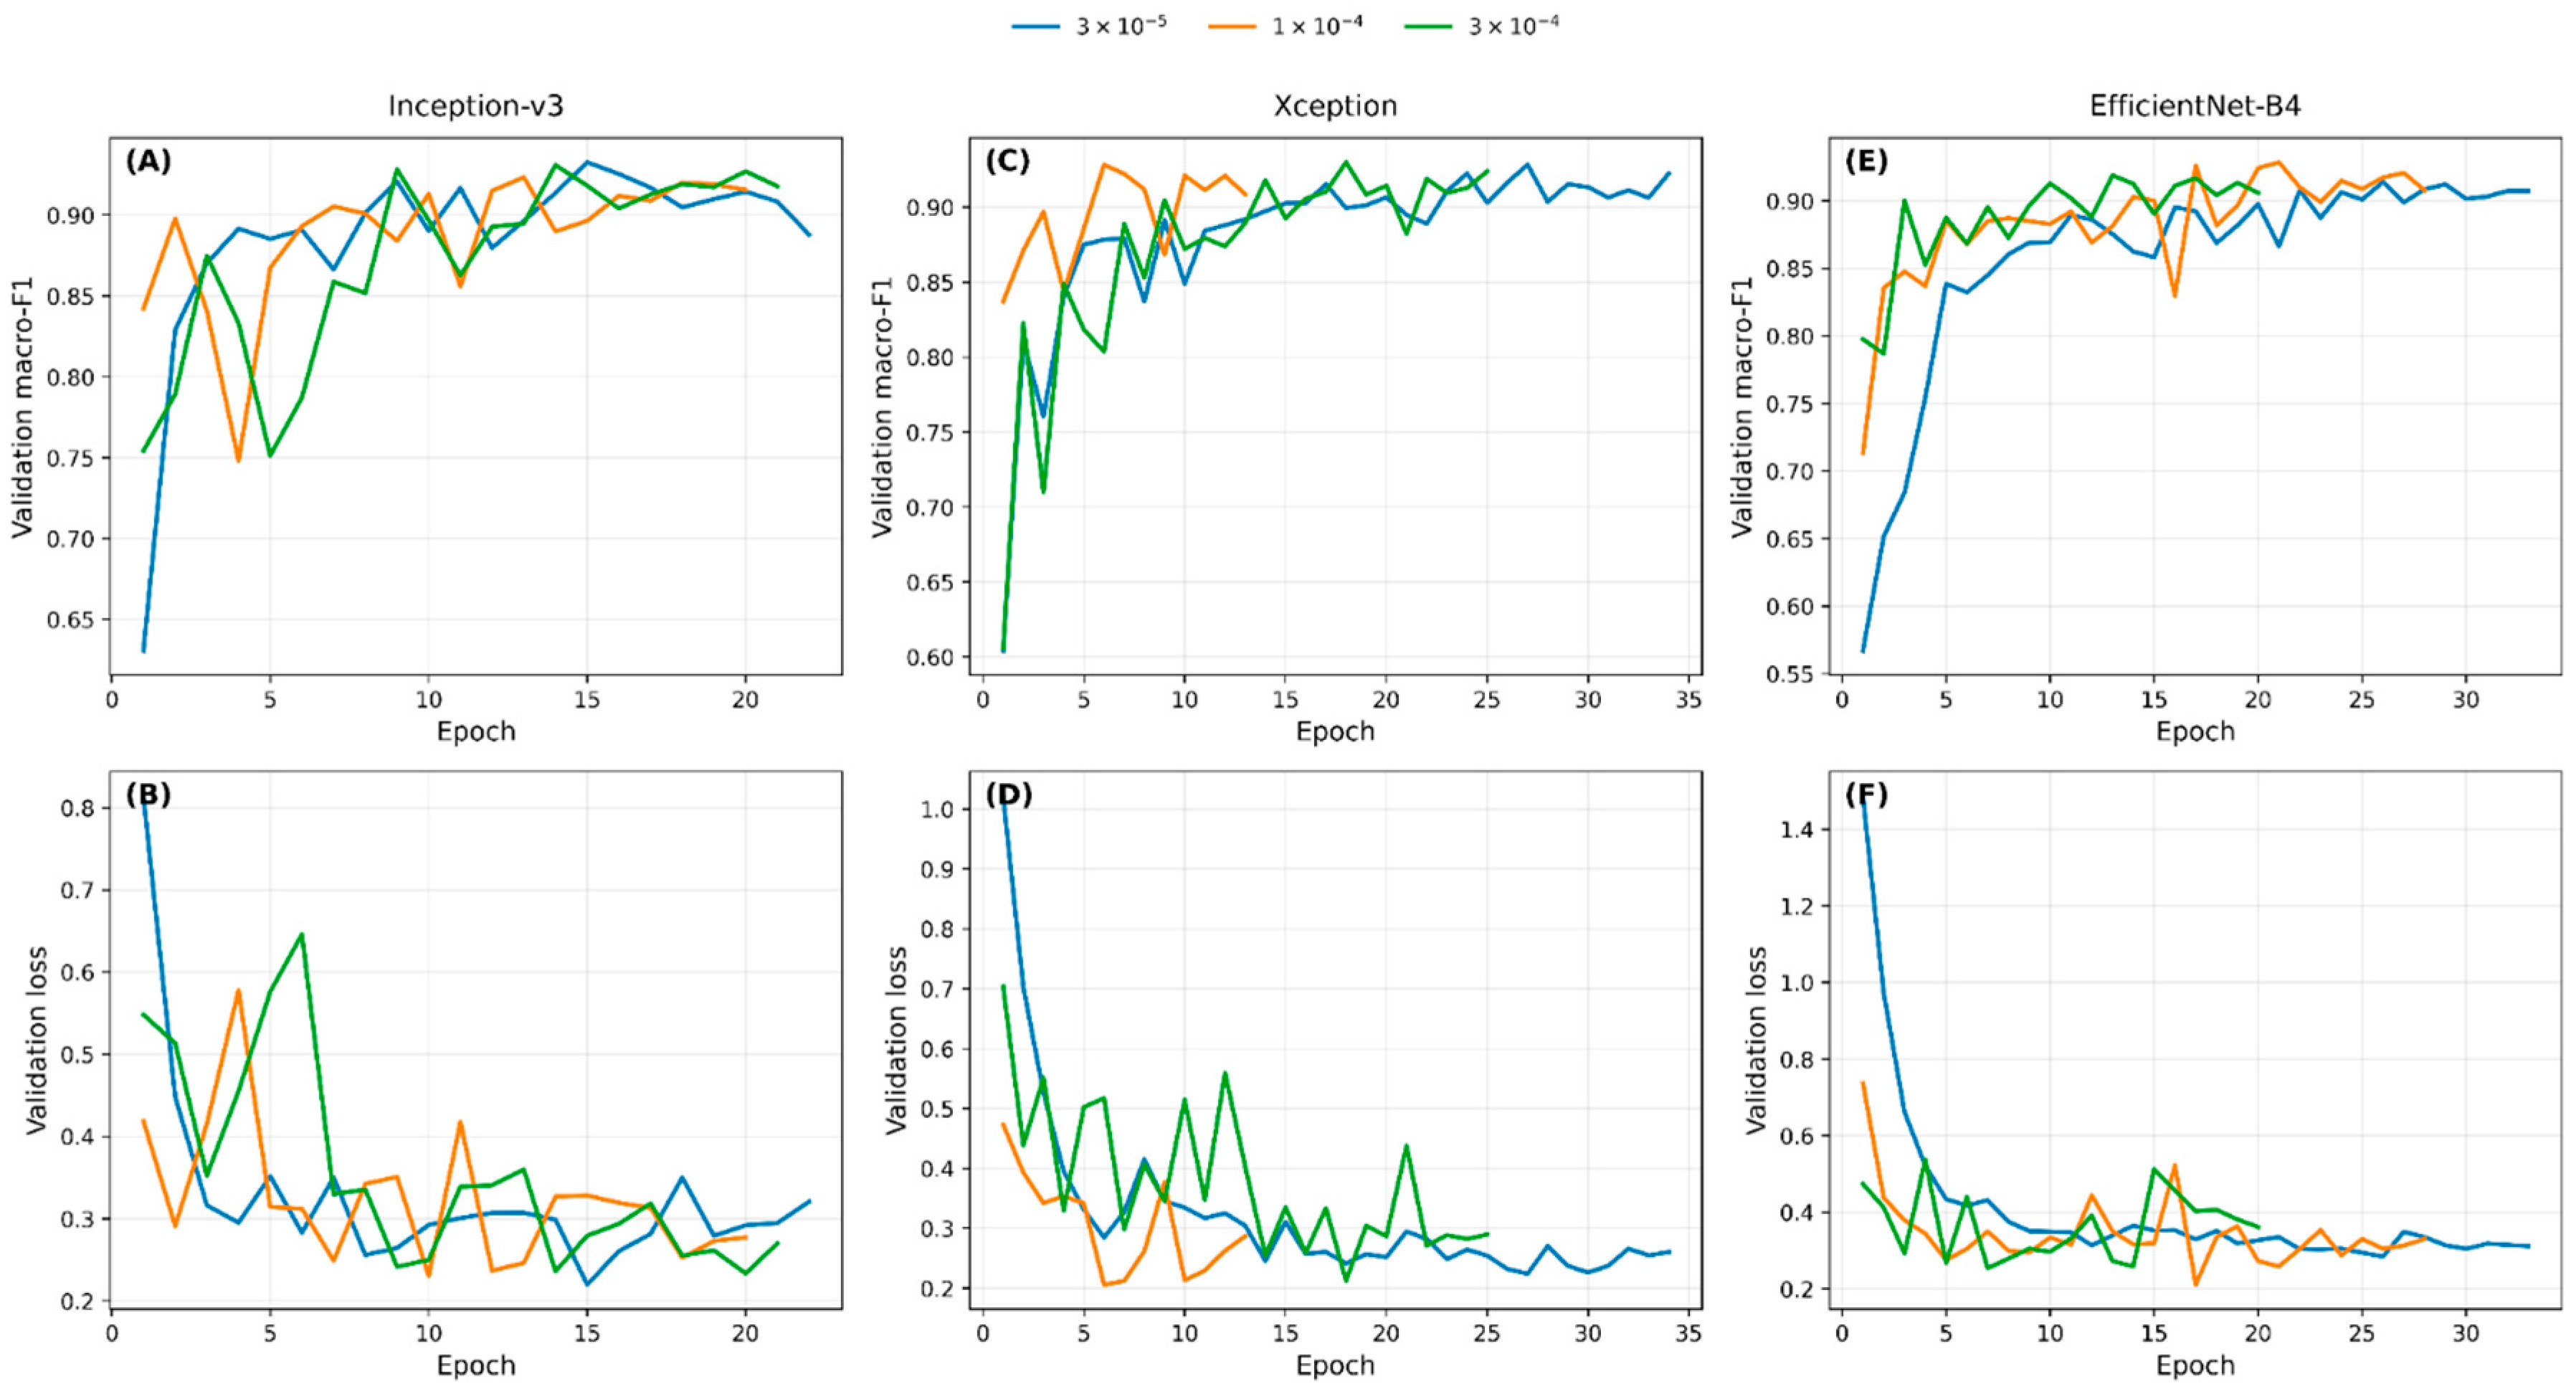
Validation loss and macro F1 rankings were not identical. The lowest validation loss was observed for Xception at 1 × 10⁻⁴, but this setting did not produce the highest macro F1 score. Because the main objective was balanced classification across age classes, macro F1 was retained as the primary model selection criterion. Inception v3 with a learning rate of 3 × 10⁻⁵ was therefore selected as the Stage 1 image-only baseline.
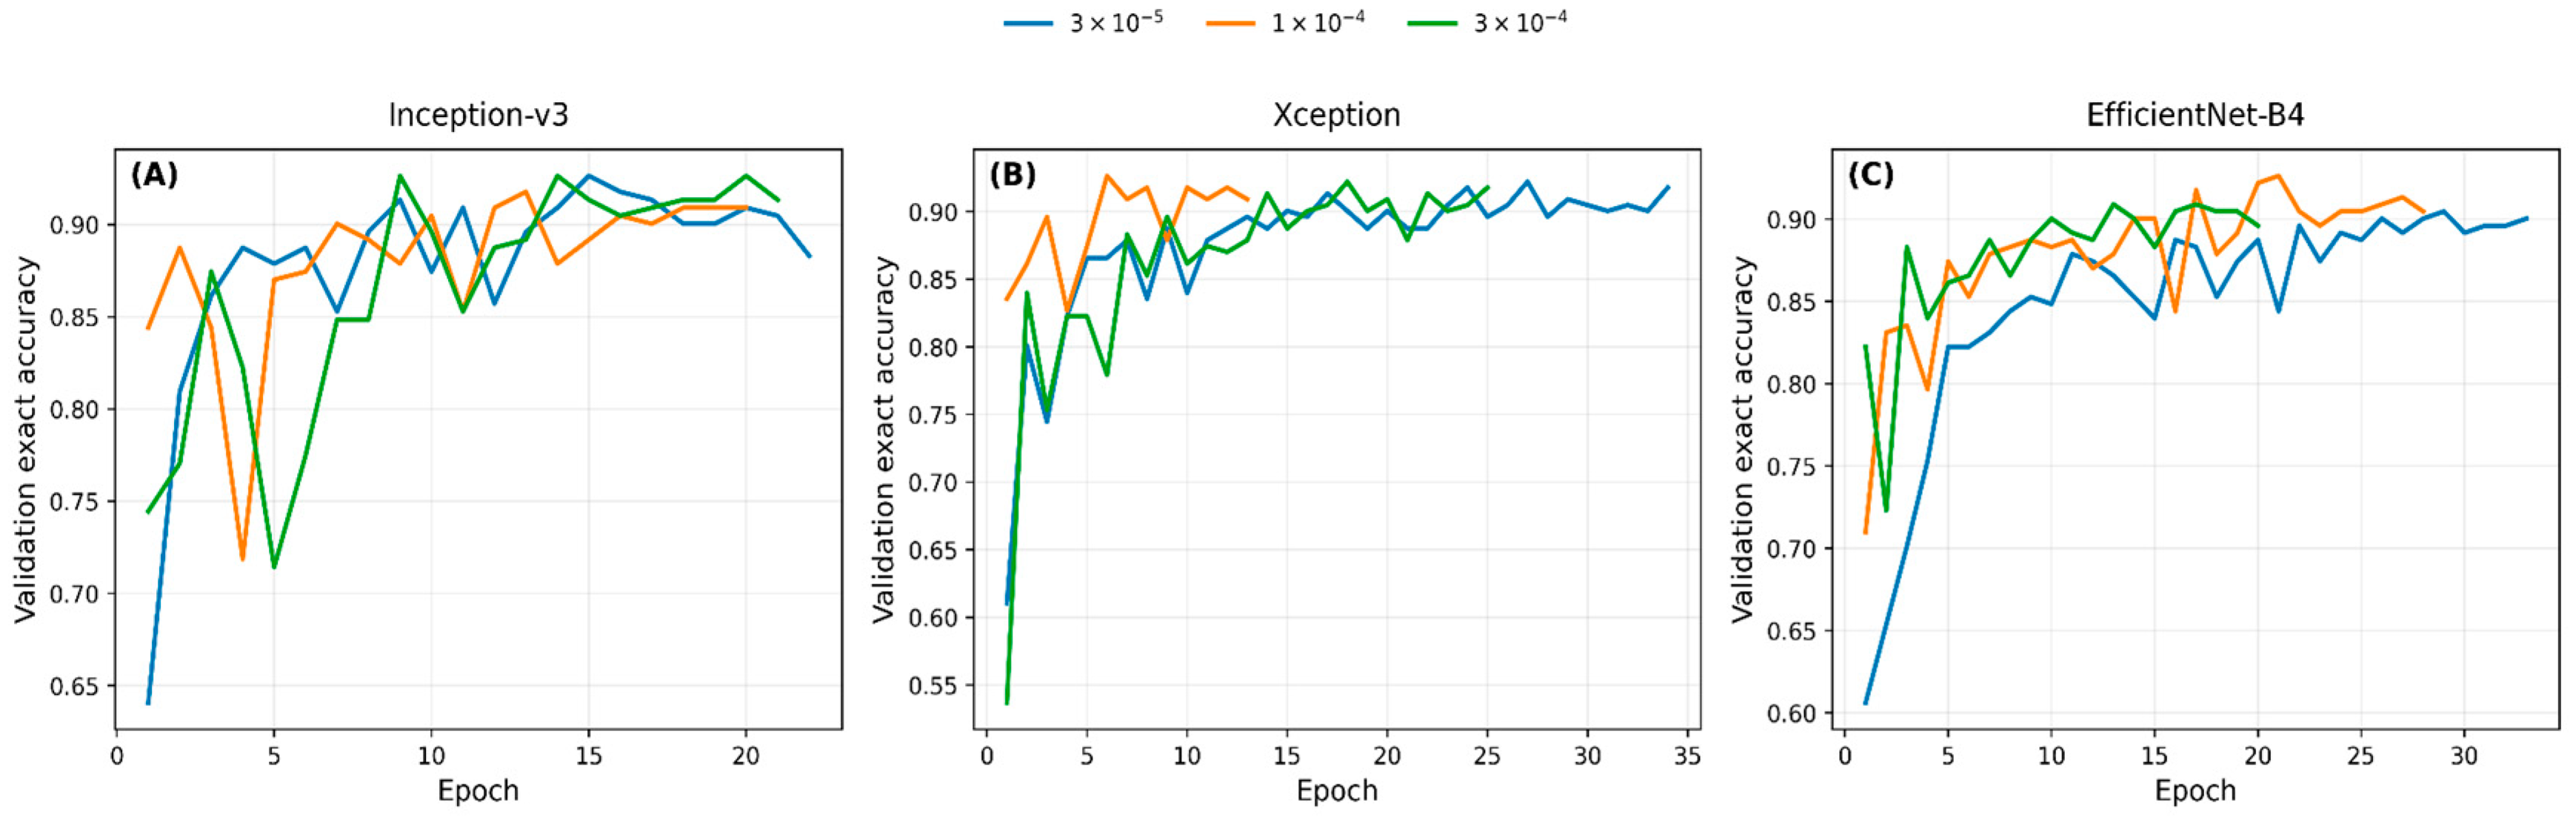
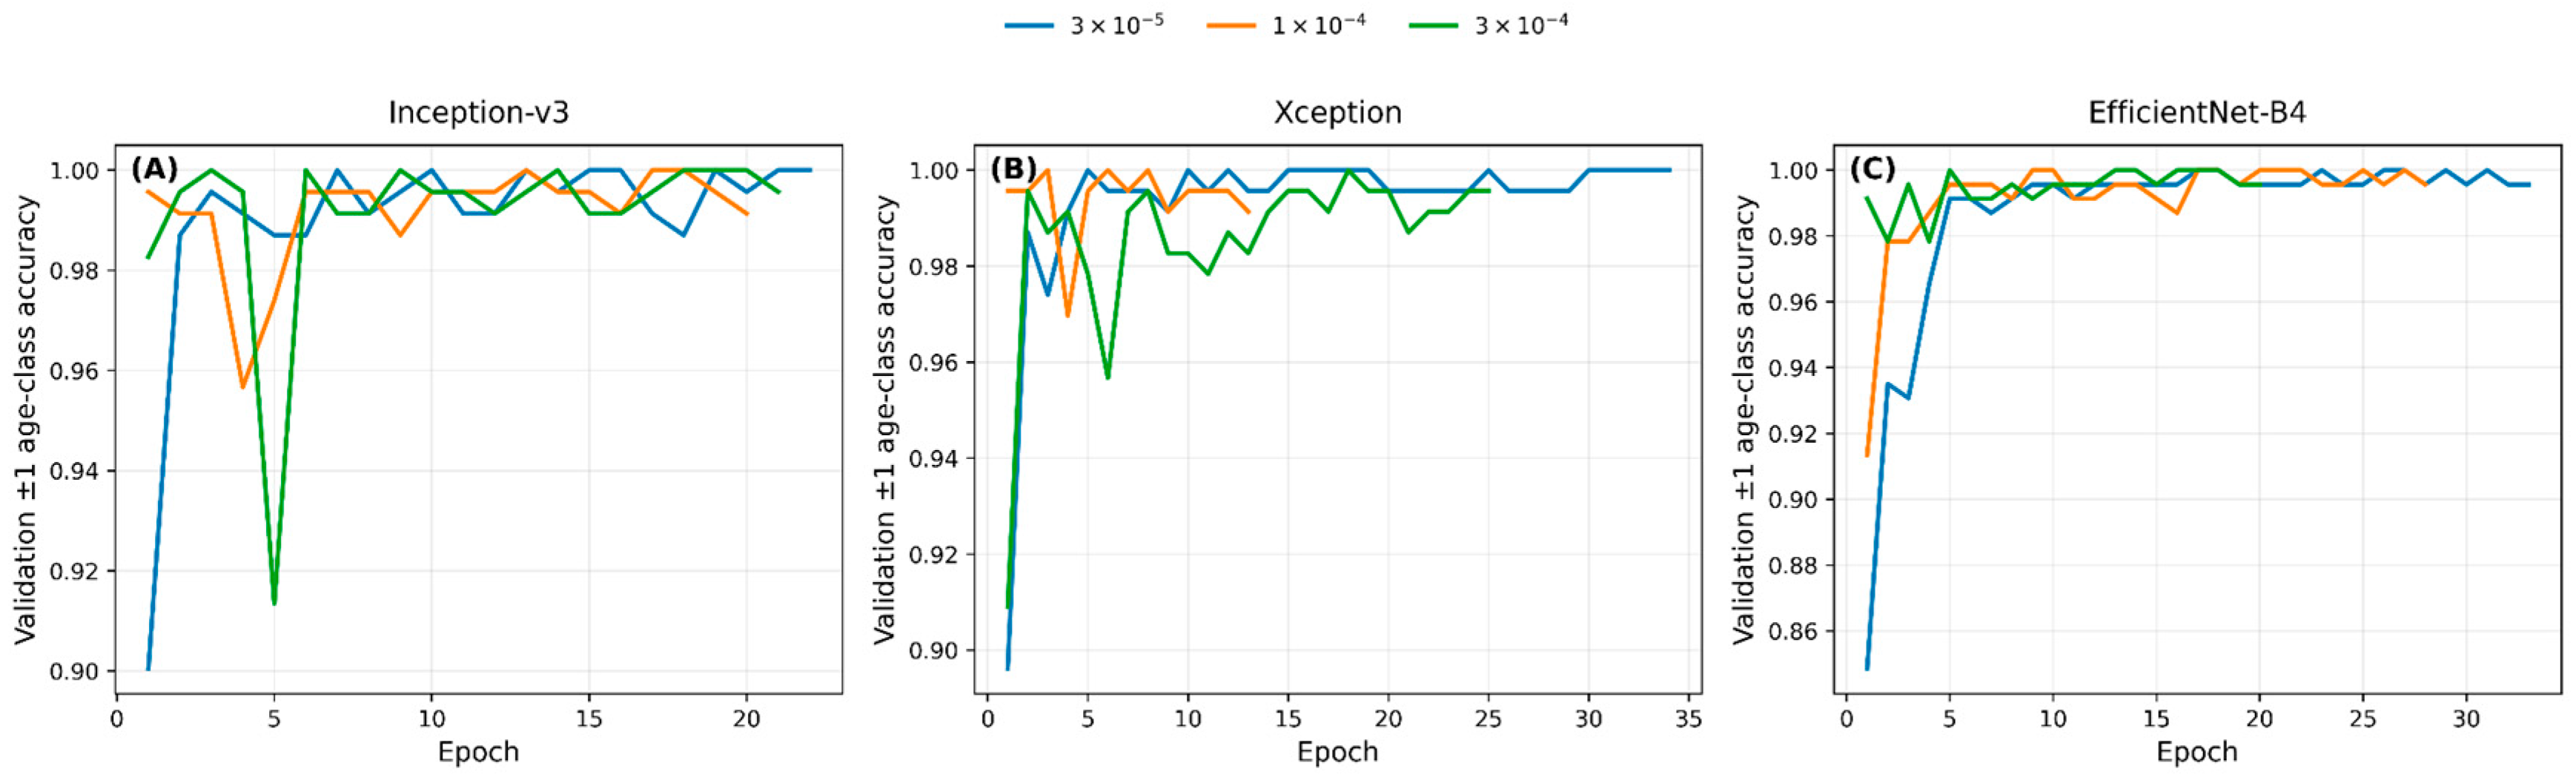
Validation exact accuracy reached 0.926 for several settings, including Inception v3 at 3 × 10⁻⁵, Xception at 1 × 10⁻⁴, and EfficientNet B4 at 1 × 10⁻⁴. Validation agreement within one age class was extremely high across nearly all models. This indicates that most errors, when they occurred, were between neighboring age classes rather than distant age classes (Figure 5, Figure 6 and Figure 7).

3.3. Stage 2 Optimization of the Selected Image-Only Backbone

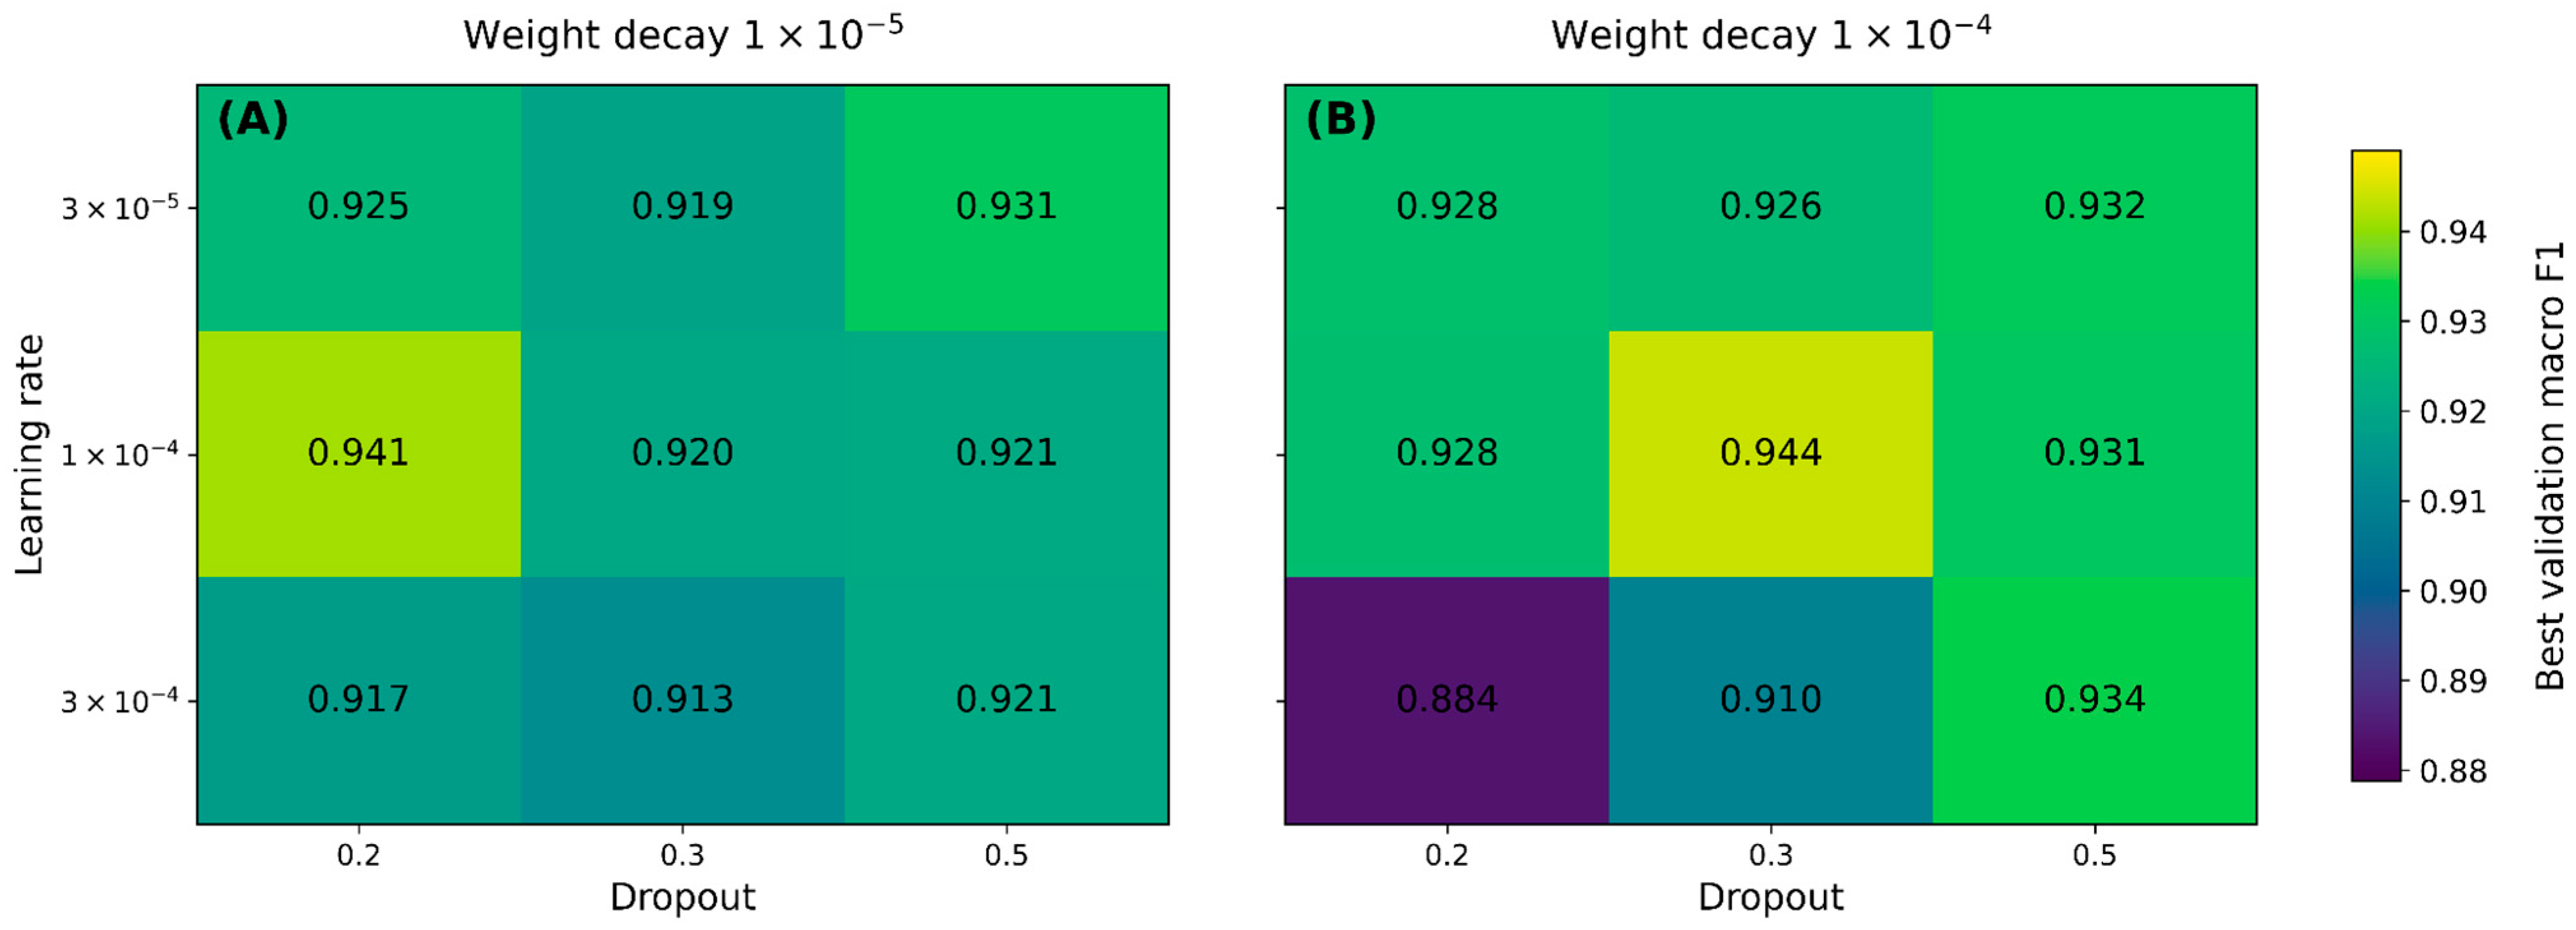
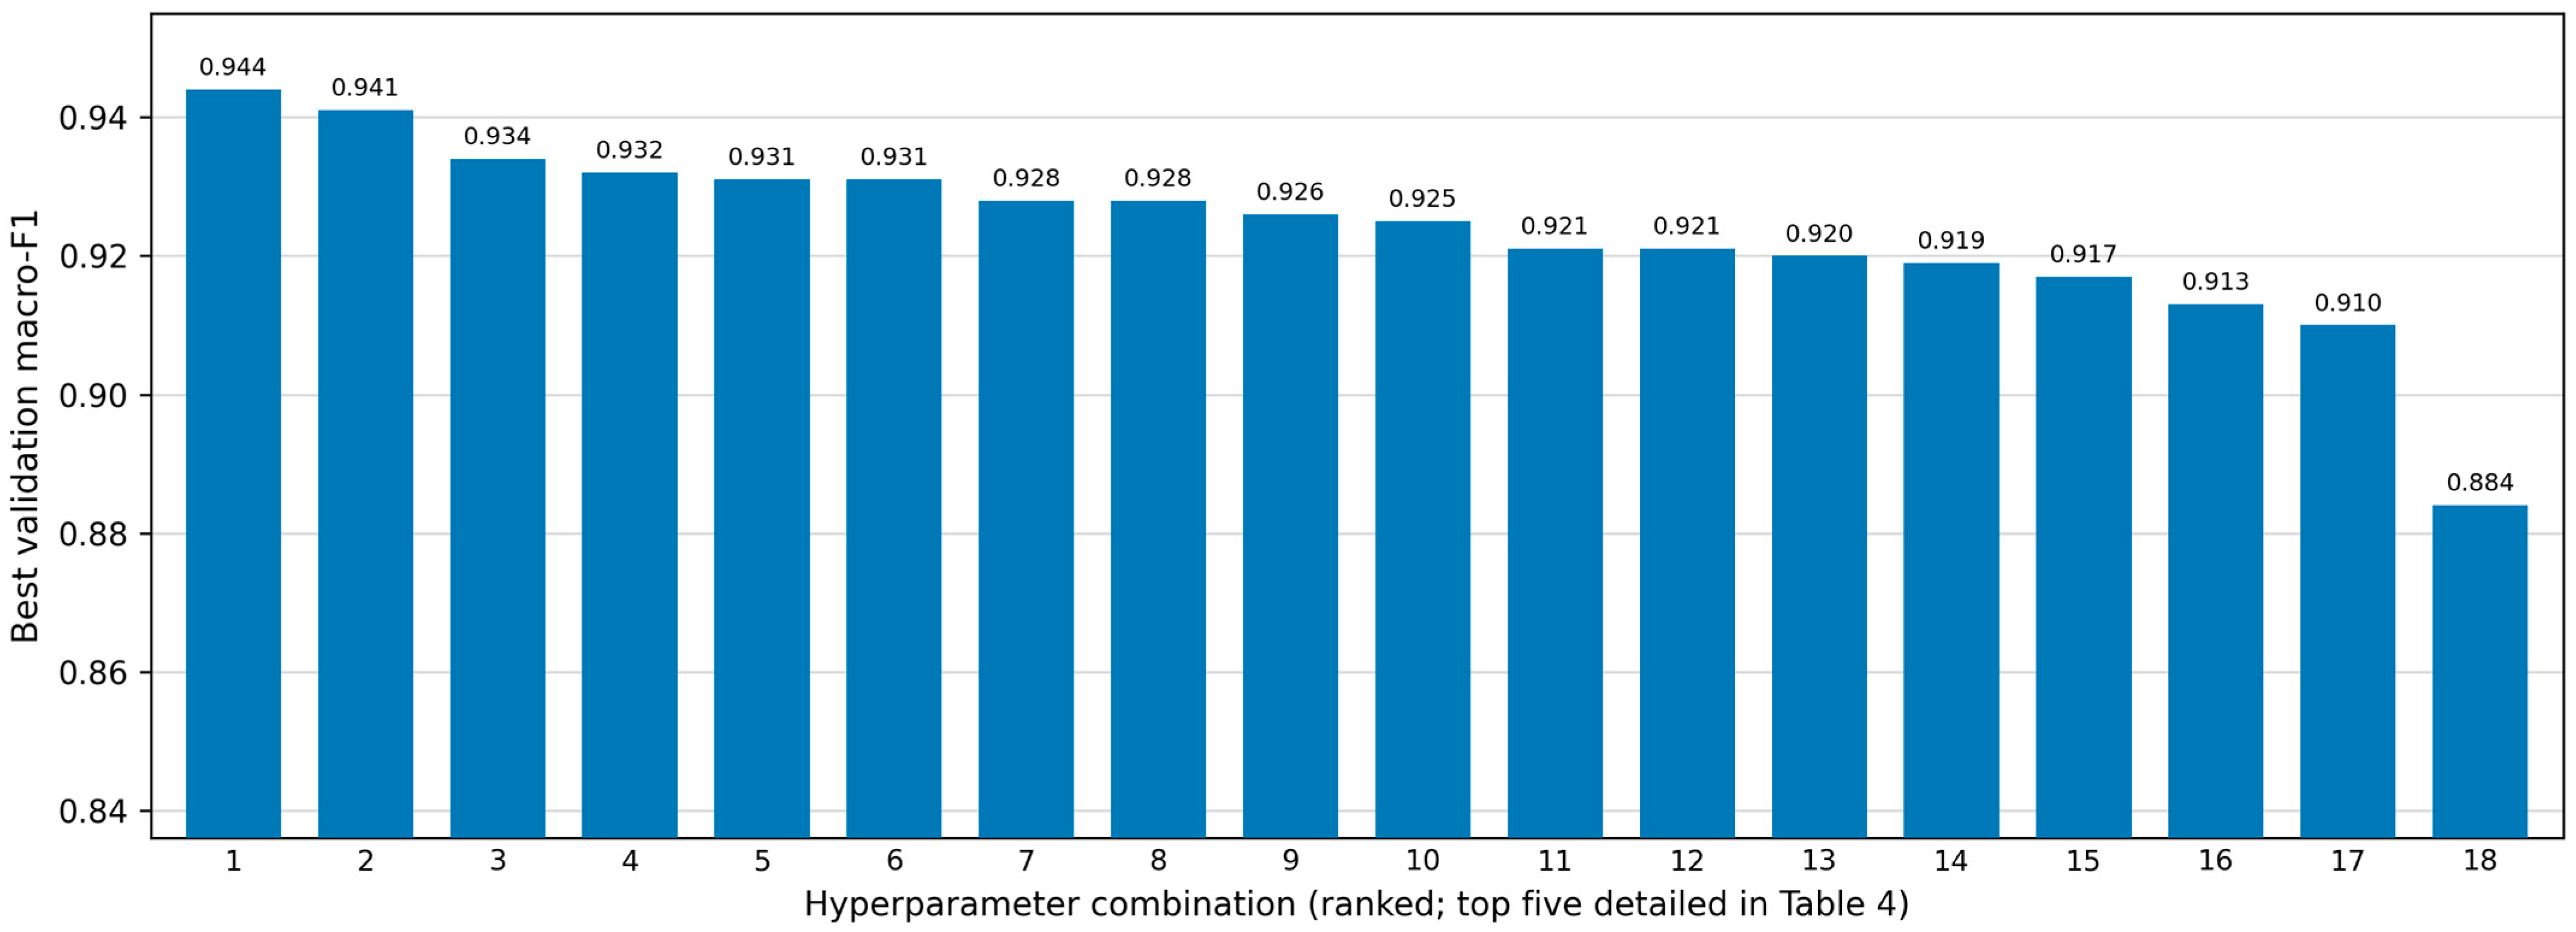
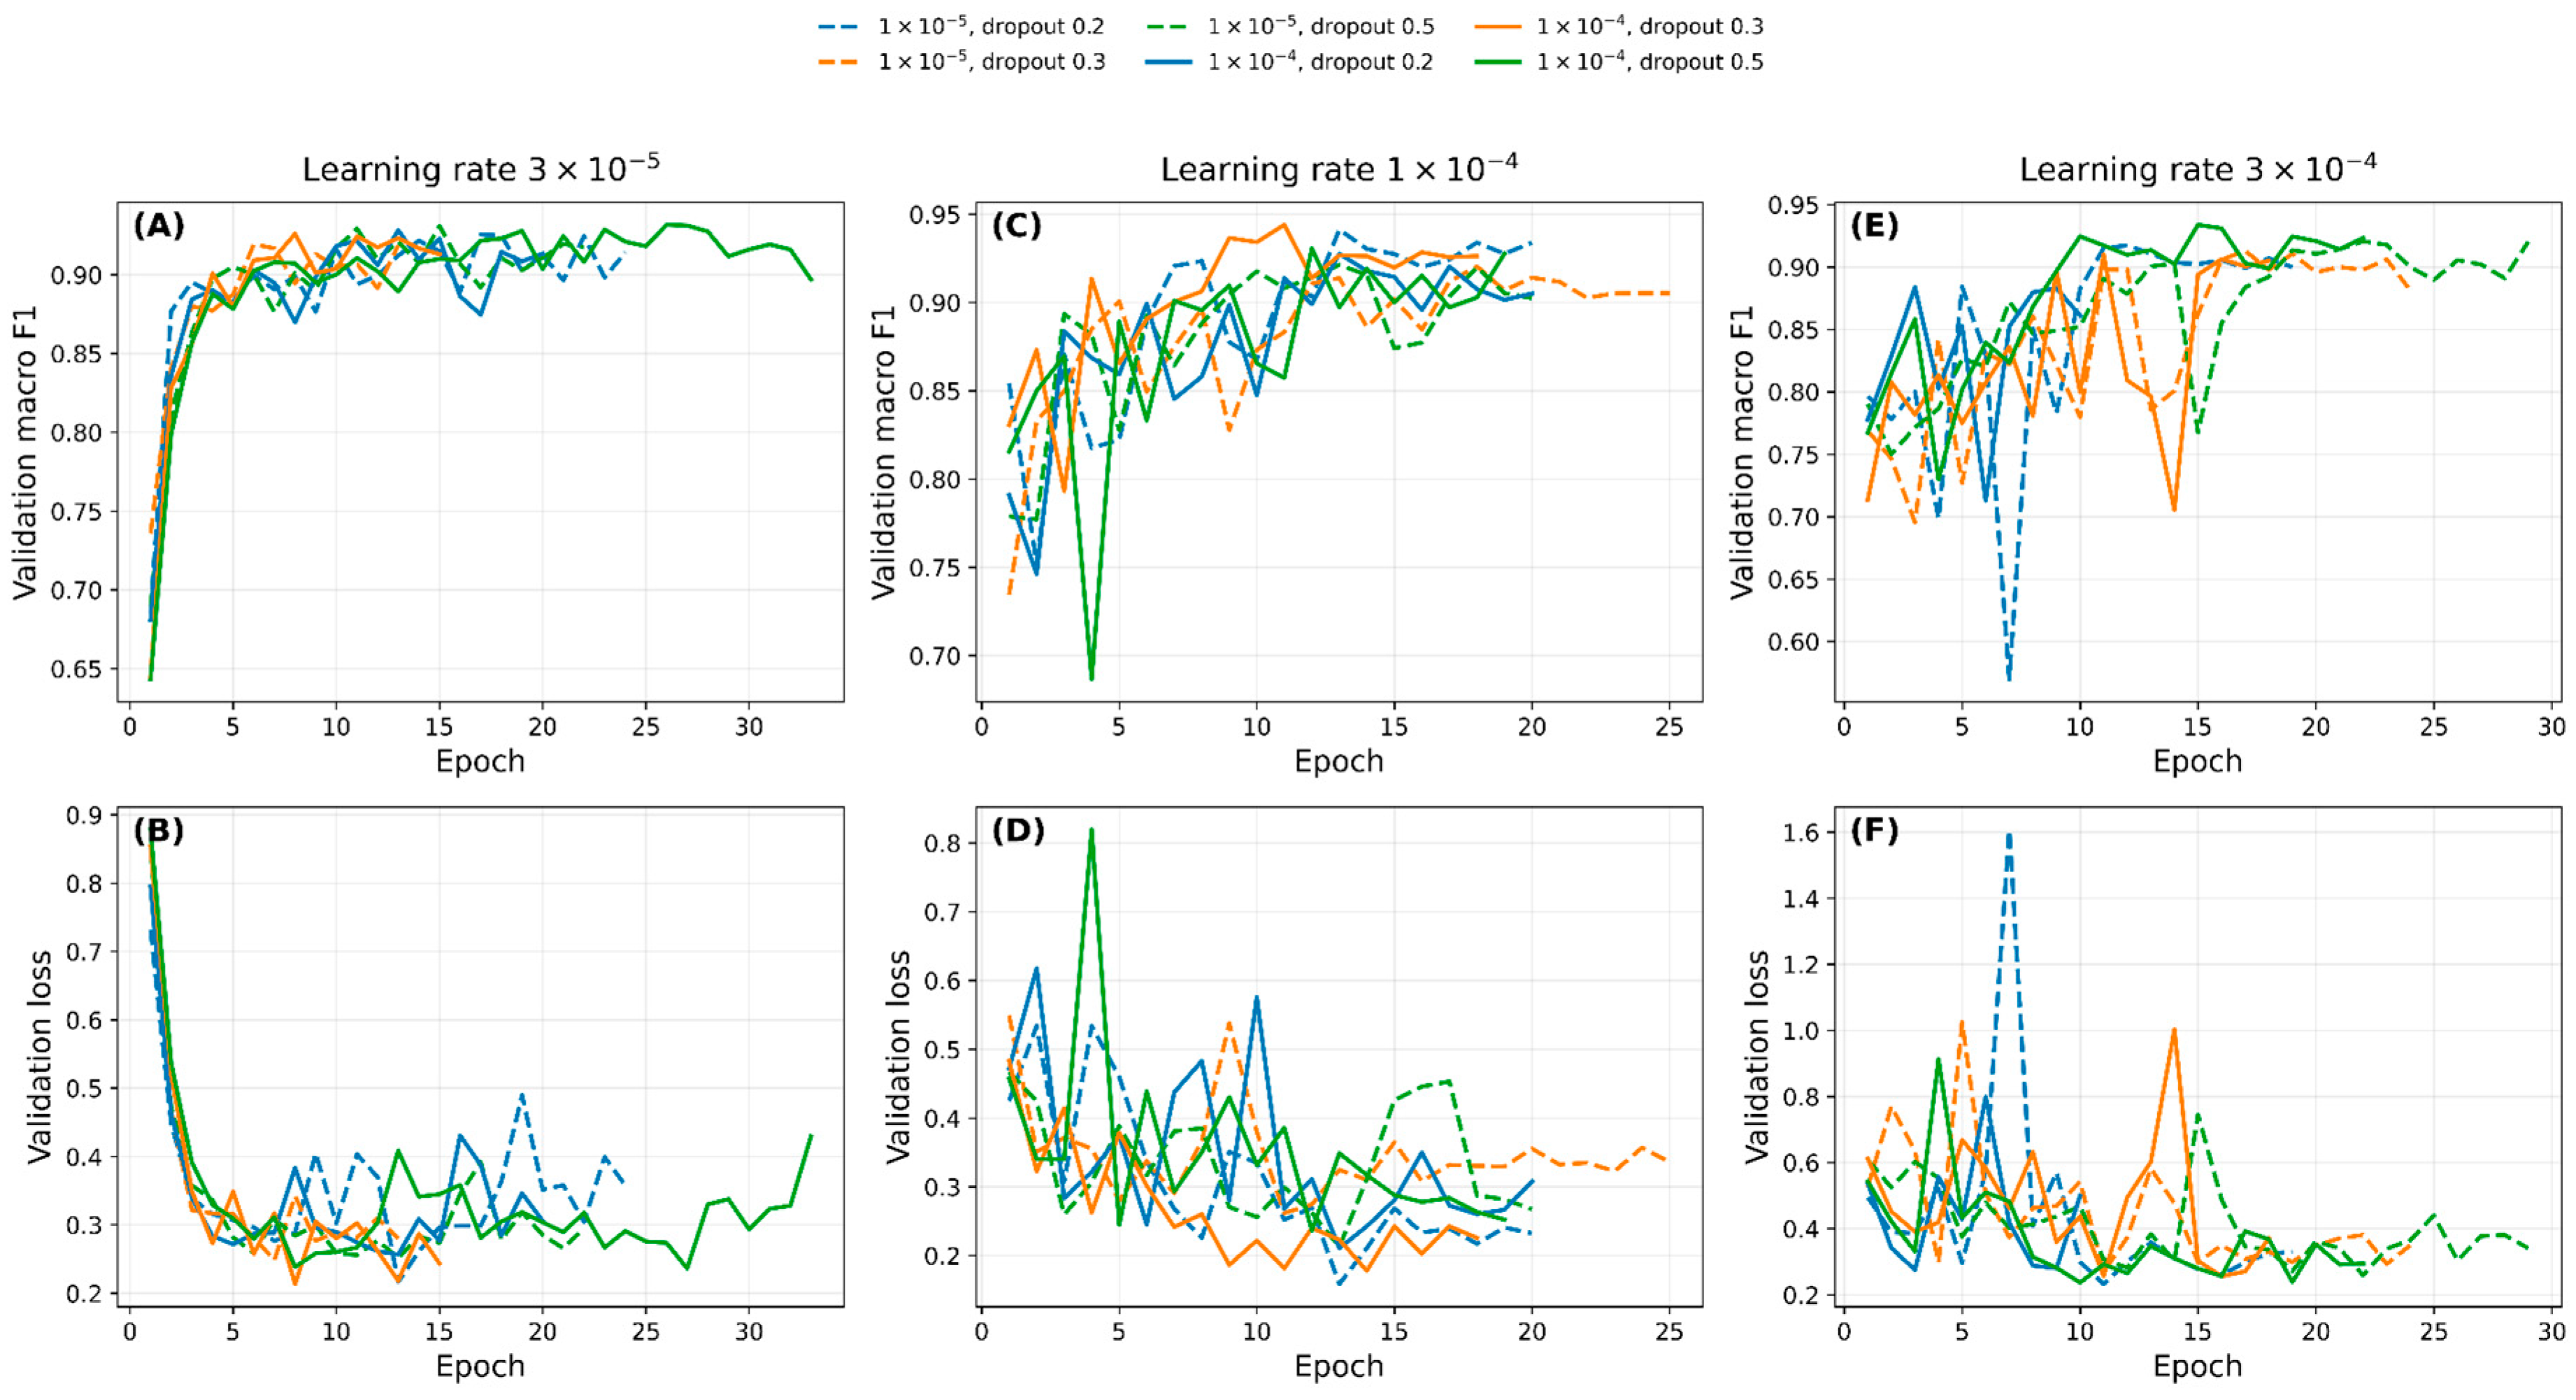
After the Stage 1 comparison, Inception v3 was further optimized by testing combinations of learning rate, weight decay, and dropout. The best validation macro F1 score was obtained with a learning rate of 1 × 10⁻⁴, weight decay of 1 × 10⁻⁴, and dropout of 0.3 (Table 4; Figure 8). The best validation macro-F1 values across the learning-rate and dropout grid, shown separately for the two weight decay settings, are presented in Figure 9. This setting reached a validation macro F1 score of 0.944 at epoch 11, with validation exact accuracy of 0.935 and validation agreement within one age class of 1.000; the corresponding validation macro-F1 and loss curves during optimization are shown in Figure 10.
The top-five hyperparameter combinations all achieved validation macro F1 scores higher than 0.931. This shows that the optimized Inception v3 model was relatively robust across several regularization settings, although the best combination provided the most balanced validation performance.

3.4. Independent Test Performance of the Image Only Model

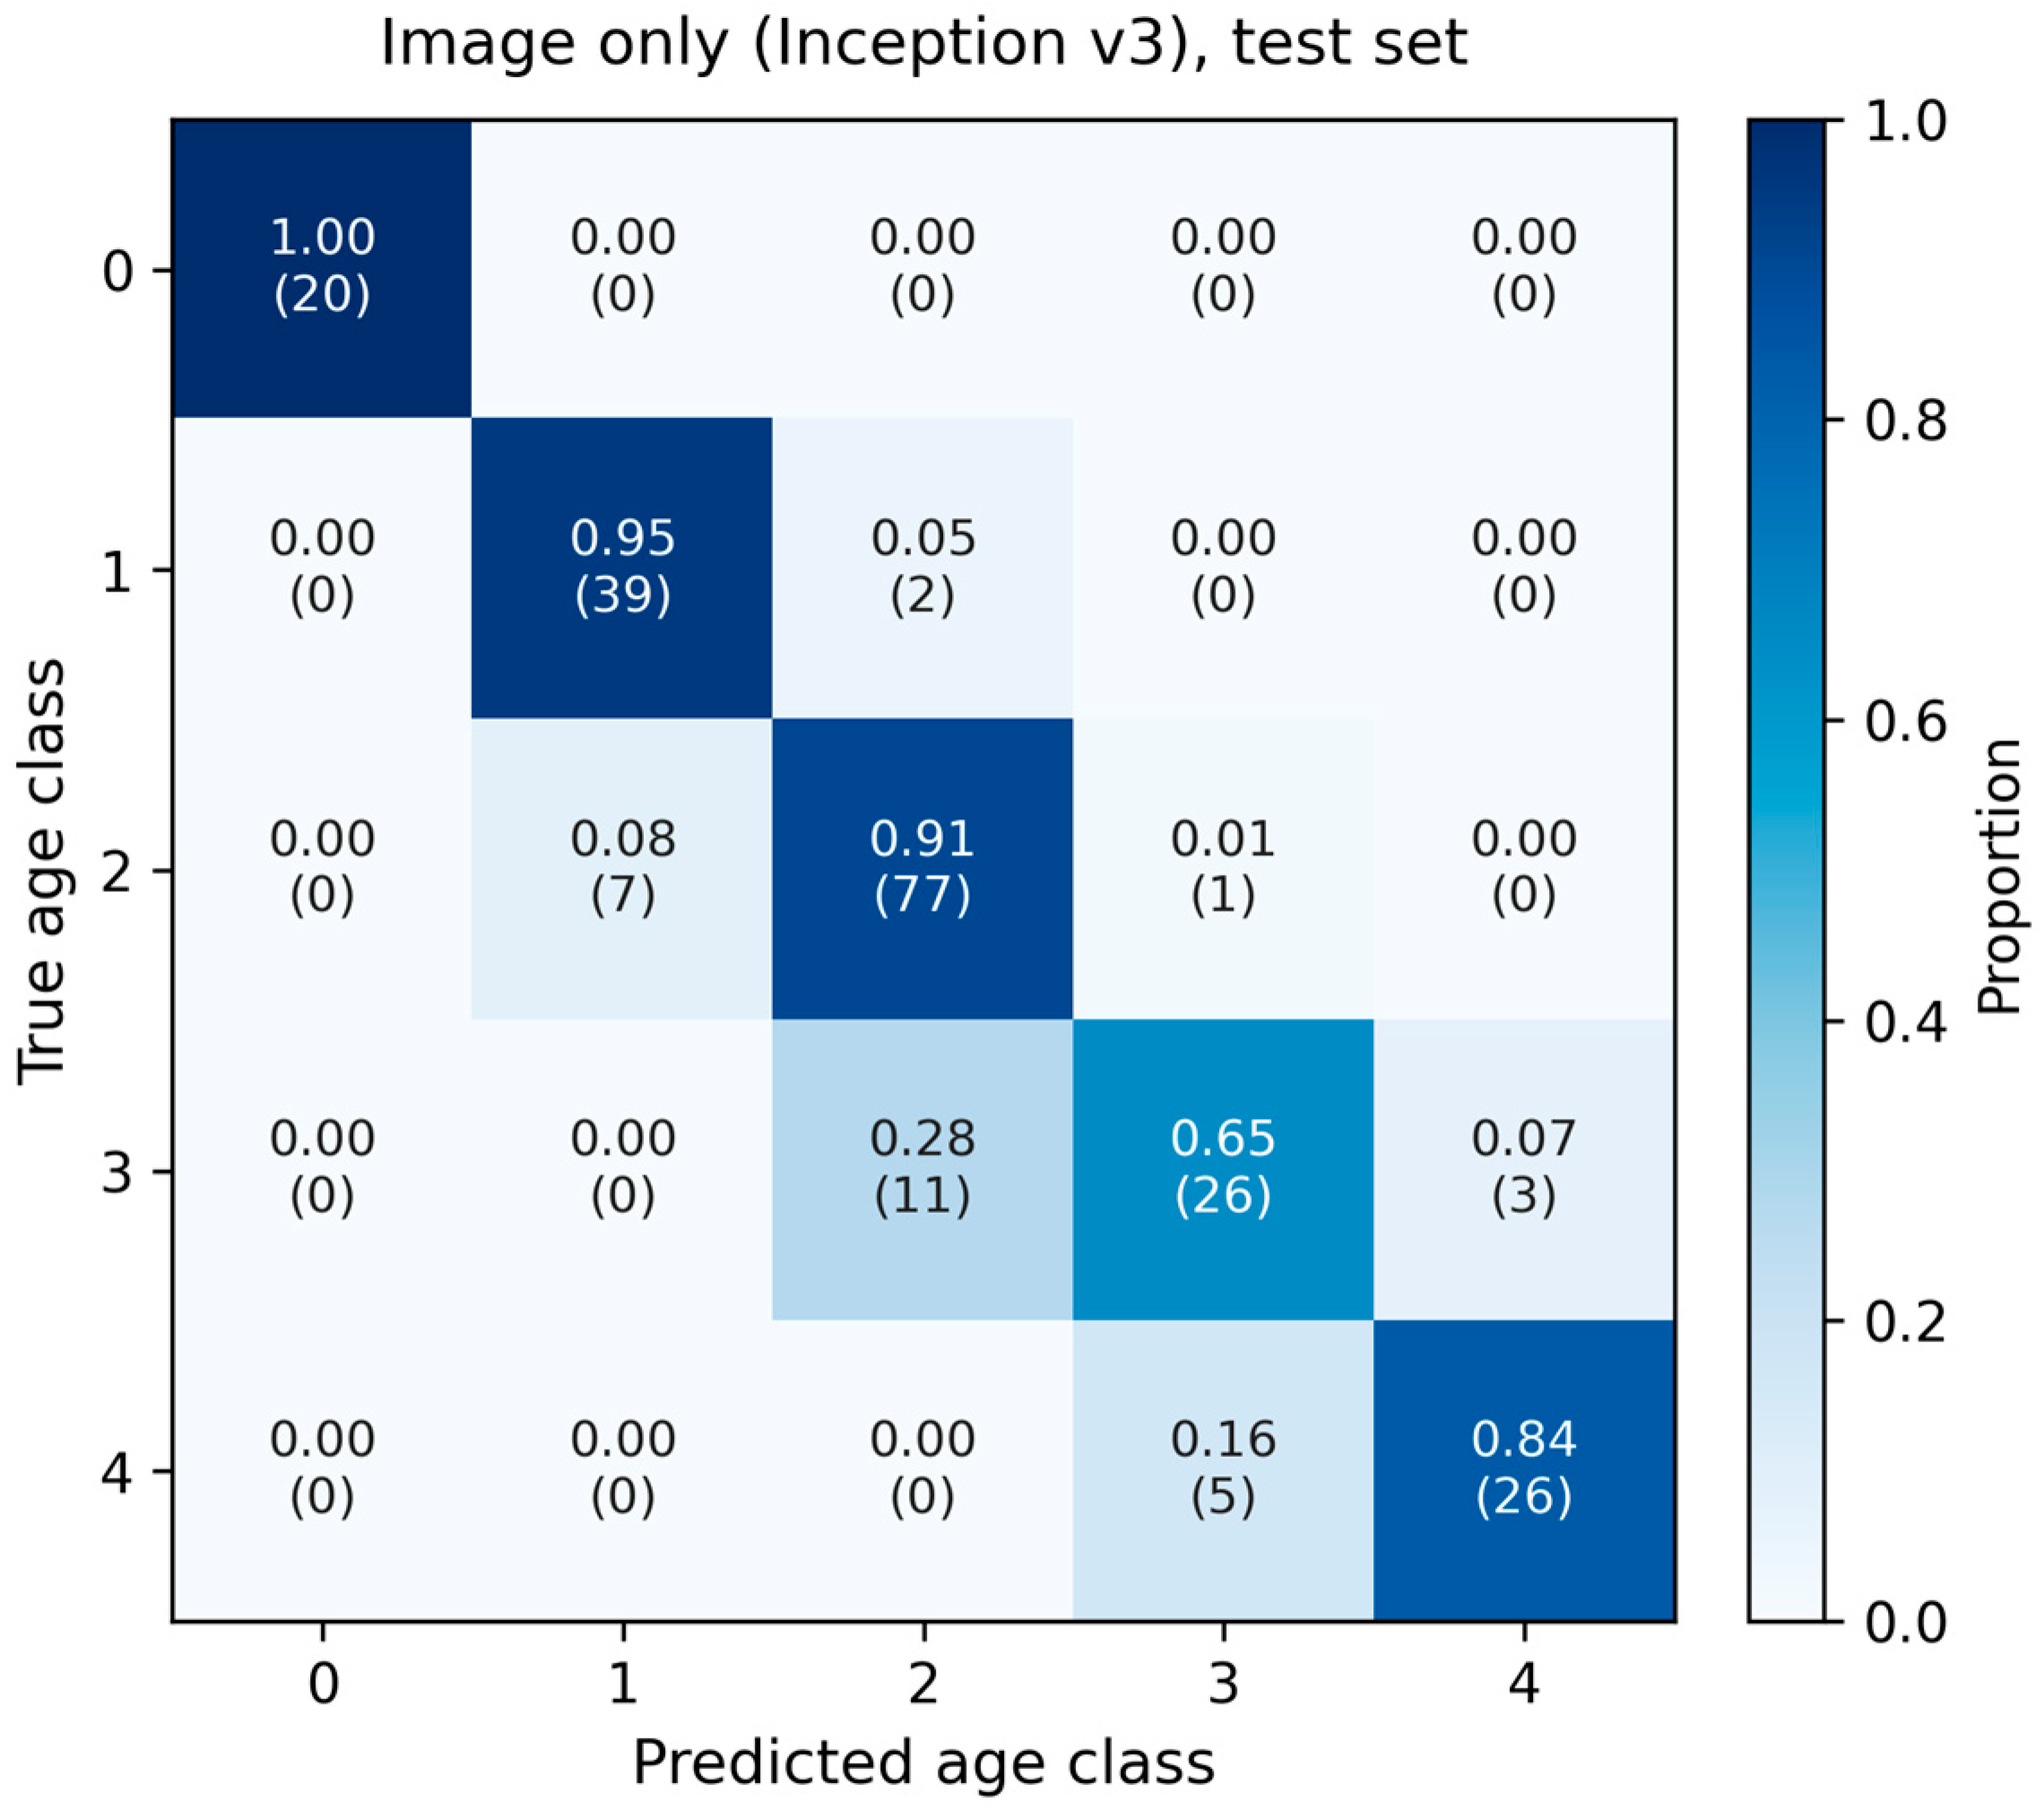
The optimized image-only model was evaluated on the independent test set after model selection had been completed. The model achieved test exact accuracy of 0.866 and test macro F1 score of 0.873 (Table 5). Agreement within one year was 1.000, indicating that all test set errors were within one age class of the reader-assigned age. Per-class performance is summarized in Table 6 and as a confusion matrix in Figure 11. Classification was perfect for age class 0 (F1 = 1.00) and strong for ages 1, 2, and 4, whereas age class 3 was the most difficult (F1 = 0.72, recall 0.65), with most age-3 otoliths misclassified as the adjacent age-2 class.
Table 5. Independent test performance of the optimized image-only model.
ModelTest Exact AccuracyTest Macro F1Test ±1 Year Accuracy
Image-only Inception v30.8660.8731.000
Table 6. Per-class precision, recall, and F1 score of the optimized image-only Inception v3 model on the independent test set.
Age ClassPrecisionRecallF1
01.0001.0001.000
10.8480.9510.897
20.8560.9060.880
30.8120.6500.722
40.8970.8390.867
Macro average0.8830.8690.873
Figure 9. Heatmaps of best validation macro-F1 according to learning rate and dropout in Stage 2, shown for two weight decay settings: (A) weight decay = 1 × 10⁻⁵ and (B) weight decay = 1 × 10⁻⁴.
Jmse 14 01145 g009
Figure 10. Validation macro-F1 (top row: (A,C,E)) and validation loss (bottom row: (B,D,F)) during Stage 2 hyperparameter optimization of the selected Inception-v3 image-only model. Each column corresponds to one learning rate: (A,B) 3 × 10⁻⁵, (C,D) 1 × 10⁻⁴, and (E,F) 3 × 10⁻⁴. Within each panel, the six curves represent combinations of weight decay (1 × 10⁻⁵, dashed; 1 × 10⁻⁴, solid) and dropout (0.2, 0.3, and 0.5).
Jmse 14 01145 g010
Figure 11. Confusion matrix of the optimized image-only Inception v3 model on the independent test set (n = 217). Cell values are row-normalized proportions with counts in parentheses.
Jmse 14 01145 g011
These results are consistent with sagittal otolith images containing age-related visual information that can be learned by CNNs. The high within-one-year agreement also suggests that the model captured the ordered nature of age classes rather than producing random class assignments.

4. Discussion

This study showed that reader-assigned age classes of T. japonicus could be classified from sagittal otolith images using CNNs. The result supports the idea that otolith images contain visual signals related to age. These signals may include broad otolith shape, image texture, and internal growth patterns. However, the model output should be interpreted as classification of reader-assigned age classes, not as independent validation of true age. This distinction is important because the supervised labels were derived from conventional otolith readings.
The Stage 1 comparison showed that all three backbones produced high validation performance. This means that the age-related visual signal was not limited to a single CNN architecture. Among the tested models, Inception v3 showed the highest validation macro F1 score and was selected as the image-only baseline. Inception-based architectures use multiple convolutional filters and can capture visual patterns at different spatial scales [18]. This may be useful for otolith images because age-related information can occur as local increment features as well as broader shape patterns. At the same time, the differences among the best backbones were moderate. The result should therefore be interpreted as the best architecture for the present dataset and training framework, rather than as general evidence that Inception v3 is always superior for otolith age classification.
EfficientNet B4 did not clearly outperform Inception v3 or Xception in this dataset, even though EfficientNet-based models have performed well in some otolith age interpretation studies [14]. One possible reason is that EfficientNet B4 may require careful adjustment of image size, learning rate, and regularization to reach stable performance. In the present analysis, its best setting was competitive, but the other learning rate settings were lower. This suggests that architecture choice and optimization settings should be evaluated together.
The Stage 2 results showed that hyperparameter optimization improved the selected Inception v3 model. The best setting combined a learning rate of 1 × 10⁻⁴, weight decay of 1 × 10⁻⁴, and dropout of 0.3. This indicates that the final performance depended not only on the backbone but also on regularization and optimization. Weight decay helps limit excessive parameter growth, and AdamW applies weight decay separately from the adaptive gradient update [29]. Dropout also reduces co-adaptation among features and can help limit overfitting [32]. These regularization methods were useful because the number of otolith images was small compared with general computer vision datasets.
The use of validation macro F1 as the primary selection criterion was appropriate because the age class distribution was not uniform. Overall accuracy can be dominated by the most common age classes. Macro F1 gives equal weight to each class and therefore provides a clearer view of class-balanced prediction [30,31]. In the present dataset, age 2 was the most abundant class, whereas age 0 was less common. A metric that gives more equal weight to all classes was therefore important for model selection.
The independent test result showed lower exact performance than the best validation result, but the model still achieved a test macro F1 score of 0.873 and a within-one-year agreement of 1.000. This pattern suggests that exact age class prediction remained difficult for some neighboring ages, while large age errors were not observed. Such a pattern is biologically reasonable because adjacent age classes can have similar otolith structures. In applied age reading, a prediction that differs by one year has a different meaning from an error of several years. For this reason, both exact accuracy and a within-one-year agreement should be considered when evaluating otolith age classification models.
The present model may be useful as a support tool for age classification of T. japonicus. It could help screen large image datasets, provide a second opinion for readers, or flag samples that require careful rechecking. Similar support-oriented use has been suggested for automated fish age estimation systems [16,17,33]. The goal should not be to remove expert readers from the process. Instead, CNN-based tools can help improve efficiency and consistency when used together with conventional otolith reading. Any efficiency gain should, however, be interpreted with caution. Otolith extraction, cleaning, grinding, and imaging remain necessary and are shared with conventional age reading, so the time saved by automating the reading step alone is likely to be modest. The more substantial practical benefits are a reduced dependence on scarce reader expertise and improved consistency and scalability when large numbers of otolith images must be processed [13].
Several limitations should be noted. First, the model was trained using reader-assigned age labels. Any uncertainty in the original readings can be transferred to the model. Because all readings were made by a single reader, between-reader agreement could not be assessed, and the labels retain an irreducible component of reading uncertainty (within-reader CV = 8.41%; Section 2.1). This uncertainty propagates into the supervised targets and effectively sets an upper bound on the agreement that any image-based model can reach. Consequently, part of the model’s exact-classification error is expected to reflect label noise rather than failure of the network, and the reported performance should be interpreted as agreement with reader-assigned age classes rather than with independently validated true age. Second, the model was developed using a single image dataset. Otolith image models can be sensitive to differences in lighting, magnification, camera settings, background, preparation method, and local reading protocol. Previous work has shown that models trained on one otolith image source may not transfer directly to another without adaptation [34]. Third, the sampled age range was limited to ages 0 to 4. Performance outside this age range remains unknown.
Future work should include external validation using otolith images from different sampling periods, imaging systems, or laboratories. Multiple reader datasets would also be useful for estimating label uncertainty. Model interpretation methods, such as class activation maps or saliency-based approaches, could help determine whether the network focused on biologically meaningful otolith regions rather than background artifacts. Such interpretability will be important if CNN models are to be used in routine fisheries monitoring.

5. Conclusions

This study evaluated three CNN backbones for age class classification of T. japonicus using sagittal otolith images only. Inception v3, Xception, and EfficientNet B4 all showed high validation performance, indicating that otolith images contained useful age-related visual information. Inception v3 gave the highest validation macro F1 score in the benchmark comparison and was further improved through hyperparameter optimization. The optimized image-only model achieved moderate to high exact test performance and complete agreement within one year. These results suggest that otolith image-based CNNs can support age class screening in T. japonicus. The approach should be treated as a complementary decision support tool rather than a replacement for expert otolith reading. These conclusions are restricted to the 0 to 4 age range available from commercial purse seine catches, and performance for older ages remains to be evaluated.

Author Contributions

Conceptualization, M.-S.Y. and C.-W.O.; methodology, M.-S.Y.; software, M.-S.Y.; validation, M.-S.Y.; formal analysis, M.-S.Y.; investigation, M.-S.Y.; resources, C.-W.O.; data curation, M.-S.Y.; writing—original draft preparation, M.-S.Y.; writing—review and editing, C.-W.O.; visualization, M.-S.Y.; supervision, C.-W.O.; project administration, C.-W.O. All authors have read and agreed to the published version of the manuscript.

Funding

This work was supported by a Research Grant from Pukyong National University (2025).

Data Availability Statement

The data that support the findings of this study are available from the corresponding author upon reasonable request.

Acknowledgments

The authors thank the members of the laboratory who assisted with sample handling and otolith image preparation.

Conflicts of Interest

The authors declare no conflicts of interest.

References

  1. Beamish, R.J.; McFarlane, G.A. The forgotten requirement for age validation in fisheries biology. Trans. Am. Fish. Soc. 1983, 112, 735–743. [Google Scholar] [CrossRef] [Scilit]
  2. Campana, S.E. Accuracy, precision and quality control in age determination, including a review of the use and abuse of age validation methods. J. Fish Biol. 2001, 59, 197–242. [Google Scholar] [CrossRef]
  3. Campana, S.E.; Moksness, E. Accuracy and precision of age and hatch date estimates from otolith microstructure examination. ICES J. Mar. Sci. 1991, 48, 303–316. [Google Scholar] [CrossRef] [Scilit]
  4. Hüssy, K.; Radtke, K.; Plikshs, M.; Oeberst, R.; Baranova, T.; Krumme, U.; Sjöberg, R.; Walther, Y.; Mosegaard, H. Challenging ICES age estimation protocols: Lessons learned from the eastern Baltic cod stock. ICES J. Mar. Sci. 2016, 73, 2138–2149. [Google Scholar] [CrossRef] [Scilit]
  5. Yamada, U.; Tokimura, M.; Horikawa, H.; Nakabo, T. Fishes and Fisheries of the East China and Yellow Seas; Tokai University Press: Kanagawa, Japan, 2007. [Google Scholar]
  6. Lee, D.J.; Kang, S.; Jung, K.-M.; Cha, H.K. Age and growth of jack mackerel Trachurus japonicus off Jeju Island, Korea. Korean J. Fish. Aquat. Sci. 2016, 49, 648–656. [Google Scholar] [CrossRef] [Scilit]
  7. Yoda, M.; Shiraishi, T.; Yukami, R.; Ohshimo, S. Age and maturation of jack mackerel Trachurus japonicus in the East China Sea. Fish. Sci. 2014, 80, 61–68. [Google Scholar] [CrossRef] [Scilit]
  8. Yoda, M.; Tanaka, S.; Takahashi, M. Age, growth and reproductive cycle of the jack mackerel Trachurus japonicus in the Southwestern Sea of Japan. Jpn. Agric. Res. Q. 2023, 57, 175–182. [Google Scholar] [CrossRef] [Scilit]
  9. Fablet, R.; Le Josse, N. Automated fish age estimation from otolith images using statistical learning. Fish. Res. 2005, 72, 279–290. [Google Scholar] [CrossRef] [Scilit]
  10. Morison, A.K.; Robertson, S.G.; Smith, D.C. An integrated system for production fish aging: Image analysis and quality assurance. N. Am. J. Fish. Manag. 1998, 18, 587–598. [Google Scholar] [CrossRef]
  11. LeCun, Y.; Bengio, Y.; Hinton, G. Deep learning. Nature 2015, 521, 436–444. [Google Scholar] [CrossRef] [Scilit] [PubMed]
  12. LeCun, Y.; Bottou, L.; Bengio, Y.; Haffner, P. Gradient-based learning applied to document recognition. Proc. IEEE 1998, 86, 2278–2324. [Google Scholar] [CrossRef] [Scilit]
  13. Moen, E.; Handegard, N.O.; Allken, V.; Albert, O.T.; Harbitz, A.; Malde, K. Automatic interpretation of otoliths using deep learning. PLoS ONE 2018, 13, e0204713. [Google Scholar] [CrossRef] [Scilit] [PubMed]
  14. Martinsen, I.; Harbitz, A.; Bianchi, F.M. Age prediction by deep learning applied to Greenland halibut (Reinhardtius hippoglossoides) otolith images. PLoS ONE 2022, 17, e0277244. [Google Scholar] [CrossRef] [Scilit] [PubMed]
  15. Moen, E.; Vabø, R.; Smoliński, S.; Denechaud, C.; Handegard, N.O.; Malde, K. Age interpretation of cod otoliths using deep learning. Ecol. Inform. 2023, 78, 102325. [Google Scholar] [CrossRef] [Scilit]
  16. Politikos, D.V.; Petasis, G.; Chatzispyrou, A.; Mytilineou, C.; Anastasopoulou, A. Automating fish age estimation combining otolith images and deep learning: The role of multitask learning. Fish. Res. 2021, 242, 106033. [Google Scholar] [CrossRef] [Scilit]
  17. Politikos, D.V.; Sykiniotis, N.; Petasis, G.; Dedousis, P.; Ordoñez, A.; Vabø, R.; Anastasopoulou, A.; Moen, E.; Mytilineou, C.; Salberg, A.B.; et al. DeepOtolith v1.0: An open-source AI platform for automating fish age reading from otolith or scale images. Fishes 2022, 7, 121. [Google Scholar] [CrossRef] [Scilit]
  18. Szegedy, C.; Vanhoucke, V.; Ioffe, S.; Shlens, J.; Wojna, Z. Rethinking the inception architecture for computer vision. In Proceedings of the IEEE Conference on Computer Vision and Pattern Recognition, Las Vegas, NV, USA, 27–30 June 2016; pp. 2818–2826. [Google Scholar]
  19. Chollet, F. Xception: Deep learning with depthwise separable convolutions. In Proceedings of the IEEE Conference on Computer Vision and Pattern Recognition, Honolulu, HI, USA, 21–26 July 2017; pp. 1251–1258. [Google Scholar]
  20. Tan, M.; Le, Q. EfficientNet: Rethinking model scaling for convolutional neural networks. In Proceedings of the International Conference on Machine Learning, Long Beach, CA, USA, 9–15 June 2019; pp. 6105–6114. [Google Scholar]
  21. Cohen, J. Weighted kappa: Nominal scale agreement with provision for scaled disagreement or partial credit. Psychol. Bull. 1968, 70, 213–220. [Google Scholar] [CrossRef] [Scilit] [PubMed]
  22. Chang, W.Y.B. A statistical method for evaluating the reproducibility of age determination. Can. J. Fish. Aquat. Sci. 1982, 39, 1208–1210. [Google Scholar] [CrossRef] [Scilit]
  23. Beamish, R.J.; Fournier, D.A. A method for comparing the precision of a set of age determinations. Can. J. Fish. Aquat. Sci. 1981, 38, 982–983. [Google Scholar] [CrossRef] [Scilit]
  24. Campana, S.E.; Annand, M.C.; McMillan, J.I. Graphical and statistical methods for determining the consistency of age determinations. Trans. Am. Fish. Soc. 1995, 124, 131–138. [Google Scholar] [CrossRef] [Scilit]
  25. Landis, J.R.; Koch, G.G. The measurement of observer agreement for categorical data. Biometrics 1977, 33, 159–174. [Google Scholar] [CrossRef] [Scilit]
  26. Yosinski, J.; Clune, J.; Bengio, Y.; Lipson, H. How transferable are features in deep neural networks? In Proceedings of the Advances in Neural Information Processing Systems, Montreal, QC, Canada, 8–13 December 2014; Volume 27. [Google Scholar]
  27. Tajbakhsh, N.; Shin, J.Y.; Gurudu, S.R.; Hurst, R.T.; Kendall, C.B.; Gotway, M.B.; Liang, J. Convolutional neural networks for medical image analysis: Full training or fine tuning? IEEE Trans. Med. Imaging 2016, 35, 1299–1312. [Google Scholar] [CrossRef] [Scilit] [PubMed]
  28. Kingma, D.P.; Ba, J. Adam: A method for stochastic optimization. arXiv 2014, arXiv:1412.6980. [Google Scholar]
  29. Loshchilov, I.; Hutter, F. Decoupled weight decay regularization. arXiv 2017, arXiv:1711.05101. [Google Scholar]
  30. Sokolova, M.; Lapalme, G. A systematic analysis of performance measures for classification tasks. Inf. Process. Manag. 2009, 45, 427–437. [Google Scholar] [CrossRef] [Scilit]
  31. Tharwat, A. Classification assessment methods. Appl. Comput. Inform. 2021, 17, 168–192. [Google Scholar]
  32. Srivastava, N.; Hinton, G.; Krizhevsky, A.; Sutskever, I.; Salakhutdinov, R. Dropout: A simple way to prevent neural networks from overfitting. J. Mach. Learn. Res. 2014, 15, 1929–1958. [Google Scholar]
  33. Bojesen, T.A.; Denechaud, C.; Malde, K. Annotating otoliths with a deep generative model. ICES J. Mar. Sci. 2024, 81, 55–65. [Google Scholar] [CrossRef] [Scilit]
  34. Ordoñez, A.; Eikvil, L.; Salberg, A.B.; Harbitz, A.; Elvarsson, B.P. Automatic fish age determination across different otolith image labs using domain adaptation. Fishes 2022, 7, 71. [Google Scholar] [CrossRef] [Scilit]
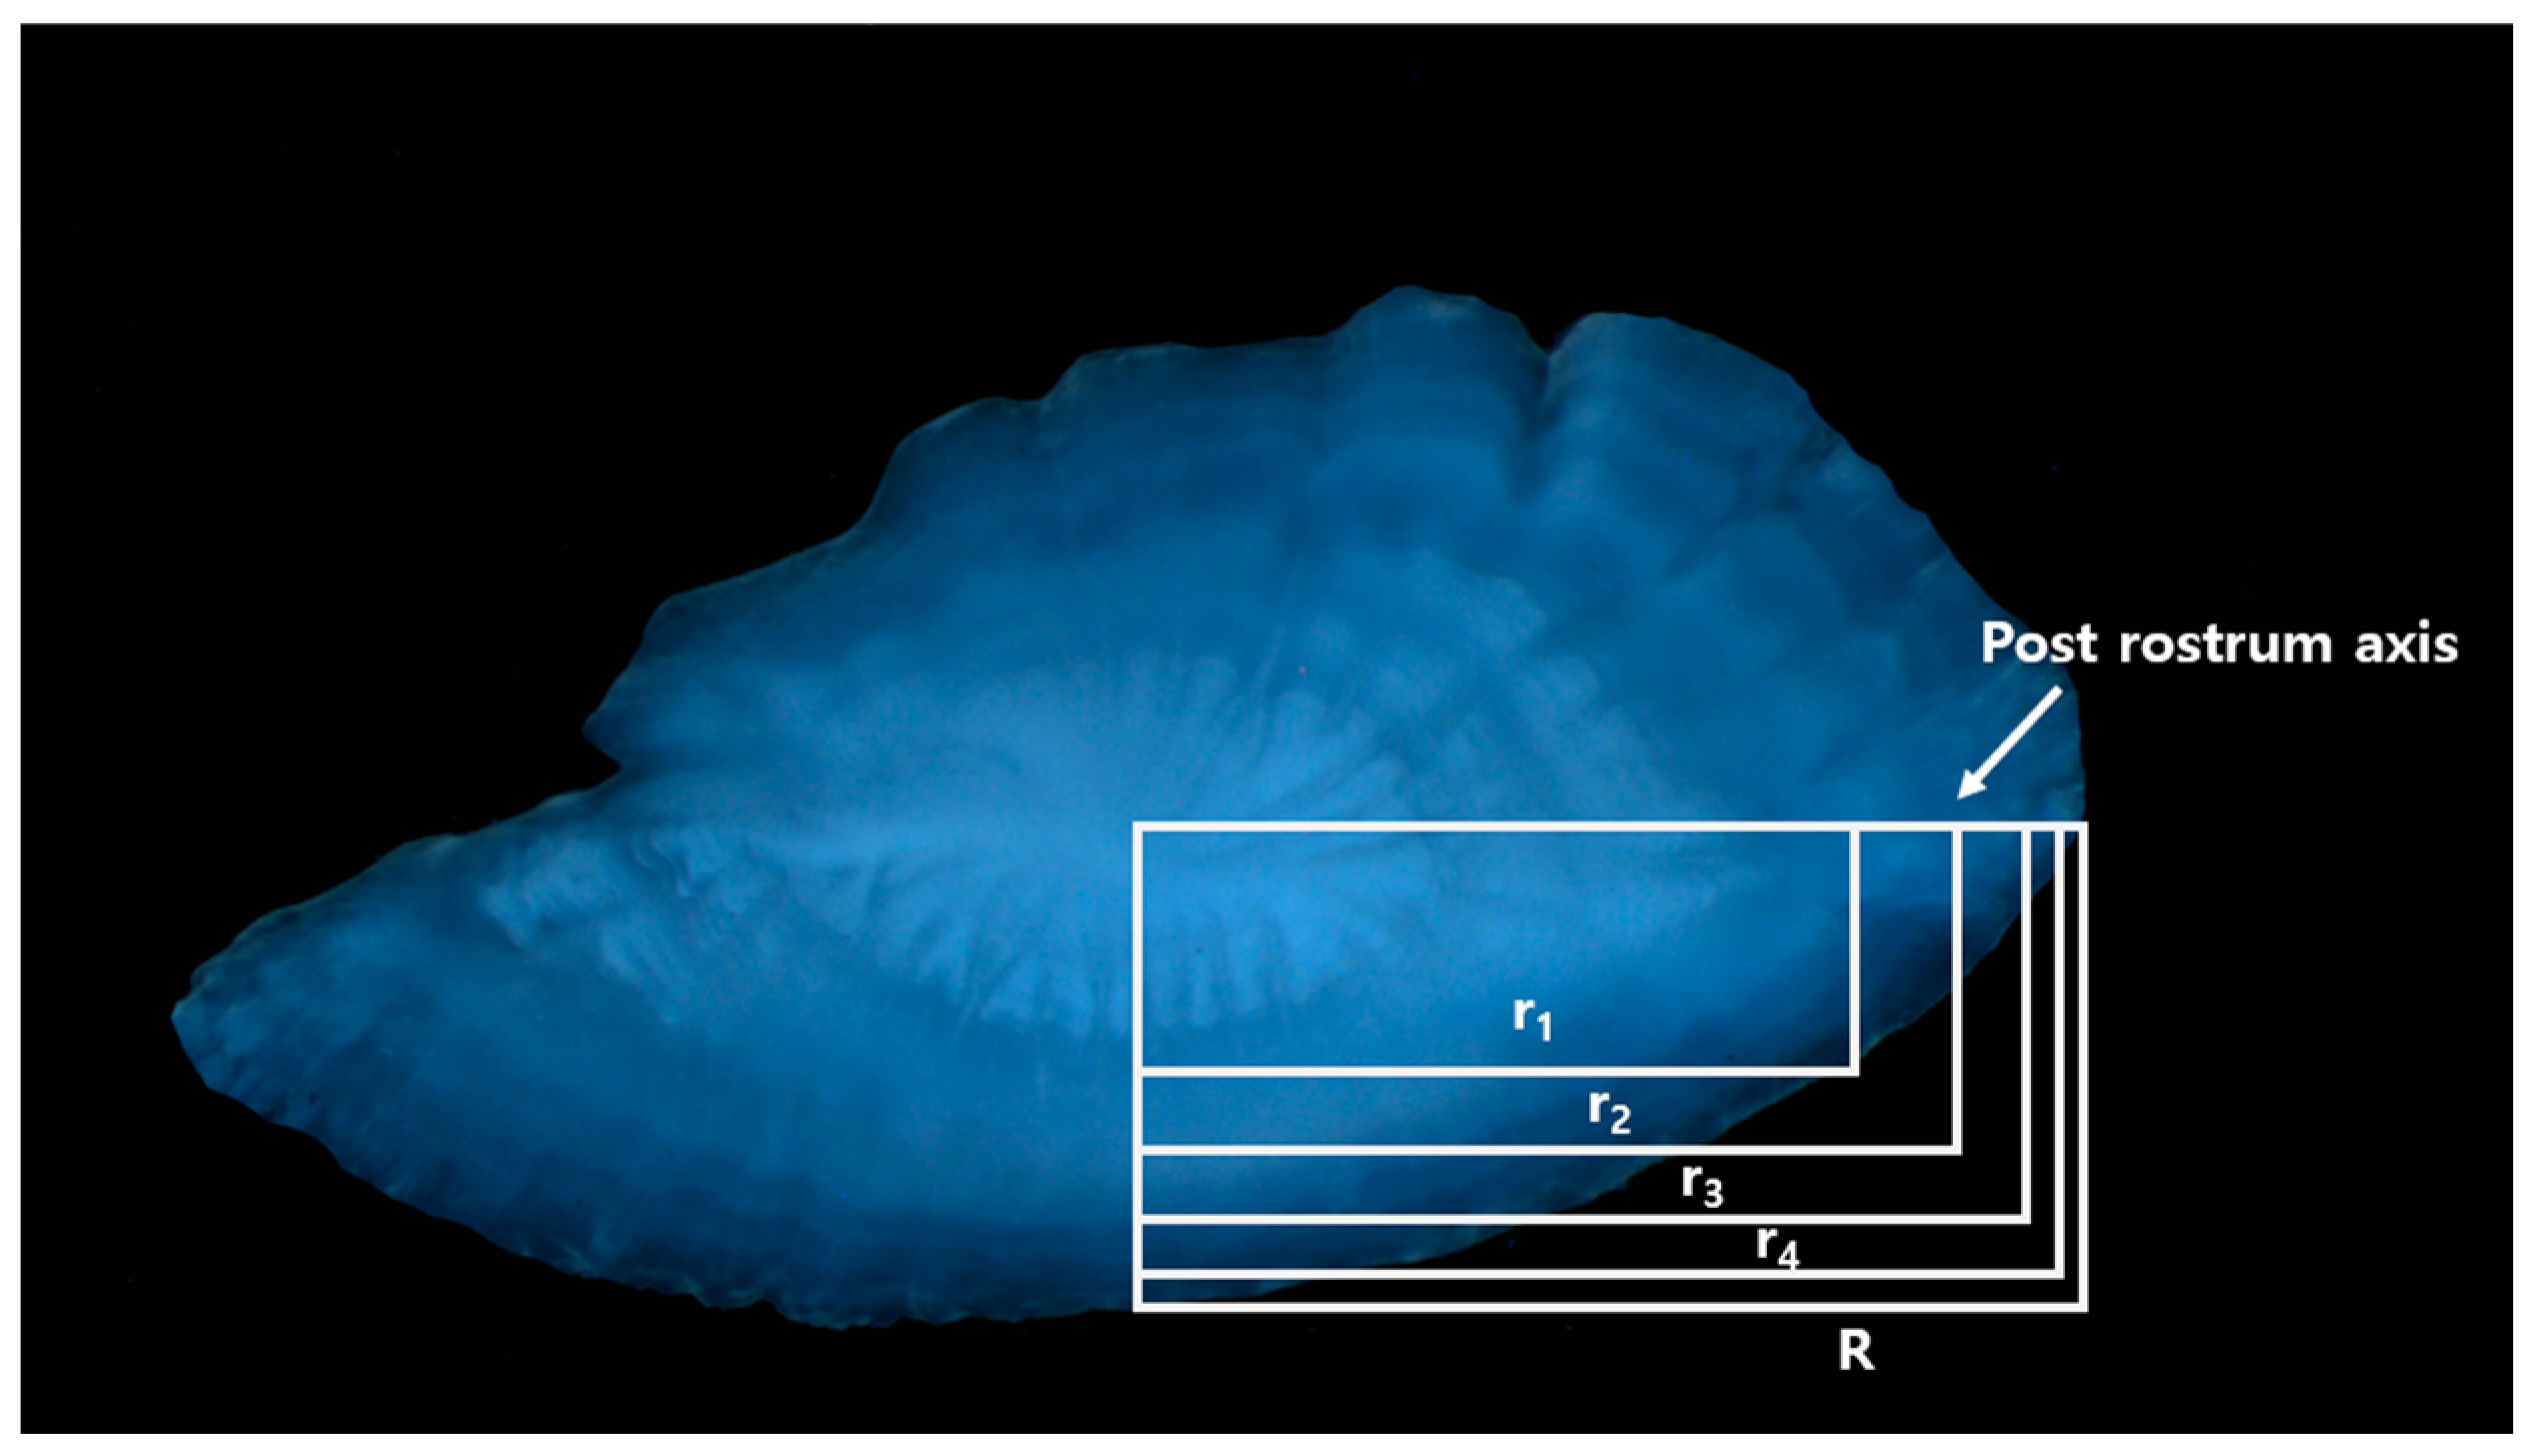
Figure 1. Representative sagittal otolith of Trachurus japonicus showing the post-rostrum reading axis along which annuli were counted, with the otolith radius (R) and successive annual marks (r1–r4).
Jmse 14 01145 g001
Figure 2. Representative sagittal otolith images for each age class (0–4 years) of Trachurus japonicus.
Jmse 14 01145 g002
Figure 3. Image standardization pipeline applied before model input: padding to a square while preserving the original aspect ratio, resizing to the backbone input size, and normalization using ImageNet statistics. Mild augmentation (rotation and brightness/contrast jitter) was applied during training only.
Jmse 14 01145 g003
Figure 4. Comparison of the best validation macro F1 scores obtained in Stage 1 across three image-only backbones and three learning rate settings.
Jmse 14 01145 g004
Figure 5. Validation macro-F1 (top row: (A,C,E)) and validation loss (bottom row: (B,D,F)) during Stage 1 training under three learning rate settings (3 × 10⁻⁵, 1 × 10⁻⁴, and 3 × 10⁻⁴). Each column corresponds to one backbone: (A,B) Inception-v3; (C,D) Xception; (E,F) EfficientNet-B4.
Jmse 14 01145 g005
Figure 6. Validation exact accuracy trajectories during Stage 1 under three learning rate settings (3 × 10⁻⁵, 1 × 10⁻⁴, and 3 × 10⁻⁴), shown for each image-only backbone: (A) Inception-v3, (B) Xception, and (C) EfficientNet-B4.
Jmse 14 01145 g006
Figure 7. Validation agreement within one age class (±1 age-class accuracy) during Stage 1 under three learning rate settings (3 × 10⁻⁵, 1 × 10⁻⁴, and 3 × 10⁻⁴), shown for each image-only backbone: (A) Inception-v3, (B) Xception, and (C) EfficientNet-B4.
Jmse 14 01145 g007
Figure 8. Best validation macro-F1 for each Stage 2 hyperparameter combination of the selected Inception-v3 image-only model, ranked in descending order (18 combinations in total). Settings for the top five combinations are listed in Table 4.
Jmse 14 01145 g008
Table 1. Sample composition of Trachurus japonicus otolith images used for age class classification.
Age ClassNumber of ImagesPercentage (%)
01349.3
127018.7
256739.3
326518.4
420814.4
Total1444100.0
Table 2. Image augmentation strategies used in previous otolith deep learning studies and in the present study.
StudySpeciesAugmentationNote
Moen et al. [13]Greenland halibutRotation 0–360°; horizontal/vertical reflection; vertical shiftRelatively strong geometric augmentation
Martinsen et al. [14]Greenland halibutHorizontal translation 10%; rotation up to 36°Moderate augmentation
Present studyJapanese jack mackerelRotation ±10°; small brightness and contrast changesMild augmentation chosen to reflect realistic image acquisition variation
Table 3. Stage 1 comparison of image-only CNN backbones and learning rate settings.
BackboneLearning RateBest EpochValidation Macro F1Validation LossValidation Exact Accuracy
Inception v33 × 10−5150.9330.2200.926
Inception v31 × 10−4130.9230.2300.918
Inception v33 × 10−4140.9310.2330.926
Xception3 × 10−5270.9280.2240.922
Xception1 × 10−460.9280.2060.926
Xception3 × 10−4180.9300.2130.922
EfficientNet B43 × 10−5260.9140.2850.900
EfficientNet B41 × 10−4210.9290.2120.926
EfficientNet B43 × 10−4130.9190.2540.909
Table 4. Top-five Stage 2 hyperparameter combinations for the selected Inception v3 image-only model.
RankLearning RateWeight DecayDropoutBest EpochValidation Macro F1Validation LossValidation Exact AccuracyValidation ±1 Accuracy
11 × 10−41 × 10−40.3110.9440.1810.9351.000
21 × 10−41 × 10−50.2130.9410.1580.9351.000
33 × 10−41 × 10−40.5150.9340.2790.9310.996
43 × 10−51 × 10−40.5260.9320.2740.9260.996
53 × 10−51 × 10−50.5150.9310.2730.9261.000
Disclaimer/Publisher’s Note: The statements, opinions and data contained in all publications are solely those of the individual author(s) and contributor(s) and not of MDPI and/or the editor(s). MDPI and/or the editor(s) disclaim responsibility for any injury to people or property resulting from any ideas, methods, instructions or products referred to in the content.