Review

Advances in Mechanism Decoupling of Cavitating Jet Impingement and Multi-Source Measurement Techniques: A Review


Zhijian Laboratory, Rocket Force University of Engineering, Xi’an 710025, China
*
Author to whom correspondence should be addressed.
J. Mar. Sci. Eng. 2026, 14(12), 1111; https://doi.org/10.3390/jmse14121111
Submission received: 14 March 2026 / Revised: 9 April 2026 / Accepted: 15 April 2026 / Published: 17 June 2026
(This article belongs to the Special Issue Advances of Multiphase Flow in Hydraulic and Marine Engineering)

Abstract

Cavitating jet impingement is a key phenomenon in marine and ocean engineering that is responsible for cavitation-induced material erosion while also being harnessed for surface treatment applications. However, decoupling these concurrent effects is challenging since hydrodynamic jet pressure, microjet impacts, and shockwave emissions often coincide in space and time, making it difficult to isolate their individual contributions. To address this challenge, this review surveys recent advances in measurement techniques designed to decouple these overlapping effects. It highlights multi-source synchronous measurement methods, such as high-speed optical imaging and broadband piezoelectric pressure sensing combined with advanced signal and image processing, to capture mechanism-specific signatures. The review treats mechanism decoupling as a linked task of mechanism identification, mechanism attribution, and contribution quantification and synthesizes the literature under distinct criteria, such as energy, peak pressure, and damage dominance. It shows that synchronized multi-source diagnostics improve attribution reliability but that true quantitative decoupling remains limited by configuration dependence, inconsistent normalization, and a lack of benchmark evaluation criteria.

1. Introduction

Cavitating impingement is a transient high-energy phenomenon involving the coupling of multiple physical fields. In this review, the term is defined as the impact of a high-velocity cavitating jet on a solid boundary. It includes the hydrodynamic loading produced by the liquid jet component, irrespective of whether cavitation is locally present, as well as the impulsive loads generated by the near-wall collapse of individual bubbles or bubble clouds. Cavitation that develops away from the wall without direct interaction with the surface is excluded from this definition. Widely encountered in hydraulic machinery—including marine propellers, water pumps, and offshore load-bearing structures—it acts as a primary driver of cavitation-induced material erosion damage [1,2,3,4,5,6]. On the other hand, cavitation effects also find practical applications in marine engineering technologies, such as marine surface cleaning and underwater acoustic signal modulation [7,8,9,10,11,12,13,14,15]. Consequently, gaining an in-depth understanding of the cavitating impingement mechanism carries substantial engineering significance for enhancing the operational reliability and service performance of marine equipment.
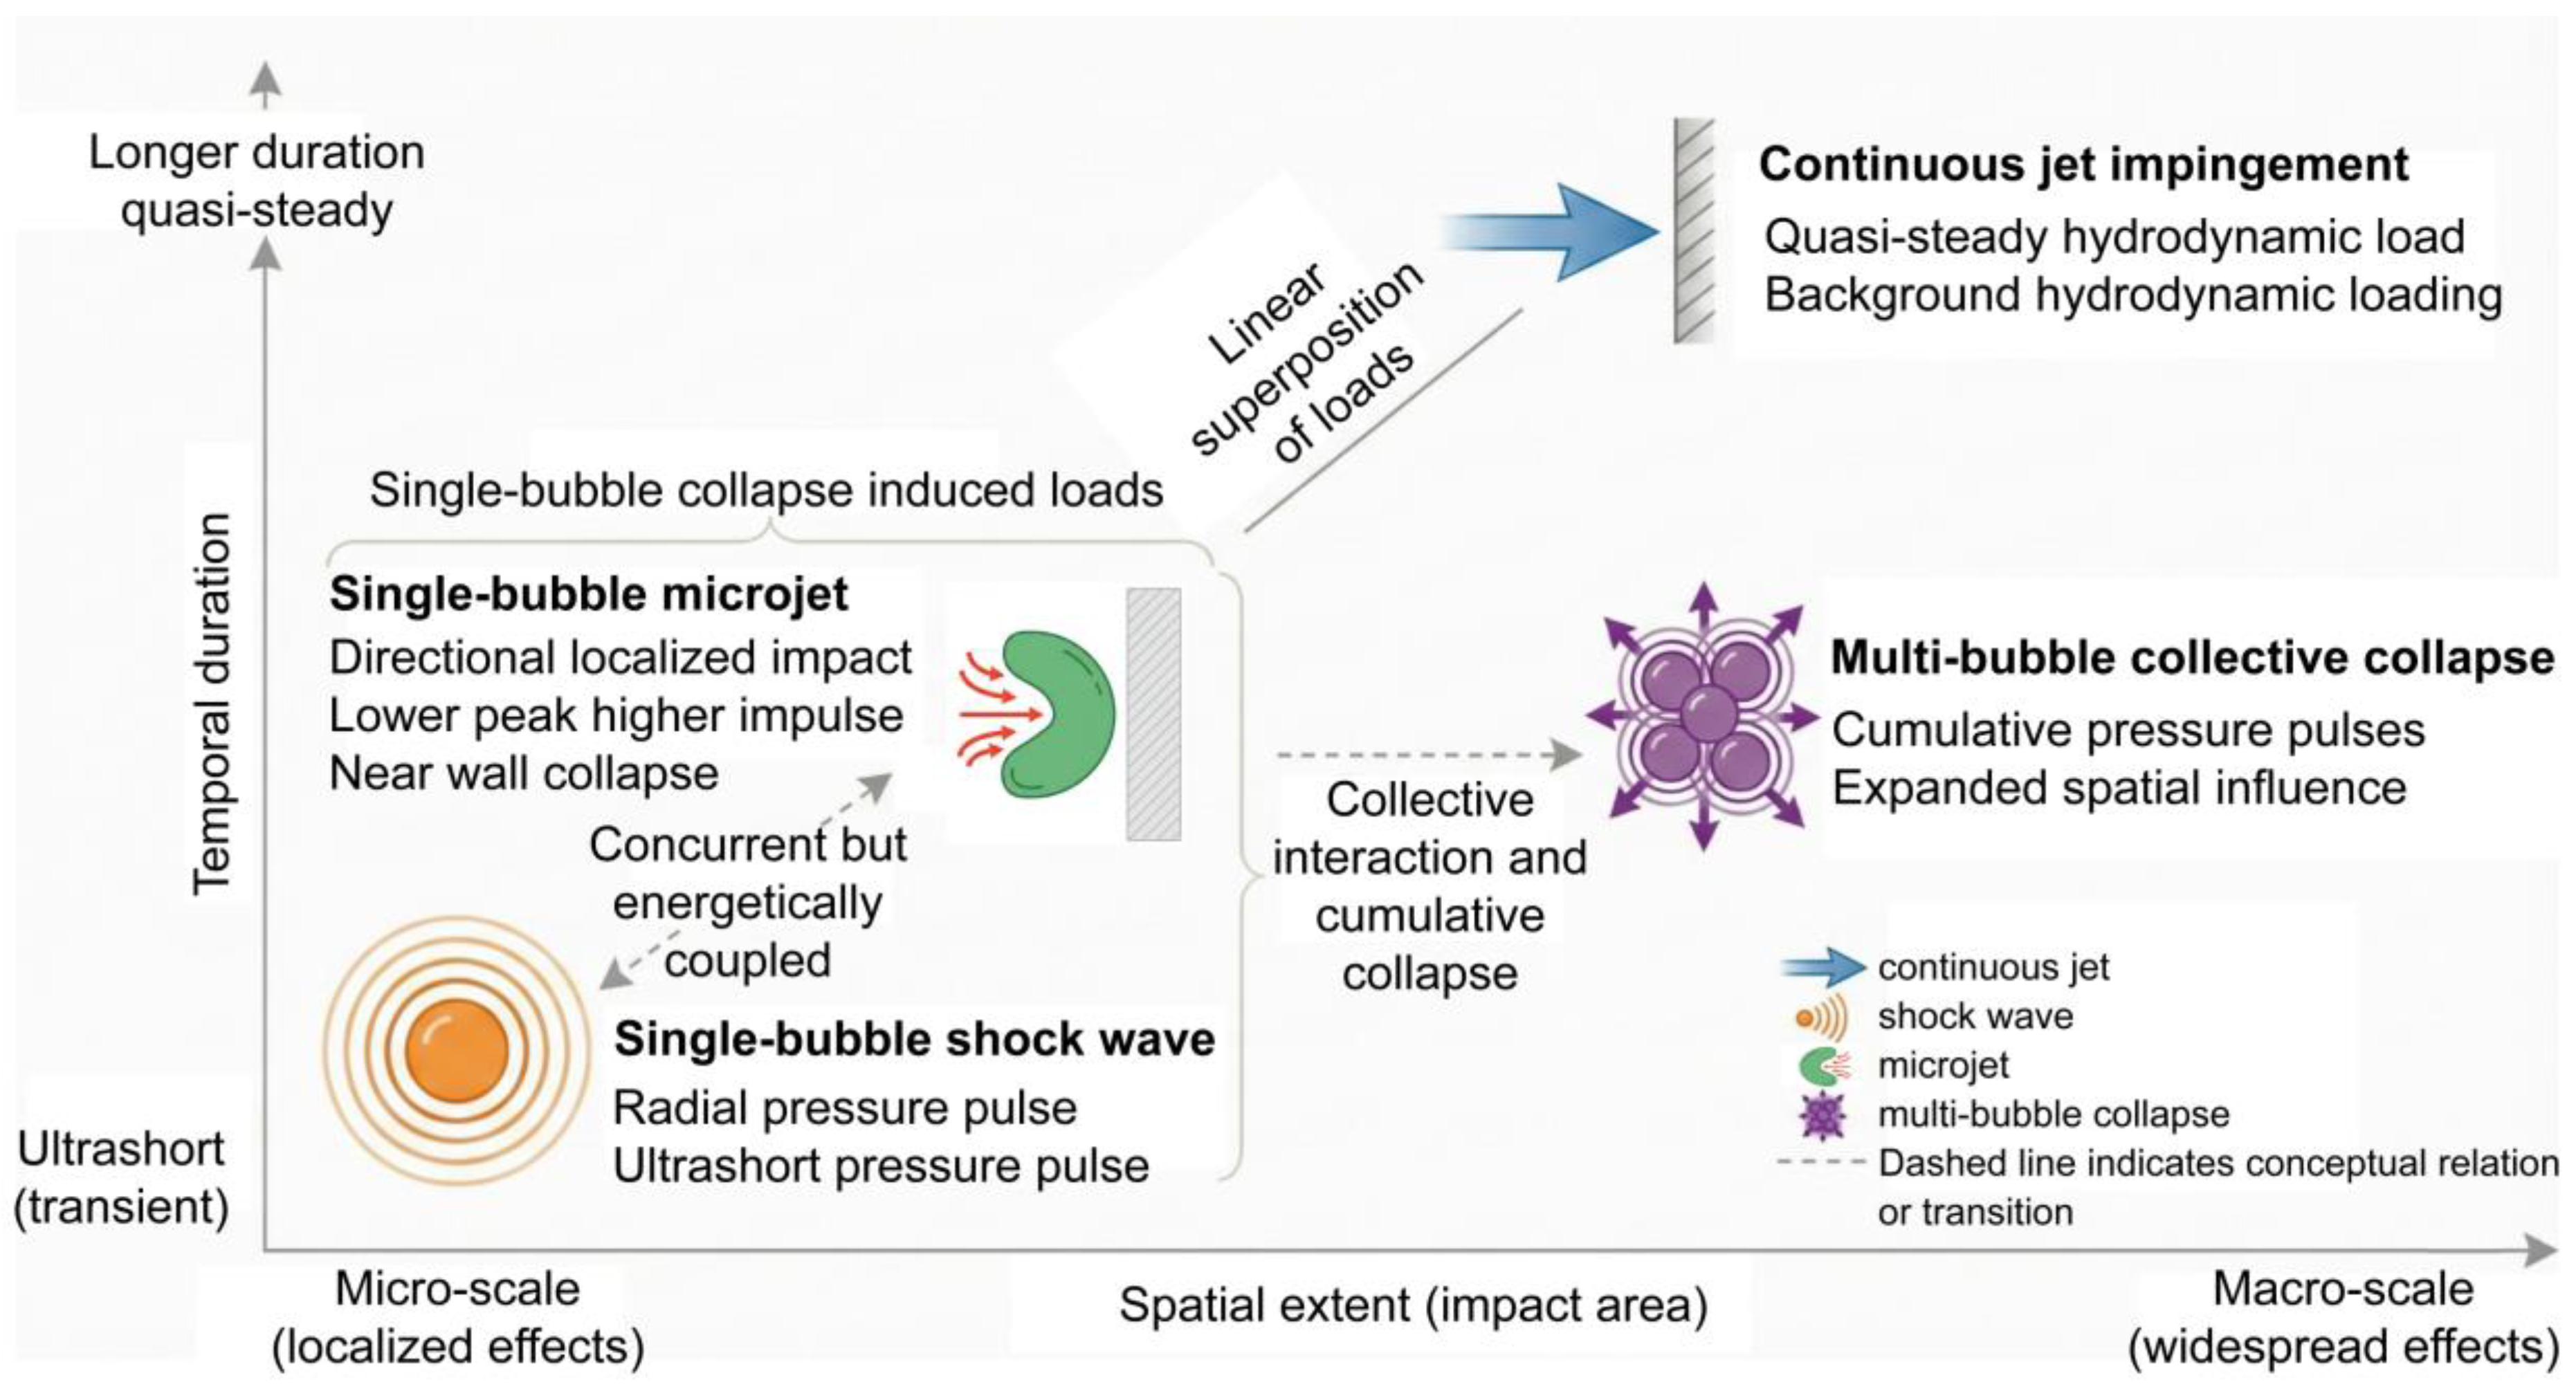
Nevertheless, the physical mechanism underlying cavitating impingement is characterized by high complexity and strong coupling effects [16,17]. Cavitating impingement loads typically originate from the combined action of multiple mechanisms, including hydrodynamic jet impingement, high-velocity microjets driven by asymmetric bubble collapse, spherical shockwaves emitted during the collapse of individual bubbles, and intense shockwaves generated by the synchronous collapse of bubble clusters [18,19]. Figure 1 provides a unified taxonomy of these dominant loading mechanisms in terms of temporal duration and spatial extent, and it serves as the organizing framework used throughout this review.
Figure 1 should be read as an analytical map. The vertical axis corresponds to a measurable duration scale, and the horizontal axis corresponds to a measurable spatial reach or impact area. Under this framework, continuous jet impingement is associated mainly with quasi-steady loading, single-bubble shockwaves with nanosecond-scale pressure pulses, single-bubble microjets with highly localized wall-directed loading, and bubble-cloud collective collapse, defined here as the near-simultaneous collapse of multiple interacting bubbles within a cluster or cloud, with a broader cumulative response window. The figure indicates that different mechanisms should be compared through different observables, such as pulse duration, affected area, wall shear, peak pressure, or cumulative vibration, depending on the response metric selected in a given study.
These effects overlap with one another within extremely narrow spatiotemporal scales [20,21]. Moreover, under practical marine operating conditions—for instance, in scenarios involving ship propellers and underwater structural components—the interactions between these mechanisms grow even more intricate.
In real-world cavitating flow systems, different mechanisms frequently occur concurrently and interact reciprocally. Their respective effects are difficult to directly differentiate through experimental observations, which poses challenges for the effective decoupling and quantitative assessment of their individual contributions [22,23]. This mechanistic ambiguity—stemming from the scarcity of quantitative data on individual mechanisms—not only leads to substantial discrepancies between simulation outcomes and experimental data for traditional theoretical models (e.g., the Rayleigh–Plesset equation) but also results in key decisions in marine engineering design (e.g., the selection of propeller anti-cavitation erosion measures and anti-cavitation coatings), still depending on trial-and-error experience, without the support of precise theoretical guidance.
Therefore, the accurate decoupling of cavitating impingement mechanisms is not only critical for overcoming the bottleneck in theoretical modeling but also serves as the core foundation for realizing cavitation erosion protection of marine equipment and the precise regulation of cavitation effects [7,22,23]. More specifically, decoupled measurements can provide mechanism-resolved benchmarks for CFD and multiphase cavitation models and can also help erosion prediction to move from indirect empirical inference toward response-specific validation against pressure, wall-shear, and damage metrics.
To address this longstanding bottleneck, mechanism decoupling is treated in this review as an operational framework rather than a purely descriptive concept. In cavitating jet impingement, this framework can be understood through three linked tasks: mechanism identification, namely distinguishing hydrodynamic jet loading, microjet impact, single-bubble shockwaves, and bubble-cloud collective collapse; mechanism attribution, namely linking an observed waveform, image feature, or damage pattern to a physically justified source; and contribution quantification, namely estimating the metric-specific contribution of each mechanism under clearly defined conditions. In this review, the comparison is limited to energy fraction, normalized peak pressure, or a stated damage metric, and these three bases are not treated as interchangeable. This definition does not imply that every mechanism must be completely isolated within a single experiment. Instead, it emphasizes reproducible interpretation based on synchronized measurements, mechanism-specific signatures, and explicit uncertainty awareness. Accordingly, the literature reviewed in this paper is organized around the relationship among mechanism class, measurable signature, diagnostic route, attribution reliability, and remaining uncertainty. For clarity, Table 1 summarizes the decoupling framework and the associated comparison criteria used throughout this review.
For a given experimental condition set, including geometry, stand-off distance or wall distance, cavitation number or driving condition, liquid medium, sensor type, sensor bandwidth, sensor position, sampling rate, target material, and exposure duration, the term dominance is used here in a metric-specific sense rather than as a universal ranking. Energy dominance refers to the fraction of mechanism-resolved energy in the total response, with the experimentally accessible proxy represented, where appropriate, by the time integral of squared pressure over a stated time window, bandwidth, and reference distance. Peak-pressure dominance refers to the normalized maximum pressure measured at the same reference distance and within the same sensor bandwidth. Damage dominance refers to the contribution of a mechanism to a stated material-response metric, such as erosion rate, pit density, pit volume density, mass-loss rate, or incubation-life reduction, under specified material and exposure conditions. Without these conditions, dominance should be understood as qualitative relevance rather than a transferable quantitative hierarchy.
To avoid conflating fundamentally different physical regimes, the discussion below distinguishes three roles in the literature: near-wall single-bubble collapse as a mechanism-level reference case, bubble-cloud cavitation in internal-flow configurations as a collective-regime problem, and pure jet impingement as a non-cavitating engineering reference load.
In this sense, mechanism decoupling does not require the complete physical isolation of every mechanism in a single experiment. Instead, it requires that the interpretation be reproducible, cross-validated, and tied to a clearly defined response metric. The remainder of this paper is organized as follows: Section 2 elucidates the physical basis for mechanism separability; Section 3 reviews the advances in visual, sensing, and processing technologies; Section 4 discusses the current bottlenecks, engineering implications, and future research priorities for achieving precise cavitation regulation; and Section 5 presents the main conclusions of this review.

2. Physical Mechanisms of Cavitating Impingement and the Basis for Its Decouplability

2.1. Core Energy Release Mechanisms and Dominant Forms of Cavitating Impingement

Based on the above motivation, this section first clarifies the core energy release mechanisms of cavitating impingement and summarizes their dominant forms. This mechanism-level description provides a foundation for the multi-source synchronous measurement and feature extraction strategies discussed in the following sections [32].
In the discussion below, the figures are used as analytical anchors rather than as visual illustrations alone and are interpreted together with measurable quantities, such as action duration, spatial reach, cavitation number, stand-off distance, peak pressure, and cumulative vibration response.
The discussion in this section separates three physical regimes that are often cited together but should not be interpreted as interchangeable. Near-wall single-bubble collapse is used here as a mechanism-level reference case for resolving the elementary roles of shockwaves and microjets. Bubble-cloud cavitation in Venturi and cryogenic nozzle flows is treated separately as a collective regime in which shedding mode and collapse synchronization become central. Pure jet impingement is discussed only as a non-cavitating engineering reference load. The following discussion is organized in that order.
The fragmentation effect of cavitating jets can be understood through two coupled pathways: background hydrodynamic jet impingement and cavitation-bubble collapse. At the bubble scale, the latter is expressed mainly through two dominant release modes, namely spherical shockwaves and directional microjets generated by asymmetric collapse [23,29]. These two modes are not mutually exclusive and may coexist within a single collapse event. For this reason, the present review uses observations from ultrasonic and laser-induced single-bubble studies mainly as reference cases because they provide clearer signatures of collapse morphology, jet formation, and shockwave emission than fully developed cavitating jet flows.
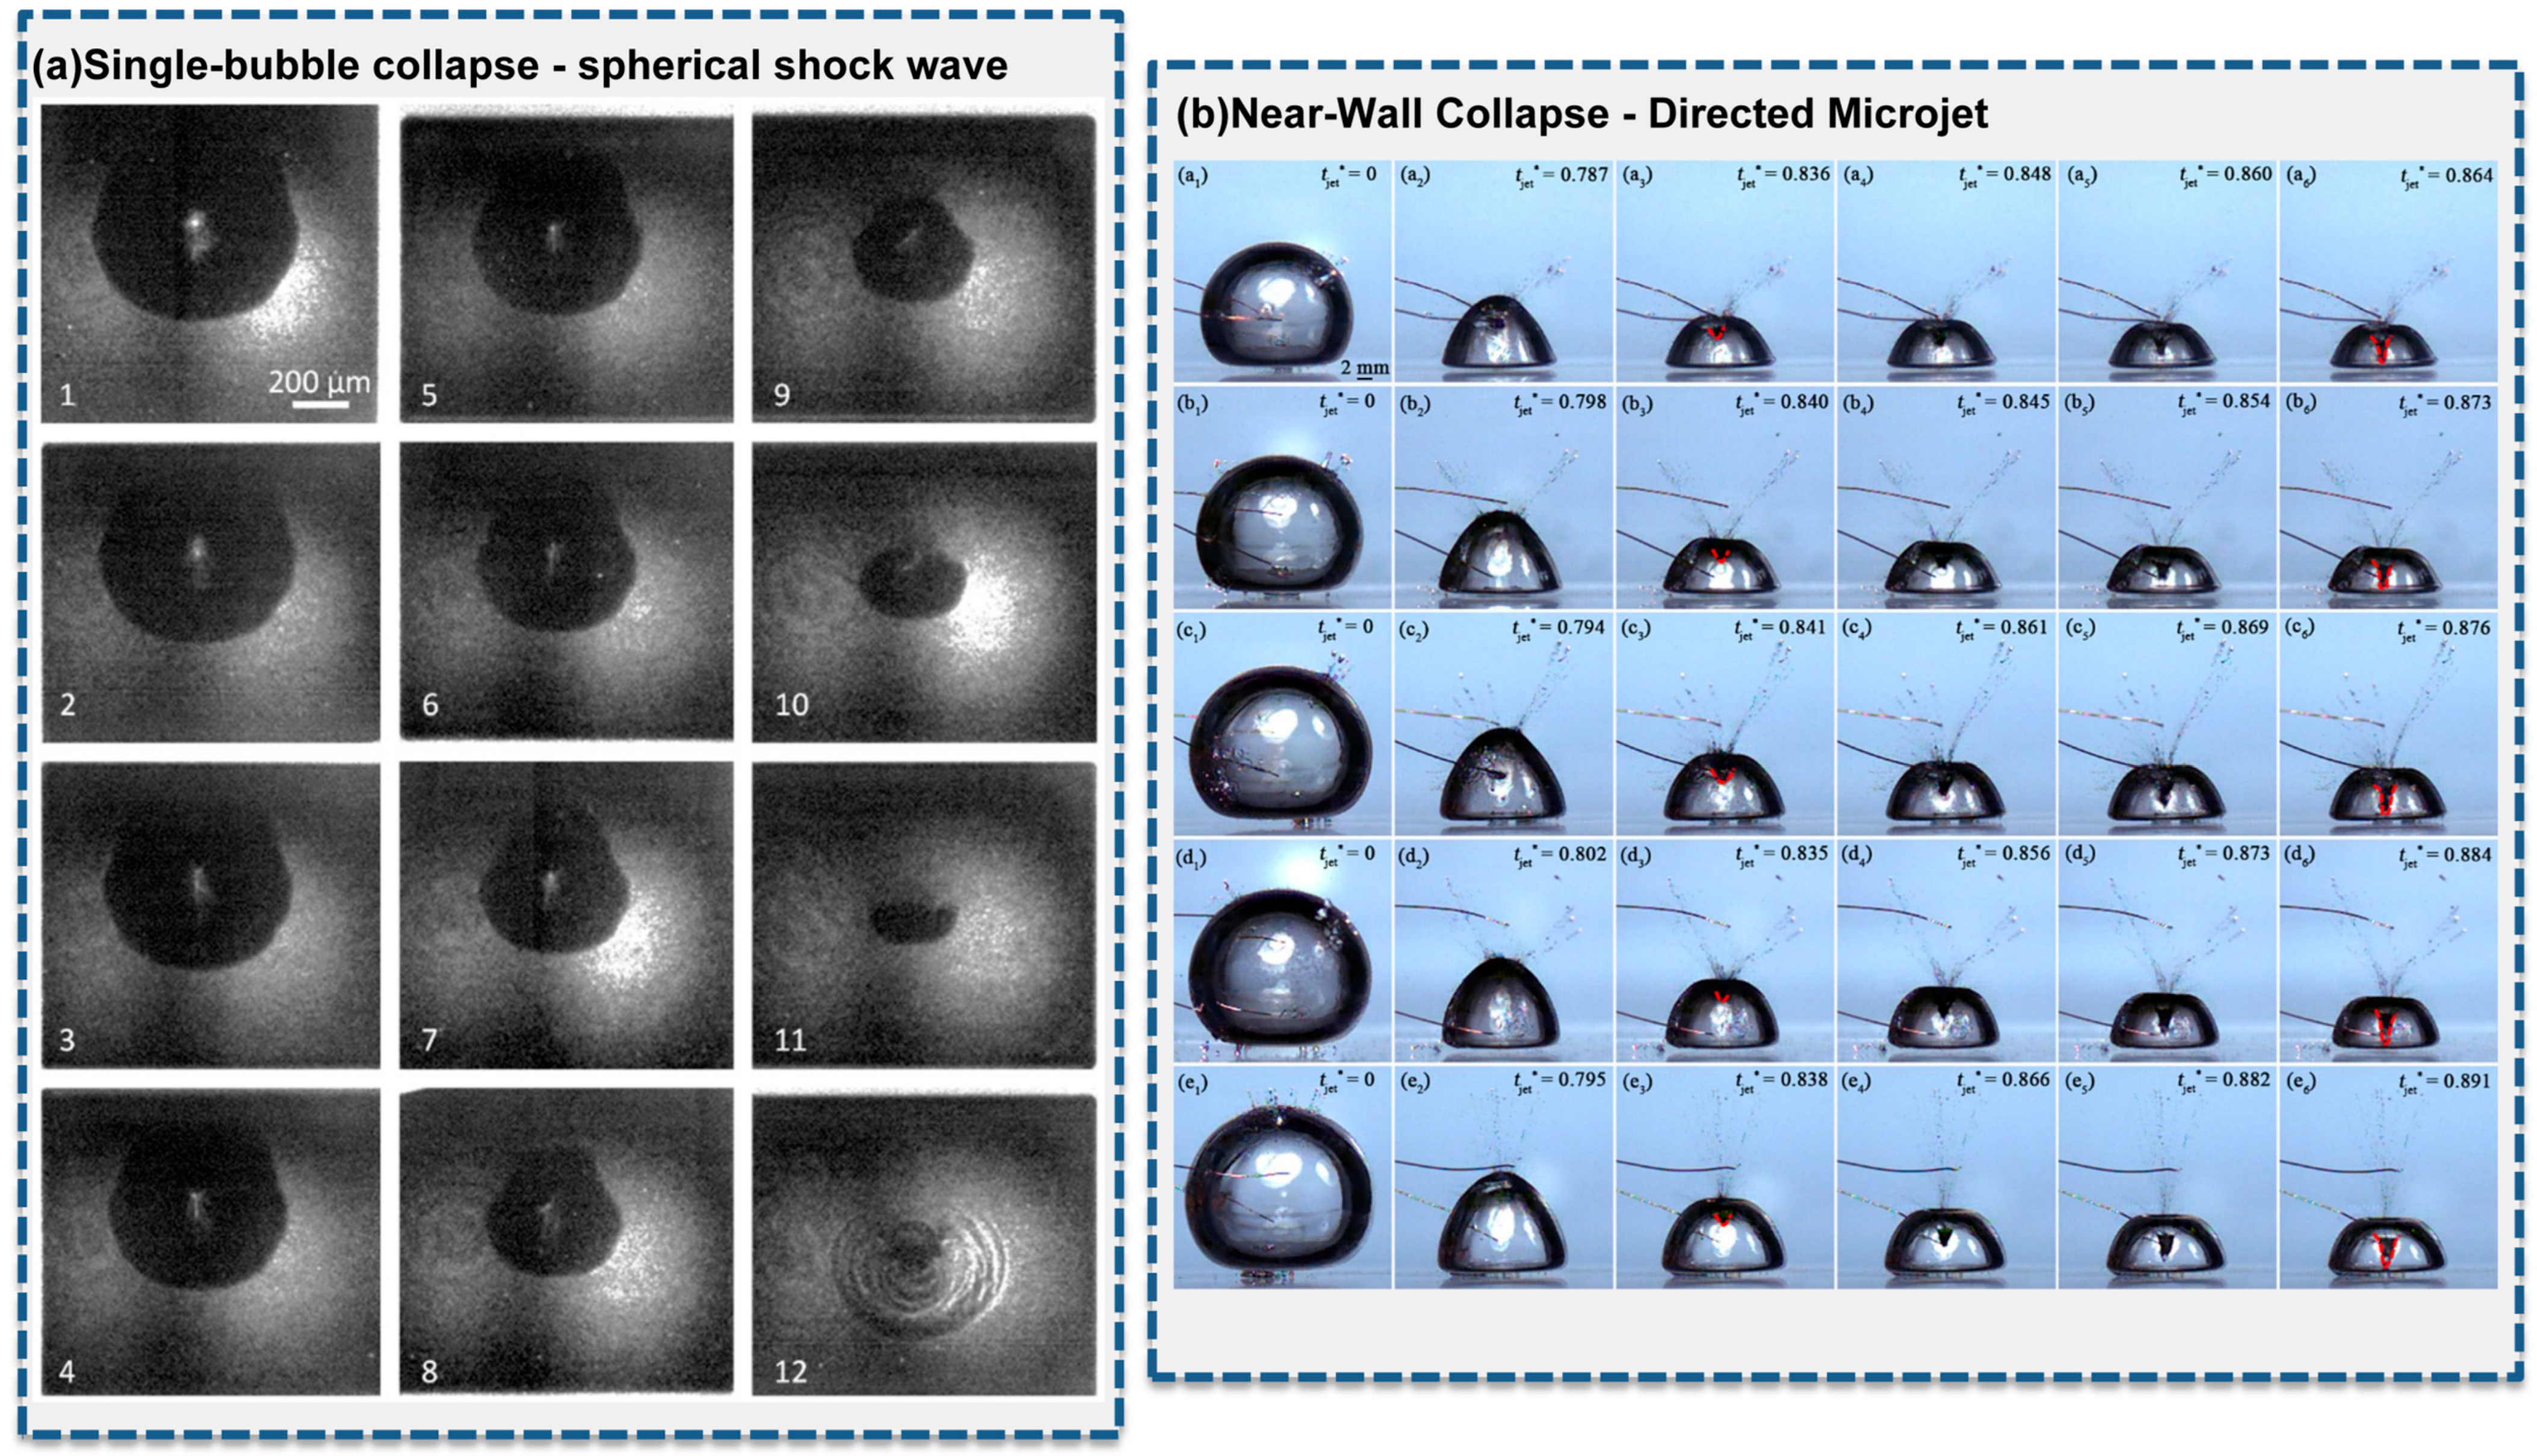
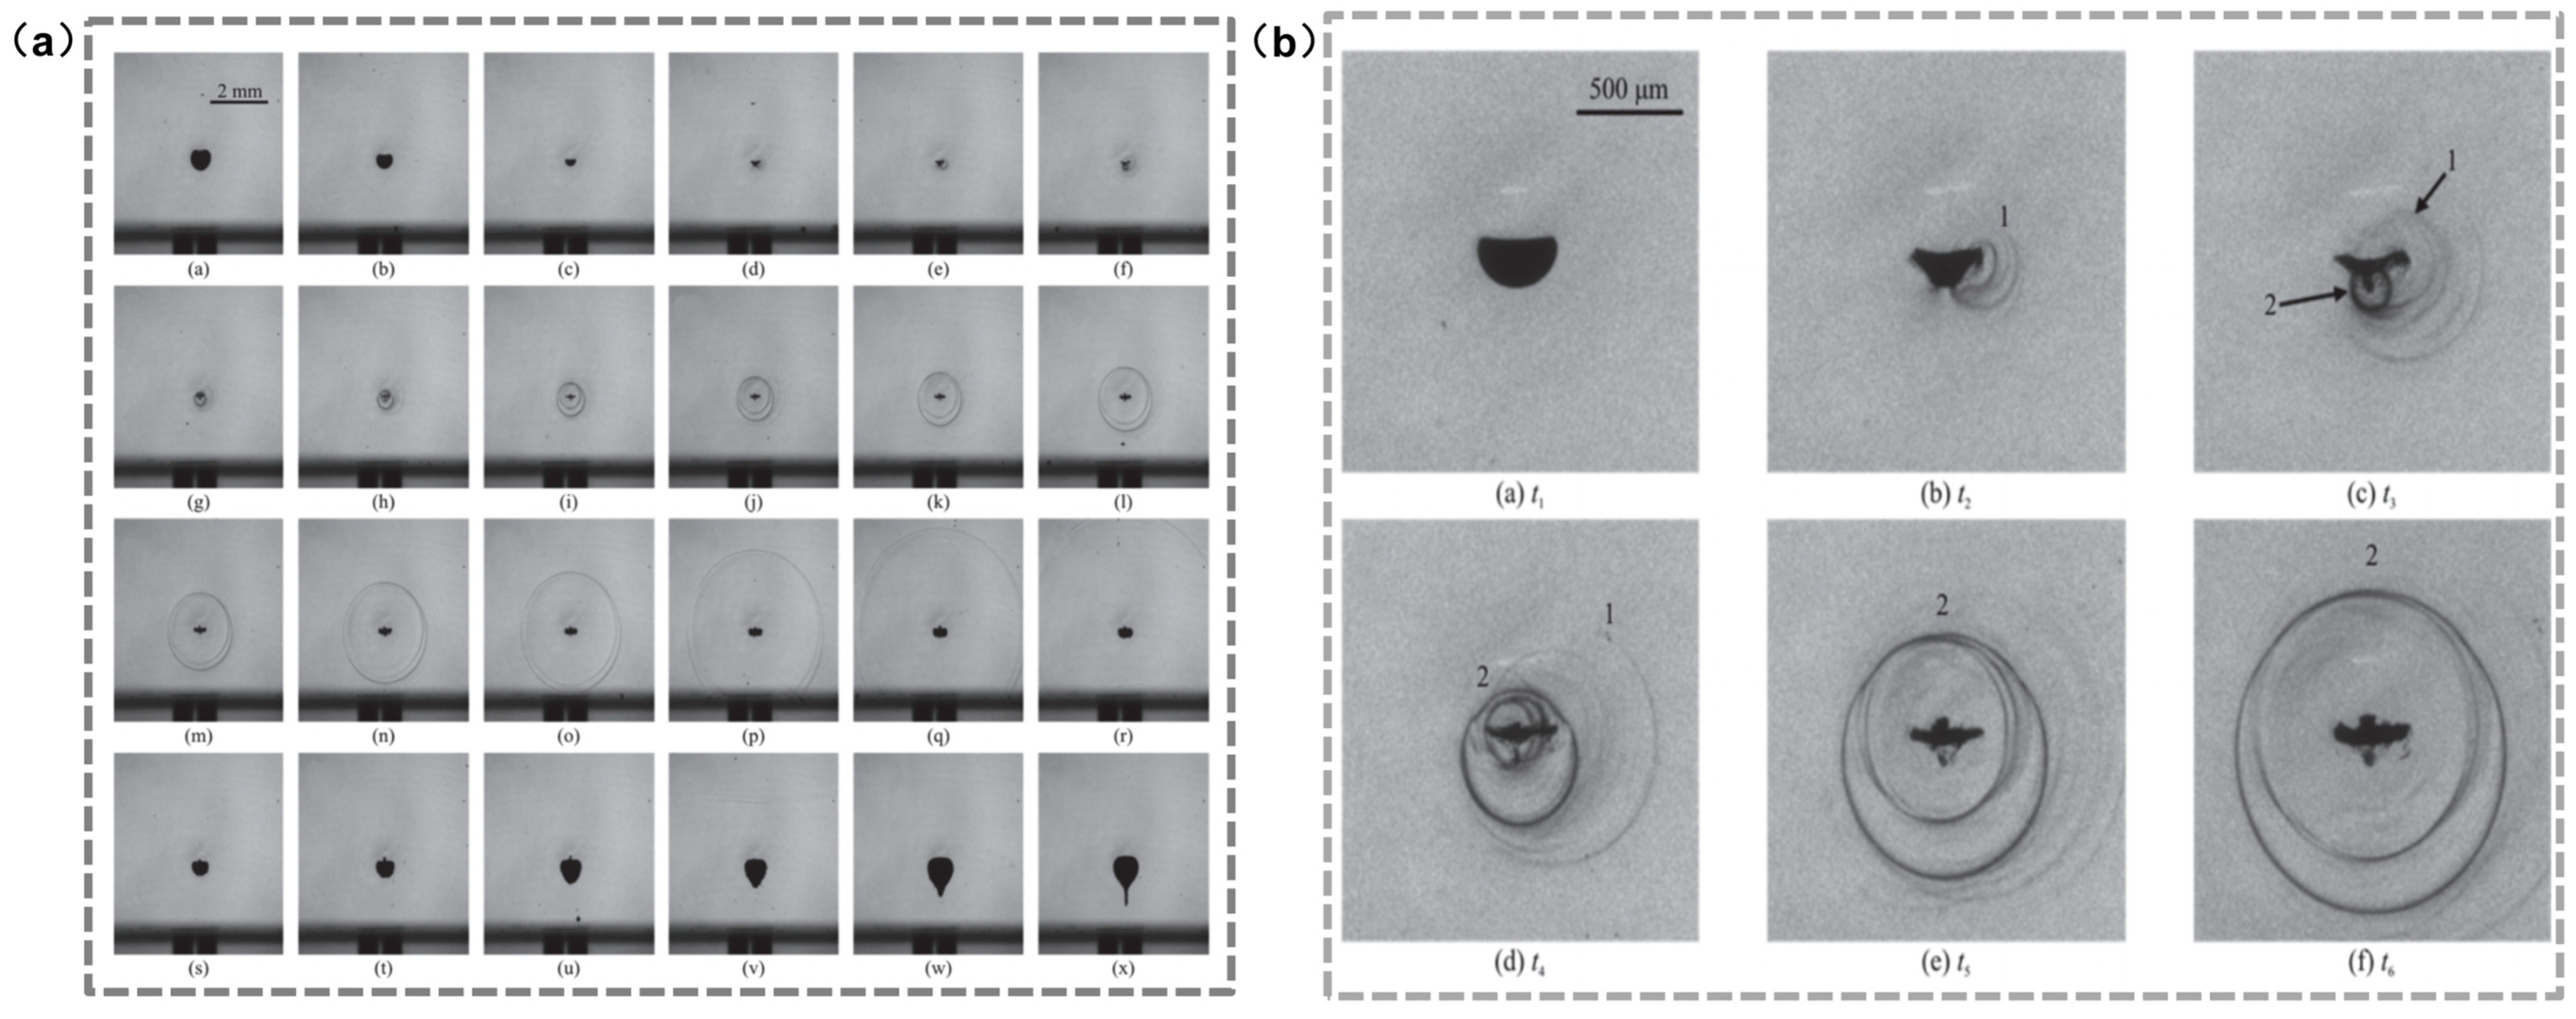
Figure 2 is used here not only to show collapse morphology but also to distinguish two observable signature types. Figure 2a highlights that shockwave emission at collapse may be temporally structured rather than emitted as a single idealized pulse [20]. Figure 2b highlights that near-wall microjet development is configuration-dependent and remains sensitive to ambient-pressure conditions [33].
Microjet formation is promoted by collapse asymmetry induced by boundaries, geometric confinement, and local pressure gradients. When the bubble is sufficiently close to a rigid wall or structural feature, collapse becomes directionally biased and favors jet formation toward the surface; by contrast, more symmetric collapse in less confined conditions releases a larger share of energy through shockwaves. This asymmetry is not governed by wall presence alone. Boundary compliance, wall topology, and imposed motion can all modify jet direction, collapse focusing, and the associated local loading [34,35,36]. Therefore, near-wall microjet response should be understood as a boundary-conditioned mechanism rather than a fixed consequence of cavitation itself.
Liquid properties further reshape the relative importance of shockwaves and microjets by modifying interface deformation, collapse rate, and energy dissipation. Surface tension influences jet focusing and interface stability, whereas viscosity and elasticity attenuate collapse intensity and extend the loading timescale. In this sense, liquid properties do not merely alter the background medium; they directly affect how cavitation energy is partitioned between localized jetting and radiated pressure waves. This is why mechanism comparison across different liquids cannot rely on pressure magnitude alone. In quantitative terms, the transition between shockwave-dominated and microjet-dominated response should not be discussed through pressure magnitude alone but through normalized descriptors that reflect geometry, liquid properties, and operating condition. For near-wall single-bubble collapse, the normalized stand-off distance γ   =   d / R m a x is more informative than absolute wall distance, where d is the initial distance of the bubble center from the wall and R_max is the maximum bubble radius. In the axisymmetric VoF simulations of Zeng et al. (2021) [29] for a rigid boundary, the maximum inward wall shear stress τmn follows the empirical relation τ m n R e 0.35   =   70 γ   +   110 , with τmn expressed in kPa, for 0.5 < γ < 1.4 and 0.01 ≤ μ ≤ 0.1 Pa·s. Here, Re = ρU0Rmax/μ and U0 = (P/ρ)1/2. For water (μ = 10−3 Pa·s), the same study reported τmnRe0.35 = −70γ + 100. This relation is therefore context-specific and should not be interpreted as a universal scaling law. In cryogenic convergent-divergent nozzles, the dominant mechanism shifts from re-entrant jet to condensation shock as σ decreases from 0.497 to 0.386 [37]. Therefore, reported pressure ranges or pulse durations should not be generalized across studies unless σ , γ , liquid properties, geometry, and sensor position are stated together.
Taken together, the above discussion concerns near-wall single-bubble collapse as a mechanism-level reference case in which the relative roles of shockwave radiation and microjet formation can be examined under comparatively well-defined geometric and measurement conditions.
Shockwaves and microjets differ not only in spatiotemporal scale but also in the type of response they generate. Shockwaves propagate as short high-pressure pulses over a broader field, whereas microjets act more locally through concentrated momentum transfer near the wall [5,38,39,40,41,42,43]. Additional factors such as excitation condition, particle environment, daughter-bubble evolution, and cloud interaction further modulate this balance. At the regime scale, the governing role of cavitation number remains especially important: in both Venturi and cryogenic-nozzle studies, the dominant shedding mechanism shifts between re-entrant-flow-controlled and condensation-shock-controlled behavior as σ changes [37,39,44].
Collapse may also be accompanied by sonoluminescence and acoustic radiation, which are useful as auxiliary diagnostic signatures of collapse intensity rather than as primary wall-loading mechanisms [45,46,47].
In near-wall single-bubble conditions, asymmetric collapse can promote greater conversion of collapse energy into microjet kinetic energy and localized wall loading; by contrast, under the energy-partition measurements reported for comparable near-wall configurations, shockwaves may account for a larger share of the released energy, whereas microjets become more relevant to localized high-intensity impingement [48]. Li et al. (2025) [39] revealed the significant influence of corrugated wall surfaces on laser-induced cavitation bubbles through numerical simulations. Surface protrusions can guide bubbles to form peach-shaped structures and induce bilateral contraction processes, altering the direction and velocity distribution of microjets.
We now turn from near-wall single-bubble collapse to bubble-cloud cavitation in internal-flow configurations, where the main issue is no longer elementary jet-versus-shock separation at the single-bubble level but collective shedding mode and collapse synchronization.
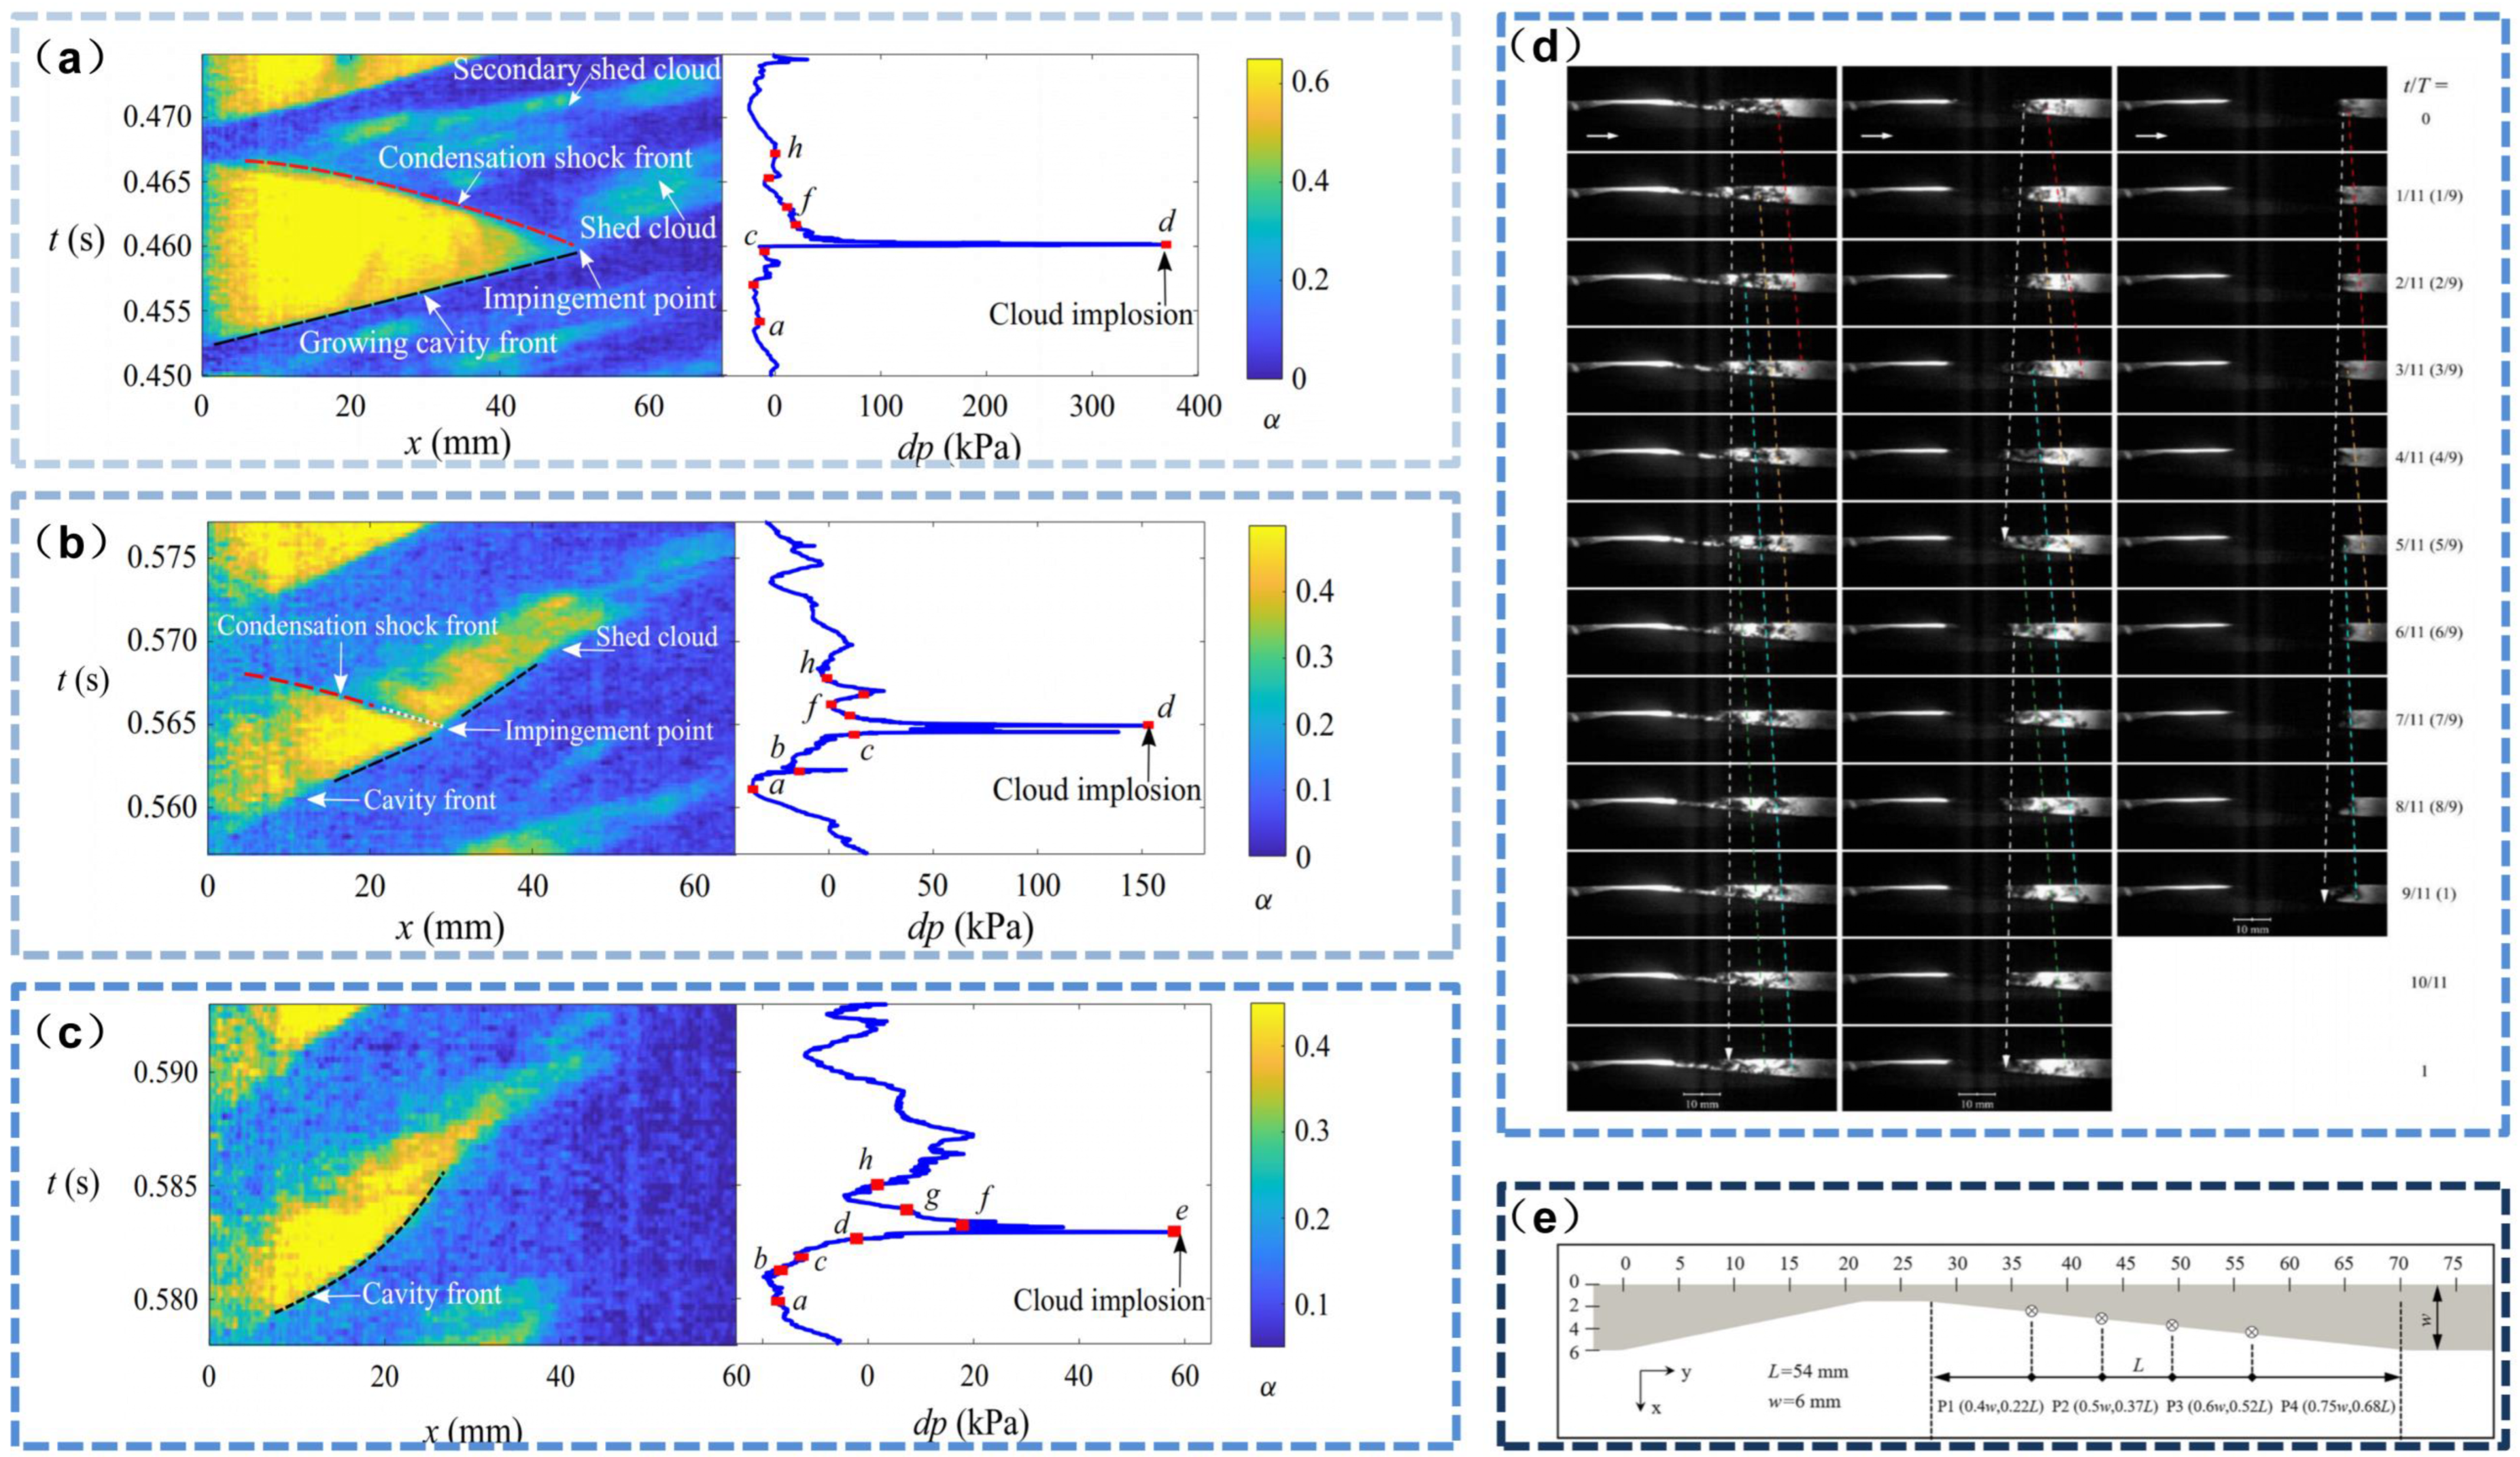
Extensive studies have further confirmed the pivotal influence of σ on the collapse outcome, and the following evidence highlights representative trends. The critical effect of the cavitation number has been verified in multiple studies: In Venturi tube cavitation experiments, a condensation shockwave is the high-speed pressure front generated by the rapid implosion of a vapor cavity as the local liquid condenses back into the liquid phase. In the reported Venturi configuration, the shedding regime shifts with cavitation number: when σ decreases below 0.78, the observed shedding behavior becomes condensation-shock-controlled (Mach number > 1), whereas, when σ increases above 0.84, the collapse process is associated more closely with expansion re-entrant flow.
The regime transition summarized above can be read more explicitly from Figure 3. In panels (a)–(c), the room-temperature Venturi results show that the shedding pathway changes with cavitation number because the X-ray density field and synchronized pressure response capture whether the upstream-moving disturbance develops into a condensation-shock-dominated front or remains associated with re-entrant-flow-controlled detachment [44]. Panels (d) and (e) provide a complementary cryogenic example. In panel (d), the tracked image sequences are consistent with re-entrant-jet-controlled shedding at σ = 0.497, with the upstream jet at the cavity tail promoting detachment and its velocity at the cavity end reported to be about −4 to −5 m/s before decreasing upstream; by contrast, at σ = 0.386, the vapor structure extends much farther downstream, the shed clouds collapse rapidly after detachment, and the resulting pressure rise is more consistent with an upstream-moving condensation shock. Panel (e) is therefore needed as a spatial reference rather than as a simple geometric sketch because it identifies the throat, divergent section, and measurement layout used to interpret where the observed cavity evolution in panel (d) occurs. Together, panels (d) and (e) show more clearly that the cryogenic case is not only morphologically different but also undergoes a transition between re-entrant-jet-controlled and condensation-shock-controlled shedding as σ decreases from 0.497 to 0.386 [37].
Microjets, single-bubble shockwaves, and bubble-cloud collective collapse should therefore be compared as mechanisms with different action range, duration, and response metric, which is exactly why later decoupling analysis in this review is organized around separability rather than around a single fixed hierarchy of mechanism importance.
In contrast to the cavitation-collapse regimes discussed above, pure jet impingement is introduced here only as a non-cavitating engineering reference load. Here, pure jet impingement refers to the mechanical loading generated when a water jet directly impinges on a material surface in the absence of cavitation bubble collapse. Depending on the target material, chemical dissolution may occur concurrently and can be suppressed by using a saturated brine jet to isolate the mechanical contribution. In experiments on low-pressure water jet erosion of salt rock, Zhang et al. (2022) [49] showed that saturated-brine and pure-water jets produced markedly different erosion morphologies under otherwise identical conditions, indicating that jet chemistry can significantly affect the mechanical response of salt rock.
The load history during pure jet impingement typically exhibits two stages, an initial water-hammer spike followed by a lower stagnation-pressure stage. Experimental studies have shown that the load of non-submerged high-velocity jets can be divided into a water-hammer pressure stage and a stagnation-pressure stage. The former occurs when the jet first contacts the material surface and generates an instantaneous peak pressure, while the latter maintains a relatively low pressure after the formation of stable impingement. Comparative experimental data from Yuan et al. (2025) [50] show that the peak water-hammer pressure of pure jet impingement is much higher than that of cavitating jet impingement, whereas the stagnation pressure is significantly lower than that of cavitating jet impingement.
Taken together, the literature discussed above serves three different interpretive purposes. Near-wall single-bubble collapse provides a mechanism-level reference for resolving shockwave and microjet loading under comparatively controlled conditions. Venturi and cryogenic nozzle studies probe bubble-cloud cavitation as a collective regime in which shedding mode, synchronization, and collapse propagation become central. Pure jet impingement, by contrast, is included only as a non-cavitating engineering reference for hydrodynamic loading history. These regimes do not probe the same instability pathway or loading history and should therefore not be merged into a single hierarchy of mechanism importance.
A further difficulty is that the literature often compares metric-specific mechanism dominance across fundamentally different experimental contexts. Near-wall single-bubble collapse, Venturi cloud cavitation, cryogenic nozzle flows, and pure jet impingement do not probe the same instability pathway or loading history [23,37,44,50]. As a result, the apparent dominance of shockwaves, microjets, or re-entrant-flow-driven collapse may partly reflect differences in response metric, test geometry, medium, sensor position, and observation scale rather than a universal physical hierarchy. This suggests that mechanism comparison should be framed more carefully, with explicit attention to configuration dependence and normalization conditions.

2.2. Basis for the Decouplability of Physical Mechanisms of Cavitating Impingement

2.2.1. Spatiotemporal Scale Differences for Separability

This subsection first considers separability within near-wall single-bubble collapse, where microjets and shockwaves can coexist but remain distinguishable in action range and duration. Bubble-cloud collapse is then introduced as a separate collective regime, not as a direct extension of the single-bubble case but as a contrast in temporal window, spatial footprint, and cumulative response. Microjets focus energy intensely on an ultra-small region of the target wall surface, resulting in localized high-intensity impingement yet with a confined influence scope. Shockwaves, by contrast, radiate outward as spherical wavefronts, covering a broader spatial range while their intensity at any single point diminishes sharply as they propagate.
The shockwave generated by single-bubble collapse is a nanosecond-scale transient pulse event. In this review, collective collapse refers to the near-simultaneous implosion of multiple interacting bubbles within a cluster or cloud such that their pressure waves overlap in both time and space. By contrast, the collective collapse of multi-bubble clusters belongs to a different regime of cumulative loading, characterized by an extended time scale and a more extensive spatial scope. Tinguely et al. (2022) [20] captured the law of multiple shockwave radiations at the final stage of single-bubble collapse via ultra-high-speed shadowgraphy. This indicates that bubble morphology and collapse synchrony directly regulate the shockwave action duration: the more asymmetric the shape and the more dispersed the collapse, the longer the action duration. In terms of intensity and cumulative effects, the differences between single-bubble and multi-bubble mechanisms are more significant. Priyadarshi et al. (2021) [51] compared laser-induced single-bubble cavitation with ultrasonic bubble cloud cavitation. In the single-bubble tests, the collapse produced shockwave peaks of 20 to 40 MPa. They captured these peaks with a Precision Acoustics fiber-optic hydrophone featuring a 125 μm tip, calibrated from 1 to 30 MHz and sampled at 500 MS per second, placed about 3 to 4 mm from the bubble centre. The cloud experiments followed a similarly tight near-field measurement geometry. The crystal was positioned 3 to 4 mm below the horn, while pressure was sampled within 0.2 mm of the crystal tip at a point about 3 mm downstream on the symmetry axis and 4 mm off axis. With that setup in mind, the 20 to 40 MPa range reads as a near-field snapshot rather than a generic loading level. When collapse events occur inside a multi-bubble cloud, the shock from a single event is far milder, around 0.4 to 0.5 MPa under the same near-tip sampling strategy using a Precision Acoustics fiber-optic hydrophone. This number looks small on paper, yet periodic repetition can still drive low cycle fatigue in materials. Moreover, the reported far-field peak pressure for the overall collapse of a multi-bubble cloud is around 1.6 MPa. It attenuates rapidly, but the affected region is broader and the cumulative vibration and noise become more apparent [52,53]. Here, near-field pressure refers to peaks measured within a few millimeters of the collapse event under tightly localized sensing geometry, whereas far-field pressure refers to the attenuated response measured after spatial propagation over a broader region.
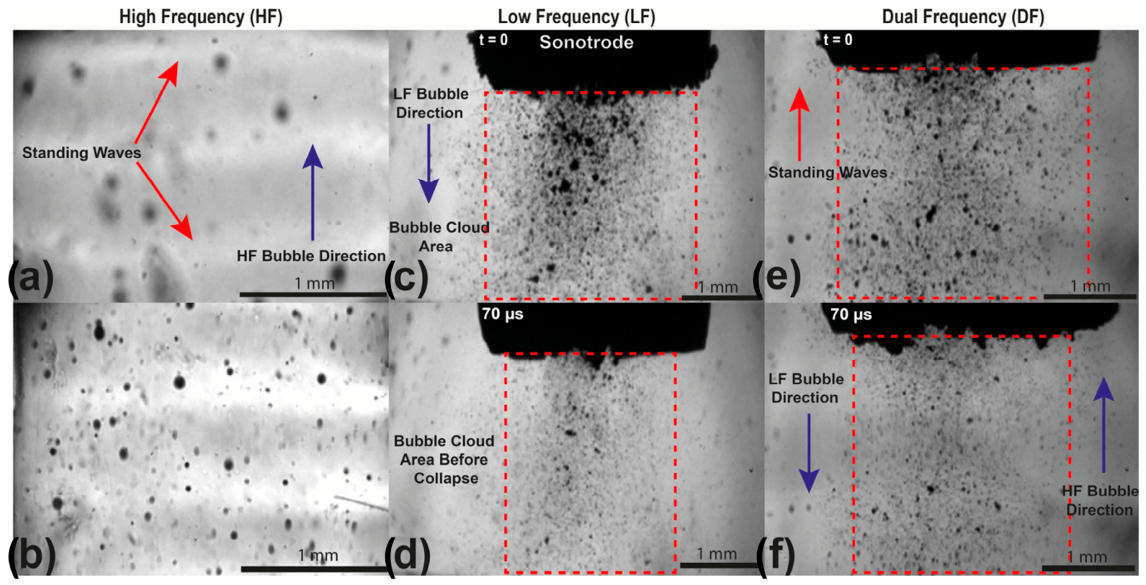
Figure 4 is not included merely to show cluster shape. Its analytical value is that the HF, LF, and DF conditions correspond to different bubble-cluster scale, density, and collapse synchronization, which in turn alter the temporal window and spatial footprint of collective loading [54]. This morphological variation helps to explain why bubble-cloud response should not be evaluated by a single local peak alone. Pressure measurements from single-bubble and bubble-cloud cavitation show that a single bubble may generate near-field peaks of 20–40 MPa, whereas a single event inside a cloud is much weaker, yet the overall cloud collapse can still yield a broader cumulative response and a far-field peak of about 1.6 MPa [51]. Figure 4 therefore supports a response-based interpretation in which cloud cavitation is compared through spatial reach, action duration, and cumulative vibration or fatigue relevance rather than through peak value alone [55,56,57,58]. In this sense, local response metrics refer to quantities such as wall shear, pit initiation, or a single-point peak pressure, whereas global response metrics refer to broader cumulative measures, such as affected area, broadband vibration, or fatigue-related response.
To conclude, examining the energy dissipation pathways of different mechanisms and their dominant effects not only lays the groundwork for the theoretical modeling of cavitation phenomena but also acts as a critical reference for guiding engineering practice. Only by identifying which mechanism dominates a specified response metric, such as energy fraction, normalized peak pressure, pit density, erosion rate, or mass-loss rate, can process parameters be optimized in a targeted and reproducible manner [25,59]. Just as differences in spatial scale help to separate effects, differences in the time-domain behavior of cavitation-induced loads offer another basis for isolating individual mechanisms.

2.2.2. Temporal Variation Characteristics of Transient Loads

Waveform characteristics provide a second basis for mechanism decoupling because different mechanisms redistribute loading in distinct temporal forms. Asymmetric single-bubble collapse can emit multiple nanosecond-scale shock pulses rather than one idealized spike [20]. Microjet-associated loading, by contrast, tends to reduce peak magnitude and prolong the effective action window through energy dispersion near the wall. Bubble-cloud collapse differs again by producing multi-modal or quasi-periodic fluctuations; although the peak of a single pulse may be modest, repeated cycles can still drive cumulative damage and fatigue-related response [51,55,56]. Pure jet impingement is not treated here as another cavitation-collapse regime. It is mentioned only as a non-cavitating engineering reference for comparison with the high-initial-peak lower-sustained-load history reported in Ref. [50]. Taken together, temporal signatures are informative only when interpreted together with configuration and response metric, which is why the comparison below focuses on dominance criteria rather than on raw waveform description alone [60,61,62].
Although the main loading mechanisms in cavitating impingement are well established, the literature does not support a single universal hierarchy of mechanism importance. In this review, energy dominance refers to the mechanism-resolved energy fraction under a stated normalization basis; peak-pressure dominance refers to the normalized maximum pressure measured at a specified reference distance and within a stated sensor bandwidth; and damage dominance refers to the contribution of a mechanism to a stated material-response metric, such as erosion rate, pit density, pit volume density, mass-loss rate, or incubation-life reduction, under specified material and exposure conditions. In near-wall energy-partition measurements, shockwaves often account for the larger share of collapse energy [23], whereas, under suitable stand-off distance and boundary conditions, microjets may become more important for localized wall shear or pit initiation [29,30]. Bubble-cloud collapse may become more relevant when the comparison is based on cumulative vibration, broadband response, or fatigue-related effects rather than on a single local peak [31,51]. These conclusions are therefore not contradictory because they are tied to different response variables and should be compared only under matched geometry, medium, sensor location, and bandwidth. For this reason, statements about mechanism dominance in this review should be read as condition-dependent rather than universal, unless the response metric and configuration are explicitly matched. Accordingly, local response metrics should not be conflated with global or cumulative response metrics when interpreting mechanism importance.
A compact quantitative comparison further clarifies why these criteria should not be conflated. Near-wall energy-partition measurements indicate that collapse shockwaves can account for approximately 70–80% of the bubble energy [23]. By contrast, pressure-based comparisons show that single-bubble collapse may generate near-field shock peaks of 20–40 MPa, whereas the overall collapse of a bubble cloud is associated with a broader but much lower far-field peak of about 1.6 MPa [51]. At the system scale, cavitation cloud activity is often reflected not by a single extreme pressure spike but by broadband or high-frequency vibration, with 4–10 kHz reported as a representative cavitation-induced band in a centrifugal pump under part-load operation [31]. These data show that dominance is meaningful only when both the response metric and the associated measurement conditions are stated explicitly, including, at minimum, reference distance, liquid medium, sensor type, sensor bandwidth, and, for damage metrics, target material and exposure duration.
On this basis, a decoupling result should be regarded as convincing only when three conditions are met. First, the mechanisms under comparison must be distinguishable in at least one relevant domain, such as time, frequency, space, morphology, or damage response. Second, the claimed attribution should be supported by at least two mutually consistent observables rather than by a single signal alone. Third, the reported contribution should be tied to an explicit metric, such as energy fraction, normalized peak pressure at a stated reference distance, wall-shear concentration, erosion rate, pit density, or cumulative vibration effect, because different studies do not rank mechanism importance on the same basis. If these conditions are not satisfied, the result is better interpreted as partial attribution rather than complete decoupling. For clearer cross-study comparison, Table 2 summarizes representative quantitative results together with the normalized descriptors and response metrics on which the reported mechanism dominance is based.

3. Advances in Cavitation Impact Measurement Technologies for Mechanism Decoupling

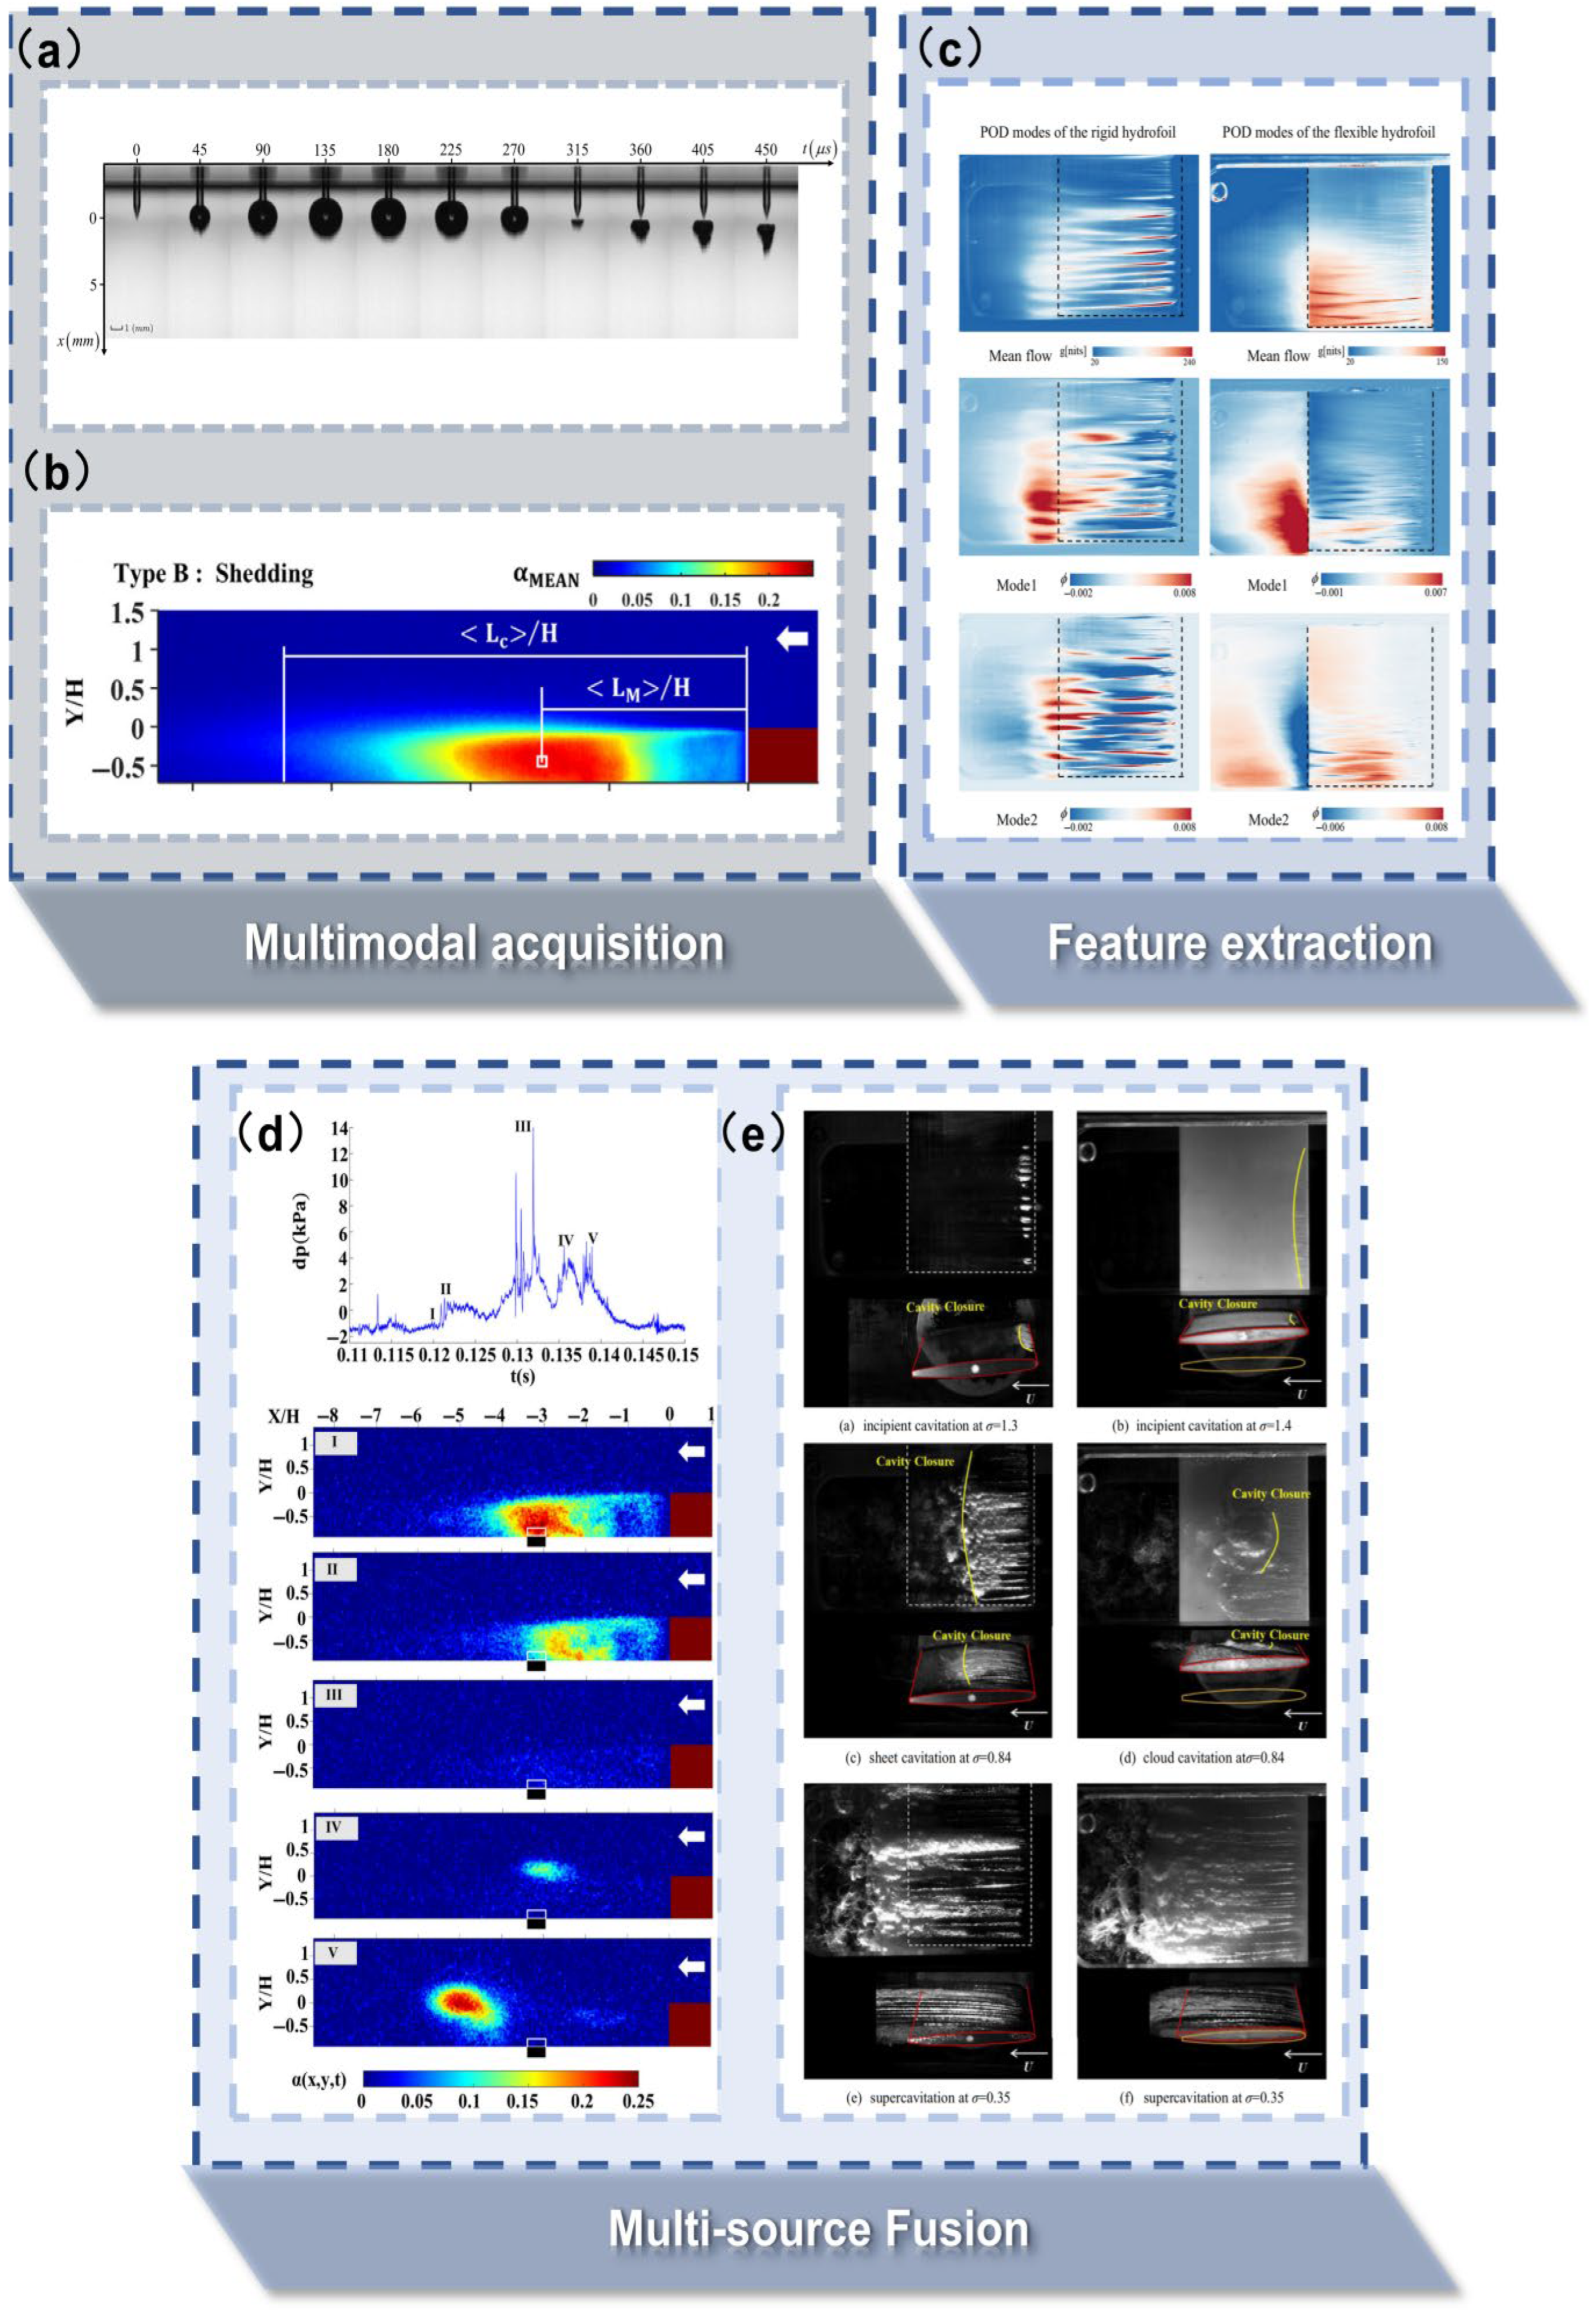
This chapter provides a review of the experimental observation and data analysis technologies utilized for the physical mechanism decoupling of cavitation impact in recent years. Encompassed within these technologies are high-speed optical visualization imaging, multi-sensor spatiotemporal synchronous measurement, and emerging signal processing and image analysis methodologies. The core objective is to elaborate on how these technical approaches extract mechanism-specific diagnostic signatures corresponding to distinct cavitation mechanisms and realize multi-source information fusion. In this paper, mechanism-specific signatures are reproducible time–frequency and spatial patterns in multi-source measurements that uniquely indicate the active cavitation mechanism.

3.1. Advances in Visual Measurement Technologies

3.1.1. High-Speed Optical Imaging Technology

By capturing the transient morphological evolution of cavitation processes, high-speed optical imaging provides direct visual evidence of cavitation morphology and microjet dynamics, and, when combined with schlieren-, BOS-, X-ray-, or pressure-based diagnostics, can help to identify shockwave-related events and multi-bubble collective collapse [63]. This technique’s outstanding temporal and spatial resolution enables intuitive visualization of cavitation bubble dynamics, and it can be synchronized with other measurement approaches (such as pressure transducers and acoustic emission sensors) to correlate different signals in real time. Such integration facilitates mechanism decoupling analysis and quantitative cross-validation of distinct cavitation effects.
With nanosecond-level temporal resolution and micrometer-level spatial resolution, high-speed imaging can clearly capture even the most rapid cavitation phenomena. For example, an ultra-high-speed shadowgraphy system captured collapse morphology together with optical signatures associated with annular-collapse and jet-induced shockwave generation from a bubble imploding near a rigid porous wall, as shown in Figure 5, supporting the interpretation that microjets and shockwaves can interact within a single event. These capabilities highlight the strength of high-speed optical imaging in diagnosing and interrogating transient cavitation events.
More importantly, Figure 5 separates one collapse event into identifiable sub-events. The streak images distinguish jet impact, annular collapse, and subsequent shockwave emission within a common near-wall configuration, which is why this geometry is especially suitable for synchronized pressure validation. Figure 5 should be read as a morphology-to-measurement bridge.
However, high-speed optical imaging is not without limitations. First, it is generally limited to transparent media and cannot effectively be applied in opaque or highly light-scattering environments (e.g., molten metals or cavitation clouds with high gas content), which necessitates using alternative imaging modalities, such as synchrotron X-ray imaging, for those cases [44]. Second, conventional high-speed imaging yields only two-dimensional projections and thus loses three-dimensional flow information (for instance, the full depth-wise structure of a bubble cluster collapse) unless multi-view or tomographic imaging techniques are employed. Third, optical imaging alone provides only qualitative morphological insight and cannot directly measure impact forces or pressures, so it must be combined with techniques such as piezoelectric pressure sensing or acoustic emission monitoring to quantify load intensity. In practice, researchers often synchronize high-speed camera footage with pressure sensor signals (e.g., using PVDF transducers) to accurately correlate bubble-collapse events with pressure pulse peaks, creating a two-way verification system that mitigates the limitations of either technique alone. At the review level, the main uncertainty in such synchronized measurements usually arises from timing synchronization, sensor placement, and finite sensor bandwidth, while repeatability is often limited by collapse-to-collapse variability.
Despite these limitations, high-speed optical imaging has been extensively applied in cavitation research, yielding critical insights into key mechanisms. Notably, it provides a unique window into the dynamics of cavitation microjets. High-speed visualization—especially when coupled with particle image velocimetry (PIV)—allows quantitative characterization of microjet formation and motion. For example, Yu et al. (2025) [64] showed that laser-induced cavitation bubble jets exhibit self-similar turbulent expansion in the far field, with maximum radial expansion rates and entrainment coefficients significantly exceeding those of ordinary continuous jets. Using ultra-high-speed photography, Morton et al. (2021) [65] recorded collapse-driven liquid microjets with velocities up to 80 m/s, supporting the view that such jets can be an important contributor to highly localized material damage under the reported near-surface experimental conditions; they obtained this jet speed in laser-induced bubble tests near a graphite surface, with the bubble placed 0.72 to 1.5 mm from the sample. Pressure was recorded by a Precision Acoustics fiber-optic hydrophone aligned with a Hielscher UP200S 24 kHz transducer and positioned 1.2 or 2.5 mm from the horn, using a calibrated bandwidth from 1 to 30 MHz. Furthermore, energy partition measurements indicate that approximately 20–30% of a cavitation bubble’s collapse energy is converted into microjet kinetic energy (with the remainder radiated via shockwaves) based on high-speed imaging of bubbles collapsing near porous walls [23]. These quantitative findings provide an experimental foundation for developing and validating microjet dynamic models.
When combined with schlieren, BOS, or synchronized hydrophone measurements, high-speed optical methods have also been important for resolving shockwave-related phenomena in cavitation. In power ultrasonic fields, Khavari et al. (2021) [8] synchronously combined high-speed photography with a broadband fiber-optic hydrophone to investigate shockwave emissions. They identified distinct resonance peaks around 3 MHz in the shockwave spectrum for the first time and observed that the acoustic signals were highly consistent with the visual cavitation events. Non-intrusive optical methods, such as background-oriented schlieren (BOS), further enable quantitative analysis of shockwaves: Yamamoto et al. (2022) [66] used a high-resolution BOS technique to capture an underwater shock front only 90 μm thick in a microchannel, validating theoretical predictions. Their setup used a square microtube with a 500 μm inner width and an image scale near 0.68 μm per pixel, with shocks driven by a 6 ns 532 nm Nd:YAG pulse.
High-speed schlieren imaging combined with spatial pressure mapping has also revealed that cavitation bubble clouds can dramatically attenuate shockwaves. Experiments showed that a dense cloud of bubbles causes far-field shock pressure to drop by about 97–98% within only a few millimeters [8]. Furthermore, high-speed video has captured shockwave “stratification” effects during asymmetric bubble collapses near particles: in such cases, separate water-hammer and implosion shockwaves form with a slight temporal delay between them [41]. Additionally, in shockwave lithotripsy, the synchronization of high-speed cameras with ultrafast acoustic emission sensors has enabled microsecond-level discrimination of microjet impacts versus shockwave radiation events [27], underscoring the value of multi-modal high-speed diagnostics. By integrating high-speed optical observations with acoustic measurements and analytical models (e.g., Rankine–Hugoniot relations), researchers can spatially localize shockwave origins and quantify their strength, thereby distinguishing the contributions of different cavitation mechanisms.
High-speed optical imaging has revealed the complex process of collective collapse in cavitation bubble clouds by capturing the spatiotemporal evolution of bubble clusters and applying advanced image analysis; this technique quantifies bubble-cloud dynamics and their interaction with pressure fields. For instance, in a spark-induced cavitation experiment, high-speed cameras recorded the formation and collapse of bubble clouds, and a Gaussian mixture model was used to extract the probability density distribution of dense bubbles. The resulting measurements delineated the extent of the bubble cloud and correlated it with reconstructed pressure maps, confirming that cavitation activity concentrates in low-pressure regions [27]. High-speed imaging has also revealed that, when bubbles collapse collectively, their interactions produce significantly stronger impacts than isolated collapses. Closely spaced bubbles of differing sizes collapsing in unison generate pressure wave fronts with nonlinear superposition, yielding impact loads much higher than those from a single bubble or even from multiple bubbles of equal size. This synergistic intensification effect was verified by synchronizing high-speed video with PVDF pressure sensor data, which showed pronounced pressure spikes attributable to collective collapses [67]. These examples demonstrate how high-speed optical imaging captures complex multi-bubble phenomena and deepens our understanding of cooperative cavitation mechanisms. To complement these optical observations, particle-based velocimetry techniques provide quantitative velocity-field insights under cavitating flow conditions.

3.1.2. Particle Dynamics Analysis and Particle Image Velocimetry Technologies

Particle Dynamics Analysis (PDA) and particle image velocimetry (PIV) are flow diagnostic techniques that use tracer particles or even cavitation bubbles as markers, tracking their motion with pulsed lasers and high-speed cameras to directly obtain quantitative velocity-field distributions and turbulent flow characteristics. These methods provide critical experimental data to finely characterize cavitation flow structures, quantify microjet dynamic behavior, and reveal the inherent correlations between flow-field evolution and transient impact events. The core value of PIV/PDA, therefore, lies in establishing a quantitative bridge between macroscopic cavitation phenomena and the microscopic flow-field structures underlying them.
However, despite their ability to map cavitating flow velocity fields and even show how liquid properties influence these flows, PIV/PDA techniques have notable limitations: they cannot directly discern which specific cavitation mechanism is responsible for an observed flow pattern. For example, a region of high-speed flow captured by PIV cannot be conclusively identified as a microjet versus an ordinary jet based on velocity data alone.
This limitation is more consequential than it may first appear. In many studies, PIV results are interpreted as indirect evidence of mechanism evolution, yet velocity-field information alone rarely provides a unique basis for mechanism attribution. Similar flow structures may arise from different collapse drivers, and the inferred mechanism often depends on simultaneous imaging or pressure evidence. Therefore, PIV is highly valuable for quantifying flow response but much less decisive when used alone to identify the causal source of impact loading.
This limitation is closely related to identifiability. If two mechanisms produce flow or signal features that become indistinguishable within the available sensor bandwidth, field of view, or synchronization accuracy, then the experiment cannot support a unique mechanism assignment. In such cases, only grouped attribution or conditional interpretation should be claimed. For this reason, uncertainty in decoupling does not arise only from collapse complexity itself but also from the sensing configuration and the interpretation route. In practical terms, uncertainty should be discussed with reference to synchronization error, bandwidth limitation, sensor location, preprocessing choice, and repeatability; where the cited studies do not report a single comparable error bar, these factors should be understood as the main practical bounds on quantitative interpretation. A decoupling result is methodologically stronger when the mechanism label, the contribution estimate, and the main uncertainty sources are reported together.
Researchers address this shortcoming by complementing PIV with other methods—for instance, synchronizing PIV with high-speed optical imaging to distinguish flow structures based on bubble morphology and applying advanced signal processing to link velocity fluctuations with characteristic pressure signal frequencies—thereby inferring the underlying mechanism. Second, in flows with dense bubble clouds, tracer particles can be obscured or imaged poorly, which necessitates using supplemental techniques like phase Doppler interferometry or advanced image-denoising algorithms to maintain measurement accuracy. With this measurement logic in mind, it is helpful to look at a few representative studies where PIV turns a visually complex cavitating scene into quantitative flow metrics that can actually be compared across cases.
Yu et al. (2025) [64] used 2D PIV to analyze laser-induced cavitation bubble jets. The PIV data (mean velocity fields and Reynolds stresses) confirmed that the jet’s velocity profile was self-similar and enabled calculation of the jet’s effective turbulent viscosity and entrainment coefficient. Subsequent analyses have revealed that the radial expansion rate (Sr) of bubble-induced jets is approximately 0.12, with an entrainment coefficient (α) of around 0.086. Furthermore, their maximum expansion rate exceeds that of continuous turbulent jets by 20%, while the entrainment coefficient is enhanced by 9%. This demonstrates that these transient microjets, driven by rapid energy release, have superior turbulent mixing and transport capabilities. Such quantitative findings provide a robust foundation for evaluating the intensity and scope of jet impingement effects.
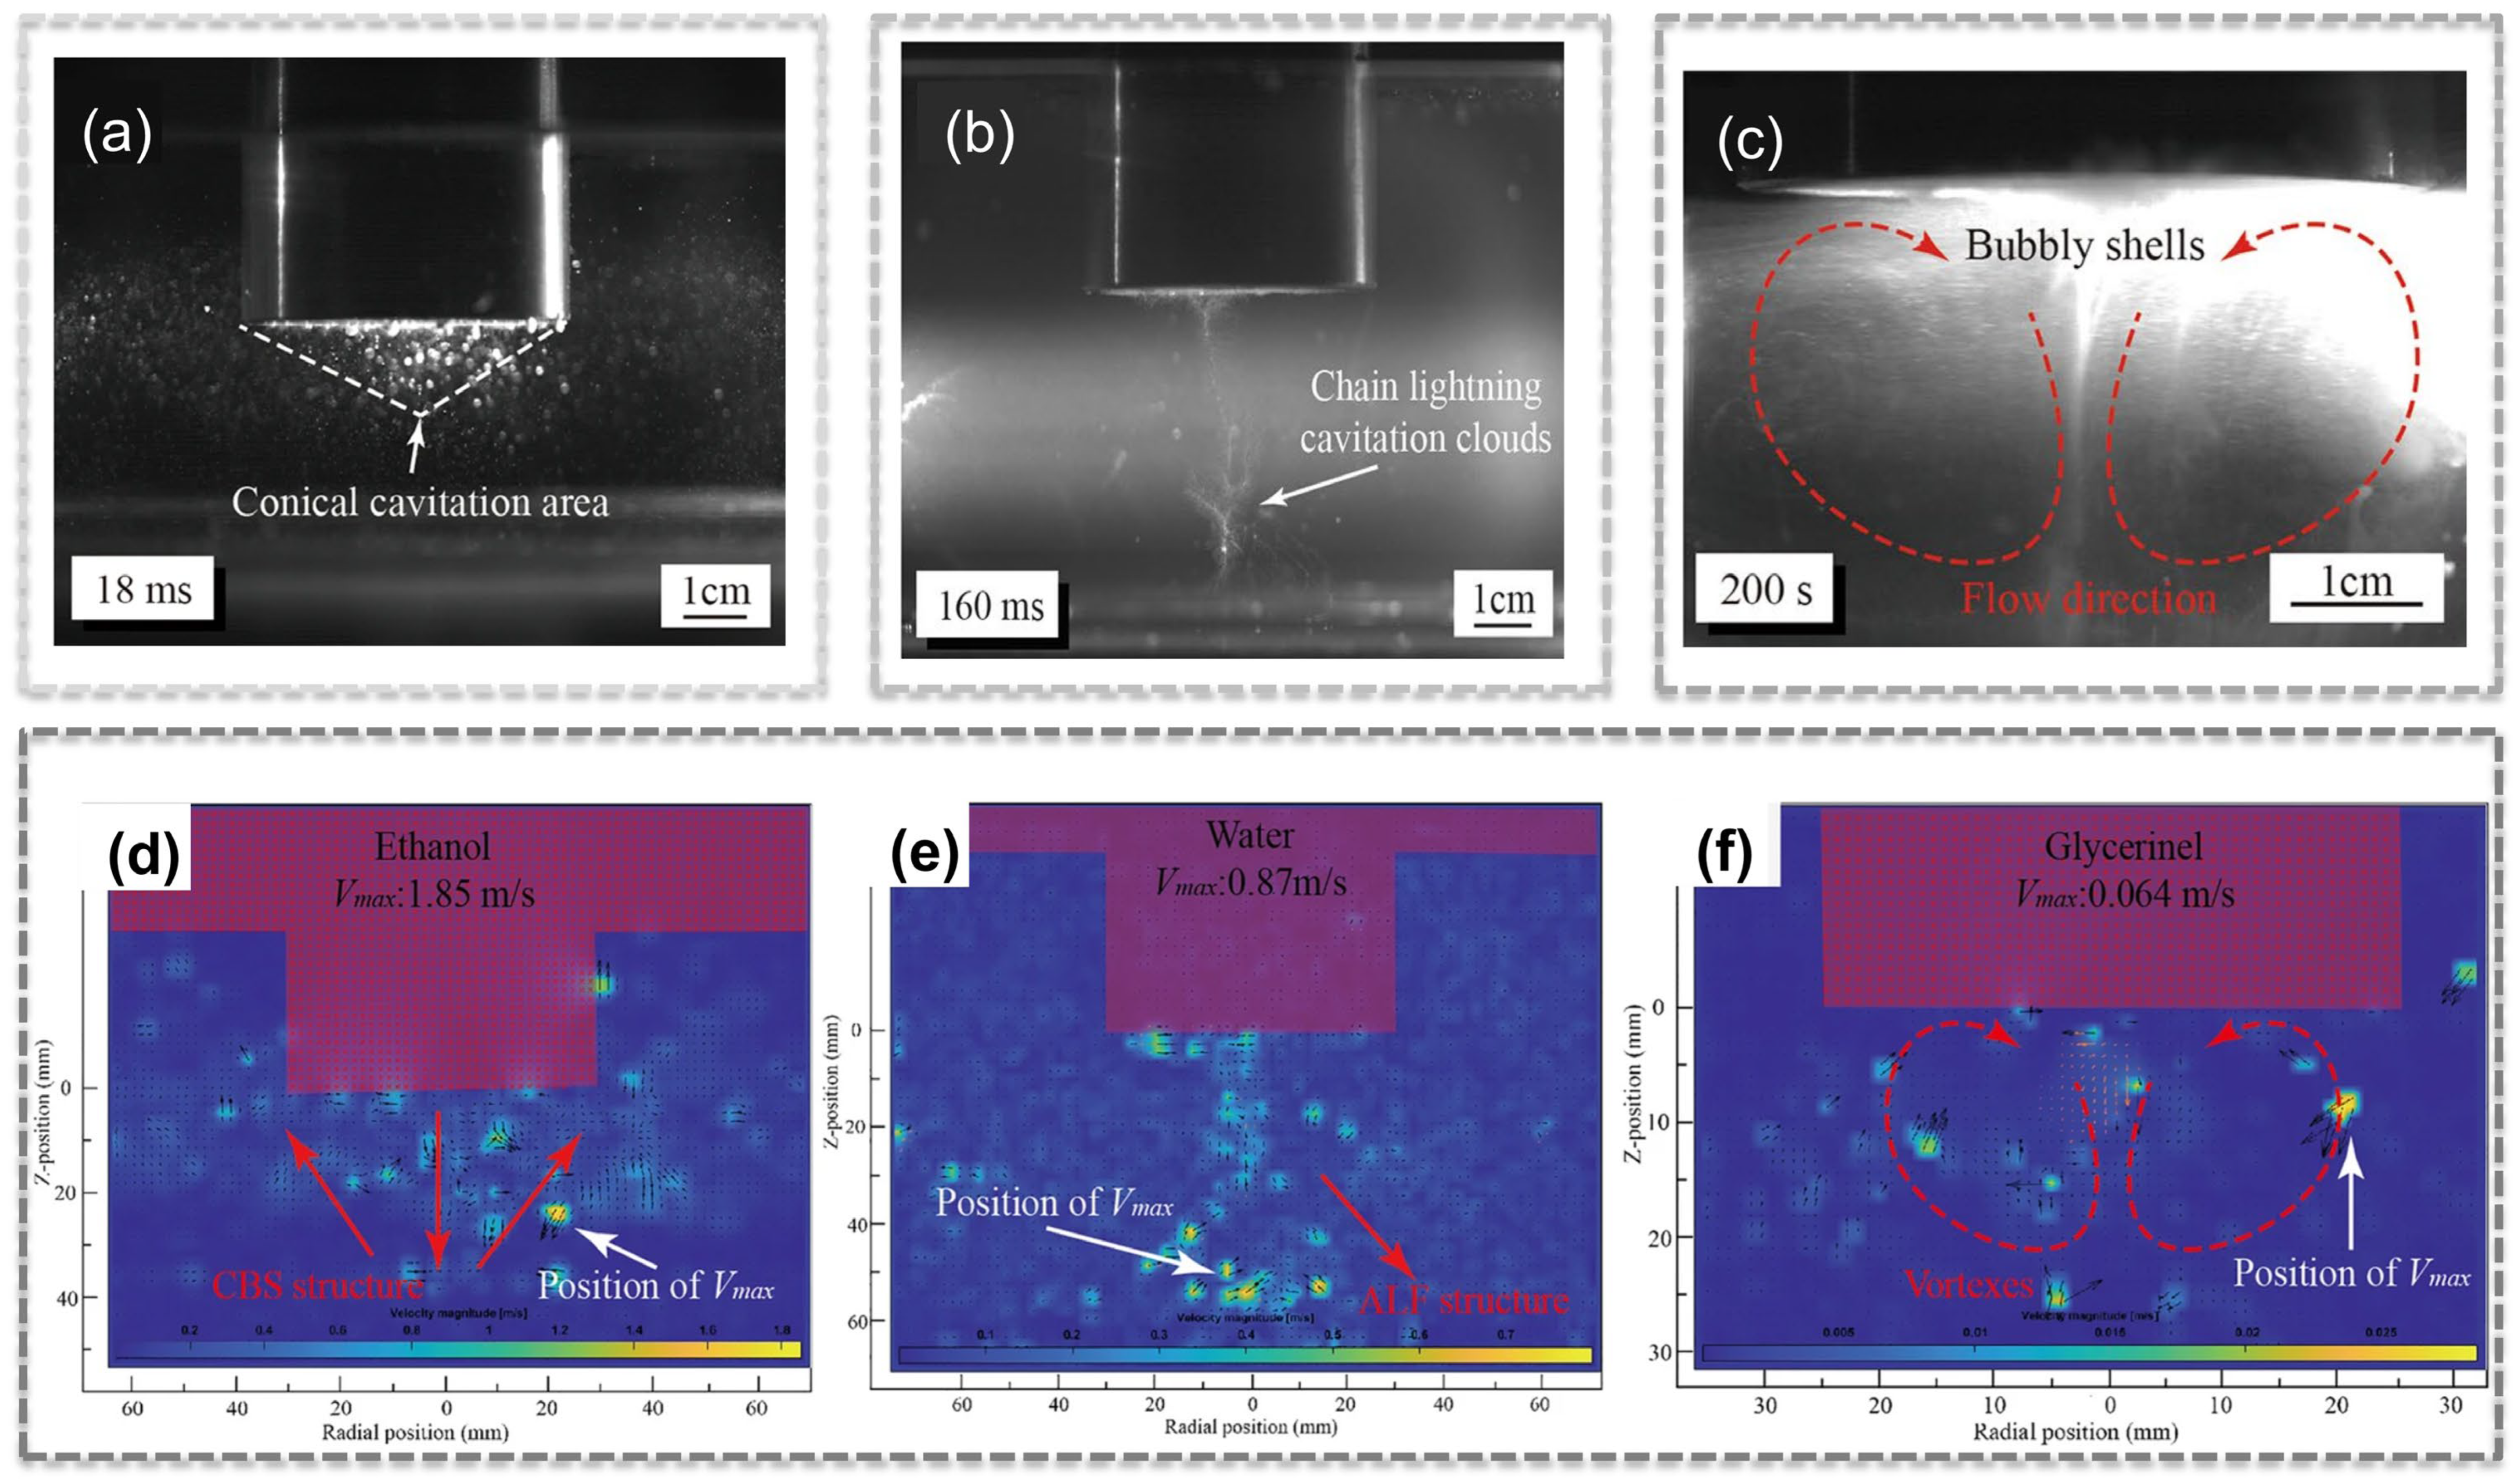
Beyond their core functionality, the combined application of PDA/PIV techniques across diverse fluid media further elucidates the correlation between cavitation behavior and flow-field characteristics. Chen et al. (2025) [68] conducted comparative investigations into incipient cavitation phenomena in ethanol, water, glycerol, and aluminum melts through high-speed photography, synchrotron radiation X-ray imaging, and PIV measurements (see Figure 6). They observed a stark contrast in cavitation behavior: ethanol (with low surface tension) tends to form a distinct conical cavitation cloud that, after bubble detachment, collapses rapidly into a strong microjet, whereas glycerol’s high viscosity inhibits bubble motion, yielding only slow-moving vortex-like bubble clusters. The PIV data further showed that the maximum bubble migration speed in ethanol reached 1.85 m/s, whereas, in glycerol, it was only 0.028 m/s—reflecting an enormous difference in the flow’s Reynolds and Weber numbers. These results clearly confirm the crucial role of liquid viscosity and surface tension in governing the intensity and stability of the cavitating flow field. Moreover, these findings underscore that accurate velocity-field measurements via PIV improve the precision of cavitation predictions based on dimensionless parameters, providing a reliable basis for quantitatively comparing cavitation inception thresholds and impact effects across different liquids.
By synchronizing PIV with high-speed visualization and acoustic/pressure sensors, researchers can directly link flow-field structures to transient impact events—a critical step towards untangling causality in cavitation phenomena. For example, in a tip-loaded hydrofoil experiment, Koncoski et al. (2023) [69] synchronized three-plane stereoscopic PIV with dual hydrophones to simultaneously capture flow dynamics and pressure signals. They found that the tip vortex’s oscillations were highly unsteady: peak vorticity reached about 4–5 times the mean value, and the turbulent stresses were strongly anisotropic. A temporal comparison between acoustic signals and high-speed imaging reveals that cavitation inception detected via acoustic methods (σ ≈ 4.4) precedes visual observation (σ ≈ 4.2), indicating acoustic signals are more sensitive to early-stage cavitation. During cavitation cloud shedding, interactions between the collapsing bubbles and the axial vortex core produced a pronounced pressure pulse peak in the 31.5–50 kHz range with significant spectral broadening, thereby confirming a direct correlation between high-shear vortex structures and high-frequency pressure pulse events.
Furthermore, PIV has been extended to directly visualize shockwave propagation during cavitation bubble collapse. Han et al. (2021) [24] developed a nanosecond-scale photography system based on dual-head PIV lasers that is capable of capturing cavitation bubble dynamics within a 10 ns timeframe. Their data on laser-induced shockwave propagation showed that shockwave velocity rapidly decays from 3611 m/s to the speed of sound in approximately 400 ns, validating the predictions of the Gilmore model. Byun et al. (2022) [70] later pioneered a seedless optical method to measure shockwave convection speed: a focused 532 nm laser pulse generated a plasma shock, and a 658 nm continuous laser probe beam was sent through the flow, with shock-induced deflections captured by photodiodes. Using a Sedov–Taylor analysis, they obtained the shock propagation velocity with 1.5% accuracy. Notably, this was the first successful quantitative measurement of shockwave convection speed without tracer particles, providing crucial data for understanding momentum transfer during bubble collapse events. In summary, by precisely measuring microjet velocities, bubble-cloud dynamics, and turbulent flow features—and synchronizing these measurements with high-speed imagery and pressure data—PIV/PDA techniques have elucidated inherent links between specific flow structures and transient impact events. This synergy provides indispensable experimental support for decoupling analyses and model validation of cavitation impact mechanisms [71,72,73].
Cavitation mechanisms are often coupled and superimposed within the same spatiotemporal domain. Effective decoupling remains elusive when relying solely on flow-field visualization and velocity data. Consequently, it is imperative to leverage advanced signal processing methods to extract mechanism-specific signal signatures from pressure, vibration, and acoustic signals. This enables cross-validation with flow-field visualization results, thereby achieving accurate separation and quantitative identification of multi-physical cavitation processes.

3.2. Physical Field Measurement Technologies for Cavitation Impact: With Broadband Piezoelectric Sensing as the Core

Broadband polyvinylidene fluoride (PVDF) film sensors, known for their high sensitivity and wide frequency response, have become core tools for quantitatively measuring transient cavitation loads. Their ultra-thin and flexible form factor allows them to be attached directly to solid surfaces or embedded within flow fields, incurring minimal disturbance to the fluid. These sensors are often synchronized with high-speed imaging to directly correlate the measured impact loads with the observed cavitation morphology [7].
PVDF sensors capture cavitation impact waveforms characterized by ultrashort pressure pulses and extremely steep pressure rise edges. The duration of a shockwave from a single-bubble collapse is on the order of only a few nanoseconds. For example, a near-field underwater bubble explosion produced a shock pulse with a peak pressure of 3.46 GPa and a width of only 18 ns [74]; a near-wall annular collapse can look even more abrupt, with a rise time around 40 ns. Reuter et al. (2022) [75] recorded that transient with a Müller Platte needle PVDF hydrophone at 5 to 8 mm from the bubble and then checked it against an ONDA HFO690 fiber-optic hydrophone about 2 mm away. They normalized peak pressures to a 700 μm reference distance. In contrast, the collective collapse of a bubble cloud releases multiple overlapping pulses spread over a longer period: experiments have recorded 5–8 sequential pulses in one cloud collapse event, spanning a total of approximately 1.2 μs [31]. These impact pulses also exhibit an almost instantaneous rise, essentially a water-hammer effect: the pressure climbs from 20% to 90% of its peak value within only a few tens of nanoseconds. For instance, the shockwave from a laser-induced single-bubble collapse was measured to have a 30 ns rise time [20], and the pressure jump due to a microjet impact in an ultrasonic cavitation field occurred in as little as 25 ns [65]. Such ultrafast transients demand sensors with exceptionally high temporal resolution to capture them without distortion.
PVDF measurements also reveal distinct frequency-domain signatures for different cavitation-collapse scenarios. Single-bubble collapses tend to concentrate energy in higher-frequency components (several megahertz and above), whereas collective collapses of bubble clouds spread energy across a broader band into the lower megahertz range. A good example comes from power ultrasound measurements, where single-bubble collapses can leave narrowband resonance peaks around 3.27 to 3.43 MHz. Khavari et al. (2021) [8] tracked this feature by scanning 136 positions from 1 to 10 mm around a 24 kHz horn. They used a needle-type Precision Acoustics fiber-optic hydrophone with a 10 μm effective tip, calibrated from 1 to 30 MHz. By contrast, the combined collapse of a bubble cloud produces a wider spectrum (approximately 1–10 MHz) that includes lower-frequency content associated with the cloud’s oscillation and shedding dynamics [31]. Moreover, PVDF sensors have been employed to investigate the influence of fluid properties on cavitation impacts. Luo et al. (2024) [59] found that increasing the liquid viscosity (using water–glycerol mixtures) caused the recorded shock front thickness to grow from 3.171 μm to 5.117 μm, the impact duration to lengthen from 3.015 μs to 20.823 μs, and the fraction of energy released via shockwaves to drop from about 95.6% to below 70%. These results confirm that higher viscosity dissipates more energy and attenuates the intensity of shockwave-induced impacts.
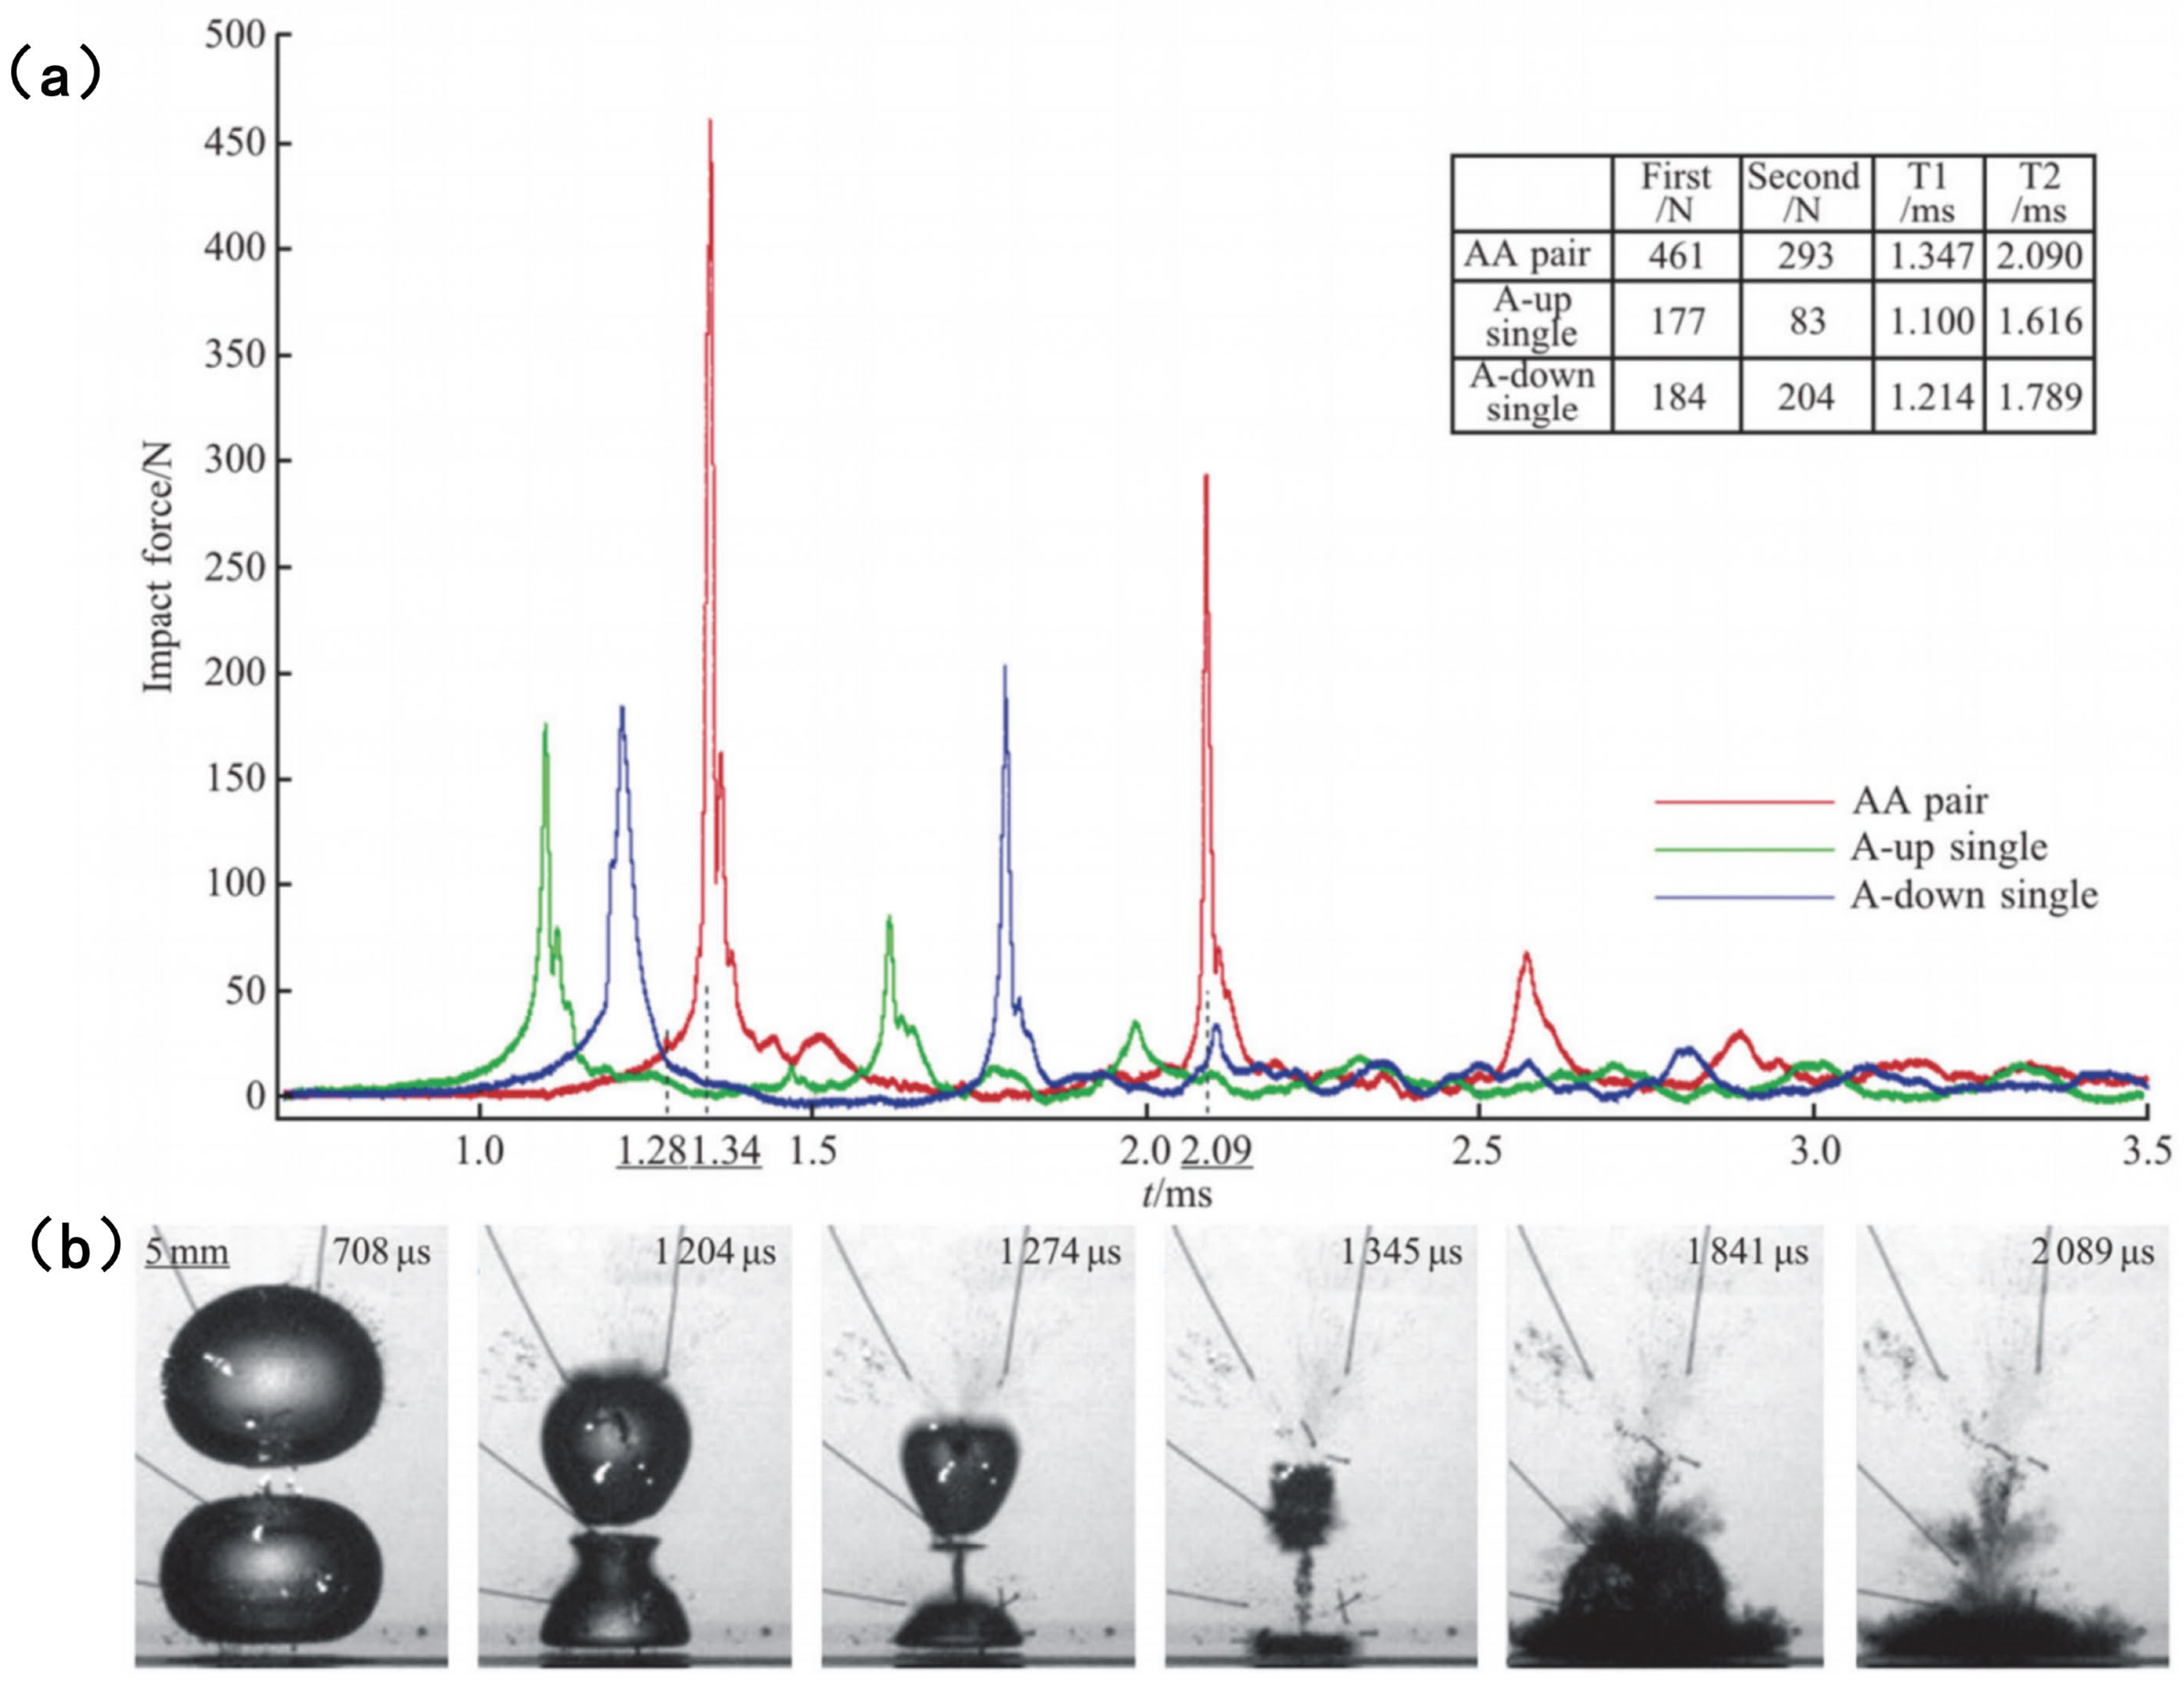
An explicit example of waveform-to-morphology correlation is provided in Figure 7. In this case, synchronized PVDF measurements and high-speed imaging are used to compare an AA-sized tandem bubble pair with the corresponding two single-bubble cases near a rigid wall, showing that bubble–bubble interaction lengthens the collapse process and strengthens the boundary impact relative to the single-bubble reference [7].
Figure 7 illustrates the main strength of PVDF-based synchronized diagnostics, but PVDF sensing still has inherent limitations that necessitate multi-technique approaches. First, as a point measurement device, a single PVDF sensor cannot capture the spatial distribution of a cavitation pressure field. Techniques such as background-oriented schlieren (BOS) imaging or deploying arrays of sensors are required to reconstruct the full-field pressure map of an impact event [66]. Second, PVDF needle hydrophones used in cavitation-shock measurements are often calibrated over bandwidths up to about 20 MHz, which can still be limiting for resolving the highest-frequency components of the sharpest cavitation pulses; complementary ultra-broadband sensors, such as fiber-optic hydrophones, are therefore often valuable in synchronized measurements [76]. In addition, PVDF signals are susceptible to electromagnetic interference and attenuation in long cable connections, which can distort the recorded waveforms; calibration tests (e.g., using laser-induced shockwaves) are often required to correct such distortions [8]. Accordingly, reported pressure amplitudes should be read as calibration-dependent quantities rather than instrument-independent values, and repeatability is further constrained by event-to-event variability and probe-position sensitivity. Finally, probe location can strongly affect the measured cavitation aggressiveness. Studies using PVDF probes at different radial wall positions have shown that the recorded load level depends sensitively on sensor position and gap width, so probe placement should be selected and reported carefully [77].
Nevertheless, PVDF remains a vital diagnostic for decoupling and analyzing cavitation mechanisms when used in tandem with other observation methods. By synchronizing PVDF signals with high-speed imaging, researchers can directly link specific waveform features to distinct physical mechanisms, making this approach a cornerstone for multi-mechanism cavitation analysis. For example, in one study, PVDF sensors captured the sequential collapse of two cavitation bubbles near a wall, recording a bimodal pressure pulse—two separate impact peaks rather than the single peak produced by an isolated bubble collapse. High-speed camera footage confirmed that the first peak was generated by the shockwave from the first bubble’s collapse, while the second peak was caused by the microjet impact of the following bubble. This analysis enabled researchers to quantify the contribution of each bubble to the overall impact load [7]. Similarly, PVDF measurements in cavitation erosion experiments have been correlated with material damage patterns: extremely rapid pressure spikes recorded by the sensor corresponded to the pit distributions observed on metal surfaces, confirming that locally focused shockwaves were responsible for those erosive features [75]. Another example is in ultrasonic cavitation, where a fiber-optic hydrophone detected a characteristic impact frequency of about 4.8 MHz. In that study the hydrophone was a Precision Acoustics FOH with an effective tip diameter of 10 μm and calibration from 1 to 30 MHz, sampled at 500 MS per second, with measurements taken across radial distances from 1 to 10 mm around the 24 kHz horn; by comparing the PVDF signal with schlieren imaging of the bubble dynamics, this frequency was identified as the resonant bubble-collapse frequency of the system [8].
As a practical takeaway, PVDF-based broadband piezoelectric sensing offers a direct way to quantify cavitation impacts in the time domain and, when needed, to extract complementary spectral cues. In most setups, its real strength is how easily it can be paired with imaging or sensor arrays so that pointwise pressure traces can be interpreted in a spatial and mechanistic context. At the same time, bandwidth ceilings, wiring-related attenuation, and electromagnetic noise still set the boundary of what PVDF alone can resolve, which is why many studies combine it with full-field optical methods and higher-bandwidth hydrophones and rely on dedicated calibration routines to keep waveforms trustworthy.
To compare these diagnostic techniques on a common basis, Table 3 summarizes their effective observables, representative resolution or bandwidth characteristics, suitability for different cavitation mechanisms, and the main sources of limitation and uncertainty. The purpose is not to rank one technique above another but to clarify which method is most informative for morphology identification, flow-response quantification, transient loading measurement, or cross-validated mechanism attribution.
Table 3 makes clear that no single diagnostic method simultaneously resolves collapse morphology, quantitative flow response, and local transient loading with equal fidelity. High-speed optical and X-ray techniques are strongest for mechanism identification, PIV/PDA for flow-response quantification, and pressure/acoustic methods for transient loading. Reliable decoupling therefore depends on synchronized use of complementary observables together with explicit reporting of bandwidth limit, field of view, sensor position, and synchronization uncertainty [22,27,28].

3.3. Application Progress of Advanced Signal and Image Processing in Mechanism Decoupling

Previous technologies, such as high-speed imaging, particle image velocimetry (PIV), and broadband piezoelectric sensing, have provided massive amounts of raw multi-physical field data for the observation and measurement of cavitation impact processes. However, these direct observation results are often mixed responses from the coupled effects of multiple mechanisms (e.g., microjets and shockwaves), and the signals and images generated thereby exhibit characteristics such as strong nonlinearity, non-stationarity, and high noise. Therefore, by relying solely on raw visual observation or single physical quantity measurement, it remains difficult to accurately separate and quantify the contributions of each individual mechanism from complex mixed information. To accomplish the leap from cavitation phenomenon observation to physical mechanism decoupling, it is imperative to leverage advanced signal and image processing methodologies to extract features associated with mechanism-specific physical processes from mixed multi-physical field data. This chapter will center on examining how these data processing techniques function as robust enablers for decoupling analysis in cavitation research. By means of feature extraction, pattern recognition, and multi-source information fusion, these approaches ultimately facilitate the quantitative identification and decoupling of diverse dominant cavitation impact mechanisms.

3.3.1. Progress in Signal Processing Technologies

Pressure, vibration, and acoustic signals generated by cavitation-induced impact are typically characterized by strong nonlinearity and non-stationarity and are frequently buried in background noise. Fundamentally, these signals are the outcome of the superposition of multiple cavitation mechanisms—encompassing microjets, single-bubble collapse, and the collective collapse of multi-bubble clouds. These mechanisms vary substantially in terms of spatiotemporal scales and frequency components. Therefore, it becomes imperative to leverage signal decomposition and targeted feature extraction to retrieve the mechanism-specific “fingerprint” features from complex mixed signals, thereby achieving quantitative identification and decoupling of individual mechanisms.
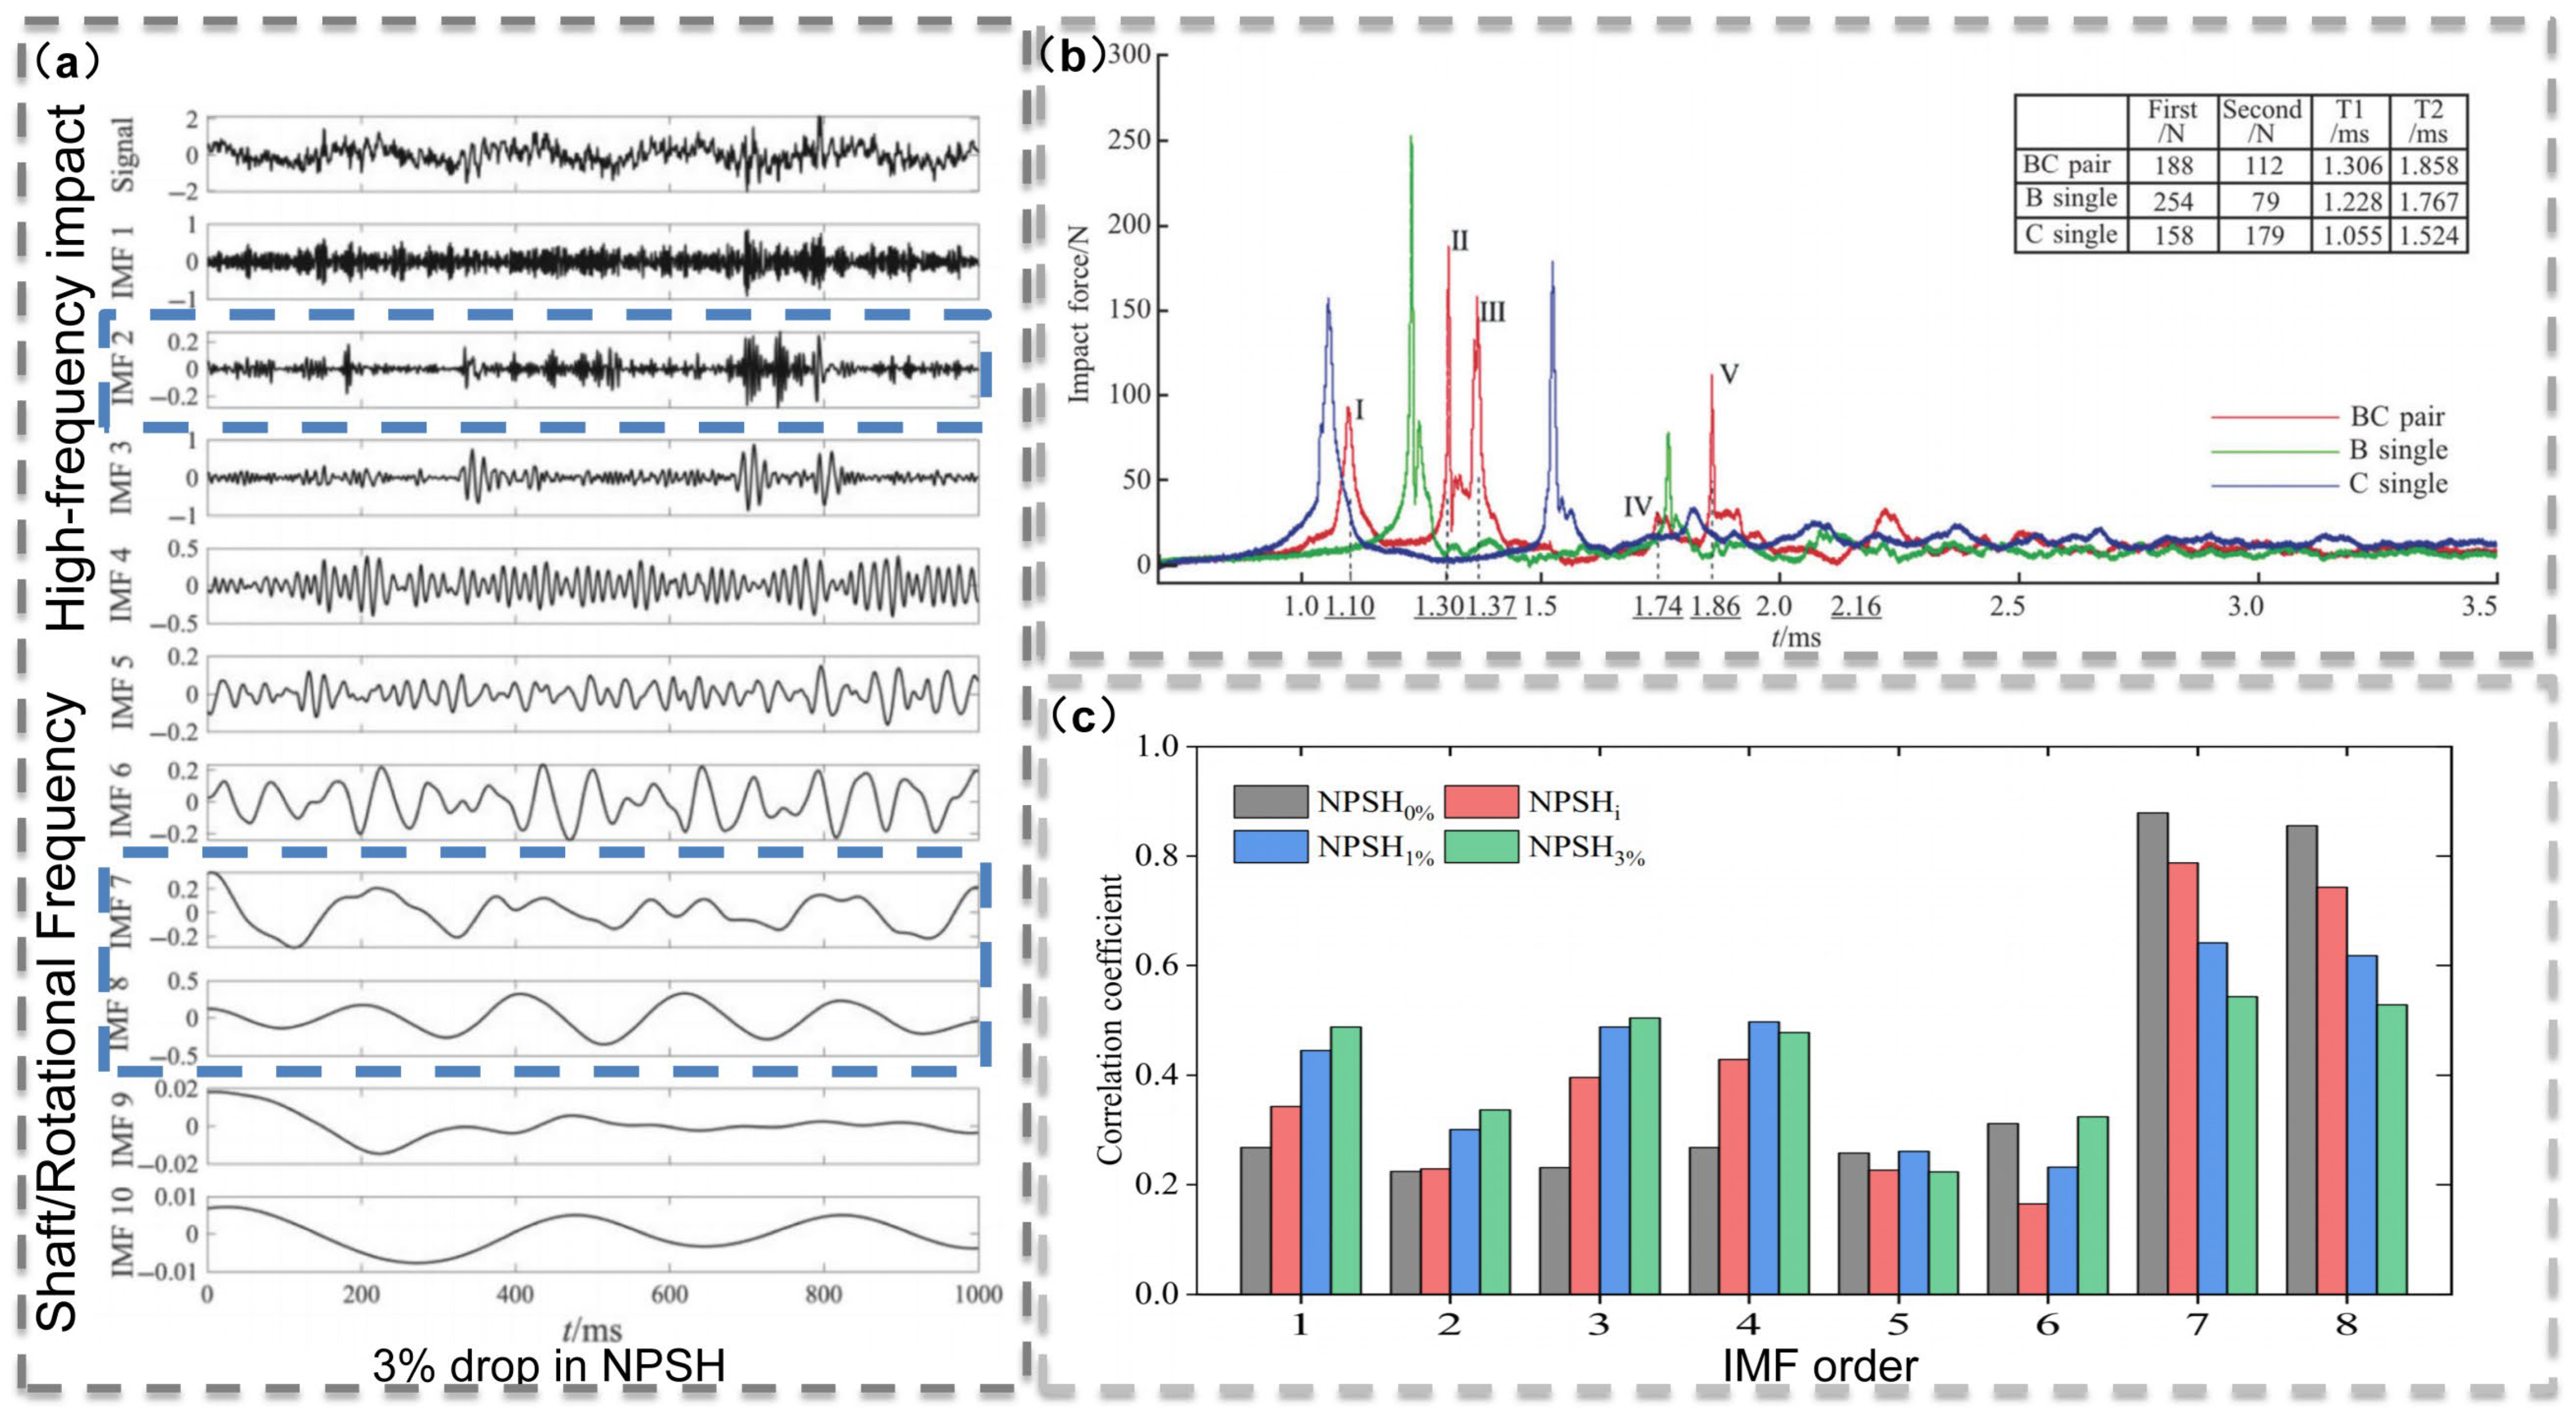
Empirical Mode Decomposition (EMD) and its derivative methods enable the adaptive decomposition of non-stationary signals into intrinsic mode functions (IMFs) across distinct frequency bands, thereby overcoming the limitation that traditional linear decomposition approaches fail to accommodate nonlinear cavitation signals. To tackle the mode mixing problem prone to EMD, improved algorithms such as Ensemble Empirical Mode Decomposition (EEMD) and Complete Ensemble EMD with Adaptive Noise (CEEMDAN) can significantly enhance decomposition robustness through the introduction of white noise. Bryngelson et al. (2020) [32] optimized the statistical model of cavitation bubble clusters by combining the Gaussian moment method with an LSTM recurrent neural network, solving the problem of high-order moment prediction errors under nonlinear dynamics and reducing the model error to less than 1% of the original method. Dai et al. (2023) [78] applied CEEMD to decompose cavitation noise signals of centrifugal pumps. After adding positive and negative white noise, eight IMF components were obtained, among which IMF1 corresponds to high-frequency cavitation noise in the 4000–6000 Hz range and IMF5 corresponds to low-frequency features in the 100–200 Hz range. Combined with a residual shrinkage neural network, accurate identification of normal, developing, and severe cavitation states was achieved. Similarly, Zhou et al. (2024) [79] used CEEMDAN to decompose vibration signals of sewage pumps into 9th-order IMFs, extracted energy features of the first six high-frequency IMFs (accounting for approximately 82% of the total energy), and achieved a 99.7% accuracy rate in identifying multiple cavitation states by combining with a Bayesian-optimized support vector machine classifier. As shown in Figure 8, for example, CEEMDAN can concentrate high-frequency impacts in pump signals into low-order IMFs (e.g., IMF2) while separating shaft/rotational frequencies into high-order IMFs (7th/8th order). This corresponds to the T1/T2 bimodal impact prototype of dual-bubble collapse and is reflected in the correlation coefficient–order curve as a trend of increasing correlation in low orders and decreasing correlation in 7th/8th orders. Compared with direct time-domain or frequency-domain indicators, energy features based on CEEMD/CEEMDAN show clearer pattern clustering, which can effectively separate high-frequency transient impacts from low-frequency background vibrations, providing a frequency-domain layered basis for mechanism decoupling.
Dai et al. (2023) decomposed liquid noise signals using CEEMD and combined with the DRSN model to realize cavitation state identification of centrifugal pumps with an accuracy of 94.61%, finding that liquid noise in the 0–500 Hz frequency band is most sensitive to cavitation [78]. Zhou et al. (2024) [79] extracted IMF energy features of vibration signals via CEEMDAN and combined with Bayesian-optimized SVM to classify multiple cavitation states of sewage pumps; the five-channel fusion model achieved 100% accuracy under critical cavitation conditions, verifying the synergistic advantages of modal decomposition and machine learning. Li et al. (2024) [80] constructed a dual-channel network model by combining point cloud data with deep learning, realizing real-time prediction of centrifugal pump cavitation and flow fields. The computational time for multiphase flow simulations was reduced from 10 h to 1 s, while the mean relative error (MRE) was maintained below 10%—findings that verify the advantages of data-driven modeling in multiphase flow analysis.
Al-Obaidi et al. (2025) [81] employed vibration acceleration signals and microphone-acquired acoustic data, integrated with Continuous Wavelet Transform (CWT) and Fast Fourier Transform (FFT) analyses, to achieve cavitation diagnosis for axial flow pumps. Their findings revealed that, when the flow rate exceeded 16 L/min, the vibration amplitude in the low-frequency band (10–2000 Hz) increased sharply. Notably, acoustic signals could capture incipient cavitation features even in noisy operational environments, yielding a diagnostic accuracy of 98.2%.
In another study, Li et al. (2024) [82] optimized Variational Mode Decomposition (VMD) parameters using Singular Spectrum Analysis (SSA) and integrated this with a multi-scale Convolutional Neural Network (CNN) to accomplish multi-scale feature extraction from hydraulic turbine acoustic signals. Their SSA-VMD-MSCNN model exhibited a higher diagnostic accuracy for cavitation compared to the traditional Wavelet Packet Decomposition (WPD)-MSCNN method.
Time–frequency analysis methods, by balancing time-domain and frequency-domain resolution, are suitable for capturing transient impacts and non-stationary characteristics of cavitation signals. The Short-Time Fourier Transform (STFT) generates time–frequency spectrograms through sliding a fixed time window, enabling the identification of periodic characteristic frequencies. However, limited by the fixed window length, it struggles to simultaneously accommodate nanosecond-scale impacts and millisecond-scale processes. In contrast, the Wavelet Transform (WT) achieves multi-resolution analysis using scaled and translated mother wavelets, making it more suitable for capturing events of different scales. Continuous Wavelet Transform (CWT) has been applied to identify high-frequency transient energy mutations in cavitation: CWT time–frequency plots of pump station vibration and acoustic emission signals show that, under full cavitation conditions, the originally smooth shaft frequency and harmonic spectral lines are disrupted, with discrete high-amplitude transient components appearing, corresponding to high-frequency short-term energy spikes excited by cavitation bubble collapse [22]. The Hölder exponent based on wavelet transform can quantitatively characterize singular mutation points in signals. When integrated with quantitative statistical features, such as multi-scale entropy, this approach can further characterize the nonlinearity and randomness of cavitation signals, acting as a sensitive discriminative tool to differentiate dynamic processes, such as microjet impacts and bubble oscillation noise. Sha et al. (2022) [83] proposed a 1-D Dual-Hierarchy Residual Network (1-D DHRN), integrated with Sliding-Window Fourier Transform (Swin-FFT) data augmentation, to achieve cavitation detection and intensity quantification of valve acoustic signals—attaining 100% detection accuracy under noisy operational conditions. Tiwari et al. (2021) [84] utilized the XGBoost deep learning algorithm integrated with pressure signal feature engineering to detect centrifugal pump blockage and cavitation. They adopted non-overlapping sliding window data augmentation to mitigate the small-sample limitation, achieving 93.56% accuracy in binary classification and outperforming traditional machine learning approaches. Wang et al. (2025) [85] calculated pump source flow via the TSMOC (Time–Space Multi-Objective Calibration) method and developed a DPAM-CORAL transfer learning framework. By decoupling high- and low-frequency features of cavitation signals through a dual-path attention mechanism, they achieved an average accuracy of 98.0% in the four-classification task—validating the superior performance of flow signals compared to pressure signals in cavitation identification. Chao et al. (2020) [86] proposed a 1-D CNN model with multi-channel input, bolstering its anti-noise robustness through the fusion of three-directional vibration signals. The cavitation identification accuracy reached 91.2% in scenarios with SNR = 5 dB, an improvement of 15% compared to single-channel models, demonstrating that multi-modal signal fusion enhances noise robustness. Deep learning also shows promise in cavitation-oriented design optimization and mitigation [87]. Zhang et al. (2025) [88] combined Mel spectrograms with a self-attention mechanism to realize four-classification identification of hydrofoil cavitation states, achieving 90% accuracy under varying operating conditions, with 100% accuracy in cloud cavitation identification. Oliveira e Souza et al. (2024) [89] applied CNN combined with k-means clustering for fault detection of injection pump vibration, pressure, and other signals, achieving 93.7% accuracy on industrial datasets. Among them, the pre-diagnosis time for abnormal vibration faults was advanced by 1 day, verifying the ability of deep learning in feature extraction from non-stationary signals. Qiu et al. (2022) [90] realized real-time prediction of the pump-jet propulsor velocity field using discrete pressure points through a bicubic interpolation and multi-path CNN framework, shortening the calculation time from 10 h to 1 s, which verified the efficiency advantage of data-driven modeling in multiphase flow analysis. Zheng et al. (2025) [91] constructed a Bayesian-optimized CNN–BiLSTM-attention framework, achieving multi-state identification of hydraulic turbine vortex band intensity through spatiotemporal feature extraction from pressure signals. The accuracy under multi-channel fusion was improved by 3.2% compared to a single model.
Multifractal and statistical feature analysis correlates with the complexity of cavitation physical mechanisms by extracting the long-range correlation and multi-scale inhomogeneity of signals. Multifractal Detrended Fluctuation Analysis (MF-DFA) can obtain parameters such as Hurst exponent and fractal spectrum width: Feng et al. (2024) found in the study of hydraulic turbine cavitation that, as cavitation develops from incipient to severe stages, the Hurst exponent of vibration signals decreases from 0.9 to 0.6 (indicating increased randomness), and the fractal spectrum width Δα of pressure pulsations increases to 1.26 (indicating enhanced inhomogeneous multi-scale fluctuations) [22]. These parameters can serve as signatures of cavitation states: an increase in fractal spectrum width implies the diversity and irregularity of bubble collapse events, corresponding to the collective collapse of cavitation clouds and the interaction of turbulent vortices, whereas, if the signal exhibits strong correlation and single-scale characteristics, it is likely dominated by single-bubble impacts. This underscores the quantitative correlation between fractal features and underlying physical mechanisms of cavitation.
Traditional frequency spectral analysis deduces the physical mechanisms of cavitation by extracting dominant frequency components and their variations. For instance, in the absence of cavitation, the dominant frequency of pressure pulsations in a hydraulic turbine draft tube equals 16 times the impeller rotational frequency; once cavitation occurs, this frequency shifts downward to four times the rotational frequency—reflecting energy migration to lower-frequency ranges induced by bubble shedding. Owing to their ultrashort pulse traits, cavitation shockwaves exhibit energy concentration in high-frequency ranges, whereas the collective collapse of cavitation clouds produces continuous pulses—yielding frequency spectra characterized by broad bands and low-frequency modulation. In ultrasonic cavitation experiments, Khavari et al. (2023) [92] detected 3.3–3.4 MHz narrowband peaks in water and water–ethanol mixtures using 1–30 MHz broadband hydrophones; these peaks, however, disappeared in high-viscosity glycerol due to the dissipation of impact energy.
Numerical simulations further confirmed that, during the collective collapse of large bubble clusters, wall pressure signals exhibit multi-peak structures, with intensity increasing by approximately 50% compared to scenarios involving fewer bubbles. Conversely, near-wall cavitation enhances the proportion of high-frequency components. These frequency-domain features provide critical clues for mechanism differentiation: MHz-level narrow peaks correspond to single-bubble shockwaves, while Hz-to-kHz low-frequency components and multi-peak spectra originate from the periodic shedding of cavitation clouds and structural vibration responses. Xu et al. (2024) [93] reconstructed multiphase flow fields from sparse pressure observations using a Transformer-based PFNet model, achieving high-precision prediction of cavity contours and volumes during the sheet cavitation stage. This advancement offers support for flow-field state monitoring under limited sensor deployment conditions.
Advanced signal processing methods isolate the characteristic patterns of mechanisms—such as microjet impact and shockwave radiation—from mixed signals via decomposition, time–frequency analysis, and statistical feature extraction: single-bubble collapse shockwaves correspond to nanosecond-scale spikes with steep rising edges; microjet impacts manifest as slightly longer yet high-intensity pulses; and cavitation cloud collapse presents continuous pulses with broadband energy distribution. Fundamentally, signal processing furnishes a core basis for the quantitative identification and decoupling of distinct cavitation mechanisms by extracting discriminative features from pressure, vibration, and acoustic emission signals.
Although signal processing methods have substantially improved cavitation recognition, most current studies still stop at state classification rather than mechanism quantification [94]. Features extracted by spectral decomposition, multifractal analysis, or deep networks are often discriminative, but they are rarely linked back to physically interpretable quantities, such as local collapse energy, shock attenuation, or jet momentum. As a result, a model may achieve high classification accuracy without showing why a given signal should be assigned to one mechanism rather than another. This limitation becomes more serious when the operating condition departs from the training set. In this sense, the present literature is stronger in pattern recognition than in physical attribution. Future progress will depend on explainable and physics-guided frameworks [95,96,97,98] that can connect learned features with mechanism-specific parameters rather than treating decoupling as a black-box recognition task.
Future development should prioritize incorporating domain-specific prior knowledge in fluid mechanics—such as bubble dynamics described by the Rayleigh–Plesset equation—into algorithm architectures to construct physics-informed learning models [97,98]. The objective of such models should not be limited to qualitative mechanism identification; instead, they should enable direct quantitative decoupling of the instantaneous contribution ratio of each mechanism to the total load from mixed signals. This will drive the field toward a new stage of physical inversion, transcending mere pattern recognition. In parallel, advanced image processing techniques offer a complementary spatial perspective, connecting transient cavitation morphology with its resulting mechanical effects.

3.3.2. Progress in Image Processing Technologies

The core value of image processing lies in establishing a connection between transient cavitation morphology and mechanical effects, making up for the shortcomings of single sensing signals in spatial positioning and visualization [28] and providing intuitive evidence for mechanism decoupling. For example, in steam cavities with a layered core structure, high-speed visualization clearly correlates bubble rupture frequency with thermal resistance performance [99]. In research on multi-source image processing fusion for cavitation mechanism decoupling, a single technology can hardly achieve both morphological visualization and mechanical effect correlation simultaneously; most tasks are accomplished through technological collaboration. Take Figure 9 as an example. Panel (a) represents the role of high-speed optical image processing in resolving the local evolution of bubble-induced jet formation. In the laser-induced bubble case, shadowgraph visualization is not used merely for qualitative observation; when combined with 2D-PIV, it links transient bubble morphology to jet velocity-field characteristics and entrainment behavior, thereby providing a quantitative basis for evaluating the kinematic strength and spatial influence of bubble-induced microjets [64]. Panel (b) serves a different purpose in an optically difficult cavitating wake. Here, time-resolved X-ray densitometry recovers the void-fraction field of backward-facing-step cavitation and makes the development of cavity topology and shedding structure measurable in a non-transparent flow region [21]. Panel (d) should be interpreted together with panel (b) because the synchronized X-ray snapshots and dynamic-pressure signal resolve one shedding event as a coupled process of cavity growth, shed-cloud motion, and cloud implosion rather than as two isolated measurements [21]. By contrast, panel (c) focuses on coherent-structure extraction rather than direct visualization. In the hydrofoil case, POD is used to extract the dominant large-scale cavitating structures from unsteady cloud-cavitation images so that the main spatial modes can be compared between rigid and flexible configurations [100]. Panel (e) then provides the morphology comparison needed to interpret those modal differences because the flexible hydrofoil exhibits longer cavity development and an accelerated transition of cavitation regime and shedding behavior as the cavitation number decreases [100]. Therefore, Figure 9 should be read as a verification chain linking local morphology, velocity-field quantification, void-fraction evolution, coherent-structure extraction, and synchronized response signals for mechanism decoupling.
The representative cases in Figure 9 show that image processing is most informative when it is used not as an isolated visualization tool but as part of a synchronized route linking morphology, velocity field, void-fraction evolution, and dynamic response. Yu et al. (2025) employed 200,000 fps shadowgraph imaging combined with 2D-PIV to quantify the velocity-field characteristics and entrainment capacity of laser-induced cavitation bubble jets, revealing the regulatory effects of laser parameters on jet dynamics [64]. In studies on multi-bubble interaction, Bao et al. (2021) [101] generated a synchronous three-bubble array using diffractive optical elements and captured sub-microsecond inter-bubble interactions via nanosecond laser shadowgraphy, intuitively presenting the dynamic process of jet impact and shockwave superposition, thus providing direct evidence for quantifying loads in multi-bubble interaction. Liu et al. (2025) [102] automatically extracted features such as length, area, and centroid of hydrofoil cavitation regions based on the U-Net image semantic segmentation algorithm. Compared with traditional manual measurement, this method enables the analysis of the transition mechanism from sheet cavitation to cloud cavitation by means of more sensitive indicators of regional changes.
Massive image data generated from cavitation visualization experiments require advanced algorithms to extract mechanistic information. Traditional threshold segmentation and edge detection are prone to noise interference, while the introduction of deep learning and dimensionality reduction analysis has significantly improved feature extraction capabilities. U-Net models based on Convolutional Neural Networks (CNNs) can achieve pixel-wise semantic segmentation of cavitation images, with higher accuracy than manual thresholding methods. For example, they can delineate the range of cavitation regions in hydrofoil cavitation images, verifying the generalization ability of deep learning in cavitation big data analysis. Pre-trained deep CNNs (e.g., ResNet-50) applied to cavitation state identification can achieve more than 90% classification accuracy for centrifugal pump cavitation versus other faults; when combined with convolutional–recurrent networks, they can extract spatiotemporal features of cavitation evolution to enable automatic mechanism discrimination. In addition, dimensionality reduction methods such as Proper Orthogonal Decomposition (POD) decompose complex flow fields into several dominant modes, allowing quantification of the contributions of key structures (e.g., re-entrant jets and vortices). For instance, POD decomposition of PIV results from Venturi cavitating flows revealed the influence of temperature on the coherence of cavitating flows [72]. Liu et al. (2024) [103] coupled LSTM networks with computational fluid dynamics (CFD) to realize time-series prediction of butterfly valve erosion rates, finding that erosion rates increase with opening degree. The LSTM model improved prediction accuracy by 5.39% compared to BP neural networks, providing a new method for temporal decoupling of erosion mechanisms. Tong et al. (2023) [104] quantified cavitation intensity Ic using the pixel counting method in high-speed photography, captured cavitation bubble distributions through transparent pump casings, and established a mapping relationship between Ic and vibration signals. This provided visual labels for neural networks, enabling early cavitation diagnosis. Prasshanth et al. (2024) [105] converted vibration signals into scaled images, extracted time–frequency features through AlexNet convolutional layers, and their RGB mapping results could intuitively distinguish the spectral distributions of cavitation and mechanical faults, offering a new method for visual diagnosis of vibration signals.
The integration of image processing techniques with multi-source measurement methodologies (encompassing pressure, vibration, and flow-field sensing) has propelled forward the quantitative decoupling and experimental verification of cavitation mechanisms. At the cavitation cloud scale, Esplin et al. (2021) [106] achieved spatiotemporal synchronization between high-speed photography and a needle hydrophone, extracted the probability distribution of image features via a Gaussian mixture modeling (GMM) approach, and reconstructed the spatiotemporal distribution of cavitation volume alongside the corresponding transient pressure field under non-visible operational scenarios. At a discharge energy of 72 J, the bubble cloud expanded to a radial range of about 10 cm. By improving the imaging resolution to 100 μm, they could resolve discrete bubbles that traditional approaches tended to miss. They derived the cloud extent by synchronizing high-speed imaging with needle hydrophone measurements, placing three hydrophones about 8.9 to 10.2 cm from the spark electrodes at viewing angles between 5 and 25 degrees. The experiments were conducted in a cubic Plexiglas tank with a side length of about 50.8 cm, filled with 28 ppt salt water, and the spark electrode depth was set between about 1.5 and 4.5 cm. In microscale shockwave measurement, Yamamoto et al. (2022) [66] used high-resolution BOS technology to capture a 90 μm thick shockwave front in a microtube with an inner diameter of 500 μm, inversely deriving a peak pressure of approximately 3 MPa. They also verified the linear correlation between microjet velocity and pressure impulse, with a correlation coefficient of 0.8. Feng et al. (2024) [22] achieved synchronous acquisition of runner vibration signals, draft tube dynamic pressure pulsations, and cavitation visualization images in experiments on a bulb turbine. They derived the Hurst exponent and fractal spectrum width (Δα) through Multifractal Detrended Fluctuation Analysis (MF-DFA), and their analysis revealed that Δα of the pressure signals exhibited the minimum value (0.66) under critical cavitation conditions and the maximum value (1.26) under full cavitation conditions. Moreover, it was more sensitive to the inhomogeneity of bubble shedding than vibration signals, verifying the reliability of fractal parameters as features of cavitation states.
The complementarity between image and signal processing lies in this: images provide spatial distribution of cavitation morphology and details of spatiotemporal evolution, while signals quantify impact intensity, spectral characteristics, and structural responses. Their integration enables the establishment of a morphology–mechanics correlation [28]. Here, morphology–mechanics correlation refers to a quantitative mapping between cavitation morphology descriptors and measured mechanical responses, including pressure impulses, vibration metrics, and damage indicators. For example, in near-field underwater explosion experiments, Zhou et al. (2024) [74] synchronized high-speed photography, optical vibration measurement, and PVDF sensors, clarifying the causal relationship between shockwaves, cavitation, and structural deformation and confirming that a single measurement method cannot separate multi-physical processes. However, ultra-high-speed imaging equipment has high cost and limited field of view, optical occlusion in complex media restricts the visualization of internal structures, and the quantification of images relies on model inversion. Future efforts need to focus on developing economically feasible ultra-high-speed imaging solutions, multi-modal imaging, artificial intelligence-driven quantitative analysis, and real-time monitoring and early warning of cavitation states [66,100].
Image processing technology converts transient cavitation morphology into quantifiable parameters, providing irreplaceable evidence of spatiotemporal evolution for mechanism decoupling. However, there are inherent limitations in its technical path, with the core issue being that the correlation between morphological observation and mechanical effects still needs to be indirectly established through models—and this introduces uncertainties and errors. For example, inverting pressure fields from schlieren images relies on a complete set of optical and physical assumptions, and its accuracy is hard to guarantee in complex flow fields. On the other hand, mainstream two-dimensional (2D) imaging modalities fail to capture critical depth-dimension information about cavitation phenomena [107,108]. The 3D spatial collective collapse architectures of bubble clouds and the spatial morphology of microjets may be oversimplified or morphologically distorted in 2D projections, which can lead to misjudgments regarding the mechanism’s action scope and intensity [107,108]. Additionally, a significant disparity exists between the computational and hardware resource demands of existing algorithms and the real-time processing requirements for meeting active control needs. The key to overcoming the existing technical bottlenecks lies in developing integrated multi-modal analytical frameworks that incorporate true three-dimensional (3D) imaging technologies—for instance, integrating X-ray tomography with high-speed optical visualization to capture the complete 3D structural characteristics of cavitation [26]. Concurrently, it is imperative to develop data-driven intelligent algorithms capable of direct mapping of spatiotemporal morphological evolution sequences to 3D flow-field characteristics and even transient load distributions. This will bridge the morphology–mechanics disconnect, forging a direct pathway from visualization to quantitative analysis of cavitation mechanisms. Nevertheless, key challenges continue to impede complete mechanism decoupling, highlighting the need for further innovations and guiding the next stage of research.

4. Technical Challenges and Future Directions

Despite recent advancements in identifying cavitation mechanisms, significant challenges remain in decoupling their effects. This chapter synthesizes the core impediments to cavitation impact mechanism decoupling—in particular, limitations due to multi-mechanism coupling that complicate experimental measurements—and then outlines potential solutions and future research directions.

4.1. Core Challenges in Mechanism Decoupling

Mechanism decoupling remains difficult because hydrodynamic jet loading, microjet impact, single-bubble shockwaves, and bubble-cloud collapse often overlap within microsecond or even nanosecond windows, producing composite loading, mixed waveform features, and coupled erosion footprints [20,23,74]. This difficulty is amplified by limitations in three-dimensional visualization, temporal synchronization, and cross-study normalization, especially when results from single-bubble experiments, cloud-cavitation studies, and engineering-scale systems are compared directly [109].

4.2. Engineering Implications, Remaining Limitations, and Future Priorities

Cavitation impact results from the coupled action of microjets, shockwaves, and bubble-cloud dynamics, and mechanism decoupling seeks to distinguish their individual contributions to loading, erosion, or performance. From a methodological perspective, this should be treated as a staged task rather than a single diagnostic exercise. The decoupling target should first be stated explicitly, such as morphology identification, local loading attribution, or contribution-ratio estimation. The diagnostic set should then match that target: high-speed imaging is most suitable for collapse morphology and jet evolution [24], whereas broadband hydrophones, BOS, and synchronized pressure-acoustic measurements are more informative for transient loading and shockwave characterization [8,25,27,66]. When microjets and shockwaves overlap within the same narrow spatiotemporal window, synchronized acquisition and cross-validation become essential [22,27]. Contribution estimates should therefore be reported as metric-specific quantities together with their main uncertainty sources, including sensor bandwidth, sensor location, reference distance, synchronization error, liquid medium, and configuration dependence. Without such normalization, results remain difficult to compare directly across studies.
Recent progress in synchronized optical, pressure, and signal-analysis techniques has improved the identification of mechanism-specific cavitation signatures. However, true quantitative decoupling remains difficult because different mechanisms still overlap strongly in space and time, no single sensor can isolate all contributions, and the existing decomposition or recognition methods are not yet robust across different cavitation configurations. In addition, the lack of widely accepted operational definitions for energy dominance, peak-pressure dominance, and damage dominance, together with the absence of benchmark conditions, continues to limit direct comparison across studies. These limitations show that further progress depends not only on better sensing hardware but also on more consistent normalization, uncertainty reporting, and cross-study evaluation criteria.
Future advances should therefore focus on low-intrusiveness approaches, high-resolution diagnostics, and benchmark-based validation. High-resolution schlieren-type methods and interferometric fiber-optic probes have already shown the potential to measure microscale shockwave fields and bubble-wall motion with high spatial and temporal fidelity, including in optically challenging conditions [110]. More importantly, multi-source synchronized measurements should be developed together with standardized test configurations, explicit response metrics, and clear error evaluation procedures. Only under such conditions can different decoupling strategies be compared on a common basis and used more reliably for quantitative cavitation analysis.
In-depth cavitation mechanism decoupling provides a foundation for shifting from passive mitigation to active control of cavitation effects [111,112]. From an engineering perspective, such information is useful not only for selecting anti-erosion coatings or boundary configurations but also for deciding which response metric should be minimized or enhanced in design, such as local peak pressure, cumulative vibration, erosion rate, pit density, or mass-loss rate.
A representative laboratory example is shown in Figure 10. Under an inclined-wall condition θ = 45°, the erosion pattern changes markedly with jet morphology: the single-hole orifice produces more concentrated damage, whereas multi-hole interference redistributes bubble activity and alters the erosion zone.
Importantly, erosion appears not only in the direct jet-impact region but also in the surrounding field where cavitation bubbles move violently, indicating that practical regulation should consider bubble-distribution dynamics rather than the nominal impact point alone [112].
At the same time, the practical relevance of these regulation strategies should not be overstated. Most evidence for microporous coatings, biomimetic textures, and excitation control still comes from simplified laboratory conditions [5,23,55,112]. Their long-term durability, scale dependence, and effectiveness under realistic marine turbulence, material aging, and repeated loading have not yet been established. Moreover, a strategy that suppresses one damaging pathway may shift the system toward another rather than reduce the total damage level. This trade-off is rarely quantified in current studies. For this reason, the literature already suggests engineering promise but not yet mature design rules.
Overall, recent progress has clarified the main signatures of hydrodynamic loading, microjets, single-bubble shockwaves, and bubble-cloud collapse. However, true quantitative decoupling remains limited. The literature is still fragmented across single-bubble experiments, cloud-cavitation studies, and engineering-scale flow systems, and these results are often compared without sufficient normalization of geometry, medium, and sensing bandwidth. This is why agreement on mechanism dominance, contribution ratio, and transferability to engineering conditions is still incomplete.
In modeling terms, this means that many current CFD or multiphase simulations are still validated against integrated cavitation phenomena rather than against mechanism-resolved observables. Decoupled datasets would make it possible to test whether a model correctly predicts not only the overall cavitation occurrence but also the relative contribution of shockwaves, microjets, and bubble-cloud collapse under specified geometry and operating conditions.
Future work should focus on benchmark configurations, mechanism-specific evaluation metrics, and rigorously synchronized multi-source measurements [22,28]. Equally important, data-driven recognition should be coupled more tightly to physically interpretable parameters [94,95,96,97,98] so that classification accuracy is not mistaken for mechanism understanding. Only with this shift can cavitation decoupling move from qualitative inference toward quantitative and reproducible engineering use.

5. Conclusions

This review examined cavitating jet impingement from the perspective of mechanism decoupling. The literature shows that hydrodynamic jet loading, microjet impact, single-bubble shockwaves, and bubble-cloud collective collapse differ not only in physical origin but also in action duration, spatial reach, and response metric. As a result, apparent disagreement across studies often reflects differences in configuration, response metric, observable, and measurement condition rather than any contradiction in physical principle.
The review also shows that mechanism decoupling increasingly depends on synchronized multi-source diagnostics. High-speed imaging, PIV/PDA, PVDF sensing, pressure/acoustic measurements, and image/signal processing each provide only partial evidence when used alone but become much more informative when combined through time-locked acquisition and cross-validation. Recent progress has improved the identification and attribution of cavitation events, yet quantitative contribution analysis remains limited by strong spatiotemporal overlap, configuration dependence, inconsistent normalization, insufficient uncertainty reporting, and the lack of clearly adopted operational definitions for energy, peak pressure, and damage dominance.
Overall, the current research supports a shift from descriptive cavitation observation toward response-specific and mechanism-resolved interpretation. Future progress will depend on benchmark configurations, explicit comparison metrics, synchronized measurements, and closer integration between physically interpretable observables, predictive models, and engineering design needs. In this sense, mechanism decoupling is important not only for clarifying cavitation physics but also for improving model validation, erosion prediction, and the practical regulation of cavitation effects in marine and hydraulic systems.

Author Contributions

Conceptualization, G.Z., B.L. and X.W.; methodology, G.Z. and B.L.; formal analysis, W.Z. and X.B.; investigation and resources, W.Z. and Y.X.; writing—original draft, G.Z.; writing—review and editing, B.L., Y.X., X.B. and X.W.; supervision, B.L. and X.W. All authors have read and agreed to the published version of the manuscript.

Funding

This work was supported by the Youth Foundation of Rocket Force University of Engineering (Grant No. 2024QN-B043).

Data Availability Statement

No datasets were used in this study.

Conflicts of Interest

The authors declare no potential conflicts of interest with respect to the research, authorship, and/or publication of this article.

References

  1. Weißgraeber, P.; Welschinger, F.; Üffing, C. Cavitation damage in rubber-like silicone adhesives. Int. J. Adhes. Adhes. 2025, 136, 103867. [Google Scholar] [CrossRef]
  2. Abreu, M.; Jonsson, S.; Elfsberg, J. Differences in ultrasonic cavitation damage between new and used engine coolants with varying time in operation. Wear 2024, 542–543, 205238. [Google Scholar] [CrossRef]
  3. Su, R.; Liu, Y.; Hu, L.; Shen, Y.; Wang, J.; Ruan, X.; Fu, X. Experimental investigation of cavitation erosion-induced surface damage and particle shedding from PTFE. Mater. Des. 2025, 253, 113886. [Google Scholar] [CrossRef]
  4. Cui, Y.; Guo, F.; Ding, Q.; Cheng, B. Investigation of cavitation damage patterns in centrifugal pump blades under rotating flow fields. J. Pipeline Sci. Eng. 2025, 6, 100288. [Google Scholar] [CrossRef]
  5. Tian, L.; Zhang, Y.; Shi, J.; Yin, J.; Lv, L.; Zhang, J.; Zhu, J. Study of the interaction between a cavitation bubble and nearby biomimetic gas-entrapping microtextured surfaces and the potential damage effects on the wall using the compressible multiphases volume of fluid model. Ocean Eng. 2024, 311, 118976. [Google Scholar] [CrossRef]
  6. Kumar, P.; Kadivar, E.; el Moctar, O. Numerical Analysis of Cavitation Suppression on a NACA 0018 Hydrofoil Using a Surface Cavity. J. Mar. Sci. Eng. 2025, 13, 1517. [Google Scholar] [CrossRef]
  7. Naing, N.M.T.; Park, J.; Hyun, S.H.; Jung, R.T. Impact loads generated by tandem cavitation bubble on solid wall. J. Hydrodyn. 2022, 34, 467–482. [Google Scholar] [CrossRef]
  8. Khavari, M.; Priyadarshi, A.; Hurrell, A.; Pericleous, K.; Eskin, D.; Tzanakis, I. Characterization of shock waves in power ultrasound. J. Fluid Mech. 2021, 915, R3. [Google Scholar] [CrossRef]
  9. Wang, M.J.; Zhou, Y.F. Numerical investigation of the inertial cavitation threshold by dual-frequency excitation in the fluid and tissue. Ultrason. Sonochem. 2018, 42, 327–338. [Google Scholar] [CrossRef] [PubMed]
  10. Xu, H.; Tu, J.; Niu, F.; Yang, P. Cavitation dose in an ultrasonic cleaner and its dependence on experimental parameters. Appl. Acoust. 2016, 101, 179–184. [Google Scholar] [CrossRef]
  11. Niemczewski, B. Cavitation intensity of water under practical ultrasonic cleaning conditions. Ultrason. Sonochem. 2014, 21, 354–359. [Google Scholar] [CrossRef]
  12. Zhong, X.; Dong, J.; Liu, M.; Meng, R.; Li, S.; Pan, X. Experimental study on ship fouling cleaning by ultrasonic-enhanced submerged cavitation jet: A preliminary study. Ocean Eng. 2022, 258, 111844. [Google Scholar] [CrossRef]
  13. Niemczewski, B. Influence of concentration of substances used in ultrasonic cleaning in alkaline solutions on cavitation intensity. Ultrason. Sonochem. 2009, 16, 402–407. [Google Scholar] [CrossRef]
  14. Niemczewski, B. Observations of water cavitation intensity under practical ultrasonic cleaning conditions. Ultrason. Sonochem. 2007, 14, 13–18. [Google Scholar] [CrossRef]
  15. Yusof, N.S.M.; Babgi, B.; Alghamdi, Y.; Aksu, M.; Madhavan, J.; Ashokkumar, M. Physical and chemical effects of acoustic cavitation in selected ultrasonic cleaning applications. Ultrason. Sonochem. 2016, 29, 568–576. [Google Scholar] [CrossRef]
  16. Li, L.; Cheng, X.; Zhu, Z.; Sun, X.; Zhang, X. Investigation of cavitation shedding mechanisms including reentrant jet and shock wave by Eulerian-Lagrangian multiscale simulation. Phys. Fluids 2024, 36, 032126. [Google Scholar] [CrossRef]
  17. Hu, J.; Liu, Y.; Duan, J.; Yu, J.; Zhang, Y.; Gao, D.; Zhang, Y. Investigation of mechanisms of shock wave generation by collapse of cavitation bubbles near particles. Ultrason. Sonochem. 2024, 108, 106952. [Google Scholar] [CrossRef]
  18. Hu, J.; Liu, Y.; Duan, J.; Liu, Y.; Yu, J.; Zheng, X.; Zhang, Y.; Gao, D.; Zhang, Y. Investigations on the jets and shock waves of a cavitation bubble collapsing between a wall and a particle. Phys. Fluids 2024, 36, 033330. [Google Scholar] [CrossRef]
  19. Reese, H.; Ohl, C.D.; Rossello, J.M. Cavitation and jetting from shock wave refocusing near convex liquid surfaces. Int. J. Multiph. Flow 2024, 175, 104822. [Google Scholar] [CrossRef]
  20. Tinguely, M.; Ohtani, K.; Farhat, M.; Sato, T. Observation of the Formation of Multiple Shock Waves at the Collapse of Cavitation Bubbles for Improvement of Energy Convergence. Energies 2022, 15, 2305. [Google Scholar] [CrossRef]
  21. Bhatt, A.; Ganesh, H.; Ceccio, S.L. Cavitating flow behind a backward facing step. Int. J. Multiph. Flow 2021, 139, 103584. [Google Scholar] [CrossRef]
  22. Feng, J.; Zhao, N.; Zhu, G.; Wu, G.; Li, Y.; Luo, X. Cavitation identification in a hydraulic bulb turbine based on vibration and pressure fluctuation measurements. Mech. Syst. Signal Process. 2024, 208, 111042. [Google Scholar] [CrossRef]
  23. He, D.Q.; Wen, H.G.; Geng, S.Y.; Yang, C.X.; Zhong, Q.; Yao, Z.F. Energy partition in laser-induced cavitation bubbles near the rigid wall with a gas-containing hole. J. Hydrodyn. 2024, 36, 435–443. [Google Scholar] [CrossRef]
  24. Han, D.X.; Yuan, R.; Jiang, X.K.; Geng, S.Y.; Zhong, Q.; Zhang, Y.F.; Yao, Z.F.; Wang, F.J. Nanosecond resolution photography system for laser-induced cavitation based on PIV dual-head laser and industrial camera. Ultrason. Sonochem. 2021, 78, 105733. [Google Scholar] [CrossRef]
  25. Petkovšek, M.; Hočevar, M.; Dular, M. Visualization and measurements of shock waves in cavitating flow. Exp. Therm. Fluid Sci. 2020, 119, 110215. [Google Scholar] [CrossRef]
  26. Bokman, G.T.; Biasiori-Poulanges, L.; Lukic, B.; Bourquard, C.; Meyer, D.W.; Rack, A.; Supponen, O. High-speed x-ray phase-contrast imaging of single cavitation bubbles near a solid boundary. Phys. Fluids 2023, 35, 013322. [Google Scholar] [CrossRef]
  27. Li, M.C.; Sankin, G.; Vu, T.; Yao, J.J.; Zhong, P. Tri-modality cavitation mapping in shock wave lithotripsy. J. Acous. Soc. Am. 2021, 149, 1258–1270. [Google Scholar] [CrossRef]
  28. Wu, Q.; Gray, M.; Smith, C.A.B.; Bau, L.; Cleveland, R.O.; Coussios, C.; Stride, E. Challenges in classifying cavitation: Correlating high-speed optical imaging and passive acoustic mapping of cavitation dynamics. J. Acous. Soc. Am. 2024, 156, 3608–3620. [Google Scholar] [CrossRef]
  29. Zeng, Q.; An, H.; Ohl, C.-D. Wall shear stress from jetting cavitation bubbles: Influence of the stand-off distance and liquid viscosity. J. Fluid Mech. 2021, 932, A14. [Google Scholar] [CrossRef]
  30. Wen, H.G.; Yao, Z.F.; Wu, Q.; Sun, Y.R.; Yang, C.X.; Zhong, Q. Investigation of cavitation erosion caused by laser-induced single bubble collapse near alloy coating surface. J. Hydrodyn. 2023, 35, 876–886. [Google Scholar] [CrossRef]
  31. Lu, J.X.; Gong, Y.; Li, L.H.; Liu, X.B.; Kan, N.Q.; Zhang, F. Research of the vibration induced by cavitation in a centrifugal pump under part load condition. Phys. Fluids 2023, 35, 045144. [Google Scholar] [CrossRef]
  32. Bryngelson, S.H.; Charalampopoulos, A.; Sapsis, T.P.; Colonius, T. A Gaussian moment method and its augmentation via LSTM recurrent neural networks for the statistics of cavitating bubble populations. Int. J. Multiph. Flow 2020, 127, 103262. [Google Scholar] [CrossRef]
  33. Qu, T.; Luo, J.; Xu, W.L.; Li, J.; Fu, G.H.; Ma, Y.Q.; Zhao, Z.Q. Experimental study on the collapse behavior of cavitation bubbles under low ambient pressure conditions. Ultrason. Sonochem. 2025, 114, 107255. [Google Scholar] [CrossRef]
  34. Ding, Q.M.; Li, X.M.; Cui, Y.Y.; Yang, S.G.; Li, L.F. Dynamic response of the elastic boundary near a single cavitation bubble. Int. J. Multiph. Flow 2024, 177, 104884. [Google Scholar] [CrossRef]
  35. Han, D.W.; Park, S.H.; Duy-Trong, N.; Nguyen, V.; Sagar, H.; El Moctar, O.; Phan, T.H.; Park, W.G. Dynamics of a single cavitation bubble near a cylindrical blind hole. Ocean Eng. 2024, 311, 118890. [Google Scholar] [CrossRef]
  36. Zhu, Y.C.; Ma, X.J.; Zhou, R.Q.; Sun, Y.W.; Zhang, M.D. Bubble collapse dynamics near the composite walls: Progress and challenges. Ultrason. Sonochem. 2025, 116, 107298. [Google Scholar] [CrossRef]
  37. Wei, A.B.; Yu, L.Y.; Gao, R.; Zhang, W.; Zhang, X.B. Unsteady cloud cavitation mechanisms of liquid nitrogen in convergent-divergent nozzle. Phys. Fluids 2021, 33, 092116. [Google Scholar] [CrossRef]
  38. Park, S.H.; Phan, T.H.; Park, W.G. Numerical investigation of laser-induced cavitation bubble dynamics near a rigid surface based on three-dimensional fully compressible model. Int. J. Heat Mass Transf. 2022, 191, 122853. [Google Scholar] [CrossRef]
  39. Li, M.J.; Huang, Z.H.; Yang, X.J. Collapsing dynamics and microjet formation of laser-induced cavitation bubble near corrugated solid wall. Appl. Phys. A 2025, 131, 242. [Google Scholar] [CrossRef]
  40. Li, J.; Zhou, M.L.; Luo, J.; Xu, W.L.; Zhai, Y.W.; Qu, T.; Zou, L.T. Collapsing behavior of spark-induced cavitation bubble in rigid tube. Ultrason. Sonochem. 2024, 103, 106791. [Google Scholar] [CrossRef]
  41. Zou, L.T.; Luo, J.; Xu, W.L.; Zhai, Y.W.; Li, J.; Qu, T.; Fu, G.H. Experimental study on influence of particle shape on shockwave from collapse of cavitation bubble. Ultrason. Sonochem. 2023, 101, 106693. [Google Scholar] [CrossRef] [PubMed]
  42. Zhou, Y.F.; Wang, X.T. Effect of pulse duration and pulse repetition frequency of cavitation histotripsy on erosion at the surface of soft material. Ultrasonics 2018, 84, 296–309. [Google Scholar] [CrossRef]
  43. Li, Y.L.; Tan, C.J.; Yan, B.; Han, T.; Yu, A.C.H.; Qin, P. Evaluation of the properties of daughter bubbles generated by inertial cavitation of preformed microbubbles. Ultrason. Sonochem. 2021, 72, 105400. [Google Scholar] [CrossRef]
  44. Gawandalkar, U.U.; Poelma, C. The characteristics of bubbly shock waves in a cavitating axisymmetric venturi via time-resolved X-ray densitometry. J. Fluid Mech. 2024, 988, A34. [Google Scholar] [CrossRef]
  45. Suslick, K.S.; Flannigan, D.J. Inside a collapsing bubble: Sonoluminescence and the conditions during cavitation. Annu. Rev. Phys. Chem. 2008, 59, 659–683. [Google Scholar] [CrossRef]
  46. Brenner, M.P.; Hilgenfeldt, S.; Lohse, D. Single-bubble sonoluminescence. Rev. Mod. Phys. 2002, 74, 425–484. [Google Scholar] [CrossRef]
  47. Huang, Y.; Zhang, L.; Chen, J.; Zhu, X.; Liu, Z.; Yan, K. Experimental observation of the luminescence flash at the collapse phase of a bubble produced by pulsed discharge in water. Appl. Phys. Lett. 2015, 107, 184104. [Google Scholar] [CrossRef]
  48. Li, H.L.; Zhang, J.Y.; Wang, L.K.; Li, B.; Zhang, Z.F.; Zhang, G.Y.; Zong, Z. Bubble dynamics and structural damage caused by underwater explosion. Int. J. Mech. Sci. 2025, 297, 110387. [Google Scholar] [CrossRef]
  49. Zhang, T.; Wang, X.; Hu, J.; Ye, J.; Wu, Y.; Wen, X. Experimental study on erosion characteristics of salt rock by water jet under low pressure. J. Energy Storage 2022, 55, 105690. [Google Scholar] [CrossRef]
  50. Yuan, G.; Song, J.; Yang, Y.; Ni, B.; Yang, D.; Xue, Y. Experimental study on icebreaking mechanism and failure modes of submerged high-pressure water jets. Ocean Eng. 2025, 323, 120586. [Google Scholar] [CrossRef]
  51. Priyadarshi, A.; Khavari, M.; Subroto, T.; Conte, M.; Prentice, P.; Pericleous, K.; Eskin, D.; Durodola, J.; Tzanakis, I. On the governing fragmentation mechanism of primary intermetallics by induced cavitation. Ultrason. Sonochem. 2021, 70, 105260. [Google Scholar] [CrossRef]
  52. Gluzman, I.; Pelster, A.; Waldrop, M.; Thomas, F.O. On cavitation in the radial flow of a thin lubricating film between two overlying disks. Phys. Fluids 2023, 35, 023302. [Google Scholar] [CrossRef]
  53. Golshaei, R.; Heyat Davoudian, S.; Toyran, E.; Kestek, E.; Kaur, A.; Priyadarshi, A.; Koşar, A.; Tzanakis, I.; Ghorbani, M. Novel concept of hydroxyl radical generation in hydrodynamic cavitation on a chip. Chem. Eng. J. 2025, 517, 164356. [Google Scholar] [CrossRef]
  54. Morton, J.A.; Khavari, M.; Priyadarshi, A.; Kaur, A.; Grobert, N.; Mi, J.W.; Porfyrakis, K.; Prentice, P.; Eskin, D.G.; Tzanakis, I. Dual frequency ultrasonic cavitation in various liquids: High-speed imaging and acoustic pressure measurements. Phys. Fluids 2023, 35, 017135. [Google Scholar] [CrossRef]
  55. Shi, H.; Zhang, H.; Geng, L.; Qu, S.; Wang, X.; Nikrityuk, P.A. Dynamic behaviors of cavitation bubbles near biomimetic surfaces: A numerical study. Ocean Eng. 2024, 292, 116628. [Google Scholar] [CrossRef]
  56. Xiao, Z.; Wang, J.; Huang, R.; Huang, J.; Zhi, Y.; Wang, Y.; Wang, J. Experimental and numerical analysis of cavitation flow characteristics on surface-piercing swept hydrofoils. Ocean Eng. 2025, 335, 121616. [Google Scholar] [CrossRef]
  57. Tian, B.C.; Huang, B.; Li, L.M.; Wu, Y. Eulerian-Lagrangian multiscale numerical analysis of multimodal partial shedding dynamics. Int. J. Multiph. Flow 2024, 178, 104876. [Google Scholar] [CrossRef]
  58. Ren, Z.B.; Xu, P.; Han, H.; Ohl, C.D.; Zuo, Z.G.; Liu, S.H. Removal of surface-attached micro- and nanobubbles by ultrasonic cavitation in microfluidics. Ultrason. Sonochem. 2024, 109, 107011. [Google Scholar] [CrossRef]
  59. Luo, J.; Fu, G.H.; Xu, W.L.; Zhai, Y.W.; Bai, L.X.; Li, J.; Qu, T. Experimental study on attenuation effect of liquid viscosity on shockwaves of cavitation bubbles collapse. Ultrason. Sonochem. 2024, 111, 107063. [Google Scholar] [CrossRef]
  60. Li, H.; Xu, P.; Zhang, L.; Jiang, H.; Chen, Y.; Sun, D. Numerical and experimental investigation on rock breaking mechanism and performance of high-pressure energy-gathering water jet. Eng. Fract. Mech. 2025, 320, 111050. [Google Scholar] [CrossRef]
  61. Shangguan, J.; Ge, Z.; Deng, Q.; Cui, Y.; Yao, Z. Fluid evolution and fragmentation characteristics under high pressure water jet impact on thermal rock. Int. J. Min. Sci. Technol. 2025, 35, 483–497. [Google Scholar] [CrossRef]
  62. Guan, J.; Tao, J. Distinct lifetime scaling laws of turbulent puff in duct flow. Phys. Fluids 2025, 37, 081703. [Google Scholar] [CrossRef]
  63. Jin, P.; Tan, Z.; Xie, G.; Jian, Y.; Zheng, J.; Sun, Z.; Zhang, Y. A visualization study on capillary-driven liquid film boiling heat transfer. Int. Commun. Heat Mass Transf. 2025, 168, 109493. [Google Scholar] [CrossRef]
  64. Yu, Y.; Fan, D.W.; Hu, Y.B.; Cheng, Z.P.; Su, Z.; Chen, S.; Pan, C. Characterization of the kinematic features of cavitation bubble-induced jet flow. Int. J. Heat Mass Transf. 2025, 242, 126782. [Google Scholar] [CrossRef]
  65. Morton, J.A.; Khavari, M.; Qin, L.; Maciejewska, B.M.; Tyurnina, A.; Grobert, N.; Eskin, D.G.; Mi, J.W.; Porfyrakis, K.; Prentice, P.; et al. New insights into sono-exfoliation mechanisms of graphite: In situ high-speed imaging studies and acoustic measurements. Mater. Today 2021, 49, 10–22. [Google Scholar] [CrossRef]
  66. Yamamoto, S.; Shimazaki, T.; Franco-Gómez, A.; Ichihara, S.; Yee, J.; Tagawa, Y. Contactless pressure measurement of an underwater shock wave in a microtube using a high-resolution background-oriented schlieren technique. Exp. Fluids 2022, 63, 142. [Google Scholar] [CrossRef]
  67. Wei, L.; Liu, S.; Dong, F. Mechanism study of micro-jet generation induced by acoustic cavitation. J. Hydrodyn. 2024, 36, 1104–1117. [Google Scholar] [CrossRef]
  68. Chen, J.; Geng, J.W.; Li, Y.G.; Xia, P.K.; Li, X.F.; Wang, F.M.; Chen, D.; Wang, M.L.; Wang, H.W. Investigation of incipient cavitation in various liquids based on PIV quantification and numerical simulations. Sci. Rep. 2025, 15, 9390. [Google Scholar] [CrossRef]
  69. Koncoski, J.J.; Yang, X.I.A.; Kunz, R.F.; Nickels, A.S.; Devilbiss, D.W.; Harris, J.R. Experimental characterization of the flowfield and cavitation physics of a tip-loaded hydrofoil. Phys. Fluids 2023, 35, 053336. [Google Scholar] [CrossRef]
  70. Byun, H.; Bae, J.; Yoon, T.; Yang, I.; Lee, S.; Carter, C.D.; Do, H. Velocity measurements in a supersonic wind tunnel with a novel calibration-free seedless velocimetry utilizing laser-induced shockwaves and a double-line probe system. Int. J. Heat Mass Transf. 2022, 184, 122246. [Google Scholar] [CrossRef]
  71. Ghorbani, M.; Alcan, G.; Unel, M.; Gozuacik, D.; Ekici, S.; Uvet, H.; Sabanovic, A.; Kosar, A. Visualization of microscale cavitating flow regimes via particle shadow sizing imaging and vision based estimation of the cone angle. Exp. Therm. Fluid Sci. 2016, 78, 322–333. [Google Scholar] [CrossRef]
  72. Ge, M.M.; Zhang, G.J.; Petkovsek, M.; Long, K.P.; Coutier-Delgosha, O. Intensity and regimes changing of hydrodynamic cavitation considering temperature effects. J. Clean. Prod. 2022, 338, 130470. [Google Scholar] [CrossRef]
  73. Bawiec, C.R.; Rosnitskiy, P.B.; Peek, A.T.; Maxwell, A.D.; Kreider, W.; Ter Haar, G.R.; Sapozhnikov, O.A.; Khokhlova, V.A.; Khokhlova, T.D. Inertial Cavitation Behaviors Induced by Nonlinear Focused Ultrasound Pulses. IEEE Trans. Ultrason. Ferroelectr. Freq. Control 2021, 68, 2884–2895. [Google Scholar] [CrossRef]
  74. Zhou, Z.T.; Liu, J.H.; Wang, H.K.; Zhou, X. Experimental and numerical investigation on cavitation collapse reloading and bubble evolution for close-in and contact underwater explosion. Ocean Eng. 2024, 293, 116549. [Google Scholar] [CrossRef]
  75. Reuter, F.; Deiter, C.; Ohl, C.D. Cavitation erosion by shockwave self-focusing of a single bubble. Ultrason. Sonochem. 2022, 90, 106131. [Google Scholar] [CrossRef]
  76. Johansen, K.; Song, J.H.; Johnston, K.; Prentice, P. Deconvolution of acoustically detected bubble-collapse shock waves. Ultrasonics 2017, 73, 144–153. [Google Scholar] [CrossRef]
  77. Schreiner, F.; Paepenmöller, S.; Skoda, R. 3D flow simulations and pressure measurements for the evaluation of cavitation dynamics and flow aggressiveness in ultrasonic erosion devices with varying gap widths. Ultrason. Sonochem. 2020, 67, 105091. [Google Scholar] [CrossRef] [PubMed]
  78. Dai, C.; Hu, S.Y.; Zhang, Y.H.; Chen, Z.Y.; Dong, L. Cavitation state identification of centrifugal pump based on CEEMD- DRSN. Nucl. Eng. Technol. 2023, 55, 1507–1517. [Google Scholar] [CrossRef]
  79. Zhou, P.J.; Zeng, W.T.; Zhang, W.W.; Zhou, C.G.; Yao, Z.F. Multi-cavitation states identification of a sewage pump using CEEMDAN and BOA-SVM. J. Water Process Eng. 2024, 61, 105299. [Google Scholar] [CrossRef]
  80. Li, G.; Sun, H.; He, J.; Ding, X.; Zhu, W.; Qin, C.; Zhang, X.; Zhou, X.; Yang, B.; Guo, Y. Deep learning, numerical, and experimental methods to reveal hydrodynamics performance and cavitation development in centrifugal pump. Expert Syst. Appl. 2024, 237, 121604. [Google Scholar] [CrossRef]
  81. Al-Obaidi, A.R. Experimental novel investigation of diagnostics cavitation in axial pump using vibration and acoustic measurements based on CWT and FFT analyses approaches. Appl. Acoust. 2025, 236, 110758. [Google Scholar] [CrossRef]
  82. Li, F.; Wang, C.G.; Liu, Z.L.; Huang, Y.Y.; Wang, T.Z. Sparrow search algorithm-optimized variational mode decomposition-based multiscale convolutional network for cavitation diagnosis of hydro turbines. Ocean Eng. 2024, 312, 119055. [Google Scholar] [CrossRef]
  83. Sha, Y.; Faber, J.; Gou, S.P.; Liu, B.; Li, W.; Schramm, S.; Stoecker, H.; Steckenreiter, T.; Vnucec, D.; Wetzstein, N.; et al. A multi-task learning for cavitation detection and cavitation intensity recognition of valve acoustic signals. Eng. Appl. Artif. Intell. 2022, 113, 104904. [Google Scholar] [CrossRef]
  84. Tiwari, R.; Bordoloi, D.J.; Dewangan, A. Blockage and cavitation detection in centrifugal pumps from dynamic pressure signal using deep learning algorithm. Measurement 2021, 173, 108676. [Google Scholar] [CrossRef]
  85. Wang, R.Y.; Xu, Y.Z.; Mu, W.K.; Chen, Y.C.; Jiao, Z.X. Cavitation intensity recognition for axial piston pump based on transient flow rate measurement and improved transfer learning method. Mech. Syst. Signal Proc. 2025, 232, 112667. [Google Scholar] [CrossRef]
  86. Chao, Q.; Tao, J.F.; Wei, X.L.; Wang, Y.H.; Meng, L.H.; Liu, C.L. Cavitation intensity recognition for high-speed axial piston pumps using 1-D convolutional neural networks with multi-channel inputs of vibration signals. Alex. Eng. J. 2020, 59, 4463–4473. [Google Scholar] [CrossRef]
  87. Choi, Y.S.; Hong, S.Y.; Song, J.H. Composite propeller design optimization for cavitation minimization using deep learning-based objective parameter prediction model. Ocean Eng. 2023, 287, 115760. [Google Scholar] [CrossRef]
  88. Zhang, Q.; Lin, Y.X.; el Moctar, O.; Jiang, C.Q. Data-driven identification of cavitation regimes using acoustic signatures of hydrofoil. Phys. Fluids 2025, 37, 047147. [Google Scholar] [CrossRef]
  89. Oliveira e Souza, A.C.; de Souza, M.B., Jr.; Vasconcelos da Silva, F.V. Development of a CNN-based fault detection system for a real water injection centrifugal pump. Expert Syst. Appl. 2024, 244, 122947. [Google Scholar] [CrossRef]
  90. Qiu, C.C.; Huang, Q.G.; Pan, G.; He, X. Multi-path deep learning framework on discrete pressure points to predict velocity field of pump-jet propulsor. Appl. Ocean Res. 2022, 123, 103173. [Google Scholar] [CrossRef]
  91. Zheng, X.; Yang, C.; Zeng, L.; He, Y.; Tian, Y.; Zhang, Y.; Li, J.; Zhang, Y. Intensity recognition of vortex ropes in draft tube of a prototype pump turbine using an optimized CNN-BiLSTM framework with multi-head self-attention mechanism. J. Energy Storage 2025, 106, 114910. [Google Scholar] [CrossRef]
  92. Khavari, M.; Priyadarshi, A.; Morton, J.; Porfyrakis, K.; Pericleous, K.; Eskin, D.; Tzanakis, I. Cavitation-induced shock wave behaviour in different liquids. Ultrason. Sonochem. 2023, 94, 106328. [Google Scholar] [CrossRef]
  93. Xu, Y.; Sha, Y.; Wang, C.; Cui, H.; Wei, Y. Reconstructing multiphase flow fields with limited pressure observations based on an improved transformer model. Ocean Eng. 2024, 313, 119386. [Google Scholar] [CrossRef]
  94. Gatica, T.; van ‘t Wout, E.; Haqshenas, R. Classifying acoustic cavitation with machine learning trained on multiple physical models. Phys. Fluids 2025, 37, 037116. [Google Scholar] [CrossRef]
  95. La Rosa, B.; Blasilli, G.; Bourqui, R.; Auber, D.; Santucci, G.; Capobianco, R.; Bertini, E.; Giot, R.; Angelini, M. State of the Art of Visual Analytics for eXplainable Deep Learning. Comput. Graph. Forum 2023, 42, 319–355. [Google Scholar] [CrossRef]
  96. Diaz-Rodriguez, N.; Lamas, A.; Sanchez, J.; Franchi, G.; Donadello, I.; Tabik, S.; Filliat, D.; Cruz, P.; Montes, R.; Herrera, F. EXplainable Neural-Symbolic Learning (X-NeSyL) methodology to fuse deep learning representations with expert knowledge graphs: The MonuMAI cultural heritage use case. Inf. Fusion 2022, 79, 58–83. [Google Scholar] [CrossRef]
  97. Xu, S.; Dai, Y.; Yan, C.; Sun, Z.; Huang, R.; Guo, D.; Yang, G. On the preprocessing of physics-informed neural networks: How to better utilize data in fluid mechanics. J. Comput. Phys. 2025, 528, 113837. [Google Scholar] [CrossRef]
  98. Bai, J.; Wang, Y.; Jeong, H.; Chu, S.; Wang, Q.; Alzubaidi, L.; Zhuang, X.; Rabczuk, T.; Xie, Y.M.; Feng, X.-Q.; et al. Towards the future of physics- and data-guided AI frameworks in computational mechanics. Acta Mech. Sin. 2025, 41, 225340. [Google Scholar] [CrossRef]
  99. Tan, Z.; Jin, P.; Chen, S.; Xie, G.; Jian, Y.; Zheng, J.; Sun, Z.; Zhang, Y. Vapor chambers with hierarchical wick structures: Thermal performance and liquid film boiling visualization. Appl. Therm. Eng. 2025, 280, 128165. [Google Scholar] [CrossRef]
  100. Liu, Y.Q.; Wu, Q.; Zhang, H.Z.; Huang, B. Cavity dynamics and vibrations of a flexible hydrofoil in the cavitating flow. Phys. Rev. Fluids 2024, 9, 014304. [Google Scholar] [CrossRef]
  101. Bao, H.Z.; Zhang, H.C.; Gao, L.; Tang, M.; Zhang, C.; Lu, J. Experimental investigations of three laser-induced synchronized bubbles. Ultrason. Sonochem. 2021, 71, 105375. [Google Scholar] [CrossRef]
  102. Liu, Y.Y.; Wang, Y.Z.; An, K. A feature extraction method for hydrofoil attached cavitation based on deep learning image semantic segmentation algorithm. Sci. Rep. 2025, 15, 4415. [Google Scholar] [CrossRef]
  103. Liu, Q.T.; Xie, C.H.; Cheng, B.X. Butterfly valve erosion prediction based on LSTM network. Flow Meas. Instrum. 2024, 98, 102652. [Google Scholar] [CrossRef]
  104. Tong, Z.; Liu, H.; Cao, X.E.; Westerdahld, D.; Jin, X. Cavitation diagnosis for water distribution pumps: An early-stage approach combing vibration signal-based neural network with high-speed photography. Sustain. Energy Technol. Assess. 2023, 55, 102919. [Google Scholar] [CrossRef]
  105. Prasshanth, C.V.; Venkatesh, S.N.; Mahanta, T.K.; Sakthivel, N.R.; Sugumaran, V. Fault diagnosis of monoblock centrifugal pumps using pre-trained deep learning models and scalogram images. Eng. Appl. Artif. Intell. 2024, 136, 109022. [Google Scholar] [CrossRef]
  106. Esplin, J.J.; Kim, B.J.; Kinzel, M.P.; Culver, R.L. Measurement and quantification of acoustic bulk cavitation extent. Exp. Fluids 2021, 62, 158. [Google Scholar] [CrossRef]
  107. Long, K.; Coutier-Delgosha, O.; Bayeul-Laine, A.-C. Experimental investigation of three-dimensional effects in cavitating flows with time-resolved stereo particle image velocimetry. Phys. Fluids 2023, 35, 023324. [Google Scholar] [CrossRef]
  108. Zhang, H.; Liu, Y.-q.; Wang, B.-l. On the three-dimensionality and spanwise variations of cloud cavitation: A combined numerical and experimental study. J. Hydrodyn. 2025, 37, 437–448. [Google Scholar] [CrossRef]
  109. Luo, J.; Xu, W.L.; Khoo, B.C. Stratification effect of air bubble on the shock wave from the collapse of cavitation bubble. J. Fluid Mech. 2021, 919, A16. [Google Scholar] [CrossRef]
  110. Zubalic, E.; Vella, D.; Babnik, A.; Jezersek, M. Interferometric Fiber Optic Probe for Measurements of Cavitation Bubble Expansion Velocity and Bubble Oscillation Time. Sensors 2023, 23, 771. [Google Scholar] [CrossRef] [PubMed]
  111. Xu, H.; Wang, M.; Zhou, Z.; Sun, T.; Zhang, G. Unsteady Flow and Loading Characteristics of Rotating Spheres During Underwater Ejection. J. Mar. Sci. Eng. 2025, 13, 2331. [Google Scholar] [CrossRef]
  112. Koue, J.; Abe, A. Cavitation-Jet-Induced Erosion Controlled by Injection Angle and Jet Morphology. J. Mar. Sci. Eng. 2025, 13, 1415. [Google Scholar] [CrossRef]
Figure 1. Taxonomy of cavitating impingement loading mechanisms mapped by temporal duration and spatial extent.
Jmse 14 01111 g001
Figure 2. Two representative collapse behaviors used to illustrate mechanism separability: (a) collapse-associated multiple shockwave formation [20]. Subfigures (1–12) are time-ordered frames showing the evolution of one bubble-collapse event, from late-stage contraction to collapse, rebound, and multiple shockwave emission. (b) near-wall asymmetric collapse with directed microjet development under low-ambient-pressure conditions [33]. Subfigures (a1–e6) are organized as five rows of representative cases (a–e) and six sequential frames in each row (1–6), illustrating the progression from the initial near-wall bubble configuration to asymmetric collapse and directed microjet development.
Jmse 14 01111 g002
Figure 3. Multi-scenario visual comparison of cavitation-mechanism transition. (ac) Time-resolved X-ray density fields with synchronized pressure responses showing the condensation-shockwave and re-entrant-flow-controlled shedding variations under different cavitation numbers in room-temperature water within a Venturi tube [44]. (d) High-speed image sequences comparing the shedding evolution in liquid nitrogen under different cavitation numbers in a convergent-divergent nozzle. (e) Corresponding nozzle geometry and measurement-layout schematic used to locate the throat, divergent section, and observation positions for the image sequence in panel (d) [37].
Jmse 14 01111 g003
Figure 4. Comparison of morphologies of cavitation bubble clusters under different ultrasonic excitation conditions in deionized water (DIW) [54]. (a) High-frequency (HF, 1174 kHz) condition showing pressure nodes and antinodes. (b) The same HF condition recorded at a lower frame rate, showing the motion of HF-induced bubbles. (c) Low-frequency (LF, 24 kHz) condition during the formation of a bubble cloud. (d) The same LF bubble cloud just before collapse, 70 μs after (c). (e) Dual-frequency (DF, 24 + 1174 kHz) condition during the formation of a bubble cloud. (f) The same DF bubble cloud just before collapse, 70 μs after (e). Scale bars = 1 mm.
Jmse 14 01111 g004
Figure 5. Collapse process and multiple-shockwave generation mechanism of laser-induced cavitation bubbles near a rigid wall with a gas-containing hole [23]. (a) High-speed streak imaging of bubble morphology evolution. Subfigures (a–x) are consecutive frames of a single near-wall collapse–rebound sequence, showing pre-collapse deformation, wall-directed microjet formation, ring-shaped collapse, rebound, reflected flow away from the wall, and subsequent re-expansion toward the wall. (b) Selected frames illustrating the generation of multiple collapse shockwaves. The bubble first becomes fully concave and ring-like; collapse initiating at a point on the ring generates torus collapse shockwaves (label 1); jet penetration through the lower bubble surface generates a jet-impact shockwave (label 2); continued asymmetric ring collapse produces additional torus collapse shockwaves, whose fronts later merge and propagate outward.
Jmse 14 01111 g005
Figure 6. Comparison of cavitation morphologies and PIV velocity fields of different liquids near cavitation threshold. (ac) High-speed imaging: ethanol forms a conical cavitation structure (CBS) that extends downward; deionized water presents lightning-like/firework-like cavitation clouds, which converge in the dual-sound-source interference region; glycerol only exhibits grape-like clusters/vortex-like structures near the transducer end face, with small spatial scale and slow evolution. (df) Corresponding PIV velocity fields, showing the significant modulation of liquid physical properties on flow-field intensity and structural topology [68].
Jmse 14 01111 g006
Figure 7. Comparison of synchronous imaging and PVDF signals for the near-wall collapse of tandem cavitation bubbles. (a) Force-time histories of the AA-sized bubble pair and the corresponding two single-bubble cases. (b) High-speed imaging showing the morphological evolution of the AA pair [7].
Jmse 14 01111 g007
Figure 8. Side-by-side comparison of decomposition features and impact prototypes. (a) CEEMDAN time-domain decomposition of sewage pump vibration signals under NPSH3% operating condition [79]; (b) Comparison of PVDF sensor outputs for a BC tandem-bubble pair and the corresponding single-bubble cases near a solid wall [7]; Roman numerals I–V indicate the successive characteristic impact peaks in the BC-pair waveform, arising from the coupled first and second collapse events of the lower near-wall bubble and the upper bubble. (c) Correlation coefficient variations of original IMF signals with order [79].
Jmse 14 01111 g008
Figure 9. Image-processing and multi-source verification routes for cavitation mechanism decoupling. (a) Shadowgraph observation of the dynamic evolution of a laser-induced cavitation bubble and its bubble-induced jet [64]; (b) X-ray density inversion and cavitation void-fraction field of backward-facing-step cavitating flow [21]; (c) Proper Orthogonal Decomposition (POD) modal decomposition of hydrofoil cavitating flow field [100]; (d) synchronized dynamic-pressure signal and X-ray snapshots for a representative cavitation-shedding event [21]; (e) comparison of cavitation morphologies of rigid and flexible hydrofoils [100].
Jmse 14 01111 g009
Figure 10. Erosion-test images of cavitating jets at θ = 45°, reproduced from [112]. In each case, the processed image is used to highlight the eroded region. (a) Type No. 1, showing concave erosion in the direct-impact region. (b) Type No. 2, showing through-hole formation in the aluminum plate. (c) Type No. 3 with jet injection manner 1 (see Figure 2c in Ref. [112]). (d) Type No. 3 with jet injection manner 2 (see Figure 2d in Ref. [112]), where direct jet interference enhances the erosion pattern. (e) Type No. 4, showing localized direct-impact erosion with no clear downstream erosion.
Jmse 14 01111 g010
Table 1. Operational framework of mechanism decoupling in cavitating jet impingement.
Decoupling LayerCore QuestionWhat Counts as EvidenceComparison Criterion
Mechanism identificationWhich mechanism is active?Bubble/jet/cloud morphology, pulse waveform, and spectral signatureSpatiotemporal distinctiveness of the event [23,24,25,26]
Mechanism attributionWhy is a measured feature assigned to a given mechanism?Time-locked correspondence among imaging, pressure, acoustic, or vibration dataTemporal coincidence and cross-validation across modalities [22,27,28]
Contribution quantificationHow much does each mechanism contribute under a stated response metric?Metric-specific quantities defined on a common basis, such as energy fraction, normalized peak pressure at a stated reference distance and bandwidth, or a stated damage metric, including erosion rate, pit density, or mass-loss rateEnergy dominance, peak-pressure dominance, and damage dominance should be evaluated separately [23,29,30,31]
Table 2. Representative quantitative results relevant to mechanism comparison and decoupling.
Study ContextNormalized/Governing DescriptorReported Quantitative ResultResponse Metric Actually ComparedImplication for Decoupling
Near-wall single-bubble collapse with a gas-containing hole [23]Near-wall geometry; bubble energy as normalization basisCollapse shockwave energy is about 70–80% of bubble energyEnergy fractionSupports energy dominance of shockwaves under this specific near-wall condition and normalization basis
Jetting bubble near a rigid wall [29] γ = d / R max , Re = ρU0Rmax/μ, with U0 = (P/ρ)1/2, viscosityEmpirical fit for the maximum inward wall shear stress near a rigid wall: τmn Re0.35 = −70γ + 110, with τmn in kPa, for 0.5 < γ < 1.4 and 0.01 ≤ μ ≤ 0.1 Pa·s; for water (μ = 10−3 Pa·s), τmn Re0.35 = −70γ + 100Local wall shearShows that microjet-related loading is better compared through normalized stand-off distance and wall-shear response than through absolute wall distance alone
Liquid-nitrogen convergent-divergent nozzle [37]Cavitation number σ Dominant shedding shifts from re-entrant jet at σ = 0.497 to condensation shock at σ = 0.386Regime transition/shedding mechanismShows that cavitation number is a primary regime parameter for cloud-cavitation transition rather than a direct dominance metric by itself
Single-bubble vs bubble-cloud collapse [51]Measurement distance and collapse modeSingle-bubble shock peaks: 20–40 MPa; bubble-cloud overall collapse: about 1.6 MPaPeak pressureDemonstrates that peak-pressure dominance differs from energy or damage dominance and must be interpreted together with measurement distance and collapse mode
Cavitation-induced pump vibration [31]Pump operating condition; frequency band4–10 kHz identified as representative cavitation-induced vibration bandCumulative vibration/fatigue-related responseIndicates that bubble-cloud effects may be better tracked by frequency-band response than by single-pulse peak value, although this remains a cumulative-response proxy unless direct damage data are available
Table 3. Comparative framework of major diagnostic techniques for mechanism decoupling in cavitating jet impingement.
Technique CategoryMain Observable/CapabilityResolution or Bandwidth CharacteristicMost Suitable forMain Limitations and Uncertainty SourcesRecommended Role in Decoupling
High-speed optical imaging [23,24]Bubble morphology, collapse sequence, jet initiation, rebound behaviorNanosecond-scale temporal resolution and micrometer-scale spatial resolution in representative setups; no direct pressure bandwidthSingle-bubble collapse, microjet formation, near-wall event timing, morphology-based mechanism identificationUsually limited to transparent media; mostly 2D projection; cannot directly measure pressure or wall stress; field-of-view and synchronization constraintsPrimary tool for mechanism identification and event timing, especially when synchronized with pressure data
X-ray/BOS-based optical diagnostics [25,26,66]Hidden or near-wall bubble shape, shock-front position, contactless pressure-field informationHigh spatial contrast; suitable for optically difficult configurations; pressure-field reconstruction possible in BOS; setup complexity is highNear-wall collapse morphology, shock-front tracking, optically inaccessible or strongly scattering configurationsSpecialized facility or calibration requirement; limited accessibility; synchronization complexity; often narrower field or lower flexibility than standard optical imagingComplementary imaging route when conventional high-speed imaging is insufficient
PIV/PDA/stereo PIV [68,69]Velocity field, vorticity, entrainment, turbulent structure, flow-response quantificationQuantitative spatial mapping of flow response; 2D or 2D3C field information; no intrinsic pressure bandwidthJet development, vortex–cavitation interaction, liquid-property effects, cloud-flow structure, system-scale flow comparisonCannot uniquely assign mechanism from velocity field alone; seeding visibility, tracer bias, field of view, and synchronization dependenceQuantify flow response and support attribution, but should not be used alone for causal mechanism assignment
PVDF/hydrophone/acoustic/vibration measurements [8,25,31,66]Transient pressure waveform, spectral signature, local wall-impact pulse, system-scale vibration responseNanosecond-scale temporal response for sharp pulses; MHz-range frequency content for single-bubble shock events; strong time-domain sensitivity but limited spatial selectivityShockwave loading, wall-impact pulses, cumulative vibration or fatigue-related response, pressure-side comparison of mechanismsStrong dependence on sensor location; bandwidth ceiling, attenuation, electromagnetic noise, inverse reconstruction uncertainty, and pointwise sampling biasPrimary route for transient loading quantification and pressure-side validation
Disclaimer/Publisher’s Note: The statements, opinions and data contained in all publications are solely those of the individual author(s) and contributor(s) and not of MDPI and/or the editor(s). MDPI and/or the editor(s) disclaim responsibility for any injury to people or property resulting from any ideas, methods, instructions or products referred to in the content.