Review

An Overview of Quantum Detection Methods for Shaft-Rate Electric Fields

College of Electrical Engineering, Naval University of Engineering, Wuhan 430033, China
*
Authors to whom correspondence should be addressed.
J. Mar. Sci. Eng. 2026, 14(12), 1110; https://doi.org/10.3390/jmse14121110
Submission received: 23 April 2026 / Revised: 25 May 2026 / Accepted: 30 May 2026 / Published: 16 June 2026
(This article belongs to the Section Ocean Engineering)

Abstract

A shaft-rate electric field (SREF) is a weak characteristic signal generated by moving ships in the ocean, serving as a key physical feature in underwater target detection and identification. Based on the generation mechanism of shaft-frequency electric fields, the research progress of traditional detection and extraction methods was systematically reviewed. On this basis, the feasible paths for applying quantum technology in SREF detection were further elaborated by integrating the core characteristics of quantum technology. Results indicated that Rydberg atoms and diamond nitrogen-vacancy centers demonstrate promising feasibility for detecting SREFs, exhibiting significant advantages over conventional methods in sensitivity and precision. Meanwhile, addressing the detection frequency and measurement intensity constituted a crucial breakthrough for the development of quantum technology-based SREF detection. This study aims to provide theoretical foundations and technical feasibility analysis for the quantum detection of SREFs, promoting the paradigm shift in this field from traditional methods to highly sensitive quantum sensing.

1. Introduction

Currently, the bottleneck of traditional acoustic detection is being faced by underwater target-detection technology. With the rapid development of ship low-detectability technology and acoustic noise-reduction technology, a single acoustic method can no longer meet the requirements for precise detection, identification, and positioning of underwater targets in complex marine environments [1]. Among various non-acoustic physical fields, the ship’s electric field is recognized as a core carrier, reflecting vessel characteristics due to its strong correlation with ship structure and propulsion systems. As a key component of the ship’s electric field, the shaft-rate electric field (SREF) has further emerged as a research focus in underwater detection, thanks to its unique advantages such as distinct signal spectrum features, long propagation distance, and slow attenuation rate [2]. The SREF holds significant application prospects, particularly in underwater ship detection and positioning. In the field of underwater detection and identification, non-acoustic approaches can be adopted, allowing detection systems to break away from reliance on sonar and offering an entirely new sensing dimension. Moreover, for underwater navigation and countermeasures, the development of advanced electric-field-induction trigger devices, electric-field interference techniques, and electric-field protection technologies worldwide can benefit from relevant SREF research [3]. Therefore, further investigation of the SREF is of great importance for safeguarding maritime security.
However, the marine environment is complex, with high noise levels, and how to effectively extract the SREF signals in low signal-to-noise ratio (SNR) environments remains a challenge [4]. Against this backdrop, the advantages and disadvantages of traditional methods and quantum methods in SREF detection exhibit significant differences. Traditional electric-field measurement technologies, such as measurement systems based on energy permutation entropy, may lack sufficient sensitivity and resolution for electric field signals in complex marine environments. Conventional line-spectrum enhancement methods, such as the adaptive line enhancer (ALE) algorithm based on the least mean square (LMS) principle, see their effectiveness greatly diminished under low-SNR conditions. These methods have poor robustness against noise and interference, making it difficult to effectively extract target signals from strong noise backgrounds. In contrast, quantum sensing enables the measurement of physical quantities with extremely high precision. Electric-field-sensing technology based on Rydberg atoms leverages the high sensitivity of Rydberg atoms to external electromagnetic fields, achieving highly sensitive detection of electric fields [5]. While traditional line-spectrum enhancement methods perform poorly at low SNR, quantum sensing can extract weak signals from noise by utilizing the quantum coherence of atoms or solid-state defects, thereby improving SNR and anti-interference capabilities [6]. Quantum sensors demonstrate tremendous potential in future SREF detection due to their inherent high sensitivity, high precision, and miniaturization capability.

2. Generation and Principle of the SREF

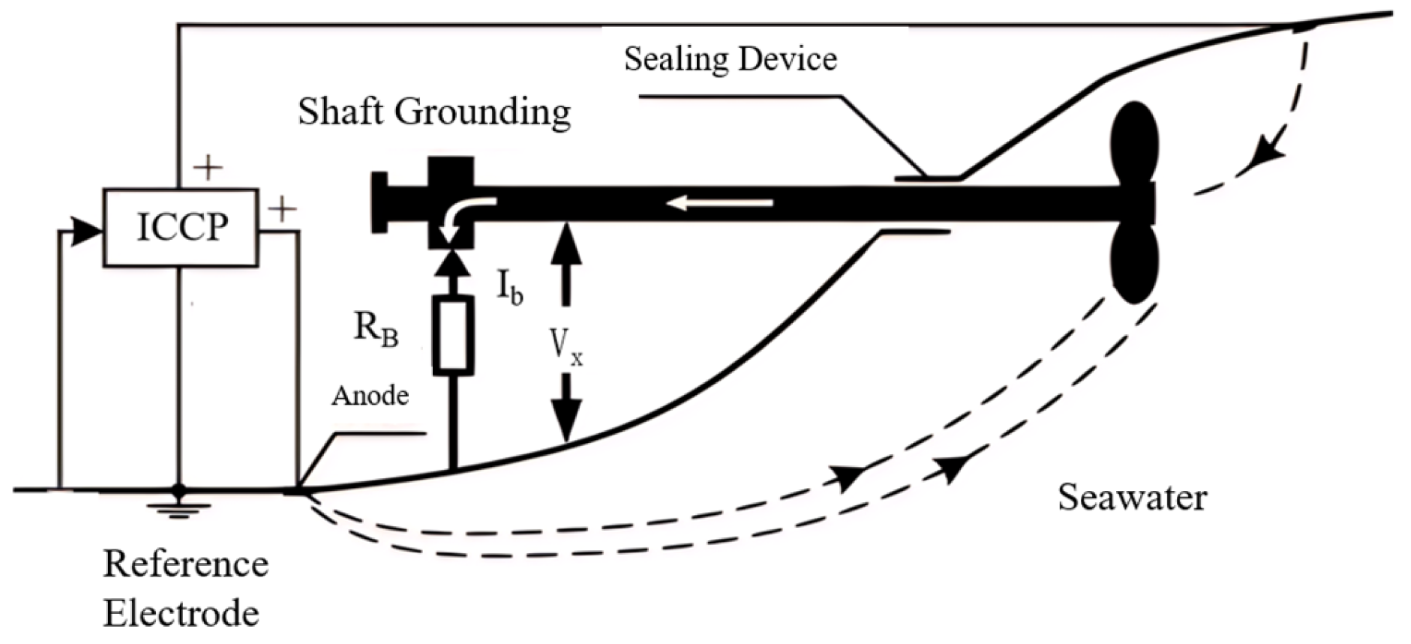
Seawater is a highly conductive electrolyte solution [7]. Due to the difference in electrochemical activity between the ship’s steel hull (anode) and nickel-copper alloy propeller (cathode), a natural corrosion cell is formed in seawater [8]. To protect the hull from excessive corrosion by seawater, a cathodic protection system is usually adopted [9]. Under this protection method, both the corrosion current and the protection current flow from the anode (corresponding to the hull and auxiliary anode or sacrificial anode, respectively) through seawater to the cathode (propeller), and then return to the hull through grounding structures, such as the stern shaft, bearings, couplings, and gears, forming a complete current loop, as shown in Figure 1 [10]. The formation of this basic current loop is a prerequisite for the generation of the SREF.
During the rotation of the propeller, it modulates the basic current formed above. These time-varying currents generate electromagnetic waves, which propagate outward from the ship hull as harmonics, with the propeller shaft’s rotation frequency as the fundamental frequency—thus generating the SREF [12]. Among them, this modulation effect is mainly achieved through internal modulation and external modulation, and the ratio of their effects usually does not exceed 5% [13]. It can be inferred that the frequency of the SREF is related to the rotation frequency of the propeller shaft, belonging to an extremely low-frequency (ELF) signal, generally ranging from 1 to 7 Hz [14]. Meanwhile, its intensity signal is very weak, typically on the order of microvolts per meter, and it attenuates severely in seawater, making it prone to being submerged by background noise [15]. Nevertheless, its power spectrum exhibits distinct line-spectrum characteristics, which makes it an important basis for target identification [16]. The SREF presents a complex spatial distribution underwater with obvious near-field features. The phase difference in the shafting of multi-shaft ships will significantly affect the amplitude of the SREF, increasing the difficulty of detection [17].
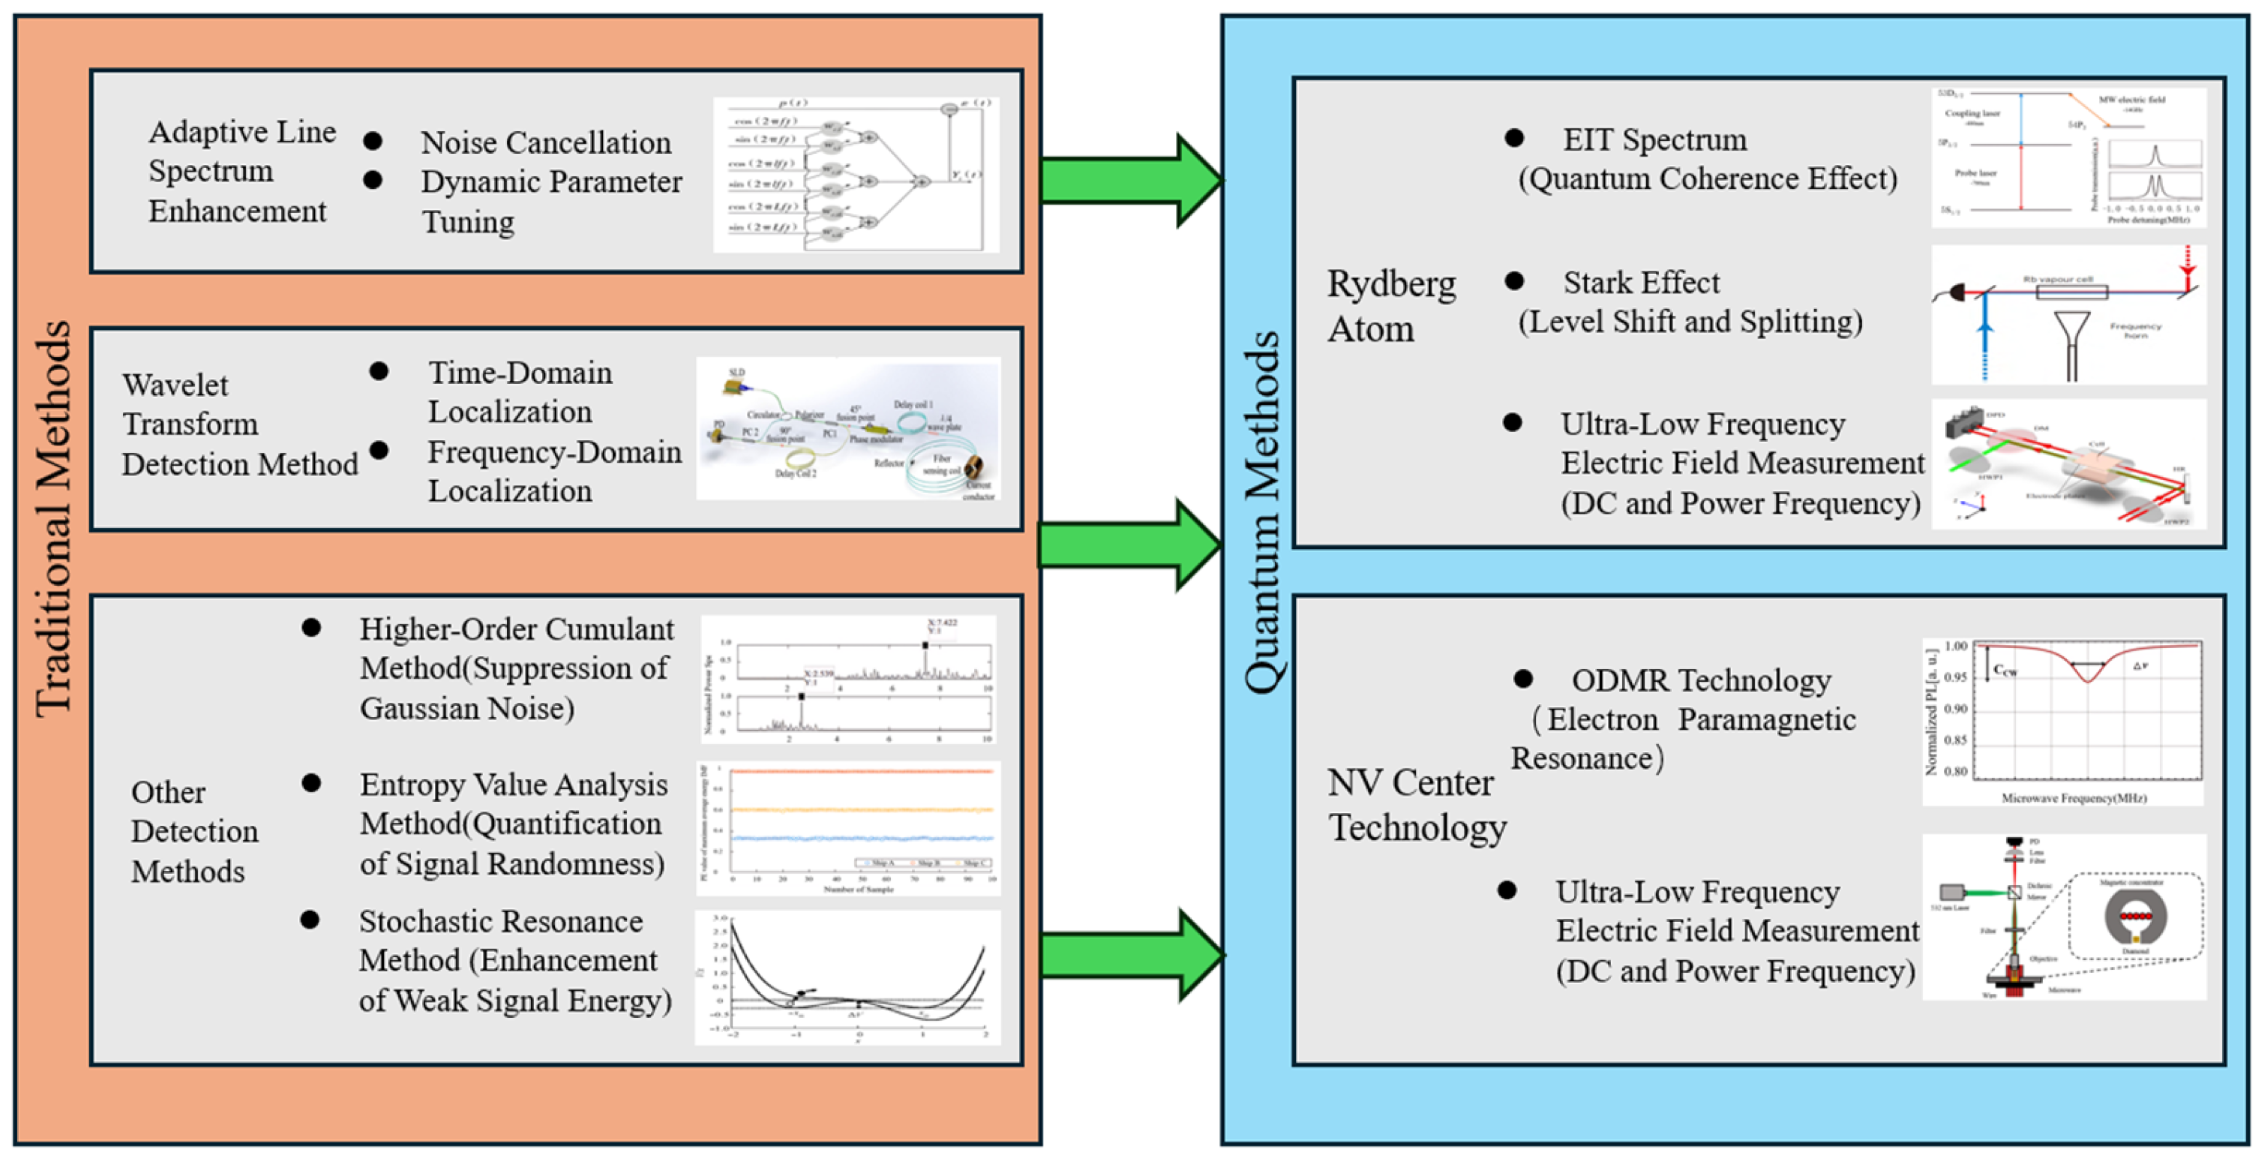
Based on these characteristics of the SREF, scholars have developed several traditional detection methods, including the ALE method, higher-order cumulant-based methods, and wavelet analysis detection methods [18,19,20]. By integrating traditional detection methods, we summarized the feasible pathways of quantum-based SREF detection, mainly covering Rydberg atom and diamond NV-center technologies. Leveraging the inherent advantages of quantum methods—such as high precision, high sensitivity, and high resolution—this study provides new ideas for SREF detection, aiming to achieve more accuracy and faster response performance. The overall structure of this paper is illustrated in Figure 2.

3. Traditional Methods for the SREF

3.1. ALE Method

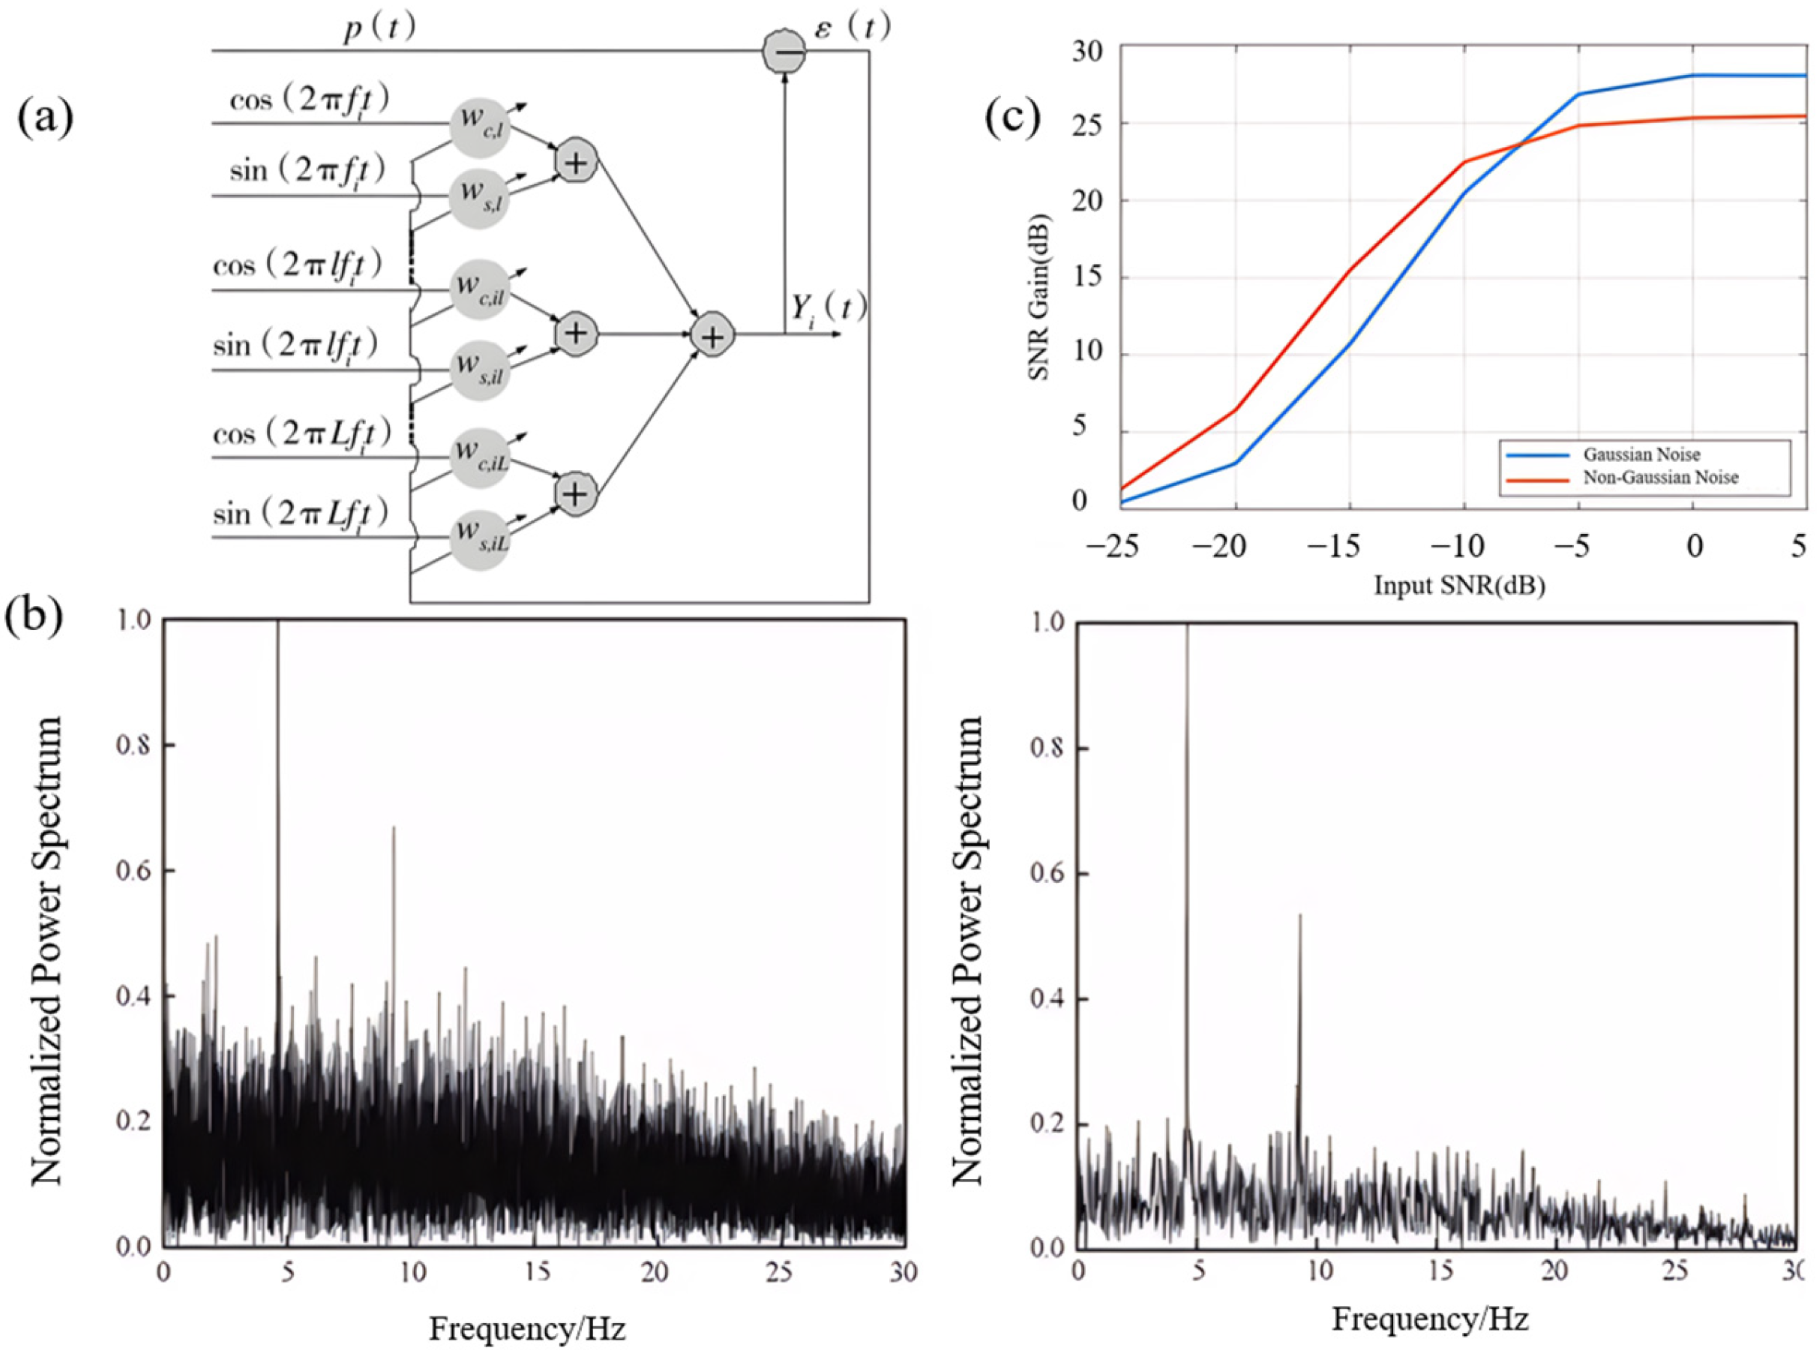
The adaptive line enhancer (ALE) method is an adaptive spectral estimation technique for parameter estimation of line spectra in additive noise [21], originally proposed by Widrow et al. in 1975 [22]. Its algorithm principle diagram is shown in Figure 3a. In 2022, Q. Bian et al. improved the traditional LMS error algorithm and proposed an ALE based on the Incremental Meta-Learning IDBD algorithm [23]. It can be seen from Figure 3b that the signal spectrum processed by the ALE based on the IDBD algorithm exhibits more distinct features compared with that based on the LMS algorithm, which can greatly suppress background noise and effectively separate narrowband SREF signals. However, the performance of the aforementioned methods degrades under non-Gaussian backgrounds. To address this issue, Y. Ma et al. proposed an adaptive line enhancement method based on the Maximum Mixed Correntropy Criterion (MMCC) in 2025 [24]. As illustrated in Figure 3c, this method maintains significant SNR gain under both Gaussian and non-Gaussian conditions. Even under extremely low-SNR conditions, the algorithm still retains strong enhancement capabilities, demonstrating high robustness and adaptability to actual noise environments.
The ALE is centered on adaptive noise-cancellation technology. Its working logic is to dynamically adjust parameters by virtue of adaptive filtering algorithms, accurately lock onto and extract periodic target components from the input signal, while significantly suppressing irregular broadband noise. A prominent advantage of this device is its ability to efficiently capture target periodic signals, even in low-SNR scenarios where the signal is severely masked by strong noise. Its core application scenario has always revolved around “extracting weak periodic signals from strong noise,” making it applicable to SREF detection.

3.2. Wavelet Transform-Based Detection Method

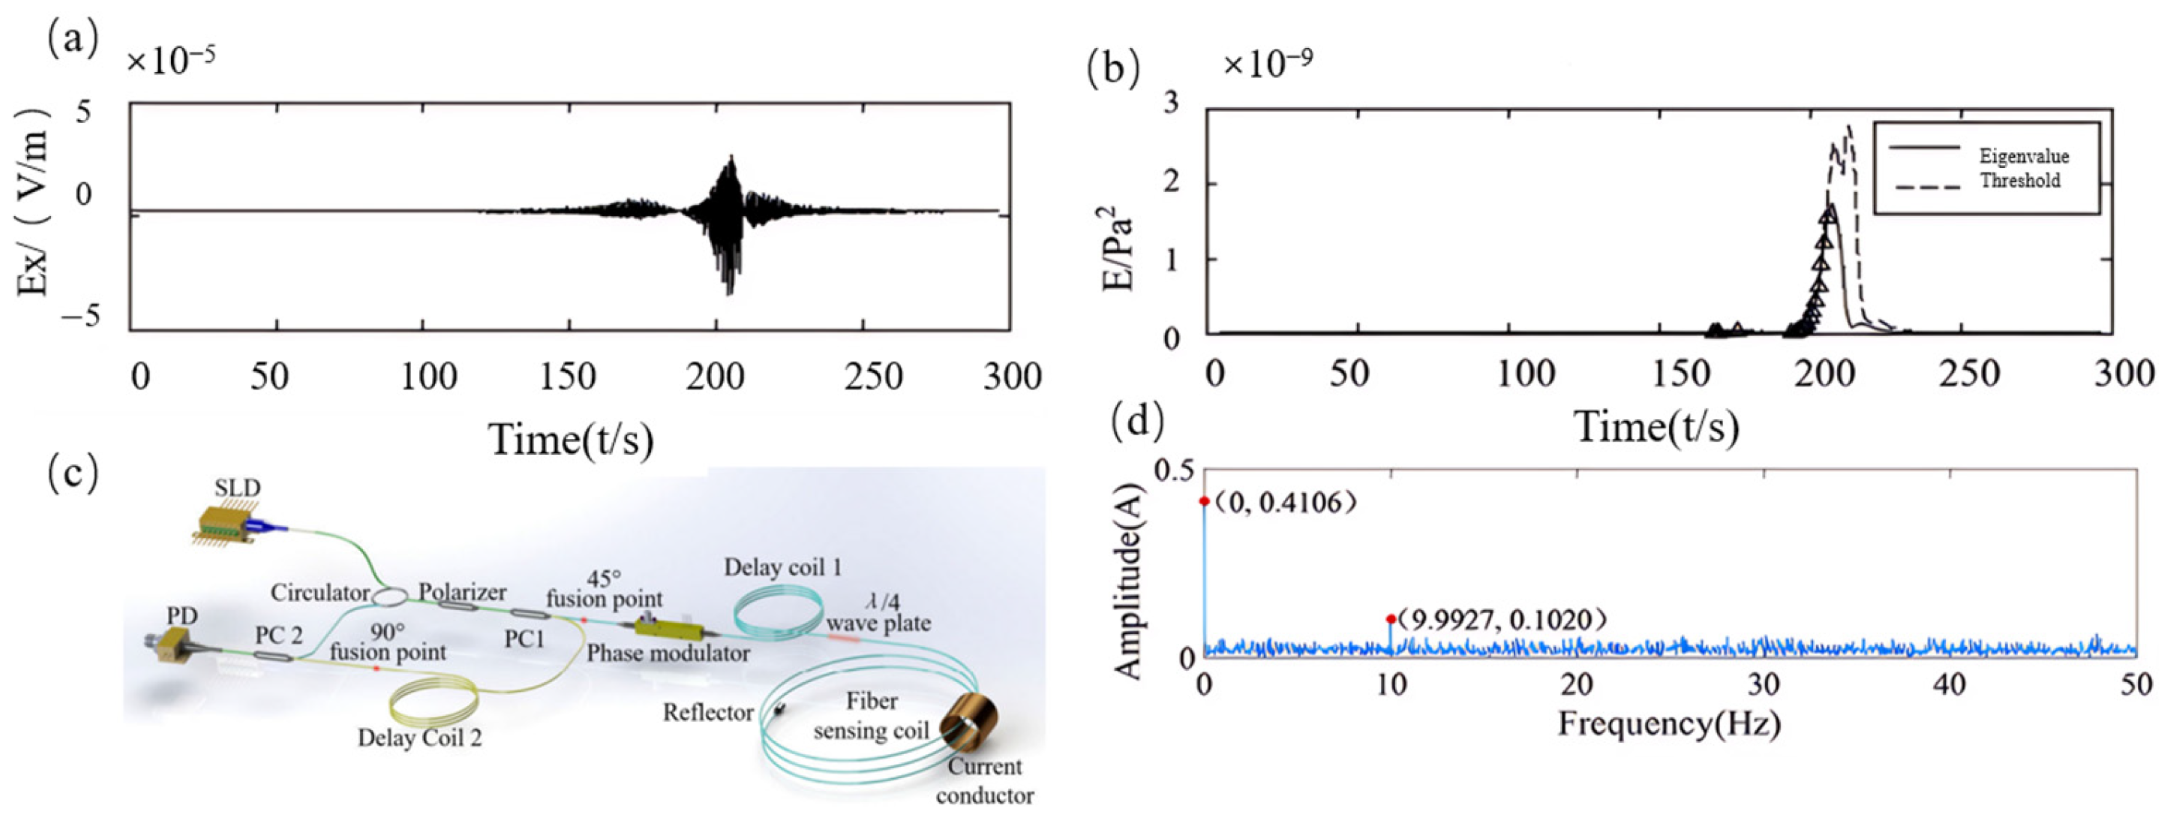
Wavelet transform is a time-frequency analysis method capable of providing information about signals in both the time and frequency domains simultaneously [25], which is crucial for non-stationary signals such as the SREF. In 2020, Y. Li et al. analyzed the measured signals of marine environmental electric fields and ship SREFs via continuous wavelet transform, calculating their scale-wavelet energy spectra [26]. As shown in Figure 4a,b, this method maintains good robustness, even under complex sea conditions. The detection rate of 20 sets of data reaches 100% under high-SNR conditions, demonstrating favorable detection performance. However, the method only utilizes uniaxial electric field signals, leading to a risk of false alarms in detection. In 2025, Y. Zhao proposed and verified a high-precision Fiber Optic Current Transformer (FOCT) for measuring ship SREF currents [27]. Adopting an optical fiber structure (as illustrated in Figure 4c), this method outperforms traditional electrical sensors significantly in hardware anti-interference capability and exhibits extremely strong environmental adaptability. The amplitude-frequency characteristic diagram shown in Figure 4d indicates that the Fast Fourier Transform-Discrete Wavelet Transform (FFT-DWT) algorithm proposed by the author can efficiently separate and extract AC and DC steady-state signals. Nevertheless, it suffers from high hardware costs and great difficulties in engineering promotion. Additionally, the optical fiber is susceptible to mechanical vibrations, requiring additional vibration-damping design.
The core characteristic of the SREF signal lies in its extremely low-frequency line spectrum. During ship movement, the signal amplitude exhibits weak time-varying characteristics, with slight fluctuations influenced by distance and propeller rotational speed. The traditional Fourier transform can only obtain the global frequency distribution of the signal, and fails to reflect the frequency variation over time. In contrast, the wavelet transform achieves dual localization in both the time and frequency domains through the coordinated adjustment of scale factors [28]. This feature perfectly matches the low-frequency and time-varying inherent properties of the SREF signal, enabling the wavelet transform to effectively detect SREF signals under low-SNR conditions.

3.3. Other Detection Methods

In addition to the two widely applied traditional detection methods for the SREF mentioned above, to further improve the detection limit, other conventional detection methods have also been developed and utilized. These include higher-order cumulant detection [29,30], entropy analysis [31,32], stochastic resonance detection [33], and so on.
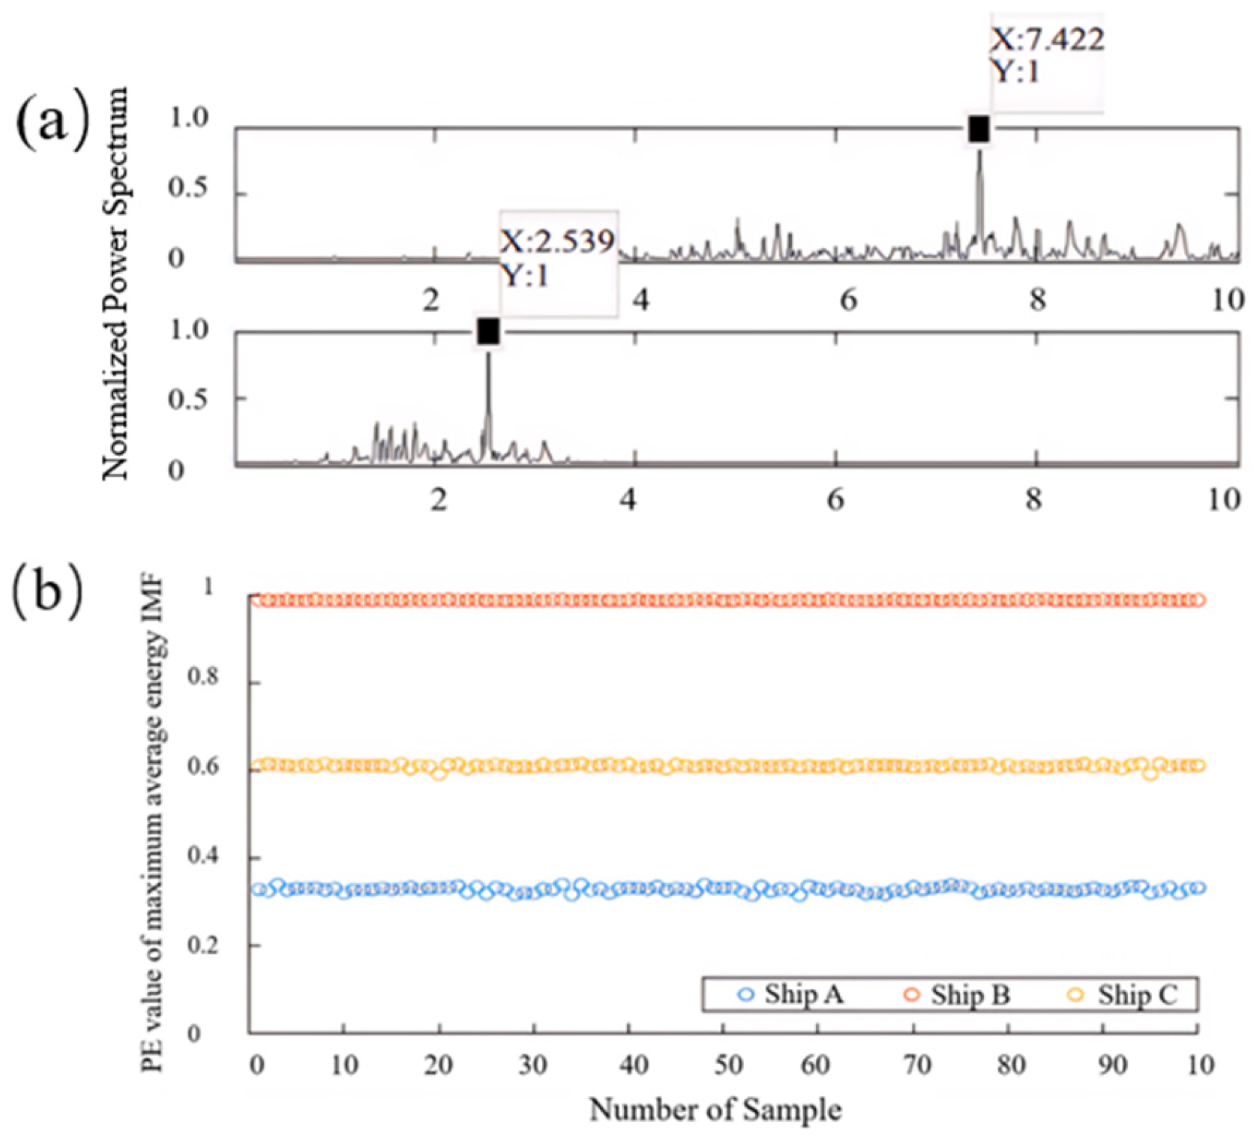
Higher-order cumulants exhibit a suppression effect on Gaussian noise [34]. Leveraging this characteristic, R. Cheng et al. proposed a method combining Empirical Mode Decomposition (EMD) and the diagonal-slice power spectrum of fourth-order cumulants in 2016 [35]. As illustrated in Figure 5a, this method can still accurately extract the fundamental frequency and third harmonic features of the SREF, even in scenarios where the SNR is as low as −15 dB. Entropy analysis, on the other hand, can effectively quantify the complexity and randomness of signals, providing a powerful tool for feature extraction of SREF signals. In 2025, X. Ma et al. proposed a feature-extraction method for ship SREFs based on the energy permutation entropy of intrinsic mode functions [36]. This method possesses strong target discrimination capability, increasing the entropy difference between SREF signals of different ships from 0.05 to approximately 0.2 (as shown in Figure 5b). It can effectively distinguish the characteristic parameters of electric field signals with different shaft frequencies, thus solving the problem of target recognition failure in traditional methods caused by small differences in characteristic parameters. Stochastic resonance technology can fully utilize noise to enhance the energy of weak signals, thereby improving the SNR to achieve weak signal recognition [37]. In 2021, J. Li et al. proposed an improved second-order bistable matched stochastic resonance detection method [38]. This method has extremely strong adaptability to low-SNR environments, and the time-domain diagram of the output signal still retains periodic features. Even at an SNR of −60 dB, it can accurately detect the fundamental frequency and its harmonic components of the ship SREF signal.
All the above are traditional methods for detecting the SREF, yet their drawbacks are equally prominent. For instance, the higher-order cumulant method has relatively high requirements for the SNR. Under weak signal conditions or strong noise environments, noise may mask the higher-order statistical characteristics of the SREF signal, leading to a significant degradation in detection performance [39]. Both the wavelet analysis method and adaptive line-spectrum methods suffer from boundary effects, resulting in inaccurate overall signal estimation. Therefore, quantum methods, such as those based on Rydberg atoms and diamond NV centers, have gradually been discovered and utilized. Leveraging the inherent advantages of quantum methods—including high precision, high sensitivity, and strong anti-interference capability—these approaches enable more effective extraction and detection of electric signals.

4. SREF Detection Based on Rydberg Atoms

4.1. Basic Characteristics of Rydberg Atoms

Rydberg atoms refer to atoms with an extremely large principal quantum number, whose outer electrons are excited to orbits far from the atomic nucleus [40]. These atoms possess exceptionally large orbital radii and sizes, with the orbital radius being proportional to the principal quantum number n2 [41]. This implies that as the principal quantum number increases, the atomic size expands drastically. Such a large size results in weak confinement between the Rydberg electron and the atomic nucleus, endowing the atom with a stronger response to external fields—an attribute that enables it to exhibit superior responsiveness to weak SREF signals. The electric dipole transition matrix element of Rydberg atoms is proportional to n2 [42], and the strength of the dipole-dipole interaction between adjacent energy levels is proportional to n4. This grants Rydberg atoms an enormous electric dipole moment and strong interactions, while also rendering them highly sensitive to external electric fields. Leveraging this characteristic, research into quantum precision measurement of electric fields and related areas based on Rydberg atoms can be pursued. The radiative lifetime of Rydberg states is proportional to n3. Although the probability of radiative transition to the ground state is very low, the relatively low transition frequency between Rydberg states endows these states with a comparatively long lifetime—an advantage that is highly beneficial for quantum information storage and processing.

4.2. Principle of Rydberg Atom Detection

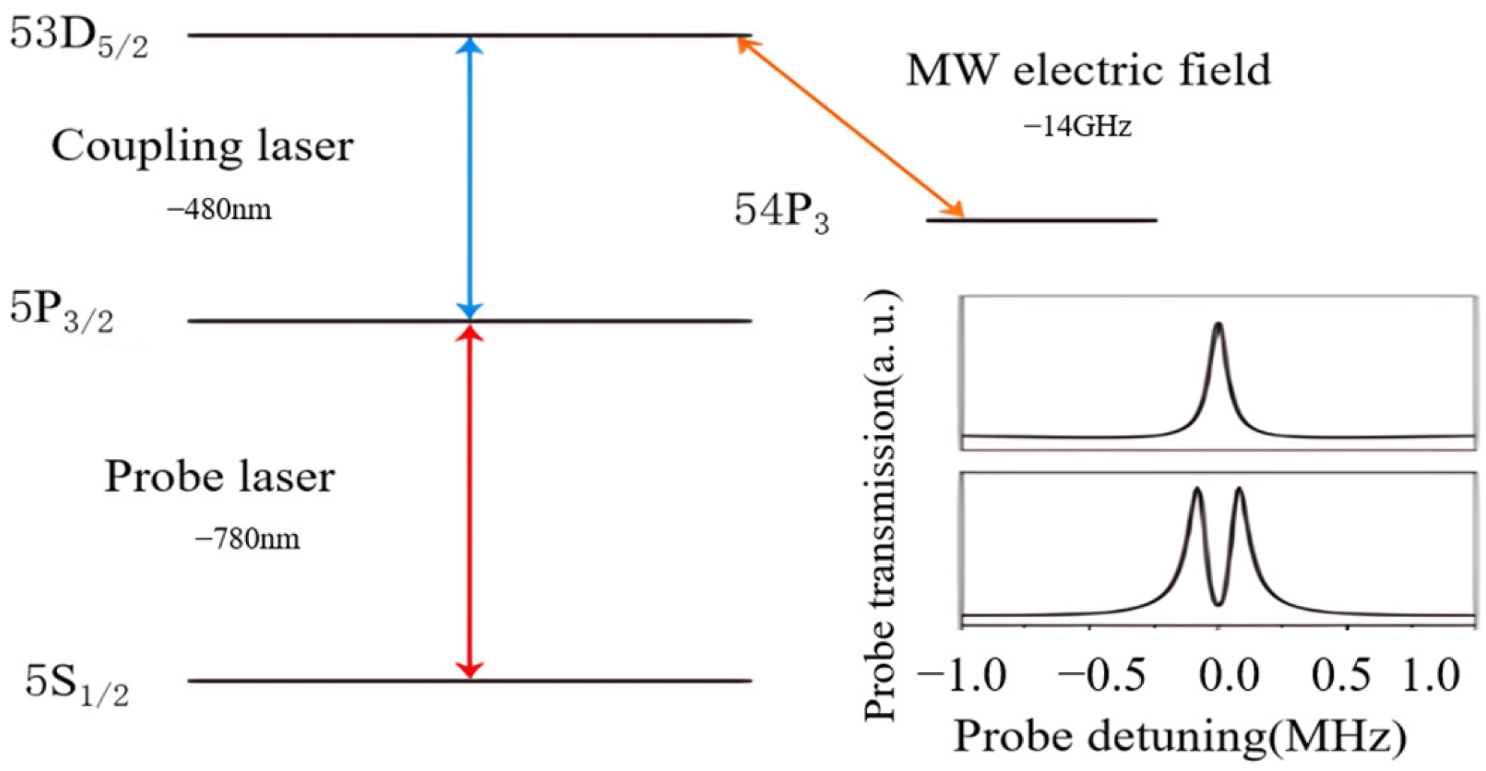
Electric field measurement primarily relies on techniques such as Electromagnetically Induced Transparency (EIT) spectroscopy and the DC/AC Stark effect. Electromagnetically Induced Transparency is a quantum coherence effect arising from the interaction between light and matter [43]. In the EIT spectroscopy of Rydberg atoms, two-photon excitation is typically employed, with the energy level diagram illustrated in Figure 6. When Rydberg atoms are in an EIT configuration, the characteristics of their EIT spectra are affected by external electric fields. By monitoring changes in these EIT spectra, sensitive detection of electric fields can be achieved. This technique leverages the ultra-high sensitivity of Rydberg states, making it particularly suitable for weak electric field detection. The Stark effect of Rydberg atoms refers to the phenomenon where their energy levels undergo splitting and frequency shifting in an external electric field [44]. When Rydberg atoms are placed in an external electric field, their energy levels shift due to the interaction between the electric field and the atoms’ intrinsic electric dipole moment. Rydberg atoms have a large principal quantum number, leading to reduced energy level spacing and high energy degeneracy, which results in a highly pronounced Stark effect [45]. By accurately measuring these energy level shifts, the electric field strength can be inversely deduced.
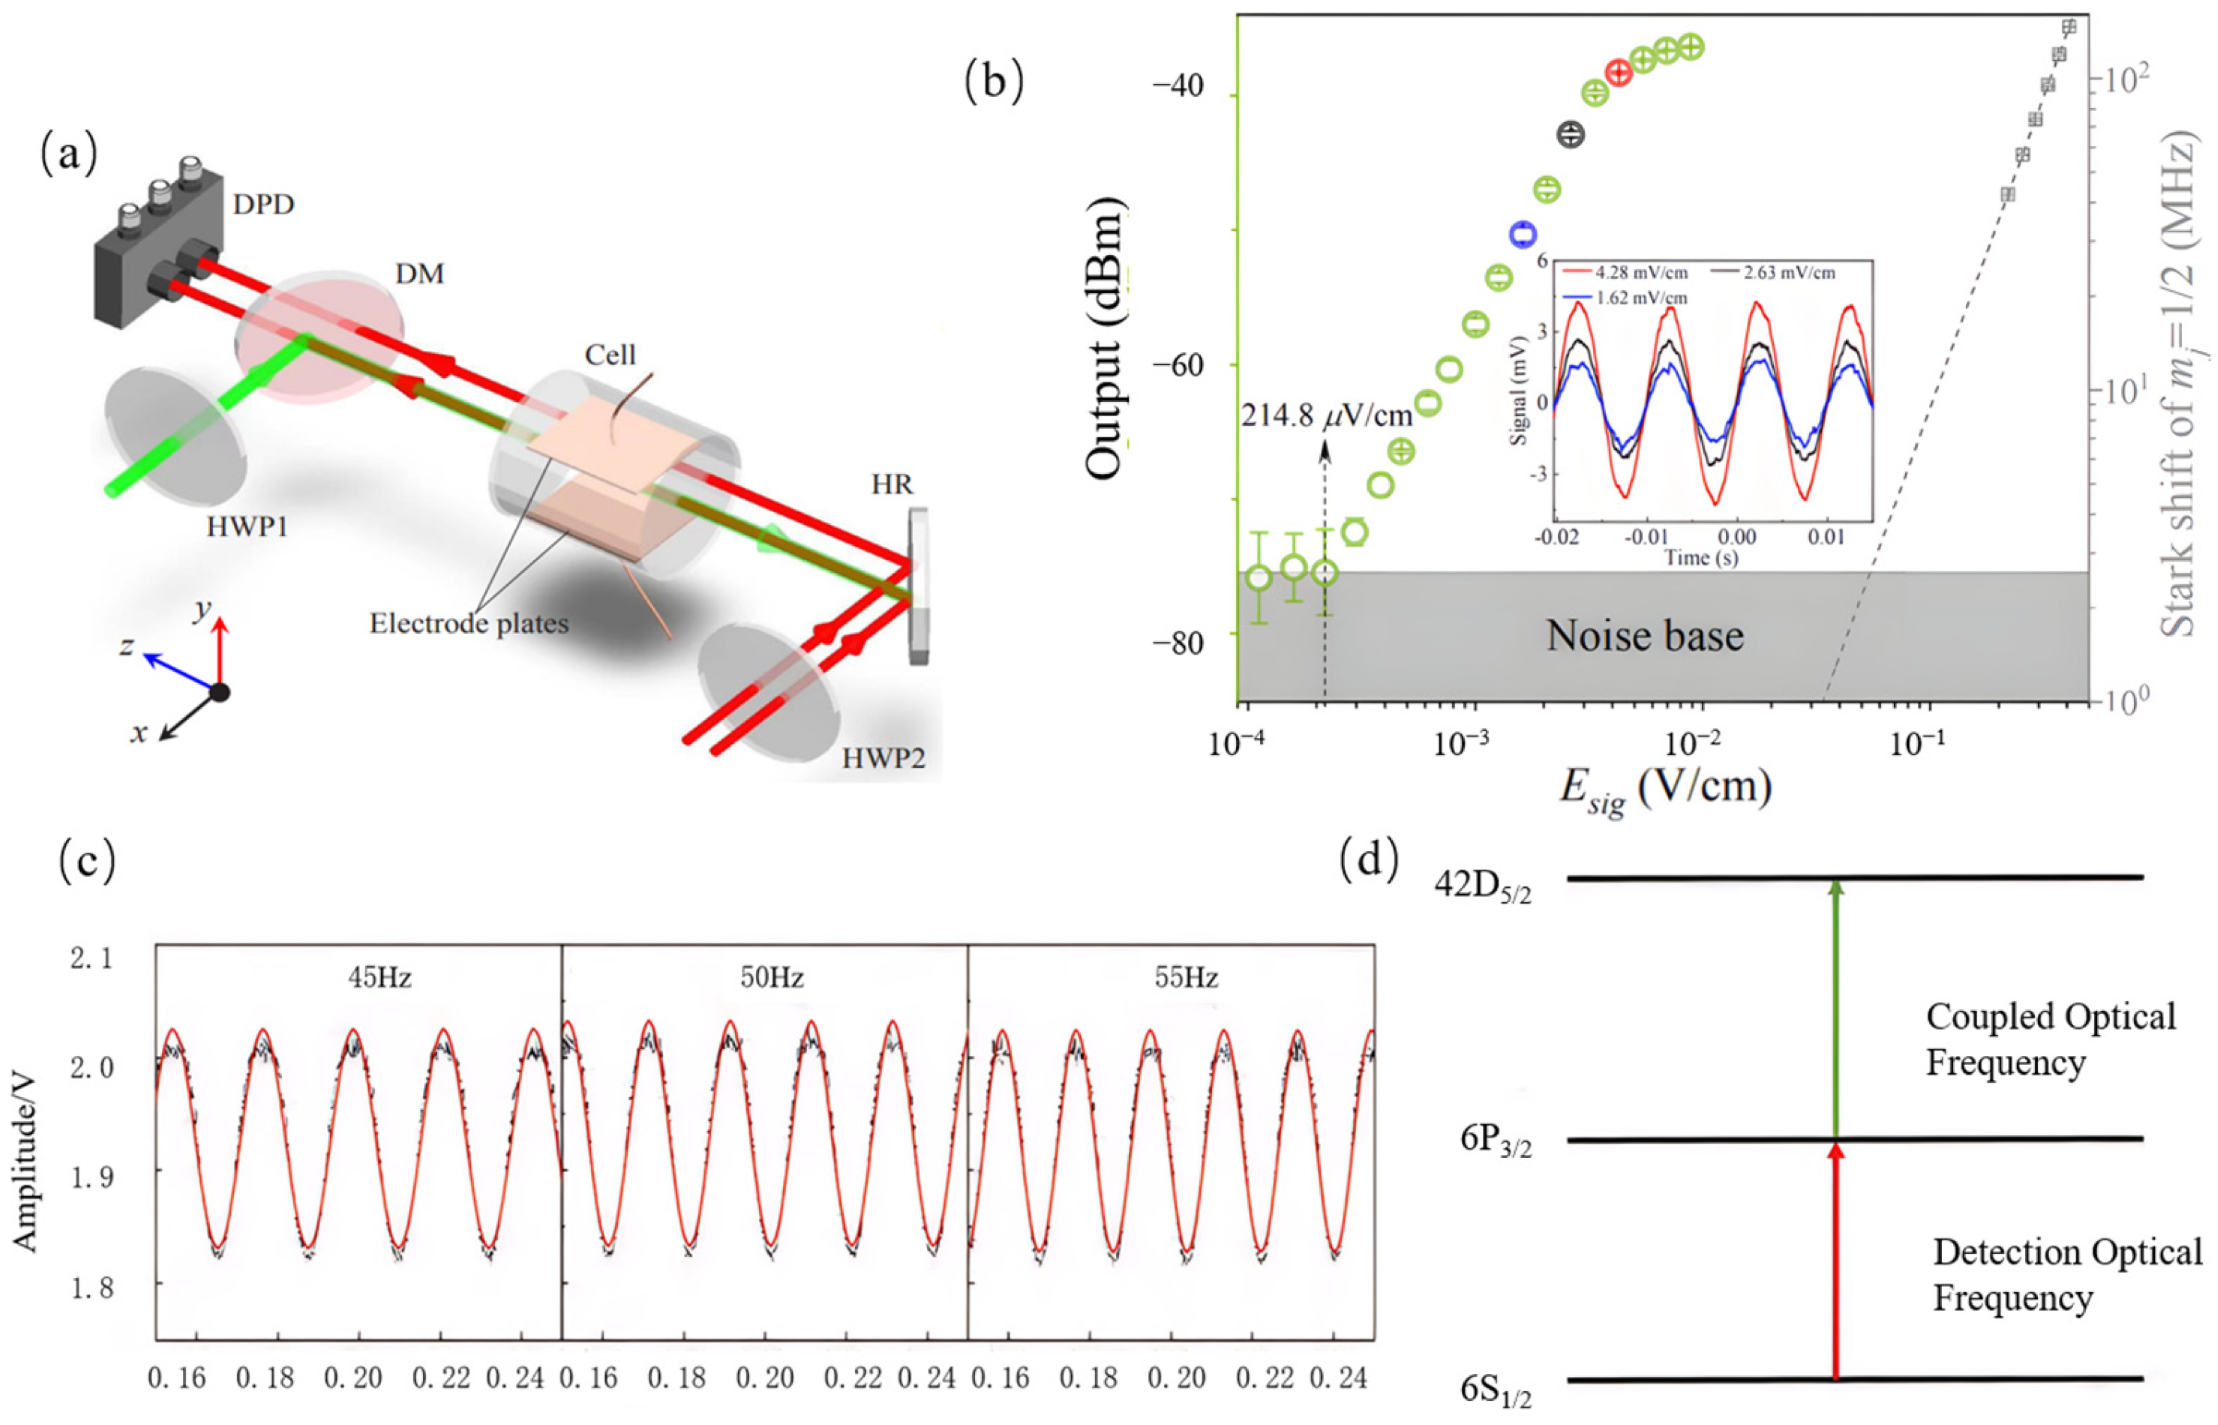
Currently, preliminary outcomes in electric field measurement have been achieved through the utilization of Rydberg atom technology. In the realm of DC electric-field detection, researchers from ETH Zurich employed vacuum ultraviolet-millimeter wave two-resonance spectroscopy, ultimately attaining a DC electric-field strength measurement of ±20 μV/cm [47]—the smallest electrostatic field strength detected to date. In the field of ultra-low-frequency (ULF) measurement, the research team led by J. Zhao from Shanxi University in China realized ULF electric-field measurement using an atomic vapor cell integrated with parallel electrodes [48]. The experimental setup is illustrated in Figure 7a, and the measurement results are presented in Figure 7b, where DPD, DM, HWP, and HR denote a differential photodetector, dichroic mirror, half-wave plate, and high-reflection mirror, respectively; E s i g represents the amplitude of the applied signal electric field. The inset in Figure 7b shows the time-domain signal, where the horizontal and vertical axes are time (s) and signal (mV), respectively. The data are taken by measuring the power of oscillation signals in the weak field region using a spectrum analyzer with a resolution bandwidth of 10 Hz and a video bandwidth of 10 Hz (green circles) and the Stark shift in the strong regime (grey squares). The grey dashed line is a linear fitting of the grey squares. This method leverages Rydberg Electromagnetically Induced Transparency (EIT) spectroscopy for signal electric-field detection, achieving a minimum measurable field strength of 214.8 µV/cm for 100 Hz electric fields, with a measurement sensitivity of 67.9 µV/cm·Hz1/2. The measurement of 100 Hz ULF signals provides reliable support for the detection of ultra-low-frequency SREFs. The core component of the sensor is a centimeter-scale cesium atomic vapor cell, eliminating the need for the massive antennas required by traditional ULF detection. This breaks through the “Chu limit” of antennas and enables application in space-constrained scenarios such as submersibles. W. Li et al. from Shanxi University implemented amplitude and frequency measurement of 50 Hz power-frequency electric fields based on Rydberg atom EIT spectroscopy, using room-temperature cesium atomic vapor as the sensor [49]. The measurement results are shown in Figure 7c. This method constructs a ladder-type EIT spectrum via two-photon excitation, as depicted in Figure 7d. Incorporating a reference optical path for calibration can further reduce frequency measurement errors, achieving a fitting degree of 0.99875. Meanwhile, the frequency measurement accuracy reaches ±0.03 Hz, enabling the capture of power frequency signals within the range of 45–55 Hz, which further supports the detection of extremely low-frequency SREFs.
However, due to the low-frequency electric-field shielding effect induced by the adsorption of alkali metals on the inner surface of the atomic vapor cell [50], it is extremely difficult for Rydberg atoms inside the cell to sense electric fields with frequencies lower than the shielding rate. Several strategies can be employed to counteract the induced electric field within the cell, including applying an electric field inside the cell using externally connectable ring electrodes [51], inserting thin-film electrodes into the cell [52], and directly using ultraviolet light, argon ion lasers, or heating to desorb surface metals [53]. These methods aim to further reduce the lower limit of detectable electric field frequencies, ultimately enabling the detection of SREFs.

5. SREF Detection Based on Diamond NV Centers

5.1. Basic Characteristics of Diamond NV Centers

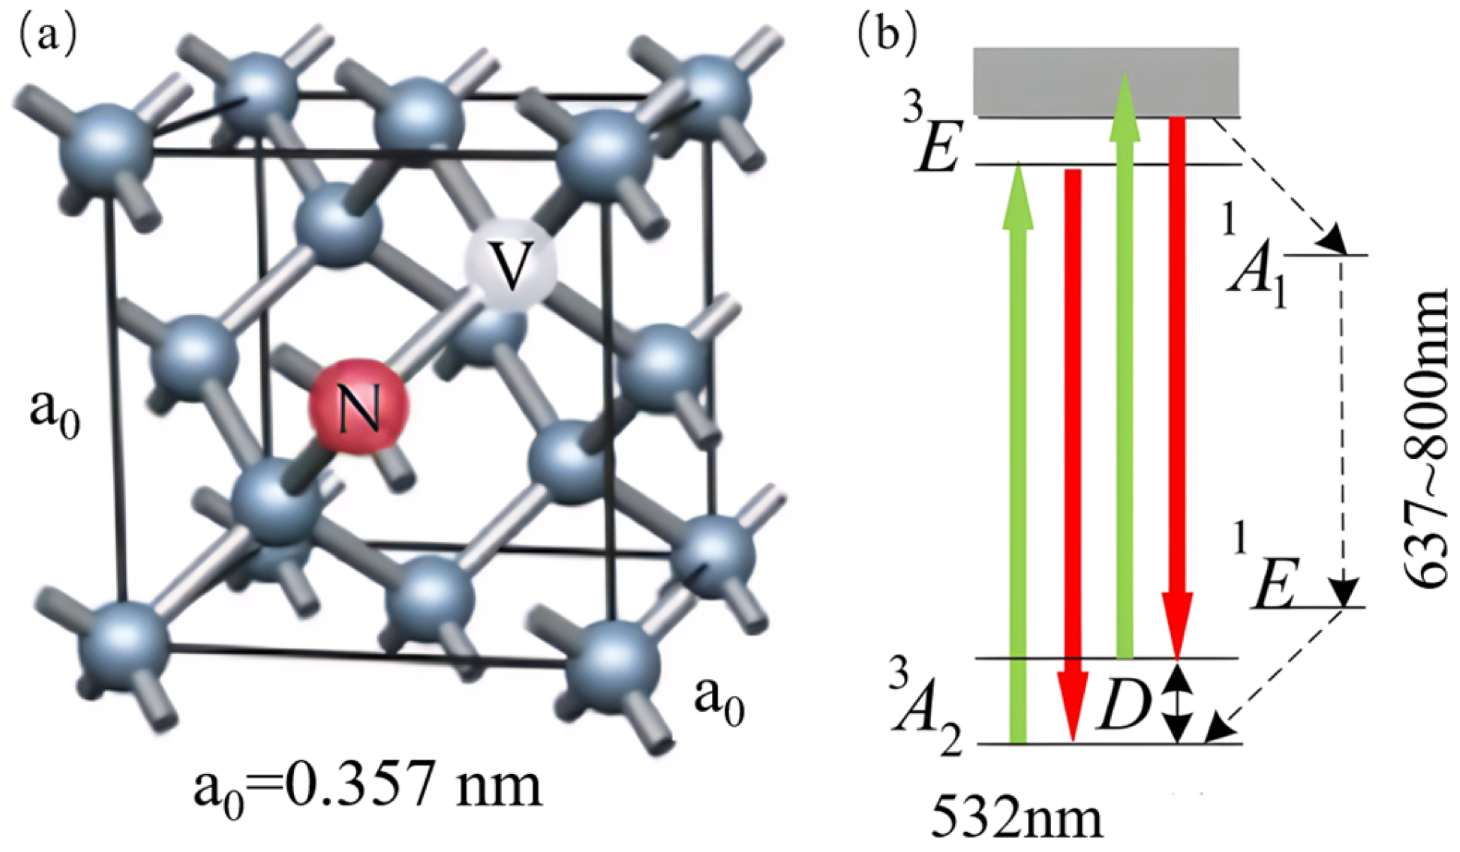
The NV center in diamond is an atomic-scale point defect consisting of a substituted nitrogen atom in the diamond lattice and an adjacent carbon atom vacancy [54]. Its electronic structure can be equivalently represented as an electron spin triplet state with S = 1 and an electron spin singlet state with S = 0 (where S denotes the spin quantum number), as shown in Figure 8a. The electronic ground state of the diamond NV center is a spin triplet state, comprising one ground state and one excited state, as schematically illustrated in Figure 8b.
The NV center mainly exists in two charge states: the neutral NV0 and the negatively charged NV [57]. Among them, the NV center has become a research hotspot in the field of quantum technology due to its excellent quantum properties. It can achieve spin polarization and readout optically, and maintain a long ground-state transverse-spin relaxation time, even at room temperature, making it an ideal solid-state qubit and high-sensitivity sensor [58]. The NV center in diamond possesses extremely high spatial resolution, typically reaching the nanometer scale. This resolution stems from the atomic-scale characteristic of the NV center as a point defect. These properties enable the NV center to be applied not only in quantum computing and quantum networks but also as a multifunctional quantum sensor for high-precision electric-field measurement. Essentially, the NV center sensor is atomic-scale, facilitating miniaturization and integration.

5.2. Detection Principle of Diamond NV Centers

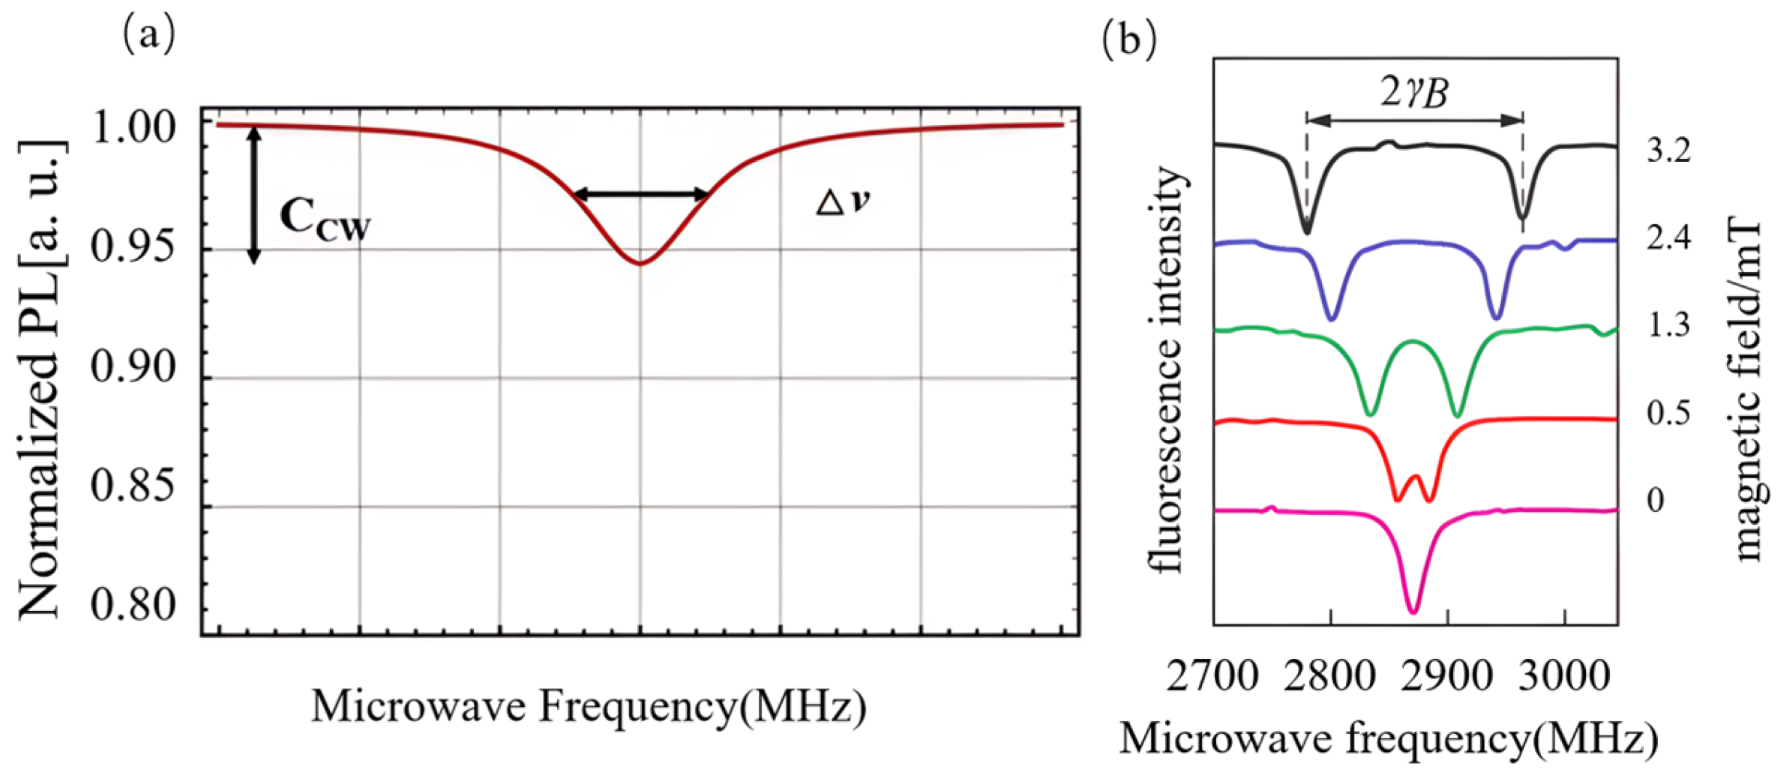
In electric field measurement using NV-center technology, continuous-wave or pulsed Optically Detected Magnetic Resonance (ODMR) techniques are typically employed [59]. The ODMR technique drives transitions between different spin sublevels of NV centers by applying a microwave field [60], which is essentially Electron Paramagnetic Resonance (EPR). When the microwave frequency matches the spin energy level difference, resonance occurs, resulting in a detectable change in fluorescence intensity. By scanning the microwave frequency and recording the variation in fluorescence intensity, the ODMR spectrum can be obtained, as illustrated in Figure 9a,b.
The energy level changes induced by the electric field will be directly reflected in the shift or splitting of the ODMR spectral lines [62]. Essentially, ODMR is EPR, which relies on the fluorescence intensity difference of the triplet state. The microwave resonance frequency is determined through photoelectric detection, and the magnetic field strength is ultimately derived from the microwave resonance frequency, thereby calculating the electric field strength [63].
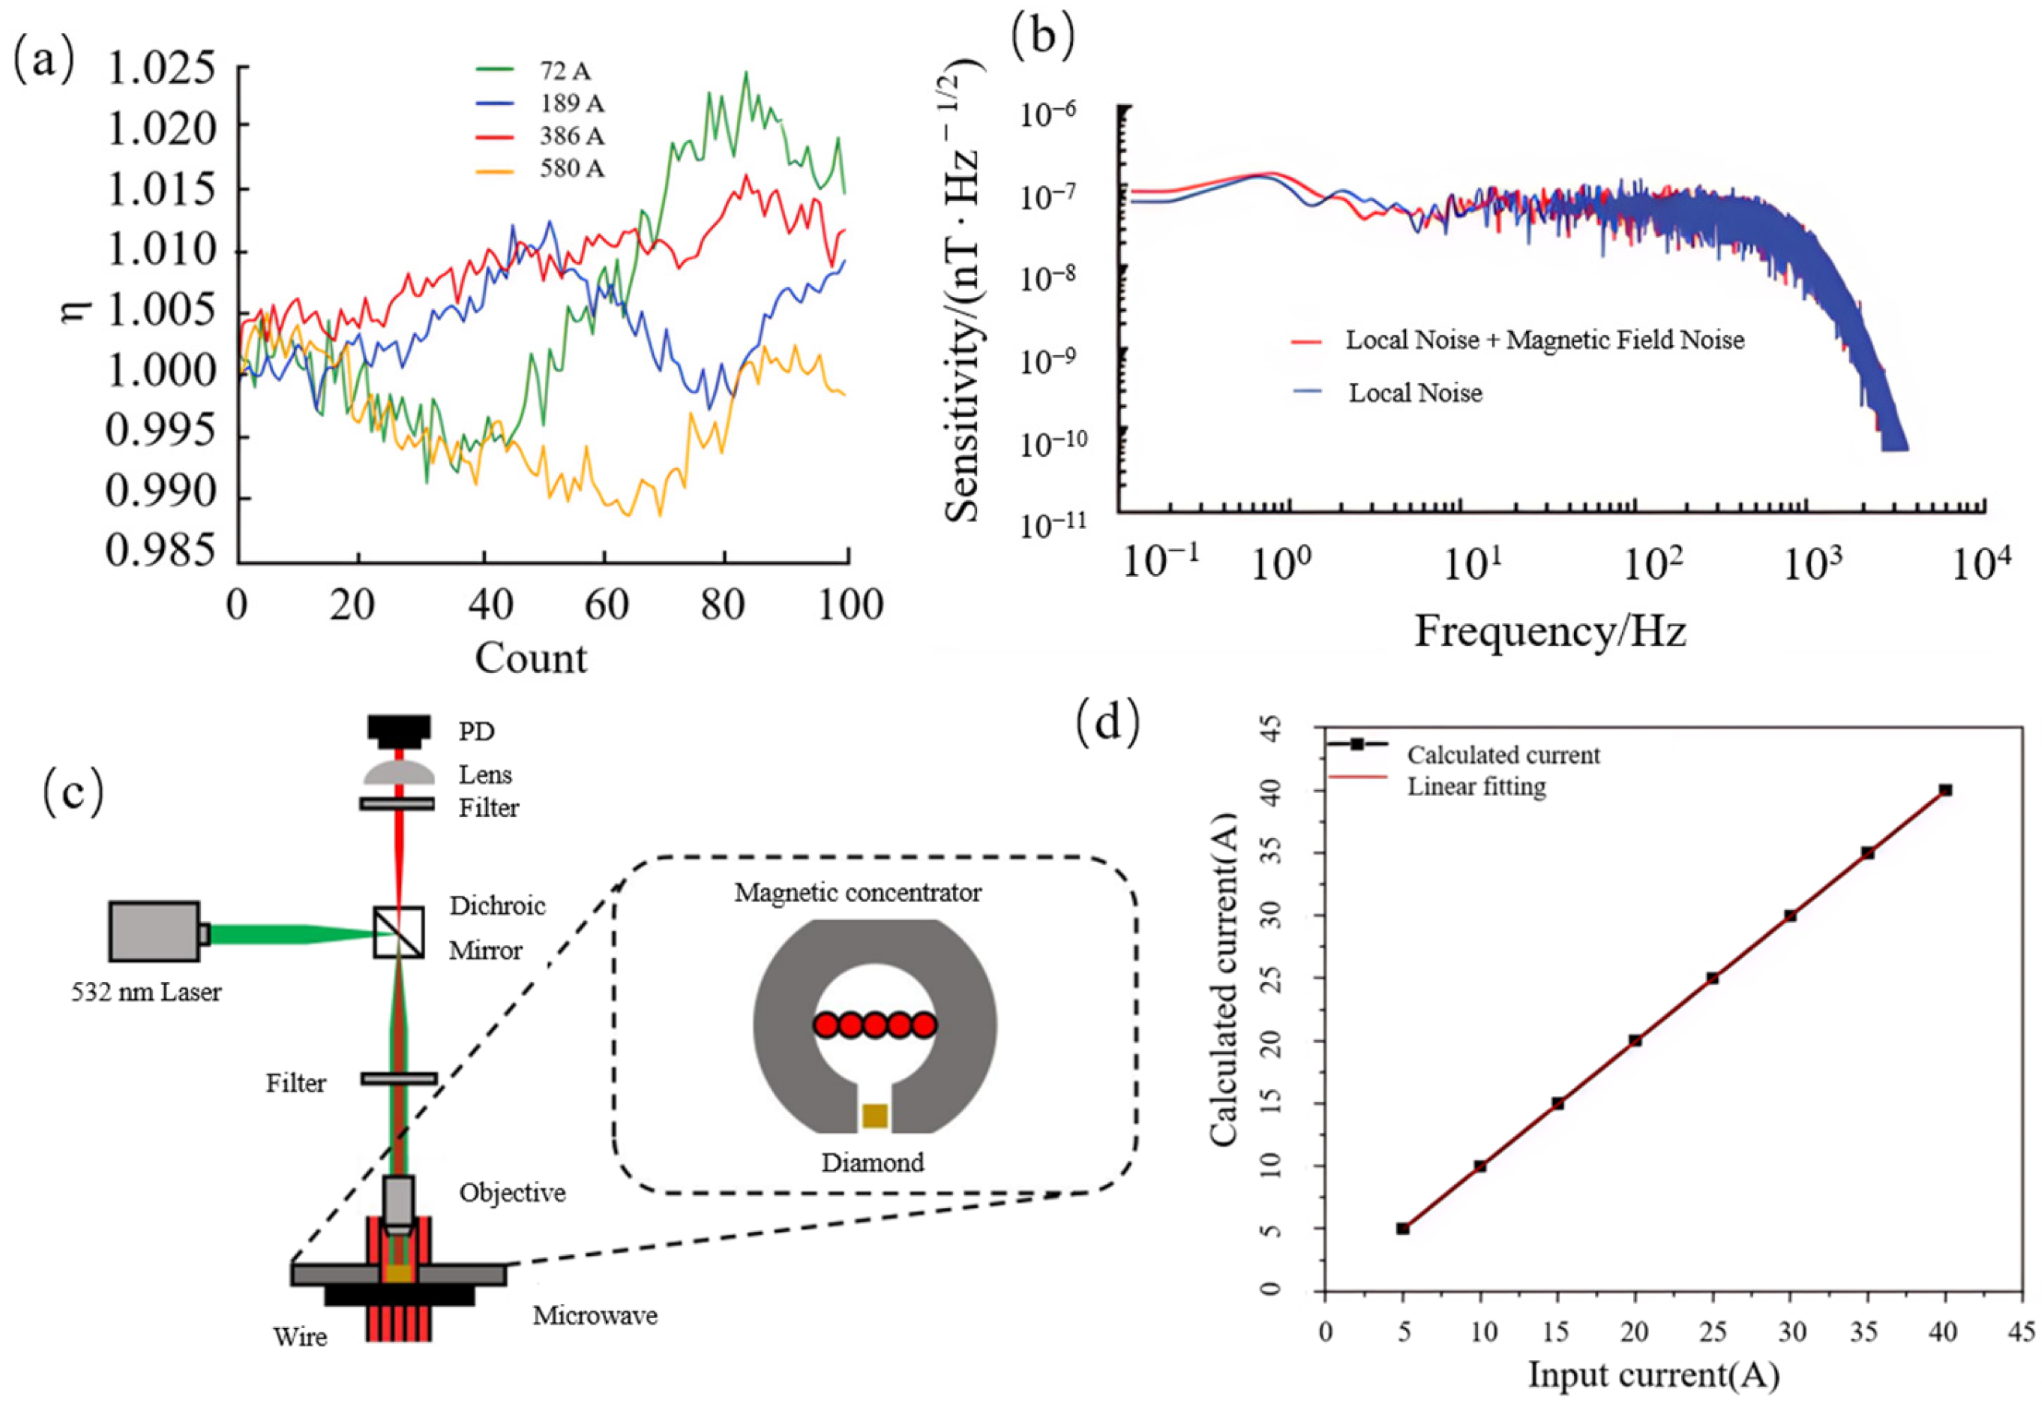
Currently, preliminary achievements have also been made in current measurement using diamond NV-center technology. In 2022, L. Zhao and his team developed a current transformer based on diamond NV centers [64], with the measurement results illustrated in Figure 10a, where η denotes the normalized current measurement ratio, defined as the ratio between the measured current and the reference current. The results indicate that the NV-center sensor achieves a measurement accuracy of approximately 0.3% for 50 Hz alternating current (AC) within the range of 100 to 500 A at a sampling rate of 10 kHz, demonstrating high precision. Meanwhile, the measurement accuracy can be further improved by reducing errors such as noise and nonlinearity of the NV-center sensor, showing great potential. It exhibits excellent magnetic measurement sensitivity, with the noise spectral density curve presented in Figure 10b. As shown in the figure, the noise spectral density at 50 Hz is approximately 60 nT/Hz1/2, which provides a foundation for high-precision current inversion. Additionally, with diamond as the substrate, NV centers can withstand extreme temperatures. This avoids issues such as ferromagnetic resonance and eddy current effects in traditional electromagnetic transformers, and also circumvents the sensitivity of fiber-optic transformers to temperature and vibration, making it suitable for many complex working conditions. In 2023, Z. Shi et al. proposed a novel Hall-like high-precision direct current (DC) sensor based on diamond NV centers, which was used to measure DC currents ranging from 5 A to 40 A [65]. The measurement principle is depicted in Figure 10c.
The measurement results are illustrated in Figure 10d, where I i and I c represent the input current and calculated current, respectively, and the red line denotes the linear fitting result. Within the measurement range of 5 to 40 A, the absolute current error is less than 51 μA. This meets the requirements of scenarios with strict linearity demands, such as precision instrument calibration and high-end power equipment monitoring. Furthermore, the stability error within 1 h is lower than 0.0002 A. Evaluation via Allan variance indicates that both short-term noise and long-term drift are at extremely low levels, avoiding stability issues such as temperature drift in traditional fiber-optic sensors and ferromagnetic resonance in electromagnetic sensors. Thus, it is suitable for long-term continuous monitoring. This method represents a significant breakthrough in the field of precision measurement of medium and low currents, particularly applicable to scenarios requiring ultra-high precision and stability. However, its practical value needs to be enhanced by expanding the measurement range, simplifying the system design, and reducing costs.
Currently, the technology of integrating NV centers into fiber-optic probes and scanning probes has become increasingly mature [66], providing a feasible engineering approach for distributed and in-situ detection on mobile platforms such as ships. The ship environment is filled with complex electromagnetic noise [67]. The development of dynamic decoupling technologies such as CDD has enabled NV-center sensors to shield magnetic field interference under strong magnetic field backgrounds and specifically detect electric field signals [68].

6. Summary and Outlook

The traditional detection methods for the SREF were first systematically reviewed. Subsequently, a feasibility analysis of SREF detection was conducted, focusing on two quantum technologies: Rydberg atoms and diamond NV centers. A quantitative comparison of the comprehensive performance of the three types of detection methods is presented in Table 1. It is indicated by research findings that electric field measurement has been achieved by Rydberg atom technology across a frequency range from direct current (DC) to tens of hertz, with a lower detection limit of electric field strength reaching the microvolt-per-centimeter (μV/cm) order of magnitude, demonstrating technical feasibility. Its characteristics of an ultra-large electric dipole moment and strong interaction with external fields endow the technology with ultra-high detection sensitivity, providing crucial support for capturing weak signals such as the SREF. Diamond NV-center technology has made remarkable progress in the field of current measurement, enabling high-precision quantitative detection of DC and low-frequency alternating current (AC). Additionally, this technology possesses the advantages of adaptability to complex environments, such as room temperature and high-pressure underwater conditions, high sensitivity, and potential for miniaturization and integration, thus showing promising application prospects in SREF detection scenarios.
However, the engineering application of quantum technologies in practical SREF detection still faces multiple challenges. First, the SREF is usually a microvolt-per-meter-level weak signal and can be easily submerged by marine environmental noise. Meanwhile, seawater is a conductive medium, and the propagation of SREFs is accompanied by conduction current and ohmic loss, resulting in significant attenuation with distance. Therefore, quantum sensing should be combined with weak-signal enhancement strategies, such as differential or gradiometric measurement, sensor-array deployment, long-time integration, and adaptive line-spectrum extraction, to improve the effective signal-to-noise ratio. Second, the coupled effects of multiple factors in the marine environment, including electromagnetic noise, temperature–salinity gradients, water-flow disturbances, marine bioelectric activity, and biofouling, may degrade the long-term stability and reliability of quantum sensors. These effects require reference channels, environmental compensation, anti-biofouling packaging, vibration isolation, and systematic calibration under temperature, pressure, salinity, vibration, and flow conditions. In addition, the computational complexity and cost of quantum-based SREF detection systems should be further optimized. A hierarchical processing architecture and a hybrid sensing scheme combining conventional electric-field sensors with quantum sensors may provide a practical route for resource-limited platforms. Most notably, the detection performance of quantum sensing technologies in the characteristic SREF frequency band of 1–7 Hz still needs to be improved, and the lower limit of electric-field detection requires further enhancement. Overcoming these technical bottlenecks is crucial for realizing quantum precision detection of SREFs in real marine environments.

Author Contributions

Conceptualization, F.Q. and J.Y.; methodology, J.Y.; software, not applicable; validation, H.Z. and L.X.; formal analysis, M.Z.; investigation, M.Z.; resources, L.X.; data curation, M.Z.; writing—original draft preparation, M.Z.; writing—review and editing, M.Z., H.Z., and L.X.; visualization, M.Z.; supervision, F.Q. and H.Z.; project administration, J.Y.; funding acquisition, F.Q. All authors have read and agreed to the published version of the manuscript.

Funding

This work was supported by the National Natural Science Foundation of China (Grant No. 42274013); Self-Supported Research Project of Naval University of Engineering (Project No. 2026504180).

Data Availability Statement

The data presented in this study are available upon request from the corresponding author.

Conflicts of Interest

The authors declare no conflict of interest.

References

  1. Wang, X.J.; Liu, D.H.; Zhu, W.B.; Ji, D. Underwater target detection based on electric-field sensor line array. Appl. Mech. Mater. 2015, 713, 337–342. [Google Scholar] [CrossRef]
  2. Ji, Q.; Jiang, P. Contact resistance in shaft-frequency electric field. J. Sichuan Ordnance 2014, 35, 127–130. [Google Scholar]
  3. Wang, J. Research status of electric field of warship and foreign electric field mine-sweeping technology. Digit. Ocean Underw. Warf. 2019, 2, 42–46. [Google Scholar]
  4. Liu, J.L.; Liu, Z.T. Design and implementation of shaft frequency signal extraction experiment based on magnetic compensation. Exp. Technol. Manag. 2025, 42, 108–116. [Google Scholar]
  5. Berweger, S.; Artusio-Glimpse, A.B.; Rotunno, A.P.; Prajapati, N.; Christesen, J.D.; Moore, K.R.; Simons, M.T.; Holloway, C.L. Phase-resolved Rydberg atom field sensing using quantum interferometry. arXiv 2022, arXiv:2212.00185. [Google Scholar]
  6. Fang, H.H.; Wang, X.J.; Marie, X.; Sun, H.B. Quantum sensing with optically accessible spin defects in van der Waals layered materials. Light Sci. Appl. 2024, 13, 303. [Google Scholar] [CrossRef]
  7. Wang, X.; Zhang, J.; Ji, D.; Tian, J.; Zhang, J. Conductivity′s influence on shaft-rate electric field in shallow sea. J. Nav. Univ. Eng. 2018, 30, 1–6. [Google Scholar]
  8. DeGiorgi, V.G. Influence of seawater composition on corrosion prevention system parameters. WIT Trans. Model. Simul. 1997, 16, 475–482. [Google Scholar]
  9. Zeng, W.; Bian, Q.; Tong, Y. Application of adaptive line enhancer based on NLMS algorithm in shaft-rate electric field signal detection. J. Phys. Conf. Ser. 2021, 1930, 012015. [Google Scholar] [CrossRef]
  10. Jiang, R.; Zhang, J.; Chen, X. Ship′s shaft-related electric field mechanism of production and countermeasure technology. J. Natl. Univ. Def. Technol. 2019, 41, 111–117. [Google Scholar]
  11. Jiang, R.; Shi, J.; Gong, S. Characteristics analysis of ship extremely low frequency electric field signals. J. Nav. Univ. Eng. 2014, 26, 5–8. [Google Scholar]
  12. Jiang, R.; Shi, J.; Gong, S. Analysis of signal characteristics of ship’s extremely low frequency electrical field. J. Nav. Univ. Eng. 2014, 26, 5–8. [Google Scholar]
  13. Tighe-Ford, D.J.; Dahele, J.S. Ship impressed current cathodic protection–modulations of system current outputs by propeller/shaft rotation on physical scale model hull. Br. Corros. J. 2000, 35, 269–272. [Google Scholar] [CrossRef]
  14. Yue, R.; Tian, Z.; Lü, J.; Zhang, Y.H. Study on attenuation law of the vessel’s shaft rate electric field based on the time-harmonic electric dipole model. Ship Sci. Technol. 2009, 31, 21–25. [Google Scholar]
  15. Zhang, Y.; Hu, X.; Han, B. Research status of shaft-rate electric field in China. Prog. Geophys. 2022, 37, 1342–1351. [Google Scholar]
  16. Zhang, J.; Xiao, D.; Xie, T.; Ji, Q. Analysis of characteristics of the electric field induced by an angularly rotating and oscillating magnetic object. Appl. Sci. 2024, 14, 1321. [Google Scholar] [CrossRef]
  17. Wang, X.; Wang, S.; Hu, Y.; Tong, Y. Mixed electric field of multi-shaft ship based on oxygen mass transfer process under turbulent conditions. Electronics 2022, 11, 3684. [Google Scholar] [CrossRef]
  18. Lu, X.; Gong, S.; Lin, C. Application of adaptive line enhancement on testing the shaft-rate electric field of a ship. J. Data Acquis. Process. 2004, 19, 438–440. [Google Scholar]
  19. Fei, Z.; Cai, X.; Bao, Z. Adaptive enhancement for ship shaft-rate electric field signals using higher-order cumulants. Ship Sci. Technol. 2014, 36, 120–124. [Google Scholar]
  20. Ma, Y.; Gong, S.; Jiang, R.; Zhang, F.; Li, S. Detection method for target signal based on wavelet transform. J. Data Acquis. Process. 2009, 24, 789–791. [Google Scholar]
  21. Liu, Y.; Yue, R.; Tian, Z.; Han, J. Ship shaft-frequency electric field testing based on harmonic waves adaptive line enhancer. Equip. Environ. Eng. 2011, 8, 29–32. [Google Scholar]
  22. Widrow, B.; Stearns, S.D. Adaptive noise canceling: Principles and application. Proc. IEEE 1975, 62, 1692–1716. [Google Scholar] [CrossRef]
  23. Bian, Q.; Zeng, W.; Ouyang, H.; Tong, Y. Application of incremental meta-learning IDBD algorithm in signal detection of shaft-rate electric field. J. Natl. Univ. Def. Technol. 2022, 44, 103–108. [Google Scholar]
  24. Ma, Y.; Yang, C.; Wang, J.; Da, X.; Yang, K. An improved sparsity-driven MMCC adaptive line spectrum enhancement algorithm to better ship’s shaft-frequency electric field detection. IEEE Sens. J. 2025, 25, 36735–36743. [Google Scholar] [CrossRef]
  25. Al-Badour, F.; Sunar, M.; Cheded, L. Vibration analysis of rotating machinery using time–frequency analysis and wavelet techniques. Mech. Syst. Signal Process. 2011, 25, 2083–2101. [Google Scholar] [CrossRef]
  26. Li, Y.; Zhang, J.; Cheng, J.; Sun, Q. Detection algorithm of shaft-rate electric field of a ship based on scale-wavelet energy spectrum. Ship Electron. Eng. 2020, 40, 152–156. [Google Scholar]
  27. Zhao, Y.; Wang, G.; Wang, Y.; Gao, W.; Wang, Y.; Wang, Z.; Zhang, T.; Yu, F. High-precision FOCT with AC-DC separation function for ship’s shaft-rate electric field current measurement. IEEE Sens. J. 2025, 25, 19077–19088. [Google Scholar] [CrossRef]
  28. Starodubtsev, P.A.; Dorofeev, G.V.; Lipovetskiy, A.O. Vibration parameters study of ship structures using wavelet analysis of vibrogram. J. Siber. Fed. Univ. Eng. Technol. 2021, 14, 292–305. [Google Scholar] [CrossRef]
  29. Wu, L.; Zhao, Z.; Su, J.; Cui, P. Detection of the Shaft Rate Electric Field Based on the Hilbert-Huang Transform. Ship Electron. Eng. 2019, 39, 138–142. [Google Scholar]
  30. Hu, P.; Jia, Y.; Gong, S. Real-time detection of ship shaft-rate electric field signal based on 1.5-dimension spectrum. J. Nav. Univ. Eng. 2012, 24, 33–37. [Google Scholar]
  31. Cheng, R.; Chen, C.; Jiang, R. Line spectrum extraction of ship shaft-rate electric field combining EMD and power spectra entropy. Ship Sci. Technol. 2017, 39, 159–163. [Google Scholar]
  32. Cheng, R.; Chen, C.; Zhang, J. Detection of ship shaft-rate electric field based on EEMD and modified power spectral entropy. J. Huazhong Univ. Sci. Technol. (Nat. Sci. Ed.) 2017, 45, 11–16. [Google Scholar] [CrossRef]
  33. Ji, D.; Shan, C. Weak signal detection in ship’s shaft-rate EM field based on stochastic resonance of tri- stable system. J. Nav. Univ. Eng. 2018, 30, 12–16. [Google Scholar]
  34. Bao, Z.; Gong, S.; Li, S. A ship shaft-rate electric signal detection method based on adaptive cumulant algorithm. J. Nav. Univ. Eng. 2009, 21, 13–16. [Google Scholar]
  35. Cheng, R.; Jiang, R.; Gong, S. Extraction of line spectrum of the ship shaft-rate electric field based on EMD and fourth-order cumulant. Ship Sci. Technol. 2016, 38, 94–98. [Google Scholar]
  36. Ma, X.; Sun, Z.; Jiang, R.; Yue, X.; Liu, Q. A method for extracting features of the intrinsic mode function’s energy arrangement entropy in the shaft frequency electric field of vessels. Appl. Sci. 2025, 15, 6143. [Google Scholar] [CrossRef]
  37. Huang, F.; Lin, C.; Yang, Z. Application of stochastic resonance technique detecting ship′s weak shaft-rate electric field signal. J. Nav. Univ. Eng. 2012, 24, 78–81. [Google Scholar]
  38. Li, J.; Han, P.; Zhu, Y. Application of an improved stochastic resonance technique detecting ship′s shaft-rate electric field signal. Foreign Electron. Meas. Technol. 2021, 40, 130–134. [Google Scholar]
  39. Wang, Y.; Wang, D.; Chi, C.; Yu, Z.; Li, J.; Yu, L. Ship shaft-rate electric field signal denoising method based on VMD-MSS. J. Mar. Sci. Eng. 2024, 12, 544. [Google Scholar] [CrossRef]
  40. Gallagher, T.F. Rydberg Atoms; Cambridge University Press: Cambridge, UK, 1994. [Google Scholar]
  41. Han, X.-X.; Zhao, J.-M.; Li, C.-Y.; Jia, S.-T. Potentials of long-range cesium Rydberg molecule. Acta Phys. Sin. 2015, 64, 133202. [Google Scholar] [CrossRef]
  42. Haroche, S.; Raimond, J.M. Radiative properties of Rydberg states in resonant cavities. In Advances in Atomic and Molecular Physics; Elsevier: Amsterdam, The Netherlands, 1985; pp. 347–411. [Google Scholar]
  43. Sedlacek, J.A.; Schwettmann, A.; Kübler, H.; Löw, R.; Pfau, T.; Shaffer, J.P. Microwave electrometry with Rydberg atoms in a vapour cell using bright atomic resonances. Nat. Phys. 2012, 8, 819–824. [Google Scholar] [CrossRef]
  44. Delone, N.B.; Krainov, V.P. AC Stark shift of atomic energy levels. Phys. Usp. 1999, 42, 669. [Google Scholar] [CrossRef]
  45. Saffman, M.; Walker, T.G.; Mølmer, K. Quantum information with Rydberg atoms. Rev. Mod. Phys. 2010, 82, 2313–2363. [Google Scholar] [CrossRef]
  46. Du, Y.; Lü, Z.; Hu, W.; He, J.; Liu, Z.; Dong, T.; Jin, S. Atomic-antenna-based quantum precision measurement of low-frequency electric fields and applications. Chin. J. Quantum Electron. 2024, 41, 701. [Google Scholar]
  47. Osterwalder, A.; Merkt, F. Using high Rydberg states as electric field sensors. Phys. Rev. Lett. 1999, 82, 1831–1834. [Google Scholar] [CrossRef]
  48. Li, L.; Jiao, Y.; Hu, J.; Li, H.; Shi, M.; Zhao, J.; Jia, S. Super low-frequency electric field measurement based on Rydberg atoms. Opt. Express 2023, 31, 29228–29234. [Google Scholar] [CrossRef]
  49. Li, W.; Zhang, C.; Zhang, H.; Jing, M.; Zhang, L. Power-frequency electric field measurement based on AC-Stark effect of Rydberg atoms. Laser Optoelectron. Prog. 2021, 58, 144–148. [Google Scholar]
  50. Abel, R.P.; Carr, C.; Krohn, U.; Adams, C.S. Electrometry near a dielectric surface using Rydberg electromagnetically induced transparency. Phys. Rev. A 2011, 84, 23408. [Google Scholar] [CrossRef]
  51. Ma, L.; Viray, M.A.; Anderson, D.A.; Raithel, G. Measurement of dc and ac electric fields inside an atomic vapor cell with wall-integrated electrodes. Phys. Rev. Appl. 2022, 18, 24001. [Google Scholar] [CrossRef]
  52. Barredo, D.; Kübler, H.; Daschner, R.; Löw, R.; Pfau, T. Electrical readout for coherent phenomena involving Rydberg atoms in thermal vapor cells. Phys. Rev. Lett. 2013, 110, 123002. [Google Scholar] [CrossRef]
  53. Anderson, P.; Jalnapurkar, S.; Moiseev, E.S.; Chang, D.; Barclay, P.E.; Lezama, A.; Lvovsky, A.I. Optical nanofiber temperature monitoring via double heterodyne detection. AIP Adv. 2018, 8, 55005. [Google Scholar] [CrossRef]
  54. Kehayias, P.; Doherty, M.W.; English, D.; Fischer, R.; Jarmola, A.; Jensen, K.; Leefer, N.; Hemmer, P.; Manson, N.B.; Budker, D. Infrared absorption band and vibronic structure of the nitrogen-vacancy center in diamond. Phys. Rev. B 2013, 88, 165202. [Google Scholar] [CrossRef]
  55. Cen, W.; Bai, J.; Meng, J.; Li, Q.; Lv, Y.; Duan, Y. Research on the key technology and standardization for current sensing based on diamond NV color center. Acta Metrol. Sin. 2024, 45, 1462–1469. [Google Scholar]
  56. Cheng, L.; Xu, N.; Tian, Y. Research on multiple microwave frequencies hopping modulation and demodulation system for magnetic sensing based on NV centers in diamond. J. Hefei Univ. Technol. Nat. Sci. 2025, 48, 1472–1477. [Google Scholar]
  57. Ishii, S.; Saiki, S.; Onoda, S.; Masuyama, Y.; Abe, H.; Ohshima, T. Ensemble negatively-charged nitrogen-vacancy centers in type-Ib diamond created by high fluence electron beam irradiation. Quantum Beam Sci. 2021, 6, 2. [Google Scholar] [CrossRef]
  58. Mizuochi, N. Control of spin coherence and quantum sensing in diamond. In Hybrid Quantum Systems; Springer: Singapore, 2022; pp. 1–25. [Google Scholar]
  59. Song, Q.; Yang, L.; Zhang, D.; Dang, S.; Xing, L.; Liu, J. Research on optical fiber current transducer using NV center in diamond. Proc. J. Phys. Conf. Ser. 2024, 2704, 12001. [Google Scholar] [CrossRef]
  60. Luo, S.; Zhu, Z.; Zhang, L.; Chen, P.; Lin, R. A low complexity reconstruction approach for optical detection magnetic resonance based diamond NV color center magnetic field measurement. Opt. Quantum Electron. 2023, 55, 1004. [Google Scholar] [CrossRef]
  61. Shi, Z. Research on High Precision Current Sensing Method Based on Diamond NV Color Center. Master’s Thesis, North University China, Taiyuan, China, 2023. [Google Scholar]
  62. Doherty, M.W.; Struzhkin, V.V.; Simpson, D.A.; McGuinness, L.P.; Meng, Y.; Stacey, A.; Karle, T.J.; Hemley, R.J.; Manson, N.B.; Hollenberg, L.C.L.; et al. Electronic properties and metrology applications of the diamond NV− center under pressure. Phys. Rev. Lett. 2014, 112, 047601. [Google Scholar] [CrossRef]
  63. Jing, K.; Xie, Y.; Lan, Z.; Rong, X.; Du, J. Magnetometry based on nitrogen-vacancy center in diamond. J. Meas. Technol. 2023, 43, 15–32. [Google Scholar]
  64. Zhao, L.; Qiu, R.; Sun, F.; Wang, X.; Wang, L.; Chen, J. Application of NV center in diamond as current transformer. Micronanoelectron. Technol. 2022, 59, 1199–1204. [Google Scholar]
  65. Shi, Z.Y.; Gao, W.; Wang, Q.; Guo, H.; Tang, J.; Li, Z.-H.; Wen, H.-F.; Ma, Z.-M.; Liu, J. Current sensor based on diamond nitrogen-vacancy color center. Chin. Phys. B 2023, 32, 070704. [Google Scholar] [CrossRef]
  66. Zhou, T.X.; Stöhr, R.J.; Yacoby, A. Scanning diamond NV center probes compatible with conventional AFM technology. Appl. Phys. Lett. 2017, 111, 163106. [Google Scholar] [CrossRef]
  67. Dobref, V.; Ciocioi, I.; Deliu, V.; Deliu, F.; Pană, L.; Dragomir, E. Critical aspects of electromagnetic compatibility on board ships. Sci. Bull. Nav. Acad. 2023, 26, 15–24. [Google Scholar] [CrossRef]
  68. Li, R.; Kong, F.; Zhao, P.; Cheng, Z.; Qin, Z.; Wang, M.; Zhang, Q.; Wang, P.; Wang, Y.; Shi, F.; et al. Nanoscale electrometry based on a magnetic-field-resistant spin sensor. Phys. Rev. Lett. 2020, 124, 247701. [Google Scholar] [CrossRef]
Figure 1. Schematic diagram of SREF generation [11].
Jmse 14 01110 g001
Figure 2. Overall structure of the research.
Jmse 14 01110 g002
Figure 3. (a) Schematic Diagram of the ALE Algorithm [21]; (b) signal spectra processed by two algorithms [23]; (c) SNR gain of the method under different noise conditions [24].
Jmse 14 01110 g003
Figure 4. (a) Transmission characteristic curve of SREF [26]; (b) real-time detection results of ferry SREF signals [26]; (c) optical fiber structure [27]; (d) amplitude-frequency characteristic diagram [27].
Jmse 14 01110 g004
Figure 5. (a) Normalized power spectrum at −15 dB [35]; (b) Permutation Entropy (PE) value of the intrinsic mode function (IMF) with maximum average energy [36].
Jmse 14 01110 g005
Figure 6. Schematic diagram of the Rydberg atom four-level system [46].
Jmse 14 01110 g006
Figure 7. (a) Schematic diagram of the device [48]; (b) measurement results diagram [48]; (c) energy level schematic diagram [49]; (d) measurement results of power-frequency electric-field signals at different frequencies [49].
Jmse 14 01110 g007
Figure 8. (a) Schematic diagram of NV-center structure [55]; (b) energy level schematic diagram of NV centers [56].
Jmse 14 01110 g008
Figure 9. (a) Spectral lines [61]; (b) corresponding Optically Detected Magnetic Resonance (ODMR) spectrum [55].
Jmse 14 01110 g009
Figure 10. (a) Comparison of current measurement results of the NV-center current transformer [64]; (b) magnetic measurement sensitivity of the NV-center magnetic sensor [64]; (c) principle of the current sensing method based on diamond NV centers [65]; (d) relationship between calculated current and actual current [65].
Jmse 14 01110 g010
Table 1. Comparison table of overall performance of the three methods.
Method CategoryTraditional MethodsQuantum Methods
Detection MethodsAdaptive Line Spectrum [23,24]Wavelet Transform [26,27]Others [35,36,37,38]Rydberg Atoms [47,48,49]NV Centers [59,60]
Frequency5 Hz10 Hz2.5 Hz, 4.73 HzDC, 45–55 HzDC,50 Hz
Sensitivity///67.9 µV/cm·Hz1/260 nT/Hz1/2
SNR10–20 dB ↑4.26 dB ↑11.36 dB ↑//
Intensity10 μV/m10–100 μV/m10–100 μV/m214.8 µV/cm100–500 A
Technical CharacteristicsStrong Adaptive CapabilityTime-Frequency Dual LocalizationStrong Noise-Suppression CapabilityHigh SensitivityHigh Sensitivity
Application ScenariosHigh-Noise ScenariosComplex Sea ConditionsUnderwater DetectionSpace-Constrained ScenariosMobile Platform
The upward arrow (↑) denotes an increase.
Disclaimer/Publisher’s Note: The statements, opinions and data contained in all publications are solely those of the individual author(s) and contributor(s) and not of MDPI and/or the editor(s). MDPI and/or the editor(s) disclaim responsibility for any injury to people or property resulting from any ideas, methods, instructions or products referred to in the content.