Article

Coupling Effects of Flow Regimes and Pulsation Frequencies on the Spatio-Temporal Evolution of Monopile Scour Through Experimental Study


1
School of Civil Engineering and Transportation, Foshan University, Foshan 528225, China
2
Department of Civil and Environmental Engineering, The Hong Kong Polytechnic University, Hung Hom, Kowloon, Hong Kong, China
*
Author to whom correspondence should be addressed.
J. Mar. Sci. Eng. 2026, 14(11), 991; https://doi.org/10.3390/jmse14110991
Submission received: 4 March 2026 / Revised: 18 May 2026 / Accepted: 24 May 2026 / Published: 27 May 2026
(This article belongs to the Special Issue Marine Geohazards and Offshore Geotechnics)

Abstract

Scour around monopile foundations is a pivotal challenge in nearshore engineering, as it undermines sediment support and threatens structural stability. This study systematically investigates the dynamic evolution of scour under four distinct flow regimes—steady, sinusoidal, pulsatile, and irregular—coupled with varying pulsation frequencies (39, 69, and 100 Hz). Utilizing a laboratory flume and underwater high-resolution imaging, near-pile flow velocities and morphological development were monitored in real time. Results indicate that the pulsation frequency, acting as the primary energy input, dictates the ultimate scour scale and acceleration. Three distinct evolutionary modes are identified: “gradual advancement” at 39 Hz, “ Rapid development phase” at 69 Hz, and “instantaneous stabilization” at 100 Hz. Higher frequencies concentrate energy release into the incipient stage, drastically shortening the duration to reach equilibrium. Morphological analysis reveals that equilibrium scour shapes are highly regime-dependent, manifesting as teardrop (steady), elliptical (sinusoidal), pronouncedly elliptical (pulsatile), and semi-circular (irregular) configurations. While scour dimensions generally scale with frequency, their sensitivity is governed by the flow regime; Constant Current Flow exhibits the highest volumetric vulnerability, whereas pulsatile flow demonstrates the greatest morphological stability. These findings provide a theoretical framework for predicting scour geometry in complex marine environments and optimizing foundation protection strategies.

1. Introduction

Scour around monopile foundations is a critical issue in nearshore engineering, especially for structures such as wind turbines and bridges, where stability and durability are of vital importance. Scour refers to the process by which sediment around the foundation is eroded due to hydrodynamic action, resulting in the formation of a scour hole. This reduces the embedded depth of the pile and increases the cantilever length, significantly lowering the natural frequency of the structural system, greatly threatening structural safety and endangering the integrity of the monopile. To ensure structural safety and avoid resonance, it is essential to maintain a sufficient separation between the natural frequency of nearshore wind turbines and the frequencies of environmental loads as well as turbine operational frequencies. The significance of scour lies in its potential to reduce the bearing capacity of the foundation and increase bending moments, which may eventually lead to catastrophic failure if left unaddressed [1]. This process is influenced by complex interactions between flow regimes, sediment properties, and the geometry of the monopile, thus presenting a multifaceted challenge for engineers and researchers. Understanding these interactions is essential for designing effective scour protection measures and guaranteeing the safety of nearshore infrastructure.
The development of scour is closely tied to the flow regimes around monopile foundations, which can vary significantly depending on environmental conditions such as tidal currents, waves, and combined wave–current flows. For instance, reversing tidal currents, as studied by McGovern DJ. [2], create a symmetrical scour hole but with a slower development rate compared to unidirectional flows. This highlights the importance of considering temporal variations in flow conditions when predicting scour evolution. Similarly, Geng et al. [3] emphasizes the role of tidal patterns, such as square and sinusoidal tides, in shaping scour progression, with symmetrical tides producing deeper scour depths than asymmetrical ones. These findings underscore the need for accurate modeling of flow regimes to predict scour behavior under realistic nearshore conditions.
Current experimental research methodologies for local scour around nearshore wind turbine monopile foundations primarily include laboratory model tests and field monitoring. Numerous researchers investigated the local scour depth around monopiles under unidirectional current conditions and its influencing factors (e.g., water depth, pile size, sediment grain size) through laboratory model tests [4,5,6,7,8,9,10,11]. Experimental work by Goutiere et al. [12] demonstrated the utility of non-intrusive measurement techniques, such as ultrasonic sensors and digital imaging, in capturing two-dimensional morphological evolution in abruptly expanding channels. Their findings revealed significant scour at expansion corners, accompanied by deposition in wider sections, highlighting the sensitivity of scour patterns to flow geometry. Ma et al. [13] performed large-scale laboratory flume tests to study the development process of local scour depth around a monopile under both fixed-bed and live-bed conditions at different water depths. The experimental results demonstrated that scour initiates upstream of the pile and progressively expands circumferentially, while deposition occurs downstream initially before eventually developing into a scour hole. Gong et al. [14] conducted large-scale physical model tests to study local scour around monopiles under Irregular Flows. For Keulegan–Carpenter (KC) numbers ranging from 4 to 9, they examined the equilibrium scour depth and scour hole volume, subsequently proposing predictive formulas for these parameters. Yan et al. [15] also employed large-scale physical model tests to study local scour around large-diameter nearshore wind monopiles under Irregular Flows. Their results indicated that when the KC number is less than 4 [16], scour primarily occurs on both sides of the pile with limited depth. However, when the KC number exceeds 6 [17], the scour hole morphology transitions from a fan shape to an elliptical shape, accompanied by a significant increase in the maximum scour depth. These studies have deepened the understanding of the scour process under individual hydrodynamic forcing and laid a foundation for research on pile scour under more complex conditions.
In-depth systematic field in situ observation and data analysis focusing on the local scour of monopile foundations have been conducted by some researchers. These studies provide profound insights into the scour mechanisms and predictive models based on field-measured data. Sun et al. [18] investigated the pile foundations of the Chengdao Oilfield platforms. Through the analysis of long-term field monitoring data, their research elucidated the dynamic evolution process of local scour around the piles and the morphological characteristics of the scour holes under tidal currents, yielding practically valuable scour data for engineering reference. The study pointed out that although the results calculated by existing empirical formulas are slightly greater than the field observations, these formulas still maintain a certain degree of applicability for predicting scour depth around piles in this specific sea area. Whitehouse et al. [19] systematically investigated the scour conditions at ten European nearshore wind farms. It was found that under sandy seabed conditions, the scour depth around monopiles does not increase indefinitely with prolonged exposure time; the maximum scour depth ranges from approximately 1.38 to 1.47 times the pile diameter. Furthermore, the study noted that the interaction between currents and scour protection systems can induce scour at the edges of the protection layer and secondary scour phenomena. The depth of such scour may even exceed the local scour caused by the monopile foundation itself. Field observations collectively indicate that flow regimes in real marine environments are complex and highly variable. Disturbances from pulse-type sources (e.g., vessel traffic, operation of subsea equipment) may also influence the scour process.
Based on the analysis, existing studies have primarily focused on the local scour depth and morphology around monopile foundations under regular flows, Irregular Flows, Constant Current Flows, or single pulse frequencies, providing relatively in-depth insights. However, few studies have systematically investigated the correlation between flow field variations and the evolution process of the scour hole around a monopile under the coupled action of different flow regimes and pulse source frequencies. In practical marine environments, flow regimes are complex and variable, and disturbances generated by pulse-type sources (e.g., vessel traffic, operation of subsea equipment) may also influence the scour process. Consequently, it is necessary to conduct laboratory physical model tests to systematically study the temporal evolution of both the flow field around the pile (such as flow velocity at specific locations from the pile side) and the scour hole morphology under the coupled influence of different flow regimes and pulse source frequencies.
Although numerous studies have investigated monopile scour under steady flow, unsteady flow, wave–current interaction, and pulsating or oscillatory forcing, no previous experiments have systematically evaluated the interaction between different flow–regime transitions and controlled pulsation frequencies, nor their combined influence on scour evolution. In contrast, the present study introduces a coupled-driver experimental framework in which the flow regime and pulsation frequency are independently controlled. Meanwhile, the use of high-frequency water-surface and morphology monitoring enables us to capture transient scour responses with improved temporal resolution. The experimental design employs four representative high-frequency flow conditions to simulate harsh marine environments. Flow velocity at specific locations around the monopile is measured under different pulsation frequencies, and the scour-pit evolution is recorded using an underwater camera. By analyzing the effects of various flow regimes and pulsation frequencies on scour morphology, this study further investigates how high-frequency energy input alters the initial motion state of sediment. The findings provide a more comprehensive theoretical basis for predicting and mitigating scour around nearshore wind-turbine monopiles, offering substantial engineering value for ensuring the long-term stability of coastal wind-energy infrastructure.

2. Experiment Setup

2.1. Basic Setup

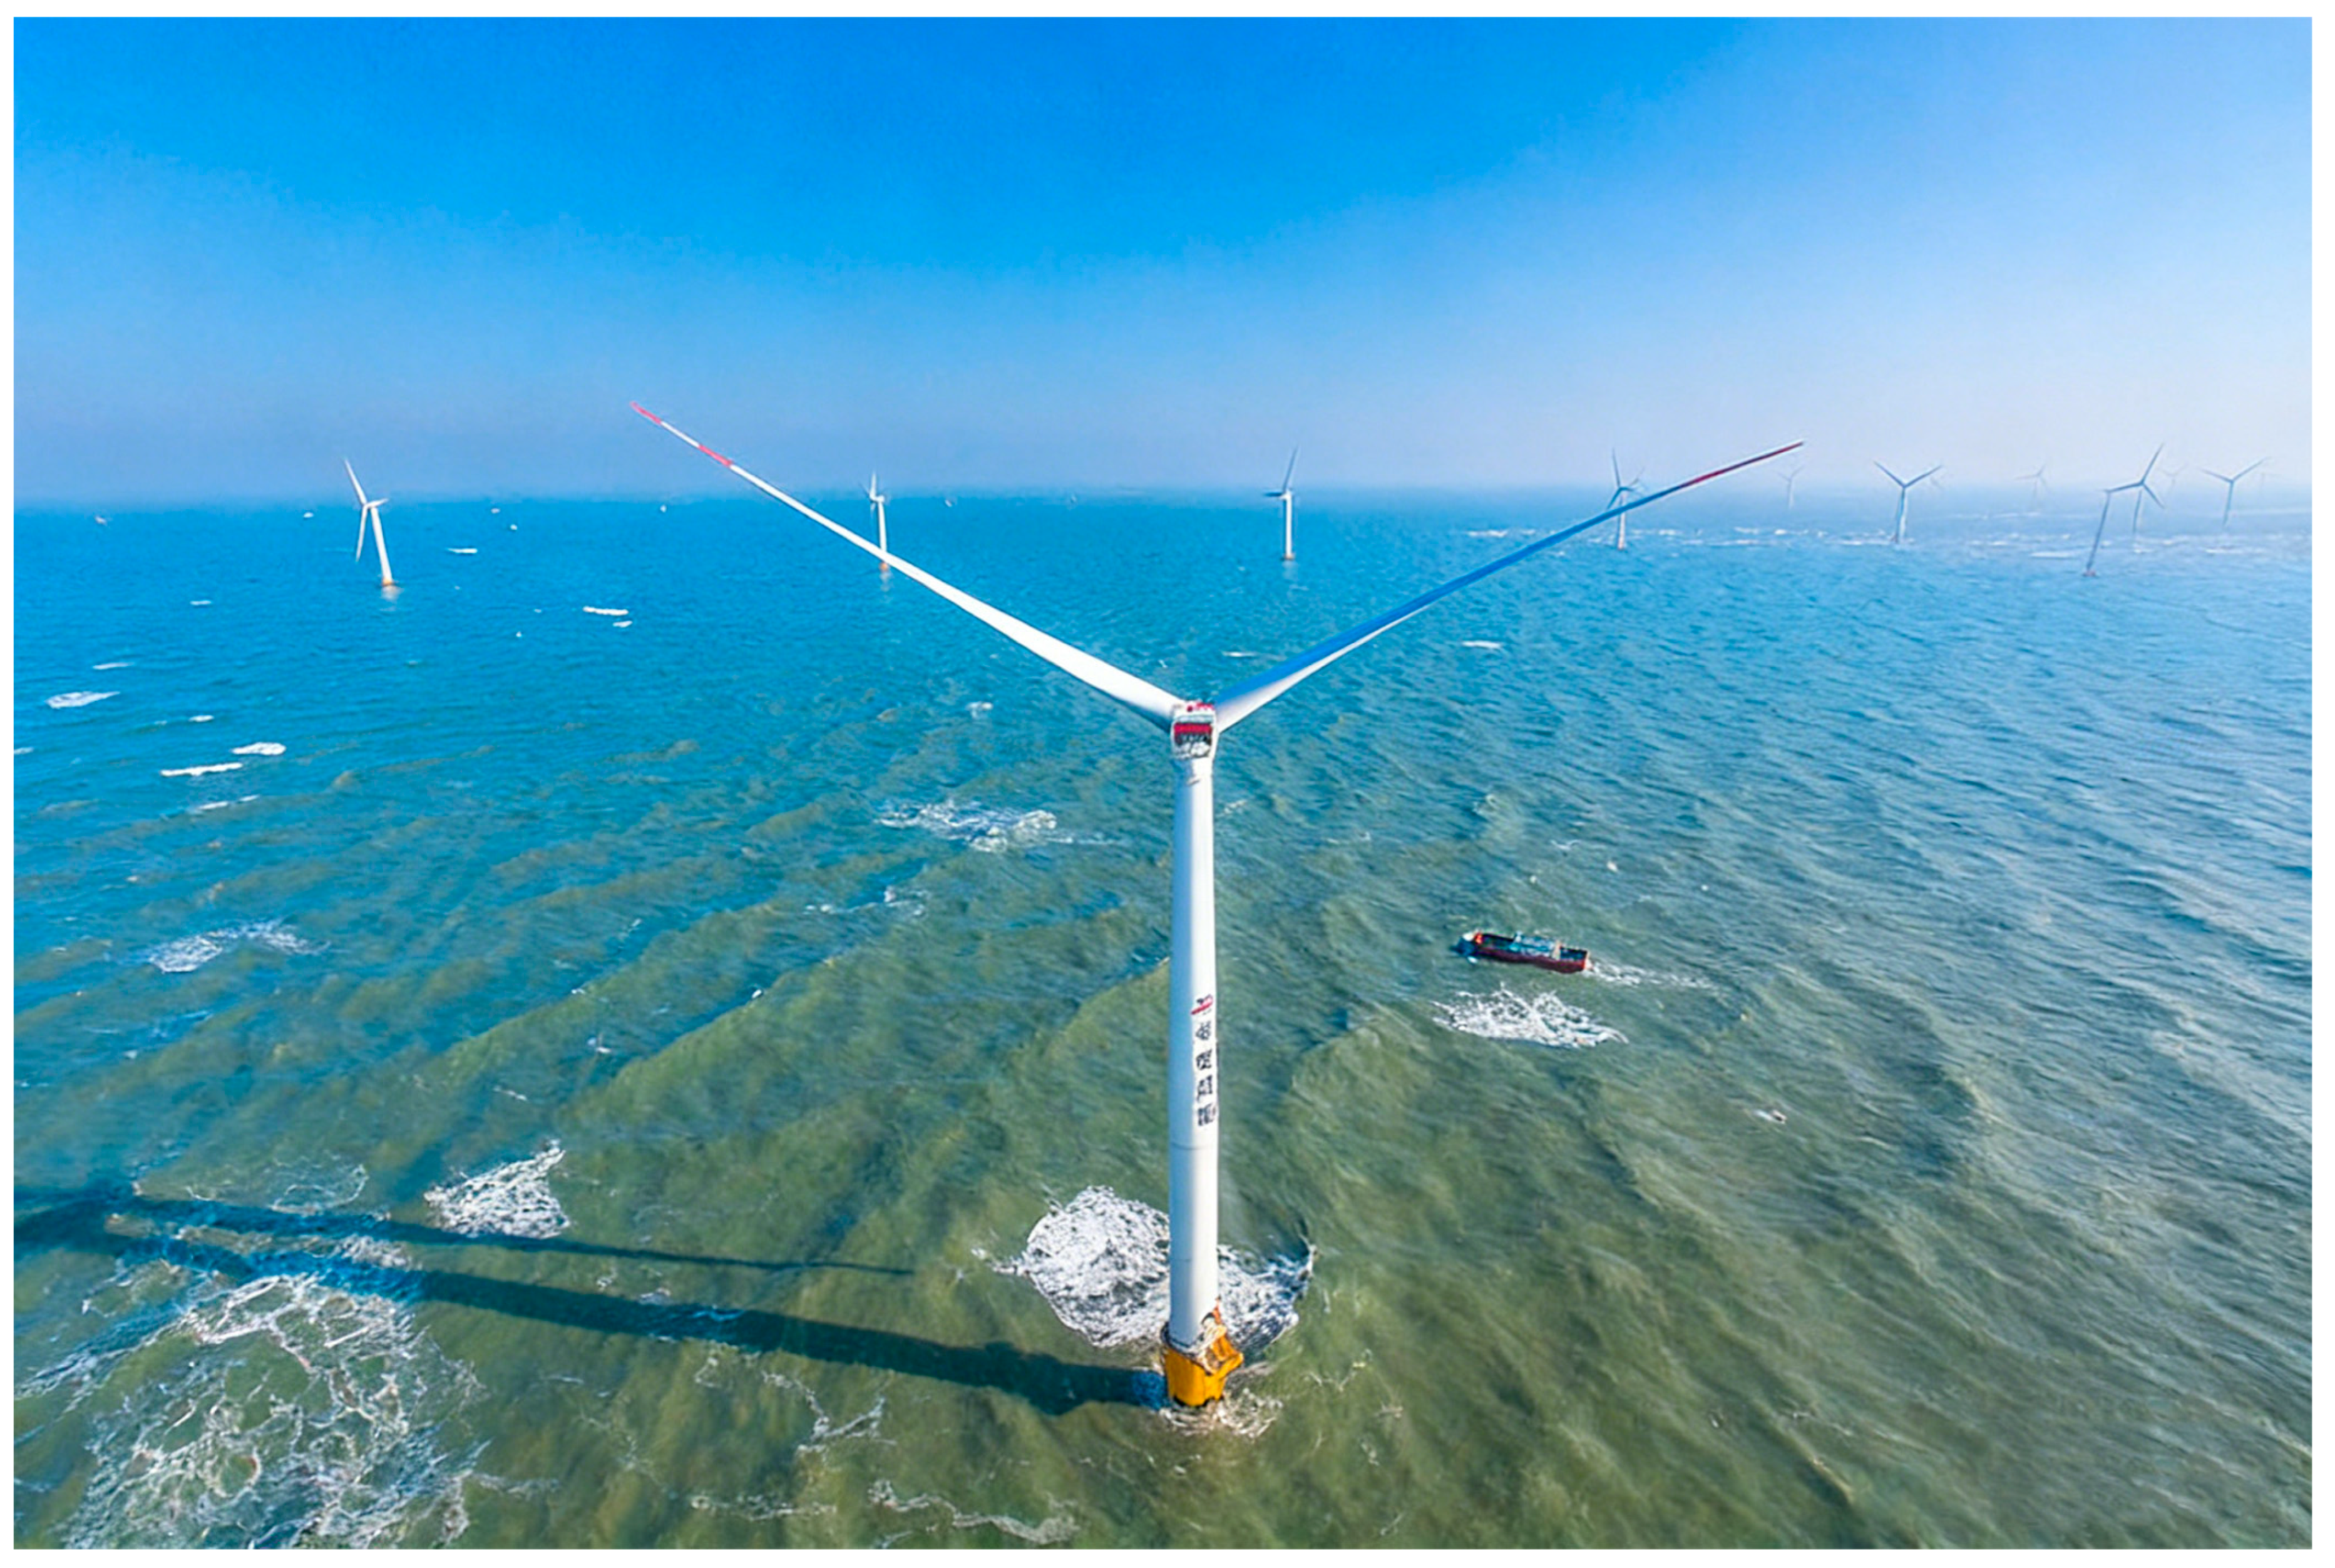
The scour experiments in this study were designed to simulate the site conditions of a nearshore wind farm located in the eastern coastal waters of Zhanjiang, Guangdong Province (Figure 1). This wind farm utilizes 5.5 MW wind turbines with a rotor diameter of 155 m and a hub height of 100 m. The turbines are supported by monopile foundations with a diameter of 7 m [20]. The primary engineering parameters of the site are summarized in Table 1. Due to variations in the hydrodynamic conditions of the waters where pile foundations are situated, local scour around piles can be categorized into three types based on different incoming flow conditions, namely: local scour under current-only action, local scour under wave-only action, and local scour under combined wave–current action. On the basis of the first type (local scour under current-only action), this experiment adopts four distinct flow patterns to investigate their respective scouring effects on monopile foundations [21,22].
Adherence to gravitational similarity scaling in physical experiments necessitates the proportional reduction of all parameters, from environmental conditions to monopile dimensions. This requirement, however, poses a significant challenge for sediment scaling. The theoretical grain size needed to satisfy similarity laws for sediment transport is often so fine that it becomes unworkable. Such model sediments are susceptible to cohesive effects like flocculation and extended suspension, thereby hindering accurate measurement of the scour hole geometry. In response to this issue, a methodology of multi-scale testing has been proposed [23]. This technique involves performing experiments at several different scales and then extrapolating the results via a double logarithmic coordinate system to derive the prototype behavior. A key advantage of this approach is its ability to mitigate scale effects arising from the unavoidable discrepancies between model and prototype sediment properties. Therefore, the present study employs a series of geometric and similarity ratios in its laboratory scour experiments. Data from each scaled test will be subjected to linear fitting and extrapolation on a log–log plot to yield the relevant prototype data at a 1:1 scale. The respective scaling ratios can be calculated using the formulas provided in Table 2. To avoid viscosity induced by scaled-down sand, prototype sand was adopted as the test sand in this experiment, resulting in a scale ratio of 1 for all sediment-related parameters. For example, λ d   =   λ γ s =   λ γ s γ / γ   =   λ w   =   λ j   =   1 . During the scale design process, we found that the scaling design for monopile scour is critical to the success of physical model tests. Although the mainstream approach in the field is to adopt large-scale models designed according to the sediment incipient motion similarity criterion, our focus remains on the flow dynamic similarity (Keulegan–Carpenter number, KC) and sediment transport similarity (Shields parameter).
To avoid viscosity induced by scaled-down sand, prototype sand was adopted as the test sand in this experiment, resulting in a scale ratio of 1 for all sediment-related parameters. For example, regarding local scour around small-diameter monopiles under wave conditions, Kobayashi et al. [24] and Sumer et al. [17] argued that the Keulegan–Carpenter (KC) number is the primary parameter influencing the equilibrium scour depth, with the relevant formula expressed as follows:
K C = U T D
In which U is the characteristic near-bed water particle velocity, T is the spectral peak period, and D is the pile diameter. Under pure wave conditions, the equilibrium scour depth around small-diameter monopiles is mainly determined by the KC number. For the prediction of equilibrium scour depth under wave conditions, Sumer et al. [17] proposed an empirical formula for equilibrium scour depth under movable bed scouring conditions based on experimental data from small flumes and regular waves:
S w / D = 1.3 1 e x p 0.03 ( K C 6 ) , K C 6
The KC number in this experiment was calculated as 22 using Formula (1). Substituting the final scour depth obtained from the subsequent M1 (Constant Current Flow) test into Formula (2) verified the validity of the formula.
A Kármán vortex street may form downstream of objects with various shapes, with the circular cylinder being the most classical case; therefore, most related studies are based on cylinder wake flow. A regular Kármán vortex street develops only when the Reynolds number falls within a specific range. Under such conditions, vortex shedding becomes the primary source of cross-flow-induced vibration, generating a periodic transverse force on the object (perpendicular to the incoming flow direction). If the shedding frequency approaches the natural frequency of the structure, resonance may occur, posing potential risks of structural damage. In the study of flow around bluff bodies, the Strouhal number is an important similarity parameter used to characterize periodic motions with a characteristic frequency. In this work, we introduced the Strouhal number and calculated representative values for the different experimental conditions (see Table 3). The Strouhal number is defined as [25,26]:
S t = f L U
In which f is the characteristic shedding frequency (Hz), L is the characteristic length (typically the cylinder diameter or body width), U is the flow velocity. Since the frequency f used in this experiment is not the natural vortex -shedding frequency of the flow but an externally imposed high-frequency pulsation, it is substantially higher than the inherent vortex-shedding frequency of a circular cylinder. Consequently, the Strouhal numbers calculated based on this forcing frequency are much larger than the classical range of 0.18–0.22. Therefore, the Strouhal number in this study represents a parameter characterizing forced oscillations rather than the conventional vortex-shedding Strouhal number.
It is widely recognized that in scaled laboratory experiments it is highly challenging to strictly satisfy both Froude similarity (governing hydrodynamics) and Shields similarity (governing sediment transport), especially when prototype sediment is used to avoid cohesion effects. In this study, Froude similarity was prioritized to accurately reproduce the gravitational and inertial forces that dominate the flow field. As a result, discrepancies in the Shields parameter indicate potential scale effects, meaning the model may underestimate the threshold for sediment motion compared with the prototype. However, because this study focuses on comparing scour-evolution patterns under different flow regimes rather than predicting absolute prototype scour depths, the observed qualitative trends and morphological features remain valid and offer meaningful insights. The multi-scale testing approach mentioned in the manuscript represents a more rigorous framework for future quantitative extrapolation to prototype scale, while the present single-scale study serves as a fundamental exploration of the underlying physical mechanisms. In this experiment, geometric similarity and Froude similarity were largely satisfied, thereby preserving the key behaviors of the free surface and overall flow patterns. Since complete adherence to Shields similarity is not possible simultaneously, the experimental design aims to enable internal process comparisons within the model rather than strict quantitative projection to the prototype. The model times reported in this study (in minutes) are used solely for relative comparison among test conditions and are not intended for direct prototype-scale prediction.

2.2. Experimental Scheme

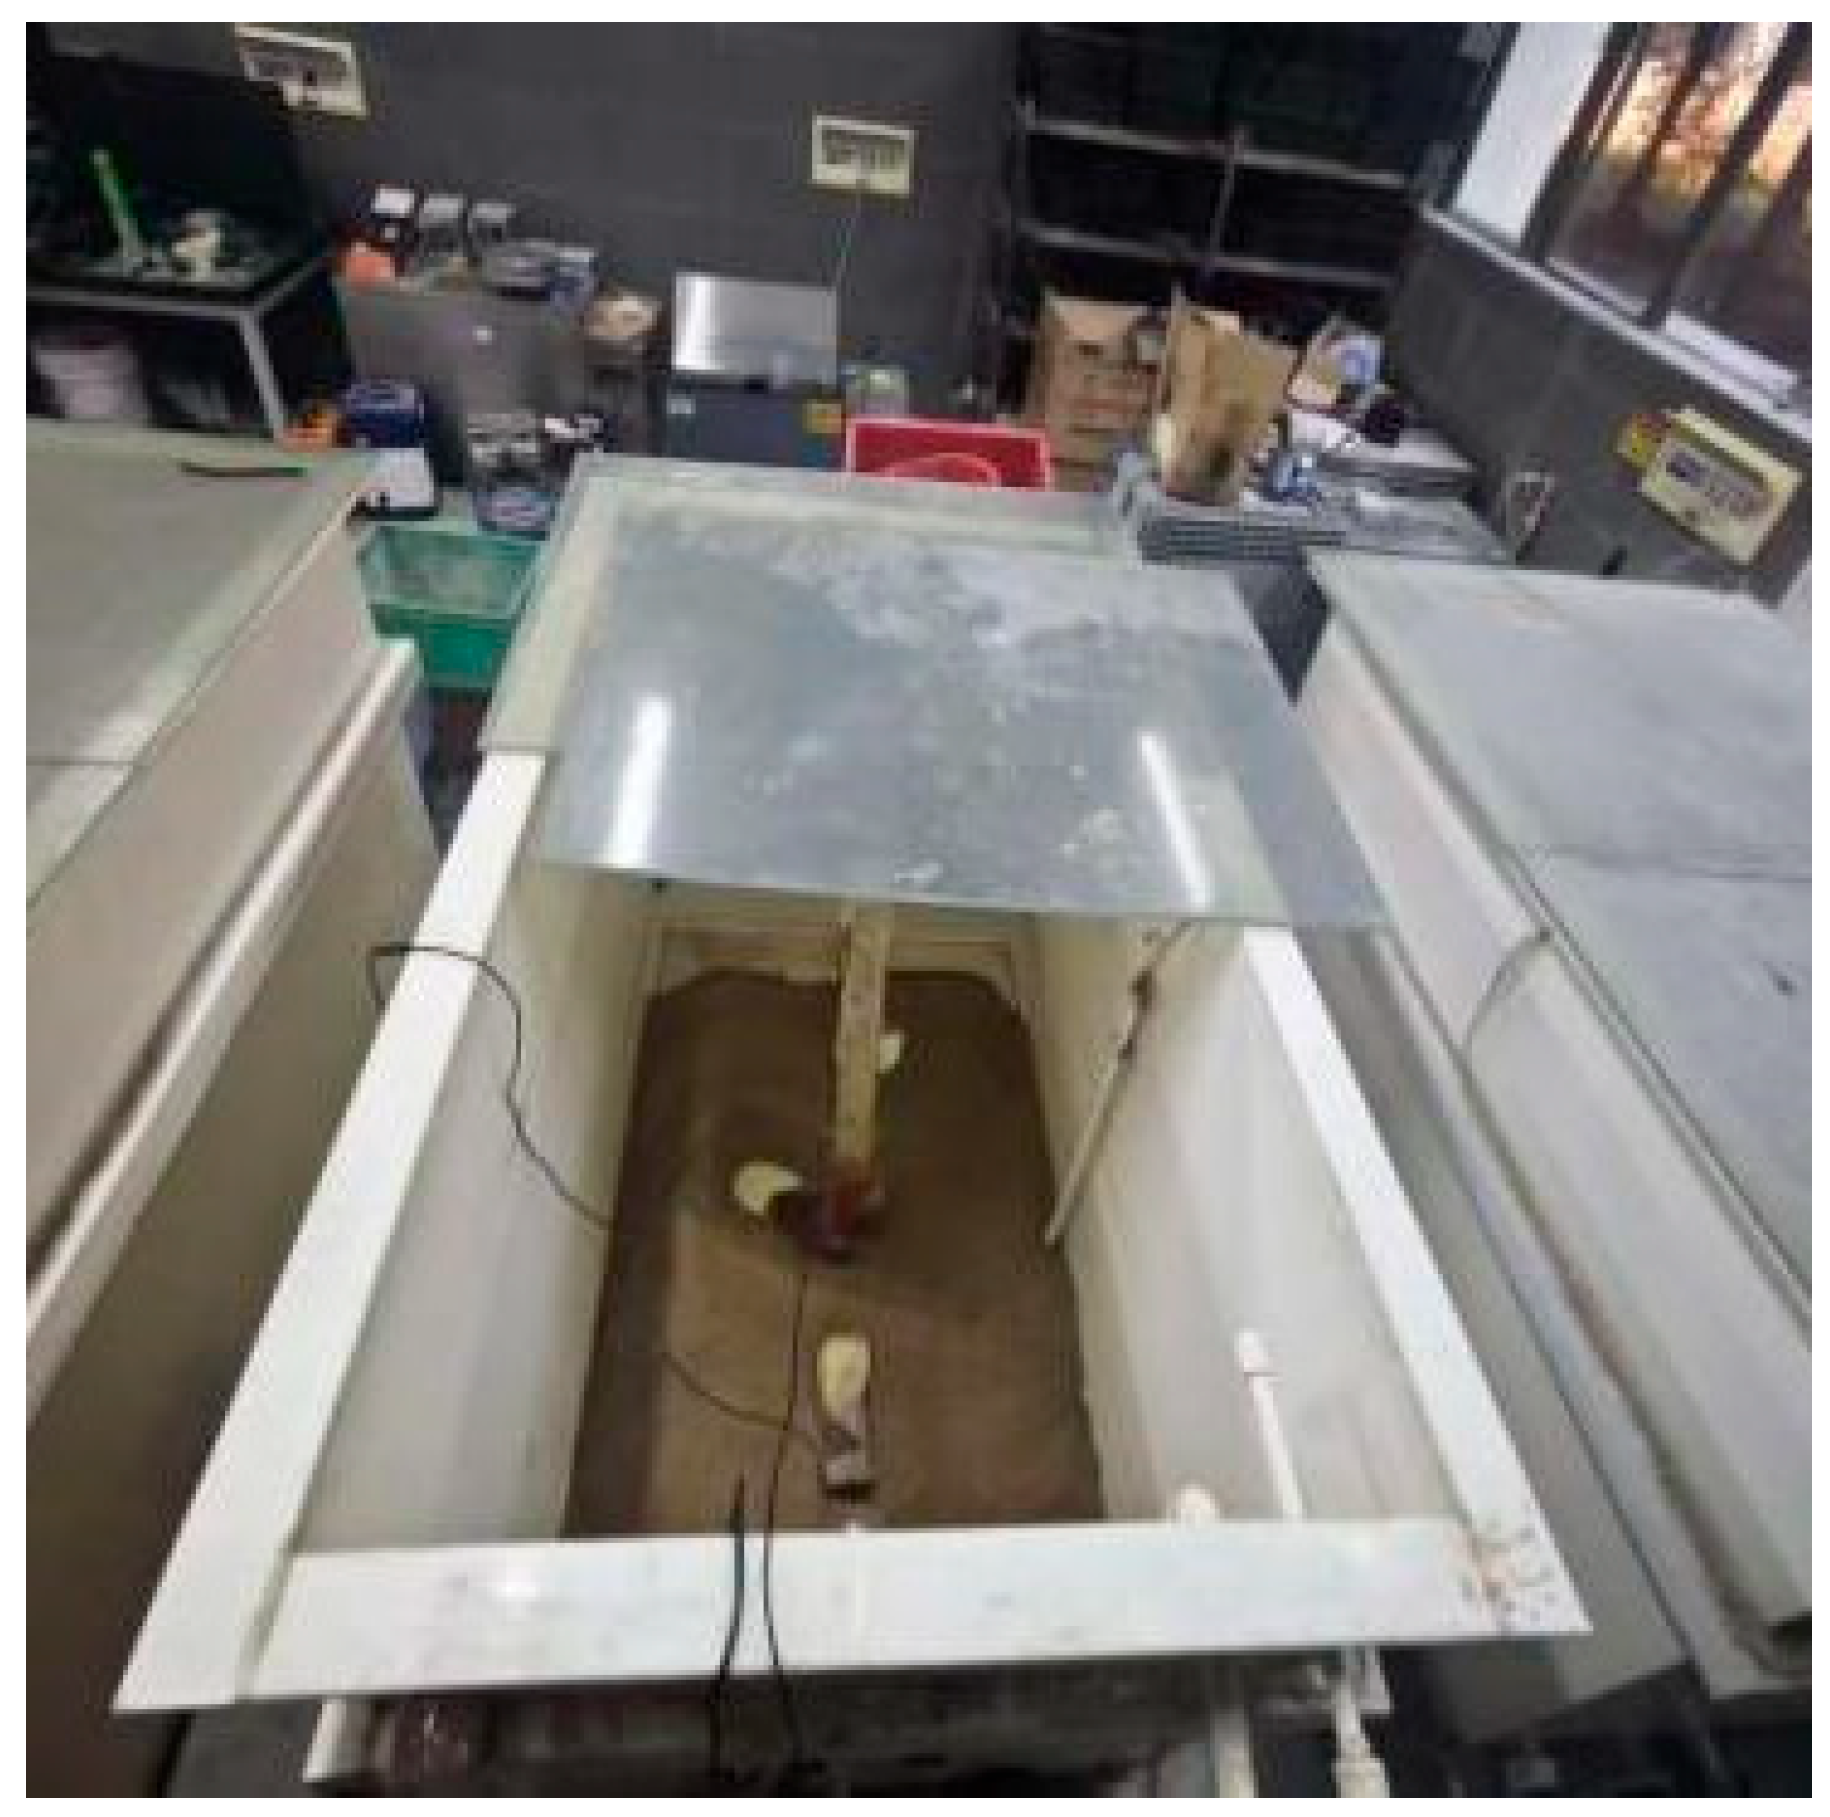
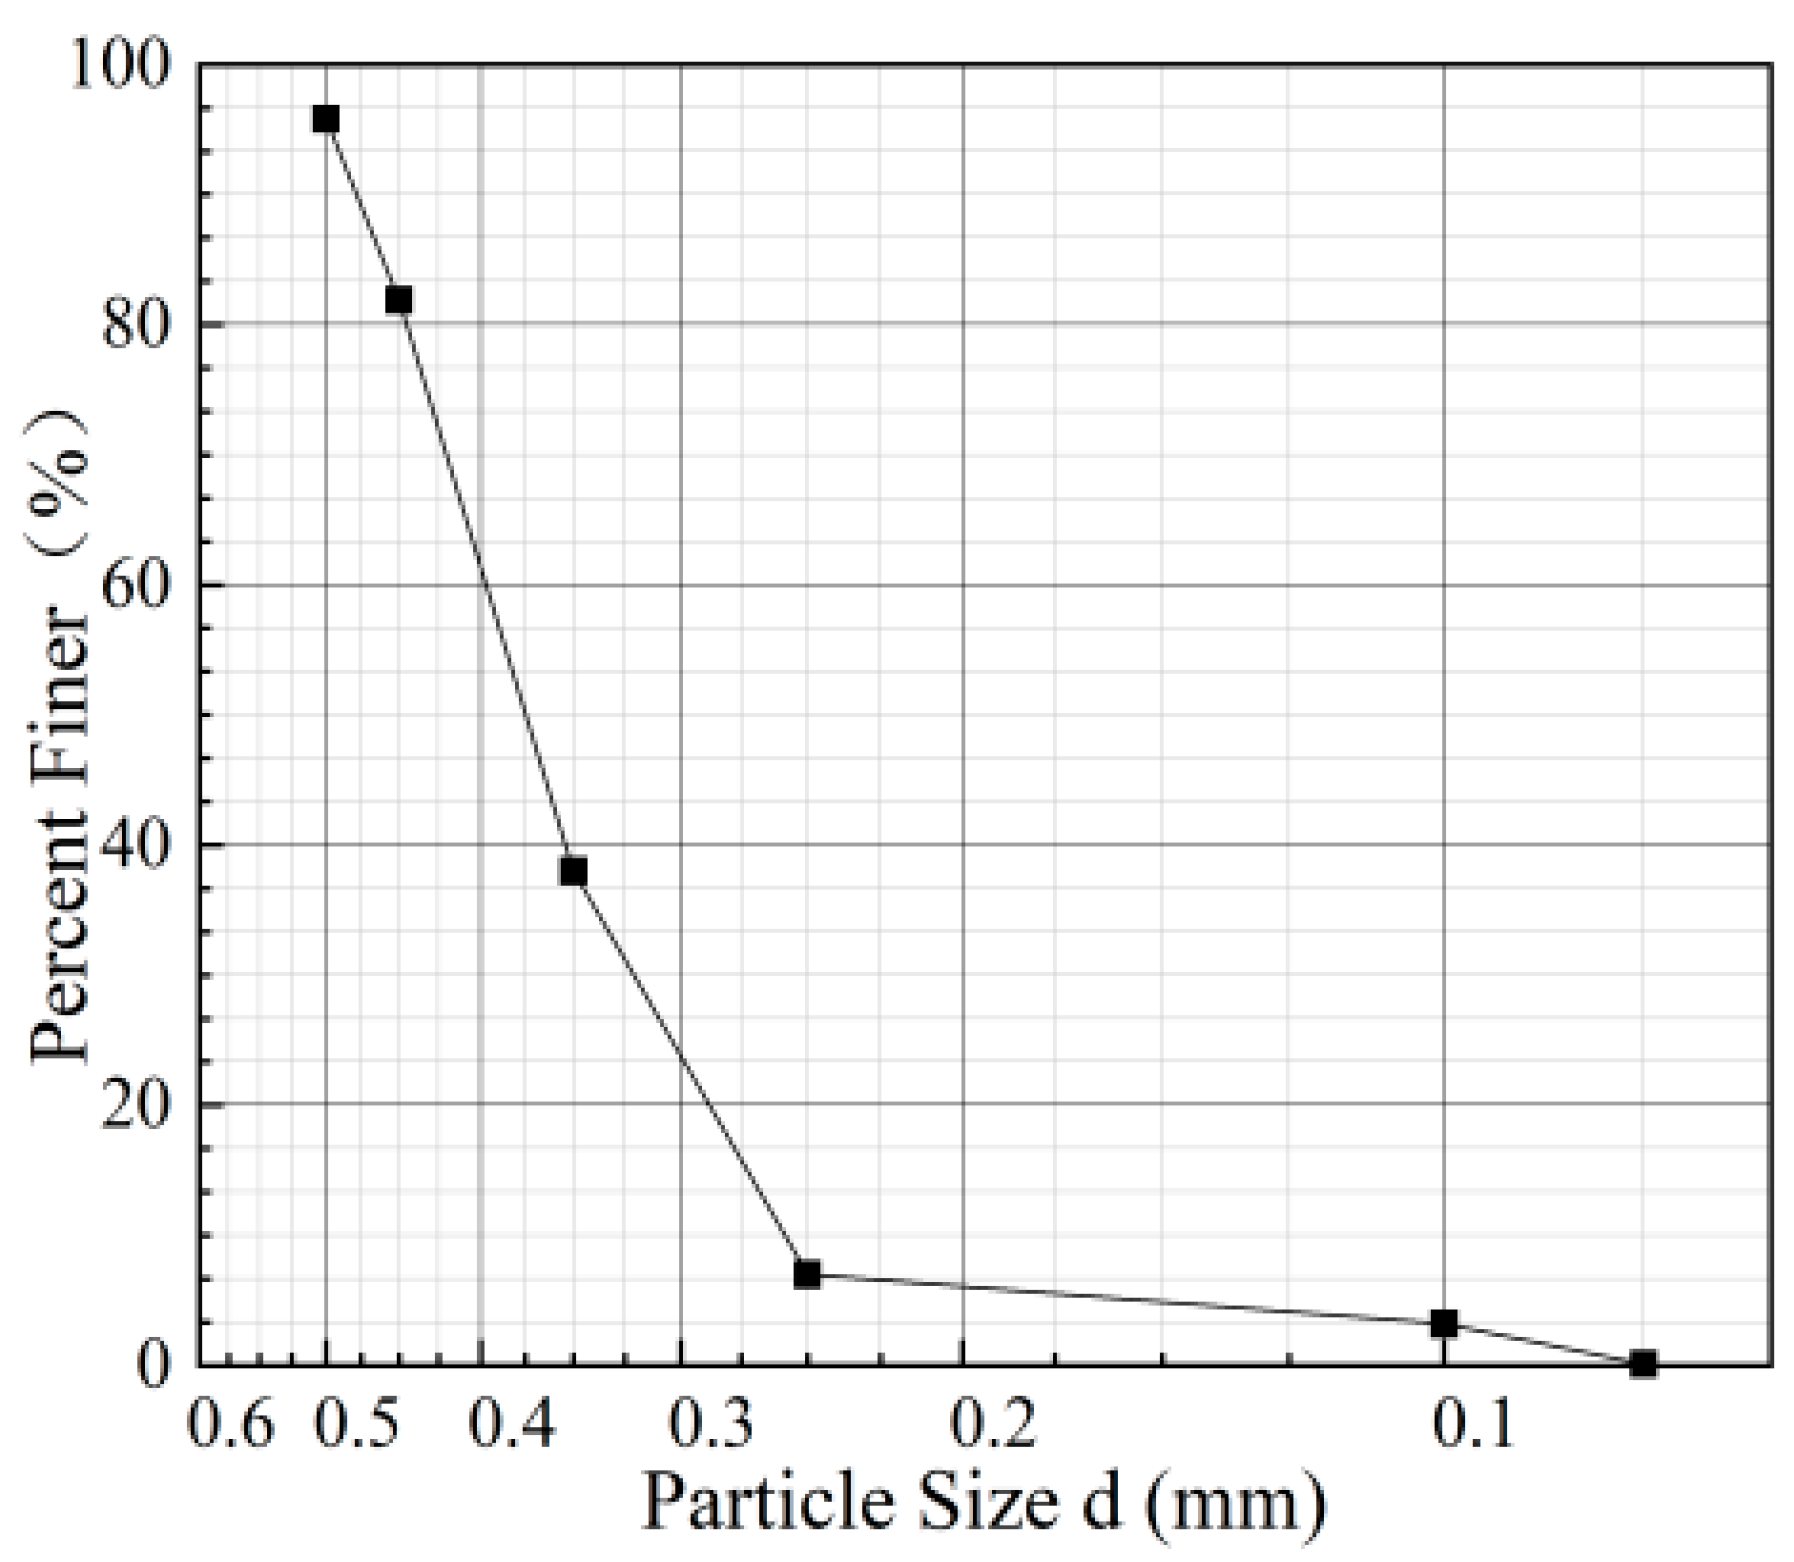
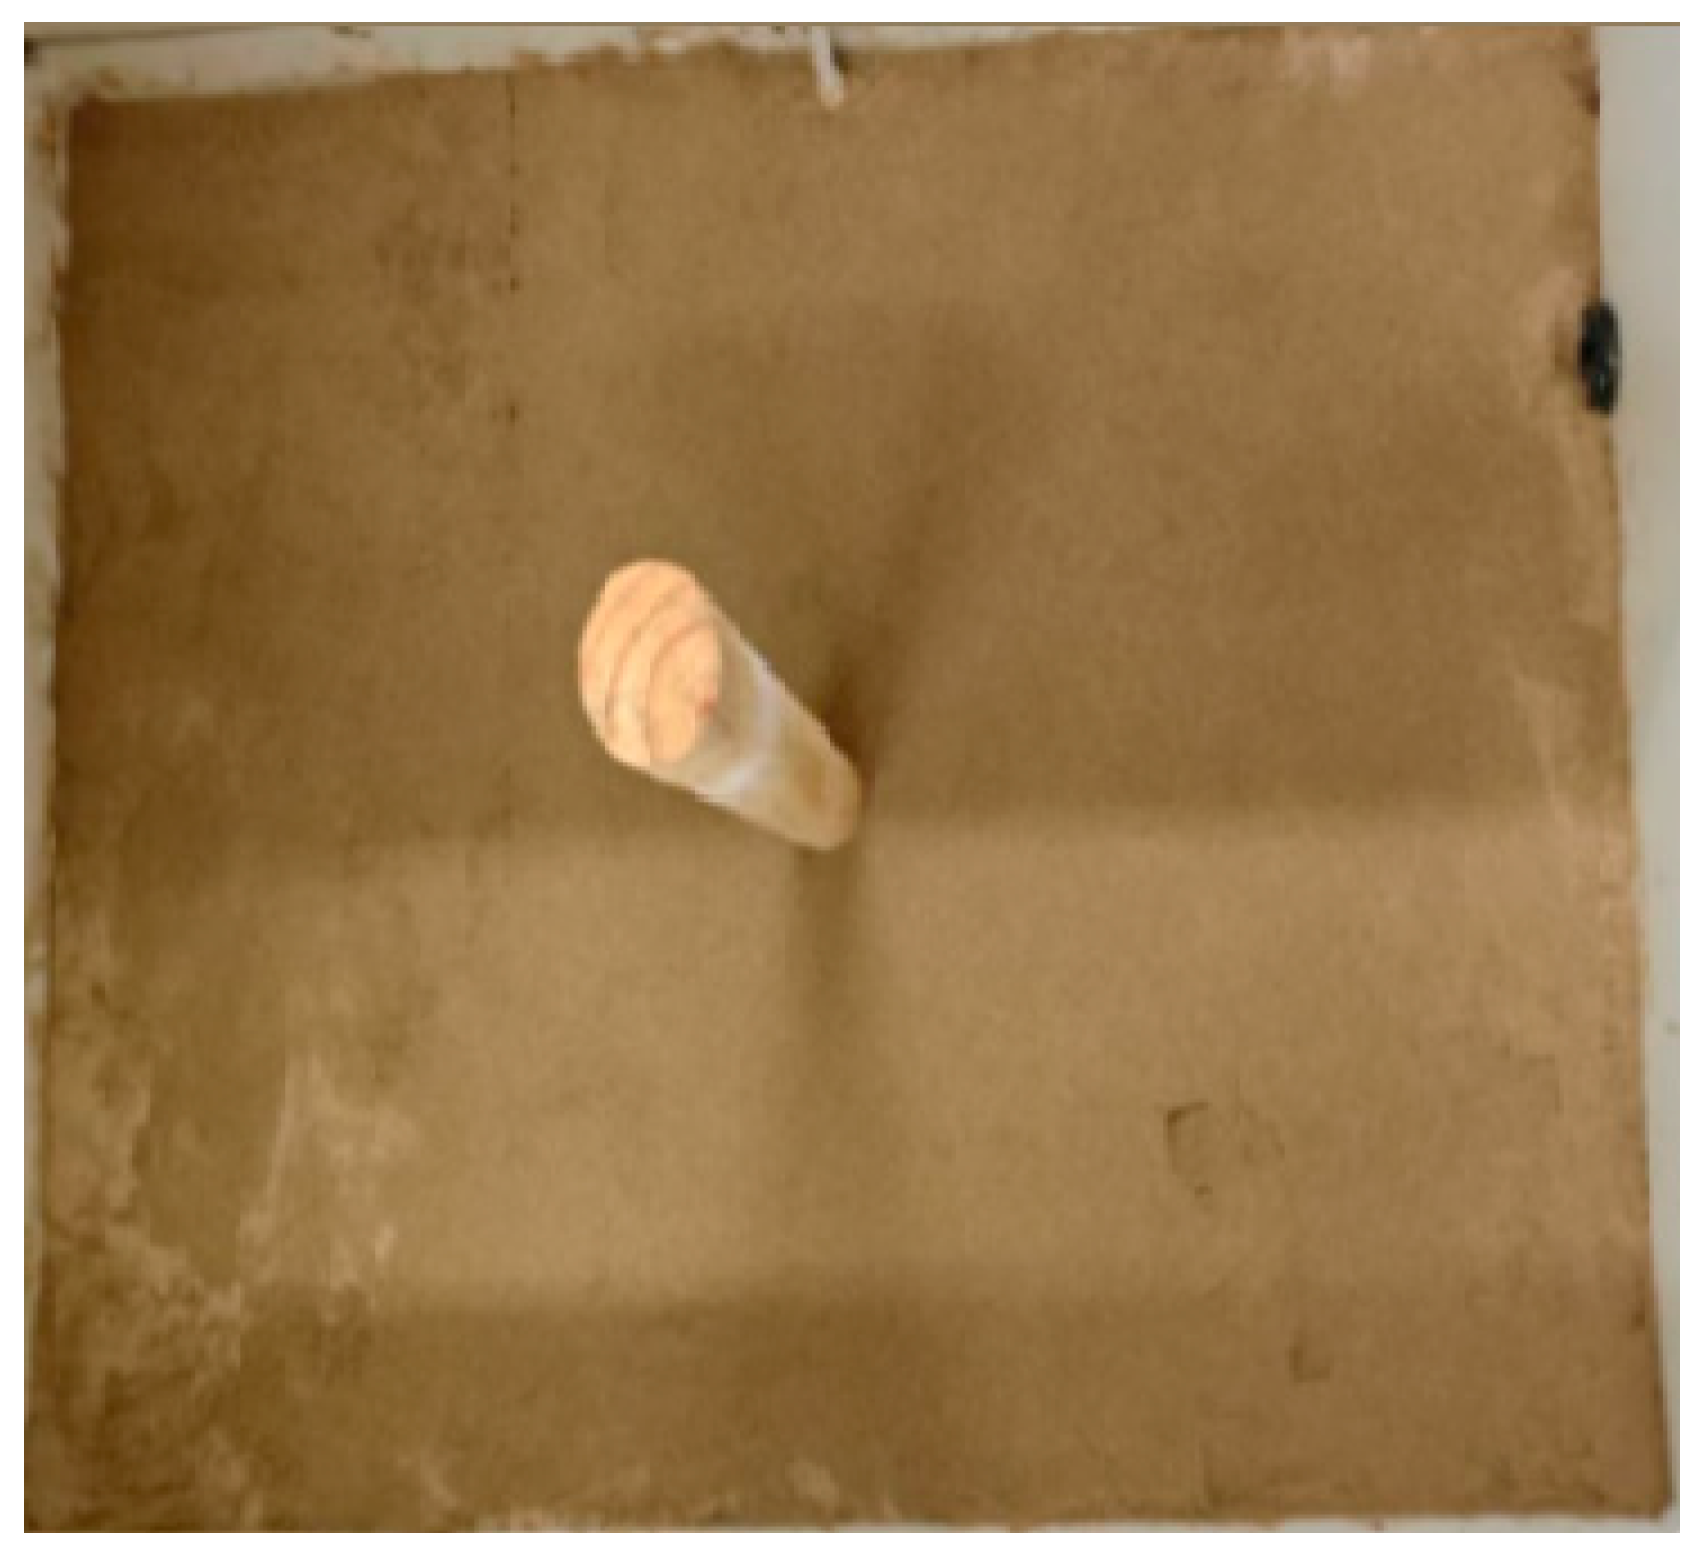
Based on scaling laws, the scour experiments were conducted in a flume measuring 1600   mm × 1000   mm × 1000   mm (Length × Width × Height). The flume was fabricated from modified polypropylene plates—selected for their superior corrosion resistance and thermal stability—using seamless welding and featured integrated automatic water supply and drainage systems (Figure 2). Owing to the size limitations of the model tank, even though the scour tests were carried out at a reasonable scale, the flow remained in a current state rather than forming waves. A 70 mm diameter wooden rod, coated with waterproof paint, was used to model the monopile foundation. Centrally positioned in the flume, the model pile had a length of 900 mm. As this study focuses on scour characteristics under horizontal flow, the pile length was not strictly scaled from the prototype but was chosen to match the flume height (Figure 3). According to [27], sidewall effects on local scour are negligible when the flume width ( B ) to pile diameter ( D ) ratio ( B / D ) exceeds 6. With a B / D   ratio of approximately 14.28, the boundary effects in this study were considered insignificant. However, under pulsating conditions, disturbances caused by sidewall reflections may occur and potentially influence the local hydrodynamics. To simulate the seabed, fine sand was laid at the flume bottom. Similar sediment gradations, where fine particles significantly influence the soil’s mechanical and hydraulic properties, have been widely adopted in previous research [28,29,30,31]. The grain size distribution of the sand is illustrated in Figure 4.
To simulate current-induced scour around the model pile, a fifth-generation circulation pump was installed at the upstream end of the flume. The pump operates at a rated power of 65 W with a maximum flow rate of 30,000 L/h, supporting four flow regimes: constant, sinusoidal, pulse, and Irregular Flow (Table 4). The pump is capable of producing pulsation frequencies between 30 and 100 Hz. Based on preliminary scour tests, this range was divided into seven frequency bands (e.g., 30–39 Hz, 40–49 Hz). The results indicated that frequencies within the same band produced nearly identical effects on scour morphology, whereas the influence of pulsation became progressively stronger with increasing frequency from one band to the next. Accordingly, the present study selected three representative frequencies—39 Hz, 69 Hz, and 100 Hz—to characterize low, medium, and high pulsation intensities for the systematic experiments. This pulsation frequency is not intended to simulate natural large-scale ocean currents, but rather to mimic high-frequency disturbances under specific engineering contexts, such as the operation of subsea pumping stations, high-frequency dynamic output from construction vessels, or special fluid-induced vibrations. The purpose is to investigate how high-frequency energy input alters the critical shear stress for the incipient motion of sediment.
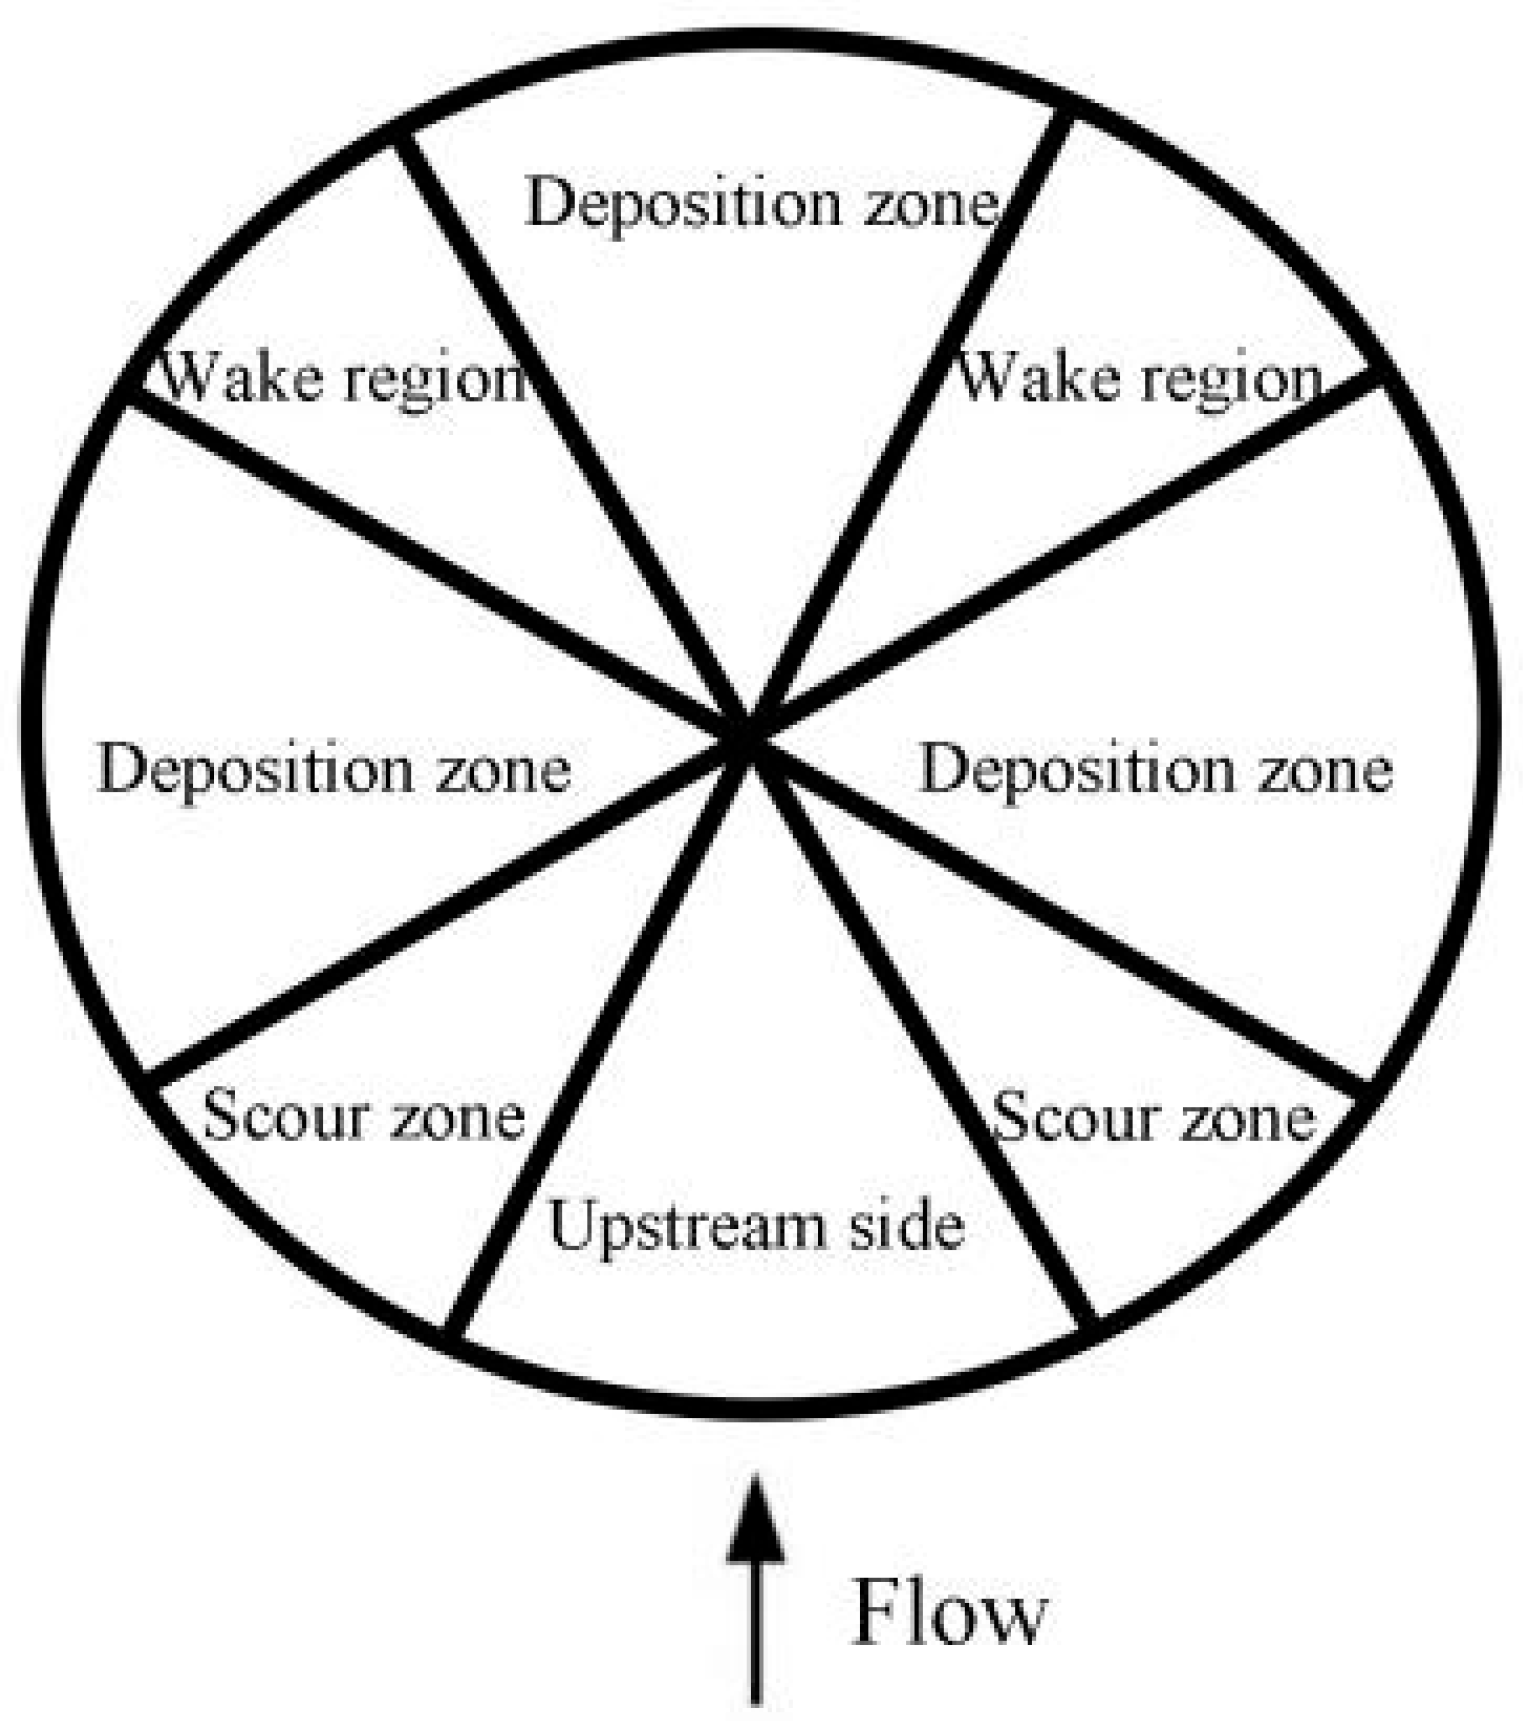
As currents propagate into nearshore areas, they undergo shoaling—characterized by increased height and decreased length—which eventually leads to breaking flows. Compared to non-breaking flows, breaking flows exert significantly higher impact forces on monopiles [32]. The intense energy dissipation associated with breaking flows can trigger substantial sediment transport, forming distinct scour holes that differ from the sand ripples typically generated by non-breaking flows [33]. According to the classification by [34], the local flow field around a pile can be categorized into four distinct zones: the Windward Face (Stagnation Zone), the Main Scour Zone, the Sedimentation Zone (Lee Wake), and the Lateral-Rear Zones (Figure 5): Illustrates the effect of scouring on the sand bed around a circular model pile during the scouring process: the sand on the upstream (wave-facing) side is primarily subjected to scouring, while the sand on the downstream (lee) side is mainly deposited. This schematic is applicable to wave-dominated nearshore monopile scour conditions, which is fully consistent with the “nearshore area and flow action” background of the experiments. Although the presence of backflow and non-unidirectional flow in the tests may cause deviations in the morphology of the side-wake and deposition zones, the core zoning law (scouring at the wave-facing side and deposition behind the pile) remains consistent. This zoning can directly explain the differences in the width and depth of the scour hole under different frequencies in the experiments: the higher the frequency, the greater the intensity of the vortices around the pile, the wider the scouring zone, the greater the scour depth, and the corresponding backward shift of the deposition zone.
The presence of a monopile significantly alters the local flow structure by introducing substantial bed resistance and turbulence, which ultimately drives the scouring process. Although scour mechanisms vary across hydrodynamic conditions, the vortex system generated around the pile remains the primary driver of sediment mobilization [35]. In this study, the four flow regimes interact with the model pile, inducing distinct breaking phenomena in its vicinity (Table 5), as detailed below:
  • Constant Current Flow: When a Constant Current Flow encounters the pile, the flow profile is modulated by energy redistribution and potential wave–current interactions [36]. This results in increased steepness upstream of the pile, leading to shear-induced breaking. This process is typically localized at the upstream face and is accompanied by intense turbulence.
  • Sine Flow: As Sine Flows propagate through shallow water, the local flow steepness increases as the water depth decreases. Upon reaching the breaking point, the flow height peaks [37]. Two typical breaking modes occur upstream: plunging and spilling breakers. Plunging breakers generate energetic vortices and high-velocity water jets that impinge directly on the seabed. Conversely, spilling breakers produce smaller vortices that remain near the free surface with lower associated velocities [38,39]. The relationship between incident and breaking flow characteristics is often quantified using the breaking index [40].
  • Pulse Flow: The interaction between Pulse Flows and the pile can result in either stable solitary flow propagation or pulse decomposition. A solitary flow breaking on the upstream face of the pile can exert the maximum breaking-induced scour force [9].
  • Irregular Flow: The encounter between Irregular Flows and the pile may generate extreme flow events [41], such as freak flows [42]. The breaking of these extreme flows produces complex turbulence and significant energy dissipation. Due to the inherent stochasticity of Irregular Flows, their breaking modes also exhibit high randomness [43].
In summary, these diverse breaking modes directly govern the formation of vortex structures and the mechanisms of energy dissipation, representing the core physical processes that dictate variations in scour hole morphology and development.
Current velocity for the four patterns was measured using an LS300-A rotor-type current meter (Nanjing Ouka Instruments Co., Ltd., Nanjing, Jiangsu, China). The measurement point was strategically located 25 mm from the pile side and 50 mm above the sand bed surface. This measurement point was designed to monitor the reference flow velocity of the far-field incoming flow after being disturbed by the monopile. Although it cannot fully replace the measurement of the complex flow field in front of the monopile, its flow velocity variation trend is highly correlated with the increase in scouring rate, serving as a quantitative indicator of energy input. A critical requirement of this experiment was the direct observation of scour hole formation induced by current-driven sediment transport. Since surface water disturbances frequently impeded visual clarity from above, an underwater imaging system was utilized. This system comprised two types of camera setups: a 2 m flexible cable (8 mm focal length, USB interface) for maneuverable, multi-angle positioning, and a 5 m rigid cable (8 mm focal length) for stable vertical orientation. During the scouring process, this system provided continuous, high-resolution monitoring of the bed surface. Key observations included the initiation of sediment resuspension, the geometric evolution of the local scour hole, and the migration of its boundaries. Image data were recorded throughout the entire test duration to capture the full dynamic cycle of the scour hole, from its initial formation and expansion to the eventual backfilling stage. The frequency of the water flow generated by the flow-generating pump was regulated by adjusting the speed governor of the circulating pump via a frequency converter. The LS300-A rotor current meter primarily records the time-averaged flow velocity. High-frequency imaging observations revealed a “micro-vibration” effect of sediment particles induced by flow velocity fluctuations, which indirectly confirms energy transfer.
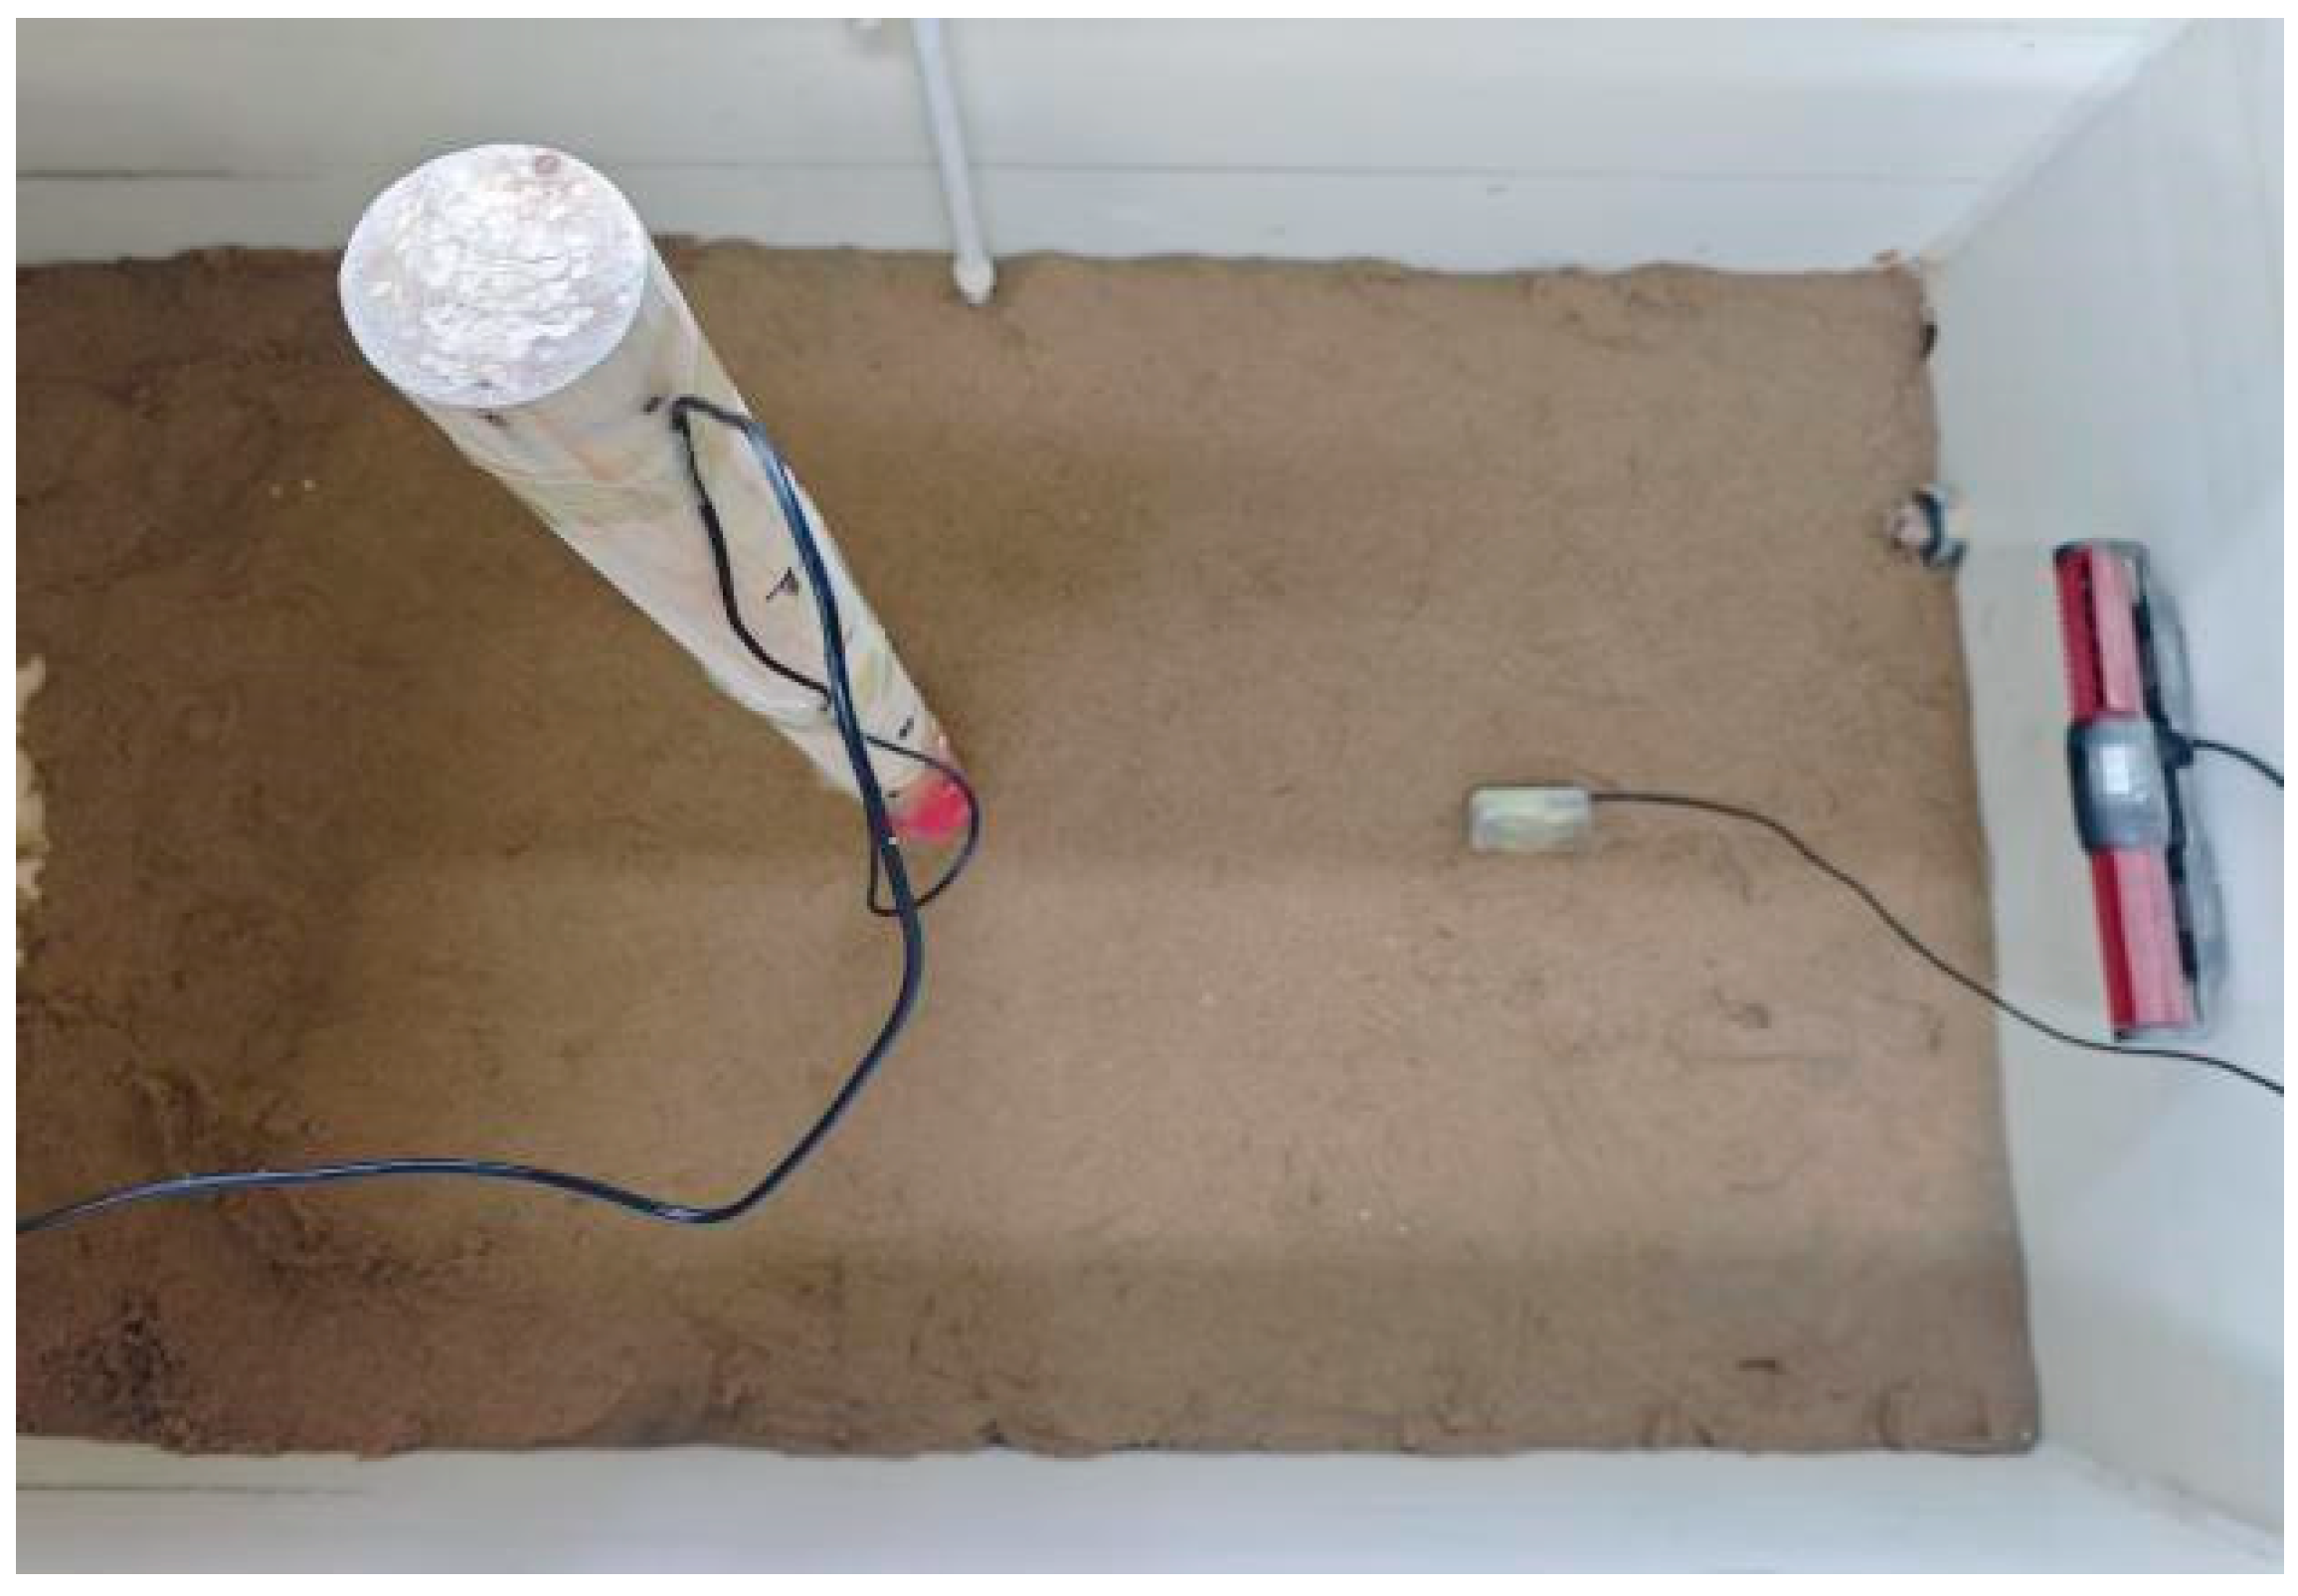
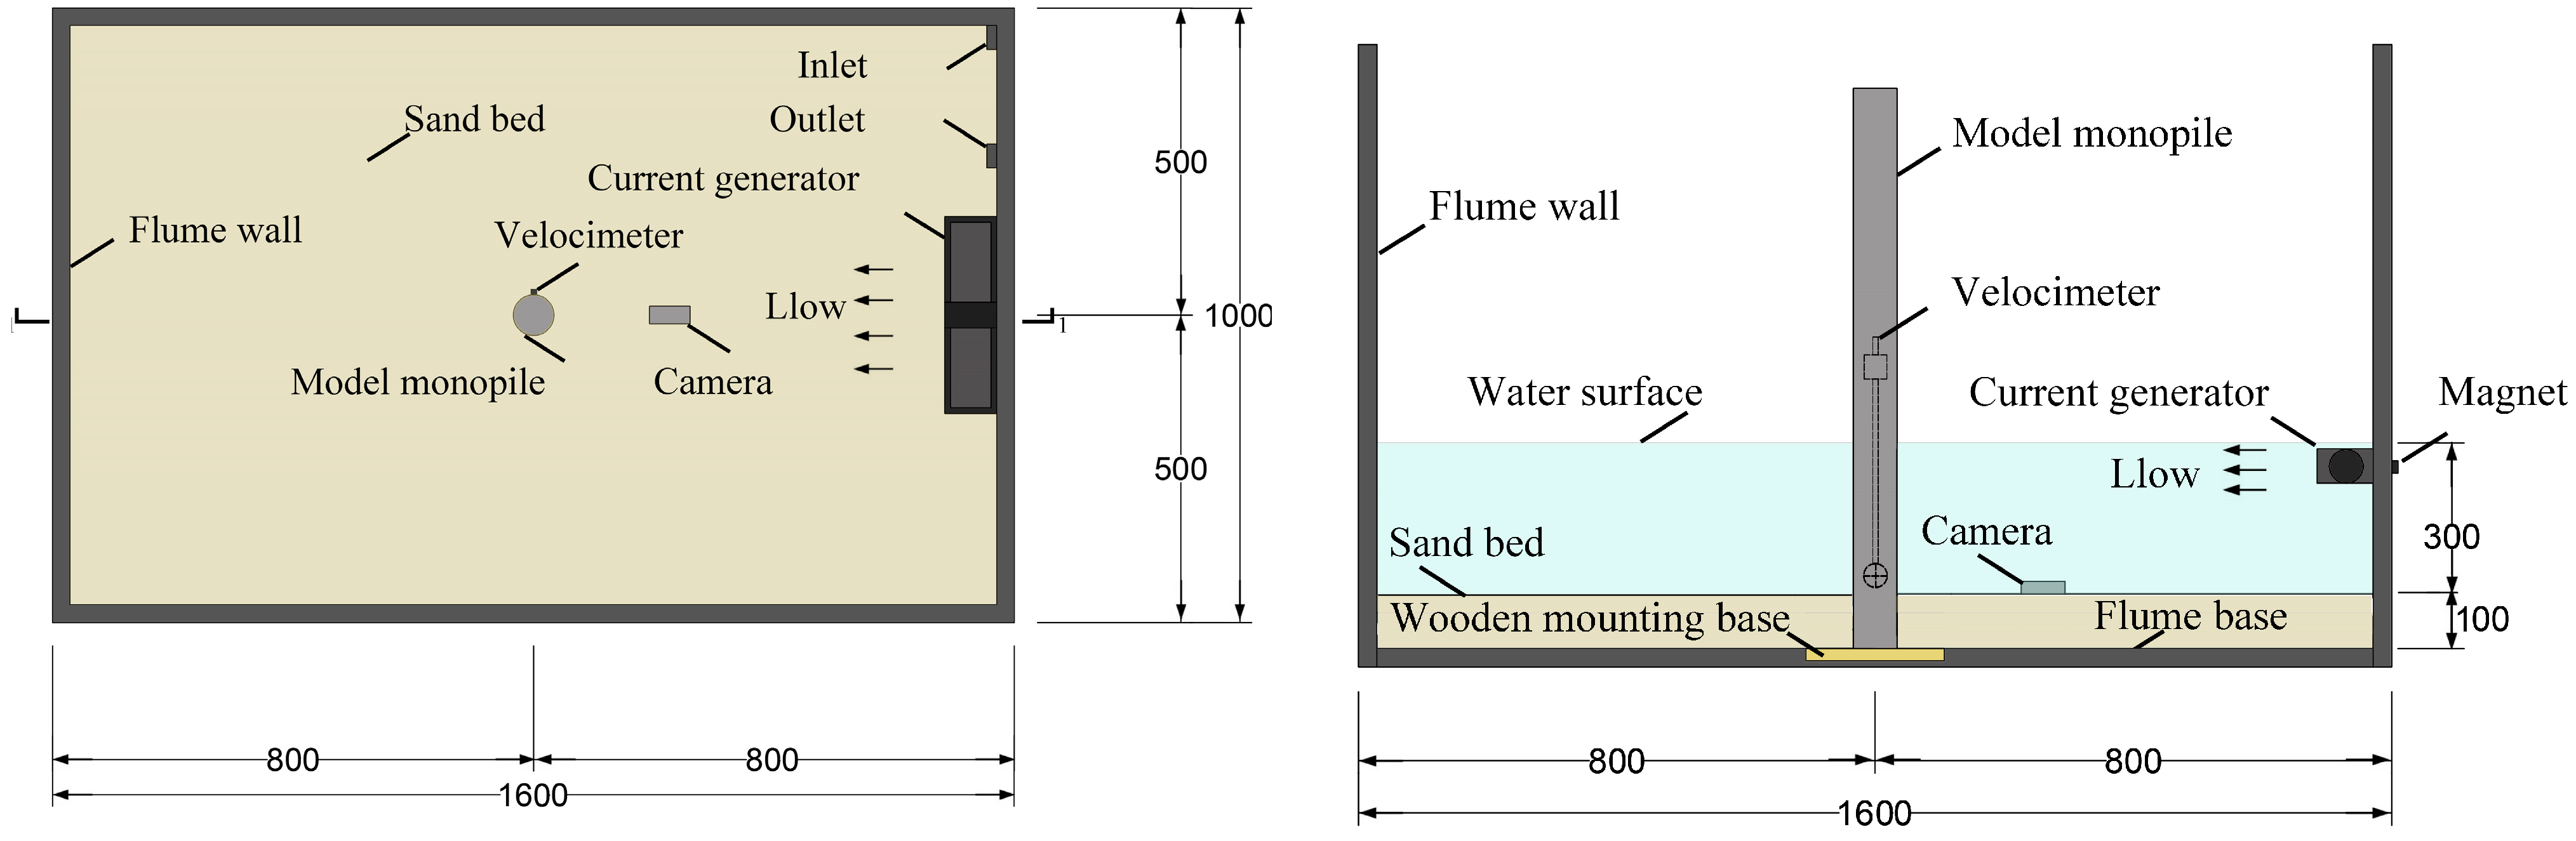
To facilitate visual measurement, the base of the model pile was coated in red, with scale markings applied upwards covering a range of 100 mm to 600 mm. The current meter probe was then secured on the right side of the pile. The model pile was mounted on a 200 × 200   mm 2 rectangular wooden base, which was fixed to the center of the flume’s bottom plate using high-strength adhesive. Subsequently, fine sand was evenly distributed across the flume floor to create a uniform seabed layer with a thickness of 100 mm [20]. For visual monitoring, one rigid-cable underwater camera was mounted horizontally on a stone ballast, positioned 200 mm laterally in front of the pile to capture real-time changes in the bed morphology. A second rigid-cable camera was utilized for mobile observations to track scour development from multiple perspectives. Finally, the circulation pump was installed on the flume wall at a height of 300 mm.
Once the setup was finalized, the flume was filled with water to a depth of 300–320 mm, ensuring the pump was fully submerged. The physical experimental setup is documented in Figure 6, while the detailed planar and sectional layouts illustrating the spatial configuration of all components are presented in Figure 7.
Regarding the issue of consistent inlet layout: Water discharge through the outlet would cause the experimental sand to be washed out, so we kept the outlet fully closed throughout the test. At the end of each test, an additional upward suction pump was used to drain water vertically, which eliminated any return flow problems. In the present physical model test, due to the limitations of the model scale and experimental equipment, it is difficult to fully achieve strict similarity with the prototype in terms of both sediment particle size and pulsation frequency simultaneously. The sand used in the test was selected to ensure reasonable Shields parameter and sediment mobility similarity under the experimental flow conditions. Although the absolute particle size and frequency values differ from those in the field, the key dimensionless parameters governing the scour mechanism, including the Keulegan–Carpenter (KC) number and Shields parameter, were maintained at comparable orders of magnitude to those in practical engineering. Thus, the vortex structure and sediment transport pattern around the monopile in the test can reasonably reflect the scour mechanism in real nearshore environments.

3. Analysis of Flow Velocity Distributions Around the Monopile Under Various Flow Regimes

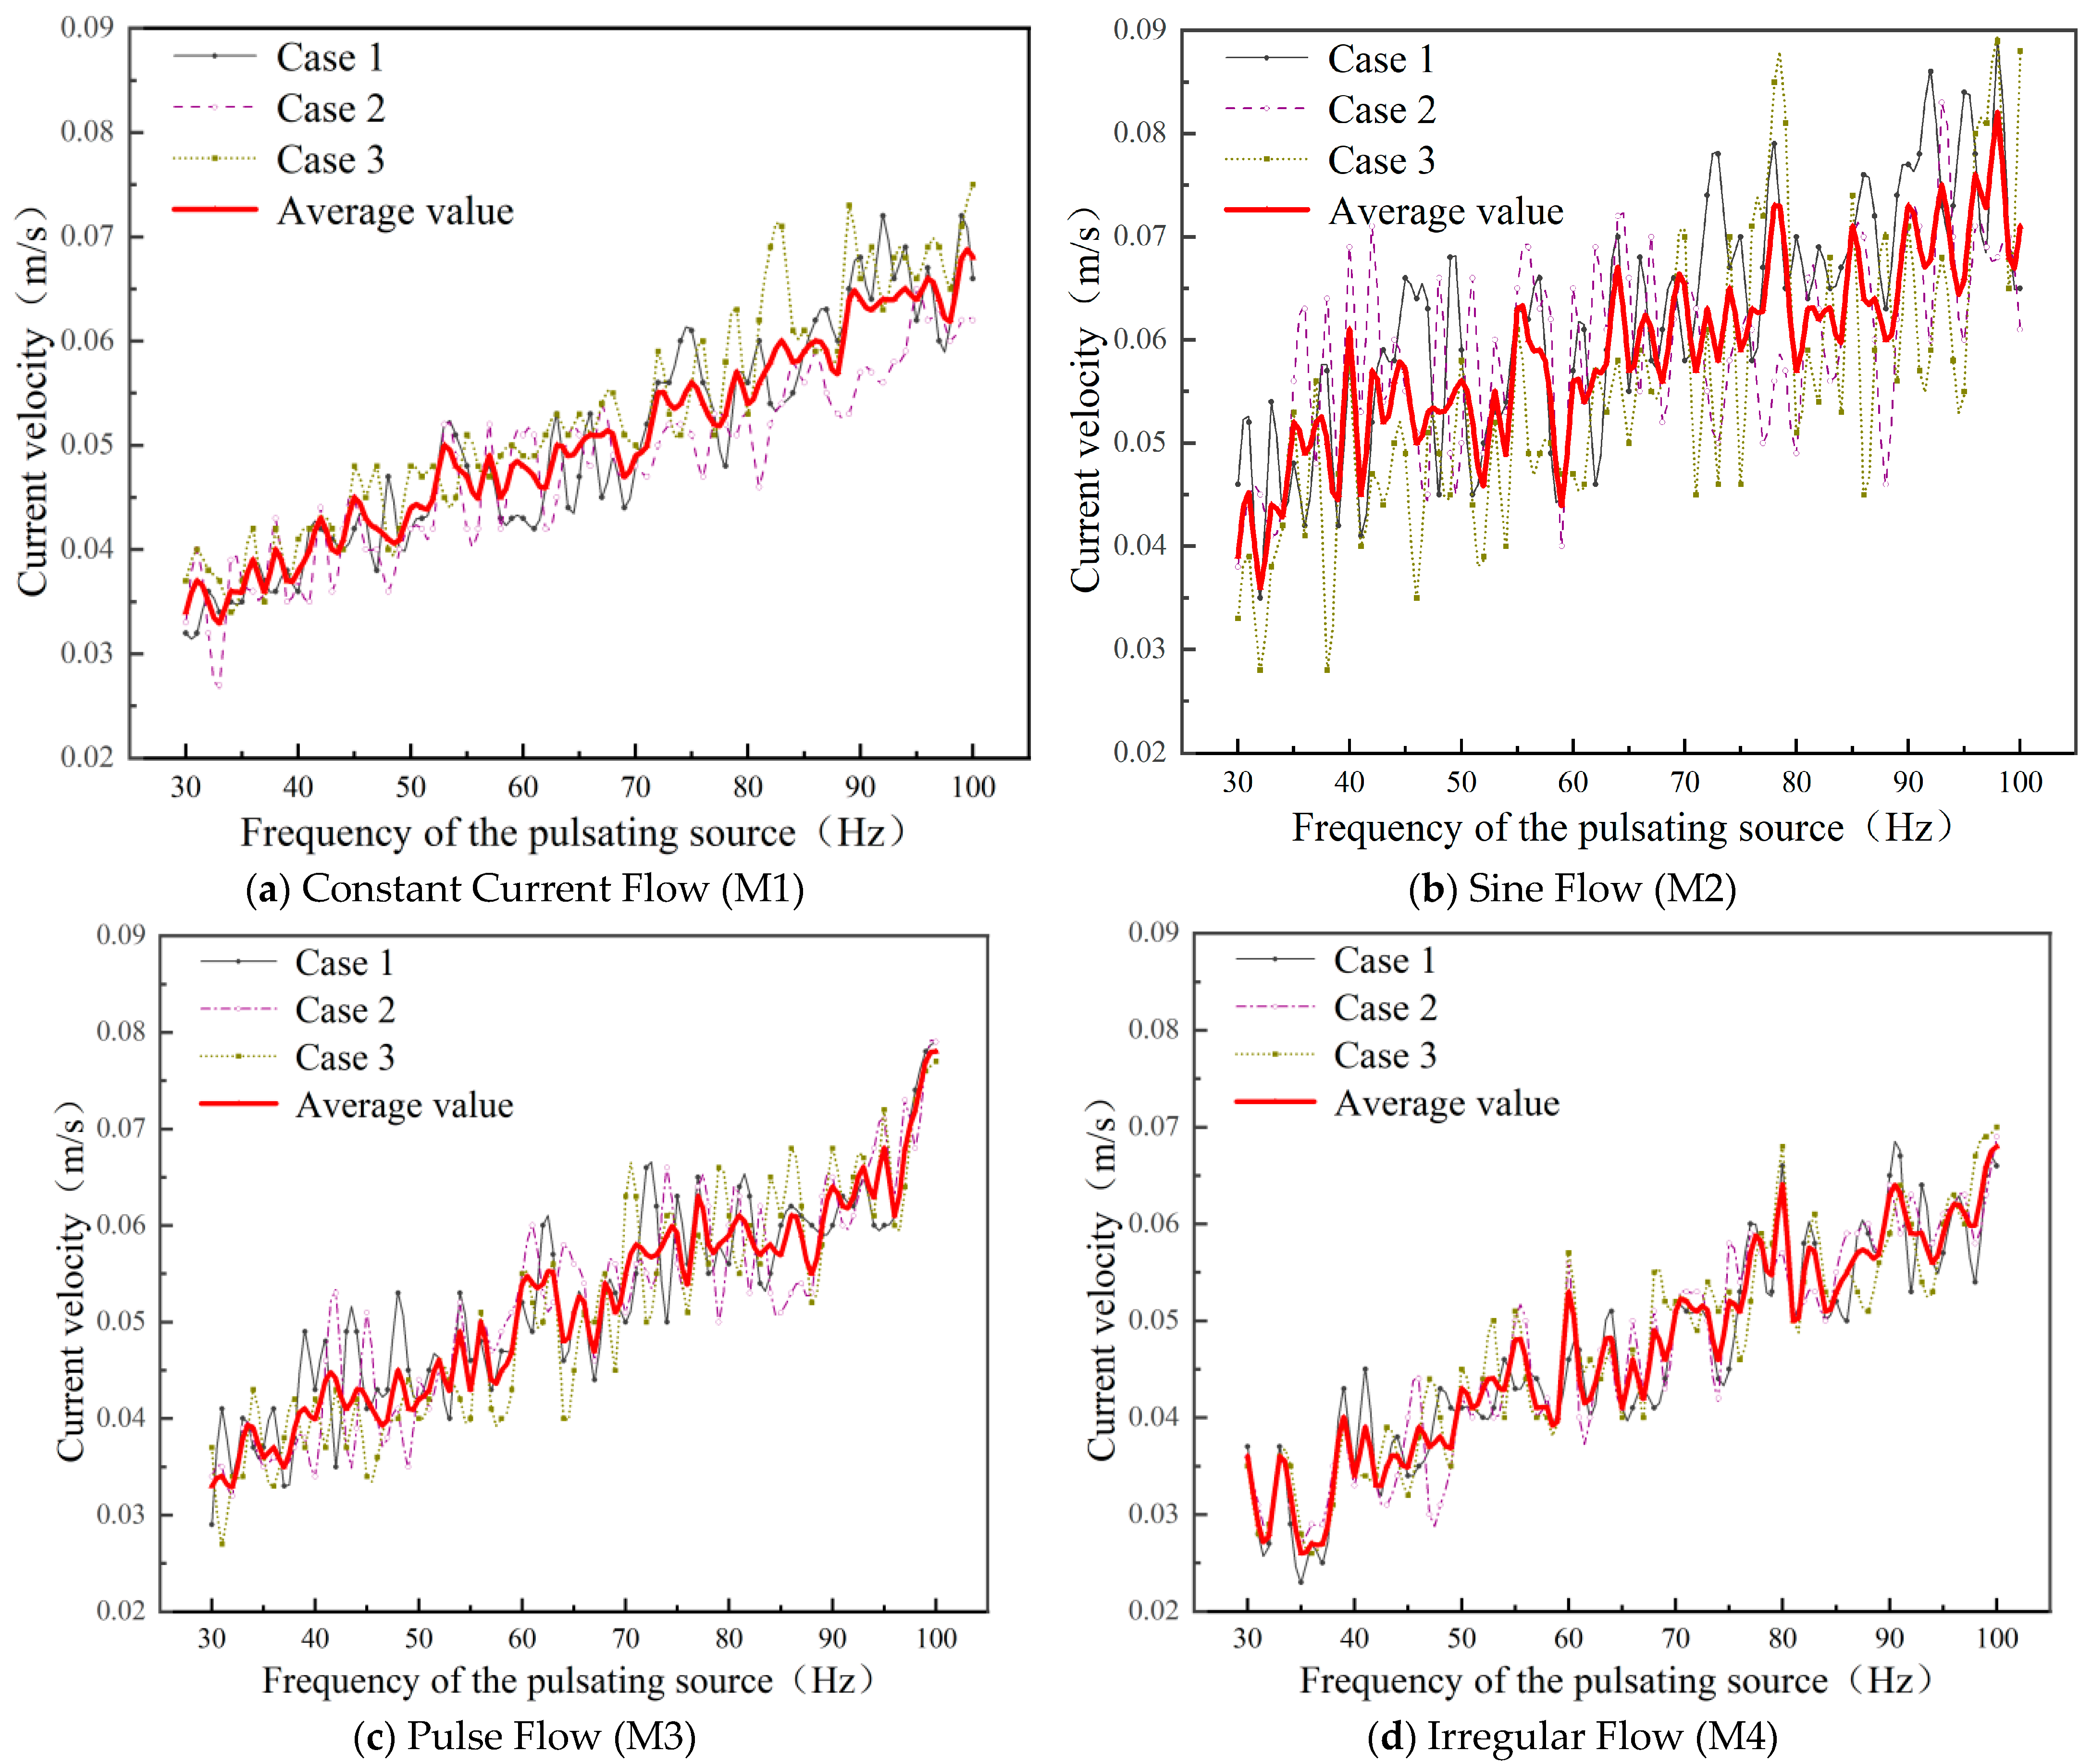
In this study, flow velocities were recorded at a fixed point 25 mm from the pile side and 50 mm above the sand bed under four conditions: Constant Current Flow (M1), Sine Flow (M2), Pulse Flow (M3), and Irregular Flow (M4). For each condition, three replicate runs were conducted across seven frequency bands (ranging from 30 to 100 Hz). To minimize random errors, the time-averaged velocity over a 60 s window was used for each measurement, and the arithmetic mean of the replicates was calculated for each frequency point. In each repeated water-velocity measurement, we ensured that all experimental conditions remained consistent, including water depth, measurement duration, distance between test points, and the pulse source frequency.
The mean flow velocity ranges for each frequency band across the four patterns are illustrated in Figure 8a–d. A consistent trend is observed across all regimes: the pile-side velocity increases with the pulsation frequency. This indicates that higher source frequencies effectively enhance the near-pile flow intensity, potentially accelerating the scouring process.
The Constant Current Flow (M1) of the flow-generating pump was realized via a closed-loop control system integrated with a frequency converter and a proportional–integral–derivative (PID) controller. As shown in Figure 8a, M1 velocities range from a minimum of 0.034 m/s (Band 1) to a maximum of 0.068 m/s (Band 7). Under this regime, the average flow velocity exhibits a monotonic, largely linear increase with frequency. The narrow fluctuation range within each band indicates a highly stable flow, suggesting that the frequency input is directly and consistently translated into kinetic energy in the M1 mode.
Specifically, the Sine Flow of M2 was achieved by periodic frequency conversion of the pump, with a period of approximately X seconds. For the Sine Flow (Figure 8b), velocities span from 0.036 m/s to 0.082 m/s. Compared to M1, the M2 pattern exhibits significantly greater dispersion and abrupt velocity fluctuations within each frequency band. This heightened unsteadiness suggests intense energy modulation. Such a phenomenon is likely due to the inherent periodicity of Sine Flow, which induces continuous acceleration and deceleration, leading to energy redistribution across frequency components and resulting in sharp velocity surges.
And then the pulsed flow of M3 was designed as intermittent acceleration based on the solitary wave theory. Under the M3 condition (Figure 8c), velocities range from 0.033 m/s to 0.078 m/s. The upward trend across successive bands is more pronounced in M3 than in M1 or M2. While the internal fluctuation within each band is greater than that of M1, it remains lower than that of M2. This is because the impulse of a Pulse Flow acts over a very short duration, creating less sustained turbulence compared to the continuous periodic oscillation of Sine Flow.
And the Irregular Flow of M4 was generated based on the random signals. For Irregular Flow (Figure 8d), velocities range from 0.027 m/s to 0.068 m/s. Generally, M4 velocities are lower and more constrained than those in M1. Despite the increased turbulence characteristic of irregular regimes, the average velocity maintains a stable positive correlation with the frequency bands. This confirms that the influence of frequency on the scaled flow averages remains discernible even under stochastic hydrodynamic conditions.
Analysis of the flow velocity variations across the designated frequency bands reveals distinct hydrodynamic patterns. In the low-frequency range (30–39 Hz), flow velocities across all four patterns remain minimal, suggesting that low-frequency excitations induce negligible disturbance to the near-pile flow field. Within the mid-frequency band (40–69 Hz), flow velocities initiate a gradual ascent, though the growth rates diverge among the regimes; specifically, the M2 condition exhibits marked fluctuations, while the M4 condition maintains a relatively stable and monotonic increase. In the high-frequency band (70–100 Hz), the upward trend persists, and the hydrodynamic disparities between the flow regimes become increasingly pronounced. Notably, the M2 condition achieves the highest peak velocity, indicating that high-frequency Sine Flows generate the most intense hydraulic disturbance in the vicinity of the monopile.
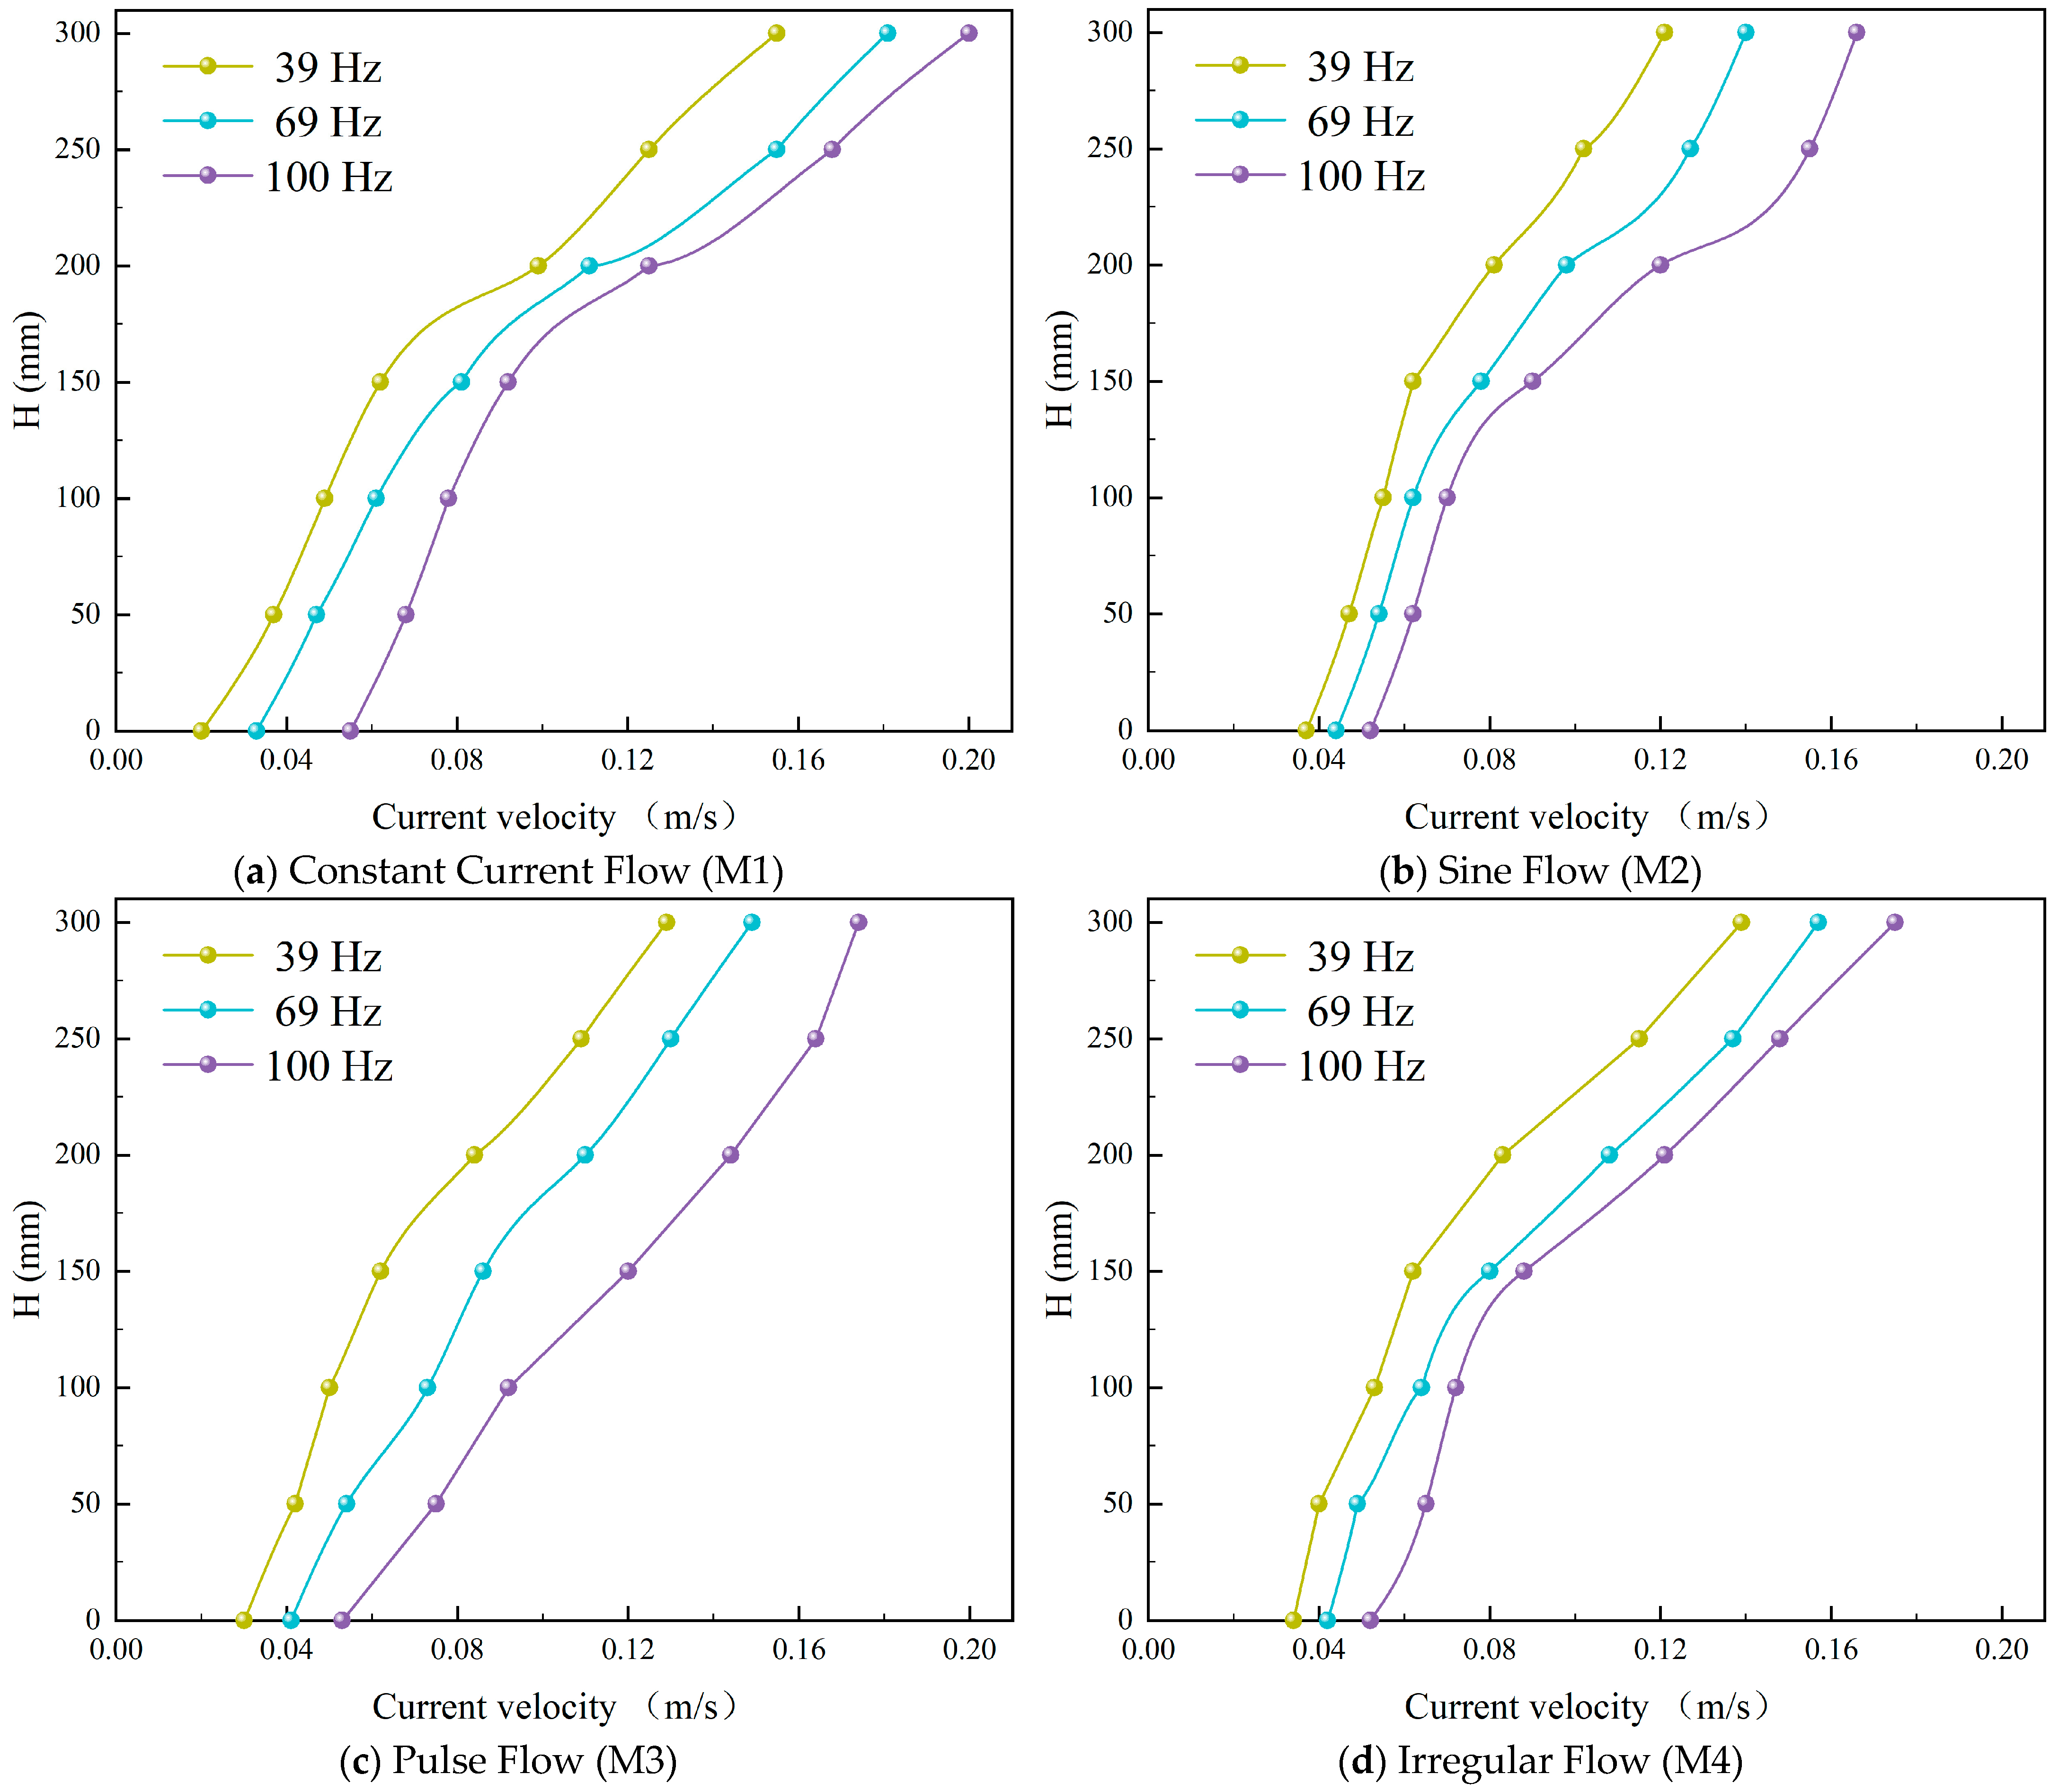
To obtain a more detailed set of point-velocity measurements, six additional measurement points were placed along the vertical profile at the same horizontal location (25 mm from the pile and 50 mm above the bed). The flow velocity at each point was systematically recorded. To enhance statistical reliability and reduce random errors, three repeated tests were conducted for each experimental condition. For each individual test, the time-averaged velocity over a 60 s sampling window was taken as a single measurement. The arithmetic mean of the three repeated measurements was then calculated to determine the final representative velocity at each point under the given condition (see Figure 9). A comprehensive comparison of the vertical velocity profiles under four flow regimes (M1–M4) and three pulsing frequencies (39, 69, and 100 Hz) reveals a consistent increase in velocity with water depth across all conditions, forming a well-defined vertical gradient. Based on the velocity difference between the free surface (300 mm) and the bed level (0 mm), regime M1 exhibits the strongest vertical shear (0.135–0.148 m/s), whereas M2 shows the weakest gradient (0.084–0.114 m/s). The gradients in M3 and M4 fall between these two regimes and increase progressively with the overall flow intensity. In terms of absolute magnitudes, the 100 Hz pulsation consistently produces the highest velocities within each regime, followed by 69 Hz and 39 Hz. This pattern indicates that higher pulsing frequencies more effectively enhance local velocities throughout the vertical profile. Comparison among the four flow regimes further shows that velocities in the upper layer increase markedly from M1 to M4, with M4 exhibiting the highest profile overall, reflecting its stronger hydrodynamic forcing. In contrast, velocity differences near the bed (0–50 mm) remain relatively small across the four regimes, suggesting that the near-bed flow is predominantly controlled by boundary resistance and is less sensitive to changes in flow regime; the middle and upper layers, however, display substantially enlarged differences, indicating that flow intensification primarily manifests in the upper water column. Collectively, these results demonstrate a pronounced upward shift of the vertical velocity distribution as the flow regime strengthens from M1 to M4. Meanwhile, pulsing frequency exerts a stable and persistent influence on velocity enhancement, following the robust pattern 100 Hz > 69 Hz > 39 Hz. Taken together, the findings highlight a synergistic effect between high-frequency pulsation and intensified background flow in reinforcing the structure of the three-dimensional flow field.

4. Temporal Evolution of Scour Morphology Under Various Flow Regimes

4.1. Morphological Development of Scour Holes Under Different Flow Regimes

Four flow patterns were adopted in the experiments, namely Sine Flow (M2), pulsed flow (M3), and Irregular Flow (M4), and the duration of each test was 15 min. This study focuses on the instantaneous evolution of scour hole geometry and the initial stage of rapid scour hole expansion, rather than the fully developed equilibrium scour depth condition. Preliminary experimental tests confirmed that, under the specific experimental conditions employed in this paper, variations in scour hole morphology became negligible after 15 min. To clarify the time-dependent effects of flow patterns on local scour and the morphological evolution of scour holes around monopile foundations at a constant pulsation frequency, the analysis of experimental results under different working conditions reveals the following: Among the three flow patterns—Sine Flow (M2), pulsed flow (M3), and Irregular Flow (M4)—the scour hole exhibited only slight changes at a frequency of 39 Hz, with no significant differences in the variations of scour hole width and depth. At a frequency of 100 Hz, although distinct differences existed in the changes of scour hole width and depth, the scour hole developed extremely rapidly under Constant Current Flow (M1), accompanied by severe turbidity in the water environment. This prevented complete observation of the evolution process, making it impossible to compare the differences among the four flow patterns at a fixed frequency. In contrast, at a frequency of 69 Hz, all four flow patterns provided favorable conditions for scour hole development, with clear and distinguishable differences, thus meeting the requirements for comparative analysis. Therefore, we selected a fixed pulsation frequency of 69 Hz to conduct comparative analysis of the experimental results under the four different flow patterns at the laboratory scale.
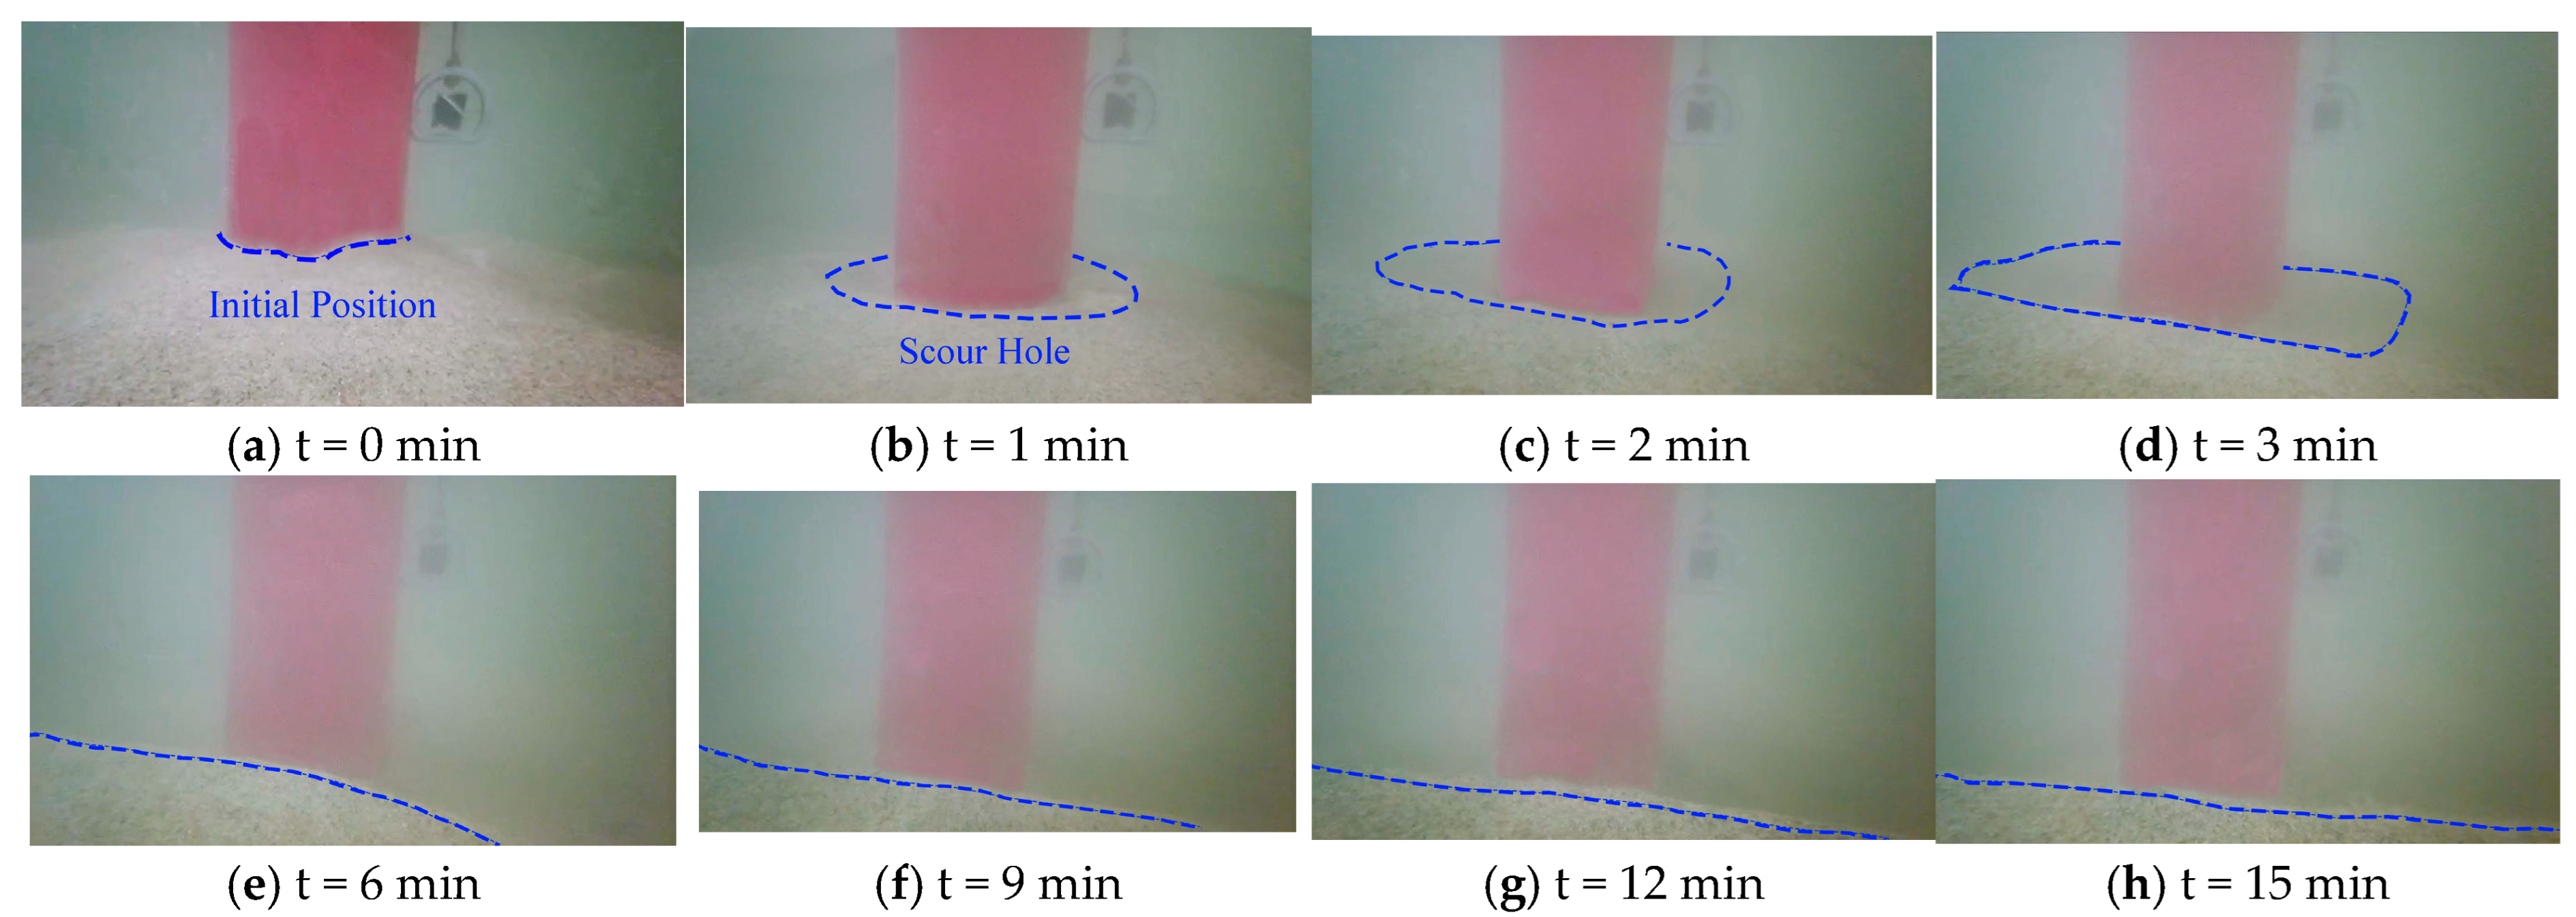
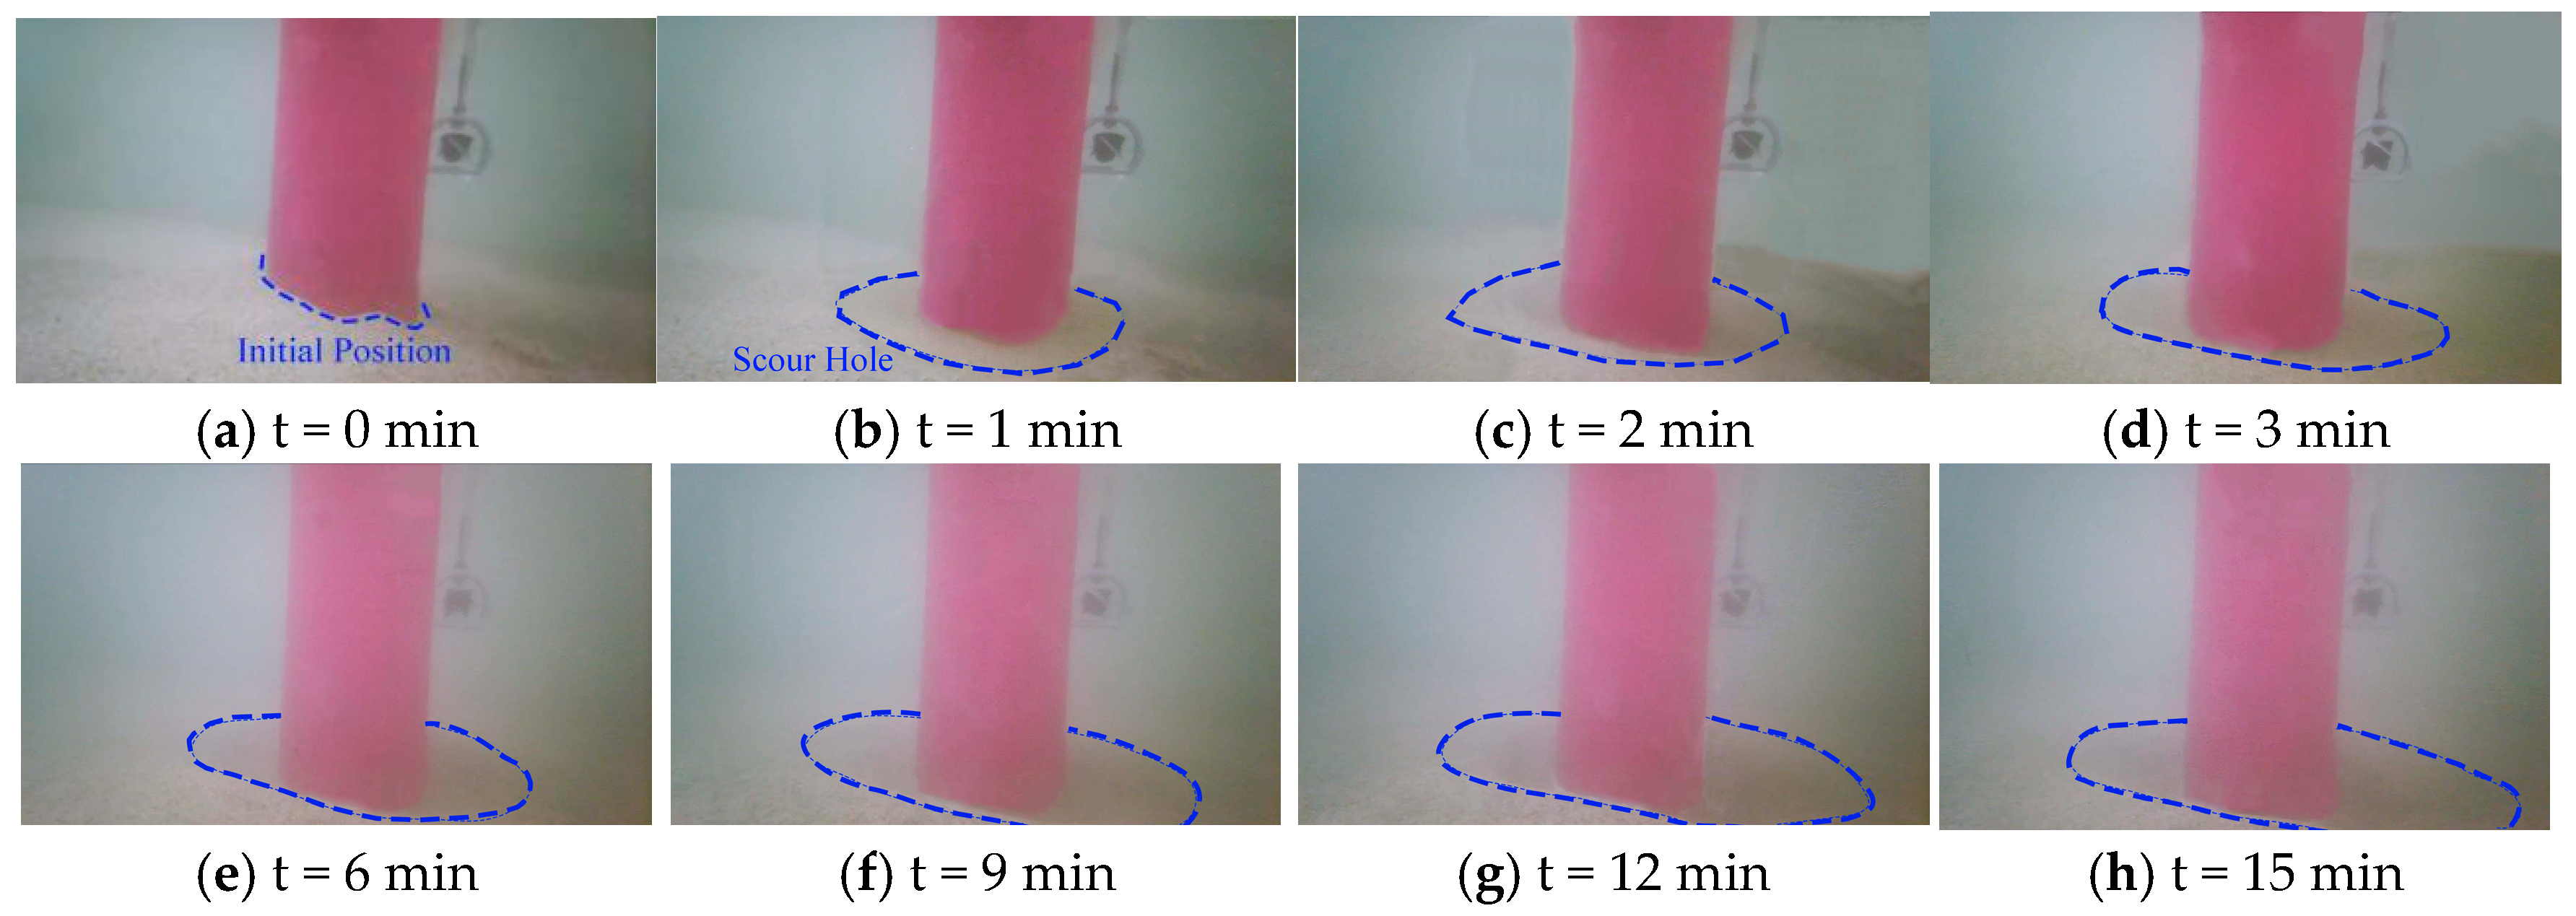
Under the M1 condition with a medium pulsation frequency (69 Hz), the average flow velocity was 0.047 m/s. The evolution of the scour hole during the 15 min test is shown in Figure 10. In the initial stage (first 3 min), the scour hole depth increased rapidly, reaching a maximum of 2 cm at the 3 min mark, while the scour hole area expanded quickly in all directions. Subsequently (at the 4 min mark), the scour hole width reached 25 cm, and the rate of areal expansion slowed further, with both the depth and area growth rates decreasing significantly. Between the 5th and 11th minutes, due to an increased amount of suspended sediment, the water turbidity rose, reducing the visibility of the scour hole morphology. Contour deposition began to appear around the scour hole. During the final stage (11th to 15th minute), the scour hole depth remained almost unchanged, and the area stabilized. However, sediment continued to be transported layer by layer by the current, accumulating around the scour hole contour. Compared to the 39 Hz condition, the height and thickness of this deposited contour were significantly greater. The final scour hole exhibited an overall teardrop shape, with both its area and depth exceeding the results observed under the 39 Hz condition. The scour depth upstream of the pile was more pronounced, and the small slope formed by deposited sediment was higher. The scour depth and area on both sides of the pile foundation were also larger, with a more distinct and thicker boundary contour.
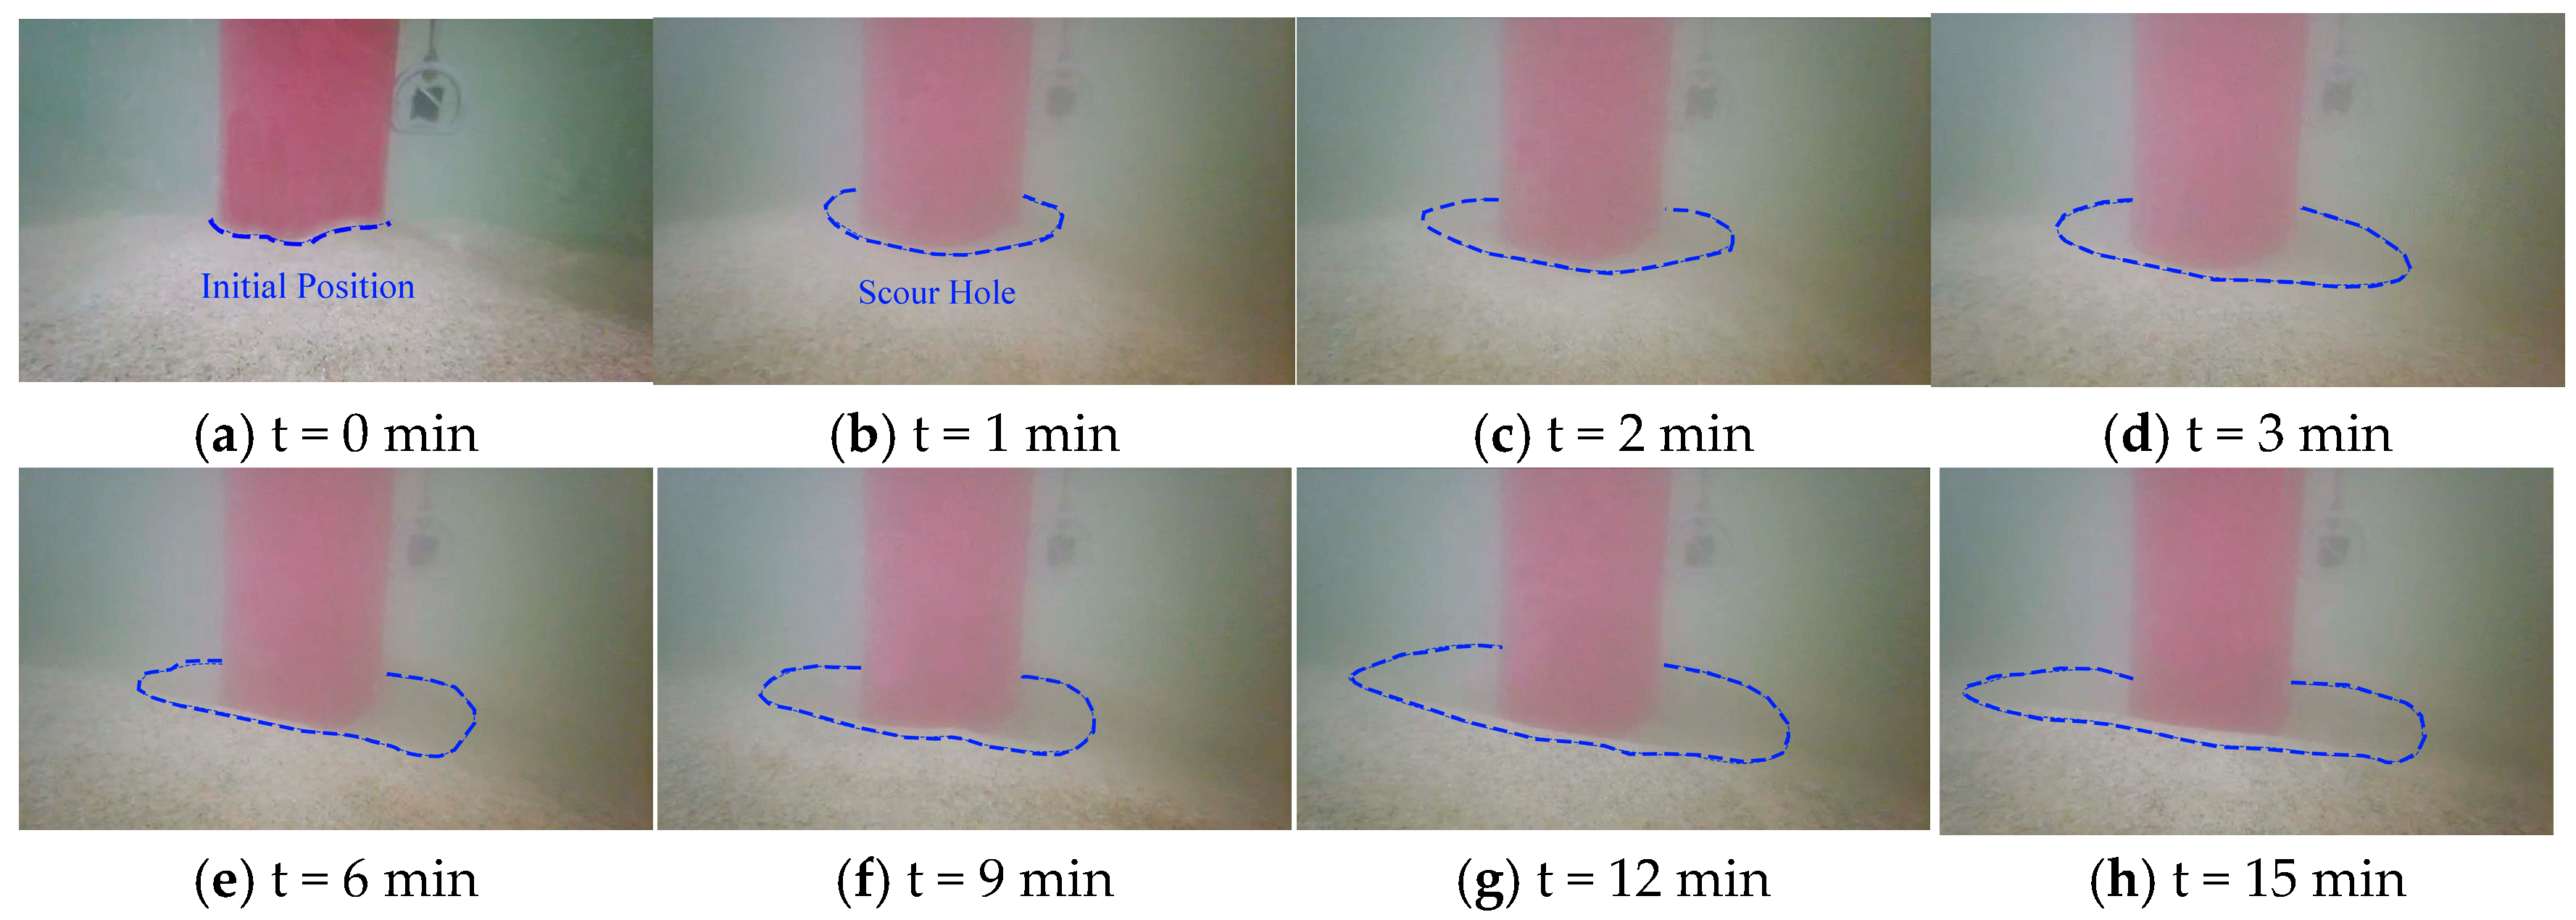
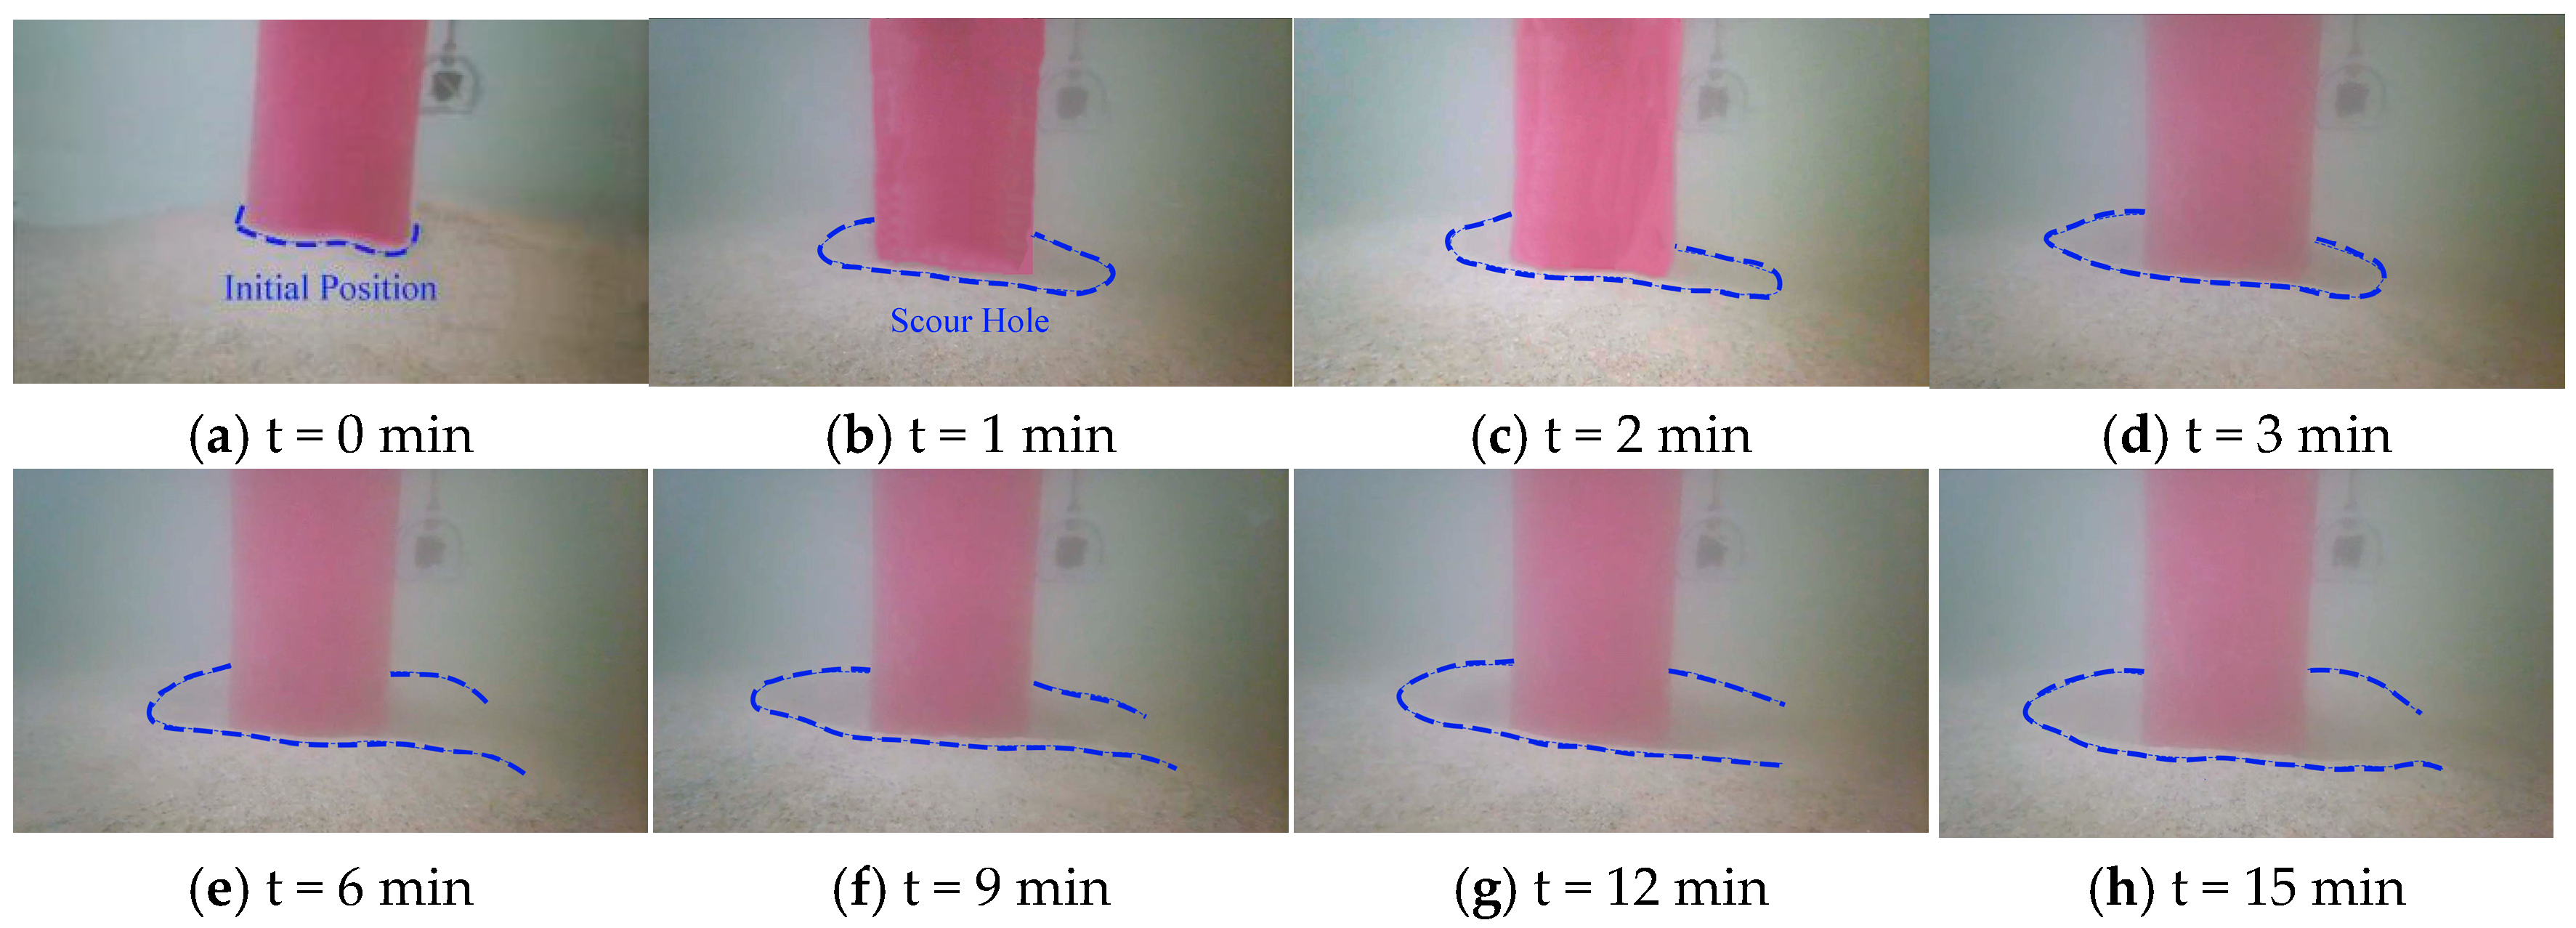
Under the M2 condition (69 Hz), the average flow velocity was measured at 0.064 m/s. The 15 min evolution of the scour hole is illustrated in Figure 11. During the initial 3 min, the surface sand layer surrounding the monopile underwent rapid erosion, resulting in the swift development of a scour hole. As the hole expanded, the scour depth increased progressively [44]. By the 5th minute, the hole width reached 14 cm. Between the 6th minute and the end of the test, the areal expansion rate of the scour hole declined significantly, with growth transitioning primarily to lateral widening. At the 8th minute, after reaching a depth of 2 cm, the vertical scour rate minimized. Subsequently, the scouring process propagated downward, approaching the bottom boundary by the 15th minute. Notably, no significant sediment accretion was observed along the hole perimeter under this condition. The resulting scour hole exhibited an asymmetric elliptical morphology, with a peak depth offset of 8 cm (mean left-side depth: 2.8 cm vs. mean right-side depth: 1.9 cm). This asymmetry demonstrates a strong spatial correlation with the intensity distribution of the horseshoe vortex and secondary flow regimes.
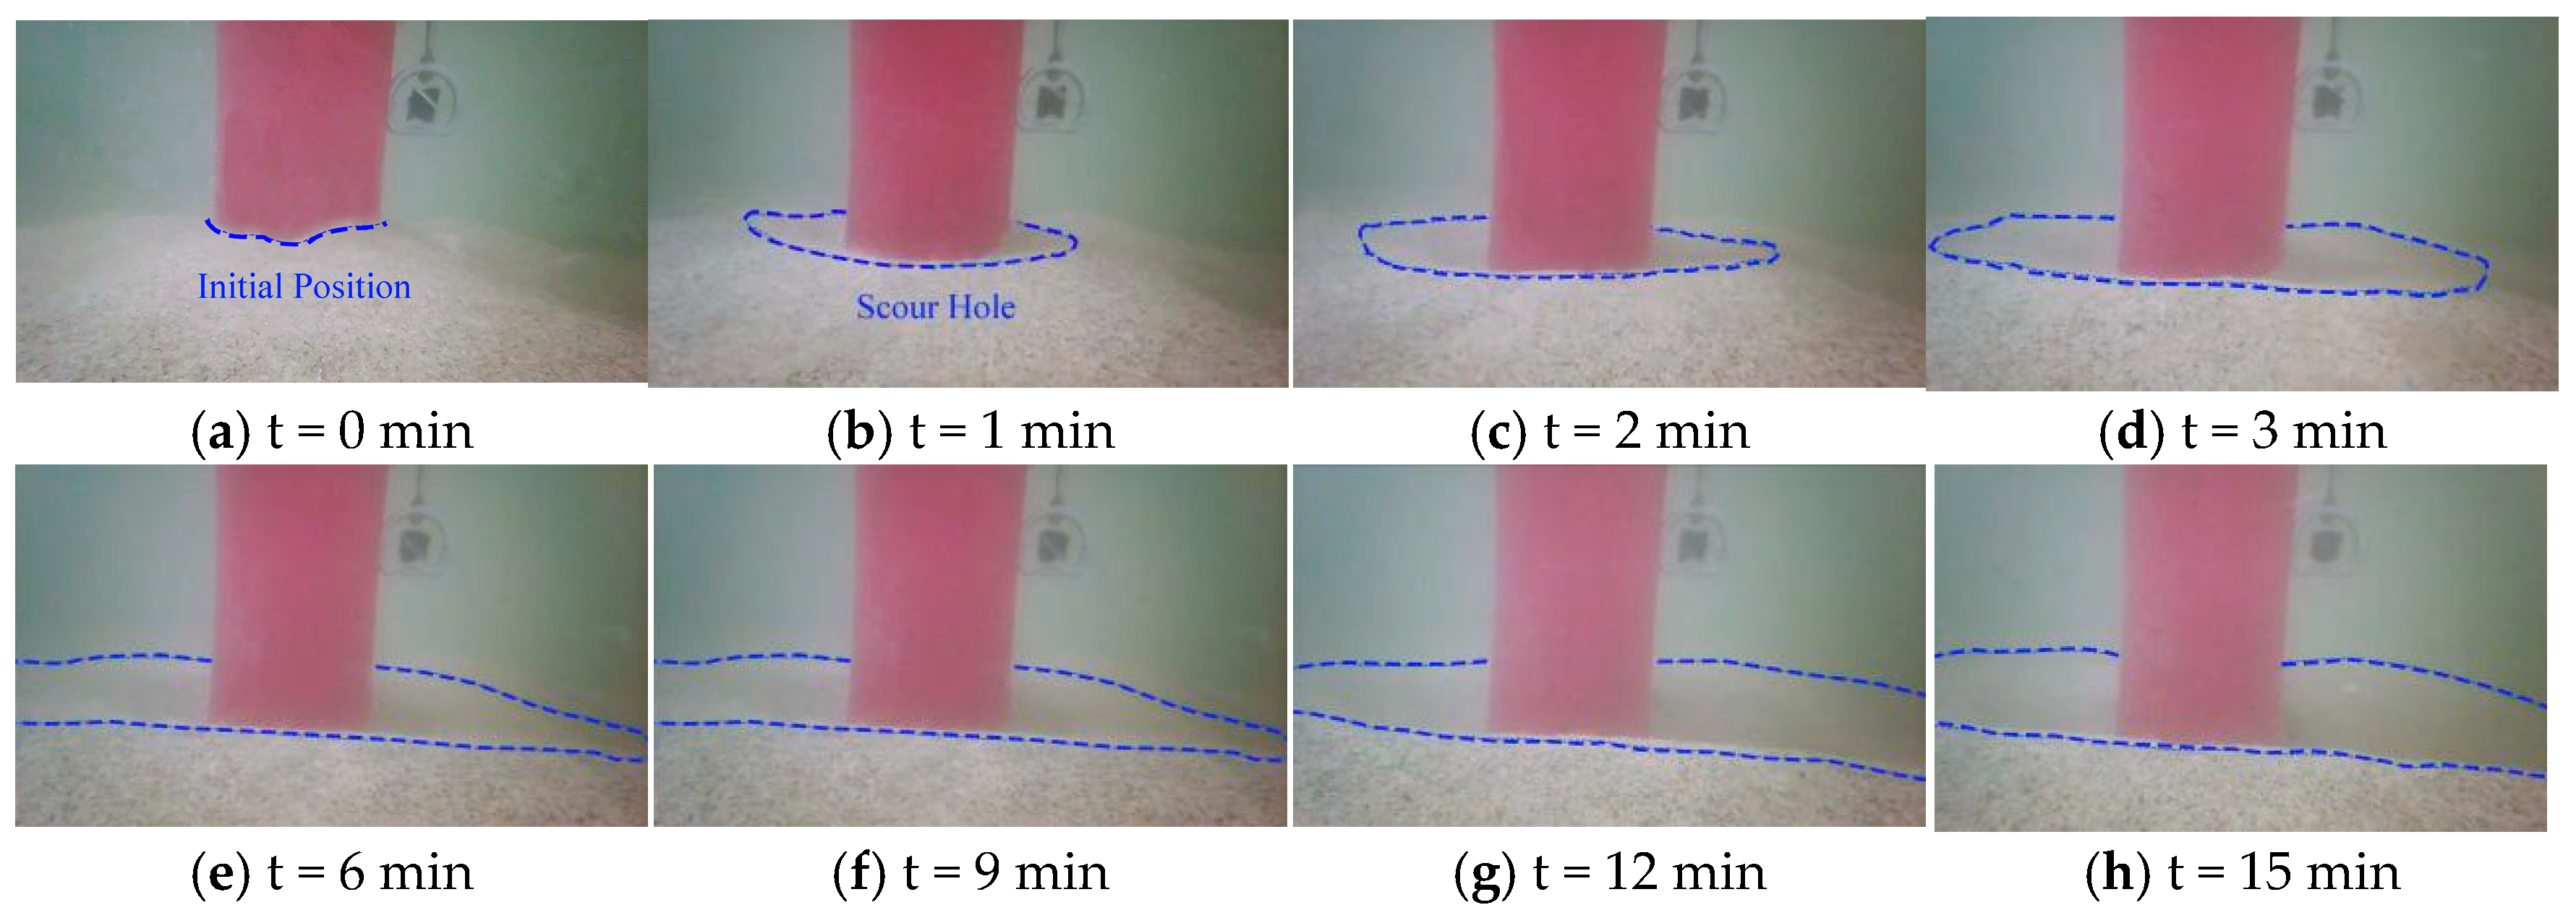
Under the M3 condition (69 Hz), the average flow velocity was 0.051 m/s. The 15 min morphological evolution of the scour hole is illustrated in Figure 12. During the initial 3 min, the scour depth increased rapidly as the surface sand was swiftly eroded, initially forming a smooth bed transition before a distinct elliptical scour hole emerged. From the 4th to the 7th minute, the scour area expanded rapidly, extending primarily along the lateral sides of the monopile. The hole morphology evolved into a pronounced elliptical shape, reaching a width of 14 cm by the 5th minute. During this stage, a noticeable increase in suspended sediment concentration significantly elevated the water turbidity. From the 8th minute until the end of the test, the expansion rates of both the scour area and depth decreased markedly, with the depth reaching approximately 2 cm by the 11th minute. Subsequently, further visual characterization of the scour area via the underwater camera was precluded by excessive turbidity. Notably, no significant sediment accretion was observed around the perimeter of the scour hole by the conclusion of the experiment.
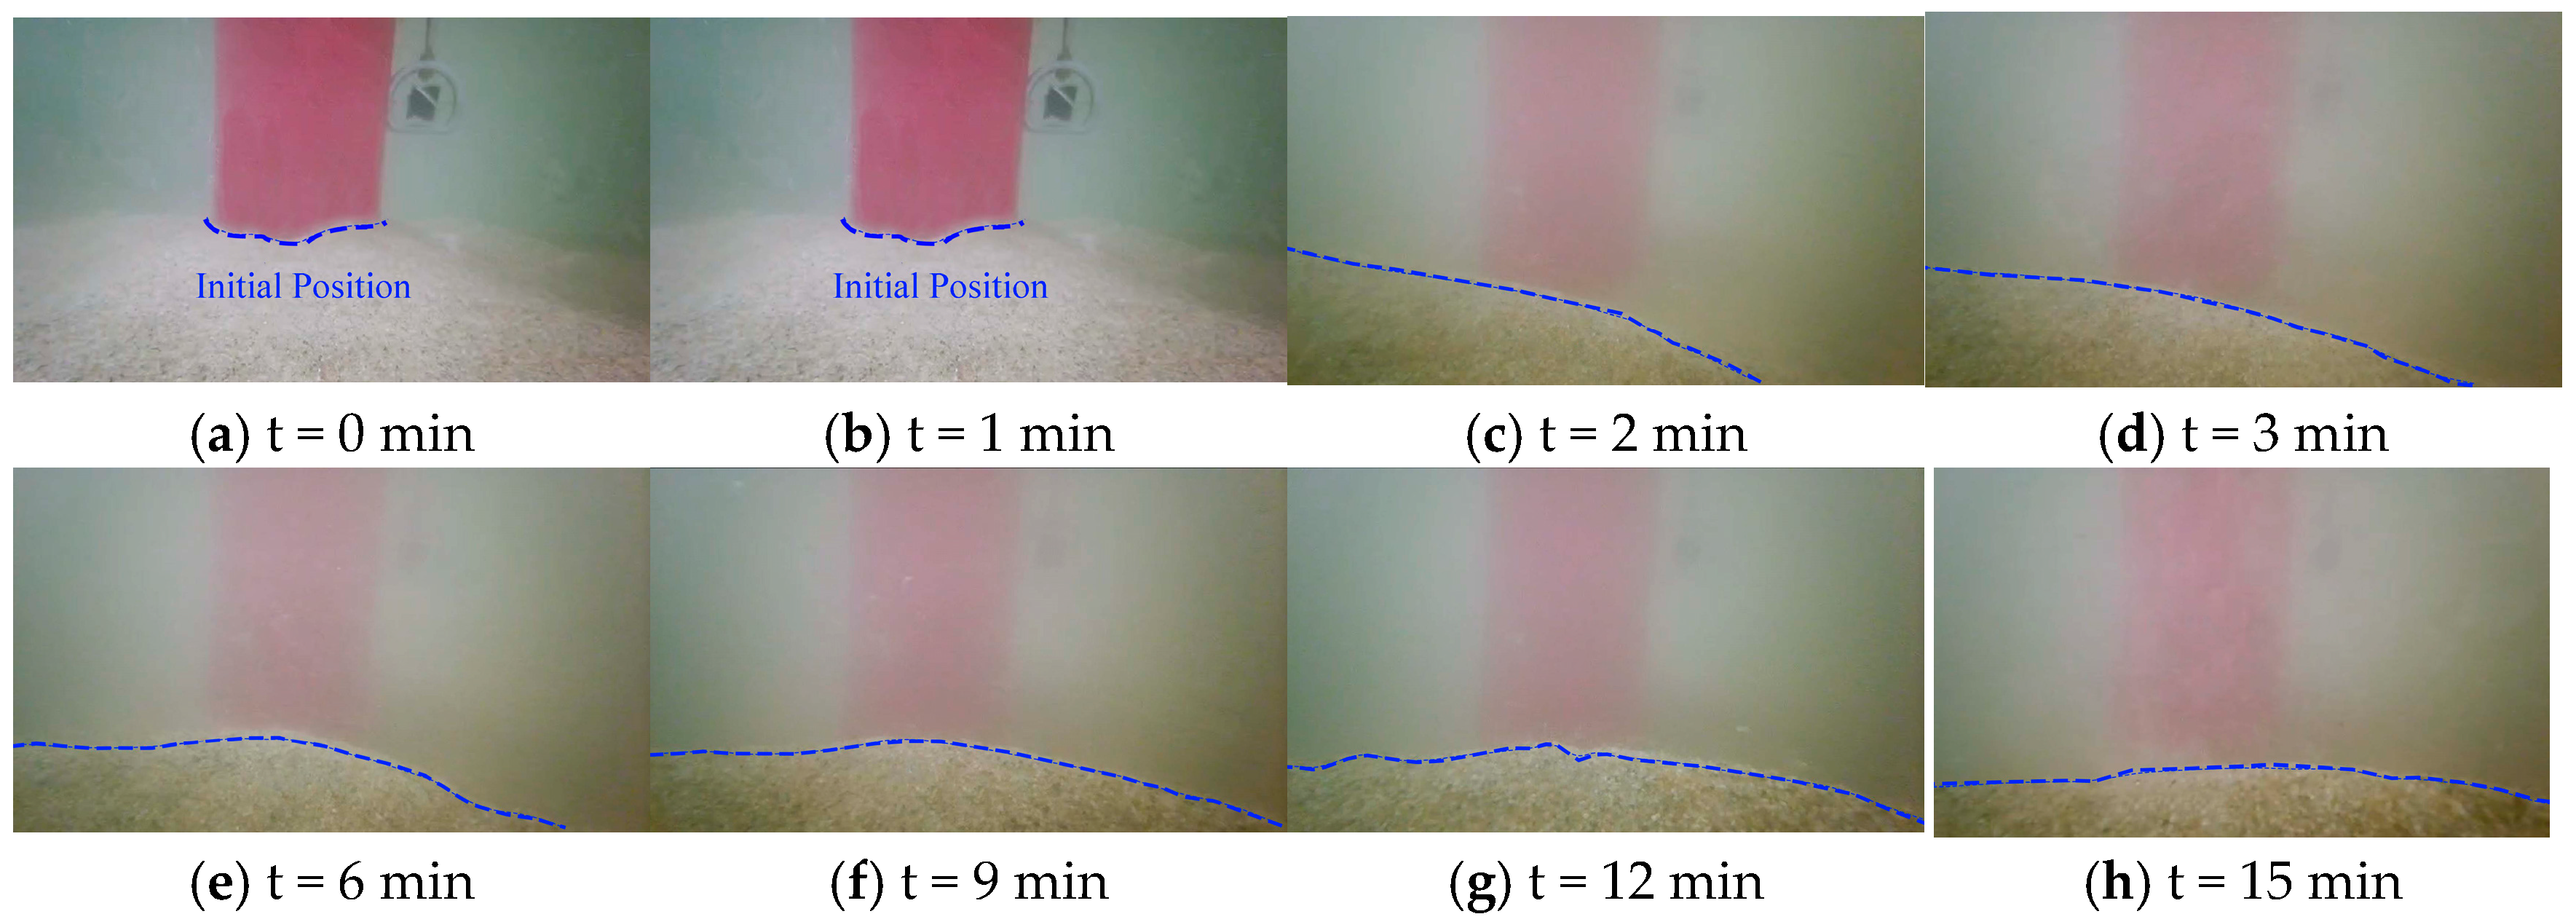
Under the M4 condition (69 Hz), the average flow velocity was 0.046 m/s. The 15 min morphological evolution of the scour hole is illustrated in Figure 13. During the initial stage (0–3 min), the scour depth increased rapidly as the current swiftly eroded the sediment around the monopile, forming a relatively shallow, elliptical depression. In the intermediate stage (4–6 min), the concentration of suspended sediment rose, significantly elevating water turbidity. Both the area and depth of the scour hole expanded rapidly, with the hole width reaching 14 cm by the 5th minute. Notably, by the 6th minute, sediment accretion initiated upstream of the pile and began to propagate outward. During the later stage (7–10 min), the vertical scouring rate decelerated, though the depth continued to increase, reaching 2 cm. The areal expansion rate, however, remained high; specifically, the downstream scour contour expanded at an accelerated pace, while the upstream expansion remained relatively stable. In the final stage (11–15 min), the growth rates for both depth and area decreased significantly. Downstream expansion nearly ceased, whereas the upstream sediment accretion continued to increase in both height and thickness. Ultimately, the scour hole attained a semi-circular morphology. The scour area was most extensive upstream of the pile, narrowed along the lateral sides, and was most constrained downstream, tapering off with increasing distance. The scour depth peaked at the pile–soil interface and gradually diminished radially outward.
At a consistent pulsation frequency of 69 Hz, the evolution of the scour holes exhibited distinct, pattern-specific variations, reflecting the complexity of flow–structure–sediment interactions. The M1 regime is characterized by a continuous transport direction, enabling scoured sand particles to migrate along fixed trajectories and accumulate in specific low-velocity zones downstream. In contrast, the randomness of the M4 regime leads to variable sand particle movement directions and dispersed energy, precluding the formation of concentrated high accumulation ridges. For the M2 and M3 regimes (periodic flow conditions), sediment backfilling was observed during the scouring process. Under the M1 regime, the scour hole developed rapidly during the initial stage in both depth and area; although growth decelerated later, pronounced sediment accretion formed around the perimeter, resulting in a characteristic teardrop morphology. In the M2 regime, rapid initial development led to significant depth, yet no sediment deposition was observed as the process slowed, ultimately yielding an asymmetric elliptical structure. For the M3 regime, early-stage expansion occurred primarily along the lateral sides of the pile; this was followed by a declining growth rate and an absence of deposition, culminating in a pronounced elliptical shape. Conversely, the M4 regime demonstrated a multi-stage evolution—rapid initiation, intermediate acceleration, and final stabilization—with sediment accretion concentrated primarily upstream, forming a unique semi-circular morphology that was dimensionally intermediate between the steady (M1) and periodic (M2, M3) flow regimes.
Despite these morphological disparities, the initial scouring dynamics across all four patterns align with the observations of [45]. Specifically, sand particles at the lateral sides of the pile were the first to mobilize, exhibiting the most rapid increase in kinetic energy. While local scour upstream of the pile initiated later, it progressed most aggressively once triggered. In contrast, sediment downstream of the pile displayed lower kinetic energy and required a longer duration to reach a state of equilibrium. Sediment accretion for M2 was absent at medium frequencies but manifested as a faint rim under high-frequency (100 Hz) excitation.

4.2. Comparative Analysis of Scour Hole Geometric Dimensions Under Different Flow Regimes

The variations in scour hole dimensions—specifically width and depth—under diverse flow regimes are systematically analyzed in Figure 14 (temporal evolution), Table 5 and Table 6 (stage-wise quantification), and Table 7 (characteristic timescales and deposition phenomena). All experiments were performed at a consistent pulsation frequency of 69 Hz for 15 min, encompassing Constant Current Flow (M1), Sine Flow (M2), Pulse Flow (M3), and Irregular Flow (M4).
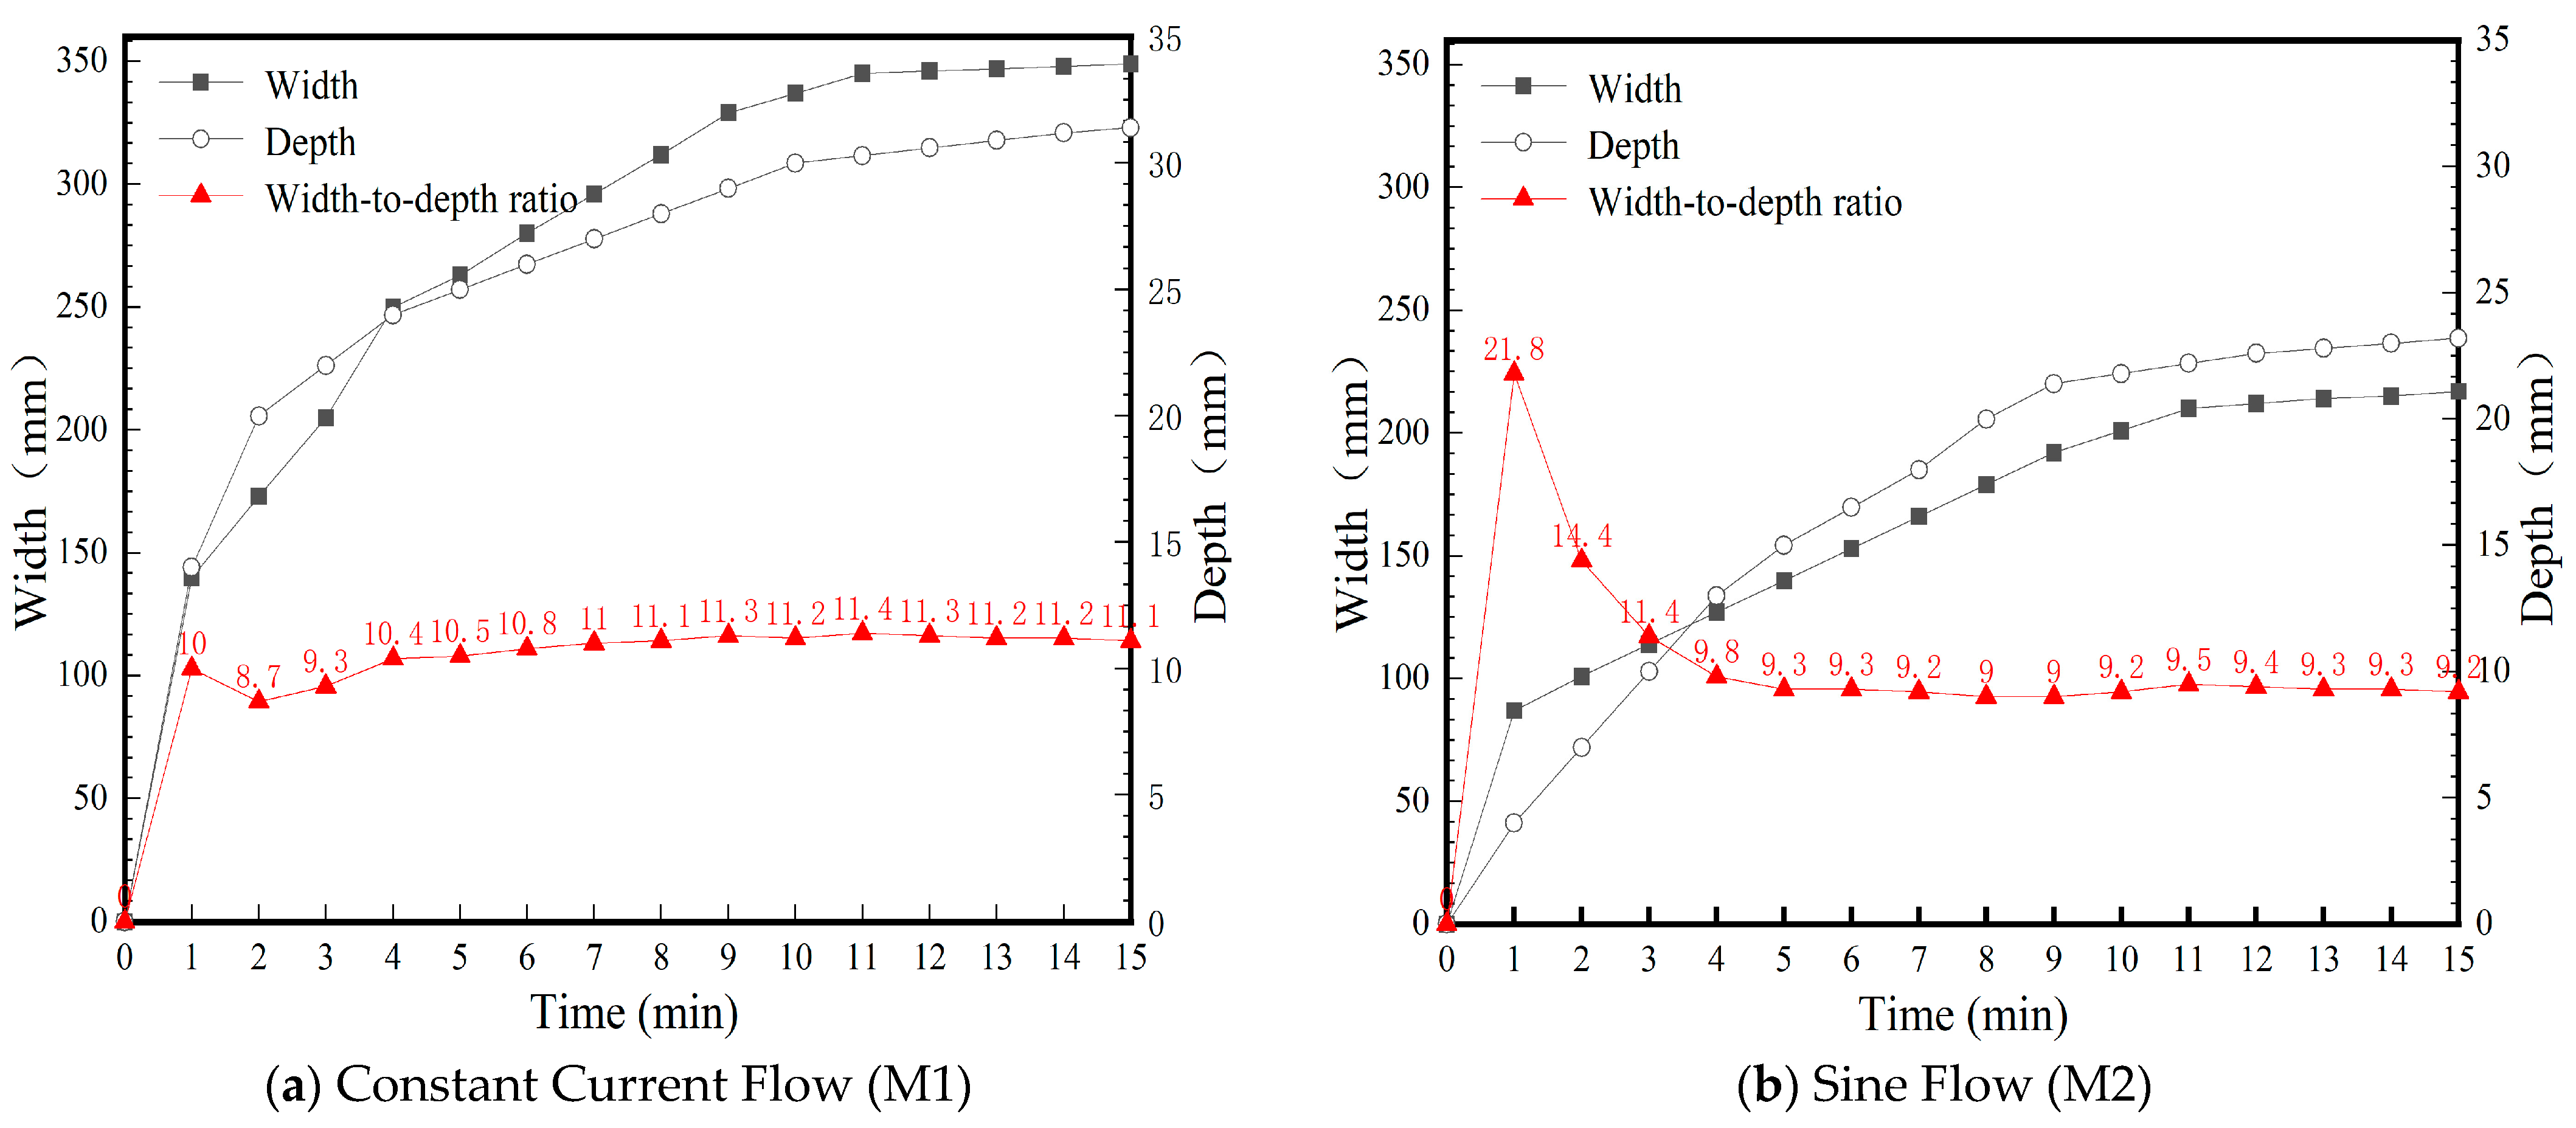
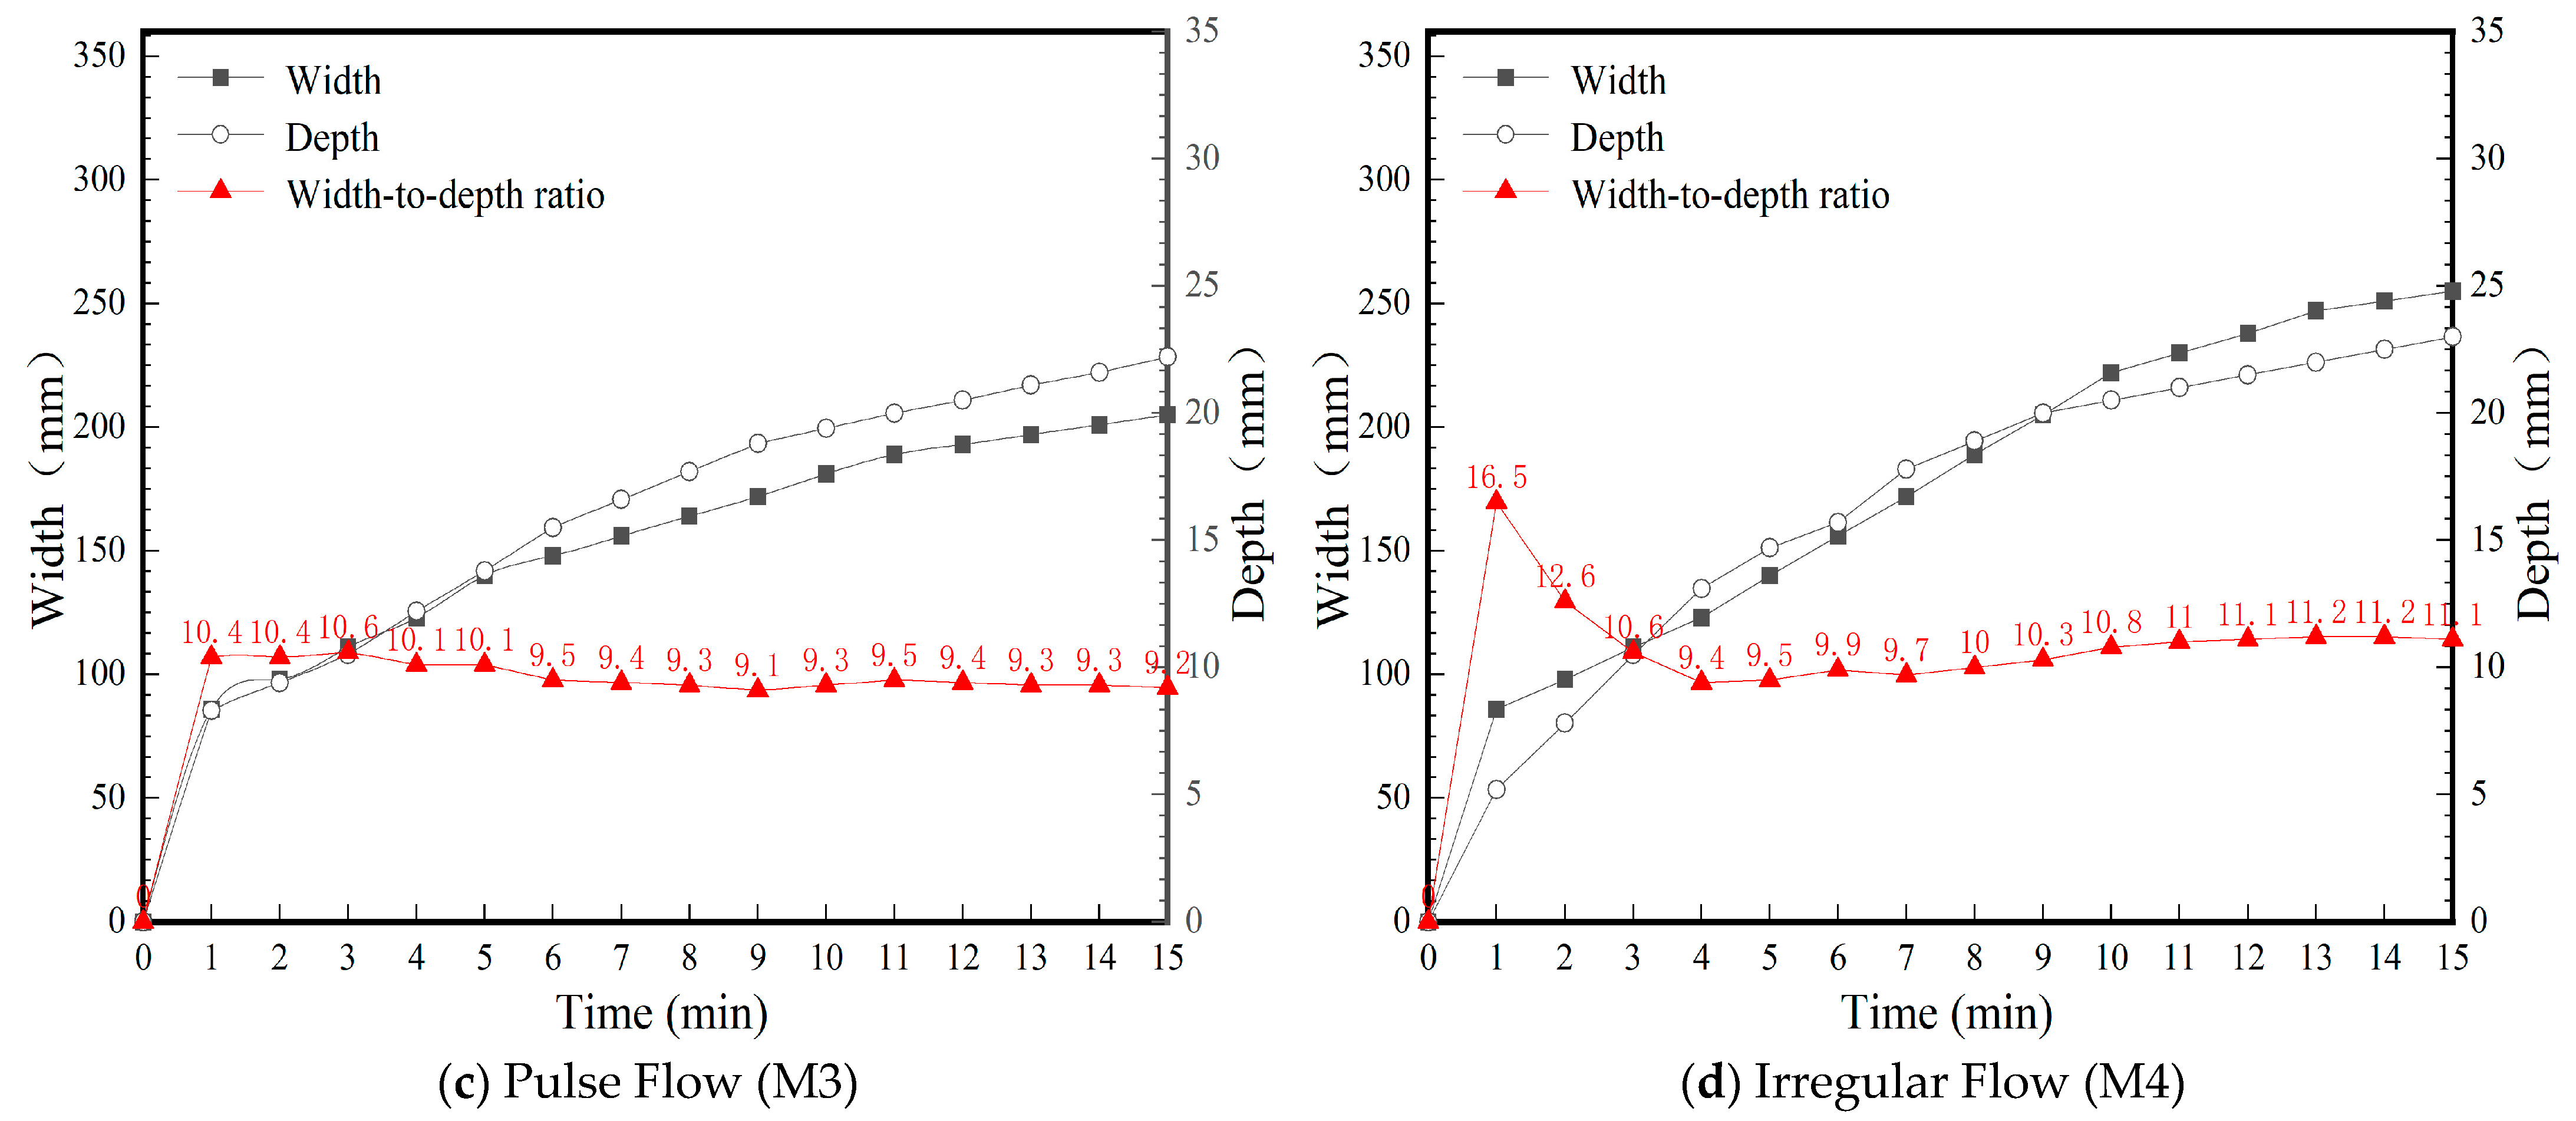
Figure 14 illustrates the dynamic evolution of the scour holes. In these plots, the horizontal axis represents time (0–15 min), while the dual vertical axes denote width (solid black dots) and depth (hollow circles). The red curve represents the width-to-depth (W/D) ratio. General observations indicate that both width and depth increase monotonically over time, though their growth rates exhibit distinct, pattern-specific characteristics across different stages. The fluctuations in the W/D ratio serve as an indicator of the relative growth dynamics: an increasing ratio signifies width expansion dominating over vertical incision, a decreasing ratio suggests depth growth is prevalent, and a stable ratio indicates a proportional scaling between the two dimensions. The three stages of scour hole evolution (initial stage, intermediate stage, and final stage) are classified based on the variation magnitudes of scour hole width and depth. The initial stage corresponds to the period when the scour hole undergoes significant changes under various working conditions; the intermediate stage corresponds to the period when the evolution rate of the scour hole slows down considerably; and the final stage corresponds to the period when no obvious changes occur in the scour hole.
Under the M1 condition, the width evolution progressed through initial (0–4 min, rapid expansion), intermediate (4–11 min, sustained growth), and final (11–15 min, deceleration) stages. Depth evolution followed a similar tripartite pattern: an initial sharp increase (0–5 min), stabilization (5–11 min), and a final slight increase (11–15 min). The W/D ratio rose initially (width-dominated growth), fluctuated and then declined during the intermediate stage as depth growth accelerated, before stabilizing. This indicates that Constant Current Flows promote width expansion early on, followed by vertical development, resulting in a deeper and relatively narrower hole morphology.
In the M2 condition, width evolution exhibited a slow initiation (0–8 min), followed by acceleration (8–12 min) and deceleration (12–15 min). Depth changes featured a rapid initial increase (0–5 min), a steady intermediate phase (5–11 min), and minimal final changes (11–15 min). The W/D ratio remained initially stable due to comparable growth rates, rose as width expansion caught up in the middle stage, and declined finally. Sine Flows induced a more moderate evolution; width growth generally lagged behind depth, yielding a shallower and wider morphology that trended toward balance in the later stages.
Under M3, width evolution was characterized by gradual (0–6 min), peak (6–11 min), and stable (11–15 min) stages, which synchronized with the depth evolution phases. The W/D ratio exhibited minimal fluctuation, remaining largely stable before a slight final decrease. Pulse Flows induced a highly coupled evolution of width and depth, resulting in a uniform morphology. Although growth rates exhibited an intermittent nature due to pulse disturbances, strong overall synchronization was maintained.
The M4 condition displayed the most volatile dynamics. Width changes were marked by a “burst-type” expansion (0–4 min), followed by fluctuating growth (4–10 min) and stabilization (10–15 min). Depth changes comprised an initial rapid increase (0–5 min), intermediate acceleration (5–9 min), and final stabilization (9–15 min). The W/D ratio initially surged (width-dominated), then declined as depth growth surpassed width expansion, before stabilizing. This irregular regime produced a dynamically shifting morphology, characterized by rapid early widening and subsequent vertical deepening.
In summary, Figure 14 reveals that the evolutionary stages for M1 and M4 are sharply defined with significant W/D fluctuations, reflecting the impact of flow stability on hole expansion. In contrast, M2 and M3 exhibit smoother transitions and lower W/D ratios, indicating that periodic or pulsed currents promote more synchronized development. Across all patterns, width growth consistently preceded depth increase, eventually reaching a state of relative equilibrium. These depth variations are consistent with the CFD simulation results reported by Dutta et al. [46]. It was also found out that there is a positive correlation between KC number and the strength of the horseshoe vortex for a fixed aspect ratio, indicating that larger KC numbers result in greater scour depths.
Table 6 and Table 7 quantify the stage-wise scour development, revealing that the flow regime dictates not only the final scour dimensions but also the unique temporal signature of its evolution ( W max and D max represents the largest one-minute increment within that stage; W min and D min represent the smallest one-minute increment within that stage). Although the initial stage universally dominated erosion by accounting for over 50% of the final depth across all regimes, the subsequent developmental patterns diverged significantly. The M1 Constant Current Flow exhibited the most aggressive, front-loaded erosion, achieving the largest final width (349 mm) and depth (31.4 mm) through an unparalleled initial burst that established it as the most erosive regime. In contrast, the M2 (Sine) and M3 (Pulse) regimes yielded more controlled and suppressed scour, with M3 being particularly notable for its highly uniform and synchronized growth that indicated a stable and predictable morphological evolution. Occupying a unique intermediate position, the M4 irregular current displayed a more volatile evolution. While its initial lateral expansion was rapid, it was distinguished by a dramatic surge in depth during the intermediate stage—the largest of any regime at that point (17 mm). This signifies a unique shift from early lateral scour to mid-stage vertical deepening, driven by the flow’s stochastic nature and highlighting a more complex, less predictable failure mechanism.
The analysis of characteristic timescales in Table 8 quantifies the distinct rates of scour development and the formation of secondary features, which are directly governed by the flow regime. The M1 (Steady) and M4 (Irregular) regimes triggered the fastest initial response, with scour width reaching 14 cm in under 3 min. However, their long-term evolution diverged. M1 was the most efficient erosive regime overall, reaching a 2 cm depth in just 2 min. In contrast, M2 (Sine) and M3 (Pulse) exhibited significantly more suppressed and gradual development, requiring 8 and 11 min, respectively, to reach the same depth threshold. This demonstrates that periodic, stable flows effectively delay vertical scour progression. Furthermore, secondary morphological features like deposition were directly linked to flow instability. Pronounced sediment ridges formed only under the unstable M1 and M4 regimes, initiating at 5 and 6 min, respectively. The stable (M2) and periodically stable (M3) flows dispersed sediment more effectively, precluding significant local deposition.
In synthesis, the flow regimes produce distinct scour signatures. M1 (Steady) creates the largest and most rapidly forming scour holes, representing the highest-risk scenario. M2 (Sine) and M3 (Pulse) generate smaller, more uniform scour holes through a controlled, predictable process. M4 (Irregular) is uniquely characterized by high variability; it combines a rapid initial burst with unpredictable, delayed deepening and deposition, amplifying morphological uncertainty. The final scour scale follows the order M1 > M4 > M2 ≈ M3, with deposition showing a direct correlation with flow instability. These findings underscore that flow type is a primary determinant of time-dependent scour evolution, highlighting the need for enhanced monitoring, particularly in Irregular Flow environments.

4.3. Final Scour Morphology Under Various Flow Regimes

The equilibrium scour widths and depths across all four flow regimes and various pulse frequencies are compiled and compared in Table 9 and Table 10. A comparative analysis reveals that the M1 (Constant Current Flow) regime consistently yielded the maximum scour dimensions (both depth and width) across all experimental scenarios. Conversely, the M3 (Pulse Flow) regime resulted in the most constrained terminal dimensions, representing the minimum scour scale observed in this study.
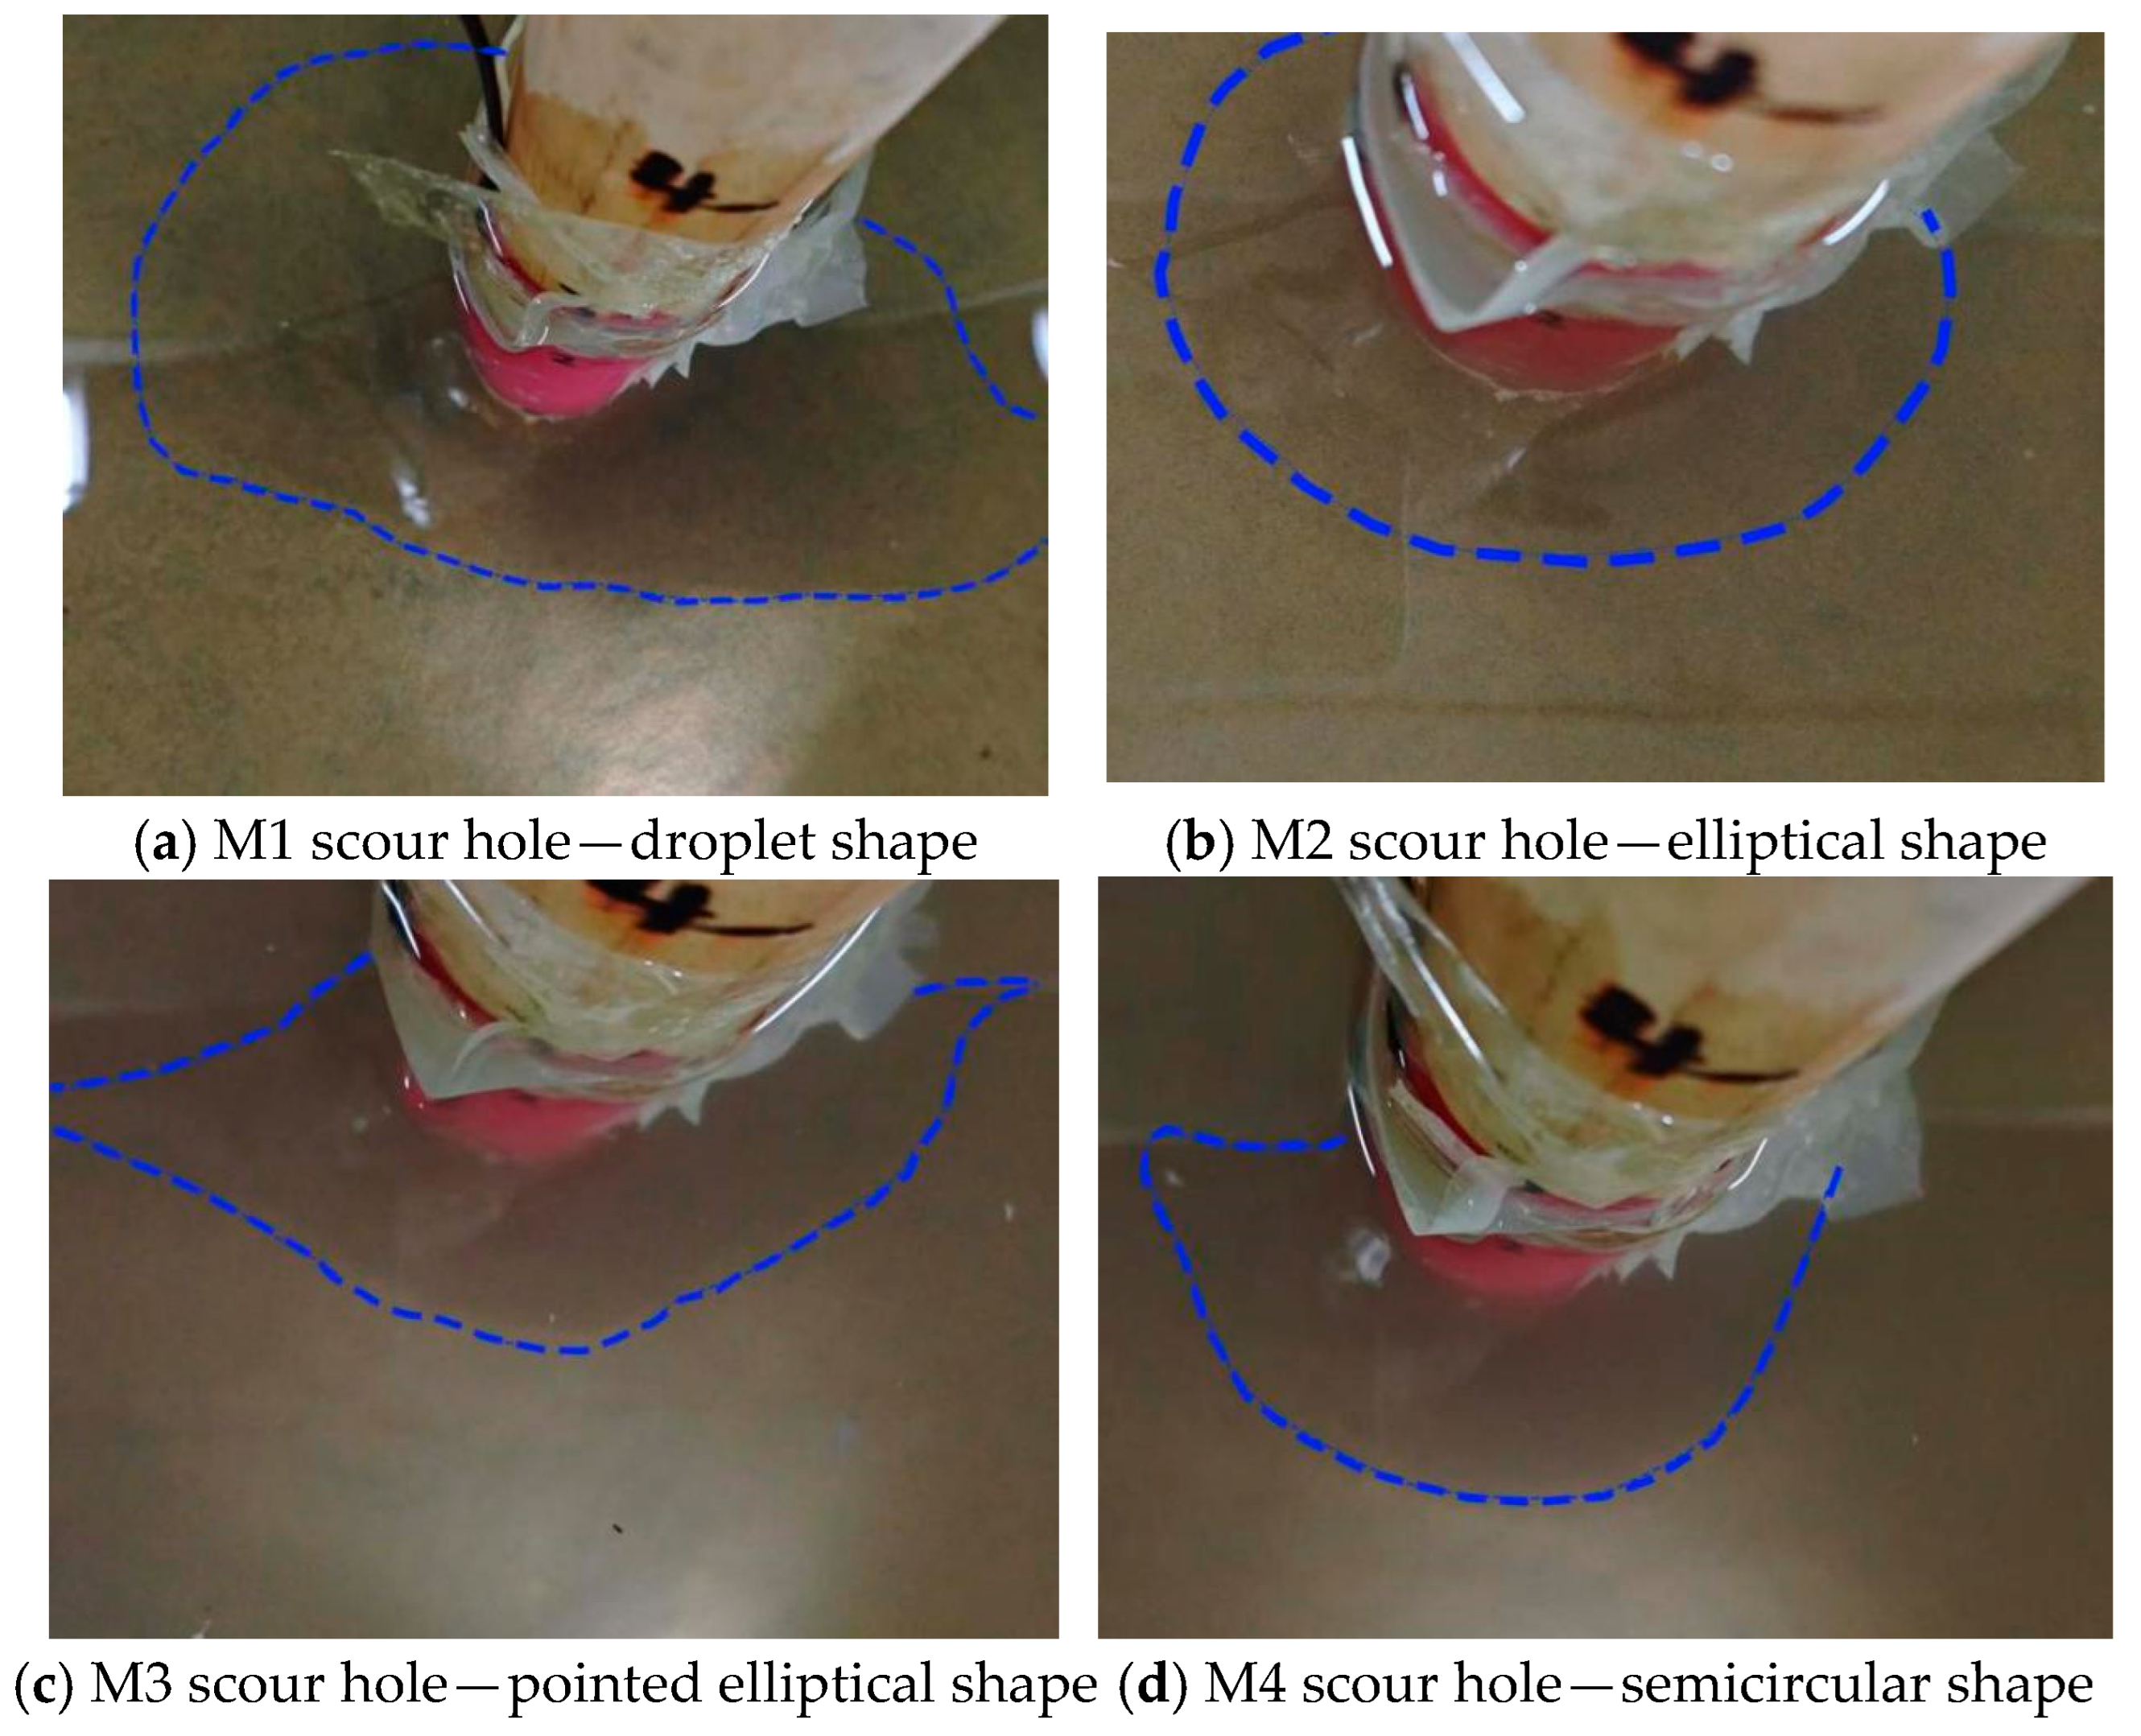
Figure 15 illustrates the equilibrium morphology of the scour holes under various flow regimes. As the scour area approached a stable state, distinct sediment accretion (deposited rims) was observed around the perimeters under the M1 (Constant Current Flow), M3 (Pulse Flow), and M4 (Irregular Flow) conditions. In contrast, this phenomenon was only observed under the M2 (Sine Flow) regime at the high-frequency excitation of 100 Hz.
Furthermore, the occurrence of this deposition showed a strong positive correlation with the pulsation frequency; specifically, the deposited contours formed more rapidly and became more pronounced as the frequency increased. In the 39 Hz (low-frequency) trials, sediment accretion was limited exclusively to the M1 condition. At the 69 Hz (medium-frequency) level, deposition became evident in both the M1 and M4 regimes. By the 100 Hz (high-frequency) condition, the phenomenon was manifested across all four flow regimes. These results indicate that the formation of peripheral deposition is highly sensitive to the pulsation frequency, and that high-frequency excitation more readily facilitates the transport and accumulation of sediment at the scour hole boundaries.
To further quantify these morphological differences, the teardrop shape under the M1 regime was characterized by a maximum scour width located approximately 1.5 pile diameters downstream from the pile center, with a length-to-width ratio of about 1.8. In contrast, the elliptical shape of M2 and M3 showed a more symmetrical distribution, with the maximum width occurring near the pile’s lateral centerline. The semi-circular morphology of M4 was distinguished by a flattened downstream edge and significant sediment deposition upstream, resulting in a highly asymmetrical planform. While these descriptions are based on 2D image analysis, they provide a more structured comparison of the final scour geometries. Future work incorporating 3D laser scanning would be beneficial for a complete topographical reconstruction and volumetric analysis.
For a more intuitive comparison, the evolutionary rates, key sedimentation features, and equilibrium morphologies under different flow regimes are summarized in Table 11 and Table 12. Although the scour holes generally approximated circular or elliptical configurations [47], they exhibited distinct geometric signatures depending on the specific flow regime.
Specifically, the M1 (Constant Current Flow) condition yielded a teardrop-shaped morphology, reflecting the stable and unidirectional nature of the scouring process. The M2 (Sine Flow) condition resulted in an elliptical structure with a relatively regular and symmetrical contour. In contrast, the M3 (Pulse Flow) condition produced a pronounced elliptical shape, indicating a significant tendency for localized lateral concentration of scour. Finally, the M4 (Irregular Flow) regime led to a semi-circular morphology, demonstrating a more complex and stochastic spatial distribution.
These morphological disparities underscore the fact that in complex marine environments, the diversity of hydrodynamic regimes drives the formation of varied scour structures. Such variations are critical for the accurate assessment of foundation stability, scour depth prediction, and the long-term structural integrity of nearshore engineering assets.

5. Temporal Evolution of Scour Morphology Under Various Pulse Frequencies

5.1. Morphological Development of Scour Holes at Different Frequency Levels

Analysis of the experimental results shows that among the four flow patterns, namely Constant Current Flow (M1), Sine Flow (M2), Pulsed Flow (M3), and Irregular Flow (M4), only the results of Constant Current Flow (M1) exhibit significant differences across the three frequency conditions, with the variation amplitude of the scour hole increasing as the frequency rises. In contrast, for the other three flow patterns at 39 Hz and 69 Hz, although slight differences exist, they are noticeably weaker than those of Constant Current Flow (M1). Therefore, to characterize the influence of pulsation frequency on the morphological evolution of the scour hole, this study selected three representative frequencies (39, 69, and 100 Hz) under the idealized Constant Current Flow (M1) regime. Scour experiments, each with a 15 min duration, were performed on the model pile to evaluate the frequency-dependent response of the bed morphology.
As shown in Figure 16, under the M1 condition with a low pulsation frequency (39 Hz), the average flow velocity was 0.037 m/s; the corresponding morphological evolution of the scour hole is illustrated in Figure 16. Within the first 6 min, the scour hole underwent rapid vertical deepening and lateral expansion, reaching a horizontal diameter of 25 cm. Between the 6th and 11th minutes, significant deepening persisted, although the rate of areal expansion decelerated. During this phase, sediment was transported in discrete layers by the current and accumulated along the perimeter, forming a distinct deposited rim. The scour depth reached 2 cm by the 11th minute. From the 12th to the 15th minute, the rate of vertical incision slowed, and the scour area remained largely unchanged. This stabilization phenomenon aligns with the scour characteristics of monopiles under unidirectional flow observed by [13]. Continuous current impingement further transported sediment outward, refining the scour hole’s contour. The final morphology exhibited a characteristic teardrop shape in plan view. Due to sediment accretion, a gentle slope formed at the upstream face (defined as the front hereafter). The scour area gradually tapered with increasing distance from the pile, a morphology consistent with the small-scale unidirectional flow experiments by [20]. Regarding the final bathymetry, the maximum scour depth occurred at the upstream face, with intermediate depths at the lateral sides and the minimum depth recorded downstream. Additionally, the downstream scour depth diminished progressively with increasing distance from the pile.
Under the M1 condition with a high pulsation frequency (100 Hz), the average flow velocity reached 0.068 m/s. The morphological evolution of the scour hole is illustrated in Figure 17. During the incipient stage (the first minute), the scour depth developed precipitously, reaching its peak of 2 cm within an exceptionally short duration, while the scour area simultaneously expanded to 25 cm [48]. The rate of these initial changes significantly outpaced those observed under the 39 Hz and 69 Hz conditions (Figure 16).
Subsequently (2–15 min), the growth rates of both depth and area decelerated markedly, leading to a substantial stabilization of the morphology. During this phase, the current-driven transport of sediment in discrete layers toward the periphery was clearly observable, resulting in a continuous increase in the height and thickness of the deposited rim over time. While the final morphology retained a teardrop shape, the high-energy flow conditions intensified the scour features compared to the lower frequency cases: the resulting scour hole was both more expansive and deeper. Furthermore, the sediment slope at the upstream face was more prominent, the lateral scour depths were greater, and the boundary contours were more robust. Notably, the water turbidity remained significantly higher throughout the process, reflecting the enhanced sediment mobilization induced by the high-frequency pulses. At the high pulsation frequency of 100 Hz, the high-frequency alternation of fluid dynamic pressure kept the particles in an approximately suspended state, thereby completing spatial rearrangement in an extremely short time. It should be emphasized that this high-frequency experiment simulates extreme sudden working conditions (such as instantaneous pulsations during severe storms), and by comparing the scouring rate under conventional working conditions, its engineering early-warning value is highlighted.

5.2. Frequencies Frequency-Dependent Evolution of Scour Hole Dimensions

The variations in scour hole dimensions under the M1 (Constant Current Flow) regime across three distinct pulse frequencies (39, 69, and 100 Hz) are systematically analyzed in Figure 18 (temporal evolution), Table 11 (stage-wise quantification), and Table 12 (characteristic timescales and deposition phenomena). These experiments were conducted over a 15 min duration to evaluate the frequency-dependent response of the scour process. The dynamic evolution of width and depth under these varying frequencies is illustrated in Figure 18.
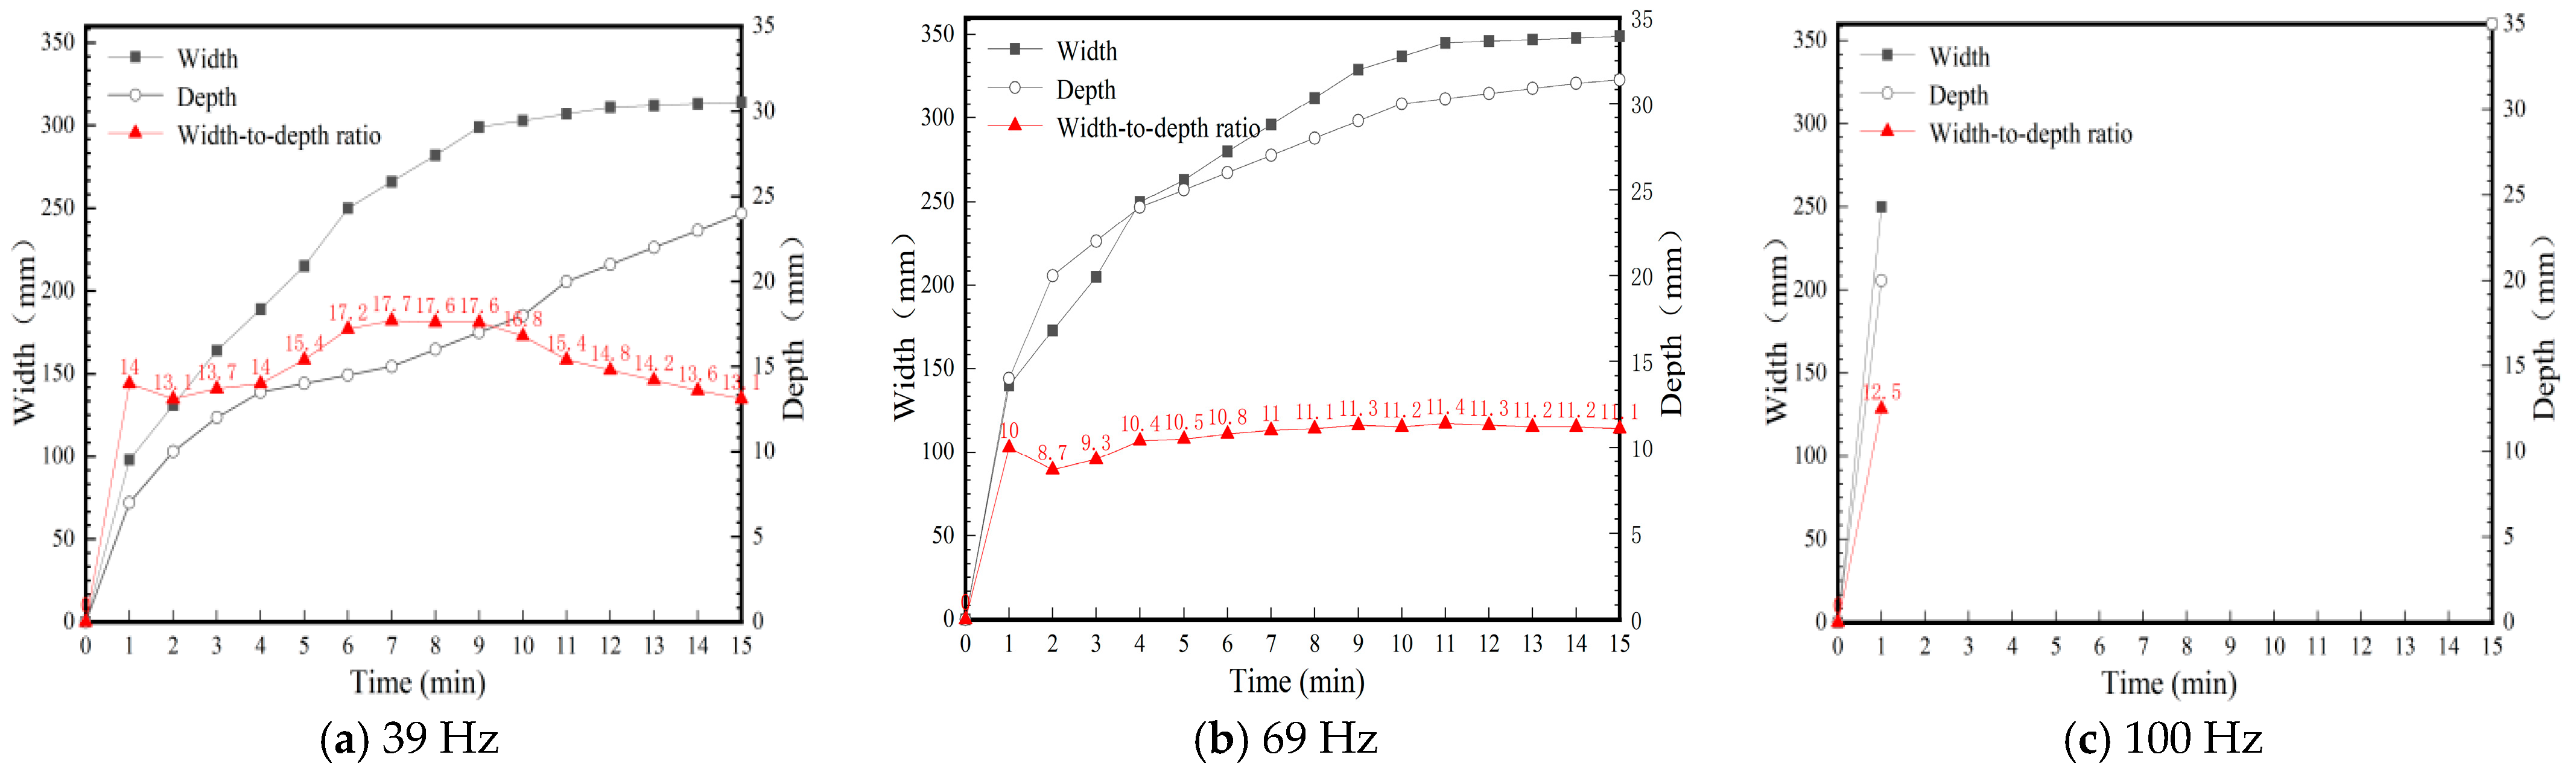
As illustrated in Figure 18a, under the low-frequency pulse (39 Hz), the scour width evolved through initial (0–6 min), intermediate (6–12 min), and final (12–15 min) stages, while the depth evolution followed a corresponding tripartite sequence of 0–8 min, 8–12 min, and 12–15 min. Figure 18b shows that for the medium-frequency pulse (69 Hz), the development was notably accelerated, with width evolution stages of 0–4 min, 4–11 min, and 11–15 min, and depth stages of 0–5 min, 5–11 min, and 11–15 min.
In contrast, for the high-frequency pulse (100 Hz) shown in Figure 18c, reliable temporal data could only be acquired during the first minute due to extreme water turbidity. After the experiment, the final morphology was measured with a physical measuring ruler following slow water drainage. The drainage rate was controlled to be extremely low to avoid disturbing the sedimentary morphology. Despite this limitation, the terminal dimensions were significantly larger than those in the other groups, with the final scour width and depth exceeding 360 mm and 35 mm, respectively. This condition exhibited the most pronounced morphological transformations among all experimental scenarios, reflecting the high kinetic energy of the flow field.
Table 13 and Table 14 summarize the incremental changes in scour width and depth across the three frequency conditions ( W max and D max represents the largest one-minute increment within that stage; W min and D min represents the smallest one-minute increment within that stage). As the pulsation frequency increased from 39 Hz to 100 Hz, the terminal width expanded from 314 mm to over 360 mm, while the terminal depth increased from 24 mm to over 35 mm. This demonstrates a strong positive correlation between pulsation frequency and the ultimate scour scale. Higher frequencies intensified flow velocities (Section 2), thereby exerting greater bed shear stress and enhancing sediment transport capacity, which culminated in more expansive and deeper scour holes.
Under the 39 Hz (Low-Frequency) condition, the scour scale was the smallest among the tested frequencies ( W = 314   mm , D = 24   mm ), yet it remained substantial, reflecting the fundamental erosive potential of the M1 regime. In the initial stage, width and depth increments were 98 mm and 20 mm, respectively; the width expansion was nearly five times that of depth, establishing the primary footprint of the pit. Growth rates decelerated markedly during the intermediate stage ( Δ W = 15   mm , Δ D = 2   mm ), indicating a transition to a quasi-stable phase. By the final stage, width growth nearly stagnated ( Δ W = 1   mm ) while depth exhibited a minor adjustment ( Δ D = 2   mm ). This “steady and progressive” pattern is characterized by gradual energy release over a prolonged duration.
Under the 69 Hz (Medium-Frequency) condition, the terminal width and depth increased to 349 mm and 32 mm, respectively, illustrating the amplifying effect of frequency on scouring capacity. The initial stage witnessed a dramatic surge in increments ( Δ W = 140   mm , Δ D = 32   mm ); notably, the entire vertical incision process was completed in one step during this phase. Subsequent growth in both dimensions was negligible, with depth remaining constant ( Δ D = 0   mm ) through the middle and final stages. This represents an “efficient, initial-stage dominated” mode, where scour energy is released explosively at the onset, rapidly achieving morphological equilibrium.
Under the 100 Hz (High-Frequency) condition, the observed width and depth reached 360 mm and 35 mm, the highest across all scenarios. The initial stage was remarkable, with increments of 250 mm for width (contributing 70% of the total) and 35 mm for depth achieved almost instantaneously. Due to extreme turbidity and the rapidity of development, the middle and final stages were effectively merged or rendered indistinguishable. This process follows an instantaneous burst or single-step finalization pattern. Energy release was so intense that the scour hole reached its dynamic limit almost immediately, with the entire evolution concentrated into the inception of the test.
In summary, the ultimate scour scale is primarily determined by the frequency of energy input. The evolutionary mode transitions from “moderate and progressive” at 39 Hz to “Rapid development phase” at 69 Hz, and finally to “instantaneously finalized” at 100 Hz. Higher frequencies not only augment the final dimensions but also significantly condense the time required to reach morphological equilibrium by concentrating energy release into the earliest stage of the scour process. At the initial start-up of the experiment, large-scale standing waves were eliminated by adjusting energy-dissipating nets and water inlet devices. Although high-frequency pulsations inevitably generate small-amplitude surface waves, their wavelengths are extremely short, and the energy is mainly concentrated in the bottom flow field, which dominates the local scouring around the monopile.

6. Conclusions

According to the experimental conclusions, high pulsation frequency significantly shortens the equilibrium scouring time. This indicates that under specific working conditions, traditional regular inspections may be ineffective; targeted backfilling for bottom protection should be strengthened at the initial stage of commissioning, and emphasis should be placed on reinforcing the explosive scouring zones on both sides of the monopile. Based on a series of laboratory flume experiments, this study investigated the scour characteristics around a monopile under four distinct hydrodynamic regimes (M1: Steady, M2: Sinusoidal, M3: Pulsatile, and M4: Irregular) across varying flow intensities. The key findings are summarized as follows:
  • Average flow velocities exhibited a cyclic increasing trend with rising pulse frequencies. The Sine Flow (M2) demonstrated the highest velocity fluctuations, whereas the Irregular Flow (M4) remained the most stable, characterized by the minimum variation amplitude.
  • At the laboratory scale, higher pulse frequencies significantly compressed the timescale for scour initiation. Observable scour holes manifested within the first 3 min at low frequency (39 Hz), 1 min at medium frequency (69 Hz), and within merely 30 s at high frequency (100 Hz).
  • The rate of vertical scour was positively correlated with frequency. At the laboratory scale, the duration required to achieve a 2 cm scour depth was reduced from 14 min (39 Hz) to 11 min (69 Hz), and ultimately to 6 min (100 Hz). Furthermore, the onset of the peak deepening phase shifted earlier as the frequency increased.
  • Lateral expansion rates were similarly frequency-dependent. At the laboratory scale, the window of most rapid area expansion advanced from 5–8 min (39 Hz) to 3–4 min (100 Hz). Despite these differing rates, all experimental groups eventually stable widths ranged from 14 to 28 cm for low/medium frequencies, reaching over 36 cm at high frequency.
  • Distinct equilibrium configurations developed under each regime: teardrop-shaped (M1), elliptical (M2), pronouncedly elliptical (M3), and semi-circular (M4). These results underscore that the hydrodynamic regime is a decisive factor in determining the ultimate geometric signature of scour holes around nearshore foundations.
  • Future research can be conducted in the following aspects. On the one hand, emphasis should be placed on refined three-dimensional topographic measurements of scour holes to overcome the limitations of conventional two-dimensional observations, obtain more comprehensive and quantitative morphological data of scour holes, and provide more accurate data support for revealing the temporal and spatial evolution of scour. On the other hand, it is necessary to systematically carry out multi-scale model tests, combine physical modeling with numerical simulations, clarify the differences and correlations of scour mechanisms across different scales, and then reasonably extrapolate laboratory test results to real engineering prototype conditions, thereby enhancing the guiding significance of research findings for offshore wind power engineering practice.

Author Contributions

Conceptualization, M.C. and Z.J.; experiments and data analyses, H.Z. and M.C.; writing—original draft, H.Z.; validation, Z.J. and M.C.; review and editing, Z.J. and M.C. All authors have read the manuscript and agreed to its submission. All authors have read and agreed to the published version of the manuscript.

Funding

This work was funded by the National Natural Science Foundation of China (Grant Nos. 52308364, 52578467).

Data Availability Statement

The data presented in this study are available upon request from the corresponding author.

Conflicts of Interest

The authors declare no conflicts of interest.

References

  1. Tang, Z.-H.; Melville, B.; Singhal, N.; Shamseldin, A.; Zheng, J.-H.; Guan, D.-W.; Cheng, L. Countermeasures for local scour at offshore wind turbine monopile foundations: A review. Water Sci. Eng. 2022, 15, 15–28. [Google Scholar] [CrossRef]
  2. McGovern, D.J. The Interaction of Tidal Currents with Offshore wind Turbine Monopiles: An Experimental Study of Flow, Turbulence, Scour and the Reduction of Scour Around the Monopile. Doctoral Dissertation, Lancaster University, Lancaster, UK, 2010. [Google Scholar]
  3. Geng, F.; Yang, W.; Nadimi, S.; Hu, Z. Development and prediction of scour around offshore wind turbine monopile foundations in ebb and flow tides. Ocean Eng. 2024, 311, 118905. [Google Scholar] [CrossRef]
  4. Satari, R.; Sarma, B.; Schendel, A.; Welzel, M.; Krishna, R.; Schlurmann, T.; Neuweiler, I. Hydrodynamics around a jacket-type foundation structure in steady current: A combined experimental and numerical study. Ocean Eng. 2024, 304, 117832. [Google Scholar] [CrossRef]
  5. Rueda-Bayona, J.G.; Guzmán, A.; Eras, J.J.C. Vortex-induced vibration effect of extreme sea states over the structural dynamics of a scaled monopile offshore wind turbine. J. Ocean Eng. Mar. Energy 2023, 9, 359–376. [Google Scholar] [CrossRef]
  6. Dai, G.; Gao, L.; Chen, X.; Wan, Z.; Zhu, M.; Du, S. A calculation model of the equilibrium scour depth for monopile foundations under waves and currents. Arab. J. Sci. Eng. 2021, 46, 5023–5029. [Google Scholar] [CrossRef]
  7. Xi, W.; Zhou, H.; Wang, Z.-L. Model Test Study on Vertical Bearing Behavior of Single Piles and Pile Groups in Sand with Scour Pits. J. Civ. Environ. Eng. (Chin. Engl.) 2025, 1–11. Available online: https://link.cnki.net/urlid/50.1218.TU.20250917.1453.002 (accessed on 23 May 2026).
  8. Li, T.; Wang, S.; Li, B.; Qi, W.G. Experimental study on Local Scour of a Large-Diameter Winged Monopile Foundation for Offshore Wind Turbines under Wave-Current Interaction. Ocean Eng. 2024, 42, 60–70. [Google Scholar] [CrossRef]
  9. Liu, S.; Liu, Z. Influence of Currents on the Breaking Wave Forces Acting on Monopiles over an Impermeable Slope. Sustainability 2022, 15, 129. [Google Scholar] [CrossRef]
  10. Wang, Z.; Liu, H.; Yang, Q. Analysis of Local Scour Characteristics of Large-Diameter Monopiles under Combined Wave-Current Action. Rock Soil Mech. 2021, 42, 1178–1185+1199. [Google Scholar] [CrossRef]
  11. Aggarwal, A.; Bihs, H. CFD study of regular waves on a jacket structure. In Proceedings of the Fourth International Conference in Ocean Engineering (ICOE2018); Springer: Berlin/Heidelberg, Germany, 2019; Volume 1, pp. 605–612. [Google Scholar] [CrossRef]
  12. Goutiere, L.; Soares-Frazão, S.; Zech, Y. Dam-break flow on mobile bed in abruptly widening channel: Experimental data. J. Hydraul. Res. 2011, 49, 367–371. [Google Scholar] [CrossRef]
  13. Ma, L.; Guo, Z.; Wang, L. Experimental Study on the Scour Process around a Monopile under Unidirectional Flow. Ocean Eng. 2017, 35, 136–146+156. [Google Scholar] [CrossRef]
  14. Gong, E.; Chen, S.; Chen, X. Large-Scale Experimental Study on Monopile Scour under Wave Conditions. J. Tsinghua Univ. (Sci. Technol.) 2024, 64, 619–625. [Google Scholar] [CrossRef]
  15. Yan, Y.; Zhang, E.; Zeng, Z. Large-scale Model Test on the Scour Evolution of Large-Diameter Monopiles for Offshore Wind Power. J. Waterw. Harb. 2024, 45, 224–229. [Google Scholar]
  16. Qi, W.; Gao, F. Equilibrium scour depth at offshore monopile foundation in combined waves and current. Sci. China Technol. Sci. 2014, 57, 1030–1039. [Google Scholar] [CrossRef]
  17. Sumer, B.M.; Fredsøe, J.; Christiansen, N. Scour around vertical pile in waves. J. Waterw. Port Coast. Ocean Eng. 1992, 118, 15–31. [Google Scholar] [CrossRef]
  18. Sun, Y.; Song, Y.; Bian, S. Analysis of Scour Process and Mechanism around Pile Foundations of Offshore Platforms. J. Ocean Univ. China (Nat. Sci. Ed.) 2007, 636–640. [Google Scholar] [CrossRef]
  19. Whitehouse, R.J.; Harris, J.; Sutherland, J.; Liddiard, M. Scour hazard assessment for offshore wind developments–lessons learned from European waters. In Proceedings of the American Wind Energy Association WindPower 2011 Conference & Exhibition, Baltimore, MD, USA, 2–4 November 2011. [Google Scholar]
  20. Zhang, R.; Wang, H.; Chen, P.; Zhang, J.; Zhang, R. Model Test of Offshore Wind Turbine Foundation Scour Prevention MeasuresBased on Bionic Grass. China Offshore Platf. 2024, 39, 80–84+90. [Google Scholar]
  21. Basack, S.; Goswami, G.; Dai, Z.; Baruah, P. Failure-Mechanism and Design Techniques of Offshore Wind Turbine Pile Foundation: Review and Research Directions. Sustainability 2022, 14, 12666. [Google Scholar] [CrossRef]
  22. Ma, L.; Wang, L.; Guo, Z.; Jiang, H.; Gao, Y. Time development of scour around pile groups in tidal currents. Ocean Eng. 2018, 163, 400–418. [Google Scholar] [CrossRef]
  23. Jia, J. Study on Local Scour and Protection of Pile Group Foundations for Offshore Wind Turbines. Master’s Thesis, Tianjin University, Tianjin, China, 2022. [Google Scholar]
  24. Kobayashi, T.; Oda, K. Experimental study on developing process of local scour around a vertical cylinder. In Coastal Engineering; 1994; pp. 1284–1297. [Google Scholar] [CrossRef]
  25. Williamson, C.H.K. Vortex Dynamics in the Wake of a Cylinder. In Fluid Vortices; Green, S.I., Ed.; Springer: Dordrecht, Netherlands, 1995; pp. 155–234. [Google Scholar] [CrossRef]
  26. Zdravkovich, M.M. Flow Around Circular Cylinders: Applications; Oxford University Press: Oxford, UK, 1997; Volume 2. [Google Scholar]
  27. Whitehouse, R.J.; Harris, J.M.; Sutherland, J.; Rees, J. The nature of scour development and scour protection at offshore windfarm foundations. Mar. Pollut. Bull. 2011, 62, 73–88. [Google Scholar] [CrossRef]
  28. Xiong, H.; Yin, Z.-Y.; Zhao, J.; Yang, Y. Investigating the effect of flow direction on suffusion and its impacts on gap-graded granular soils. Acta Geotech. 2021, 16, 399–419. [Google Scholar] [CrossRef]
  29. Jin, Y.-F.; Yin, Z.-Y.; Wu, Z.-X.; Zhou, W.-H. Identifying parameters of easily crushable sand and application to offshore pile driving. Ocean Eng. 2018, 154, 416–429. [Google Scholar] [CrossRef]
  30. Yin, Z.-Y.; Chang, C.S.; Hicher, P.-Y. Micromechanical modelling for effect of inherent anisotropy on cyclic behaviour of sand. Int. J. Solids Struct. 2010, 47, 1933–1951. [Google Scholar] [CrossRef]
  31. Yin, Z.-Y.; Zhao, J.; Hicher, P.-Y. A micromechanics-based model for sand-silt mixtures. Int. J. Solids Struct. 2014, 51, 1350–1363. [Google Scholar] [CrossRef]
  32. Wienke, J.; Sparboom, U.; Oumeraci, H. Breaking wave impact on a slender cylinder. Coast. Eng. 2001, 2000, 1787–1798. [Google Scholar] [CrossRef][Green Version]
  33. Tao, G.; Zhao, X.; Hou, Y.; Huang, Z.; Zhang, S.; Lu, J. Experimental investigation on scour characteristics and predictive model of monopile foundations under breaking waves. Coast. Eng. 2025, 200, 104764. [Google Scholar] [CrossRef]
  34. Toue, T.; Katsui, H. Scour Phenomena around Large-Diameter Circular Cylinders. Lect. Coast. Eng. 1985, 32, 425–429. [Google Scholar] [CrossRef]
  35. Guan, D.-W.; Xie, Y.-X.; Yao, Z.-S.; Chiew, Y.-M.; Zhang, J.-S.; Zheng, J.-H. Local scour at offshore windfarm monopile foundations: A review. Water Sci. Eng. 2022, 15, 29–39. [Google Scholar] [CrossRef]
  36. Teutsch, I.; Mendes, S.; Kasparian, J. Direction symmetry of wave field modulation by tidal current. arXiv 2024, arXiv:2407.04723. [Google Scholar] [CrossRef]
  37. Xia, K. Study on Hydrodynamic Performance of Floating Platforms and Wave Evolution Characteristics in Shallow Water Near Islands and Reefs ased on CFD Method. Master’s Thesis, Shanghai Jiao Tong University, Shanghai, China, 2018. [Google Scholar]
  38. Miller, R.L. Role of vortices in surf zone prediction: Sedimentation and wave forces. In Beach and Nearshore Sedimentation; SEPM Society for Sedimentary Geology: Tulsa, OK, USA, 1976. [Google Scholar] [CrossRef]
  39. Ting, F.C.; Kirby, J.T. Dynamics of surf-zone turbulence in a spilling breaker. Coast. Eng. 1996, 27, 131–160. [Google Scholar] [CrossRef]
  40. Goda, Y. Reanalysis of regular and random breaking wave statistics. Coast. Eng. J. 2010, 52, 71–106. [Google Scholar] [CrossRef]
  41. Zhang, J.; Ma, Y.; Tan, T.; Dong, G.; Benoit, M. Enhanced extreme wave statistics of irregular waves due to accelerating following current over a submerged bar. J. Fluid Mech. 2023, 954, A50. [Google Scholar] [CrossRef]
  42. Lin, J.Z.; Hu, J. Study on Wave Force on Monopile Foundation of Offshore Wind Turbine under Freak Waves. Guangdong Shipbuild. 2019, 38, 21–24. [Google Scholar]
  43. Saprykina, Y.V.; Kuznetsov, S.Y.; Kuznetsova, O.; Shugan, I.; Chen, Y.-Y. Wave breaking type as a typical sign of nonlinear wave transformation stage in coastal zone. Phys. Wave Phenom. 2020, 28, 75–82. [Google Scholar] [CrossRef]
  44. Zhang, S.; Li, B.; Ma, H. Numerical investigation of scour around the monopile using CFD-DEM coupling method. Coast. Eng. 2023, 183, 104334. [Google Scholar] [CrossRef]
  45. Zheng, Z.; Hu, Z.; Xie, X.; Huang, W. Local scour around the monopile: A microscopic perspective using CFD-DEM. Ocean Eng. 2024, 299, 117318. [Google Scholar] [CrossRef]
  46. Dutta, D.; Afzal, M.S.; Alhaddad, S. 3D CFD study of scour in combined wave–current flows around rectangular piles with varying aspect ratios. Water 2023, 15, 1541. [Google Scholar] [CrossRef]
  47. Chenxi, Q.; Lunliang, D.; Duoyin, W.; Jianting, Z.; Bingchuan, D.; Hao, F. Experimental study on silty seabed scour around the single pile induced by the current. Ocean Eng. 2024, 293, 116680. [Google Scholar] [CrossRef]
  48. Zhang, N.; Yu, B.; Yin, S.; Guo, C.; Zhang, J.; Kong, F.; Zhai, W.; Qiu, G. Numerical Investigation of Local Scour Protection around the Foundation of an Offshore Wind Turbine. J. Mar. Sci. Eng. 2024, 12, 692. [Google Scholar] [CrossRef]
Figure 1. Real photo of the offshore wind farm located on Xinliao Island, Xuwen County, Zhanjiang City, Guangdong Province.
Jmse 14 00991 g001
Figure 2. Diagram of the water tank.
Jmse 14 00991 g002
Figure 3. Diagram of model pile.
Jmse 14 00991 g003
Figure 4. Gradation curve of test sand.
Jmse 14 00991 g004
Figure 5. Flow-making pump and scouring area diagram.
Jmse 14 00991 g005
Figure 6. Layout diagram of scouring test.
Jmse 14 00991 g006
Figure 7. Plan and section layout drawings of the sink (Unit: mm).
Jmse 14 00991 g007
Figure 8. Analysis of pile-side water velocity and pulsation frequency under different flow regimes.
Jmse 14 00991 g008
Figure 9. Comparison of vertical velocity profiles under different flow conditions.
Jmse 14 00991 g009
Figure 10. The variation of the flow regime scour hole under the M1 flow regime and pulsation frequency of 69 Hz.
Jmse 14 00991 g010
Figure 11. The variation of the flow regime scour hole under the M2 flow regime and pulsation frequency of 69 Hz.
Jmse 14 00991 g011
Figure 12. The variation of the flow regime scour hole under the M3 flow regime and pulsation frequency of 69 Hz.
Jmse 14 00991 g012
Figure 13. The variation of the flow regime scour hole under the M4 flow regime and pulsation frequency of 69 Hz.
Jmse 14 00991 g013
Figure 14. The variation of the width and depth of the scouring hole with time under 4 types of flow regimes.
Jmse 14 00991 g014aJmse 14 00991 g014b
Figure 15. Final form of scour holes under different flow regimes.
Jmse 14 00991 g015
Figure 16. The variation of flow regime scour under the M1 flow regime and pulsation frequency of 39 Hz.
Jmse 14 00991 g016
Figure 17. The variation of flow regime scour hole under the M1 flow regime and pulsation frequency of 100 Hz.
Jmse 14 00991 g017
Figure 18. The dynamic evolution of the width and depth of the scour holes.
Jmse 14 00991 g018
Table 1. Engineering characteristics of an nearshore wind farm in an eastern coastal area.
ParameterValue
Mean sea level (MSL)/m2.15
Water depth range/m−20~0
Mean high water (MHW)/m3.09
Mean low water (MLW)/m1.26
Design high water level (DHWL)/m3.87
Design low water level (DLWL)/m0.72
Maximum current velocity/(m/s)1.47
Maximum wave height/m9.65
Table 2. Summary of model scales.
Geometric scalesHorizontal scale λ l 80
Vertical scale λ h 50
Distortion ratioE1.00
Hydrodynamic similarity scalesVelocity scale λ u = λ v = λ h 1 / 2 7.07
Discharge scale λ Q = λ l × λ h 3 / 2 28,284
Time scale λ t = λ l / λ h 1 / 2 11.32
Roughness scale λ n = λ h 2 / 3 / λ l 1 / 2 1.52
Table 3. Test Conditions Matrix and Strouhal Number.
Test-IDFlow RegimesFrequency of the Pulsating Source (Hz)The Average Flow Velocity (m/s)Strouhal
Number (St)
1Constant Current Flow (M1)390.03773.7
2Constant Current Flow (M1)690.047102.8
3Constant Current Flow (M1)1000.068102.9
4Sine Flow (M2)390.04560.7
5Sine Flow (M2)690.06475.4
6Sine Flow (M2)1000.07198.6
7Pulse Flow (M3)390.04166.6
8Pulse Flow (M3)690.05194.7
9Pulse Flow (M3)1000.07889.7
10Irregular Flow (M4)390.0468.3
11Irregular Flow (M4)690.046105.0
12Irregular Flow (M4)1000.068102.9
Table 4. Four flow regimes of the flow-generating.
Flow RegimesIllustrationFlow RegimesIllustration
Constant Current Flow (M1)Jmse 14 00991 i001Sine Flow (M2)Jmse 14 00991 i002
Pulse Flow (M3)Jmse 14 00991 i003Irregular Flow (M4)Jmse 14 00991 i004
Table 5. Introduction to the four flow regimes.
Flow RegimesDominant MechanismTypical PhenomenaPractical ApplicationsBreaking Mode
Constant Current Flow (M1)Doppler effect/Energy redistributionFlow height modulation, Breaking enhancementEstuaries, strait engineeringSpilling breaker
Sine Flow (M2)Dispersion/NonlinearityFlow front steepening, BreakingLaboratory flume experimentsPlunging/Collapsing breaker
Pulse Flow (M3)Balance between nonlinearity and dispersion/DissipationStable propagation of solitary flows or pulse decompositionTsunamis, impact load studiesSurging breaker
Irregular Flow (M4)Spectral evolution/Flow–flow interactionGeneration of rogue flows, flow group separationReal sea environment, field conditionsStochastic breaking
Table 6. The periodic variations in the width of scour holes under different flow regimes.
Frequency of the Pulsating Source
(Hz)
Flow
Mode
Final Width
(mm)
Initial PhaseIntermediate PhaseLater Phase
W max
(mm)
W min
(mm)
W max
(mm)
W min
(mm)
W max
(mm)
W min
(mm)
69M13491403217811
M2217871313912
M320586129844
M42558612171294
Table 7. The periodic variations in the depth of scour holes under different flow regimes.
Frequency of the Pulsating Source
(Hz)
Flow
Mode
Final Depth
(mm)
Initial PhaseIntermediate PhaseLater Phase
D max
(mm)
D min
(mm)
D max
(mm)
D min
(mm)
D max
(mm)
D min
(mm)
69M131.4142110.30.3
M223.24321.510.3
M322.28.31.11.10.60.60.5
M4235.22.62.110.50.5
Table 8. Comparison of the characteristic widths and depths of scour holes under different flow regimes.
Frequency of the Pulsating SourceFlow
Mode
Scour Width DevelopmentScour Depth DevelopmentRidge Formation
(Time of Onset)
Time to Reach 14 cmTime to Reach 28 cmTime to Reach 1 cmTime to Reach 2 cm
69 HzM1<3 min4 min<1 min2 min5 min
M25 minNot reached3 min8 minNot observed
M35 minNot reached3 min11 minNot observed
M45 min14 min<3 min9 min6 min
Table 9. Comparison of the final widths of the scour holes under four flow regimes.
Frequency of the Pulsating Source (Hz)Comparison of Final Widths
39M3 = 153 mm < M2 = 167 mm < M4 = 194 mm < M1 = 314 mm
69M3 = 205 mm < M2 = 217 mm < M4 = 255 mm < M1 = 349 mm
100M3 = 264 mm < M4 = 279 mm < M2 = 342 mm < M1
Table 10. Comparison of the final depths of the scour hole under four flow regimes.
Frequency of the Pulsating Source (Hz)Comparison of Final Depths
39M3 = 20.1 mm < M2 = 21.2 mm < M4 = 22 mm < M1 = 24 mm
69M3 = 22.2 mm < M4 = 23 mm < M2 = 23.2 mm < M1 = 31.4 mm
100M3 = 25.6 mm < M2 = 26.2 mm < M4 = 27.2 mm < M1
Table 11. Evolutionary patterns of scour hole morphology under different flow regimes.
Flow RegimesDevelopment RateKey FeaturesDeposition PatternFinal Scour Morphology
Constant Current Flow (M1)Extremely rapid initial development, decelerating in the later stagesIntense early-stage erosion, transitioning to a deposition-dominated phasePronounced deposition; high and thick deposition ridge forms around the scour holeTeardrop-shaped
Sine Flow (M2)Rapid initial phase, followed by a surge in scour rate, then a sharp declineStrongest erosion and sediment transport capacity, dominated by secondary flows (i.e., the horseshoe vortex)Negligible deposition; scoured sediment is transported far downstreamElliptical
Pulse Flow
(M3)
Rapid initial development, transitioning to a moderate rate, and slowing in the final stageBalanced development, with characteristics intermediate between M1 and M2Insignificant depositionTapered elliptical
Irregular Flow (M4)Rapid initial phase, followed by a steady development rate, and a decelerating final phaseAsymmetrical development around the pile; strong spatial heterogeneityPronounced deposition mound primarily located upstream of the pileSemi-circular
Table 12. Summary of Final Scour-Hole Depth and Width under Different Flow Regimes.
Flow ModeFrequency of the Pulsating Source
(Hz)
Final Widths
(mm)
Final Depths
(mm)
Constant Current Flow (M1)3931424
6934931.4
100>360>35
Sine Flow (M2)3916721.2
6921723.2
10034226.2
Pulse Flow
(M3)
3915320.1
6920522.2
10026425.6
Irregular Flow (M4)3919422
6925523
10027927.2
Table 13. The periodic variations in the width of scour holes under different pulse source frequencies.
Flow
Mode
Frequency of the Pulsating Source
(Hz)
Final Width
(mm)
Initial PhaseIntermediate PhaseLater Phase
W max
(mm)
W min
(mm)
W max
(mm)
W min
(mm)
W max
(mm)
W min
(mm)
Constant Current Flow (M1)39314983517411
693491403217811
100>360250/////
Table 14. The periodic variations in the depth of scour holes under different pulse source frequencies.
Flow
Mode
Frequency of the Pulsating Source (Hz)Final
Depth
(mm)
Initial PhaseIntermediate PhaseLater Phase
D max
(mm)
D min
(mm)
D max
(mm)
D min
(mm)
D max
(mm)
D min
(mm)
Constant Current Flow (M1)392470.52111
6931.4142110.30.3
100>3520/////
Disclaimer/Publisher’s Note: The statements, opinions and data contained in all publications are solely those of the individual author(s) and contributor(s) and not of MDPI and/or the editor(s). MDPI and/or the editor(s) disclaim responsibility for any injury to people or property resulting from any ideas, methods, instructions or products referred to in the content.