1. Introduction
With the gradual depletion of onshore oil and gas resources and the continuous advancement of exploration and development technologies, global oil and gas exploitation has been progressively expanding into deep-sea and even ultra-deep-sea domains. The majority of oil and gas resources in the South China Sea are buried in deep-sea areas, which has consequently made it a core strategic area for China’s deep-sea energy development. In offshore oil and gas exploitation, subsea risers serve as critical and indispensable equipment. Among various types of risers, SCRs have emerged as the preferred configuration for deep-sea oil and gas resource development, attributed to their distinct advantages such as convenient installation, relatively low cost, and excellent resistance to high temperature and high pressure. Nevertheless, due to their high slenderness ratio and inherent flexibility, SCRs are highly susceptible to VIV, even under conditions of low flow velocity. When the vortex shedding frequency approaches the natural frequency of the riser, VIR may be triggered, which gives rise to fatigue damage in the riser and has become the dominant factor contributing to its fatigue failure. Therefore, in-depth and systematic research on the vortex-induced fatigue characteristics of deepwater SCRs is of paramount significance for ensuring their long-term operational safety and reliability in deep-sea oil and gas exploitation projects.
The mechanism of VIV in SCRs under ocean current loads is relatively well established [
1,
2,
3,
4], spurring extensive research into ocean current-induced vortex fatigue of deep-sea SCRs. Lim et al. [
5] developed a method to quantify VIV fatigue damage uncertainty in risers using a distributed wake oscillator model. Numerical results revealed that flow velocity non-uniformity and hydrodynamic force phase differences are the main drivers of spatial variability in fatigue damage. Thorsen et al. [
6] adopted a time-domain simulation approach to examine the impact of combined in-line and cross-flow VIV on riser fatigue damage, finding that coupling between axial and transverse VIV significantly affects fatigue damage accumulation. Shi et al. [
7] explored the fatigue accumulation process of risers in complex marine environments via monitoring data and statistical analysis techniques. Guo et al. [
8] established a nonlinear vibration model incorporating ocean environmental loads and the structural characteristics of deepwater test risers to explore the fatigue failure mechanism of risers. Wang et al. [
9] developed a numerical model accounting for the combined effects of in-line and cross-flow VIV, analyzing the coupled response and fatigue damage of VIV at the TDP of SCRs. In addition, other in-service offshore structures similar to SCRs, such as subsea power cables and mooring systems supporting various offshore engineering structures, have also been verified through experimental tests and numerical analyses to be at risk of vortex-induced fatigue damage [
10,
11,
12]. Existing studies confirm that subsea risers are highly prone to vortex-induced fatigue damage, which is a key driver of riser fatigue failure. However, factors including marine environmental conditions, flow velocity distribution, riser nonlinearity, and FSI between the flow field and risers exert significant impacts on vortex-induced fatigue. With increasing water depth, accurate analysis of riser vortex-induced fatigue remains a formidable challenge.
Semi-submersible platforms are the primary type of floating facility integrated with deepwater SCR systems. These platforms exhibit pronounced dynamic responses when subjected to combined wind, wave, and current loads. During platform heave motion, the riser undergoes relative oscillatory displacement with respect to the ambient flow field, creating an oscillatory flow environment. As a result, in addition to VIV driven by steady ocean currents, the riser is subjected to significant out-of-plane VIV excited by platform heave motion. This dual excitation mechanism exacerbates vortex-induced fatigue damage in the SCR. Chen et al. [
13] employed numerical simulations to examine how deepwater platform heave motion affects riser VIV responses, analyzing riser VIV characteristics under varying heave amplitudes, frequencies and inflow velocities. Wang et al. [
14] conducted an in-depth mechanistic investigation into VIV of SCRs subjected to platform heave excitation, elucidated the intrinsic mechanism governing heave-induced VIV and quantified the sensitivities of riser VIV responses to a suite of influencing factors, including platform heave kinematic parameters, ambient flow hydrodynamics, and riser structural properties. Fu et al. [
15] carried out experimental investigations on VIV of 4 m long flexible risers across a range of reduced velocities and Keulegan–Carpenter (KC) numbers. The results demonstrate that VIV driven by platform heave motion falls into the category of riser VIV under oscillatory flow conditions. Notably, the VIV characteristics of risers in oscillatory flow fields differ markedly from those in steady flow fields; phenomena including amplitude modulation and intermittent VIV are prevalent in oscillatory flows [
16,
17,
18]. Building on this foundation, a small body of research has been dedicated to unraveling the mechanisms underlying vortex-induced fatigue. Wang et al. [
19,
20] performed scaled model tests on SCRs, verifying that the vortex shedding frequency driven by platform heave motion displays distinct spatiotemporal variability. Fatigue damage assessment outcomes further reveal that the VIV-induced fatigue damage caused by platform heave motion is comparable in magnitude to that induced by uniform flow.
Deepwater SCRs, deployed across broad water depth ranges and commonly paired with semi-submersible platforms, suffer vortex-induced fatigue damage driven by the synergistic interaction of ocean currents and platform heave motion. This combined effect makes their vortex-induced fatigue behavior far more complex than that of conventional risers, leading to more diverse damage mechanisms and heightened risks to structural safety. To this end, this study takes a deepwater SCR deployed in the South China Sea as the research object. First, a quasi-three-dimensional numerical model is established to simulate the two-way FSI between the fluid domain and the riser structure. On this basis, the VIV response of the SCR under the combined excitation of ambient ocean currents and platform heave motion is systematically investigated. Subsequently, the synergistic effects of these two VIV excitation sources are incorporated to analyze the spatial distribution of stress responses along the entire length of the riser. Finally, a targeted analysis of the vortex-induced fatigue damage sustained by the SCR is carried out.
3. SCR VIV Response Analysis Based on the Multi-Strip Method Concept
3.1. Principle of the Multi-Strip Method
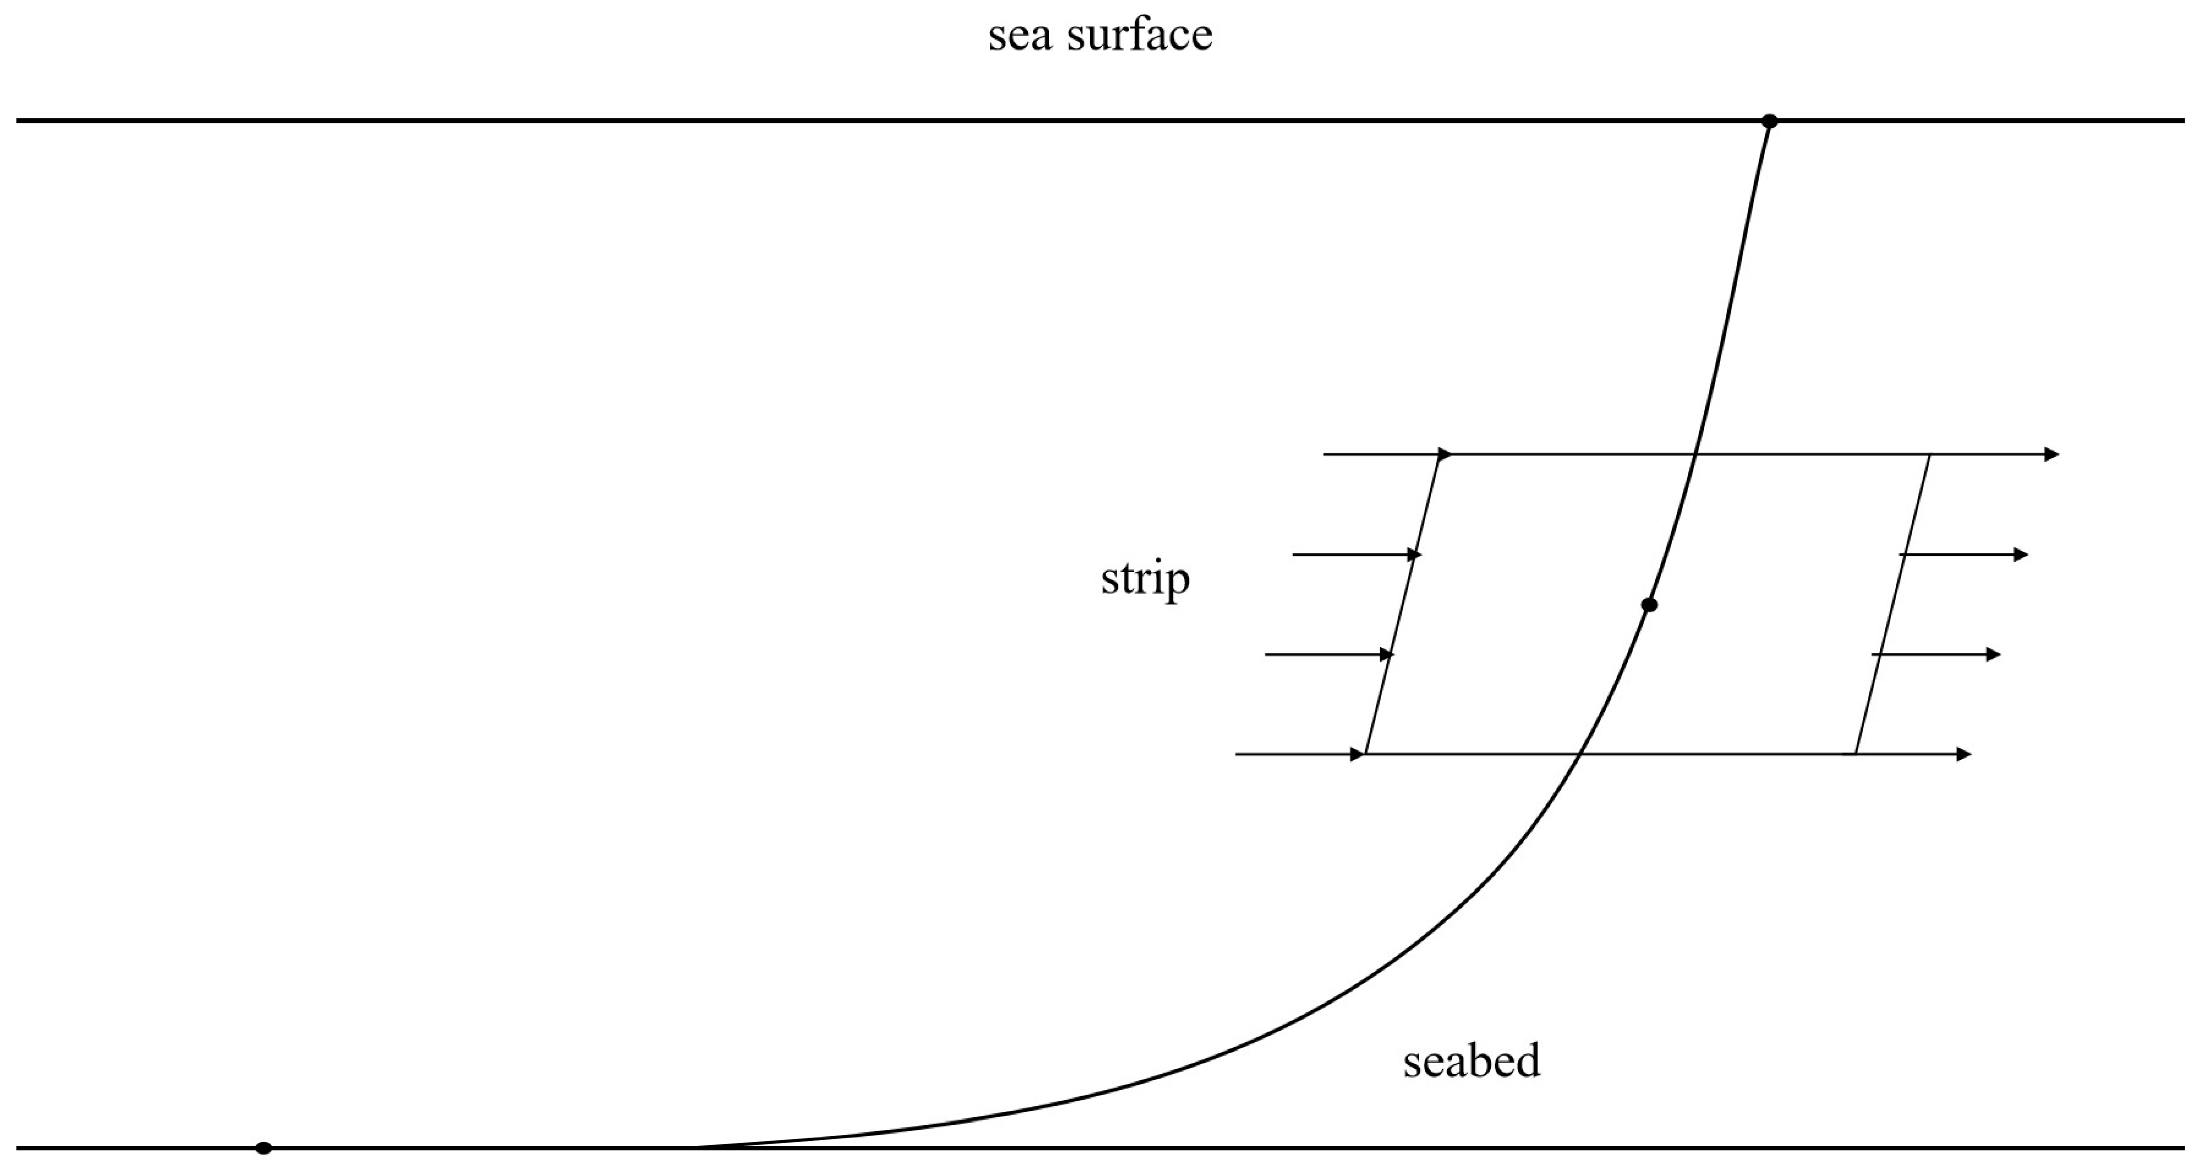
Owing to the large slenderness ratio of deepwater SCRs, the flow field and vortex shedding patterns along the riser length vary remarkably, displaying distinct three-dimensional characteristics. Nevertheless, the excessively large axial dimension poses considerable challenges to the establishment of a full three-dimensional numerical model via CFD methods for analyzing its VIV response [
23,
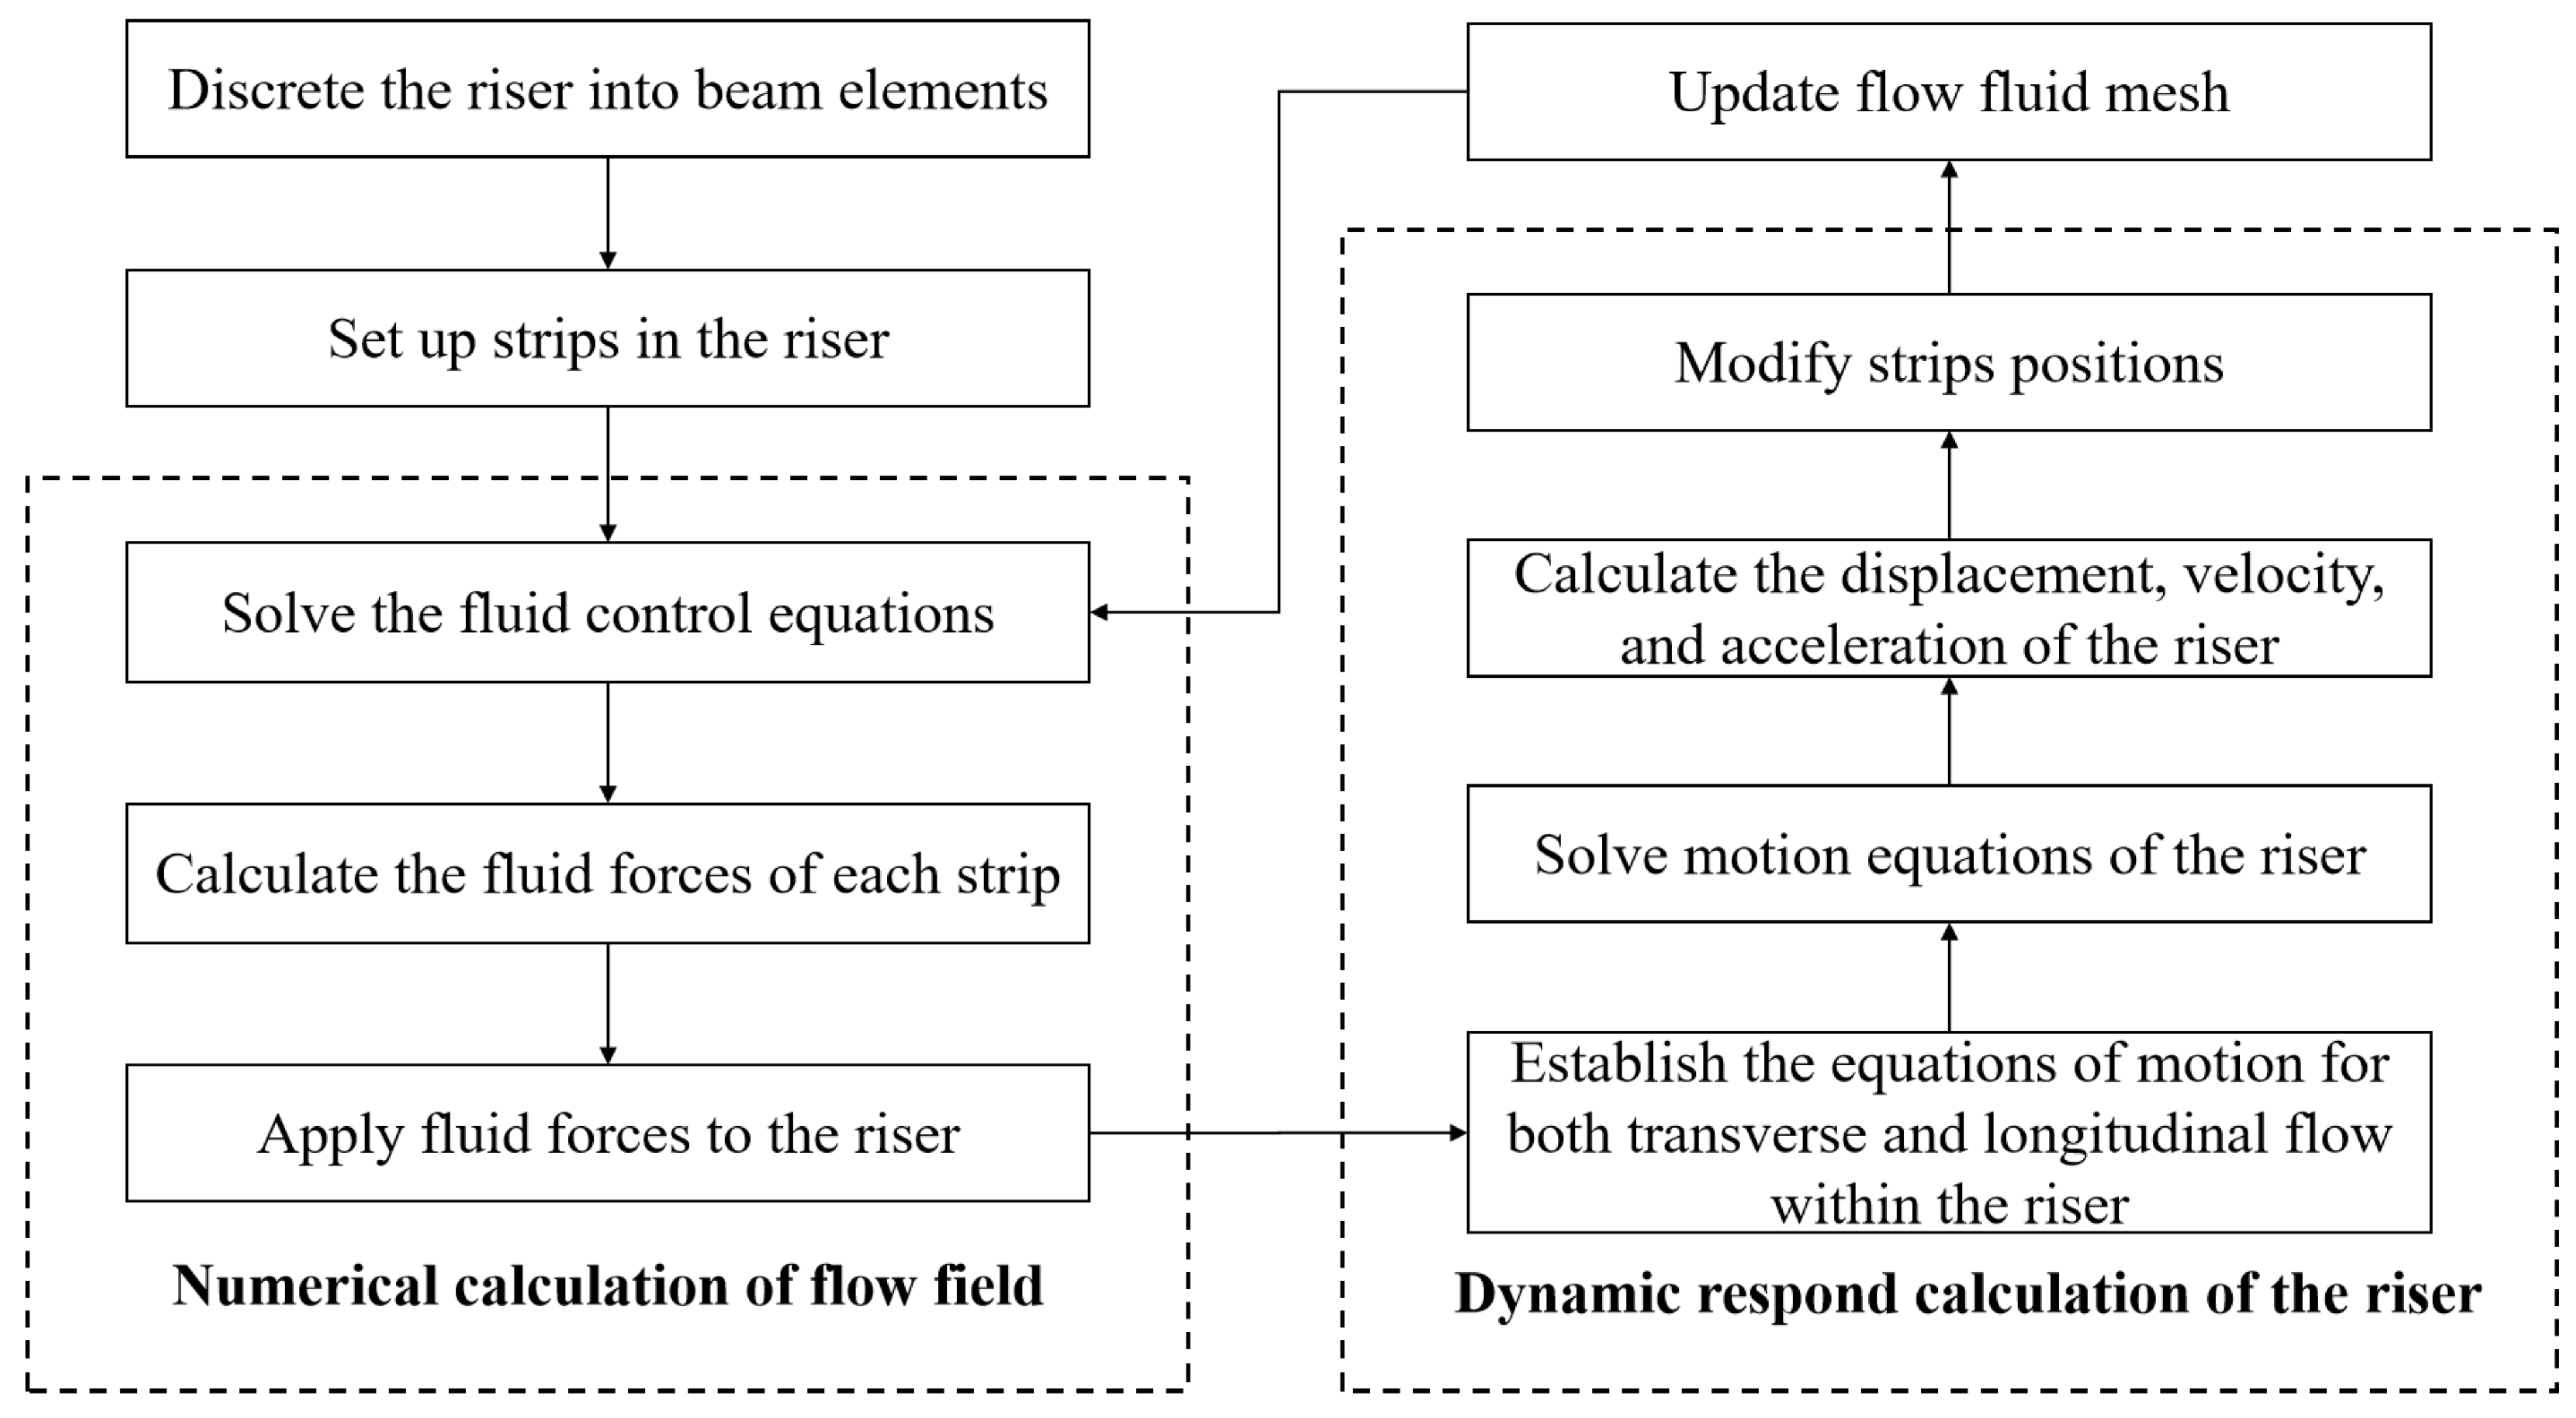
24]. Accordingly, a numerical analysis method grounded in the Multi-Strip theory was developed. The riser is partitioned into multiple segments along the water depth, with hydrodynamic loads derived by solving the Navier–Stokes equations for each segment. Three-dimensional motion equations governing the riser are formulated via finite element discretization to facilitate the solution of its dynamic response. By leveraging the overset mesh technique, real-time data exchange between the fluid domain and the riser’s structural response is achieved, enabling bidirectional FSI simulation of VIV. The numerical simulation method based on the Multi-Strip approach adopts two-dimensional slices in lieu of a full three-dimensional flow field, thereby constructing a quasi-three-dimensional numerical model for riser VIV. This method strikes an effective balance between computational efficiency and analytical accuracy, enabling reliable prediction of the key vortex characteristics exhibited by the riser [
25,
26]. The implementation procedure is illustrated in
Figure 1.
3.2. Steps for SCR VIV Response Analysis
First, the riser was discretized into 101 equally spaced beam elements. Customized nonlinear spring elements were employed to simulate pipe–soil interaction effects. Fifty strips were designated, and the flow field distribution of each strip was solved independently by means of the Navier–Stokes equations to derive the hydrodynamic forces acting on the riser surface. The continuity equation and momentum equation are expressed as follows:
where
and
denote the fluid velocities in the
i and
j directions, respectively;
and
are the coordinates in the
i and
j directions, respectively;
represents the fluid density;
t is the time;
p denotes the pressure;
represents the fluid kinematic viscosity coefficient. The mean strain rate tensor
and the Reynolds stress tensor
are expressed as follows:
where
denotes the turbulent viscosity, and
k represents the turbulent kinetic energy.
is the Kronecker delta, here
= 1 if
i =
j and
= 0 if
i ≠
j.
Given the SST k-ω turbulence model’s exceptional ability to accurately simulate near-wall flows while also demonstrating strong adaptability to free shear flow regions, this study adopts the SST k-ω turbulence model for numerical simulations of the flow field.
Subsequently, the element stiffness matrix and element mass matrix in the riser’s local coordinate system were computed. Based on the included angle between the local coordinate system of the SCR’s catenary segment and the global coordinate system, a coordinate transformation was conducted to assemble the riser’s global stiffness matrix. For the element mass matrix, a lumped mass matrix formulation was adopted, which was directly assembled into the global mass matrix using the superposition method. Given the low magnitude and dense distribution of the riser’s natural frequencies, the first-order and eleventh-order natural frequencies were selected to construct the Rayleigh damping matrix during model formulation. The derived equations of motion governing the riser’s dynamic response in the in-line and cross-flow directions are presented as follows:
where
,
and
are the mass, damping and stiffness matrices of the riser, respectively;
,
and
denote the displacement, velocity and acceleration vectors of the riser in the in-line direction, respectively;
,
and
represent the displacement, velocity and acceleration vectors of the riser in the cross-flow direction, respectively;
and
are the hydrodynamic force vectors acting on the riser in the in-line and cross-flow directions, respectively.
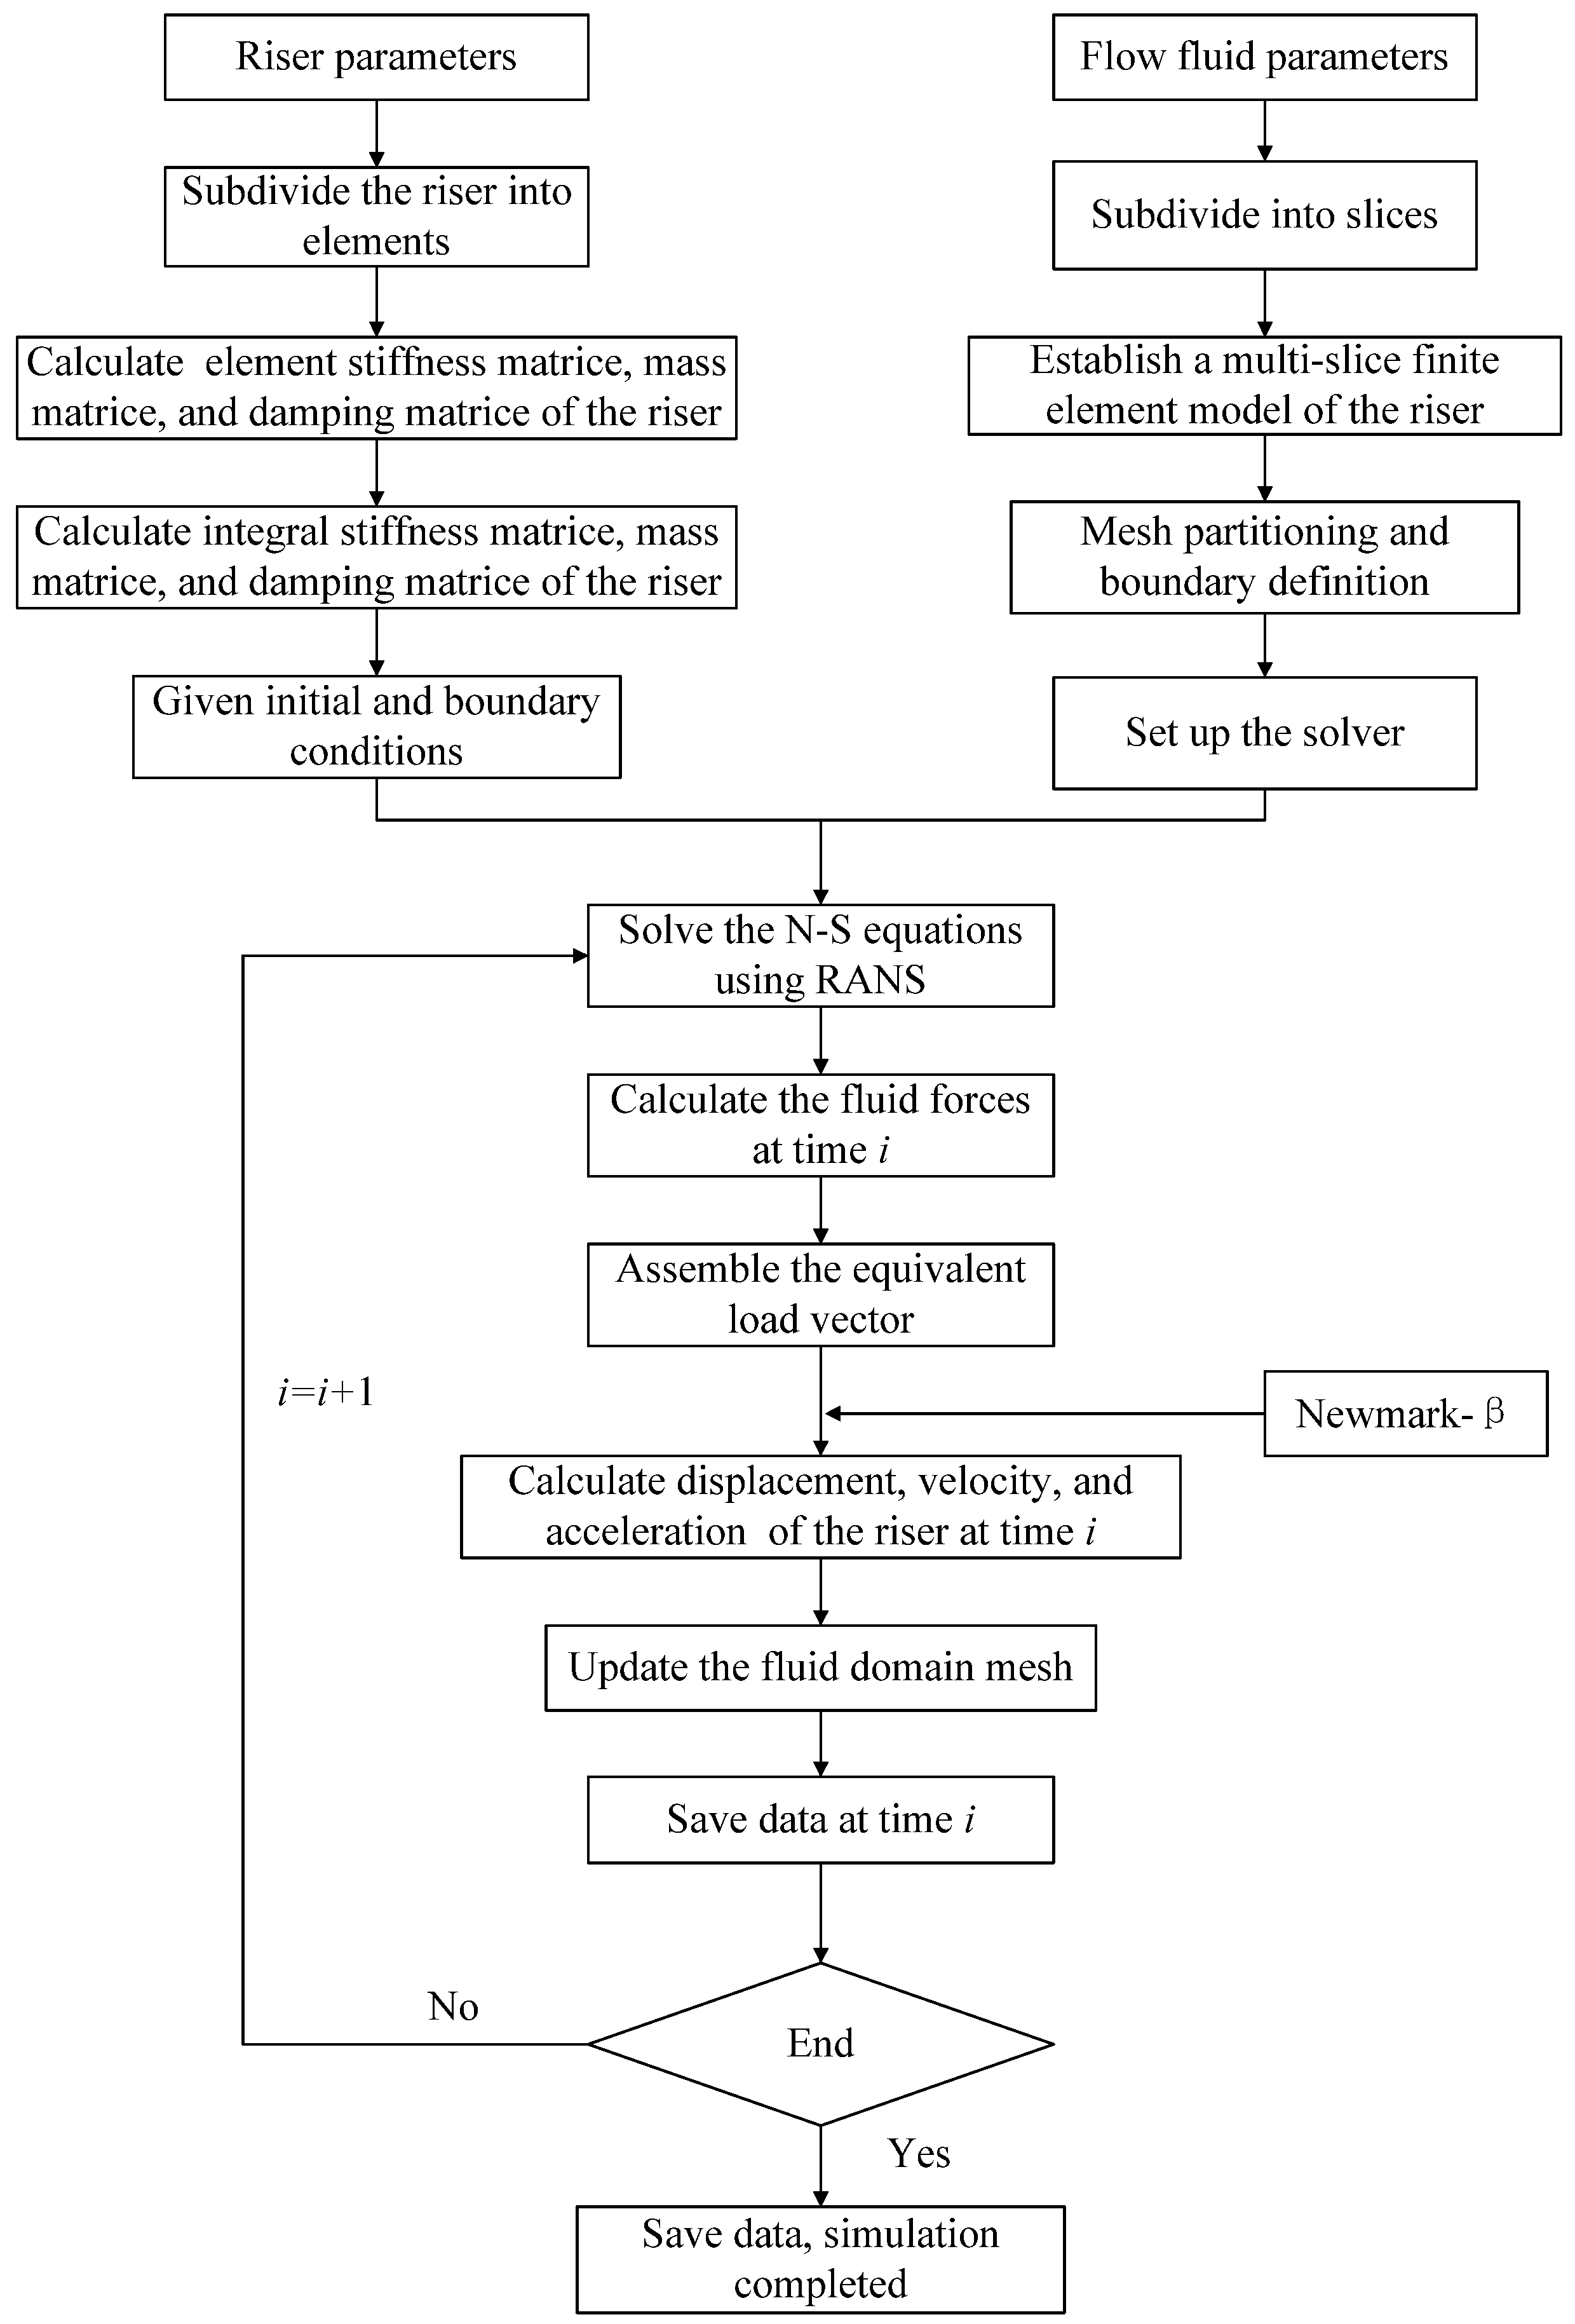
Finally, this study developed a customized User-Defined Function (UDF) to enable bidirectional FSI analysis of VIV in marine risers, with the detailed simulation analysis scheme illustrated in
Figure 2.
The riser was first discretized into finite elements. Leveraging the riser’s material properties, geometric parameters, and element-level stiffness, mass, and damping matrices, the global stiffness, mass, and damping matrices of the riser were assembled using systematic matrix aggregation techniques. Concurrently, a nonlinear spring element was incorporated to model pipe–soil interaction, accurately simulating the contact constraints between the riser and seabed. Through these steps, a finite element model of the riser was established.
The riser was segmented into discrete slices to facilitate flow field analysis. A computational domain was constructed based on actual flow field environmental parameters, and overset mesh technology was employed to generate the flow field mesh. Appropriate boundary conditions were defined for inlets, outlets, and walls, and a solver optimized for turbulent flow simulations was selected and configured to ensure accurate hydrodynamic calculations.
The bidirectional FSI analysis adopted an iterative coupling strategy executed in the following sequential steps for each time increment: first, the RANS equations were solved to obtain the hydrodynamic loads acting on the riser, which were then transformed into equivalent nodal forces applied to the riser’s finite element nodes. Next, the Newmark-β implicit time integration method was utilized to solve the riser’s structural motion governing equations, and time-history integration was performed to derive the displacement, velocity, and acceleration responses at each sliced node of the riser. Subsequently, the computed structural motion parameters were fed back to the Fluent solver, enabling the update of the riser’s transient motion boundary conditions in the fluid domain. Finally, overset mesh technology was applied to reconstruct the flow field mesh to accommodate the deformed configuration of the riser, and this iterative coupling process was repeated until all predefined time steps were completed, ultimately yielding the full-time-domain VIV response characteristics of the riser.
3.3. Mesh Generation for the Fluid Domain
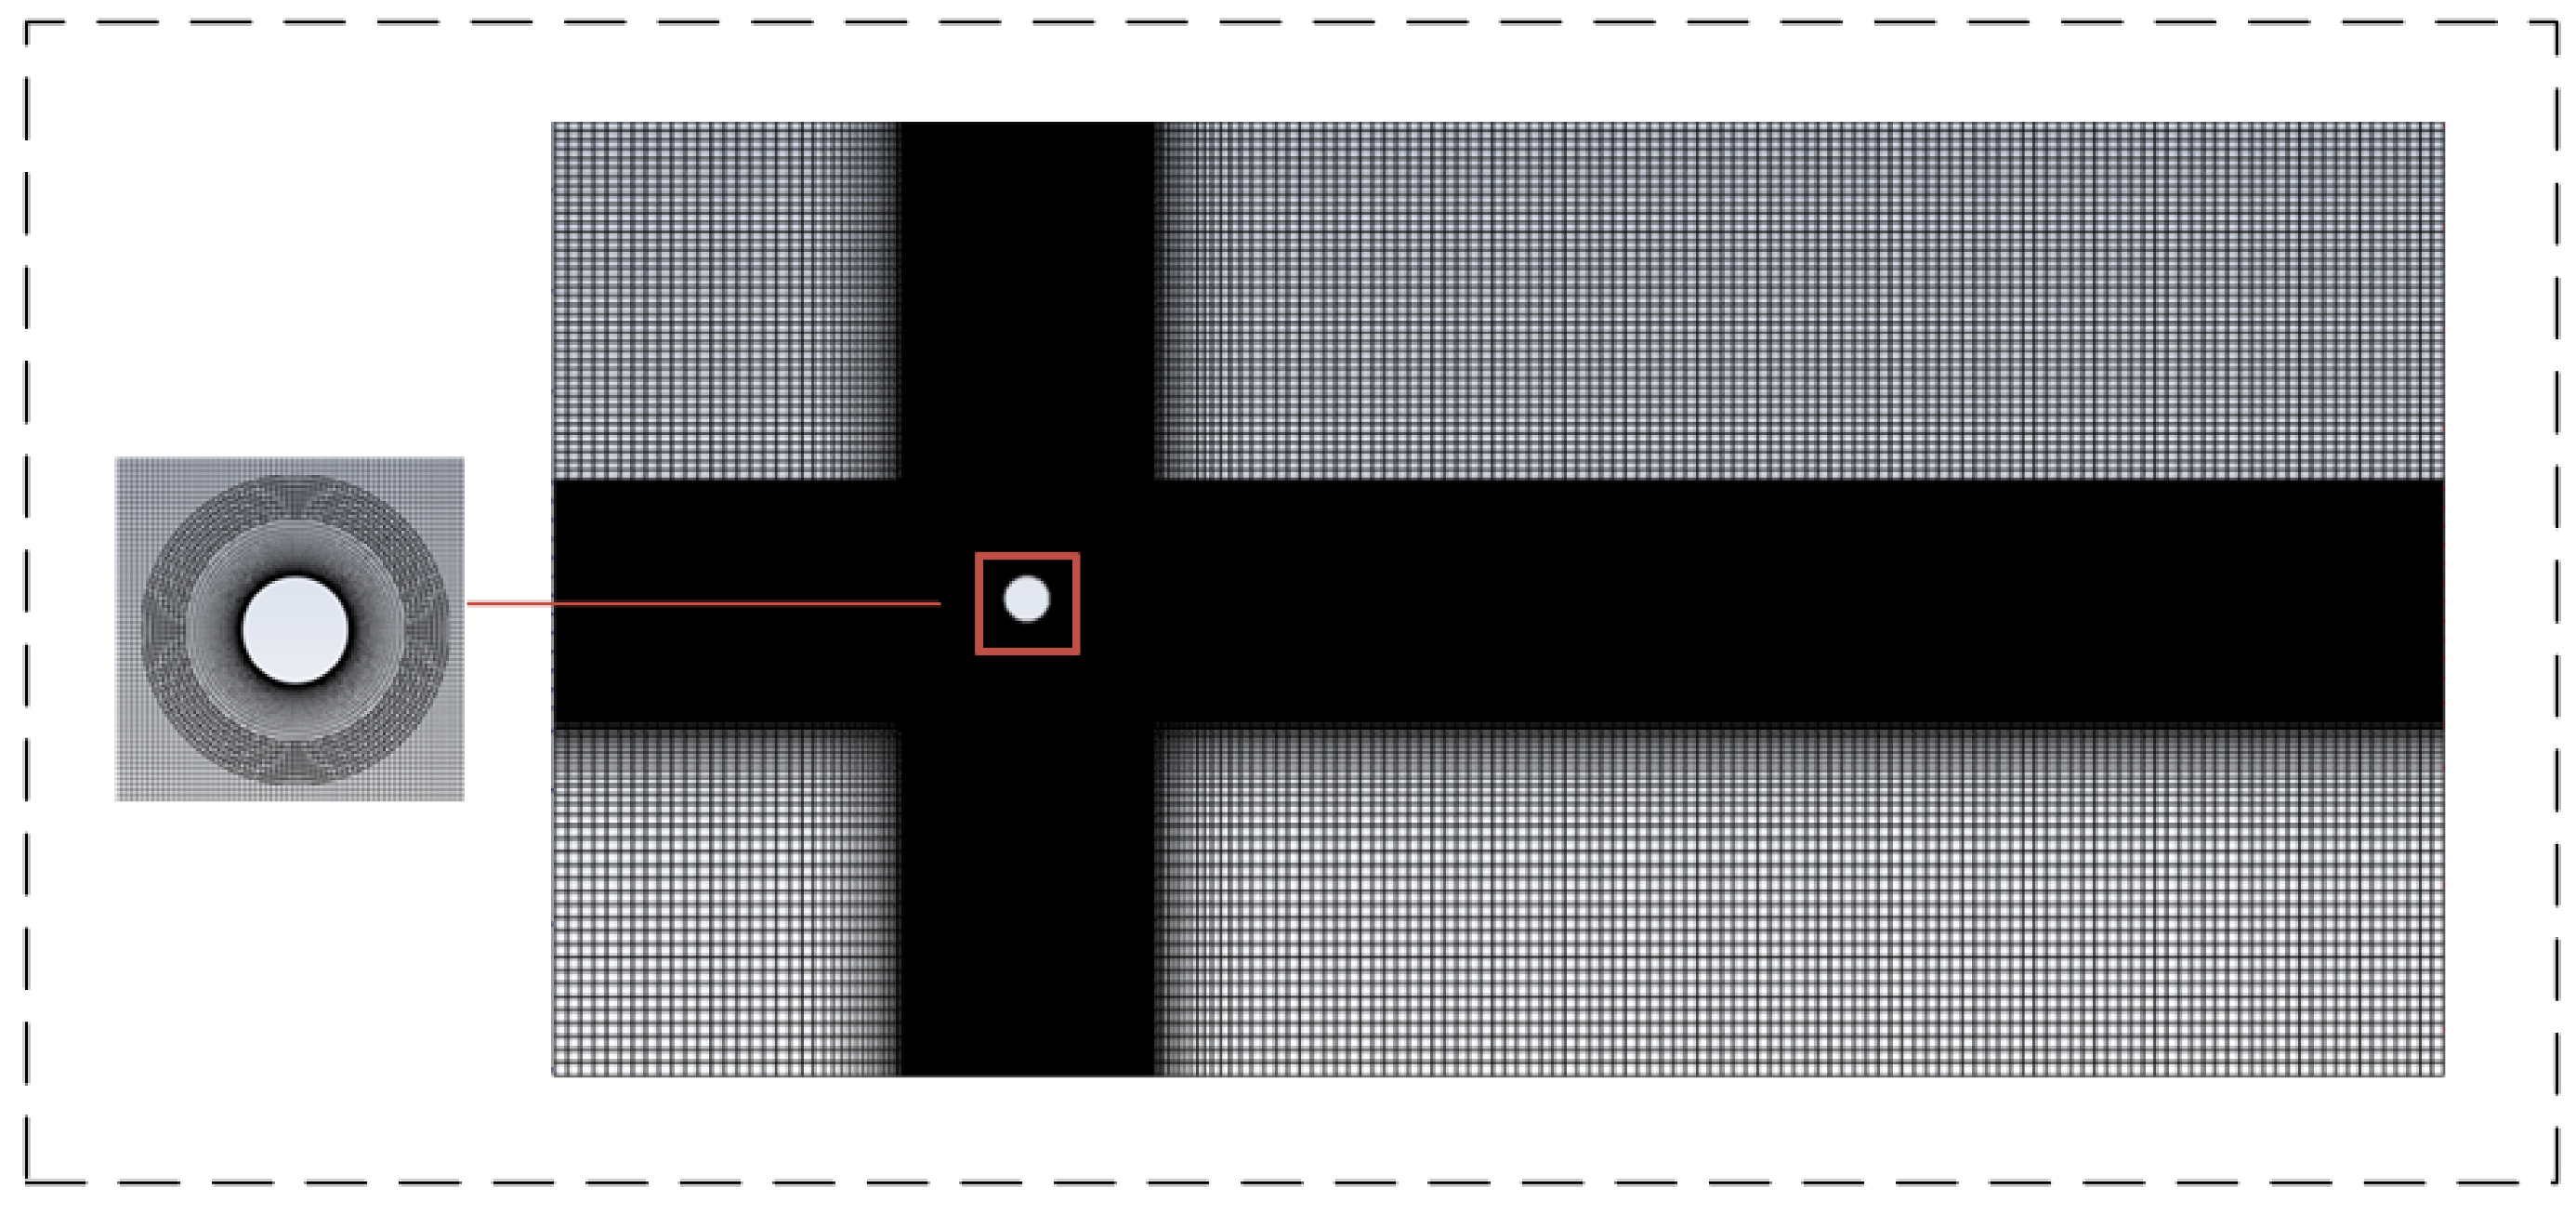
Mesh generation is a pivotal step underpinning the reliability of numerical simulations. Therefore, mesh independence verification was conducted on the strip located at the middle section of the riser. A schematic illustration of a single middle section is presented in
Figure 3, with the verification performed at a flow velocity of 0.5 m/s. For the SST turbulence model k-ω, the dimensionless wall distance y+ of the first mesh layer is strictly constrained to be ≤1. Guided by the velocity gradient distribution characteristics within the near-wall boundary layer, mesh refinement was implemented in the near-wall region, with the mesh gradually coarsening as the distance from the wall increases. This strategy ensures a highly uniform mesh gradient throughout the computational domain. The calculation formula for the height of the first mesh layer is given below:
where
D is the characteristic length of the cylinder, which is taken as the riser diameter of 365 mm in this paper;
denotes the height of the first mesh layer with the unit of millimeters;
Re represents the Reynolds number.
The component mesh of the riser and the background mesh of the flow field were generated using the overset mesh technique, as illustrated in
Figure 4. The calculated height of the first near-wall mesh layer is 0.028 m. To validate mesh independence, four sets of meshes with varying densities were constructed, and their detailed specifications are presented in
Table 4.
A comparison of transverse and longitudinal displacement amplitudes shows that both amplitudes increased significantly when the total number of grid cells was raised from 84,892 to 106,680. In contrast, further refinement from the fine mesh to the ultra-fine mesh resulted in negligible changes to the displacement amplitudes. These findings demonstrate that the fine mesh strikes an optimal balance between computational accuracy and resource efficiency, fully satisfying the requirements of the simulation. Accordingly, the fine mesh configuration will be adopted as the reference standard for mesh generation in all subsequent slice models.
4. Analysis of SCR VIV Response Caused by Background Currents
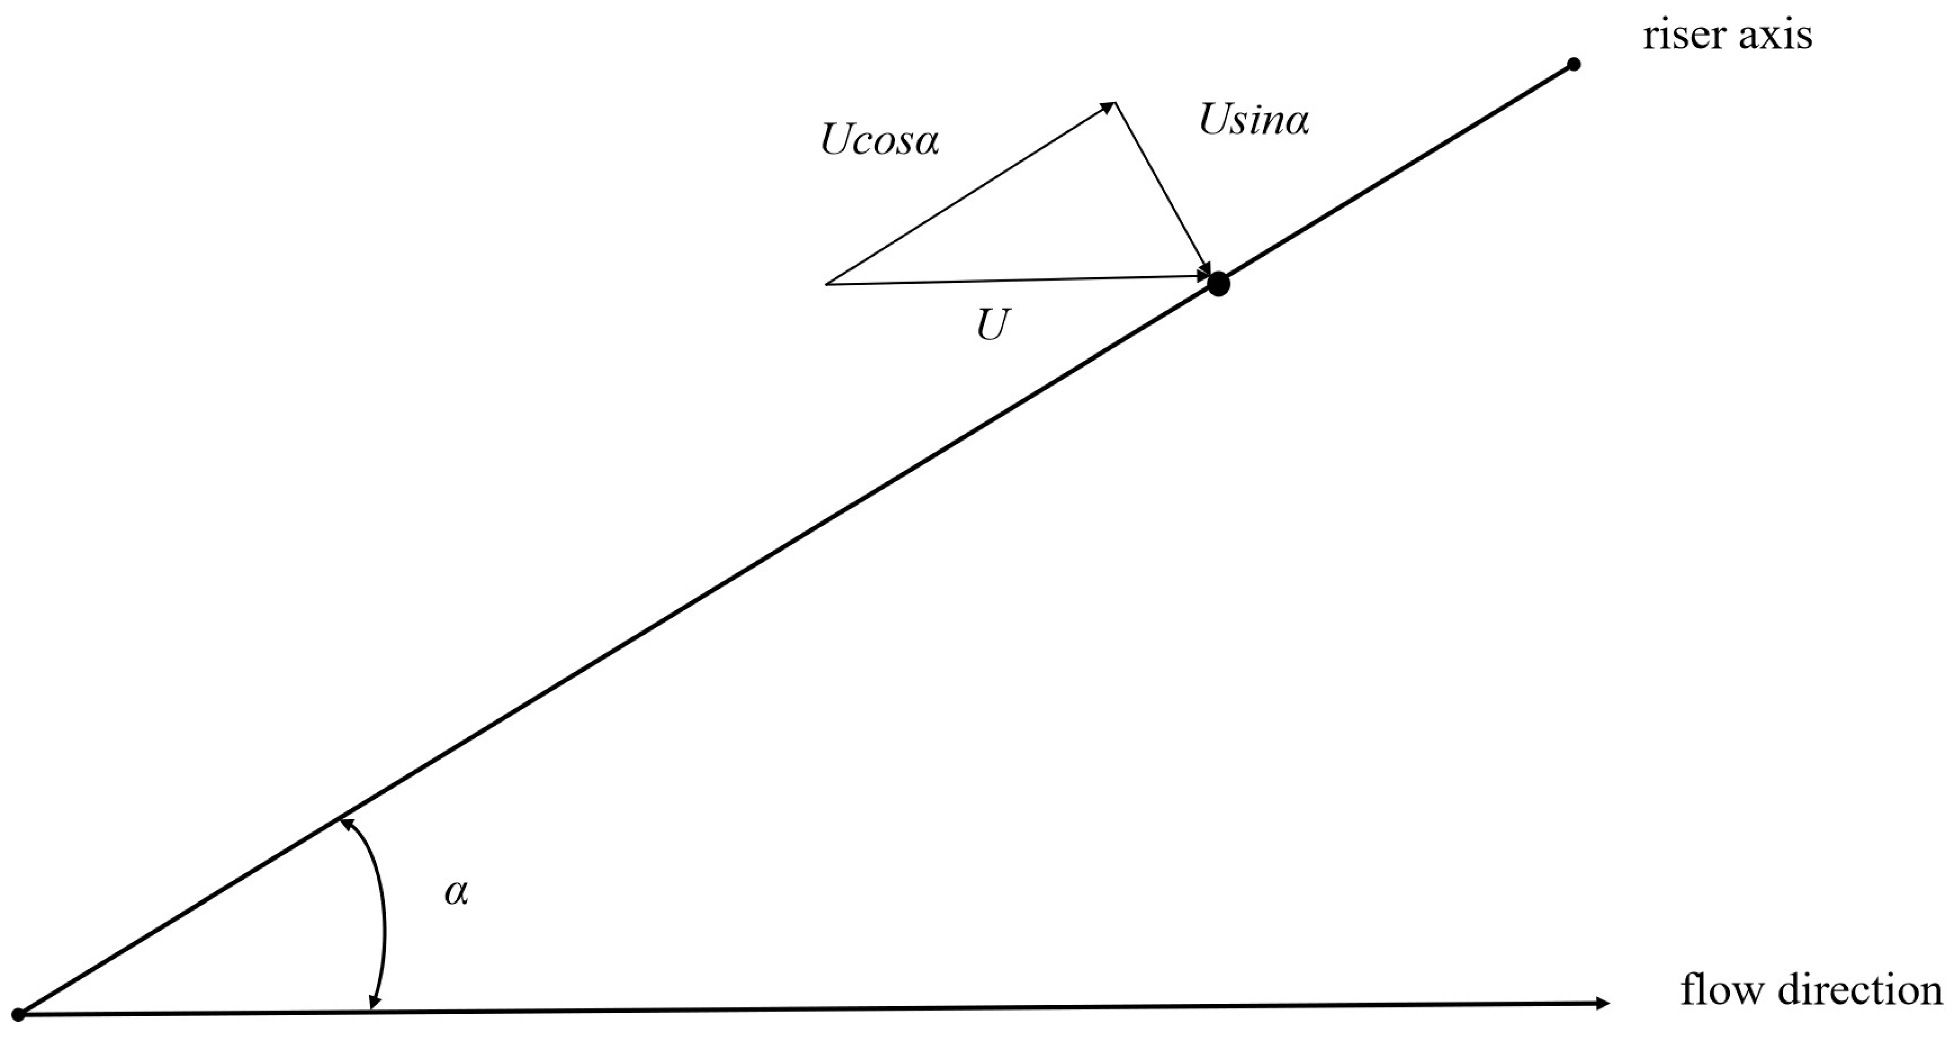
When the riser axis forms an inclination angle α with the incoming flow direction, the oncoming flow velocity
U can be decomposed into two components:
U·
sinα perpendicular to the riser axis, and
U·
cosα parallel to the riser axis. The schematic diagram of this velocity decomposition is presented in
Figure 5. According to the widely recognized Principle of Independence, the vortex-induced lift characteristics and vortex shedding frequency of an inclined riser are equivalent to those of a vertical riser subjected to a flow velocity equal to the perpendicular component
U·
sinα [
27,
28]. By applying this principle, the perpendicular flow velocity component at any given height along the riser can be determined, providing a basis for analyzing the VIV response of the inclined riser.
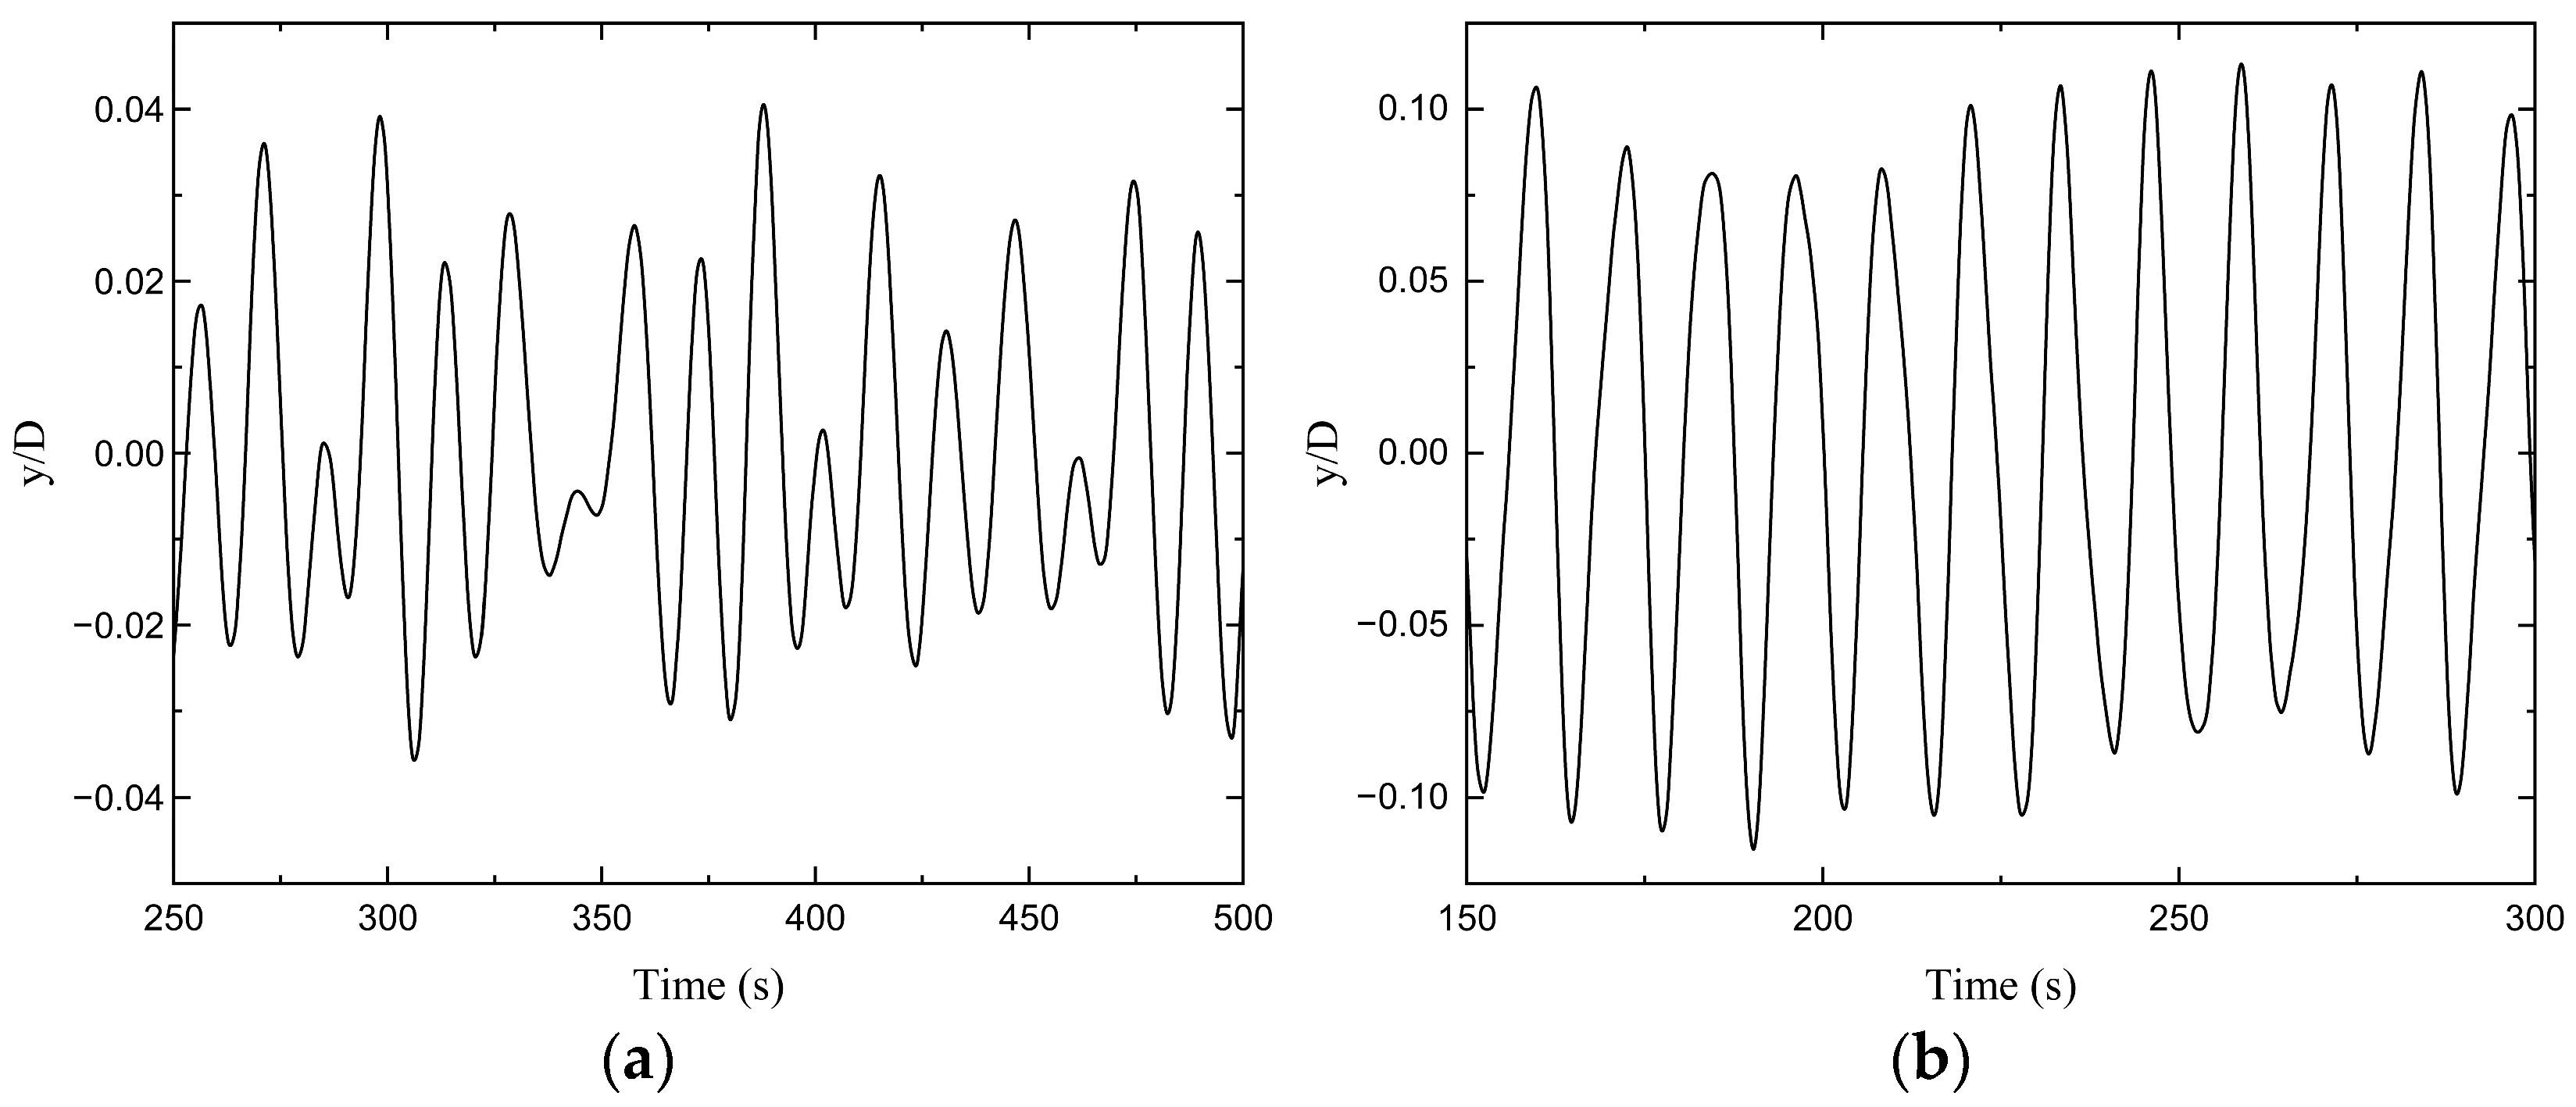
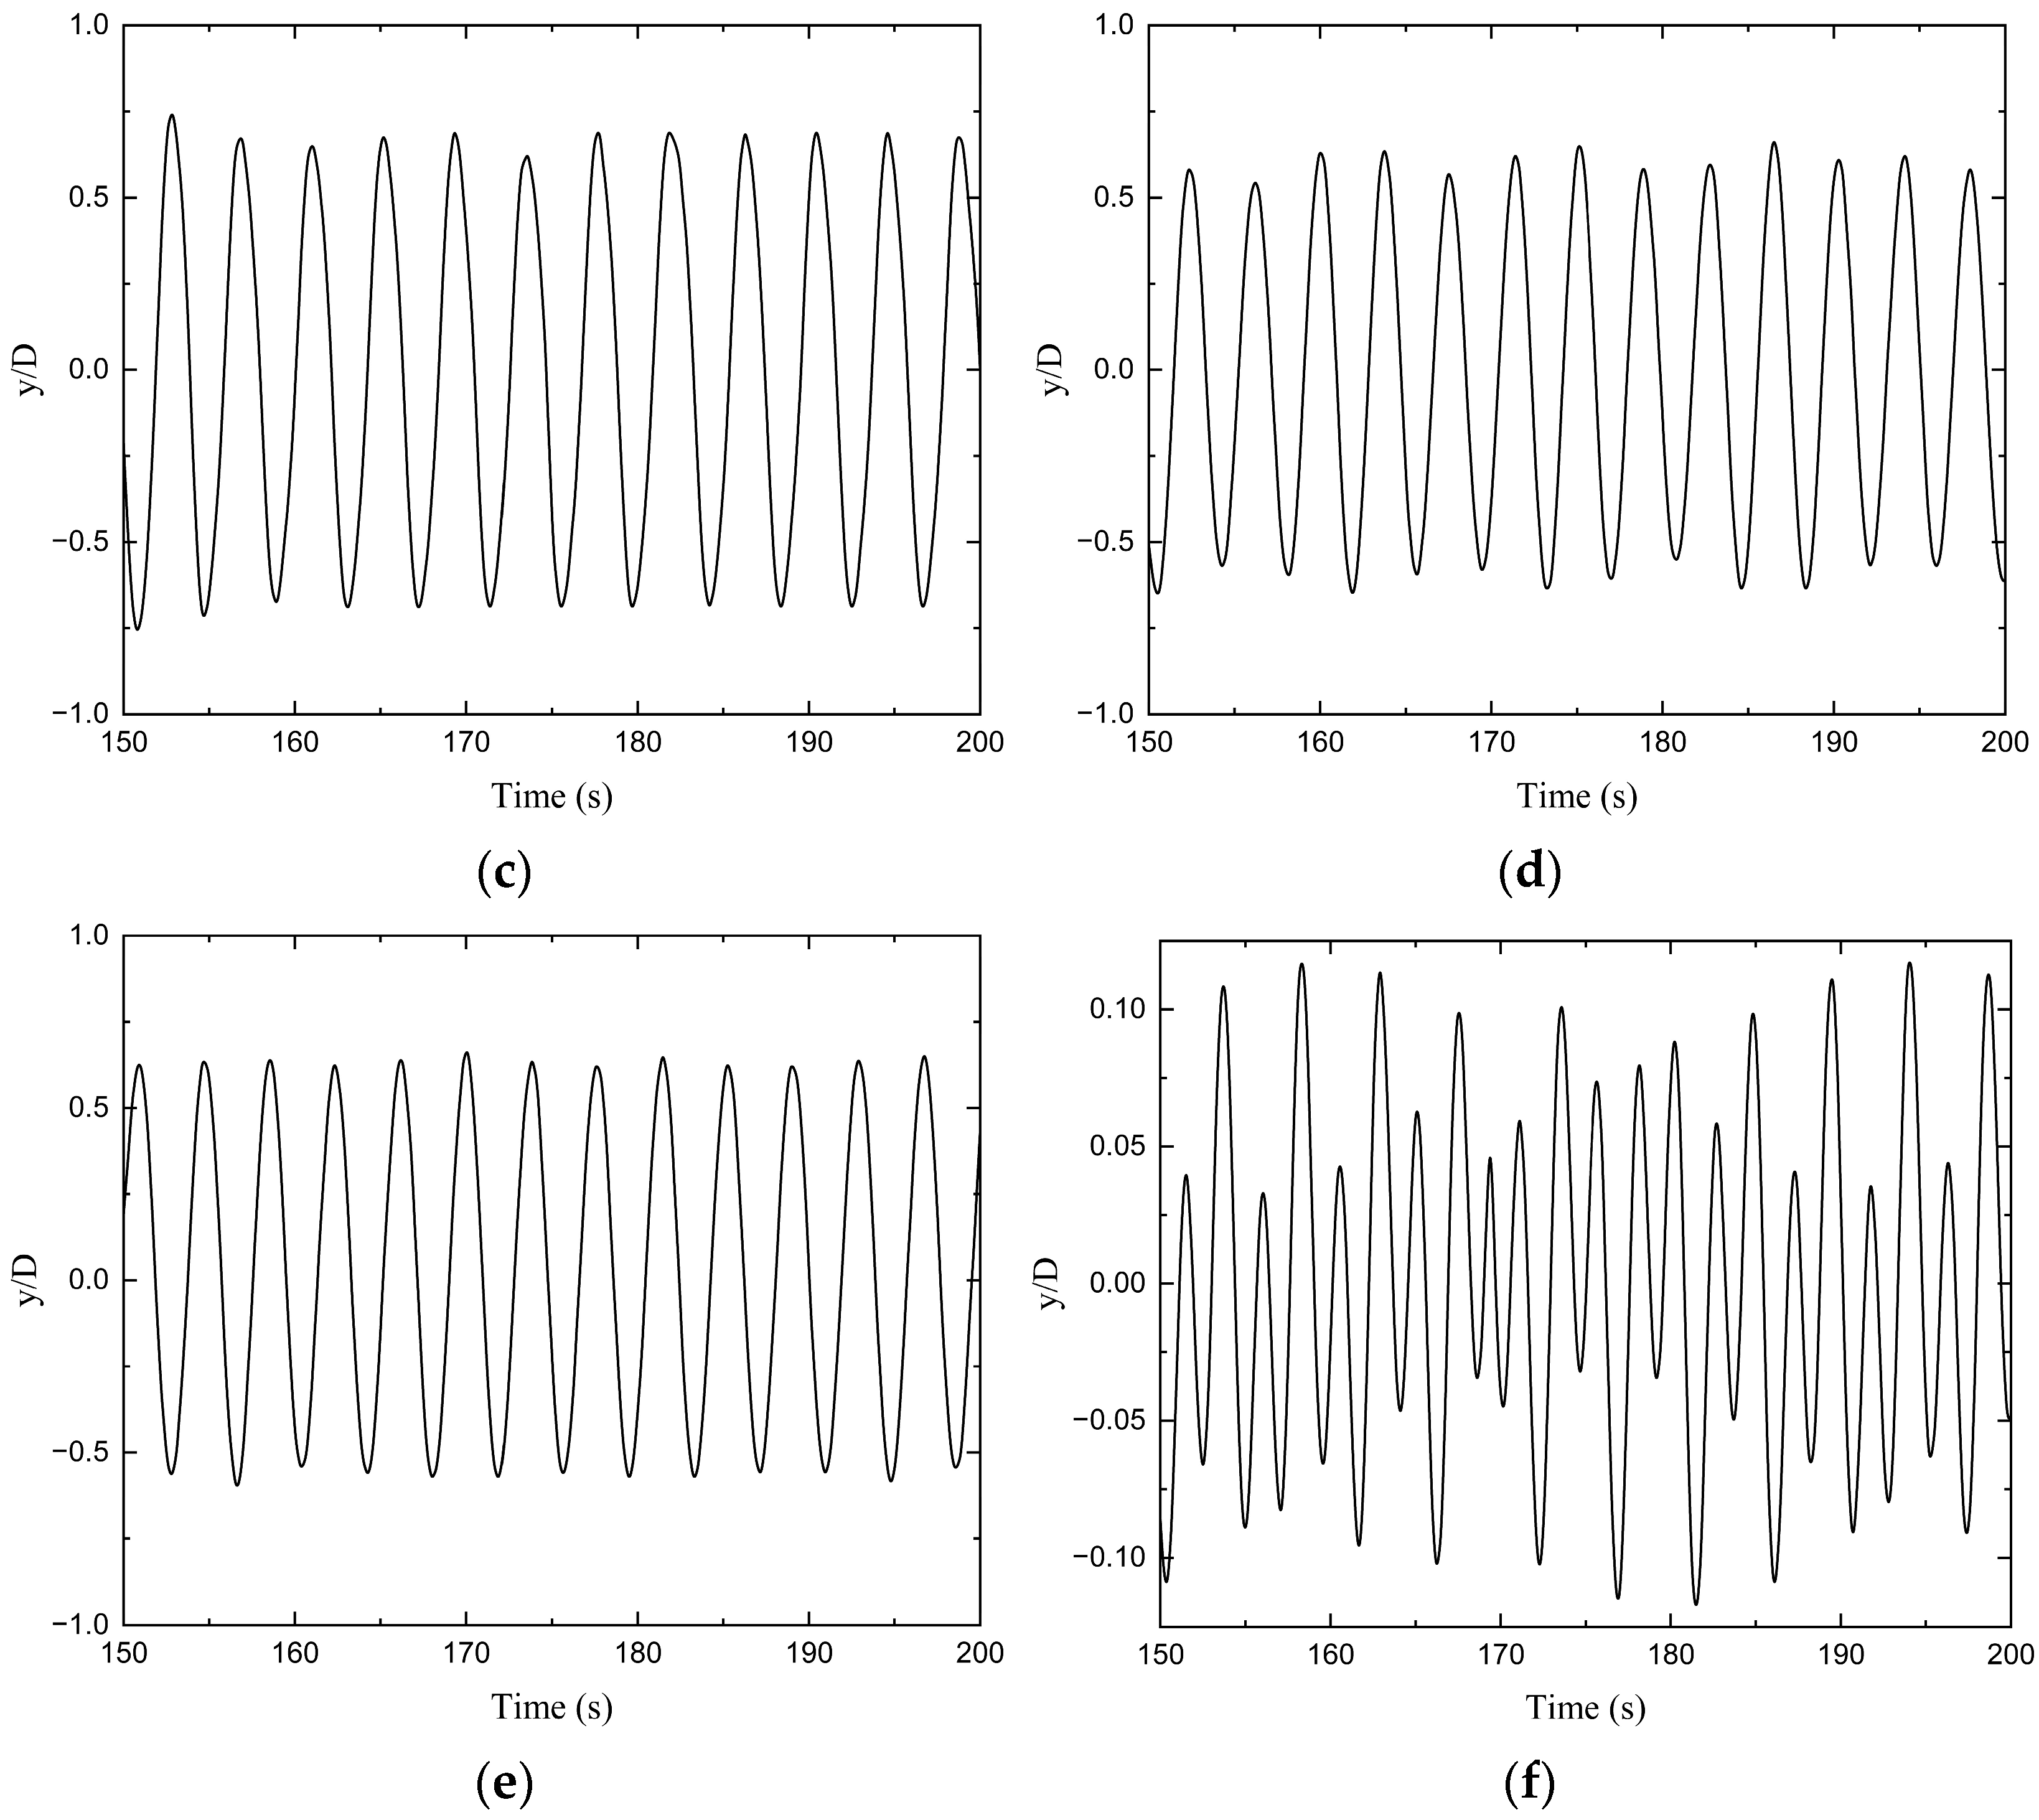
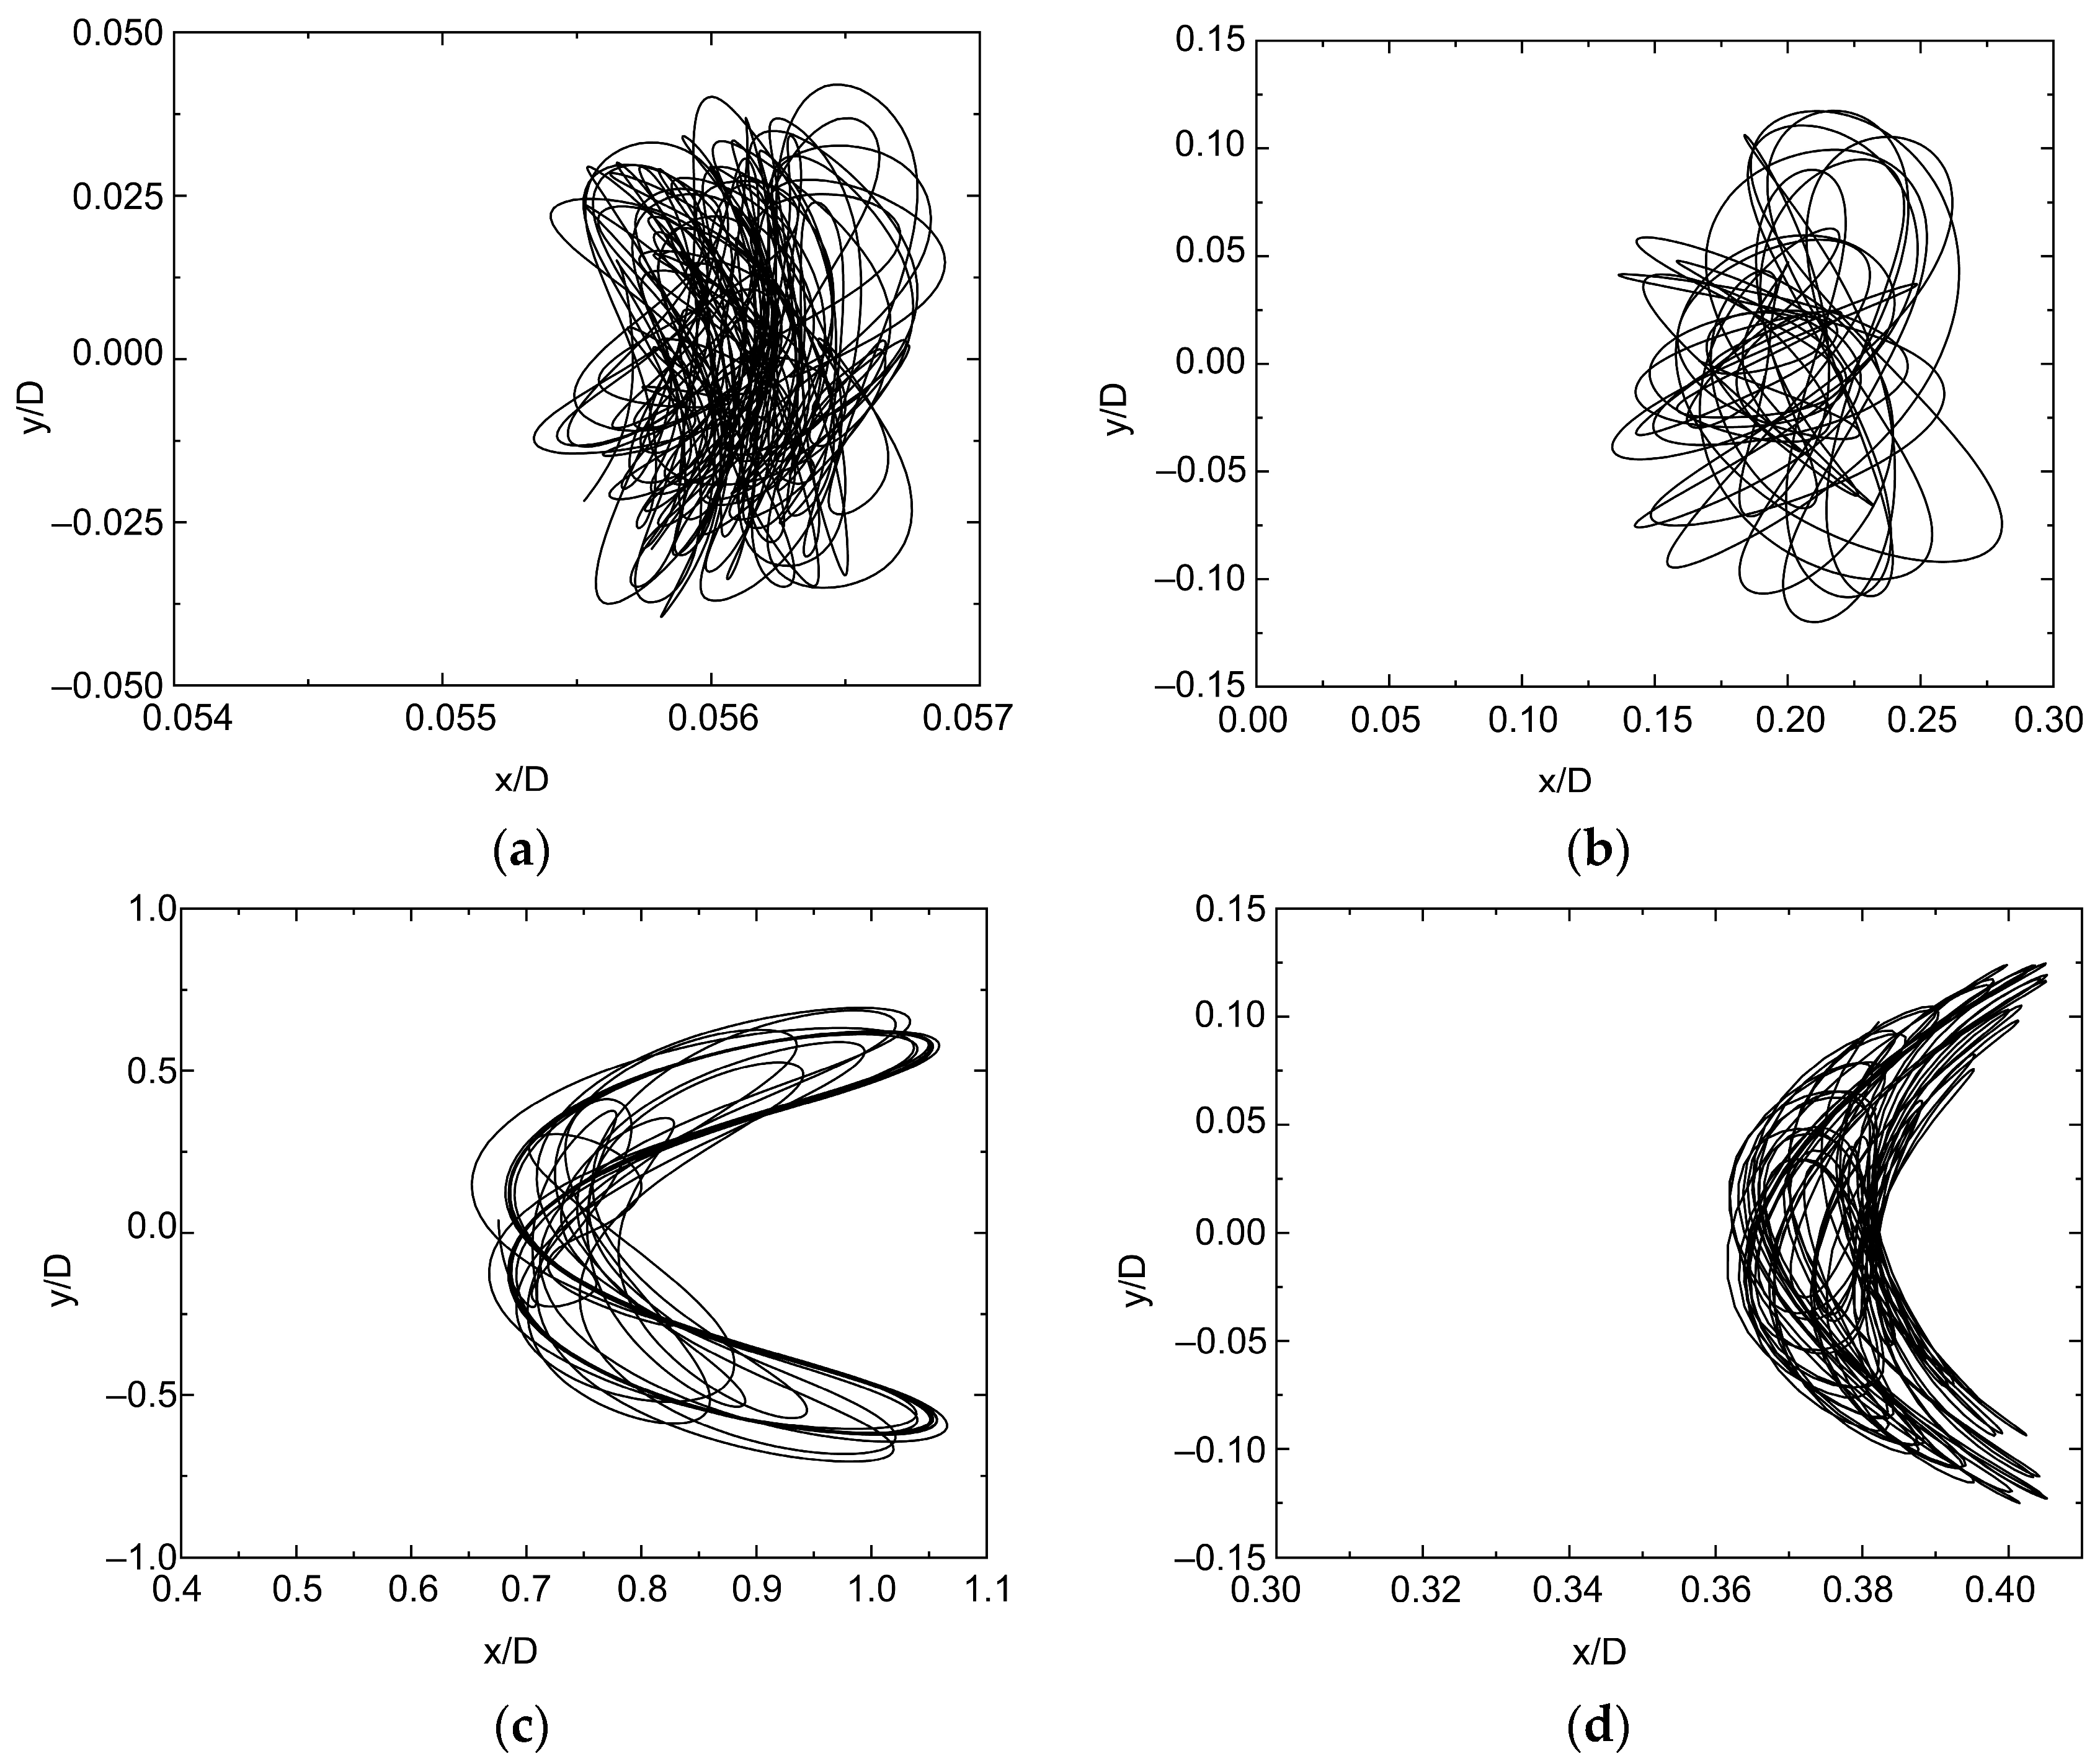
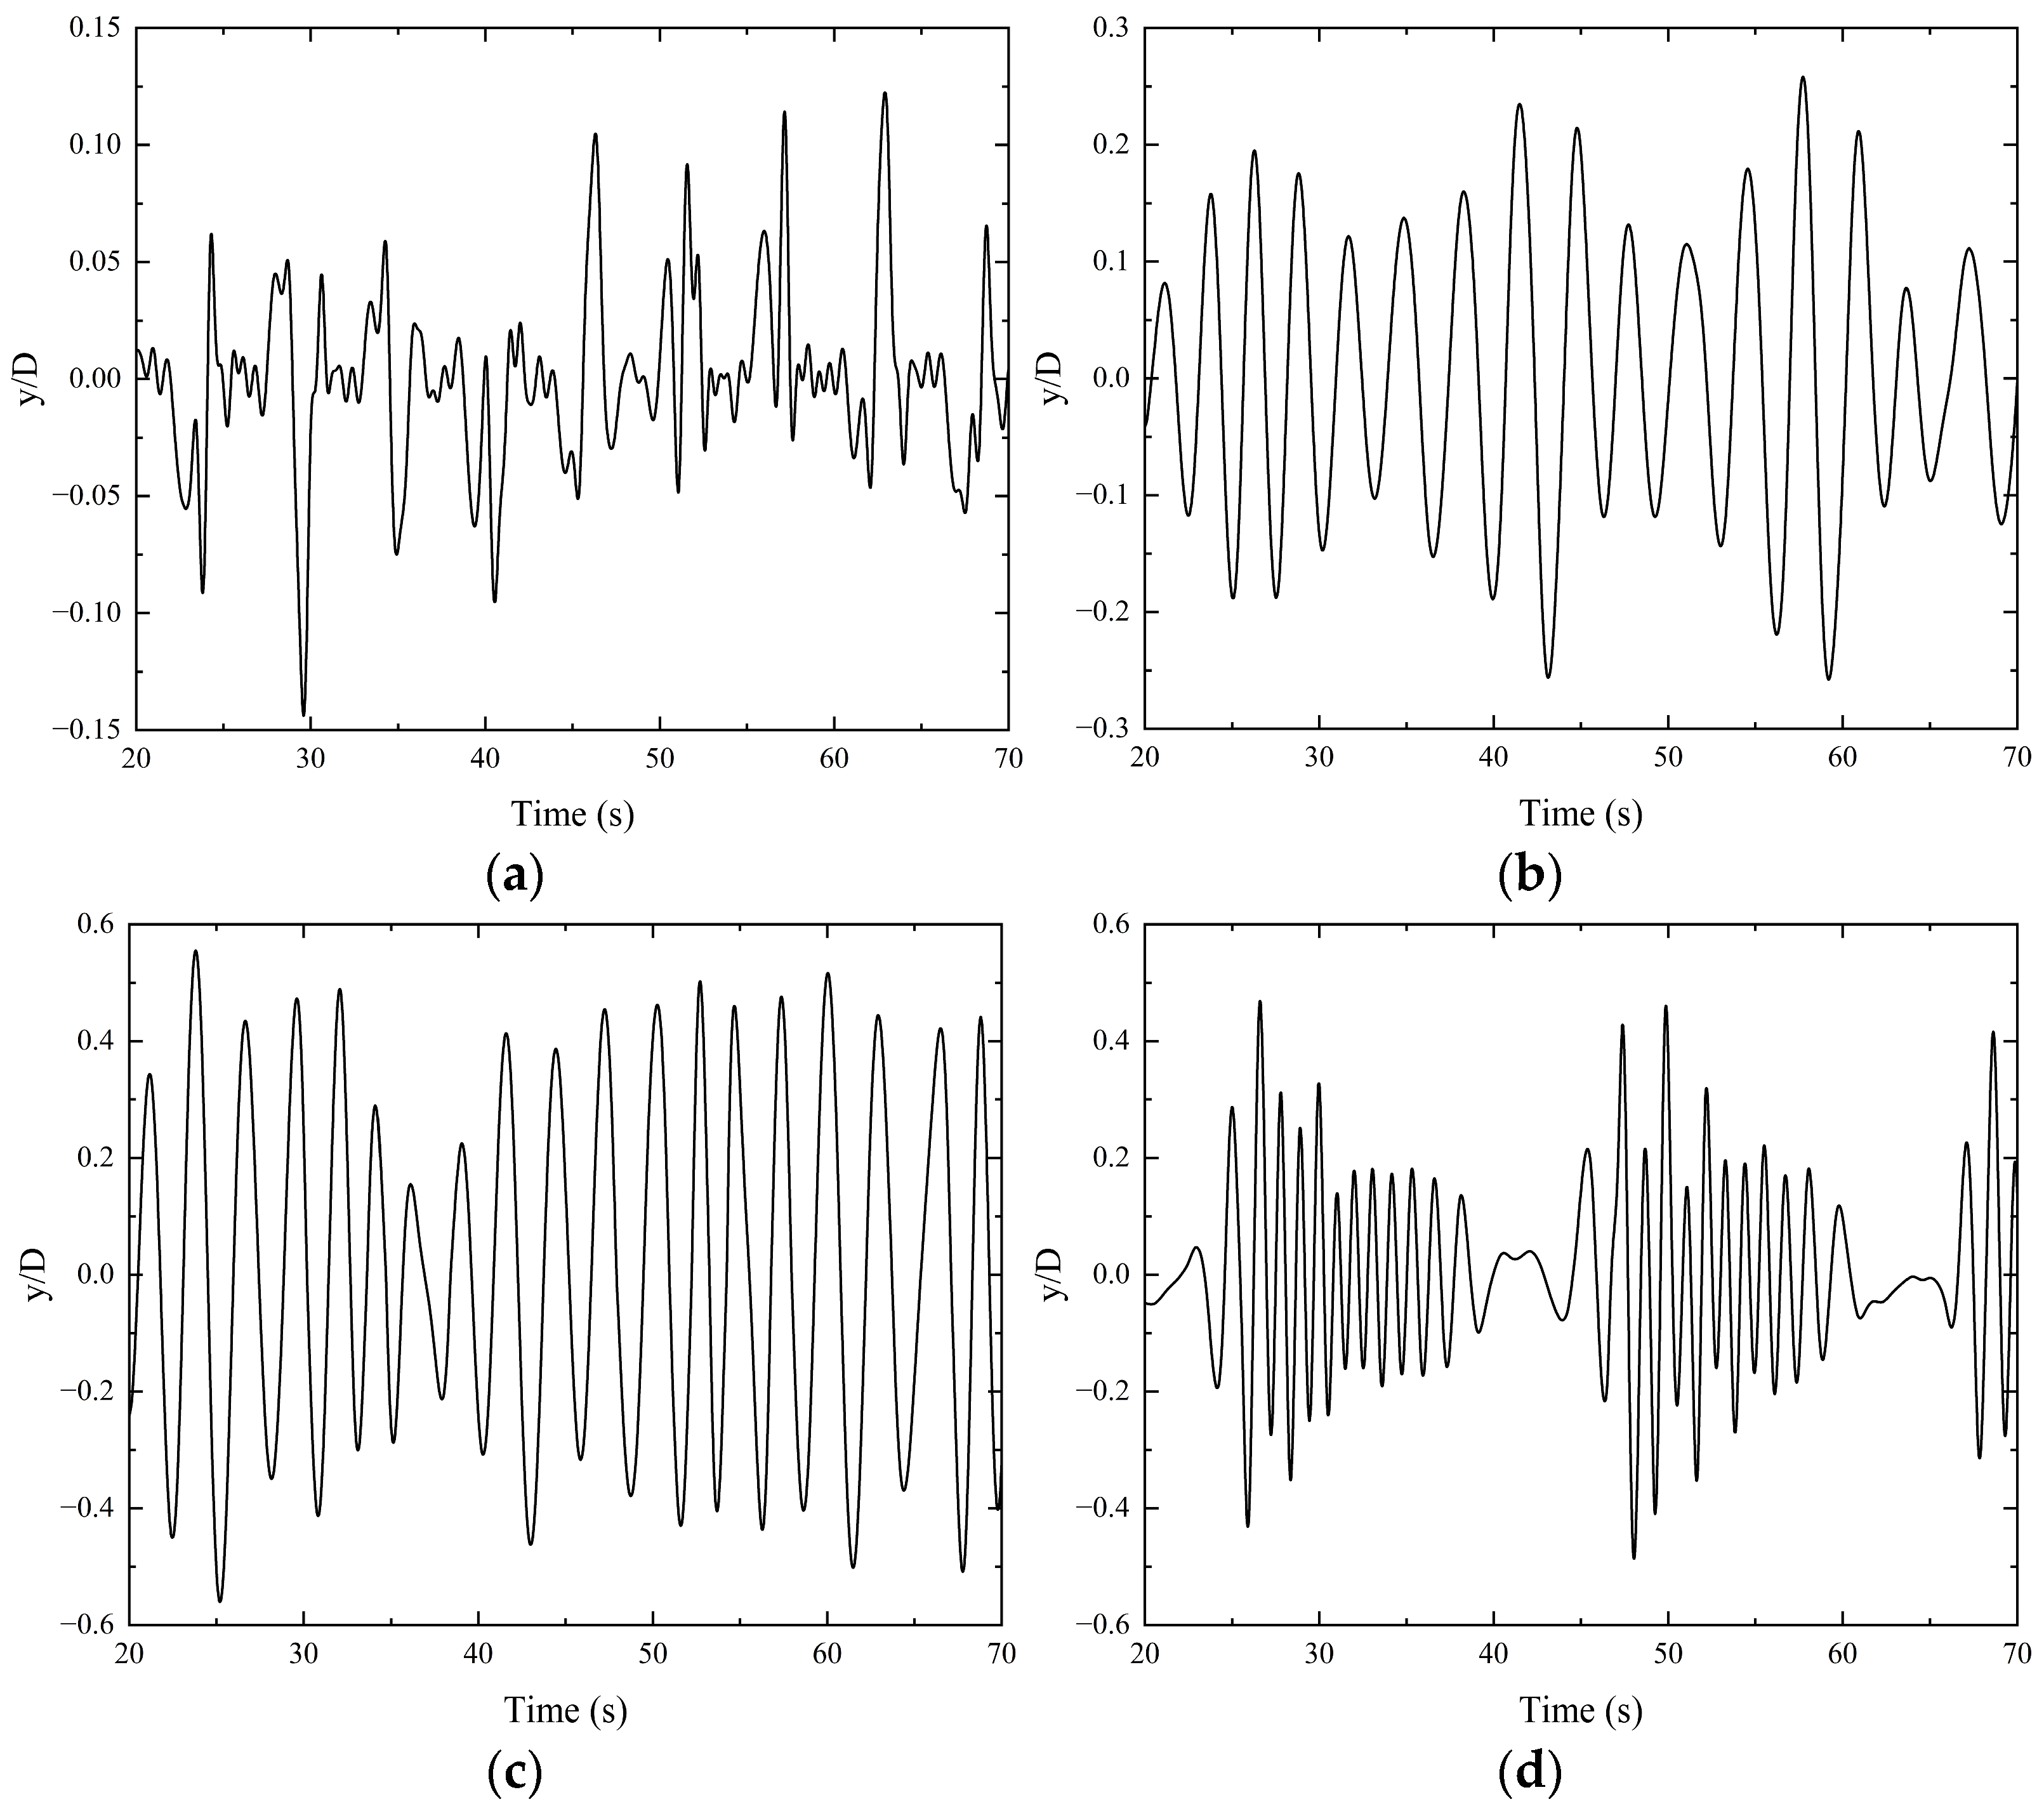
The time histories of transverse displacement and displacement trajectories at selected riser strips are presented in
Figure 6 and
Figure 7, respectively. Here,
s/
L denotes the dimensionless normalized water depth, where
s is the local water depth corresponding to the riser segment and
L represents the total water depth. Meanwhile,
x/
D and
y/
D refer to the dimensionless displacement amplitudes in the in-line and cross-flow directions, respectively, with
D being the riser outer diameter.
As demonstrated by the cross-flow VIV responses and vibration trajectories of the riser illustrated in
Figure 6 and
Figure 7, within the low-velocity regime corresponding to
s/
L = 0.1, the vibration amplitude remains below 0.1D and exhibits a hybrid multi-periodic pattern. This behavior stems from the 17° inclination between the riser axis and the incoming flow, which yields an effective cross-flow velocity of only 0.08 m/s. Under such circumstances, the axial velocity component exerts a significant influence, resulting in the coexistence of the Karman vortex shedding frequency in the vertical wake region with low-frequency axial vortex components. As a consequence, the vibration energy becomes dispersed, the cross-flow vibrations display chaotic features, and the vibration trajectory is characterized by disorder and low amplitude.
As the dimensionless position increases to s/L = 0.3, the vibration amplitude rises to 0.124D, and the vibration trajectory tends toward regularity. At this location, the angle between the riser axis and the incoming flow increases to 38°, leading to an effective cross-flow velocity of 0.4 m/s, which enhances vortex shedding in the wake region. While single-frequency vibration modes begin to dominate the energy distribution, the relatively low effective cross-flow velocity coupled with the higher effective axial velocity facilitates inter-modal energy transfer, thereby sustaining a state of multi-modal coexistence. Consequently, within the low-velocity regime, the competitive coexistence of multiple frequencies results in the vibration trajectory of this riser segment exhibiting complex chaotic characteristics.
As the flow velocity increases, within the dimensionless position range of s/L = 0.55–0.65, the vibration amplitude stabilizes around 0.7D. Specifically, at s/L = 0.6, the effective cross-flow velocity reaches 0.84 m/s. At this juncture, the cross-flow direction of the riser segment exhibits the frequency locking phenomenon, which intensifies the FSI. A single dominant mode fully governs the vibration behavior, giving rise to highly regular periodic motion. The cross-flow vibration amplitude is substantial, accompanied by a prominent VIV response, and the vibration trajectory presents a typical figure-eight pattern. Nevertheless, owing to the angle between the riser and the incoming flow, the flow separation point shifts continuously, leading to the dynamic evolution of the figure-eight trajectory.
In the high-velocity region near the sea surface (s/L = 0.8), the vibration amplitude drops to 0.125D. The elevated fluid kinetic energy significantly increases the vortex shedding frequency, and distinct aliasing occurs among multi-frequency vibration modes, impeding the occurrence of frequency locking. Energy transfer between dominant vibration modes triggers modal transitions, resulting in a multi-mode superposition of vibration responses. The superposition of multi-frequency vibration energy substantially undermines the formation of regular vibration trajectories.
5. Analysis of VIV Responses of SCR Induced by Platform Heave
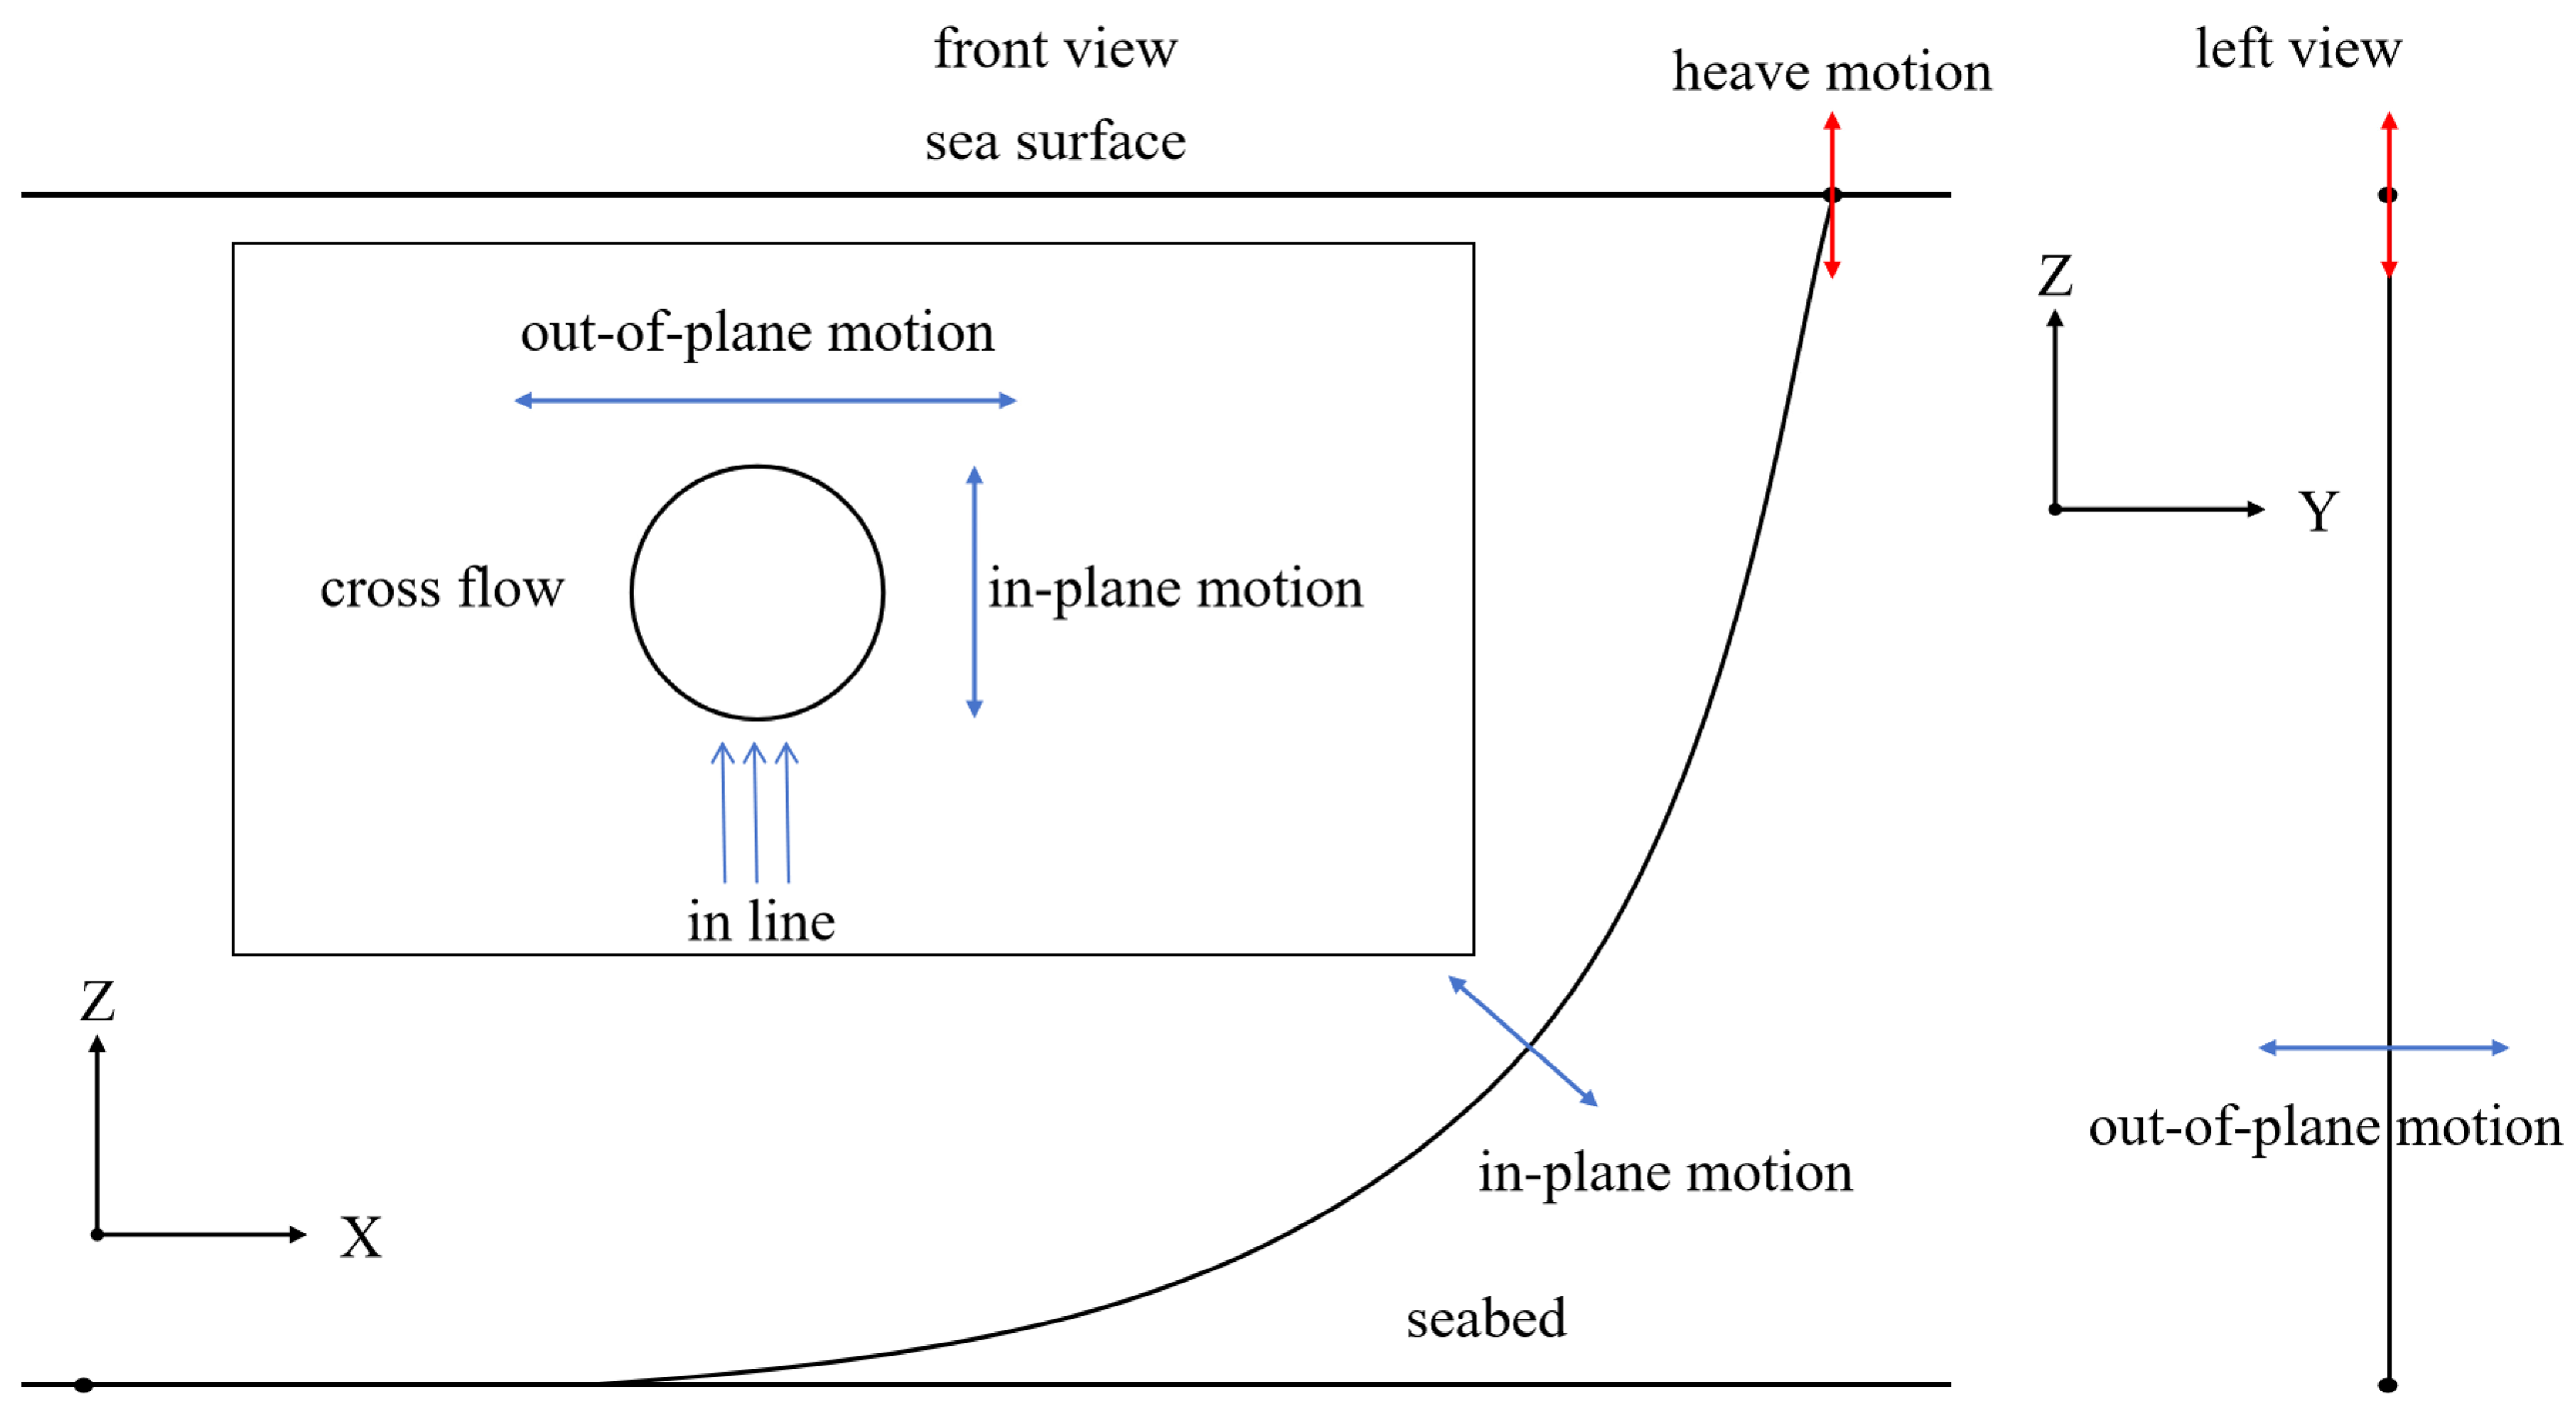
Schematic of SCR motion induced by platform heave (
Figure 8): As clearly illustrated in the figure, the heave motion of the platform not only drives the riser to move vertically within its own plane but also causes horizontal displacement of the riser out of the plane. When the platform drives a riser into horizontal motion through still water, a relative velocity is generated between the riser and the surrounding fluid. This relative motion creates an oscillating flow field superimposed on the ambient ocean current, which in turn triggers cross-flow VIV in localized segments of the riser. Existing research has established that riser VIV induced by platform heave motion is fundamentally a form of VIV driven by oscillatory flow [
15]. Against this backdrop, this study first employs the AQWA software (Ansys 2022) to simulate and analyze the heave motion response of a semi-submersible platform subjected to a 10-year return period marine event. Subsequently, grounded in the underlying mechanism of riser VIV excited by platform heave motion, the platform’s heave displacement time history is converted into an equivalent oscillatory flow boundary condition. This equivalent flow condition is then utilized to investigate the VIV responses of the riser.
Utilizing the platform and mooring cable parameters presented in
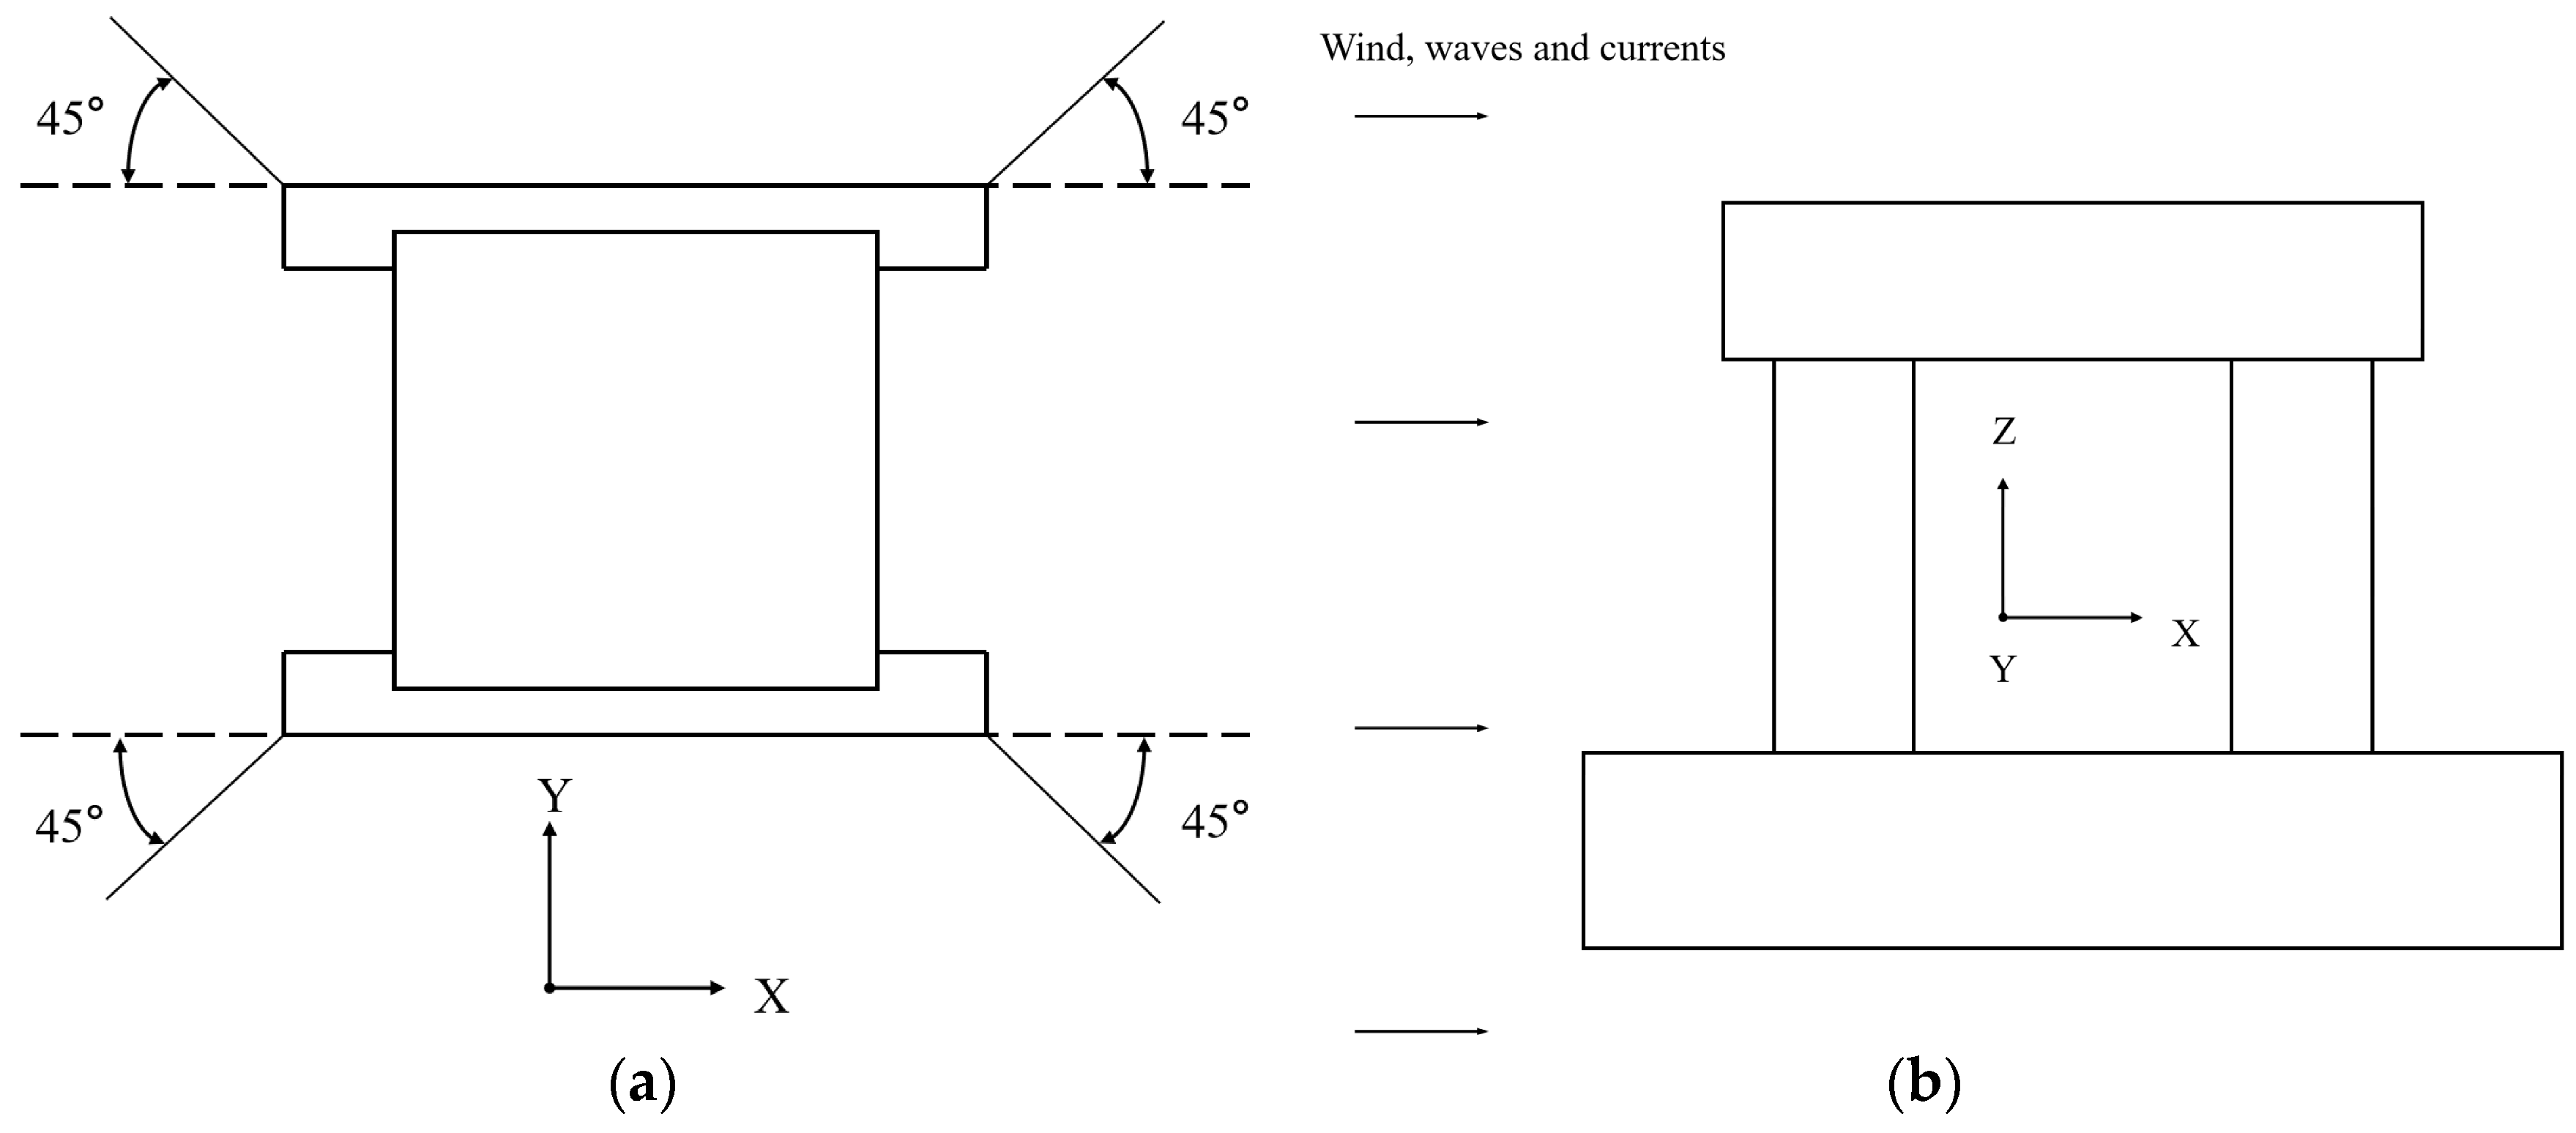
Table 5, a three-dimensional geometric model of the platform was constructed in ANSYS Space Claim. The mooring system was configured with four cables, each connected to the outer bottom corners of the platform’s floating body and oriented at a 45° angle relative to the horizontal plane, as illustrated in
Figure 9a. Wind, wave, and current fields were assumed to be collinear, with their incident direction aligned along the X-axis, as shown in
Figure 9b.
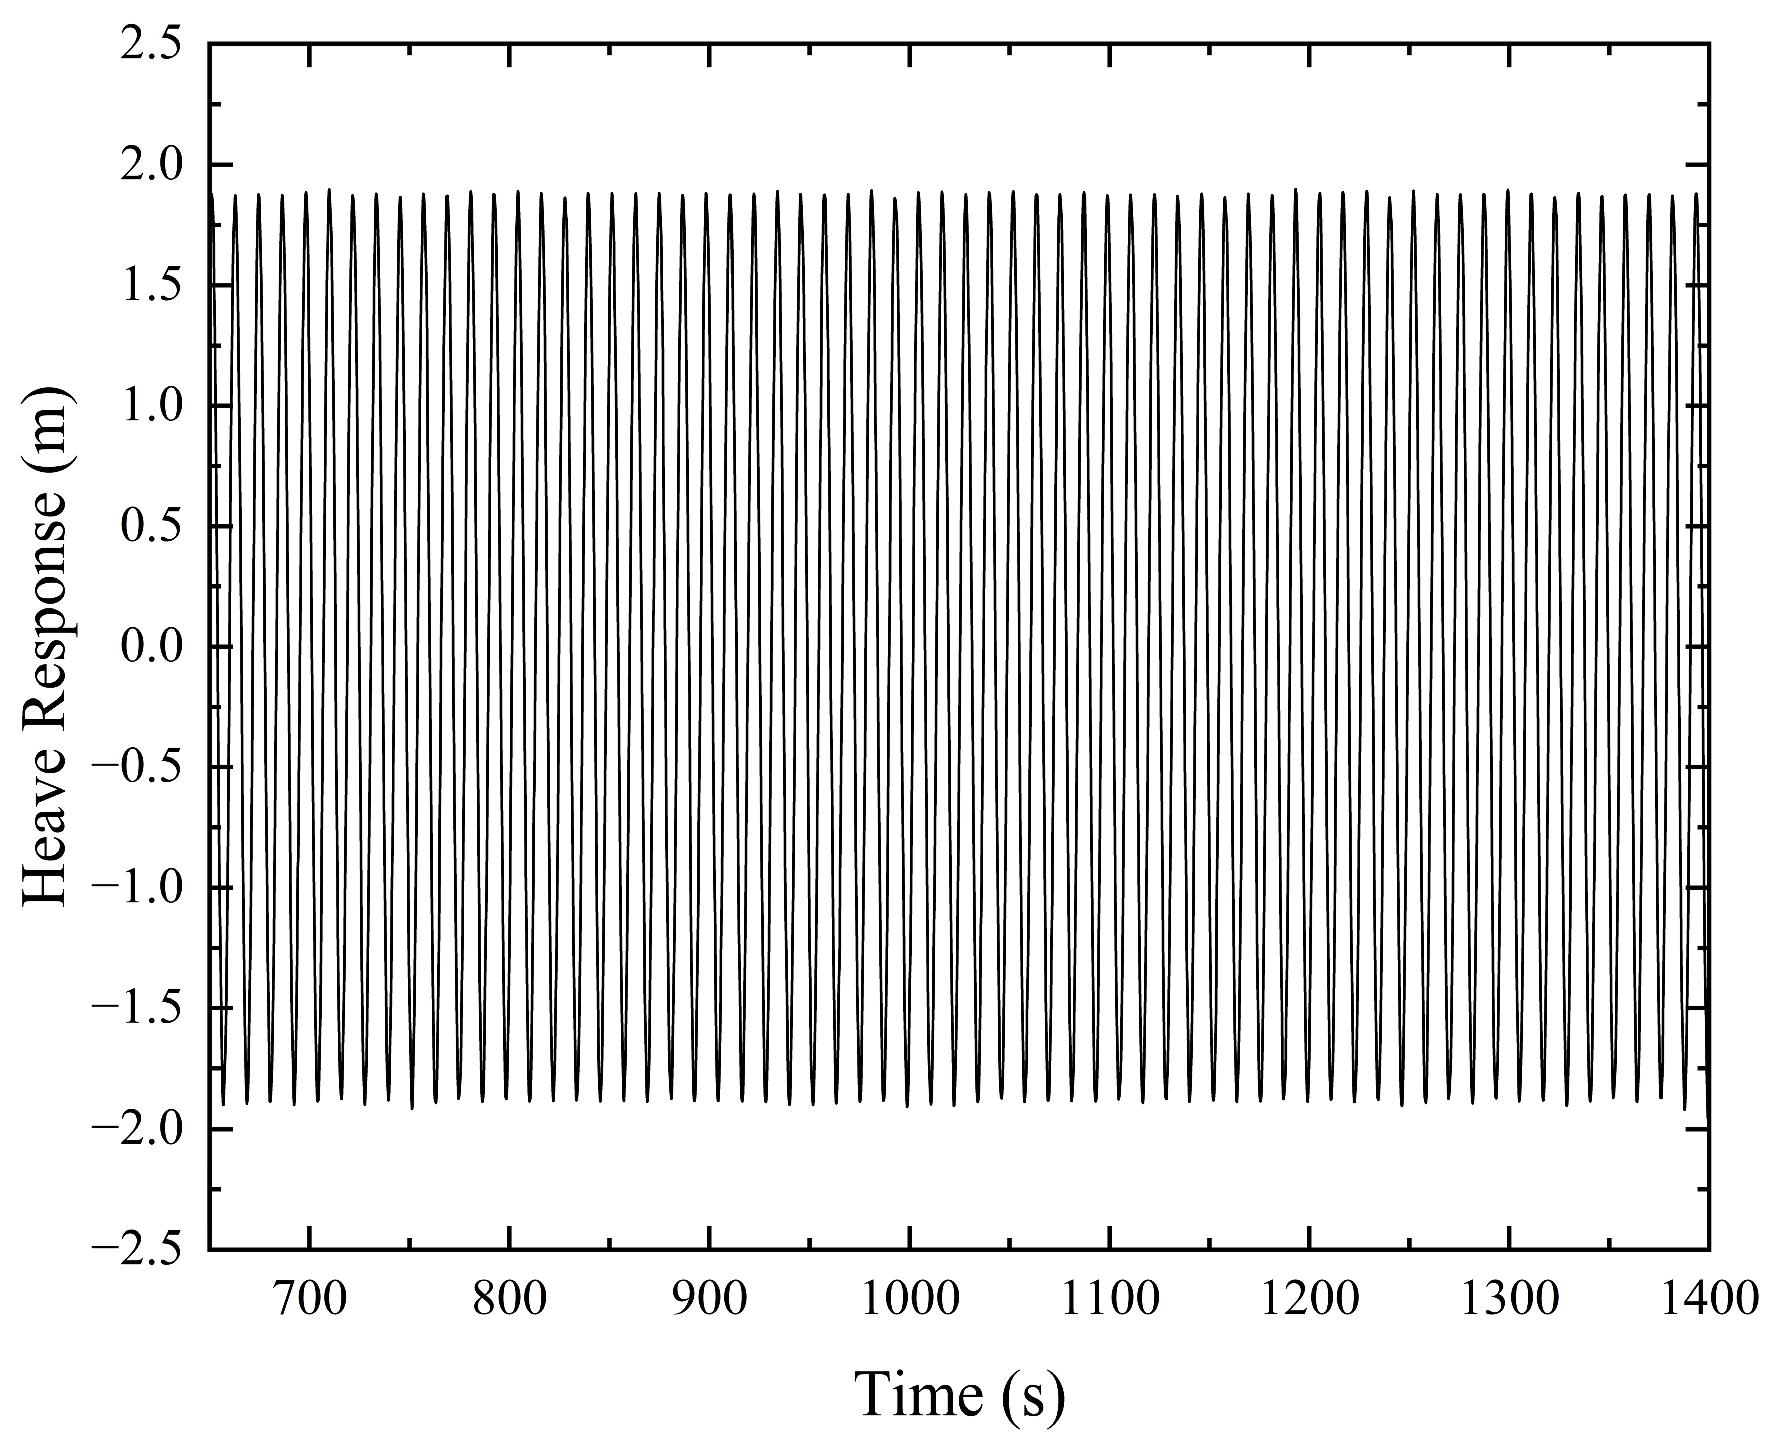
The platform heave response, derived from numerical simulations incorporating second-order Stokes waves, the NPD wind spectrum, and steady-state ocean currents, is presented in
Figure 10. The instantaneous velocity of the platform’s heave motion is defined as the first-order time derivative of the heave displacement time series.
where
A denotes the heave amplitude of the platform, and
f is the heave motion frequency of the platform.
From the riser-fixed reference frame, the heave motion of the platform induces a relative flow velocity that is numerically identical to the platform’s instantaneous heave velocity. Accordingly, the platform’s heave motion can be equivalently modeled as a cosine-form oscillatory flow. Utilizing the quantified heave response parameters of the platform (heave amplitude A = 1.8906 m, heave frequency f = 0.082 Hz), the maximum velocity amplitude of the equivalent oscillatory flow was computed as Vmax = 0.97 m/s. The KC number, which characterizes the degree of flow oscillation, is calculated as Vmax/fD, and thus the KC number is determined to be 33.
VIR occurs in the ambient ocean current when the
s/
L ranges from 0.55 to 0.65, where the response amplitude reaches its peak. Accordingly, this study focuses on the VIV response of marine risers under an oscillatory flow condition with
s/
L = 0.6, as illustrated in
Figure 11. According to the velocity formulation for oscillatory flow, the flow velocity varies cyclically from the maximum value
Vmax to zero and then returns to
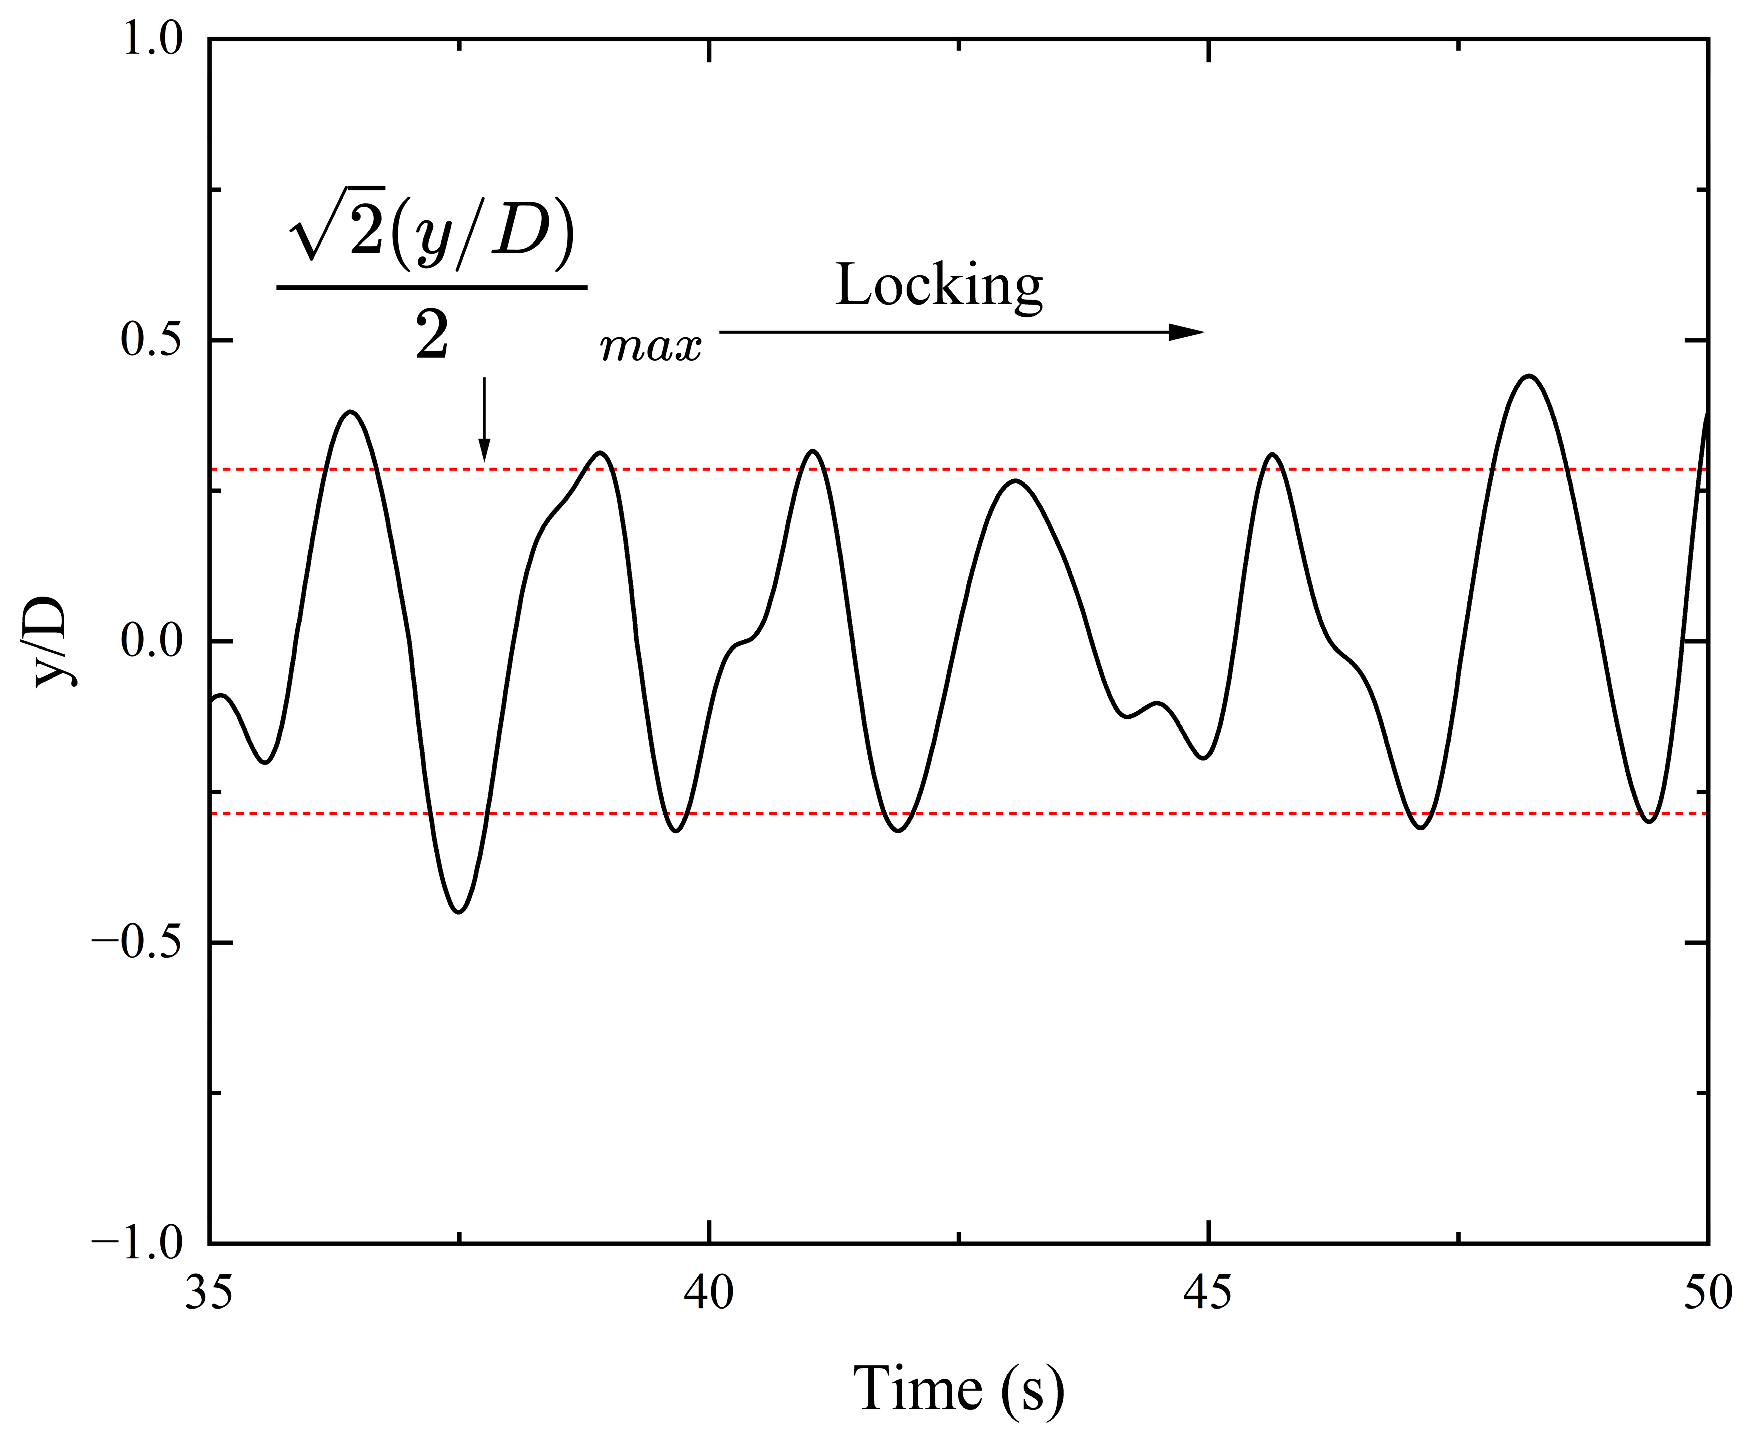
Vmax within a single oscillation period. As a result, VIV behavior under oscillatory inflow exhibits distinct temporal segmentation characteristics. Based on this feature, the entire evolutionary process of riser VIV is divided into three sequential phases: the establishment phase, the locking phase, and the decay phase. The division criterion is defined by comparing the displacement response amplitude with the threshold value
. Specifically, the VIV enters the establishment phase when the normalized displacement response amplitude
y/
D is less than
and the flow velocity is in the acceleration stage. Subsequently, as
y/
D exceeds this threshold, the VIV transitions into the stable locking phase, where the riser vibration frequency synchronizes with the vortex shedding frequency. Finally, the VIV enters the decay phase when
y/
D drops below
again, and the flow velocity is in the deceleration stage.
As depicted in
Figure 11, under the 10-year return period sea state, the VIV response of the riser maintains exceptional stability. Its amplitude envelope forms a nearly horizontal line, with the locked-phase ratio approaching 100% over the entire oscillation cycle, a characteristic defined as “complete locking”. The maximum response amplitude reaches approximately 0.47D. Notably, under the equivalent oscillatory flow condition, the intensity of the riser’s VIV response is of the same order of magnitude as that observed under steady background ocean current conditions. The time-history curves of cross-flow displacement at the analyzed riser strips are presented in
Figure 12. The VIV response under oscillatory flow conditions exhibits distinct amplitude modulation characteristics. The displacement time-history curve clearly demonstrates the typical intermittent vibration behavior of VIV: within a single oscillation cycle, the vibration amplitude drops to near-zero during specific time intervals, presenting a pronounced discontinuous pattern. Notably, this intermittent VIV maintains a certain degree of periodicity and regularity over extended time scales.
The VIV responses of marine risers differ significantly under oscillatory flow and shear flow conditions. Under oscillatory flow, the VIV response shows prominent time-varying features: within a single vibration cycle, the flow velocity’s acceleration and deceleration phases induce a dual-peak amplitude phenomenon, where the secondary peak often exceeds the initial peak. In extreme sea conditions with a 10-year return period, the oscillation flow velocity amplitude Vmax significantly increases and the excitation frequency f is relatively high, resulting in a KC number of 33. Under these conditions, the oscillation period is shortened, reducing the time interval between successive fluid excitations. As a result, the structural vibration induced by a previous cycle has not fully decayed before a new incoming flow excitation is applied. This leads to a superposition effect between the residual wake vortex structures and newly generated vortices, which amplifies the VIV response in the latter half of the cycle and results in the secondary amplitude peak being higher than the first. In contrast, the displacement response at the riser section with s/L = 0.2 exhibits non-periodic fluctuations. This phenomenon is primarily attributed to the inherent unstable vibration characteristics of the structure itself, rather than being a direct consequence of periodic flow velocity variations.
6. Analysis of Vortex-Induced Fatigue in SCRs
6.1. Workflow for Vortex-Induced Fatigue Analysis of SCRs
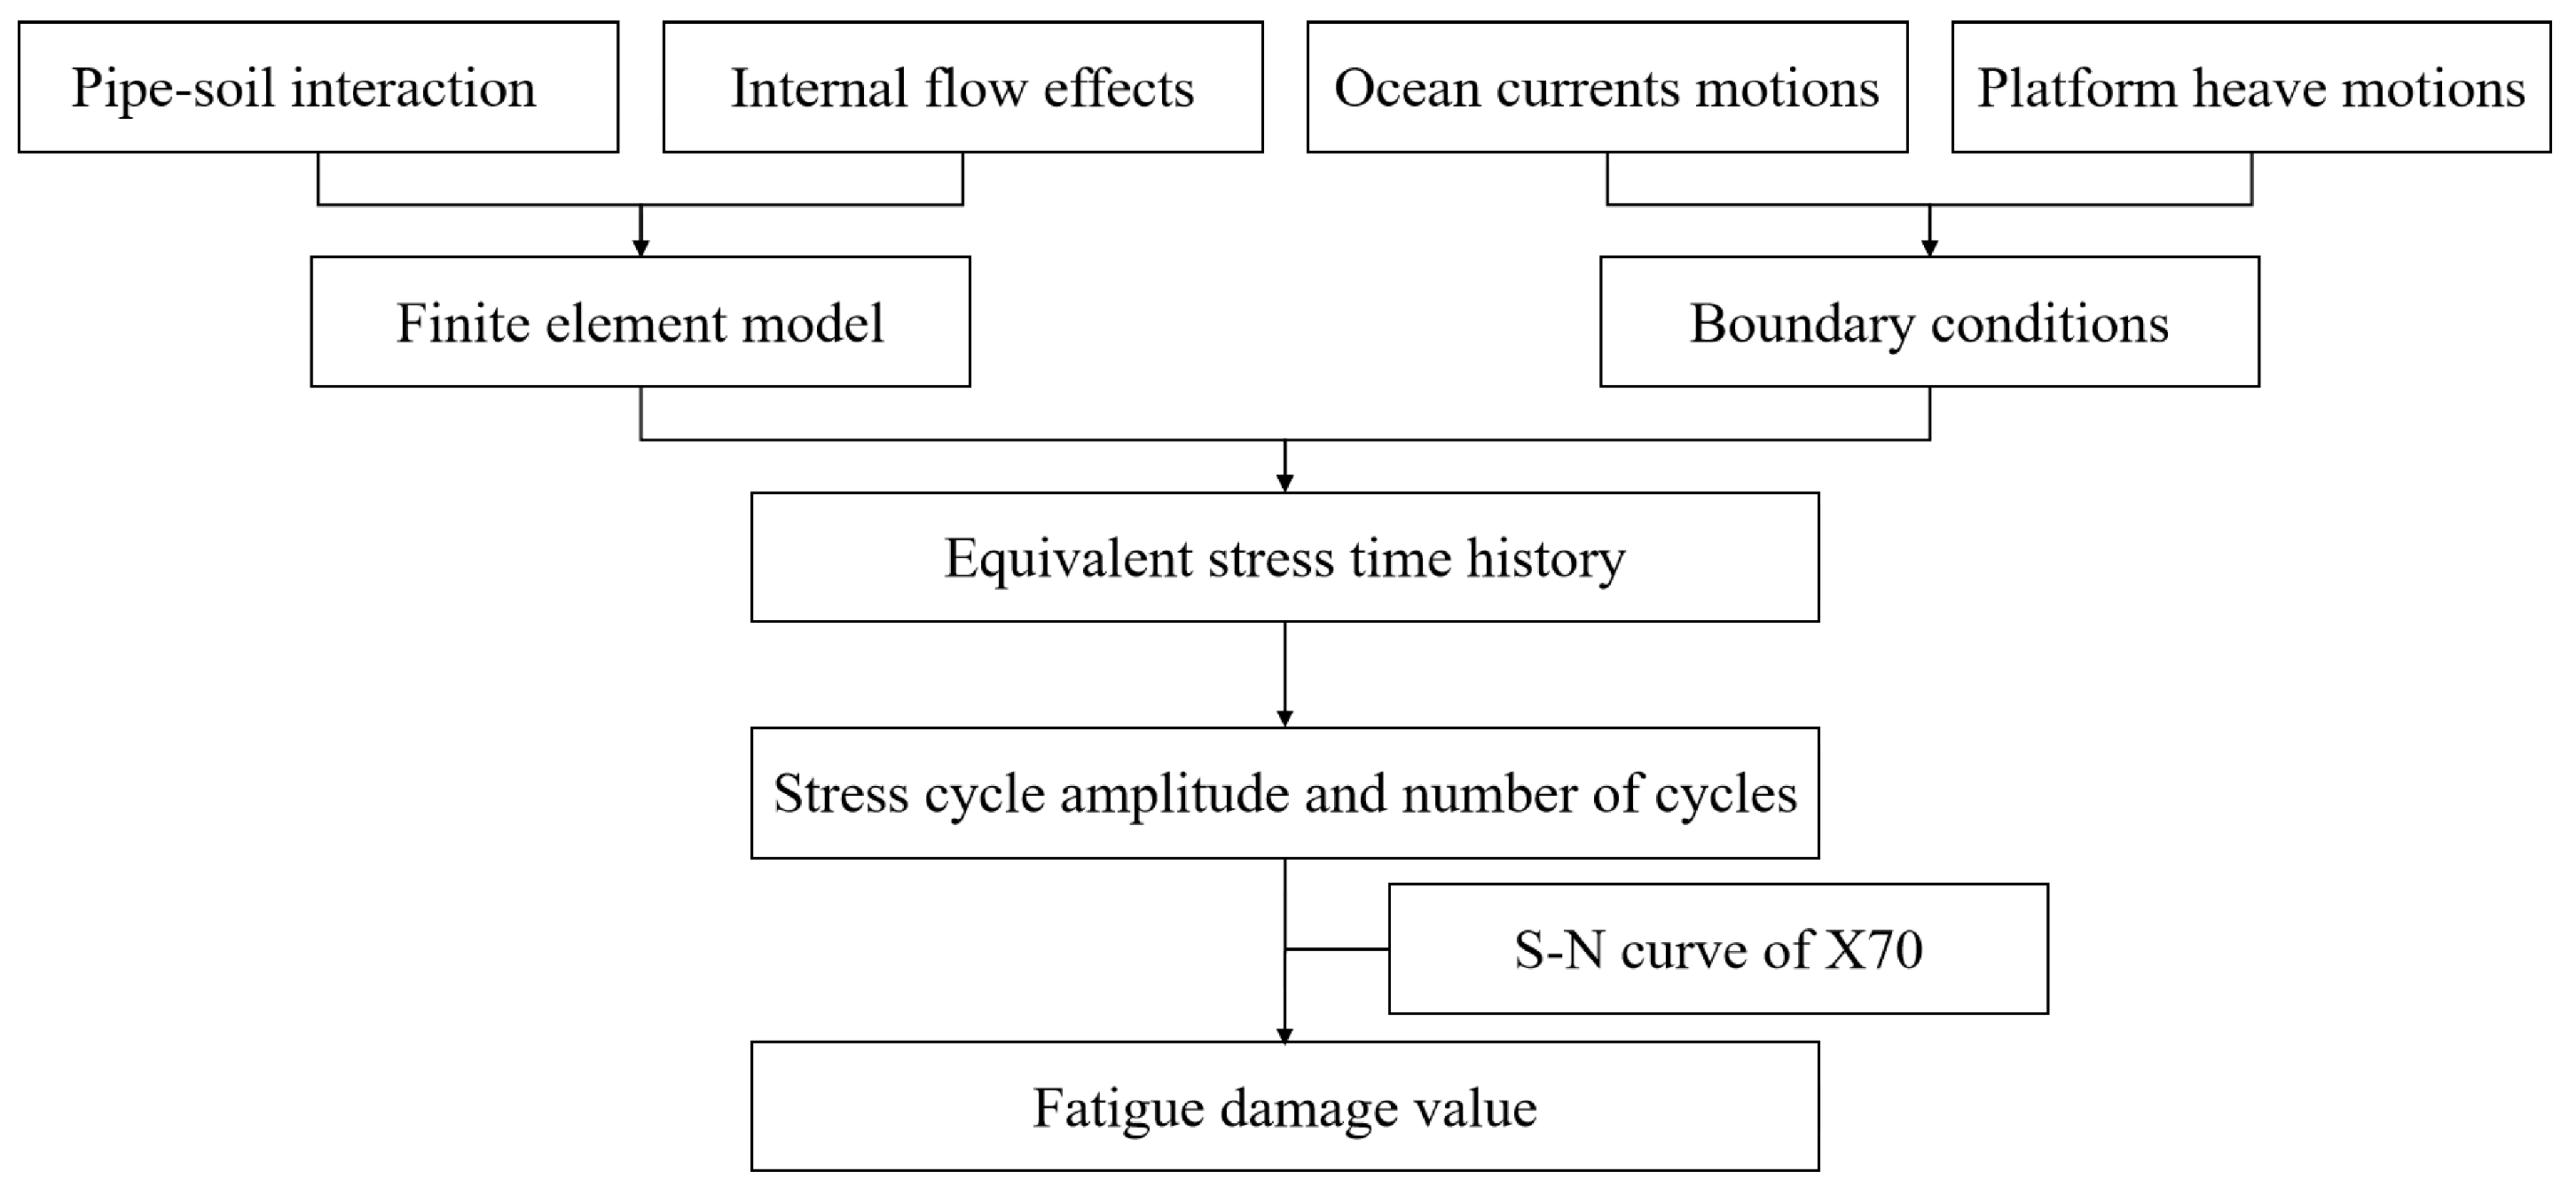
Based on the VIV response of the riser under the combined action of ocean currents and platform heave motions, the equivalent stress time history of the riser is analyzed by taking this response as the boundary condition. The rainflow counting method is then employed to decompose the stress time history into individual cycles, yielding the stress cycle amplitude and corresponding cycle count. Subsequently, the stress amplitude is corrected using the Goodman model to account for the influence of mean stress on fatigue performance. Finally, combined with the S-N curve of X70 steel obtained via numerical simulation, the fatigue damage distribution along the riser is quantified based on Miner’s linear damage accumulation theory. The detailed analytical workflow is depicted in
Figure 13.
In practical engineering scenarios, fatigue loads typically manifest as asymmetric stress cycles characterized by a non-zero mean stress. In contrast, material fatigue life datasets, such as those encapsulated in S-N curves, are predominantly derived from experimental results obtained under symmetric stress cycle conditions (i.e., with a mean stress of zero). To reconcile this discrepancy and ensure the accuracy of fatigue life predictions, the Goodman model is thus adopted for mean stress correction.
where
denotes the modified equivalent stress amplitude;
represents the stress amplitude;
is the mean stress;
denotes the tensile strength of the material.
The Miner linear fatigue damage accumulation theory is founded on the core assumption of stress cycle independence, which posits that the damage incurred by a structure under varying stress levels adheres to the principle of linear superposition. Fatigue failure of the material is deemed to occur when the cumulative equivalent damage from distinct load histories reaches a critical threshold, defined by a damage factor
D = 1. In the framework of this linear damage accumulation theory, the total damage
D is formulated as:
where
represents the cycle number of the i-th stress range;
denotes the fatigue failure cycle number of the material under the i-th stress level.
6.2. S-N Curve for X70 Steel
The geometric dimensions of the X70 steel specimens were strictly designed in accordance with GB/T 15248-2008 Metallic Materials—Test Method for Axial Constant-Amplitude Low-Cycle Fatigue [
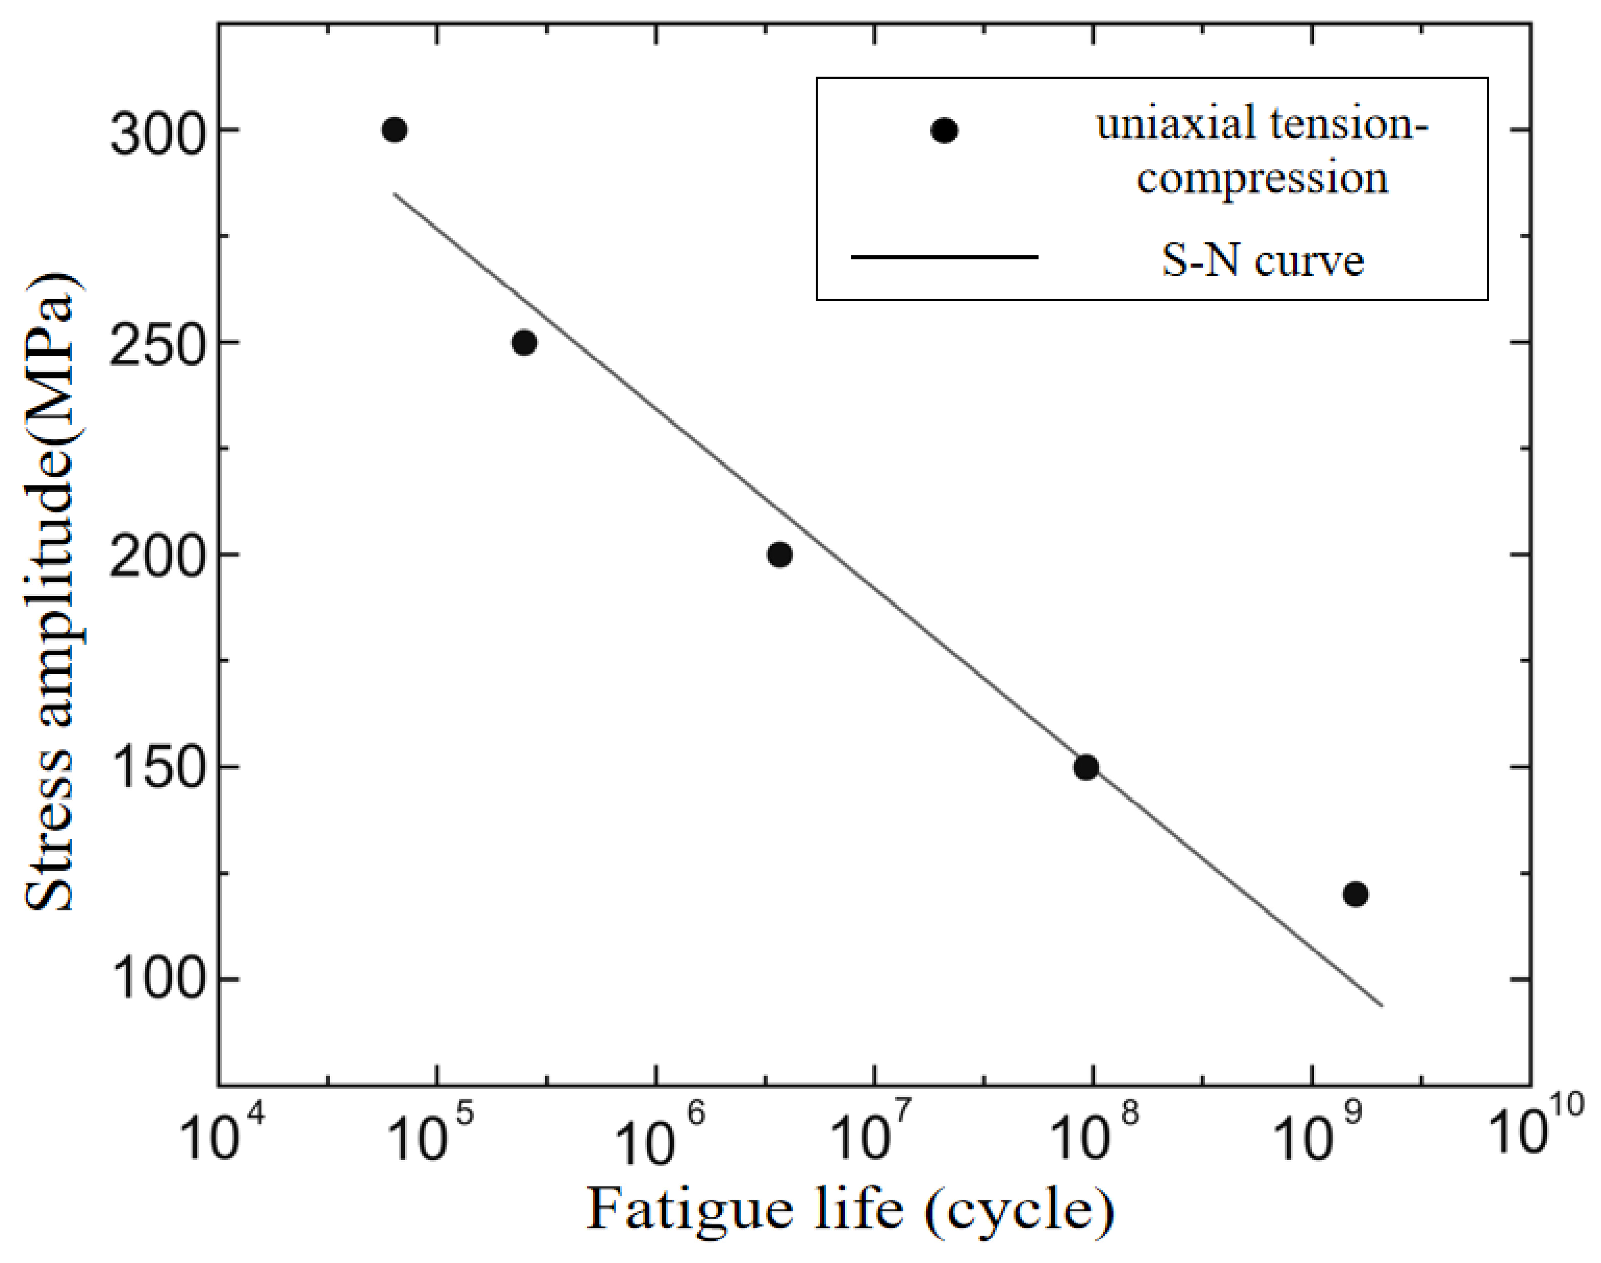
29]. The test setup adopted a fully fixed constraint at one end and a dynamic loading configuration at the other. Axial loading, calculated based on the target stress amplitude, was applied to simulate uniaxial tension-compression fatigue behavior under varying stress amplitude conditions. In the fatigue simulation tests, the maximum applied stress was set to 80% of the material’s tensile strength, with the applied stress amplitude ranging from 40 MPa to 300 MPa. Under such cyclic stress loading, the specimen eventually underwent fatigue failure. The S-N curve, which quantitatively describes the relationship between stress amplitude and the number of cycles to failure, is expressed mathematically as follows:
where
N is the number of cycles;
C and
m are constants related to the material and structure, respectively;
S represents the stress cycle amplitude.
Via least-squares regression of the fatigue life dataset, the S-N curve for X70 steel round tube specimens was derived in a logarithmic coordinate system, as depicted in
Figure 14. This regression analysis yielded the material constant
C = 1.29 × 10
33 and the structural constant
m = 11.5.
6.3. Vortex-Induced Fatigue Damage in SCRs
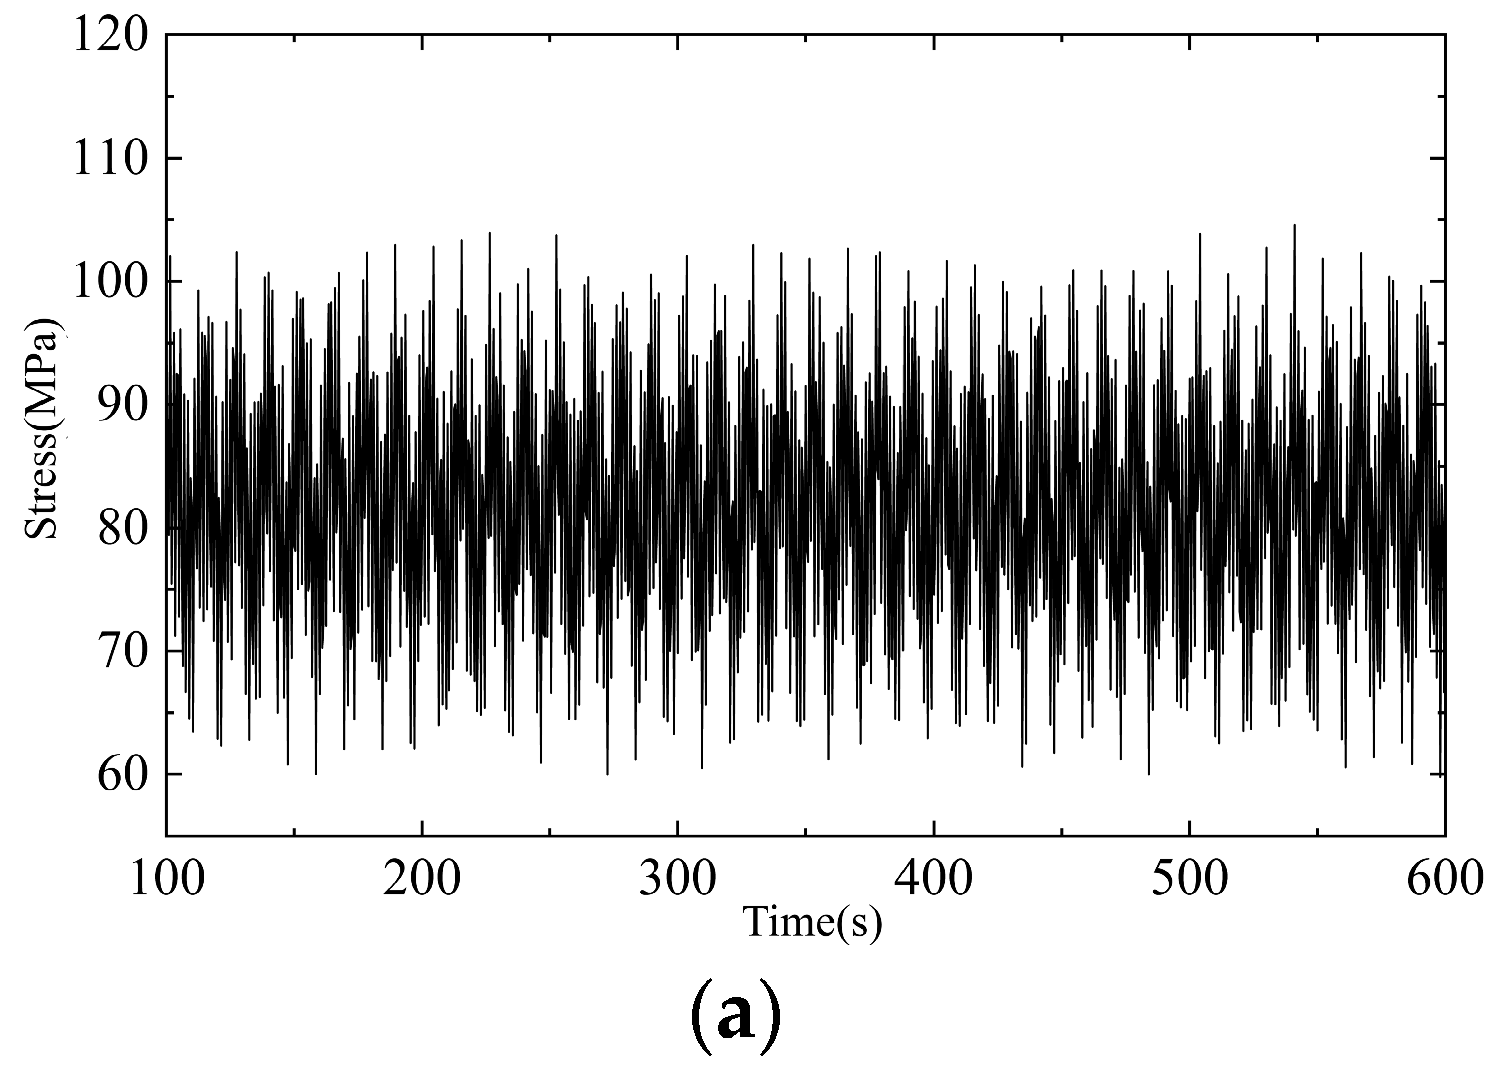
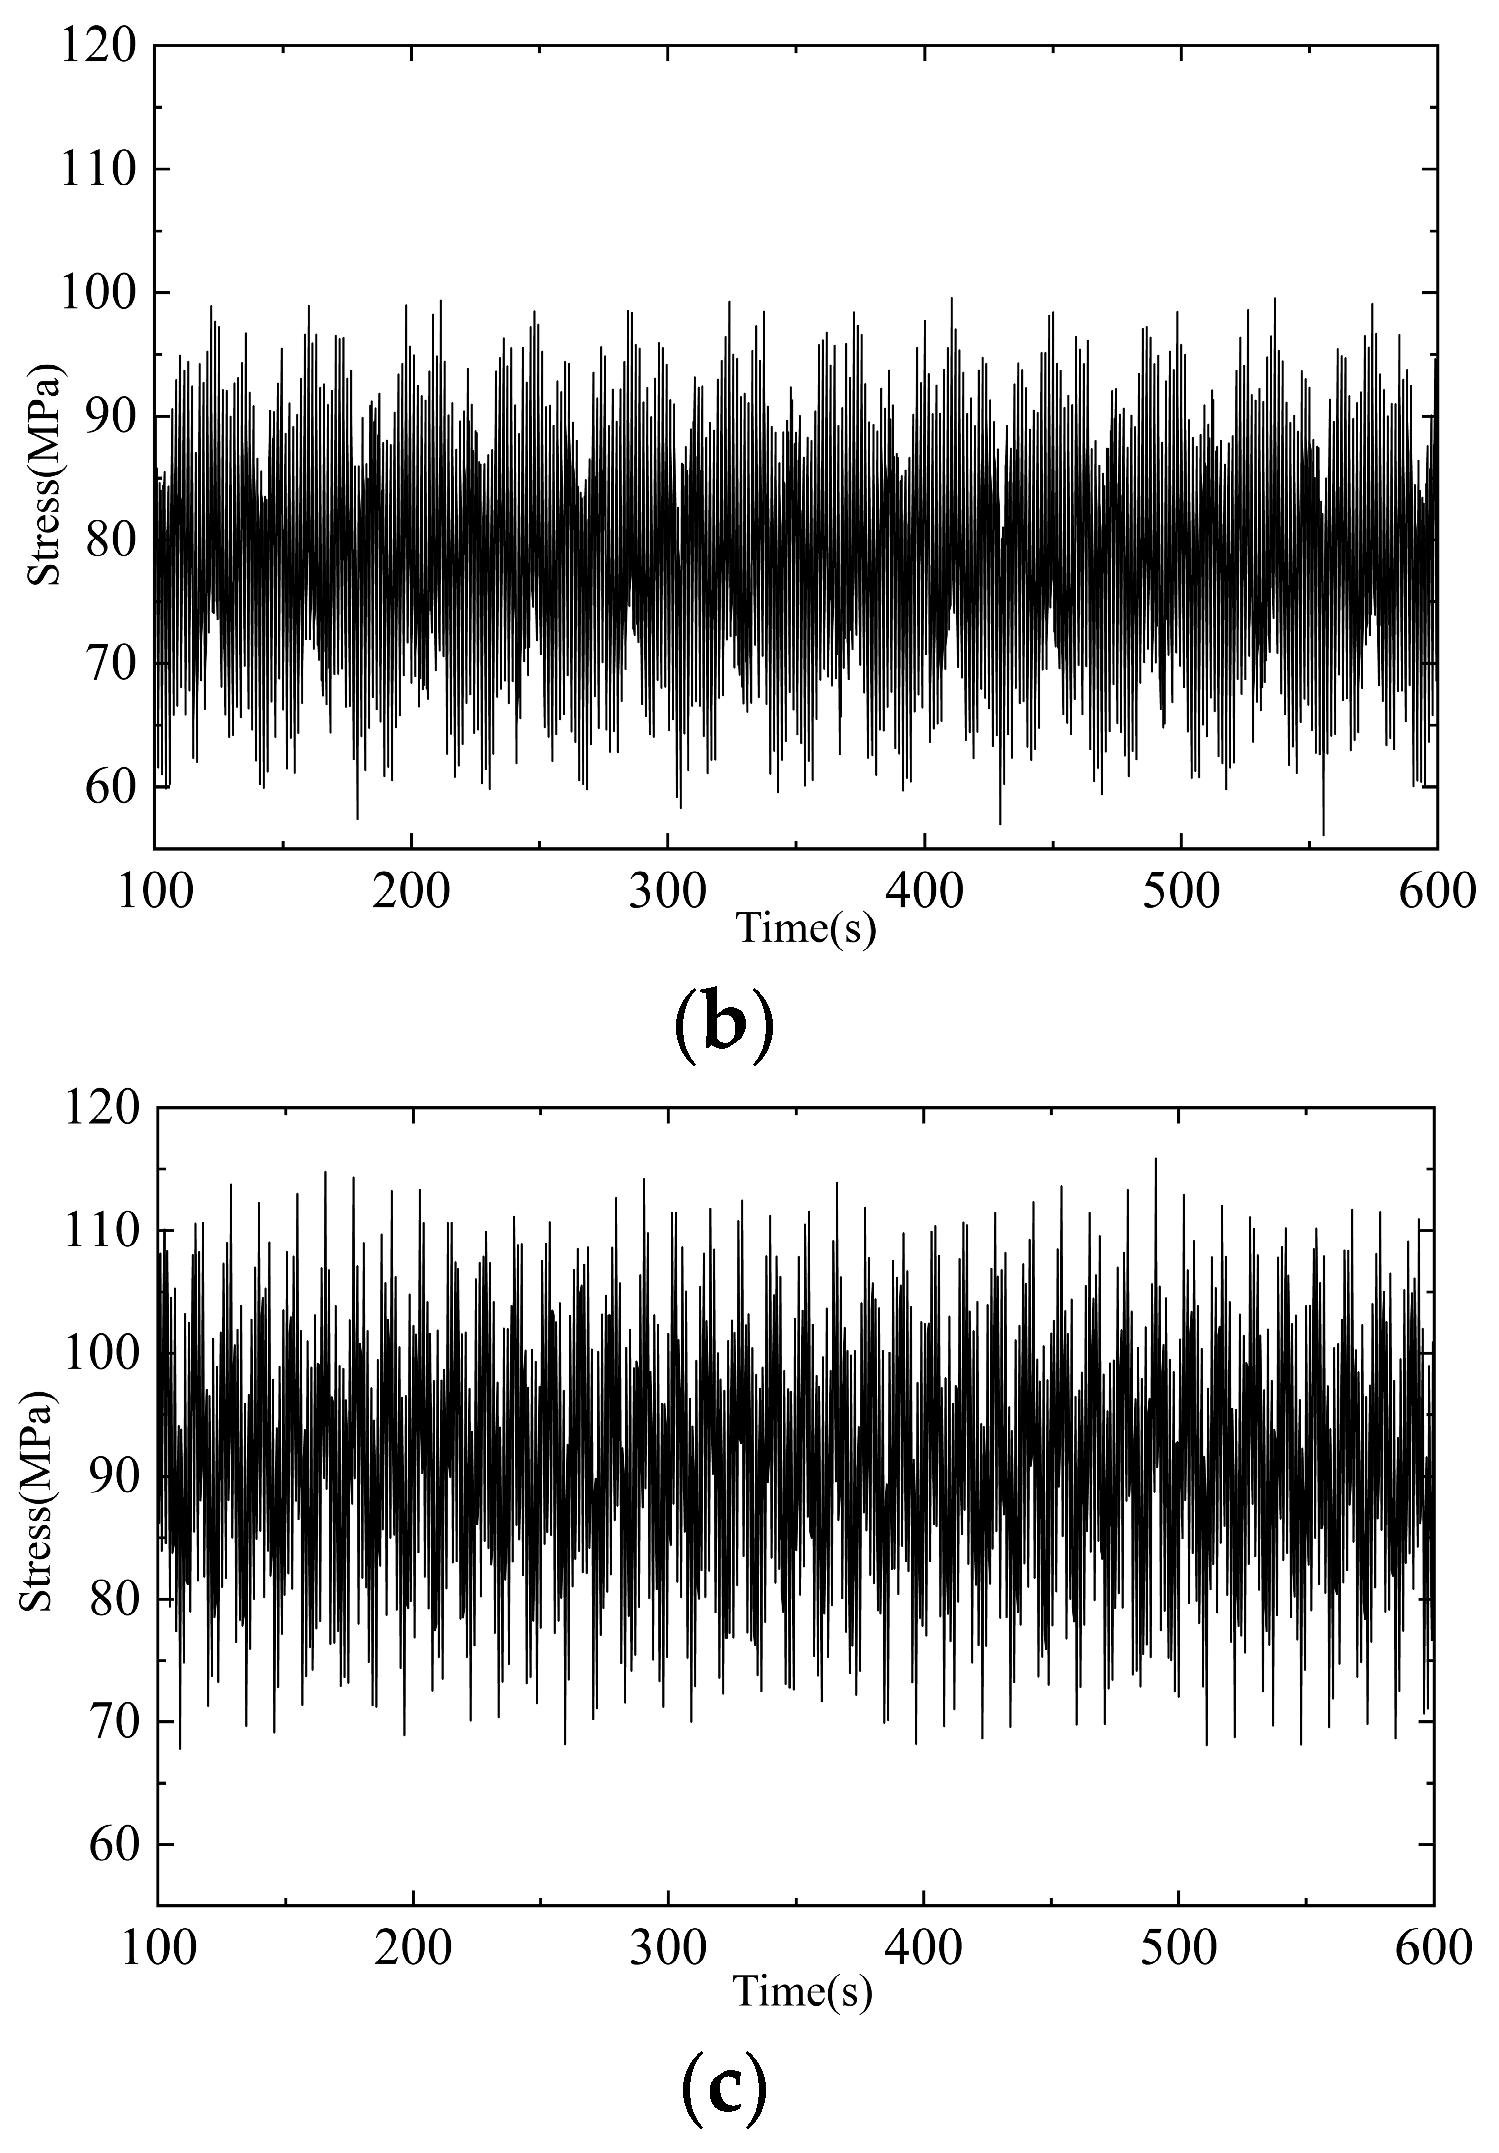
A FEM of the SCR was developed, with full integration of pipe–soil interaction mechanisms and internal fluid flow effects. In this framework, the vortex-induced vibration responses of the riser, induced separately by background ocean currents and platform heave motion, were independently applied as displacement boundary conditions to the finite element model of the riser, so as to characterize the temporal evolution of equivalent stress within the riser. Recognizing that touchdown zones (TDZs) are universally acknowledged as fatigue-critical hotspots in deepwater riser systems, this section presents and systematically compares the equivalent stress time histories at TDPs under three discrete loading scenarios: (1) VIV excitation induced solely by steady ambient ocean currents; (2) VIV excitation driven exclusively by platform heave motions; and (3) VIV excitation arising from the synergistic coupling of ambient ocean currents and platform heave motions, as visualized in
Figure 15.
As depicted in
Figure 15, the time histories of equivalent stress at the TDPs of the SCR exhibit pronounced disparities under three loading conditions: background ocean current alone, platform heave motion alone, and the superposition of both. When subjected exclusively to the background ocean current, the maximum equivalent stress attains 104.59 MPa. In contrast, under the sole excitation of platform heave motion, the peak equivalent stress reaches 99.58 MPa. Owing to the intrinsic hydrodynamic differences between oscillatory flow induced by platform heave and shear flow driven by ocean current, the stress time histories under the two single-loading scenarios display distinct periodic characteristics. Notably, the peak stress induced by platform heave motion is comparable in magnitude to that generated by the background ocean current, implying that the VIV response of the riser triggered by platform motion is non-negligible in engineering analysis. When the riser is exposed to the combined action of background ocean current and platform heave motion, the maximum equivalent stress escalates to 115.85 MPa. This finding suggests that the synergistic effect of the two loading conditions amplifies the stress concentration at the riser’s TDP, thereby accelerating the accumulation of fatigue damage and elevating the risk of vortex-induced fatigue failure in the SCR system.
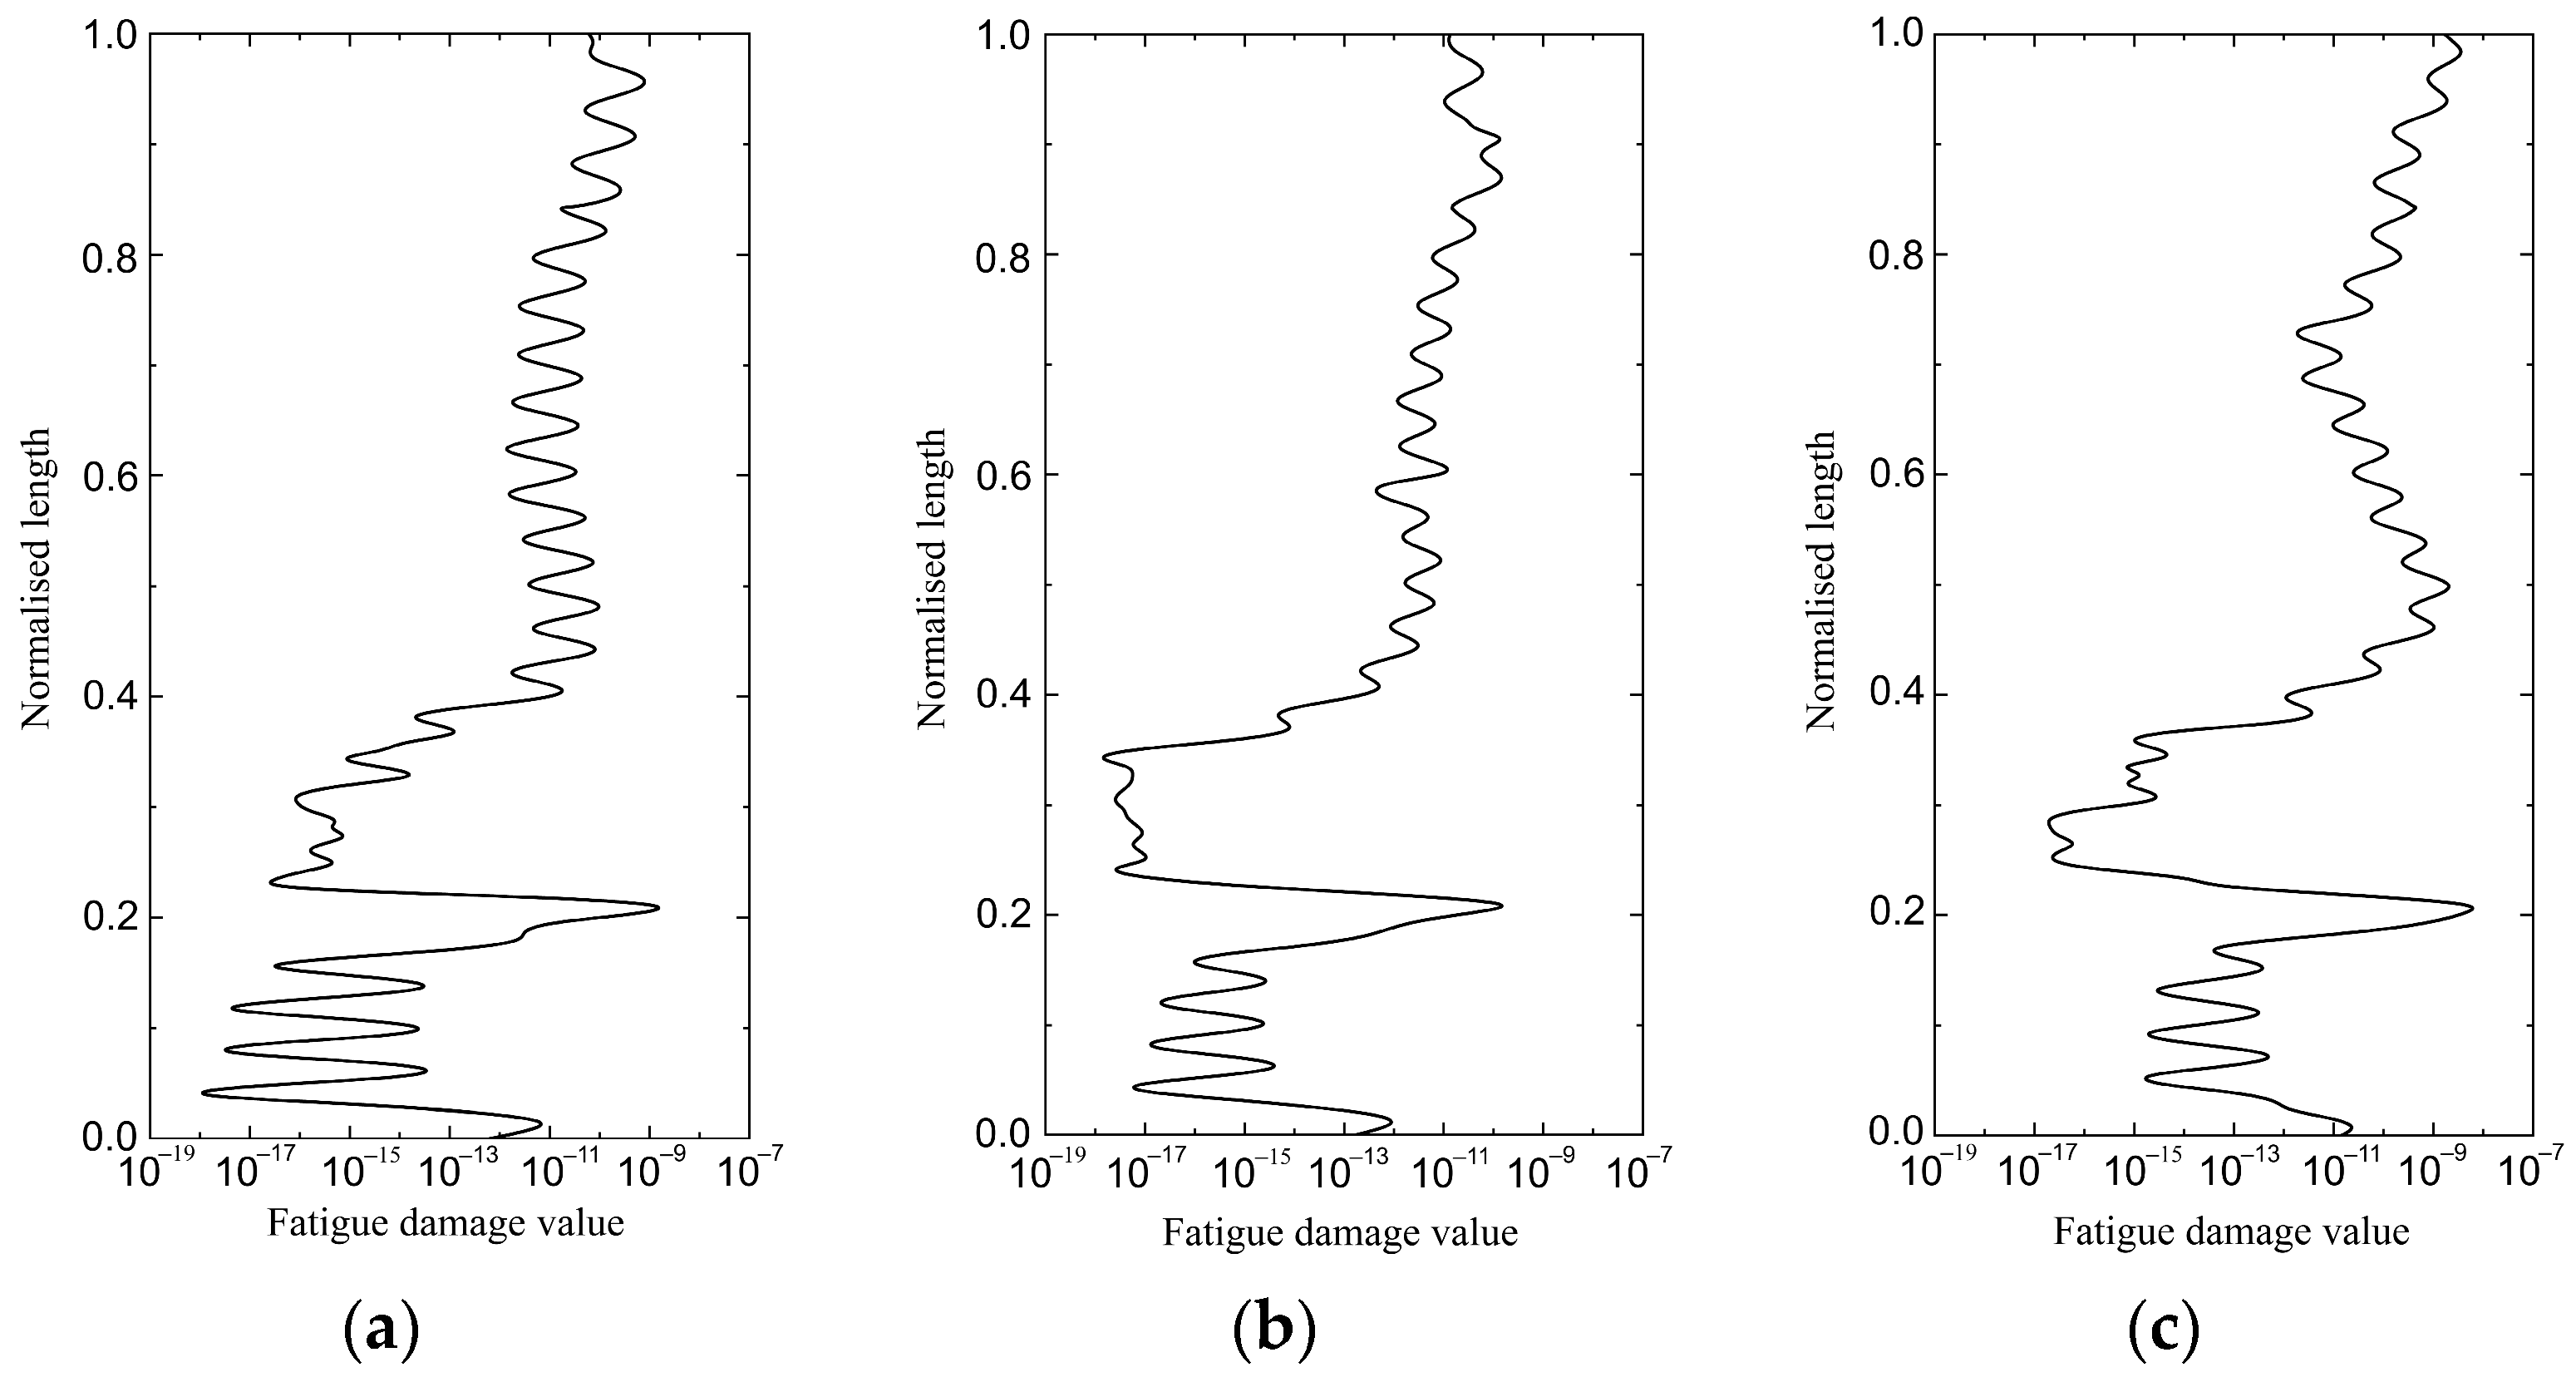
For comparative analysis, this study investigated the vortex-induced fatigue behavior of SCRs under three distinct loading scenarios: excitation by background ocean currents alone, excitation by platform heave motion alone, and the synergistic action of both loads. Based on a 10-year return period sea state,
Figure 16 presents the normalized distribution of vortex-induced fatigue damage for the SCR under the aforementioned three conditions, with the duration of vortex-induced response set at 600 s.
As illustrated in
Figure 16, the peak fatigue damage of the riser emerges at the TDP across all three operational scenarios, confirming that this region is the primary hotspot for fatigue failure susceptibility. Marked discrepancies are observed in the spatial distributions of fatigue damage along the normalized length of the riser under the three loading conditions. Notably, when subjected to background ocean currents alone, the peak vortex-induced fatigue damage concentrates in the vicinity of the TDP, which aligns with conclusions from prior experimental investigations. In contrast, under the sole excitation of platform heave motion, a secondary peak in vortex-induced fatigue damage arises near the hang-off point rather than at the hang-off point itself. For the combined loading scenario, elevated fatigue damage levels are detected not only in the proximity of the TDP and hang-off point but also within the mid-section of the riser. This indicates that the critical regions requiring fatigue damage control become more numerous and spatially complex when both loads act synergistically. The specific values of fatigue damage peaks and fatigue damage at the hang-off point are presented in
Table 6.
Under the action of background ocean currents, the peak vortex-induced fatigue damage value of the SCR reaches 5.09 × 10⁻⁹, which highlights the non-negligible contribution of background currents to riser fatigue damage accumulation. Owing to the significant shear ratio of the incident flow field, vortex shedding frequencies vary substantially along the axial length of the riser. This spatial variation in shedding frequencies excites multiple vibration modes of the riser, leading to complex, multi-peak characteristics in the fatigue damage distribution curve. Notably, the region in the immediate vicinity of the seabed TDP exhibits the highest magnitude of fatigue damage, which further validates that the TDP serves as the critical control location for mitigating vortex-induced fatigue failure in SCR systems.
In contrast, the peak vortex-induced fatigue damage value of the riser under platform heave motion alone is only 4.32 × 10⁻¹⁰, accounting for merely 8.48% of that induced by background ocean currents alone. This quantitative comparison indicates that platform heave motion contributes relatively weakly to the overall vortex-induced fatigue damage accumulation of the riser. Nevertheless, the fatigue damage induced by platform heave motion remains non-negligible in engineering practice, as its magnitude is still sufficient to accelerate the degradation of riser structural integrity over long-term service. Notably, while the peak fatigue damage under platform heave motion still concentrates at the TDP, the fatigue damage value near the hang-off point reaches 2.01 × 10⁻¹⁰, which is comparable to that at the TDP. This phenomenon can be attributed to the significant local stress fluctuations caused by the top boundary constraint of the hang-off point. When coupled with the hydrodynamic effect of oscillatory flow generated by platform heave motion, these stress fluctuations drive the downward extension of the high-value fatigue damage zone originating from the hang-off point. Therefore, in the analysis of VIV induced by platform heave motion, both the TDP and the vicinity of the hang-off point should be regarded as critical regions requiring focused monitoring and fatigue control.
When subjected to the combined action of background ocean current and platform heave motion, the peak vortex-induced fatigue damage value of the riser escalates to 9.40 × 10⁻⁹, which is 1.847 times the magnitude observed under background ocean current alone. This quantitative result clearly indicates that the synergistic effect of the two loading conditions significantly amplifies the fatigue damage accumulation in the riser system. Furthermore, the spatial distribution of vortex-induced fatigue damage under combined loading becomes notably more complex compared to single-loading scenarios. In addition to the high-damage zones concentrated near the TDP and hang-off point, a distinct secondary damage peak with a value of 2.57 × 10⁻⁹ emerges in the mid-section of the riser. This phenomenon demonstrates that the combined hydrodynamic excitation of ocean current and platform motion induces multi-location fatigue damage hotspots along the riser.
This study reveals that the conventional paradigm for vortex-induced fatigue assessment and design of SCRs, which focuses solely on current-induced vortex-induced vibrations, entails a significant risk of underestimation. The oscillatory flow induced by platform heave motion is not a negligible secondary load; its combined effect with background ocean currents not only substantially intensifies the vortex-induced fatigue damage of the riser, but also leads to highly concentrated damage in critical zones, including the mid-span section, the top hang-off point, and the TDP region. Therefore, it is imperative in engineering practice to establish a design framework based on “ocean current–platform motion” combined loading, elevating the contribution of platform heave to an equal status with that of background currents in SCR vortex-induced fatigue evaluation. Furthermore, precise fatigue mitigation strategies should be developed in accordance with the characteristic damage distribution under combined loading conditions.