Article

A Multi-Year Organic Matter Dynamics and Biogeochemical Baseline in the Southeast Clarion-Clipperton Zone

The Metals Company, 1111 West Hastings Street, 15th Floor, Vancouver, BC V6E 2J3, Canada
*
Author to whom correspondence should be addressed.
J. Mar. Sci. Eng. 2026, 14(11), 1019; https://doi.org/10.3390/jmse14111019 (registering DOI)
Submission received: 28 April 2026 / Revised: 25 May 2026 / Accepted: 27 May 2026 / Published: 30 May 2026
(This article belongs to the Section Chemical Oceanography)

Abstract

Organic matter production, recycling, and burial processes temporally fluctuate across the Clarion-Clipperton Zone (CCZ) in the Eastern Tropical Pacific. Between 2019 and 2022, we conducted pelagic and benthic surveys in Nauru Ocean Research Inc. contract area D (NORI-D) in the southeast CCZ to establish environmental baseline conditions. Here, we synthetise the natural ranges of variability in physicochemical and biogeochemical processes in NORI-D across multiple surveys and years. We present interannual water column physicochemical characteristics from five metocean and pelagic campaigns, annual satellite-derived net primary productivity and export production, time-integrated sediment trap annual particulate organic carbon flux, and seafloor biogeochemical and sediment physical characteristics from three benthic campaigns. Temperature and salinity seasonally varied at the sea surface. Strong thermohaline and oxygen stratification developed over 0–100 m. Mean net primary productivity, export production, and seafloor particulate organic carbon flux amounted to 634.1, 15.7, and 2.1 mg C m−2 d−1, respectively. These rates fluctuated nearly four-fold seasonally and interannually. An oxygen minimum zone (100–700 m) dampened organic carbon flux attenuation (b = −0.538) to the abyss. Abyssal seafloor organic matter dynamics showed more homogenous conditions in 2020–2021 (TOC = 0.57 ± 0.05%) than in 2022 (TOC = 0.42 ± 0.19%). Bioturbation rate and mixed-layer depth decreased from 2020 to 2022, while oxygen consumption increased at 0–1 cm bsf. Lipid consumption and compositional alteration in 2022 surpassed 2020–2021. Our findings provide critical baseline data to inform environmental impact assessments and monitoring programmes for deep-sea mining of polymetallic nodules in NORI-D.

1. Introduction

The biological pump produces particulate organic matter (POM) that serves as food and energy for a vast network of organisms and biogeochemical processes [1,2]. The net POM flux that leaves the surface ocean via gravitational settling, physical mixing, and vertical zooplankton migration and survives remineralisation comprises the export production [3]. Remineralisation processes recycle POM across the water column and upper sediment layers while food and energy availability decrease [4,5]. A small POM fraction escapes remineralisation, which results in a long-term POM sink at the seafloor [6,7].
Deep-sea regions predominantly rely on epipelagic primary productivity to supply POM to the abyssal seafloor [8,9]. Land-derived organic matter only contributes a minor input to abyssal settings [10]. The export flux to the abyss attenuates in a somewhat predictable manner as POM sinks through the water column [4,11]. Furthermore, it can fluctuate both spatially and temporally due to natural physicochemical variability that impacts epipelagic primary productivity and POM redistribution [12,13,14]. Thus, abyssal benthic ecosystems function on a limited, patchy, and intermittent POM supply [15,16].
Deep-sea regions account for a disproportionately huge fraction of seafloor area and, thus, they comprise an important component of the global carbon cycle [16,17]. The Equatorial Pacific has attracted significant interest to unravelling organic matter cycling from primary productivity in the surface ocean to burial at the abyssal seafloor (e.g., [18,19,20,21,22,23,24]). These studies revealed complex links between pelagic primary productivity and benthic organic matter recycling. They have shown that seasonality and interannual climate variability (e.g., El Niño Southern Oscillation, ENSO [25,26]) impact primary productivity rate, export production, and the timing of benthic ecosystem response to POM input flux. Furthermore, they found that a mismatch often occurs between POM export and seafloor organic matter remineralisation. Such a mismatch suggests that abyssal seafloor ecosystems can experience periods of pulse POM deposition that enable benthic biota and diagenetic processes to persist through times of low sedimentary POM flux [18,19,20,21,22,23,24].
The Clarion-Clipperton Zone (CCZ) covers 6 million km2 (0–20° N, 115–155° W) in the North Tropical Pacific Ocean. The CCZ’s seafloor hosts vast deposits of polymetallic nodules in an area beyond national jurisdiction [27]. With the commercial exploitation of these valuable resources for key elements (e.g., nickel, copper, cobalt, and manganese) approaching a reality in the near future [28,29], environmental concerns have emerged about the ecosystem impacts that deep-sea mining (DSM) will cause to the marine environment [30,31]. However, one can only objectively assess future DSM impacts if they fully understand the natural characteristics of pelagic and benthic ecosystems. Furthermore, one must discern both spatial heterogeneity and temporal fluctuations that result from natural variability. Only then can they inform baseline conditions that will enable environmental impact assessment (EIA) and monitoring programmes for DSM [32,33].
Currently, CCZ-scale [34,35,36] and regional-scale [37,38] studies lack sufficient details to resolve organic matter cycling from the sea surface to the seafloor (e.g., [22]) at a local scale to support EIA for DSM. However, studies that focused on the eastern CCZ in the past decade have contributed to elucidating benthic organic matter dynamics and diagenetic processes (e.g., [37,38,39,40,41,42,43,44,45]). These studies revealed that seafloor heterogeneity impacts benthic POM deposition and recycling. They also quantified organic matter remineralisation rate, revealed that aerobic processes prevail in the upper seafloor layers, and showed that oxic conditions extend hundreds of centimetres below the seafloor [37,38,39,40,41,42,43,44,45]. However, the natural range of variability of such processes remains poorly constrained and requires further investigation.
In July 2011, the International Seabed Authority (ISA) granted Nauru Ocean Research Inc. (NORI) an exploration licence for the NORI D contract area (NORI-D). In the past 15 years, NORI-D has undergone extensive investigation to characterise its physical, chemical, geological, and biological features [46]. Following the ISA’s guidelines at the time [47], we developed a systematic biogeochemical study between 2019 and 2022 to describe physicochemical and biogeochemical dynamics across NORI-D [46] (Table 1). We compiled continuous satellite-derived timeseries (2019–2022) for epipelagic primary productivity and export production over NORI-D. We also investigated interannual water column physicochemical characteristics across five offshore campaigns (C4A, C4D, C4E, C5B, and C5C). Furthermore, we quantified time-integrated (October 2019 to July 2022) sediment trap-derived POM export and flux to the abyssal seafloor. Moreover, we investigated benthic organic matter and sediment physical characteristics in the upper seafloor layers at three dedicated seafloor offshore campaigns (C5A, C5D, and C7A) in NORI-D (Table 1).
Here, we summarise a multi-year (2019–2022) characterisation of physicochemical and biogeochemical dynamics in NORI-D. Our main goals are to establish natural ranges of variability in such processes and to delineate baseline conditions in NORI-D that will support EIA and monitoring programmes for DSM of polymetallic nodules. We specifically aim (1) to quantify annual net primary productivity and export production, (2) to investigate interannual variability in water column temperature, salinity, and dissolved oxygen, and (3) to assess interannual patterns of benthic organic matter transformation. We hypothesise that pelagic organic matter dynamics fluctuate on a (inter)annual basis and, thus, benthic processes can vary on short timescales in NORI-D.

2. Materials and Methods

2.1. Study Area

2.1.1. Regional Description

The Eastern Tropical Pacific (ETP) displays strong thermohaline stratification and a marked oxygen minimum zone (OMZ) that lies beneath a sharp pycnocline [48,49,50]. The OMZ vertical onset fluctuates seasonally and interannually due to variations in primary productivity and pycnocline displacement [48,50]. NORI-D is situated in the 10° N Thermocline Ridge (10°NTR). The 10°NTR displays relatively high nutrient availability in the euphotic zone, low but significant nitrogen fixation rate, and a seasonal cycle in primary productivity with greater chlorophyll concentration in boreal winter than boreal summer [49].
Surface sediment has a mean total organic carbon (TOC) of 1.2 ± 0.7% in the ETP. TOC content range from around 5% in the high-productivity eastern near-shelf areas to less than 0.5% to the west offshore [16]. Mean particulate organic carbon (POC) rain rate ranges to 2.34 g C m−2 yr−1 in the ETP [51] and 1.59 g C m−2 yr−1 in the eastern CCZ [34].

2.1.2. Site Description

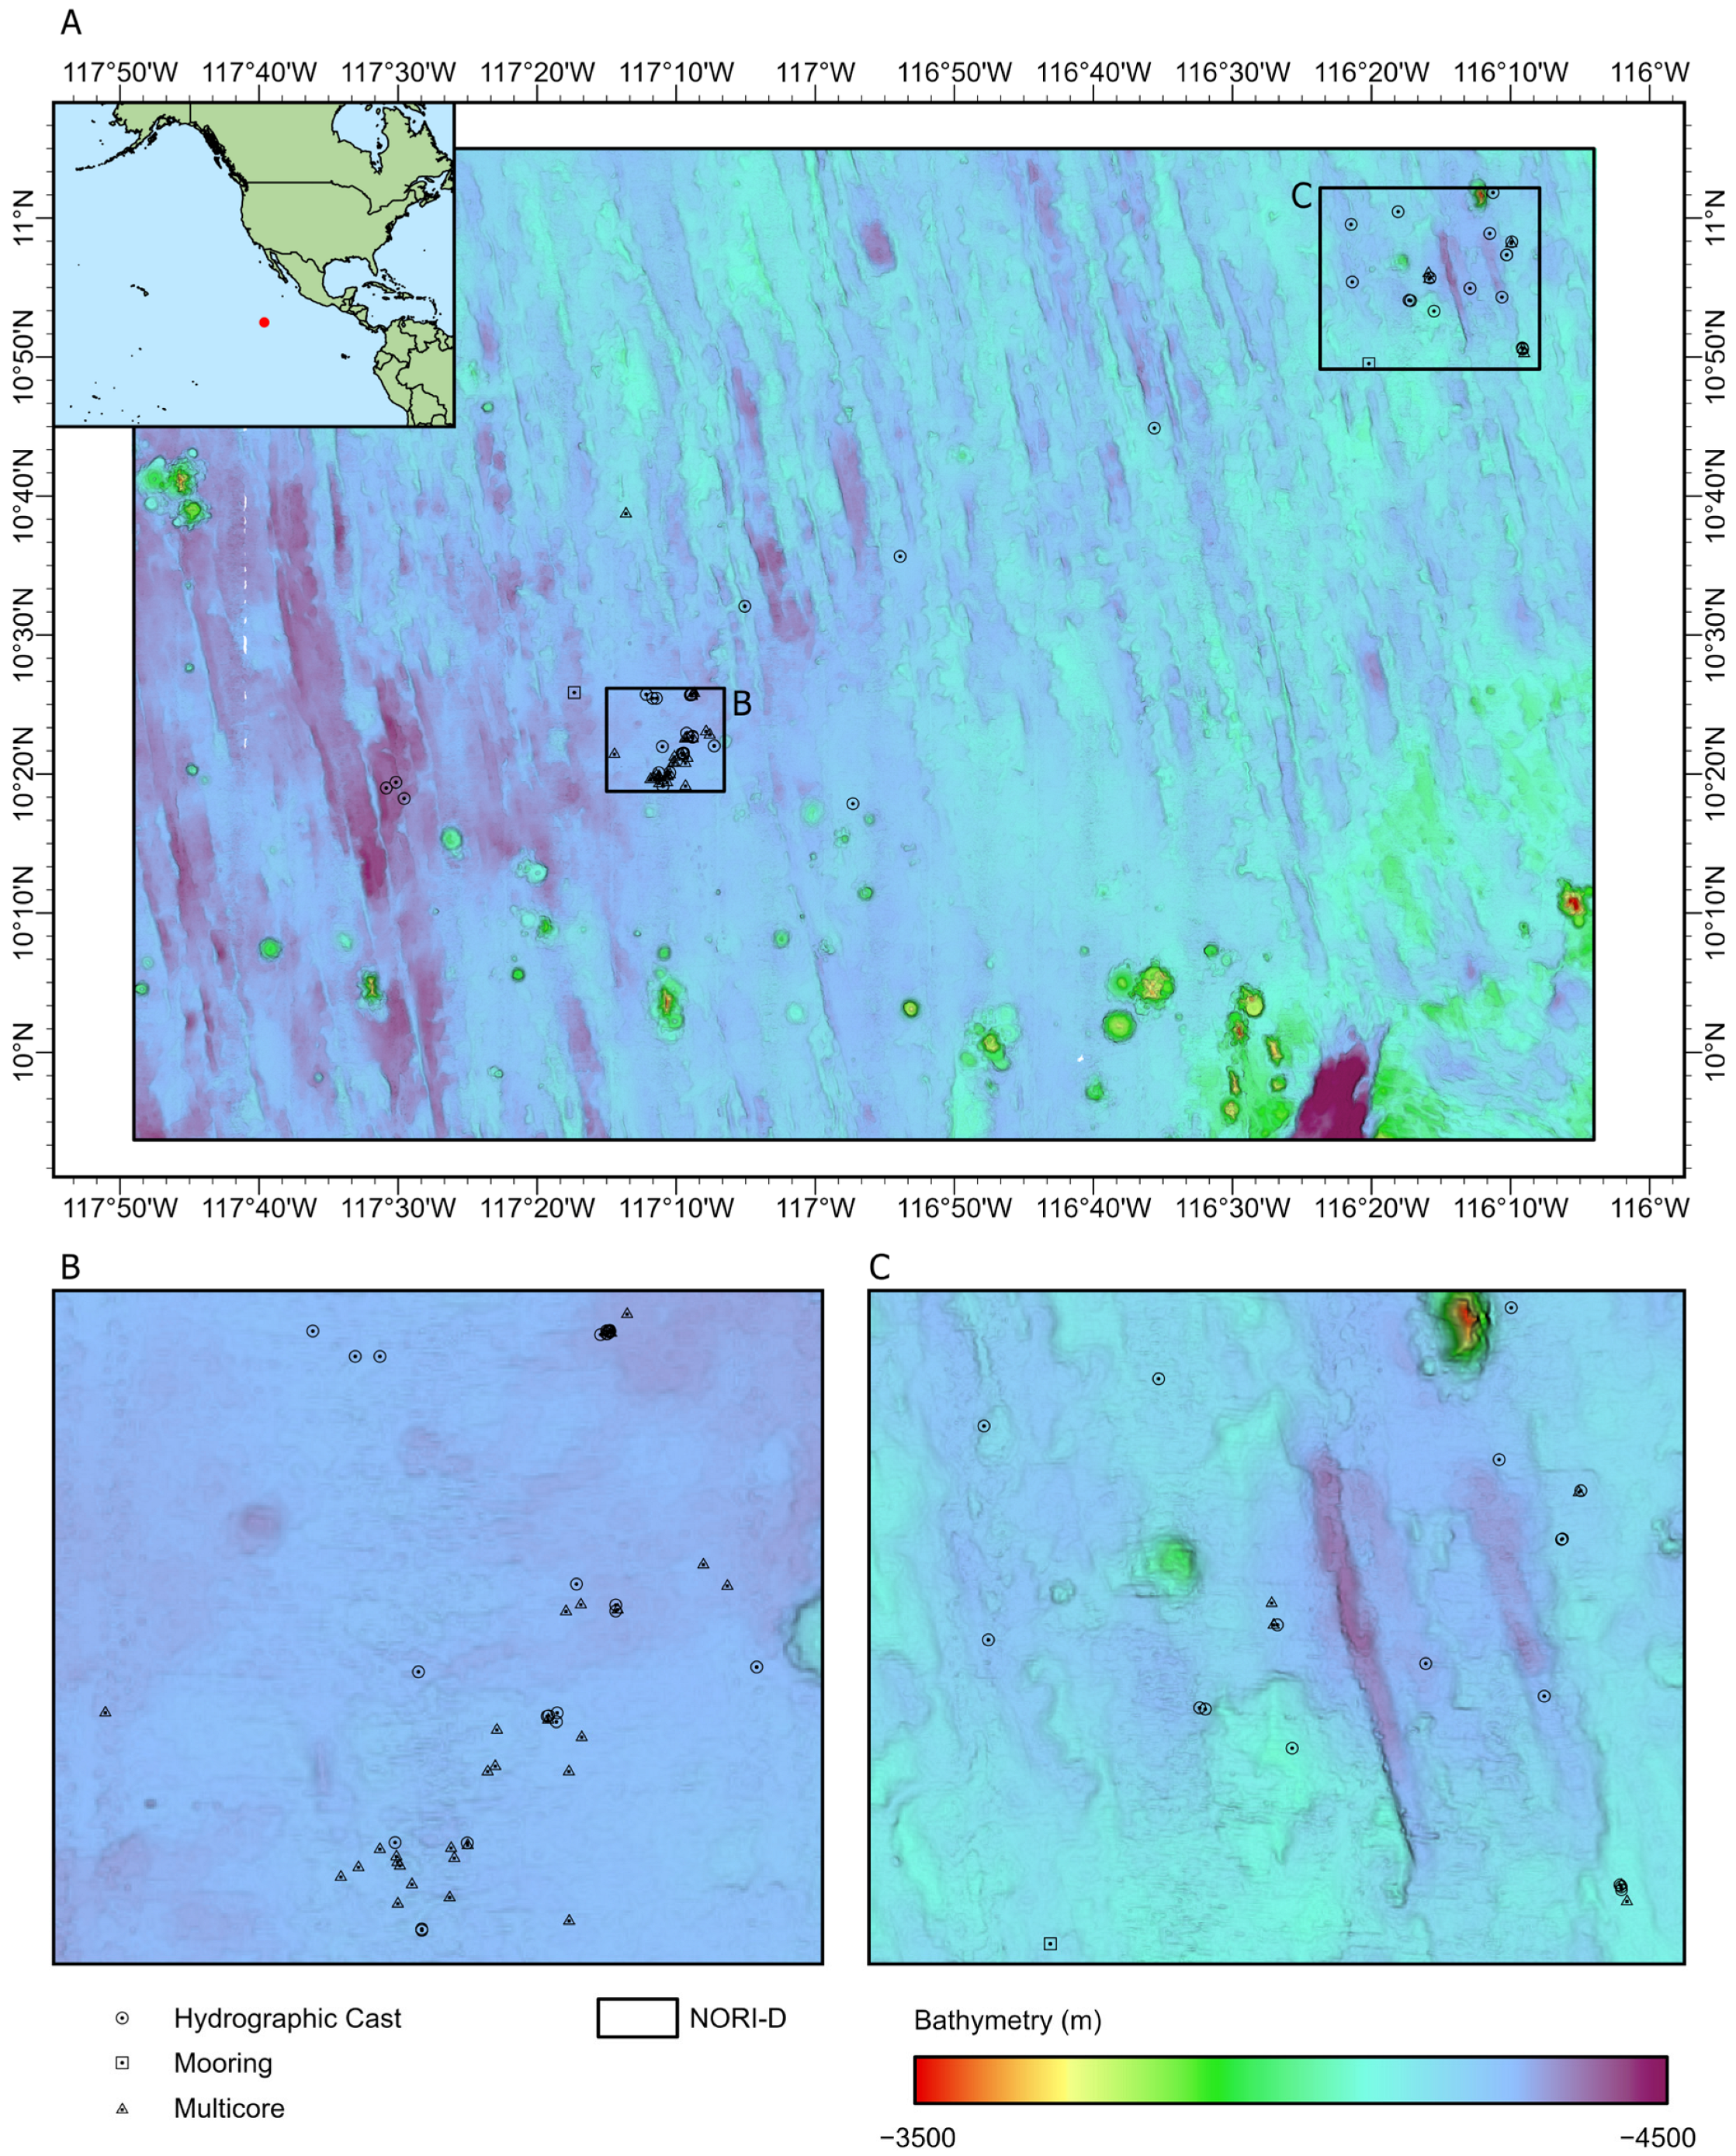
NORI-D covers 25,181 km2 in the Southeast CCZ at around 9.895–11.083° N, 116.067–117.817° W, with a mean 4230 m water depth (Figure 1) [46]. It hosts many habitat types including hills, slopes, and flatter areas. Flatter areas represent the most common topographic feature in NORI-D, particularly in the central portion. A series of NNW–SSW trending abyssal hills occur in the north and northeast portions. A few volcanic knolls extend through the southern portion of NORI-D, rising up to 800 m above the seafloor.
The surface sediment mainly consists of radiolarian oozes and typical abyssal silty clay [52]. The top sediment layer displays a dark brown colour underlain by light brown sediment due to a change in manganese oxide content that decreases with depth [42]. The TOC content in NORI-D’s surrounding area falls in the range of 0.4–0.6% [37,38,39,40]. Furthermore, the surface sediment displays predominantly oxic conditions and the oxygen penetration depth exceeds a hundred centimetres [43]. Polymetallic nodules occur ubiquitously at the sediment surface in NORI-D. The flatter areas display a relatively dense cover of predominantly small (1–10 cm) nodules. Larger nodules (5–20 cm) occur more sparsely and with lower frequency, typically within depressions and on hill crests [53].

2.2. Satellite-Based Net Primary Productivity and Export Production

We retrieved publicly available satellite-derived phytoplankton net primary production (NPP) data sets from the Oregon State Ocean Productivity (http://orca.science.oregonstate.edu/npp_products.php, accessed on 17 December 2024). We processed the NPP data according to Ryan-Keogh et al. [54]. These data sets were derived from the European Space Agency Ocean Colour Climate Change Initiative (OC-CCI) [55] and five commonly used NPP algorithms at a temporal resolution of 8 days, and a spatial resolution of approximately 25 km. Here, we focused on the carbon-based production model (CbPM) from Westberry et al. [56].
We calculated both annual mean NPP (2015–2022) for the ETP from the 8-day-resolution data sets and the annual anomalies in NPP from 2019 to 2022 relative to a climatology generated between 2015 and 2022 on a per-pixel basis. Furthermore, we calculated monthly mean NPP for the NORI-D and ETP whilst accounting for differences in the pixel areas (assuming the Earth is an ellipsoid). Moreover, we obtained the Ocean Niño Index (ONI) product [57] over 2019–2022 to qualitatively assess ENSO temporal shifts.
We modelled export production at 100 m depth in NORI-D from 2019 to 2022. We calculated monthly export production rate following Henson et al. [58] using CbPM’s NPP and sea surface temperature from the European Space Agency Climate Change Initiative (v2.1) [59,60], which we re-gridded to the same monthly resolution of approximately 25 km.

2.3. Offshore Campaigns

NORI commissioned 11 baseline environmental campaigns in NORI-D. Subcontractors collected and analysed environmental samples on behalf of NORI [46]. Here, we address 8 campaigns that targeted physicochemical and biogeochemical characterisations (Table 1 and Figure 1). We employed a suite of platforms to study the full-depth water column for temperature, salinity, dissolved oxygen (Table S1), and POC flux (Tables S2–S5). Furthermore, we collected undisturbed sediment cores that spanned the top 0–20 cm seafloor layers (Appendix A.2) to quantify porewater oxygen micro profiles, benthic organic matter content (bulk and compound-specific composition), radionuclide activity and vertical distribution, bioturbation rate, and sediment physical properties (Tables S6–S8).

2.3.1. Water Column

Fifty-six hydrographic casts occurred across campaigns C4A, C4D, C4E, C5B, and C5C (Table S1). They comprised rosette samplers fitted with factory-calibrated conductivity, temperature, depth (CTD) and dissolved oxygen (DO) sensors (Seabird SBE 43 DO). C4A, C4D, and C4E employed a Seabird SBE 19plus CTD sensor and C5B and C5C employed a Seabird SBE 911plus CTD sensor. Hydrographic casts recorded full-depth profiles of temperature, salinity, and dissolved oxygen during descent at 0.5 s interval and constant speed. Hydrographic casts in C4D extended to 2000 m. The data processing used the SBE Data Processing V7.26.7 following standard procedures. It included sensor alignment and automated de-spiking. The downcast data sets were extracted and binned into 1 m intervals. Data from 0–10 m below sea level were discarded as they recorded the initial CTD deployment which would make the measurements unreliable.
Long-term physical oceanographic monitoring was conducted in NORI-D using two mooring arrays [46]. Each mooring housed a Seabird SBE 43 DO sensor at approximately 5 m above seafloor (asf), which recorded continuous bottom water dissolved oxygen concentration. The moorings also house McLane 78H sediment traps. The long mooring (LM) had one sediment trap at 2008 m below sea level (LM-2000) and another at approximately 500 m asf (LM-500). The reference mooring (RM) had a sediment trap at approximately 500 m asf (RM-500). Sediment traps contained 20 polycarbonate bottles (1 L) fitted to an automated time-controlled carousel (8–21-day intervals, Tables S3–S5). Each bottle contained 5% formalin solution buffered with sodium borate (pH 8.0–8.5). The mooring monitoring spanned October 2019–July 2020 (C4A–C4D), July 2020–July 2021 (C4D–C4E), and July 2021–August 2022 (C4E–C7A) (Table S2). The LM-2000 sampling ended in July 2021. The LM-2000 and LM-500 collected 196-day samples (13 December 2019 to 26 June 2020) due to technical issues. The RM-500 did not collect samples between 11 April 2020 and 2 July 2020 (Tables S3–S5).

2.3.2. Seafloor

The seafloor monitoring employed an Oktopus MC20 multicorer (1.9 m × 1.9 m × 1.7 m) to collect undisturbed upper seafloor layers in 33 sites across C5A, C5D, and C7A (Table S6). The multicorer held 20 sampling Perspex tubes (60 cm in length and 9.6 cm internal diameter). The cores assigned to porewater sampling had pre-drilled holes (0.5 cm interval) covered with tape. All cores underwent quality control after recovery (Appendix A.2).
The core sample processing occurred in a temperature-controlled laboratory (4–10 °C). Bulk organic matter and biomarker cores had porewater extracted (acid-clean Rhizons) prior to slicing. Sediment physical properties and radionuclides used bulk core samples. Each core was sequentially sliced from sediment surface to a minimum of 20 cm bsf (Table S8). All frozen sediment samples (−20 °C) were shipped to the University of Leeds.
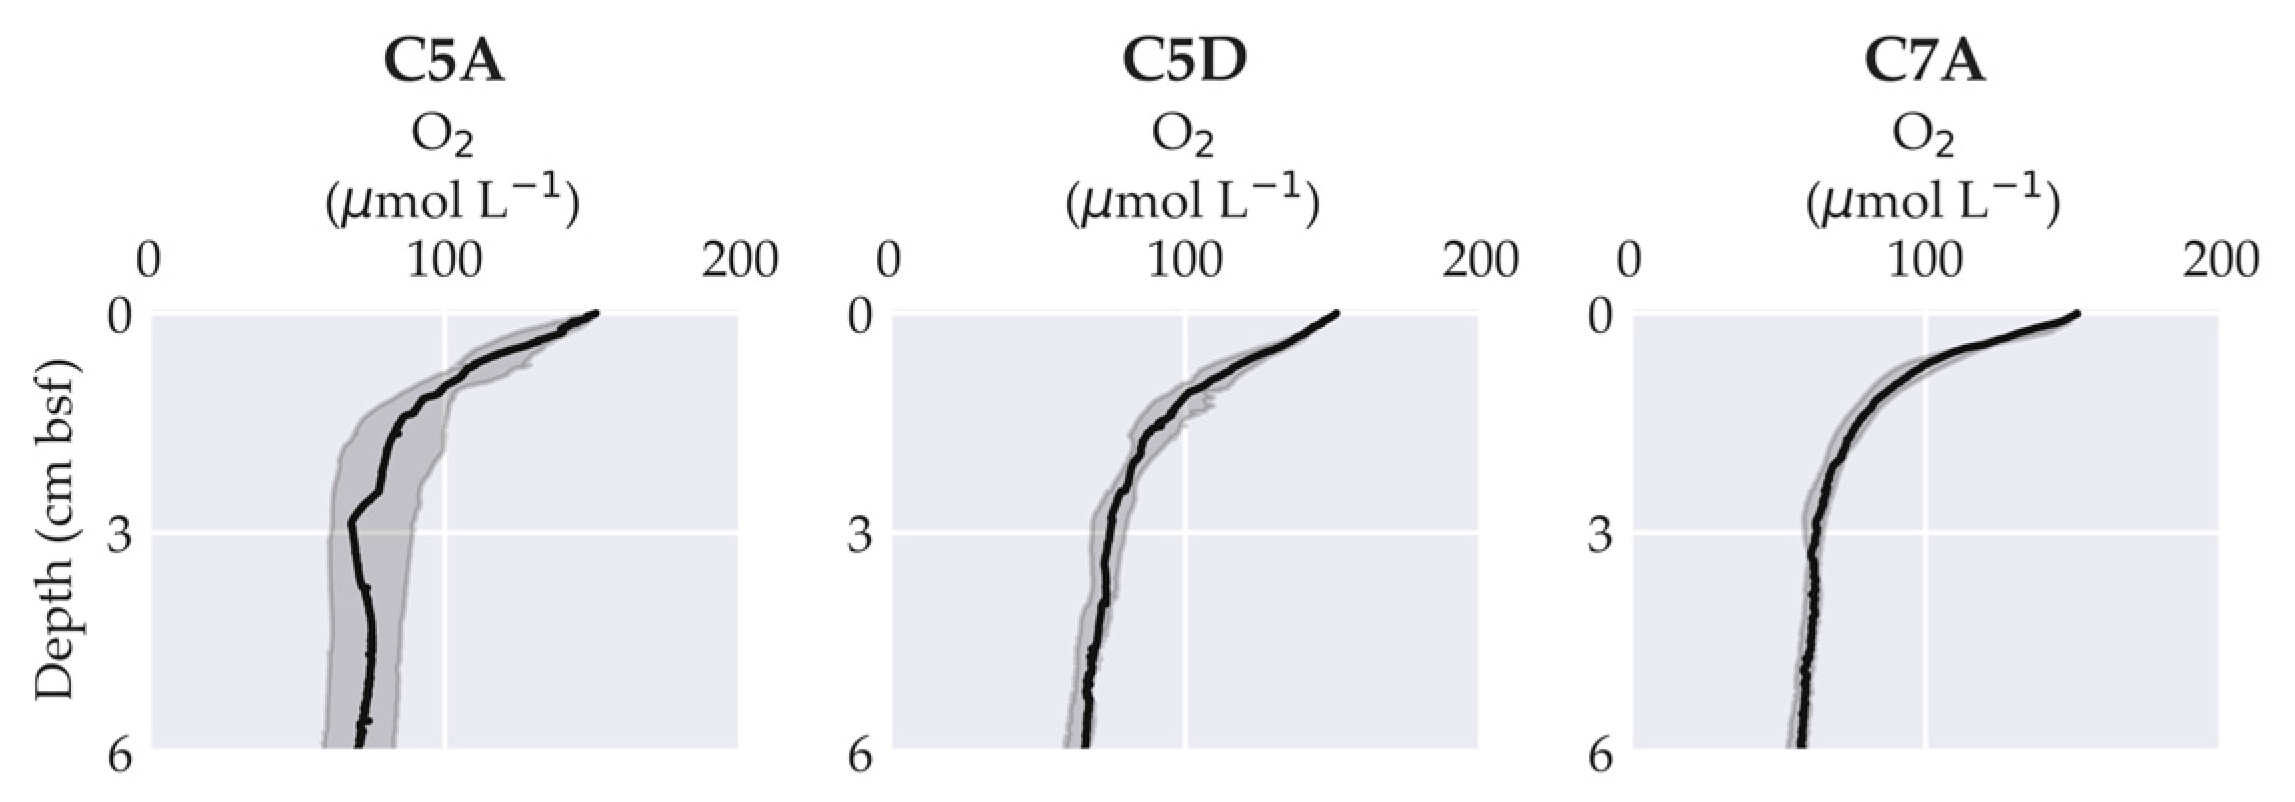
Ex situ porewater oxygen micro profile analyses used pre-calibrated (100% air-saturated seawater and sodium sulphite-saturated seawater) glass micro electrodes (Unisense) fitted to a motorised micro profiler and connected to a two-channel picoammeter (PA 2000). The system directly recorded data using Profix (Unisense). Cores equilibrated with ambient conditions in the cold laboratory prior to analyses (Tables S7 and S8). At least three micro profile readings occurred from sediment surface to 7–10 cm bsf at a 100 µm resolution. We normalised ex situ oxygen concentration using the three-year in situ moorings’ mean bottom water concentration (151.1 µmol L−1 [61]). We present average oxygen concentration profiles from multiple measurements for each core. We only use oxygen micro profiles to assess oxygen vertical distribution and penetration depth. We refrain from calculating oxygen diffuse flux to avoid errors that occur due to sampling artefacts (e.g., [62]).

2.4. Particulate Matter Analyses

2.4.1. Sinking Particulate Matter

Sediment trap sample analyses followed routine procedures at the University of South Carolina. A precision rotary splitter divided samples into four equal parts. To assess total mass flux, an aliquot was freeze-dried and weighed using a micro-balance. POC and particulate nitrogen (PN) content was determined on subsamples treated with 1 N phosphoric acid using a Perkin Elmer 2400 Elemental Analyser (Perkin Elmer, Shelton, CT, USA) [63]. Biogenic silica (BSi) content was quantified following the wet chemical leaching technique using a Beckman Coulter DU 640 Spectrophotometer (Beckman Coulter, Inc., Brea, CA, USA) [64]. Particulate inorganic carbon (PIC) content was determined with an automated acid digestion [65]. POM flux was estimated by multiplying the POC flux by a factor of 1.8 [66]. The lithogenic matter flux was determined by subtracting the cumulative flux of PIC, BSi, and POM flux from the total mass flux.
We calculated mean total mass flux and its relative composition (POM, BSi, PIC, and lithogenic matter) for each sediment trap. We also produced mean POC flux from October 2019 to August 2022 (Tables S3–S5). We applied no additional empirical corrections for hydrodynamic bias, shuttering effects, or trapping efficiency. Previous studies have demonstrated that large conical sediment traps deployed in the bathypelagic open ocean generally provide reliable estimates of vertical particle flux under relatively low-current conditions, whereas trapping biases often occur in shallower mesopelagic deployments [67,68].

2.4.2. Pelagic Particulate Organic Carbon Flux

We integrated sediment trap POC flux with satellite-derived export production rate to evaluate annual vertical POC flux in NORI-D. We employed the Martin curve [11]:
F z = F 0 ( z z 0 ) b
where Fz represents the POC flux at any given depth, F0 denotes the vertical flux at a reference depth, z0 denotes the arbitrary reference depth, z stands for depth measured in metres, and exponent b corresponds to the remineralisation parameter that describes the strength of vertical flux attenuation (i.e., the slope on a log–log scale) [11].
Here, F0 corresponds to the export production rate in NORI-D, and thus z0 equals 100 m. Satellite-derived export production estimates were resolved at monthly temporal resolution from January 2019 to July 2022, whereas sediment trap deployments integrated POC flux over 10- and 21-day collection intervals. Due to this mismatch, export production estimates were not directly paired with individual sediment trap observations. Instead, both data sets were summarised using mean (min–max) values prior to model fitting.
The export production comprised mean (min–max) monthly export production at 100 m depth, while sediment trap POC flux data comprised mean (min–max) flux measured at 2008, 3703 and 3828 m below sea level (LM-2000, RM-500, and LM-500, respectively). We fitted separate Martin curves to the mean, minimum and maximum vertical flux profiles using nonlinear least squares (NLS) regression. As such, we estimated mean (min–max) POC flux to the seafloor (i.e., 4230 m). We evaluated model performance for the mean Martin curve using root mean square error (RMSE) and residual analysis.

2.5. Sediment Analyses

2.5.1. Sediment Physical Properties

Sediment physical property analyses (Tables S7 and S8) followed routine protocols at the University of Leeds. Porosity and dry bulk density were calculated based on the gravimetric relationship between wet and dry samples [69], using a three-figure scale (Sartorius Quintix 313-1S (Fisher Scientific, Loughborough, UK), 0.001 g; automatic internal calibration). A Beckman Coulter LS230 analyser was used for particle size analyses. It determined 11 size fractions that subsequently composed particle size mean, median, mode, and standard deviation. The particle size analyses comply with the ISO 13300:2020 and standard practices [70].

2.5.2. Radionuclides and Bioturbation

Sediment samples (Tables S7 and S8) were freeze-dried and powdered at the University of Leeds. Approximately 2–4 g was placed in a Petri dish, sealed in polypropylene bags under vacuum conditions, and then shipped to the LAFARA facility (France). LAFARA adheres to the ISO/CEI-17025 methods [71]. Sample dishes were counted for 24 to 48 h on high-purity germanium (HPGe) gamma planar detectors (230cc HPGe Mirion Canberra and 183cc HPGe Ametek Ortec, Mirion Technology, Fussy, France). The facility exhibits a typical background of 0.016 s−1 kg−1 of germanium between 30 and 2800 keV [72]. LAFARA periodically performed procedural blanks on empty sample containers. Furthermore, detector calibration control and background noise checks occurred every two weeks.
Lead-210 (210Pb) and radium-226 (226Ra) activity analyses occurred simultaneously. Apex-Gamma v1.x (Mirion-Canberra, Montigny-le-Bretonneux, France) was used to process the gamma spectrum and to ensure correct peak identification, which were validated against the ISO/CEI-17025. Total 210Pb (210PbTotal) activity was obtained from the 46.5 keV peak. 226Ra activity was obtained from both 214Pb (295 and 351 keV) and 214-bismuth (214Bi; 609 keV). At equilibrium, 226Ra provides supported 210Pb (210PbSupported). As such, we can obtain excess 210Pb (210Pbxs) as [73]
210Pbxs = 210PbTotal210PbSupported
We calculated bioturbation mixing rate (Db) and mixed-layer depth (zb) based on the 210Pbxs activity concentration depth profiles [73]. We assumed that particle mixing followed a diffusive-like process that redistributes 210Pbxs [74] albeit with some non-local mixing [75]. We also assumed that the sedimentation rate in the eastern CCZ (0.20–0.64 cm kyr−1 [37,39]) remains negligible in the 210Pbxs decay timescale [76]. Thus, we express the particle-biodiffusing mixing model [76] as
A = A 0 e x p z λ / D b
where z represents the depth, A denotes the 210Pbxs activity concentration at depth z, and λ expresses the 210Pb decay constant. We fitted each 210Pbxs activity concentration depth profile to Equation (3) to obtain Db using an NLS model. Then, we obtained zb as [77]
z b = D b / λ

2.5.3. Bulk Organic Matter

Analyses of TOC and total nitrogen (TN) content, and their stable isotope composition δ13C-TOC and δ15N-TN, respectively (Tables S7 and S8), followed routine protocols at Iso Analytical Ltd., Crewe, UK. The elemental analysis coupled to isotopic ratio mass spectrometry (EA-IRMS) [78] used a Europa Scientific 20-20 IRMS. TOC and TN analyses showed relative standard deviations of 2% and 0.7%, respectively. δ13C-TOC and δ15N-TN analyses had standard deviations less than 0.07‰ and 0.09‰, respectively.

2.5.4. Lipids

Total lipid extract (TLE) analyses (Tables S7 and S8) followed routine protocols at the University of Liverpool [38]. An aliquot of dry sediment sample was spiked with internal standard 5α-cholestane, solvent-extracted, concentrated, purified, derivatised, and analysed through gas chromatography–mass spectrometry (GC-MS). The GC-MS system comprised a Thermo Fisher Scientific Trace 1300 Series (Thermo Fisher Scientific, Waltham, MA, USA) gas chromatographer coupled to a Thermo Fisher Scientific ISQ LT single quadrupole mass spectrometer. Procedural blank analyses occurred in all analytical batches. Certified material (CRM47885 Supleco 37 component FAME standard) and an in-house mixture (six components sterol and two components alcohol) were also routinely analysed. The data processing used Xcalibur 3.0. Compound identification followed comparisons between mass spectra and relative retention indices with those in the literature and/or certified materials. Compound concentration was calculated based on internal standard peak area relative to the compound of interest based on the total ion chromatogram. The instrumental detection limit was 1 fg [79].
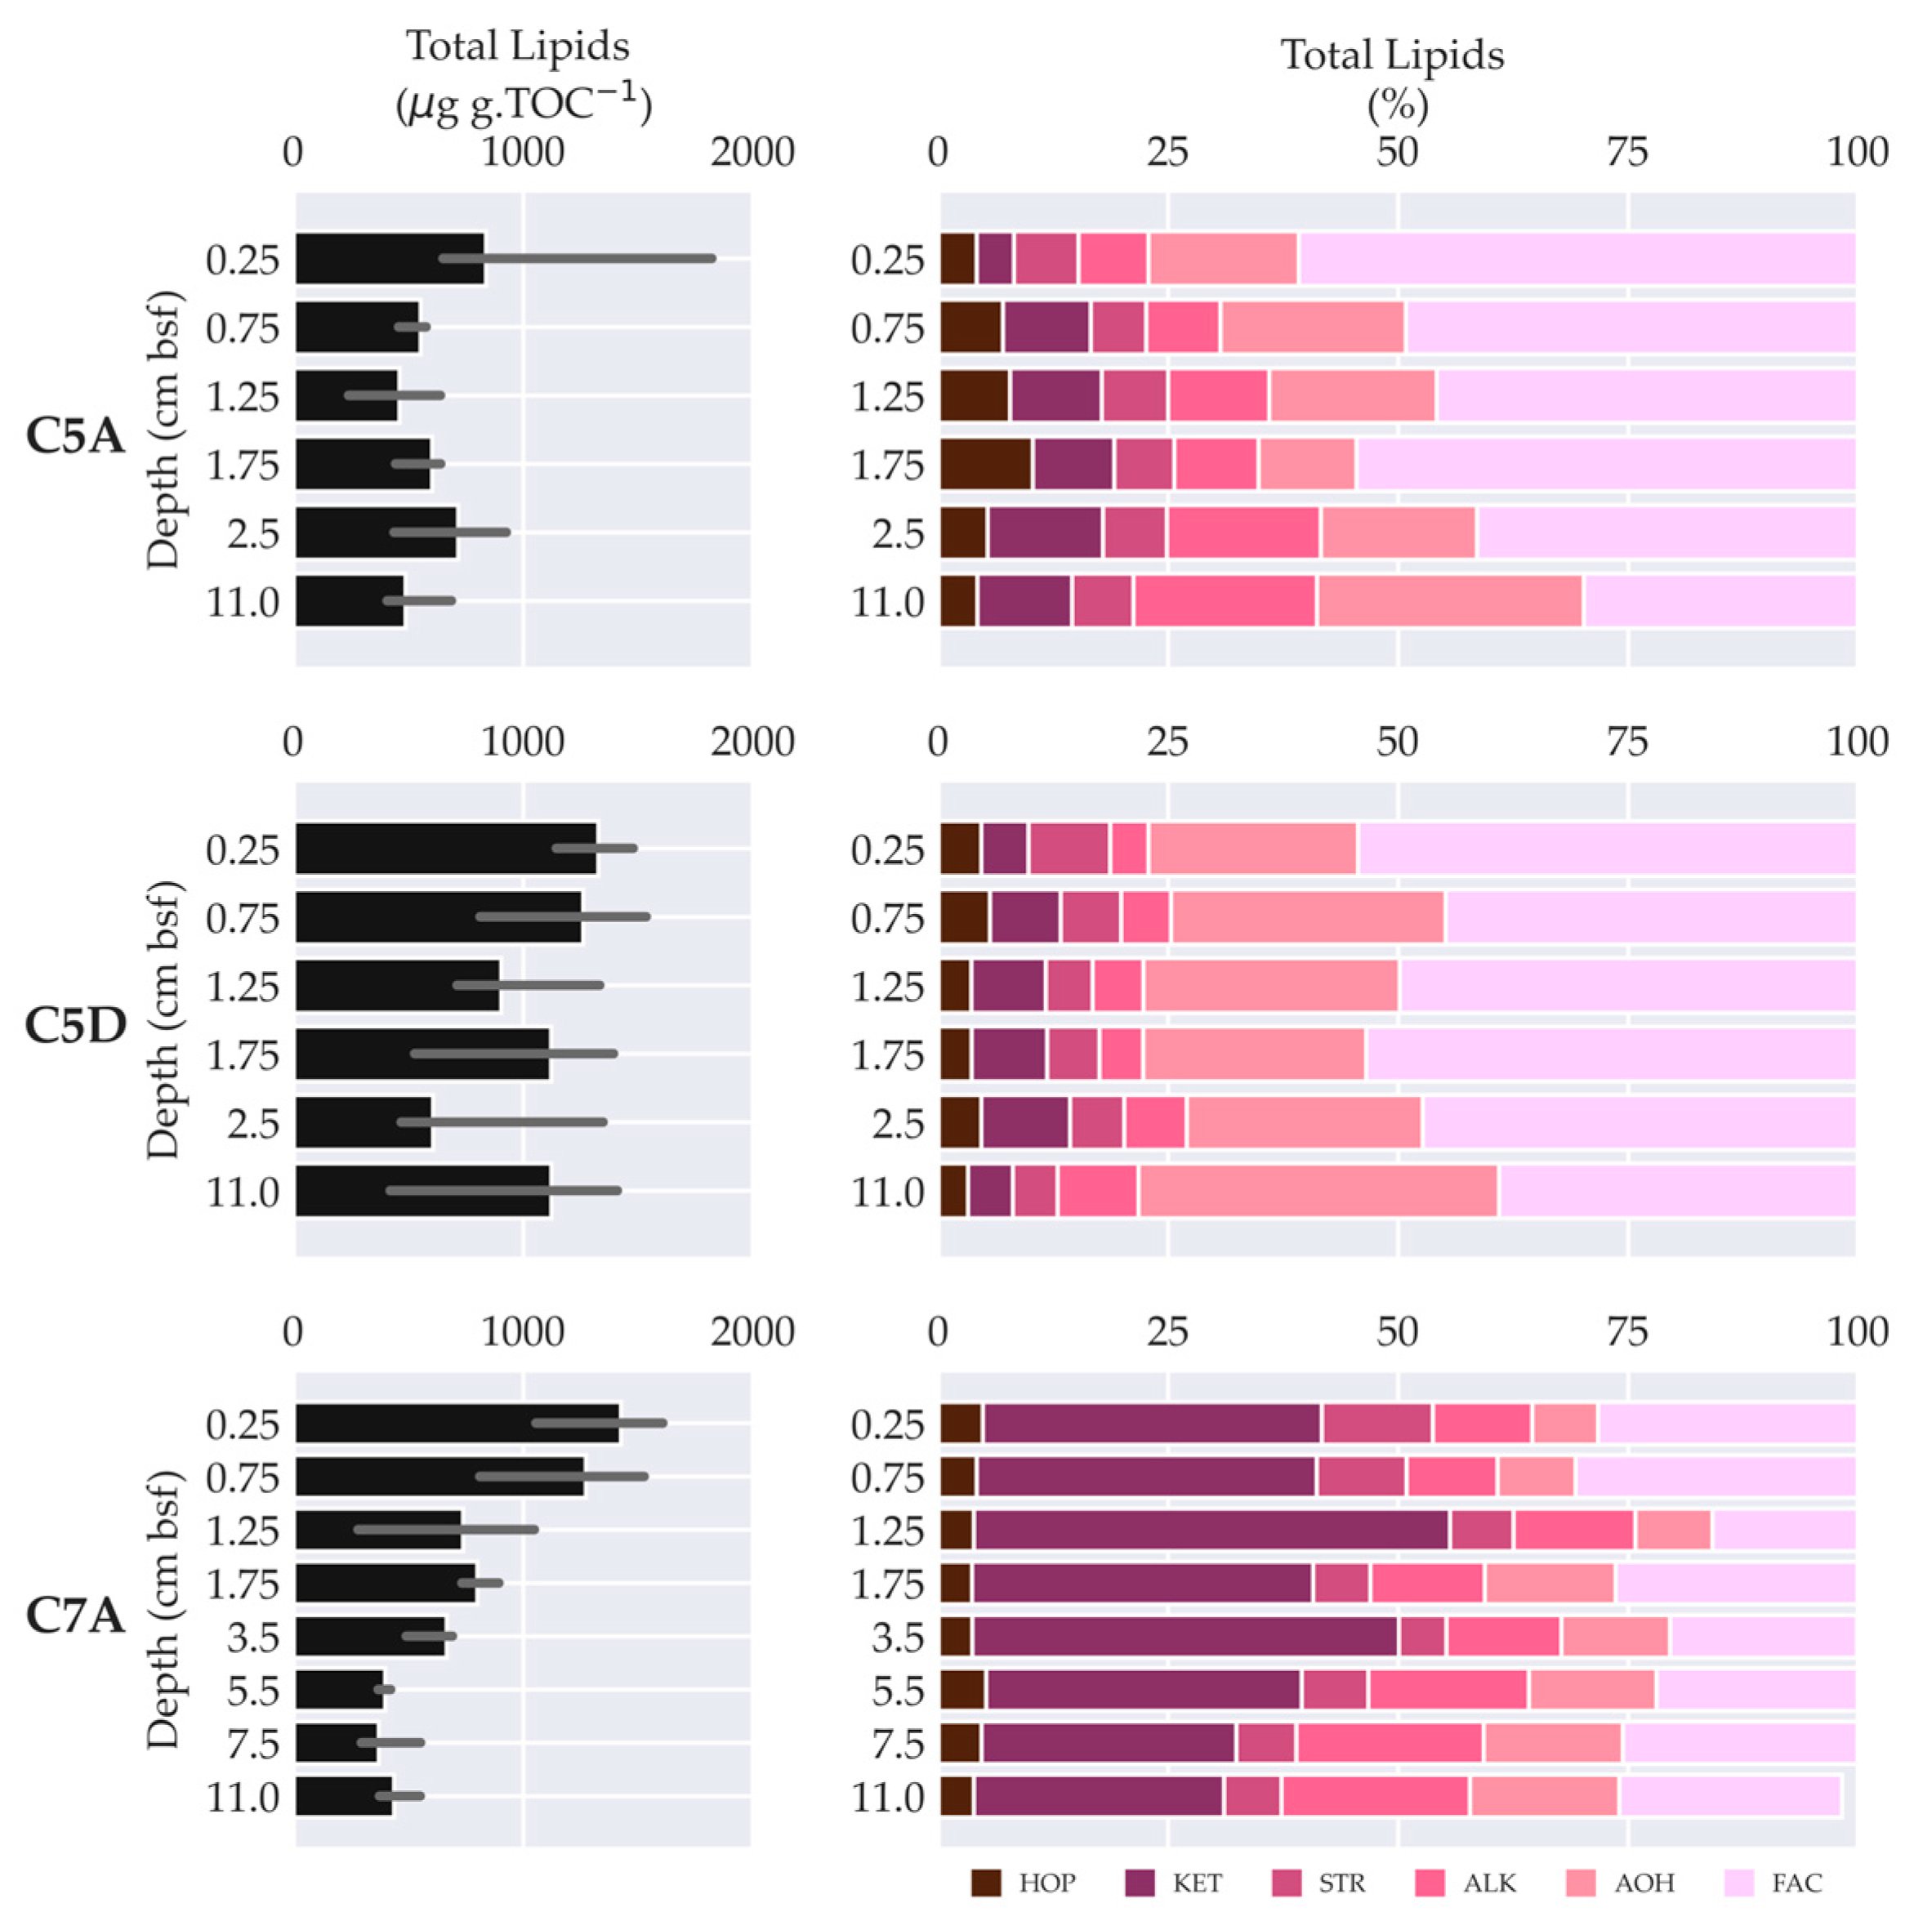
We analysed TLEs in the topmost 0–3 cm bsf and 10–12 cm bsf in C5A and C5D. In C7A, we increased the depth resolution along the 0–12 cm interval (Tables S7 and S8). Here, we address the TLE as total lipids, which represents the sum of all individual compounds. Furthermore, we explore the main compound class relative compositions (i.e., fatty acids, alcohols, n-alkanes, sterols, hopanoids, and long-chain ketones) [79].

2.5.5. Amino Acids

Total hydrolysable amino acid (THAA) analyses (Tables S7 and S8) followed routine protocols at the University of Edinburgh [80]. An aliquot of dry sediment sample was hydrolysed in 6 M hydrochloric acid and derivatised with orthophthaldialdehyde. Subsequently, the sample solutions were injected and analysed via reverse-phase high-performance liquid chromatography with a fluorescence detector (HPLC-F, Agilent 1260 Infinity II, Agilent Technologies Inc., Santa Clara, CA, USA). Procedural blank analyses used de-ionised water to determine blank values. Repeat analyses of samples occurred in each analytical session to verify batch precision. Amino acid quantification used charge-matched internal standards that were added after hydrolysis. Three internal standards were used based on response factors calculated from a standard mix of primary protein amino acids (Supleco AAS-18) and individual non-protein amino acids (Sigma-Aldrich, Merck, Gillingham, UK) [81]. Replicate analyses typically produced relative standard deviation of 9–38% (n = 18). Detection limits were below 0.03 µg g−1 [80].
Here, we present THAA as the sum of all individual (i.e., total) amino acids quantified in each sample hydrolysate. Furthermore, we present the relative molar contribution of each amino acid. We only assessed THAA for a small sample set across the three seafloor campaigns, which covered 0.0–0.5 cm bsf and 10–12 cm bsf (Tables S7 and S8).

2.6. Data Processing and Statistical Analyses

We managed our data sets with the open source Python Programming Language 3.13.5 using Spyder 6.0.7 [82], the data analysis libraries NumPy 2.4.6 [83] and PANDAS 3.0 [84], and the data visualisation libraries Matplotlib 3.10.0 [85] and Seaborn v0.13 [86]. We used Seaborn v0.13 to visualise temporal trends in our data sets while we synthesised the small-scale spatial variability in each time period according to each data set distribution (e.g., median and interquartile).
We implemented our statistical analyses in Python. We used the functions built into PANDAS 3.0 [84] to calculate descriptive statistics (e.g., mean, median, and standard deviation) across our data sets. We used SciPy 1.17.1 [87] and Scikit-learn 1.8 [88] to perform curve fitting analyses and to obtain group- and pair-wise comparisons. We tested data sets for normality (Shapiro–Wilk test) and homogeneity of variances (Levine’s test) at a significance level (p-value) of 0.05. Since our seafloor data sets did not show normal distribution and/or homogenous variance, we performed campaign comparisons using the Kruskal–Wallis test and the post hoc Dunn’s test with Bonferroni correction.
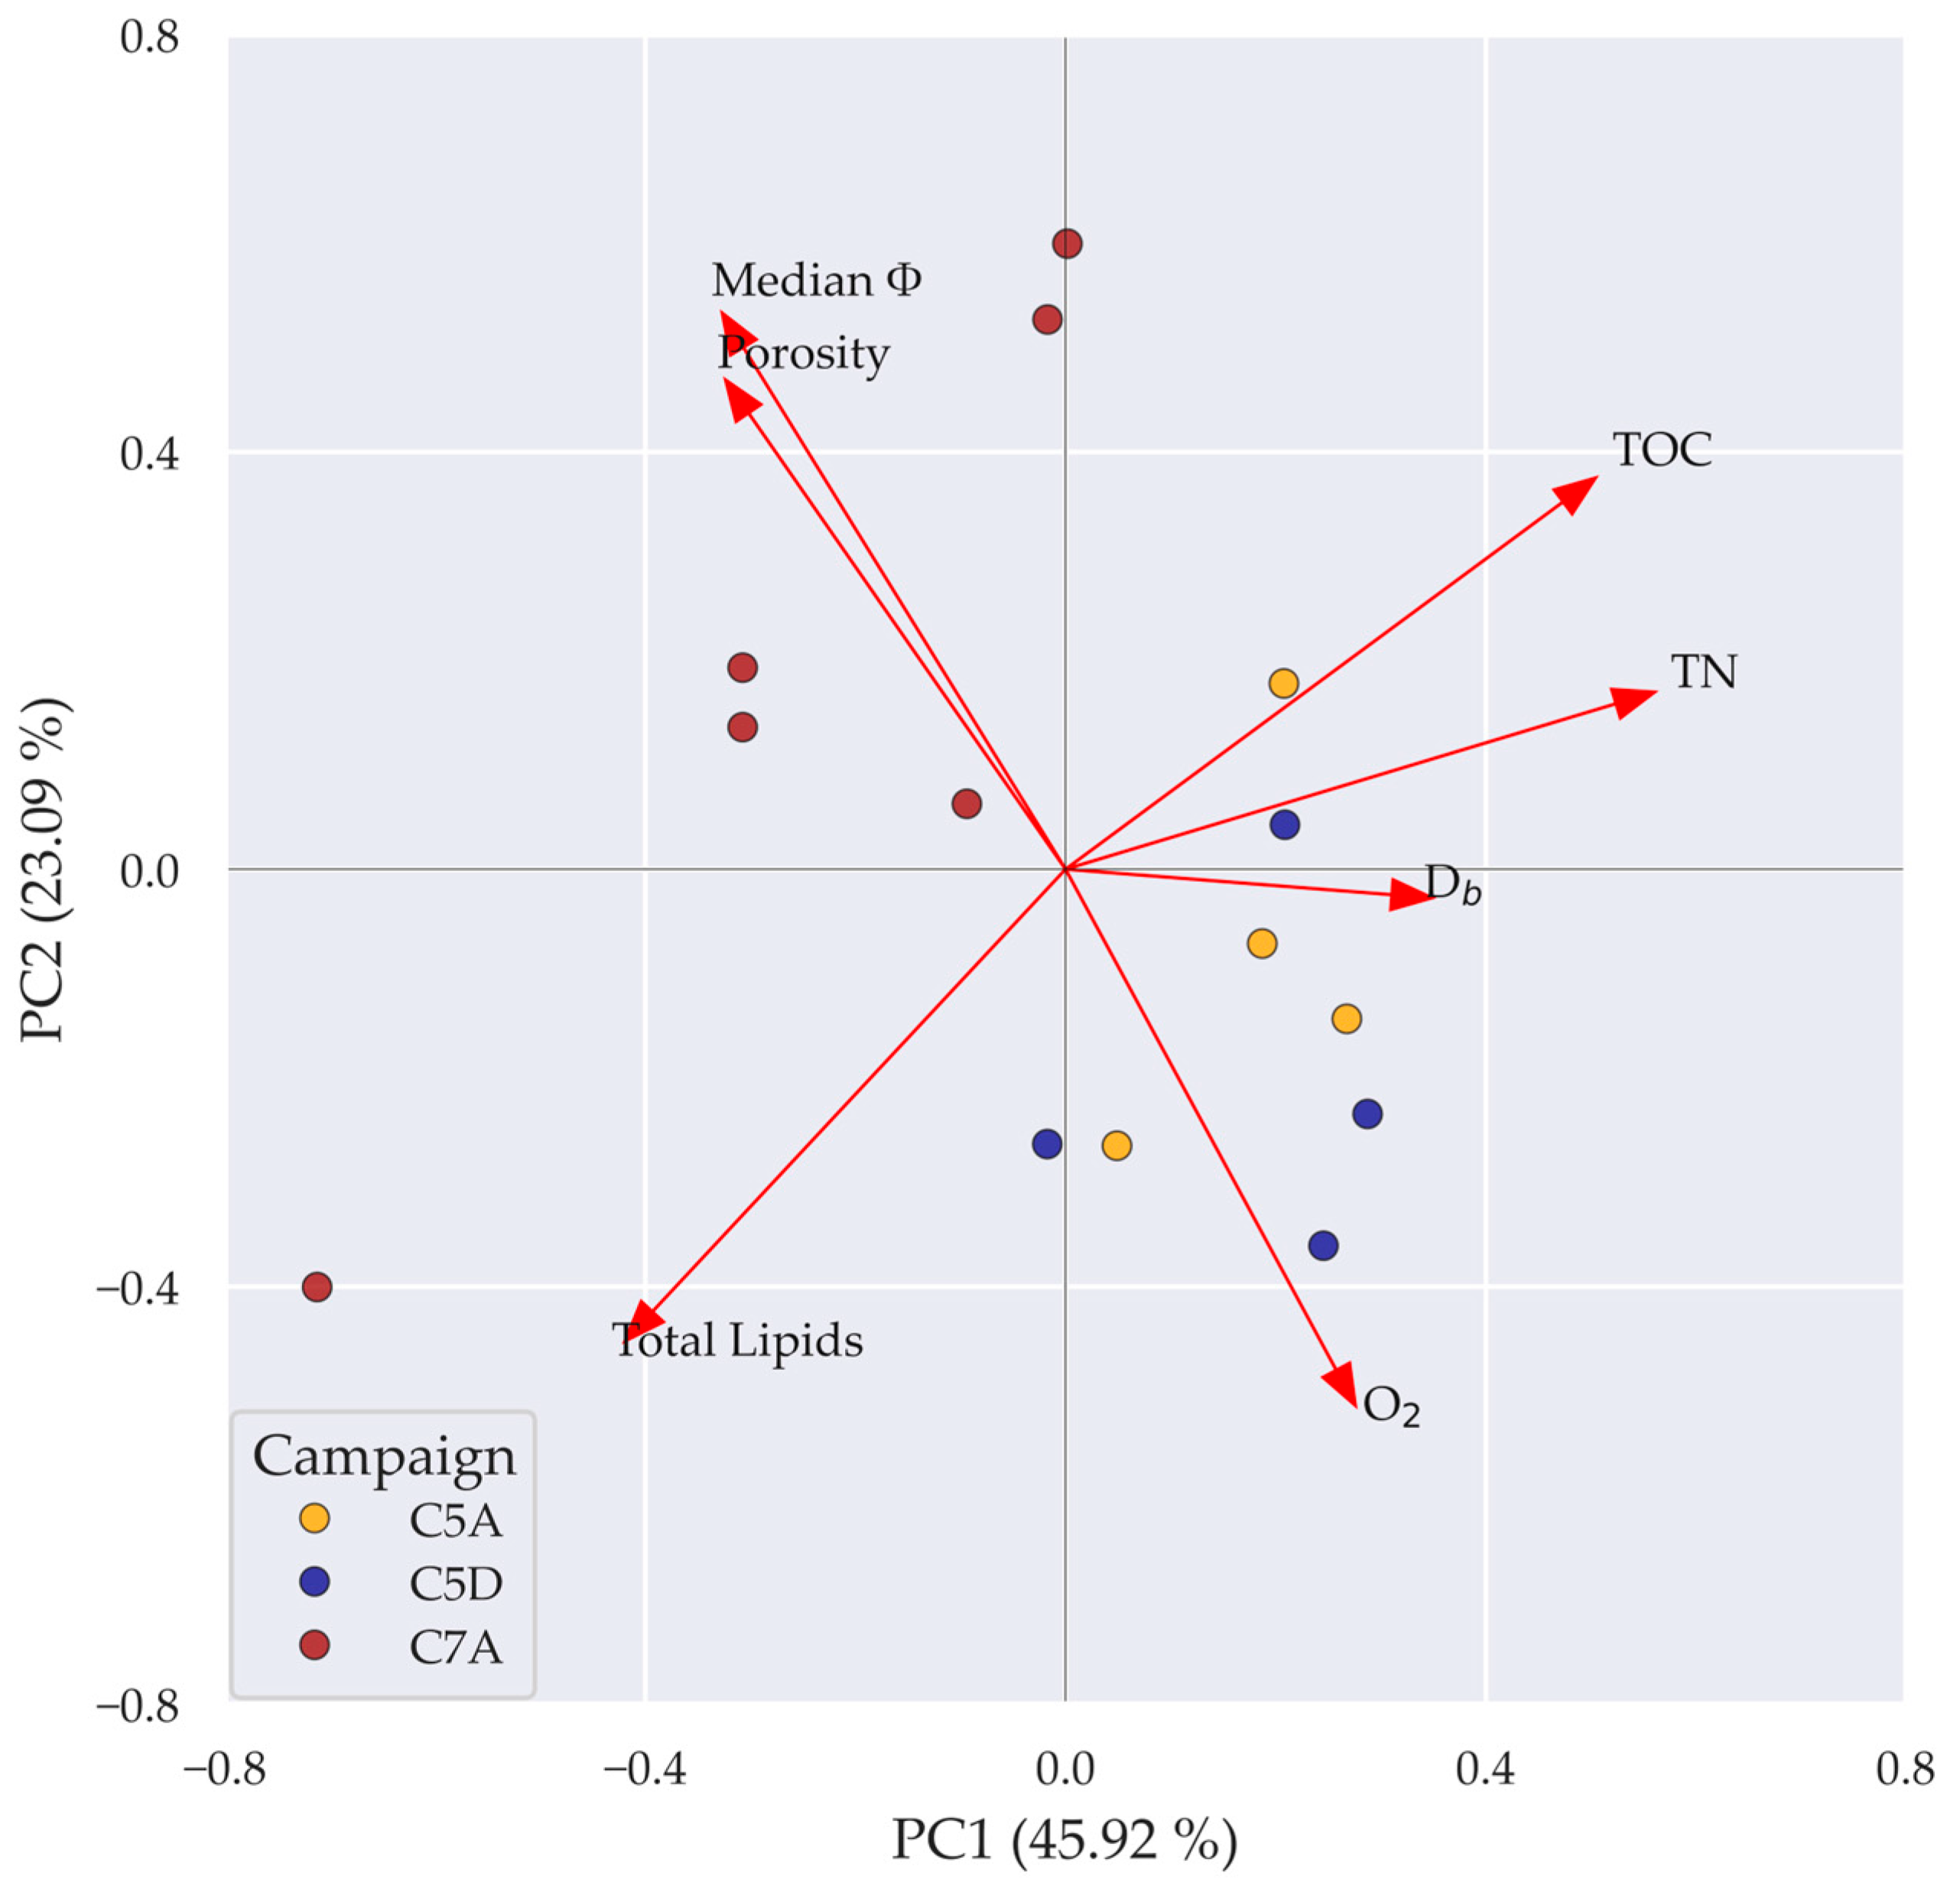
We applied principal component analysis (PCA) with Scikit-learn 1.8 [88] to summarise seafloor temporal trends. The PCA used porewater oxygen’s 0–1 cm slope, Db, and the mean 0–2 cm TOC, TN, total lipids, porosity, and median particle size. We excluded non-independent compositional variables and variables that displayed co-variance. We only included sites that had the full variable set in each campaign (Table S7). The PCA workflow included data standardisation and scaling, data fitting to a two-component PCA, and extraction of variance explanation as built in Scikit-learn 1.8 [88]. The PCA bi-plot shows scaled (min–max scaling factor) PC1 and PC2 scores overlain by variable loadings.

3. Results

3.1. Pelagic Features

3.1.1. Water Column Physicochemical Properties

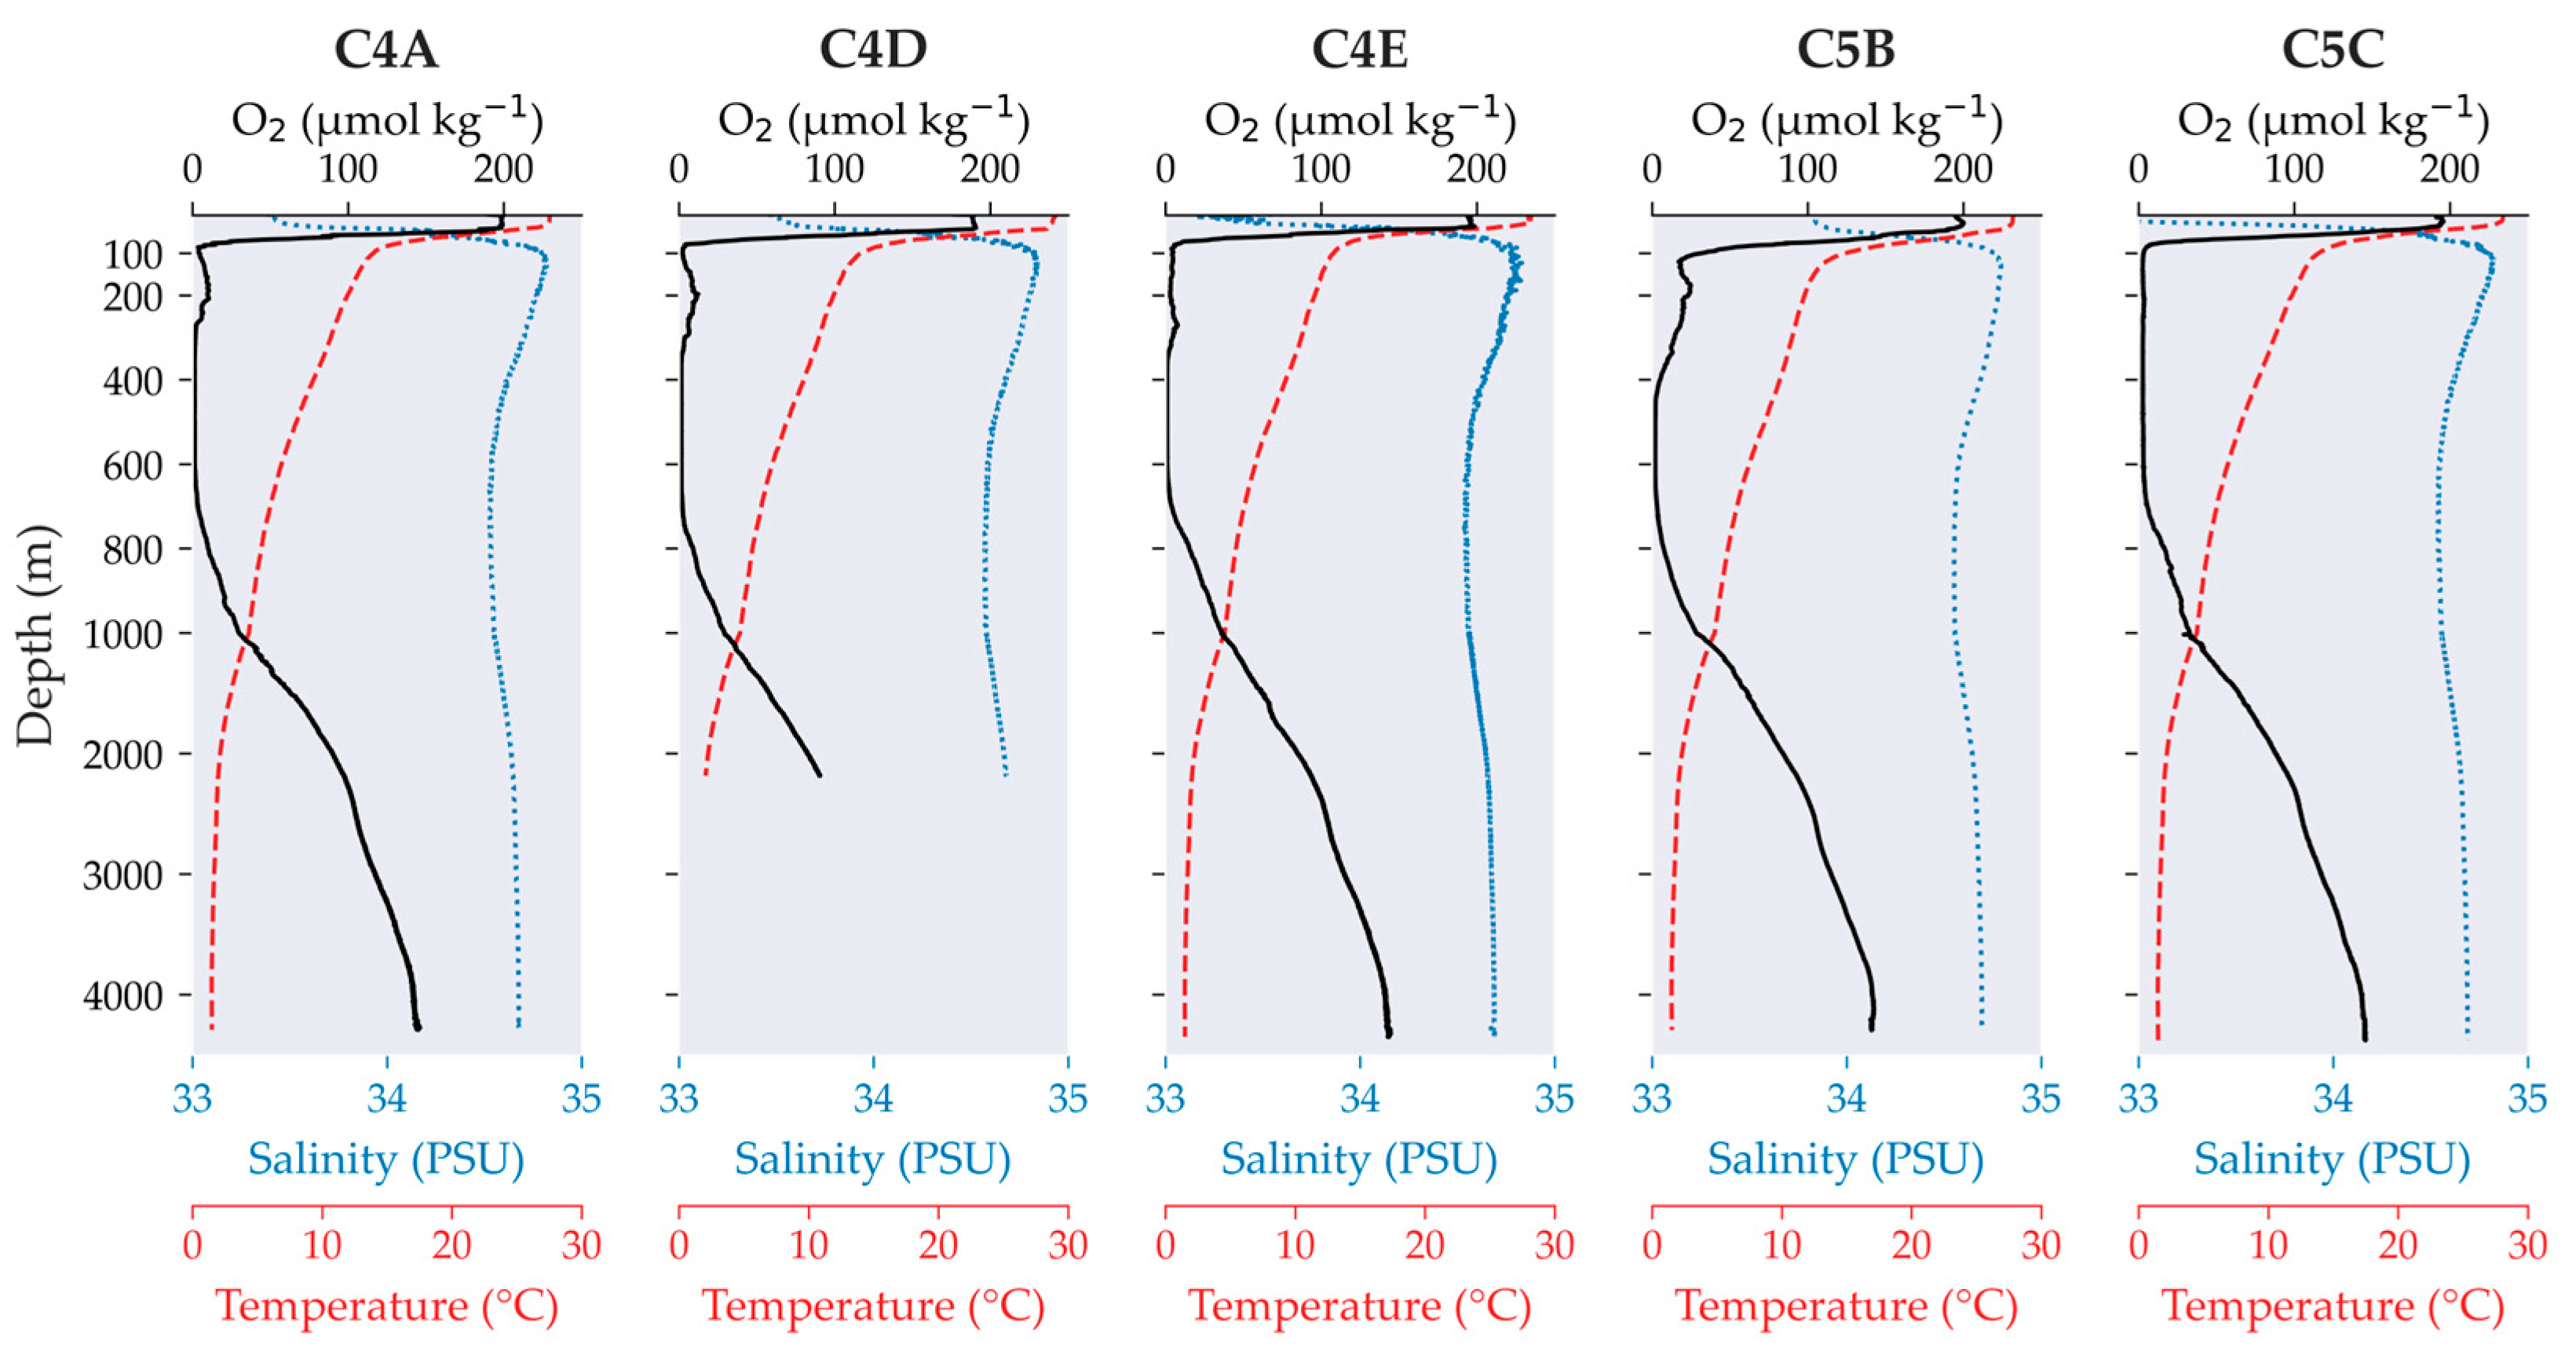
Physicochemical characteristics showed modest seasonal fluctuations at the sea surface that broadly matched the 10°NTR regional features [48,49]. Temperature ranged from 27.53 °C (C4A, October 2019) to 29.04 °C (C4D, June–July 2020), salinity from 32.81 (C5C, October 2021) to 33.84 (C5B, March 2021), and oxygen from 187.9 µmol kg−1 (C4D, June–July 2020) to 199.8 µmol kg−1 (C4A, October 2019). Physicochemical characteristics remained relatively similar across campaigns, but moderate vertical fluctuations occurred over time (Figure 2).
The water column showed strong stratification in the upper 100 m. We observed temperature gradient values of 0.151 (October 2019), 0.167 (June–July 2020), 0.143 (March–April 2021), 0.168 (July 2021), and 0.158 (October 2021) °C m−1. An accentuated salinity increase (34.75–34.83) co-occurred with a large temperature drop (12.92–14.90 °C). Oxygen concentration drastically decreased (2.1–4.2 µmol kg−1) at nearly all times, except in C5B (31.6 µmol kg−1), which showed low but persistent oxygen presence until 500 m (1.9 µmol kg−1).
Temperature steadily decreased from 100 m to 2000 m (2.13–2.29 °C). Then, temperature reached the lowest values (1.48–1.51 °C) near the seafloor. An OMZ (O2 < 5 µmol kg−1 [50]) developed between 85 and 138 m (400 m in C5B) and 690 and 760 m. Oxygen concentration progressively increased below 800 m. It reached 140.8–145.6 µmol kg−1 near the seafloor, which concurs with NORI-D’s bottom water range [61].

3.1.2. Pelagic Primary Productivity

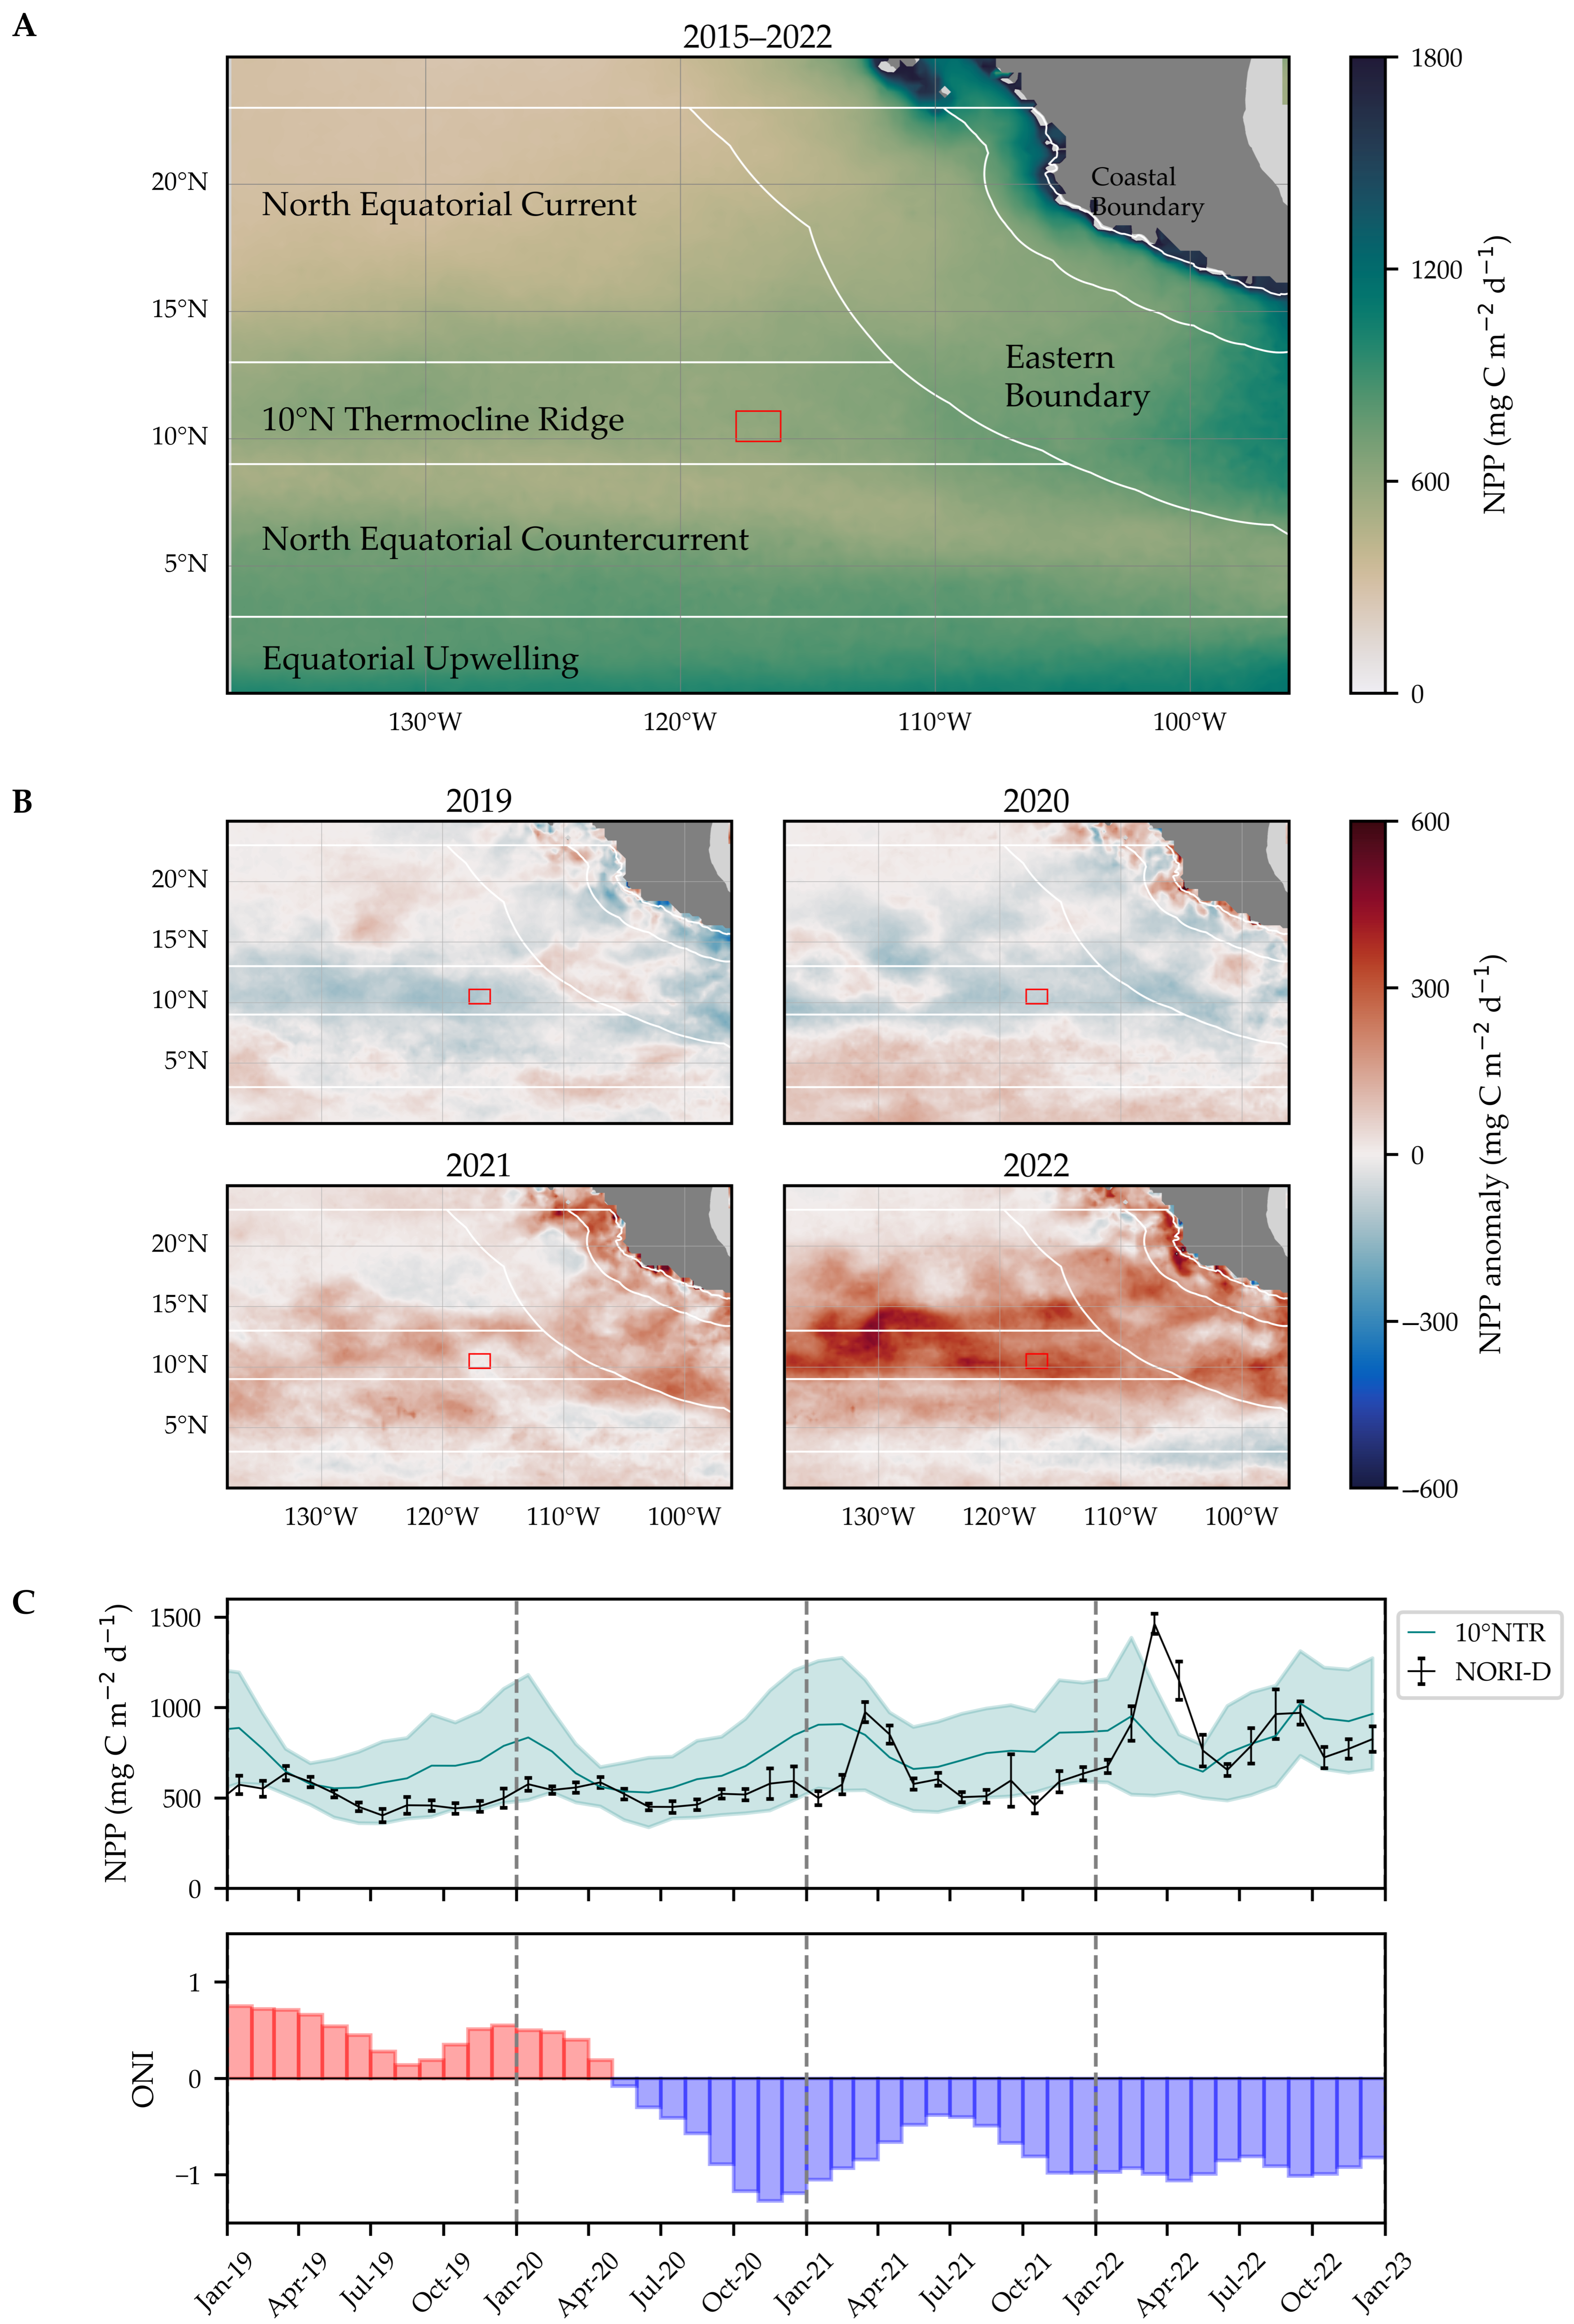
The model-derived NPP obtained from remote sensing data products [54,55,56] revealed great spatial variability in mean (2015–2022) NPP across the ETP (Figure 3A). The 10°NTR displayed mean NPP of 907.9 ± 194.6 mg C m−2 d−1. NPP displayed large interannual fluctuations over 2019–2022 (Figure 3B), which aligned with ENSO oscillations (Figure 3C) that we derived from the ONI [57]. Positive ONI prevailed in 2019 in response to the presence of El Niño conditions that led to a prevalent negative NPP anomaly in the 10°NTR. ENSO shifted from neutral to La Niña conditions in 2020, and the 10°NTR predominantly exhibited negative or near-neutral NPP anomaly. Persistent La Niña conditions prevailed in 2021–2022, which produced a La Niña “double dip” that extended through 2021 and intensified in 2022. The entire ETP recorded positive NPP anomalies. The strongest positive NPP anomaly occurred in the 10°NTR, highlighting the impacts that sustained La Niña conditions imposed in this region and across the ETP.
NPP interannual and seasonal variability in NORI-D closely matched the 10°NTR regional patterns (Figure 3C). NORI-D experienced significantly elevated NPP levels during the 2021–2022 La Niña conditions relative to 2019–2020 (Mann–Whitney U, p < 0.001). Mean NPP accounted for 614.4 ± 51.7 mg C m−2 d−1 in 2021 and 888.4 ± 74.8 mg C m−2 d−1 in 2022. In contrast, lower NPP prevailed in 2019 (503.4 ± 36.2 mg C m−2 d−1) and 2020 (530.2 ± 37.1 mg C m−2 d−1). NPP consistently exhibited lowest values during boreal summer months, followed by an increase in the boreal winter months in NORI-D.

3.1.3. Particle Mass Flux and Composition

The 2019–2022 sediment trap monitoring in NORI-D revealed great variability in particle flux and composition through the water column (Table 2). The mean total particle flux decreased from 31.4 ± 16.0 mg m−2 d−1 at 2000 m (LM-2000) to 25.9 ± 11.2 mg m−2 d−1 (LM-500) and 25.3 ± 10.1 mg m−2 d−1 (RM-500) at 500 m asf. PIC comprised the largest particle flux fraction. BSi comprised the second largest fraction, followed by POM and lithogenic matter. As such, the ballast fraction largely overwhelmed the POM fraction.

3.1.4. Export Production and Particulate Organic Carbon Flux Timeseries

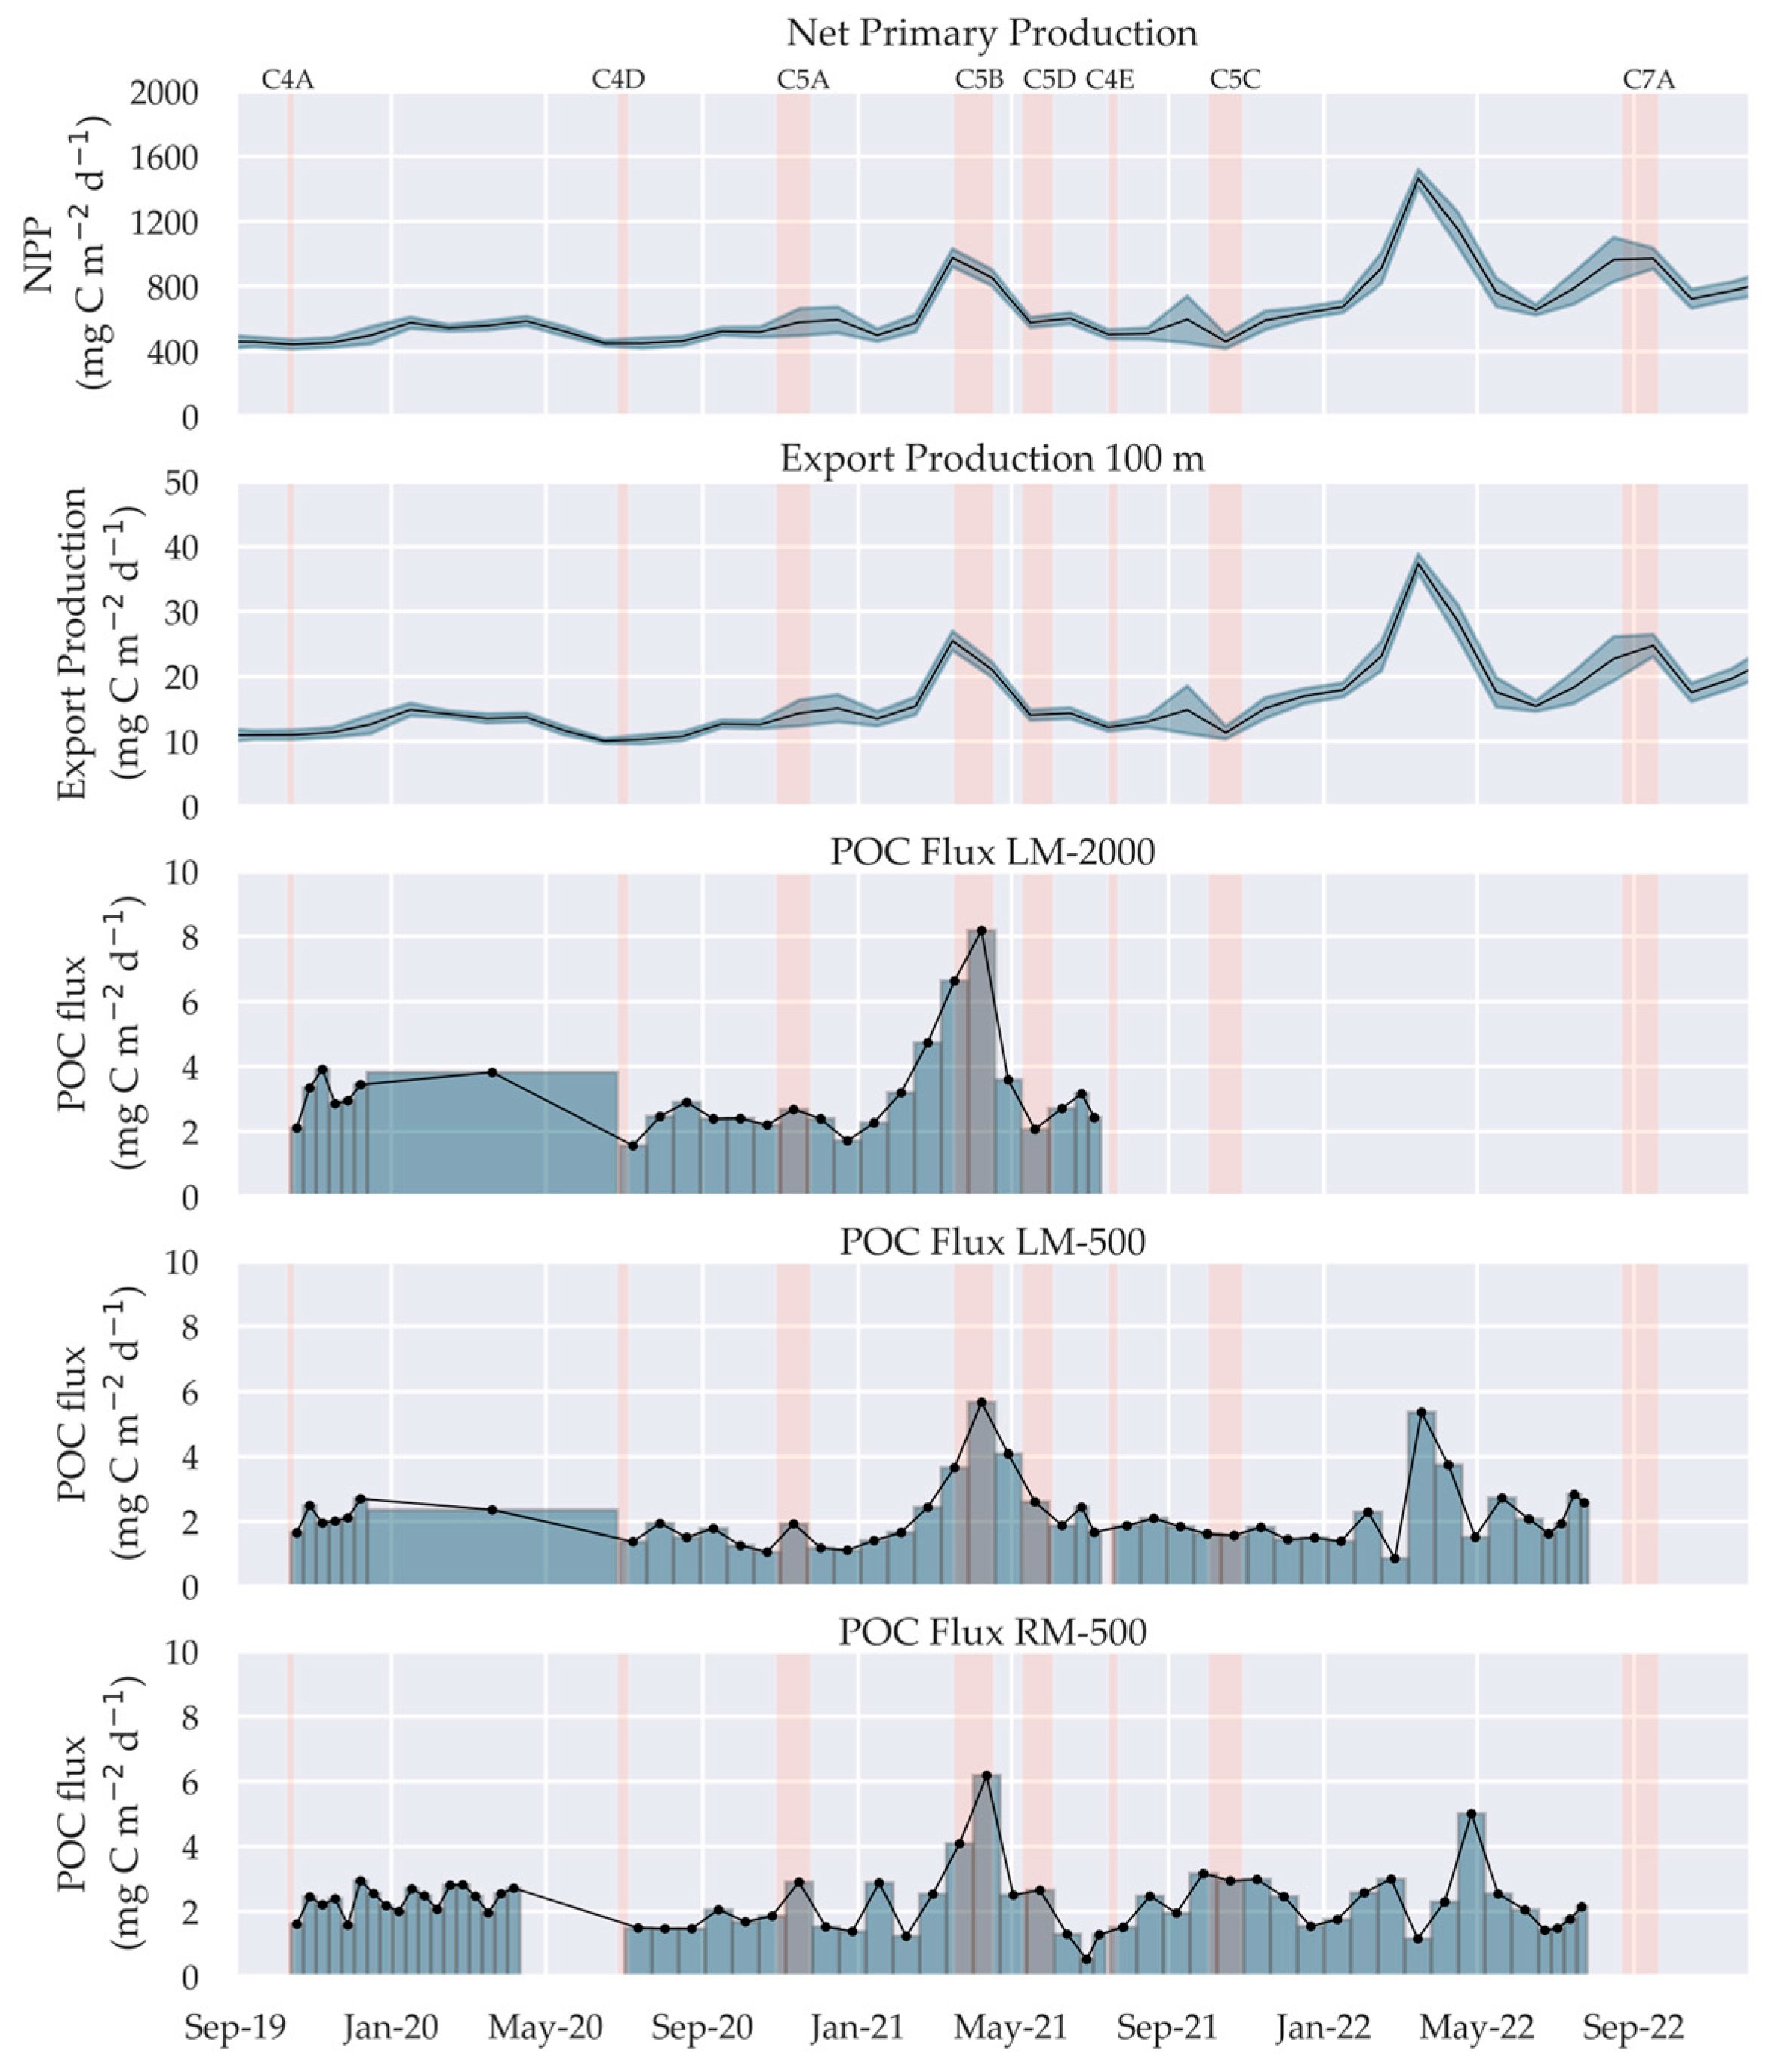
The model-derived export production [58,59,60] that we obtained from remote sensing NPP data products [54,55,56] and measured sediment trap POC flux displayed pronounced seasonality and interannual variability. Such temporal variability broadly reflected contemporaneous NPP from September 2019 to July 2022. Mean (2019–2022) export production totalled 15.7 ± 1.3 mg C m−2 d−1. It ranged from 10.1 ± 0.4 mg C m−2 d−1 in June 2020 to 37.3 ± 1.5 mg C m−2 d−1 in March 2022 (Figure 4). Mean POC flux displayed significantly greater values at 2000 m than at 500 m asf (Mann–Whitney U, p < 0.001). The LM-2000 displayed mean POC flux of 3.2 ± 1.5 mg C m−2 d−1. Meanwhile, the mean POC flux at 500 m asf varied from 2.1 ±1.0 mg C m−2 d−1 in the LM-500 to 2.3 ± 0.9 mg C m−2 d−1 in the RM-500 (Table 2).
Both moorings captured a sharp peak in POC flux in April 2021 (LM-2000: 8.2 mg C m−2 d−1; LM-500: 5.7 mg C m−2 d−1; and RM-500: 6.2 mg C m−2 d−1) that corresponded to a period of enhanced NPP in NORI-D between March 2021 (975.2 ± 56.1 mg C m−2 d−1) and April 2021 (851.0 ± 50.6 mg C m−2 d−1). A second and greater NPP peak occurred in March 2022 (1463.7 ± 55.9 mg C m−2 d−1). The LM-500 recorded a corresponding peak (5.3 mg C m−2 d−1) in March 2022. The RM-500 site displayed a delayed response to the March 2022 peak in NPP and export production. The POC flux peaked (5.0 mg C m−2 d−1) in April–May 2022. Both periods with enhanced POC flux corresponded to positive NPP anomalies across the 10°NTR (Figure 3). These enhanced NPP rate and POC flux values from NORI-D appeared somewhat later than the expected boreal wintertime cooler sea surface water and high chlorophyll-a concentration pattern that develops over the 10°NTR [48,49]. The superimposed La Niña conditions strengthened and/or extended the seasonal NPP pattern.
The timing and magnitude of POC flux response to epipelagic NPP and export production varied between the two moorings and between seasonal export peaks. The temporal mismatch between sediment trap intervals (10–21 days) and the monthly temporal resolution of NPP/export production estimates limited precise quantification of lag relationships. Furthermore, the temporal resolution differed between moorings (Tables S3–S5). Both LM-500 and RM-500 displayed strong coherence during the 2021 spring POC peak. During the spring 2022 peak, the RM-500 recorded a maximum POC flux at 16 April–7 May (5.00 mg C m−2 d−1), whereas the LM-500 exhibited elevated POC flux between 8–29 March (5.3 mg C m−2 d−1) and 29 March–19 April (3.7 mg C m−2 d−1) (Figure 4). Such mismatch occurred despite the relatively small distance (~115 km) between the two moorings [46]. These observations suggest that abyssal POC flux variability was influenced not only by NPP and export production [49], but also by mesoscale spatial heterogeneity and variability in local current regimes across NORI-D [48]. Additional uncertainty may also arise from mooring motion and variability in trap collection efficiency, which may further influence the temporal representativeness of measured POC flux at event scales [21,49]. Nonetheless, the broad correspondence between enhanced regional NPP/export production and abyssal POC flux during both La Niña periods indicates that the sediment trap records captured the dominant seasonal and interannual patterns of organic matter vertical transfer in NORI-D.

3.1.5. Particulate Organic Carbon Flux from the Sea Surface to the Seafloor

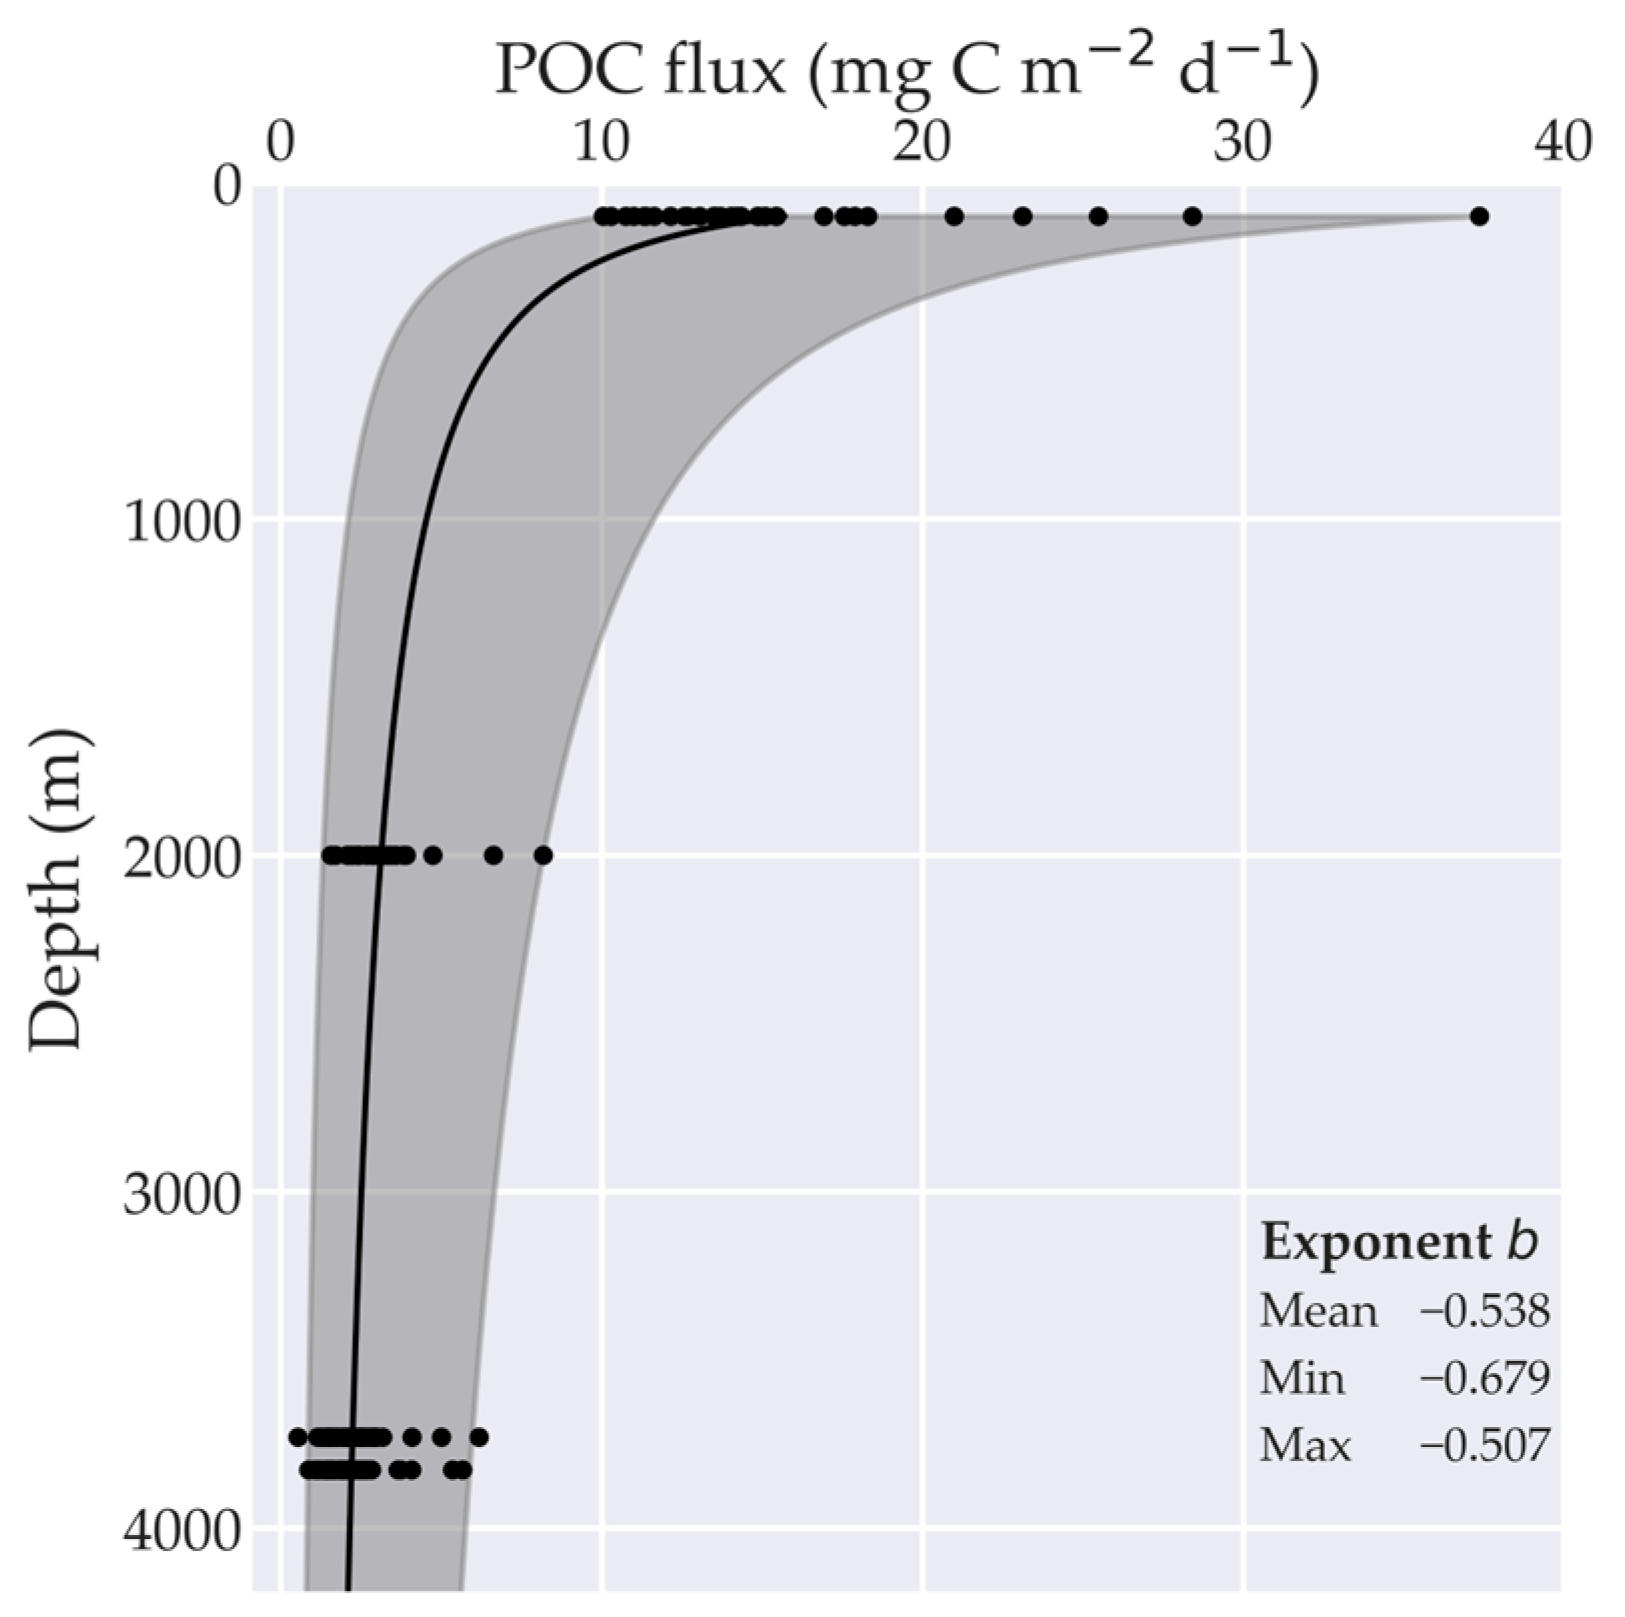
We applied the Martin curve [11] (Equation (1)) to model pelagic POC flux to the seafloor (i.e., POC rain rate) (Figure 5). The mean model fit reproduced the observed mean vertical POC flux well (RMSE = 0.04 mg C m−2 d−1) and showed no systematic depth-dependant bias. The model fit had relatively small residual values at 100, 2008, 3703, and 3838 m below sea surface (−0.001, 0.024, 0.037 and −0.066 mg C m−2 d−1, respectively).
We obtained the best-fit mean POC flux curve with the exponent b of −0.538 (min–max: −0.679 and −0.507, respectively). The mean exponent b from NORI-D falls above the mean open ocean composite b of −0.858 that ranges from −0.973 to −0.319 [11]. Nonetheless, one site that lies in the ETP and comprises the open ocean composite (VERTEX III: 15.7° N, 107.5° W) has an exponent b value of −0.648 [11]. Thus, our model results adequately represent POC flux in NORI-D and ETP.
The mean seafloor POC rain rate totalled 2.1 mg C m−2 d−1 (min–max: 0.8–5.6 mg C m−2 d−1) in NORI-D. It equals 0.76 g C m−2 yr−1, which falls below the ETP’s mean value of 2.34 g C m−2 yr−1 [16]. NORI-D records sit in the lower-end range (0.44–2.23 g C m−2 yr−1) that researchers have estimated at the eastern CCZ [34,35,37,42]. These regional estimates relied on large-scale NPP records (e.g., [89]) to calculate POC rain rate. In contrast, we obtained POC rain rate from export production and POC flux timeseries from NORI-D.

3.2. Benthic Features

3.2.1. Sediment Physical Characteristics

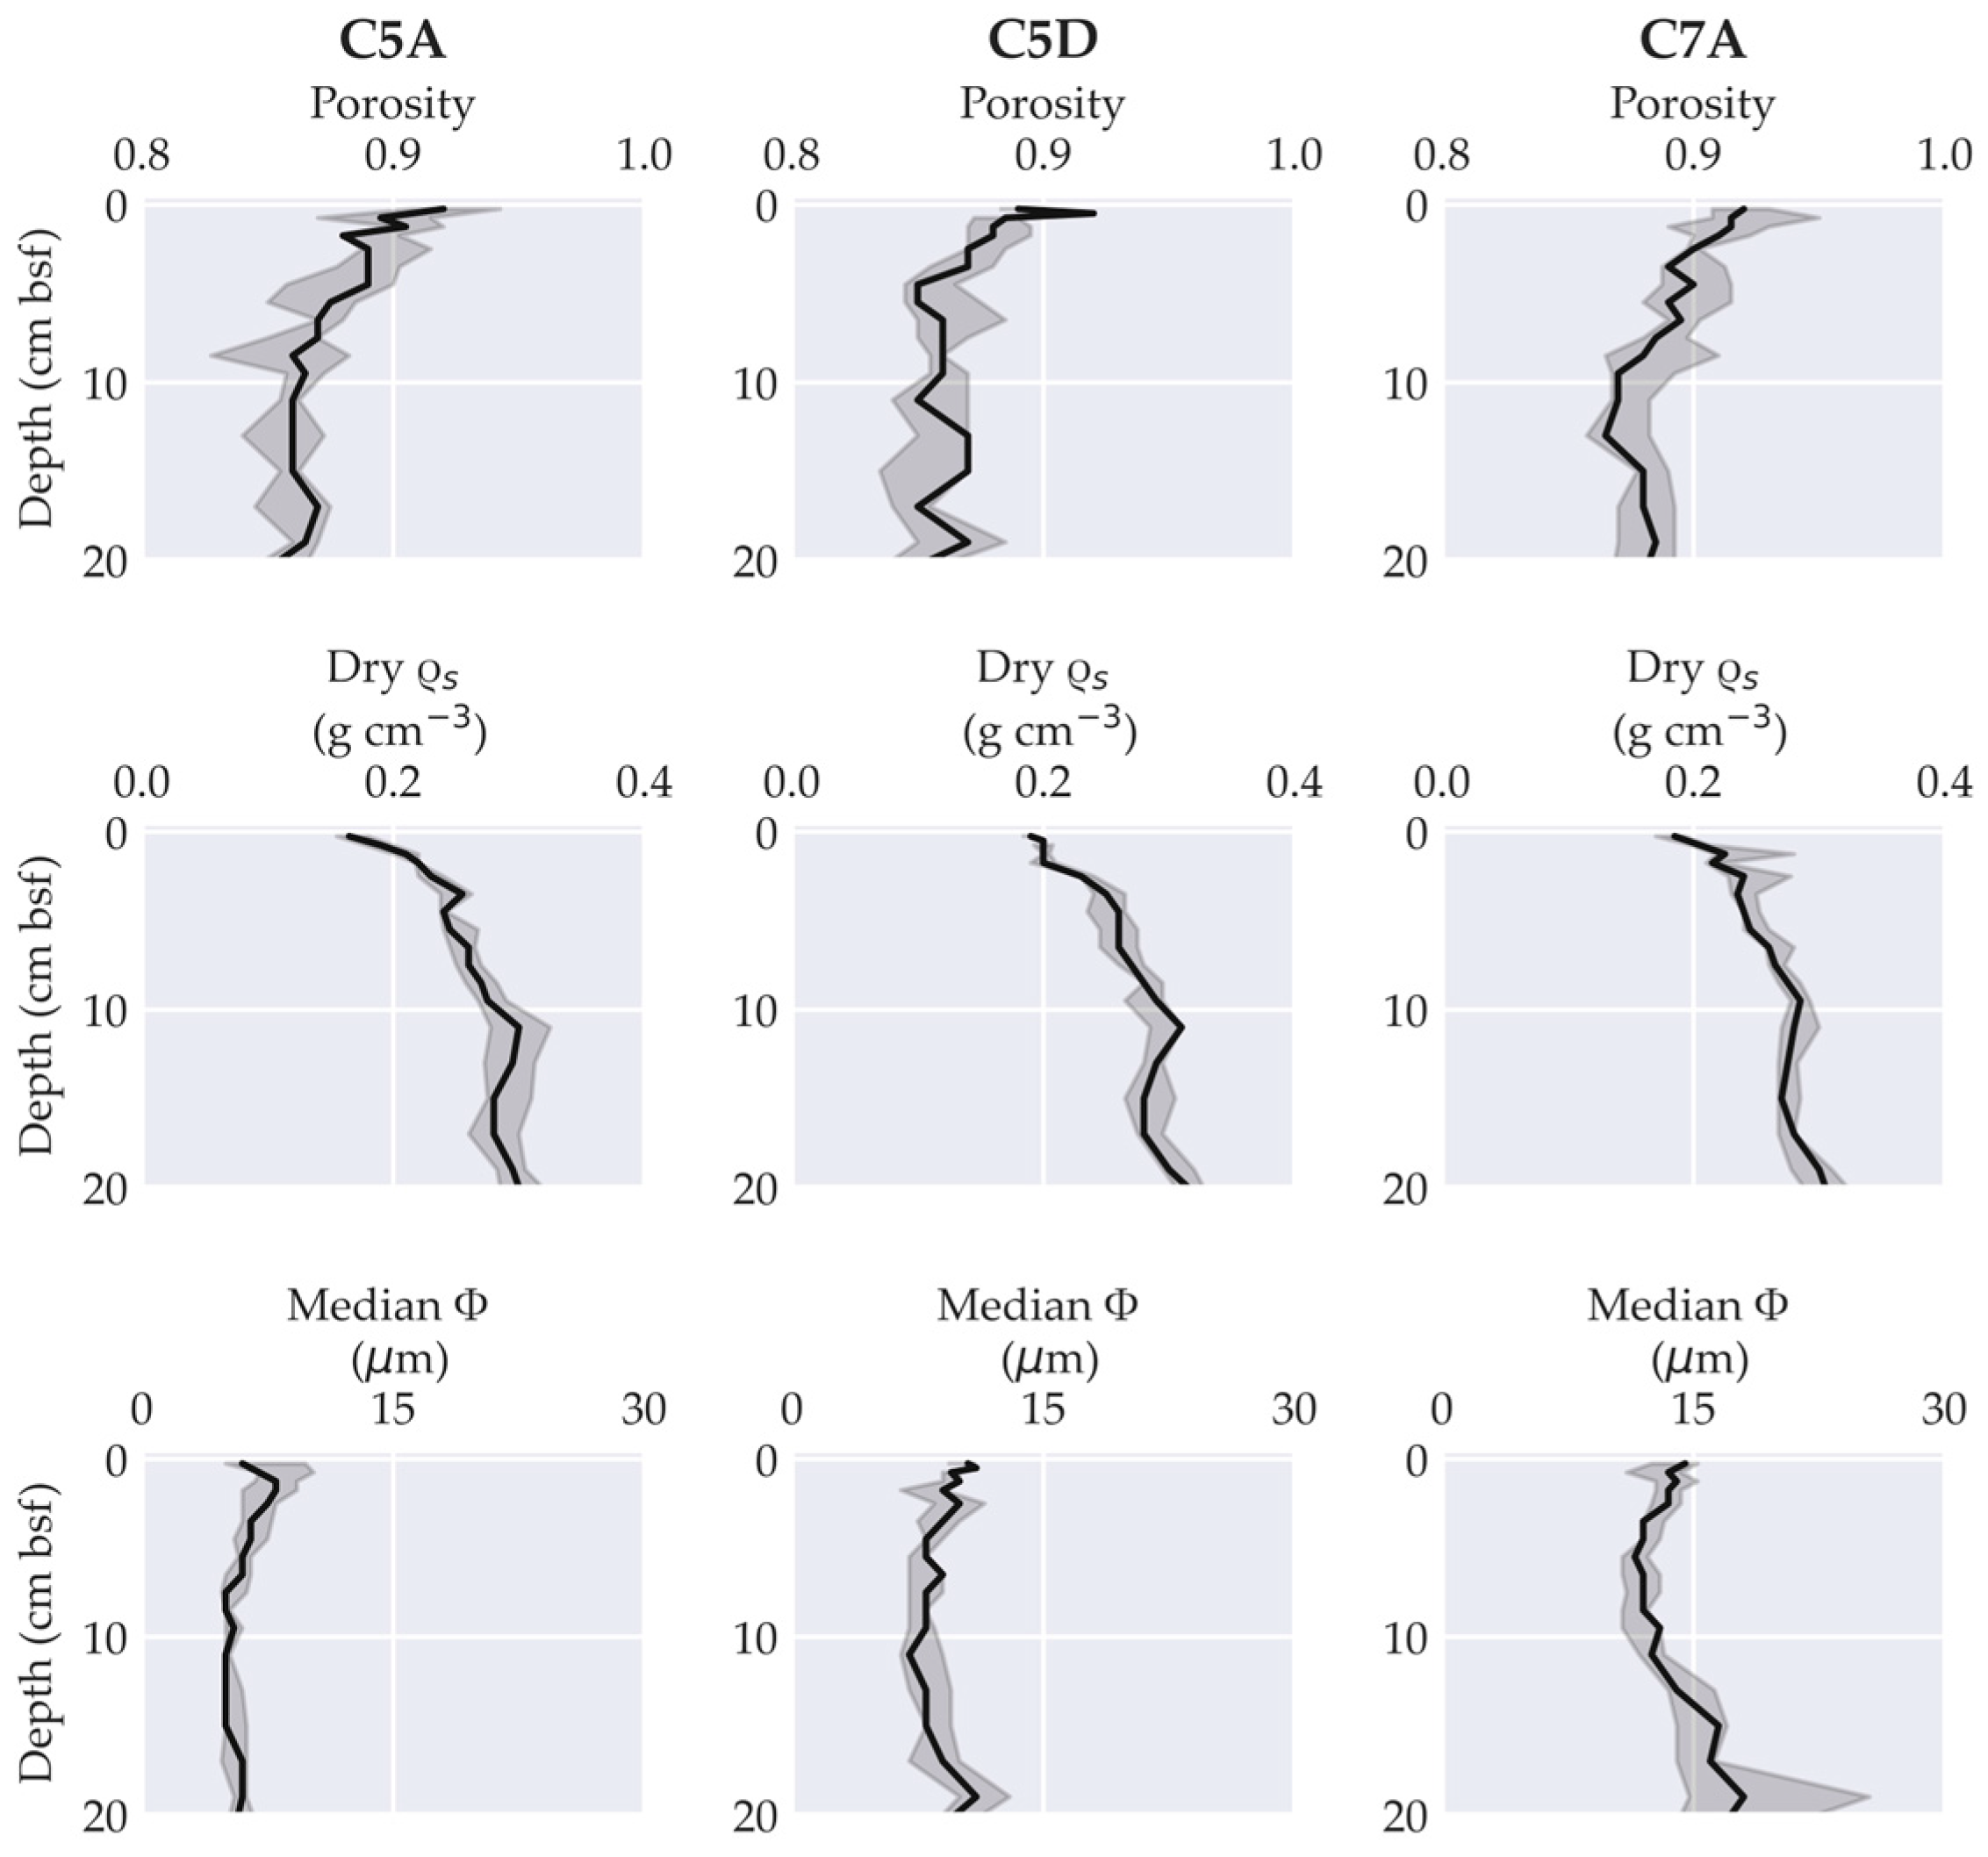
Porosity displayed a narrow range at the sediment surface (Figure 6). We recorded modestly lower porosity at 0.5 cm bsf in C5D (0.89 ± 0.01) than C5A (0.92 ± 0.05) and C7A (0.92 ± 0.04). Porosity gradually decreased with depth due to sediment compaction. The top 0–3 cm bsf significantly differed across the campaigns (Kruskal–Wallis: p < 0.05), which owed to the significant difference from C5D to C5A and C7A (Dunn’s test: C5D–C5A p < 0.05; C5D–C7A p < 0.05). Downcore changes in porosity became muted deeper than 5–10 cm bsf. Porosity trends in NORI-D match records from the eastern CCZ [38].
Dry bulk density displayed negligible variability at the sediment surface (Figure 6). No significant difference occurred in the top 0–3 cm bsf (Kruskal–Wallis: p > 0.05). Median particle size showed modest heterogeneity at the sediment surface across C5A (6 ± 3 µm), C5D (10 ± 2 µm), and C7A (14 ± 3 µm) with a significant difference at 0–3 cm bsf (Kruskal–Wallis: p < 0.05). C7A significantly differed from C5A and C5D (Dunn’s test: C7A–C5A: p < 0.05; C7A–C5D: p < 0.05), which resulted from seafloor heterogeneity rather than temporal variability [37,39]. Across the eastern CCZ, clay and silt (<7.8 µm) comprise nearly 70% of the upper 0–20 cm bsf in flat and deep plain areas [38].

3.2.2. Excess Lead-210 and Bioturbation

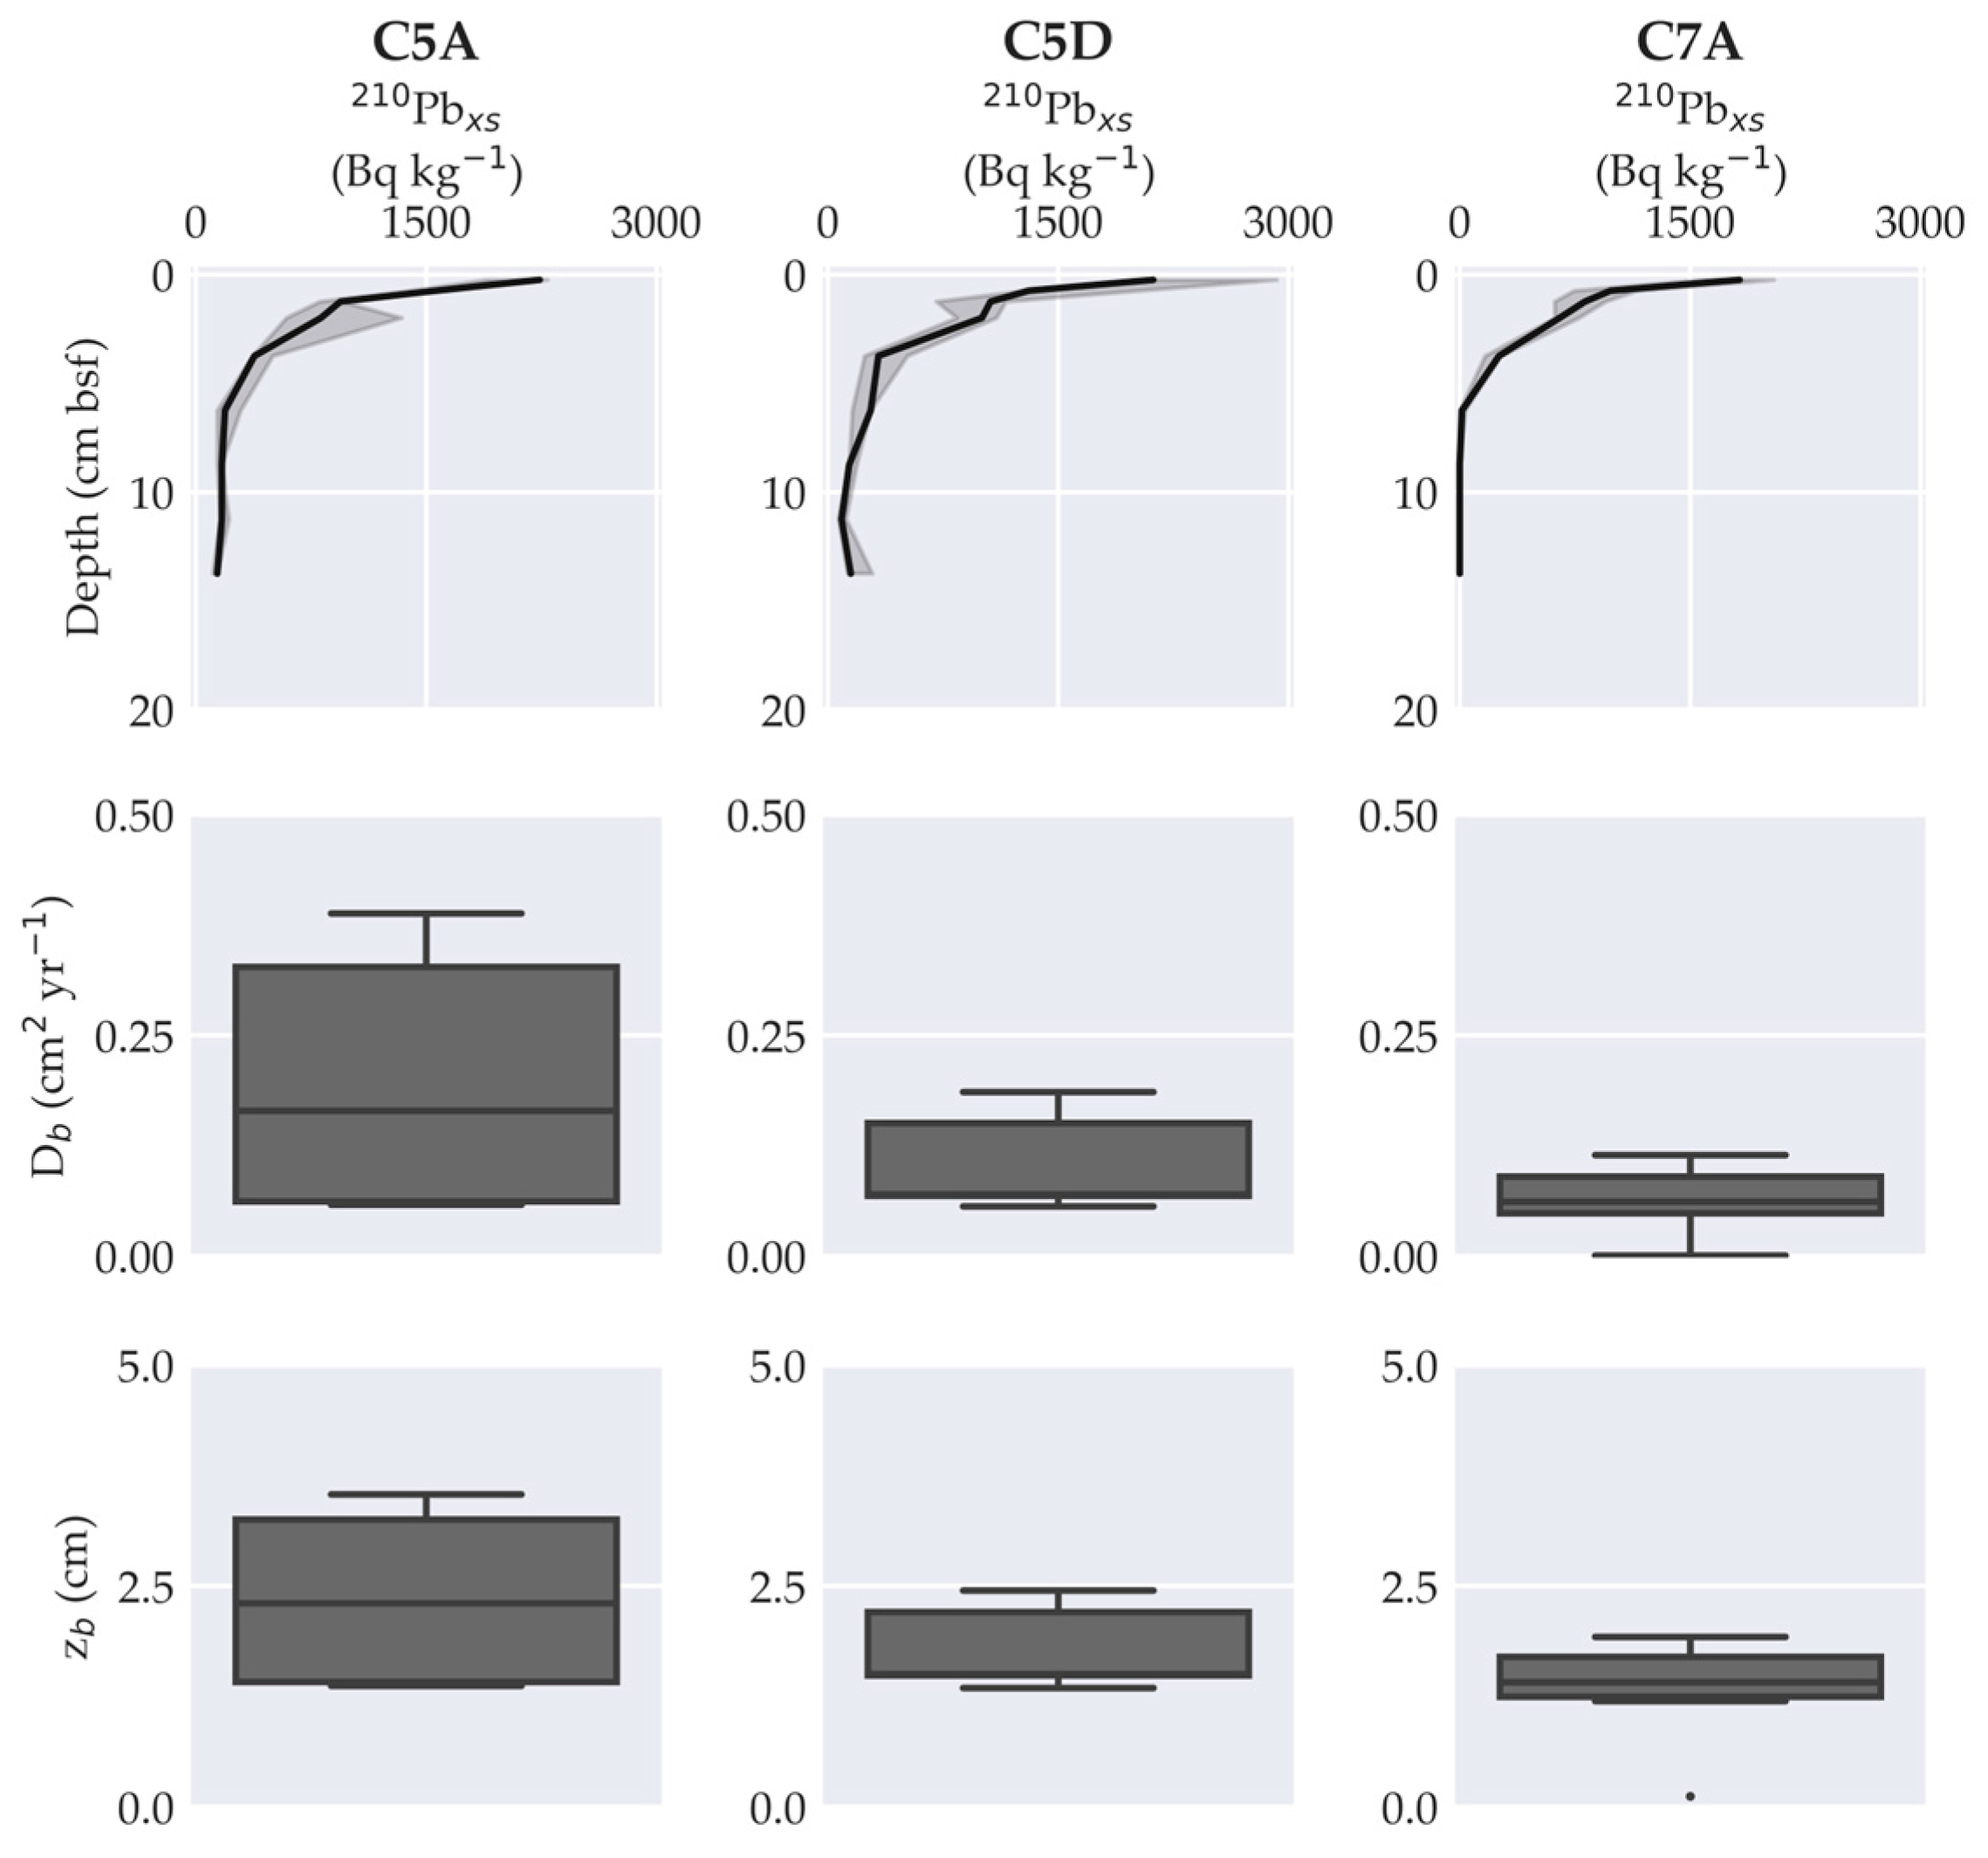
210Pbxs from C5A (2239 ± 491 Bq kg−1) and C5D (2119 ± 566 Bq kg−1) showed similar activity concentration at the sediment surface, but C7A showed lower values (1822 ± 319 Bq kg−1) (Figure 7). 210Pbxs activity concentration exponentially decreased with depth due to particle mixing and radioactive decay [76]. C5A and C5D displayed deeper 210Pbxs penetration (>10 cm bsf) than C7A (<10 cm bsf). No significant temporal difference (Kruskal–Wallis: p > 0.05) in 210Pbxs activity concentration in the top 0–3 cm bsf occurred.
Db and zb decreased from C5A (Db: 0.16 ± 0.15 cm2 yr−1; zb: 2.2 ± 1.0 cm) to C5D (Db: 0.07 ± 0.06 cm2 yr−1; zb: 1.5 ± 0.5 cm) and C7A (Db: 0.06 ± 0.04 cm2 yr−1; zb: 1.4 ± 0.6 cm) (Figure 7), although no significant difference occurred among campaigns (Kruskal–Wallis: p > 0.05). These changes in Db and zb likely resulted from fluctuation in phytodetritus input [90,91]. Polymetallic nodule fragments may also have impacted Db and zb by introducing heterogeneity in 210Pbxs records [76,92]. Changes in macrofaunal abundance and composition also impact particle redistribution and, thus, Db and zb [93,94].

3.2.3. Porewater Oxygen

Oxygen concentration at 0–0.05 cm bsf ranged from 149.9 ± 3.1 µmol L−1 in C5A to 150.6 ± 1.4 µmol L−1 in C5D and 150.8 ± 1.2 µmol L−1 in C7A (Figure 8). Typical in the eastern CCZ [37,43], the sediment surface remained fully oxic and most oxygen consumption occurred in the top 0–1 cm bsf. Oxygen concentration significantly differed at 0–1 cm bsf (Kruskal–Wallis: p < 0.05). All campaigns significantly differed from one another (Dunn’s test: C5A–C5D p < 0.05; C5A–C7A p < 0.05; C5D–C7A p < 0.05). Linear regression slope analysis (0–1 cm bsf) revealed that the oxygen consumption rate increased from C5D (−46.9 µmol O2 cm−1) to C5A (−50.9 µmol O2 cm−1) and C7A (−71.4 µmol O2 cm−1).

3.2.4. Bulk Organic Matter Characteristics

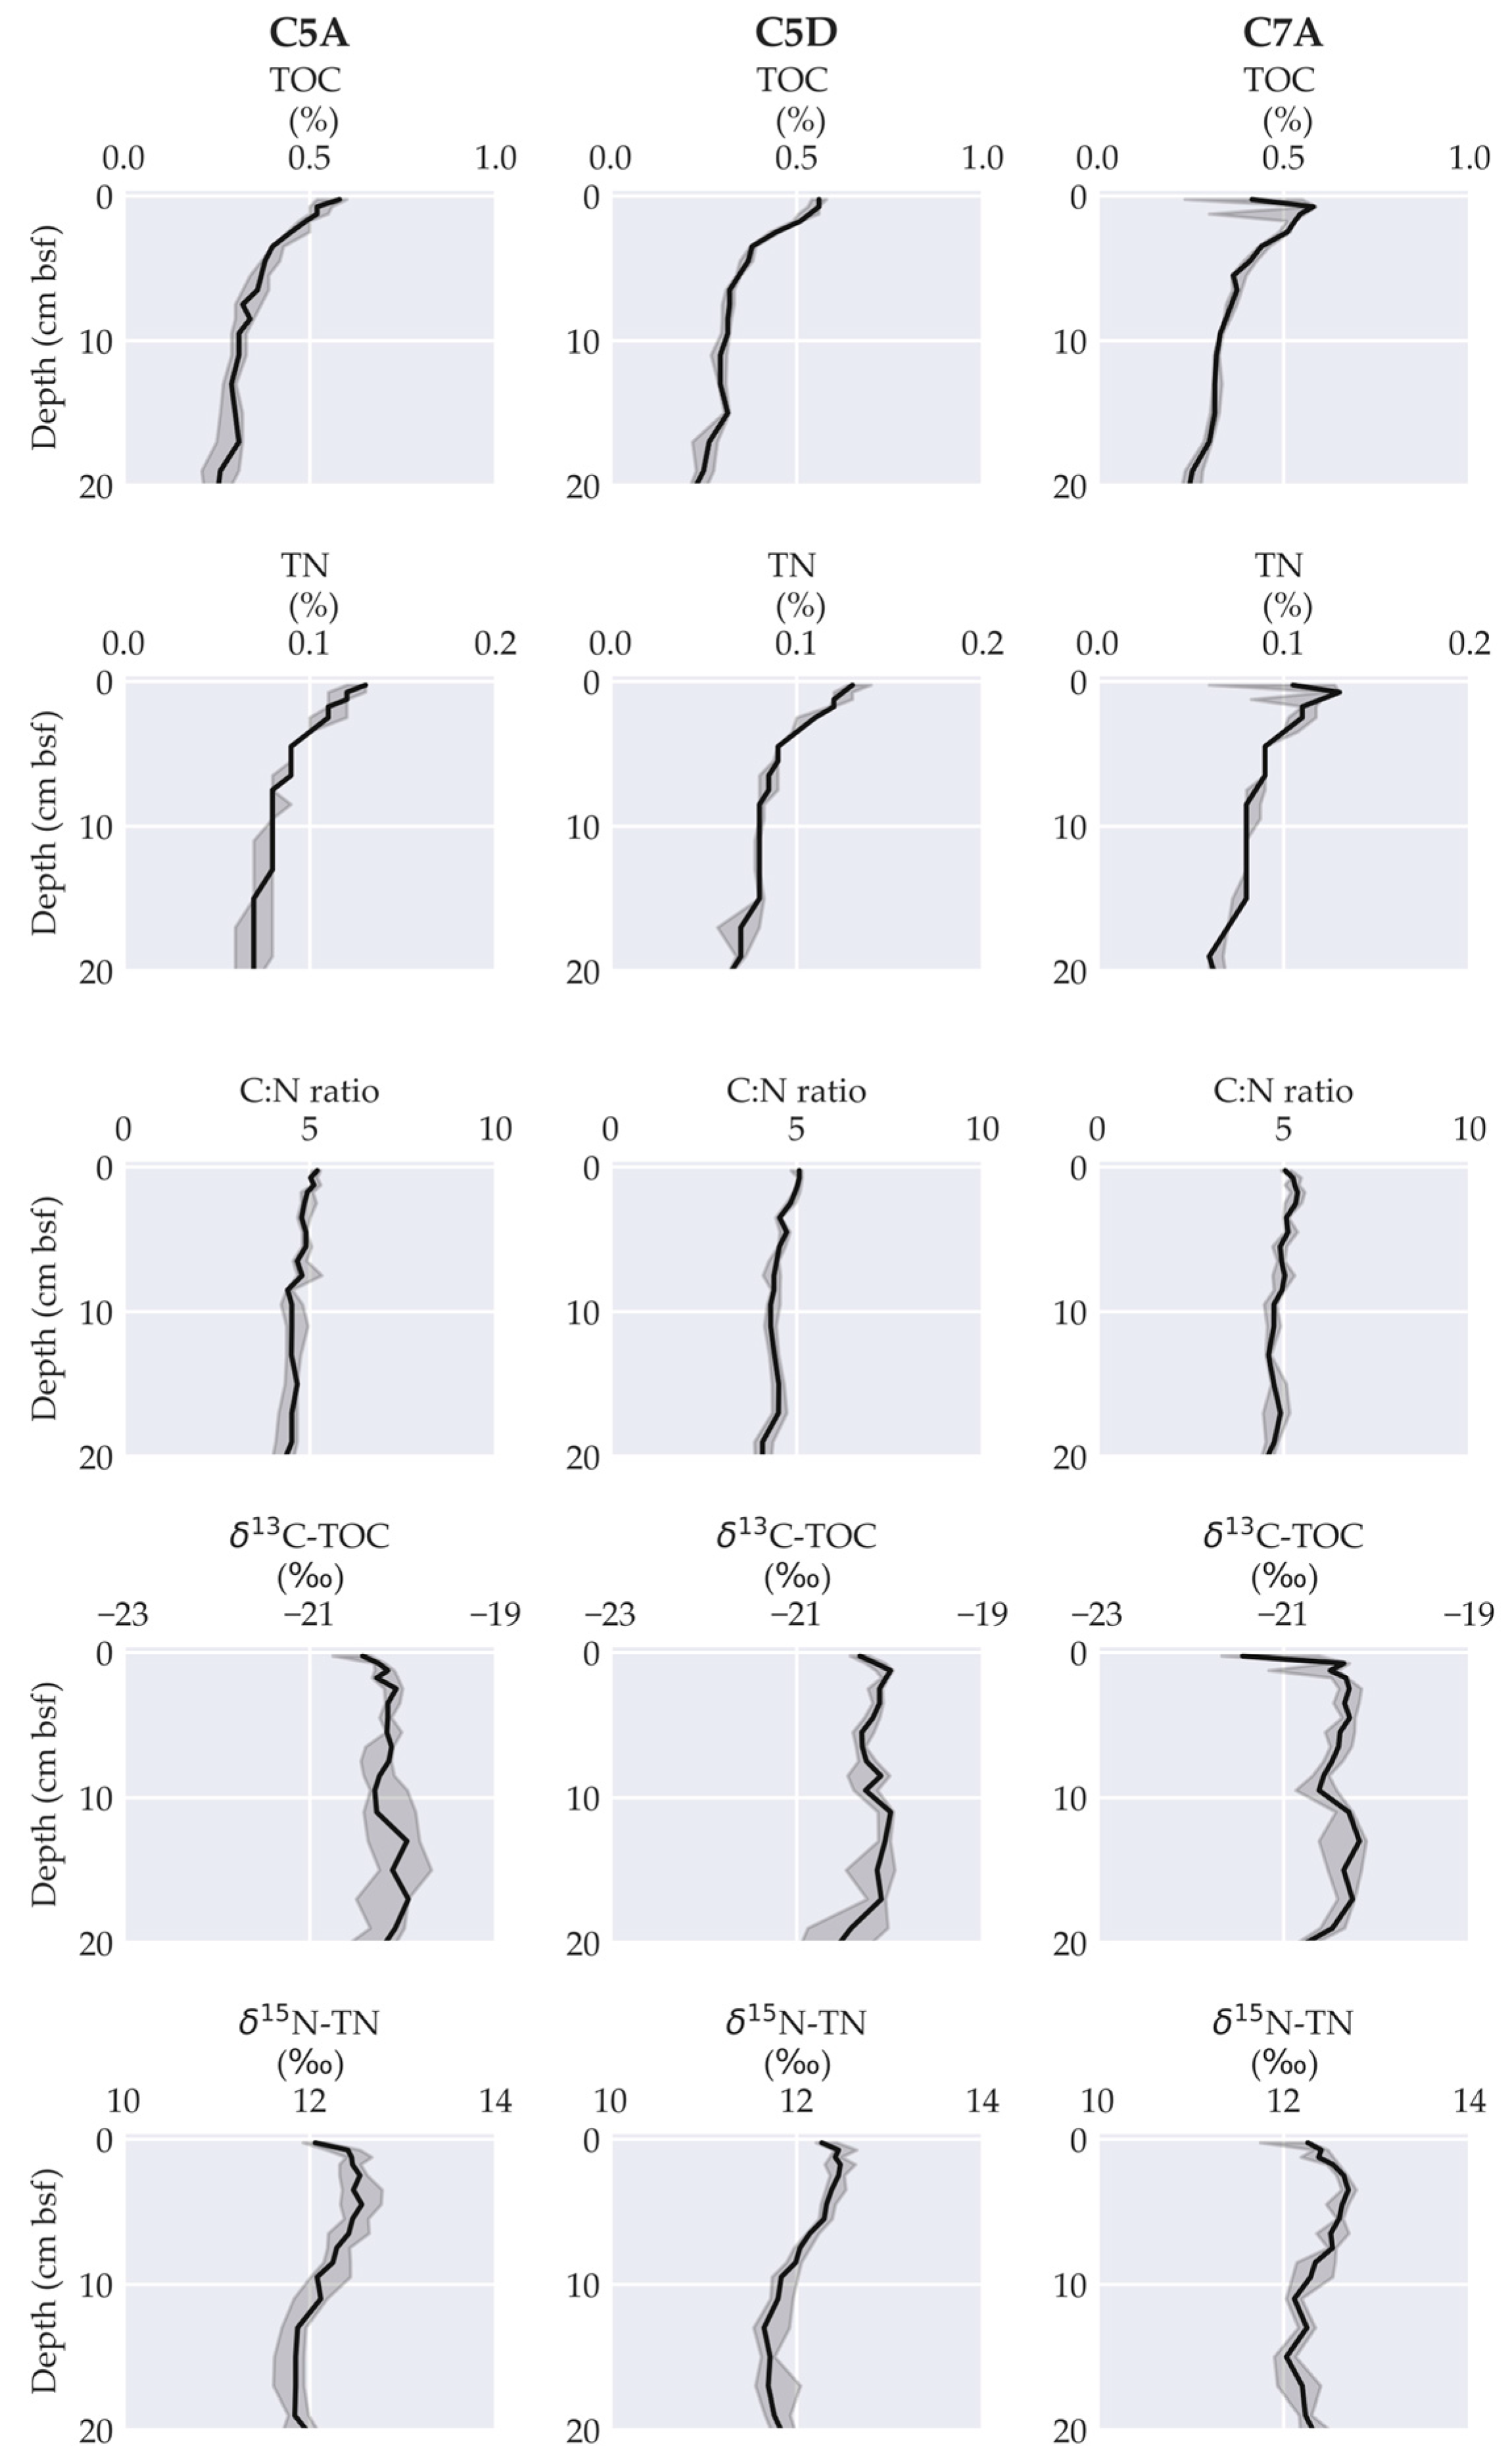
TOC content displayed broadly similar characteristics across 2020–2022 (Figure 9). At the sediment surface, median TOC ranged from 0.58 ± 0.05% in C5A to 0.56 ± 0.04% in C5D and 0.42 ± 0.19% in C7A. The top sediment layers in C7A exhibited relatively greater variability with TOC values as low as 0.18%. Such variability owes to small-scale seafloor heterogeneity that can impact benthic organic matter deposition and distribution at the seafloor in the eastern CCZ [37,39]. The upper 0–3 cm bsf showed no significant difference in TOC across the three years (Kruskal–Wallis: p > 0.05). TOC content progressively decreased from sediment surface to 3–5 cm bsf, and then changes became negligible.
Sediment surface median TN content varied from 0.13 ± 0.01% in C5A and C5D to 0.10 ± 0.04% in C7A (Figure 9). C7A showed relatively low TN content at the sediment surface (0.04%) that corresponded to low TOC values. TN had no significant temporal difference in the upper 0–3 cm bsf (Kruskal–Wallis: p > 0.05). TN depth profiles displayed a typical decrease in the upper layers and became relatively invariant beyond 10 cm bsf.
The TOC-to-TN molar ratio (C:N ratio) varied from 5.2 ± 0.4 in C5A to 5.1 ± 0.2 in C5D and to 5.0 ± 0.5 in C7A (Figure 9). The top 0–3 cm bsf showed a significant difference in C:N ratio over time (Kruskal–Wallis: p < 0.05) with a significant difference between C5D and C7A (Dunn’s test: C5D–C7A p < 0.05). The C:N ratio shifted downcore to below 5.0. The C:N ratio suggests that microbial activity converts phytodetritus into bacterial biomass [95].
Sediment surface δ13C-TOC varied from −20.4 ± 0.3‰ in C5A to −20.3 ± 0.3‰ in C5D and −21.4 ± 0.8‰ in C7A (Figure 9). The larger variability in δ13C-TOC from C7A corresponds to co-eval low TOC content. Overall, sediment surface δ13C-TOC resembles values for settling organic matter across the ETP [96]. The top 0–3 cm bsf δ13C-TOC significantly differed across the three years (Kruskal–Wallis: p < 0.05). C7A significantly differed from C5A and C5D (Dunn’s test: C7A–C5A p < 0.05; C7A–C5D p < 0.05).
Sediment surface δ15N-TN displayed a narrow range across the three campaigns from 12.1 ± 0.3‰ in C5A to 12.3 ± 0.2‰ in C5D and 12.3 ± 0.4‰ in C7A (Figure 9) with no significant temporal difference (Kruskal–Wallis: p > 0.05) in the upper 0–3 cm bsf. These values match high δ15N-PON in settling organic matter and δ15N-TN at the sediment surface in the ETP [96,97]. δ15N-TN showed a minor downcore increase, peaking at 3–5 cm bsf (12.5–13.0‰), reflecting POM remineralisation by heterotrophic bacteria [98,99].

3.2.5. Lipid Characteristics

Sediment surface total lipid concentration ranged from 838 ± 784 µg g.TOC−1 in C5A to 1327 ± 404 µg g.TOC−1 in C5D and 1425 ± 557 µg g.TOC−1 in C7A (Figure 10). The top 0–3 cm bsf significantly differed over time (Kruskal–Wallis: p < 0.05) due to the significant difference between C5A and C5D (Dunn’s test: C5A–C5D, p < 0.05). C5A and C5D displayed non-systematic downcore changes in total lipid concentration. In contrast, C7A showed a decrease in total lipid concentration with increasing burial depth. Lipid composition also displayed substantial variability. Fatty acids comprised over 50% of total lipids at the sediment surface in C5A and C5D. Alcohols and n-alkanes progressively displayed greater relative contribution with increasing burial depth, while fatty acid contribution decreased. In particular, n-alkanes steadily increased with burial depth in C5A. Sterols, ketones, and hopanoids had proportionally minor contributions and downcore variability. C7A exhibited a strikingly distinct lipid profile where fatty acids accounted for 25–30% of total lipids and ketones contribute to more than one-third of the total lipids.
The compositional shift from fatty acids to n-alkanes and n-alcohols in C5A and C5D results from lipid preferential degradation and/or selective preservation [100]. Fatty acids, in particular mono- and polyunsaturated fatty acids of fresh phytodetritus origin, experience extensive microbial remineralisation due to their high reactivity. Alcohols and n-alkenes exhibit relatively lower reactivity, and become selectively preserved in the sediment [101,102,103]. Sterols display intermediate reactivity and, thus, susceptibility to microbial remineralisation [104]. Ketones exhibit relatively low reactivity [105]. Thus, the relatively high ketone contribution in C7A suggests an extensive fatty acid preferential degradation [100]. Aerobic bacteria produce hopanoids [106]. Thus, hopanoid records suggest an ubiquitous preservation of organic matter derived from aerobic bacteria [38,102].

3.2.6. Amino Acid Characteristics

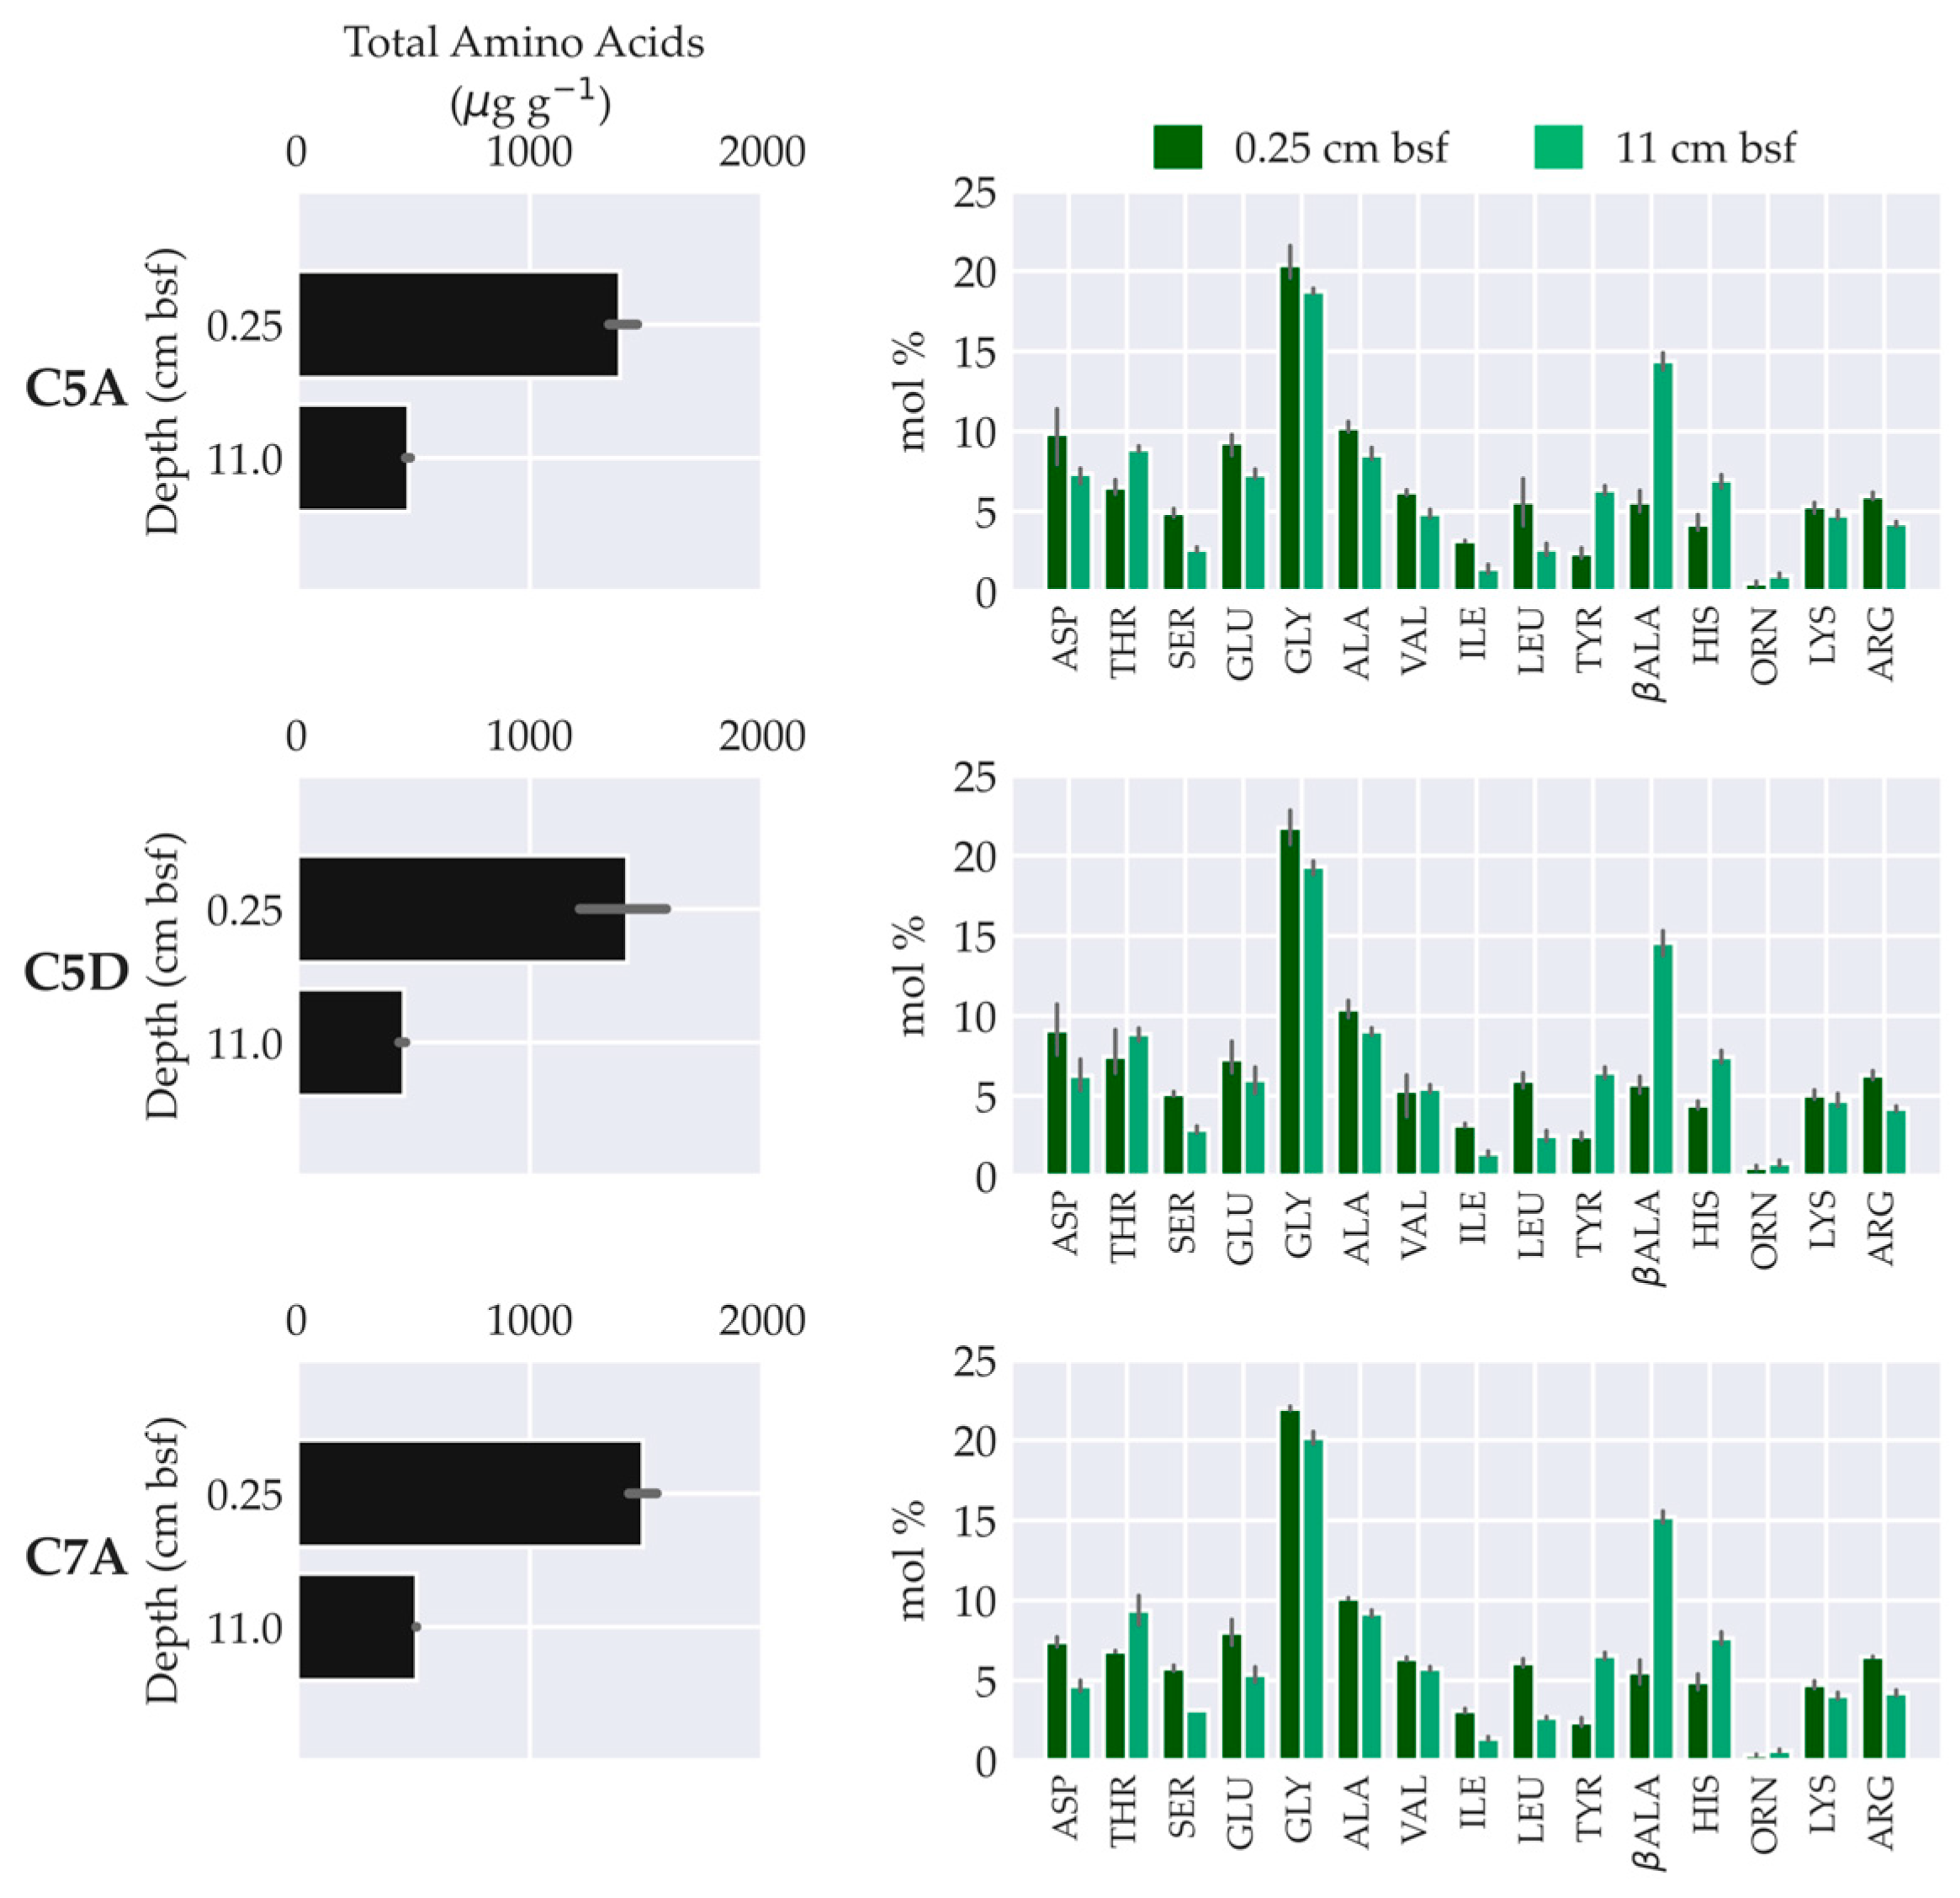
Sediment surface total amino acid concentration ranged from 1388 ± 123 µg g−1 in C5A to 1419 ± 265 µg g−1 in C5D and 1485 ± 170 µg g−1 in C7A. At 10–12 cm bsf, total amino acids narrowly ranged from 480 ± 19 µg g−1 in C5A to 460 ± 63 µg g−1 in C5D and 514 ± 1 µg g−1 in C7A (Figure 11). Such similarity among campaigns suggests temporally homogeneous amino acid dynamics in NORI-D (e.g., [107]). However, our limited data set precludes robust analyses to quantify the validity of such pattern.
Glycine comprised around 20 mol% overall (Figure 11). Glycine largely dominates amino acid pools [107,108]. It occurs in diatom cell-walls [109], making it resistant to microbial remineralisation [81]. In contrast, ornithine comprised less than 1 mol% since it occurs in negligible levels in living organisms as it mainly forms diagenetically through arginine microbial fermentation [110]. A downcore shift in amino acid composition co-occurred with the decrease in total amino acid concentration. It resulted from the relative reactivity of individual protein amino acids [110,111]. Most amino acids showed a small relative decrease downcore. In contrast, beta-alanine nearly doubled to around 15 mol% and ornithine substantially increased from sediment surface to 10–12 cm bsf. This downcore increase in beta-alanine and ornithine molar contribution occurred due to their predominantly diagenetic origin through procaryote activity in the sediment [80,81,110].

4. Discussion

The environmental baseline characterisation programme that we developed in NORI-D between 2019 and 2022 [46] has produced detailed insights on temporal variability in the water column and at the seafloor. Now, we explore the processes that drive these (inter)annual changes, particularly focusing on pelagic and benthic POM dynamics.

4.1. Pelagic Natural Variability

Seasonal cycles comprise the primary driver for environmental changes in the upper water column across the ETP and the 10°NTR [48]. Furthermore, interannual variability like ENSO becomes superimposed on seasonal cycles [25,26]. Thus, these temporal cycles impact NPP patterns over the 10°NTR [49] and, consequently, over NORI-D.

4.1.1. Oceanographic and Physicochemical Processes

Sea surface physicochemical characteristics showed modest seasonal fluctuations in NORI-D between 2019 and 2021 (Figure 2) that concur with overall trends at 10°NTR. The warmest temperature occurred in June–July 2020 and July 2021, which agrees with the 10°NTR positive temperature anomaly. Salinity did not display clear seasonality. Nonetheless, the lowest salinity that occurred in October 2021 broadly matches the 10°NTR negative salinity anomaly period [48].
Three coherent water mass systems govern the vertical water column structure in NORI-D. They respond to distinct modes of climate variability and bound the OMZ vertical extent. The Tropical Surface Water (TSW) occupies the upper 46 ± 13 m of the water column in the eastern CCZ and, thus, lies above the OMZ. The TSW (T > 25 °C, S < 34) has a mean surface temperature of 27.0–28.5 °C and salinity of 33.74 ± 0.08 practical salinity units (PSUs) [48,112]. The 13 °C Water (13CW) hosts the OMZ core. It occupies the depth band around 100–500 m on isopycnals σθ ≈ 26.2–26.3 kg m−3 and carries the lowest oxygen concentrations of any water mass in the ETP. Below the OMZ, the Northern Equatorial Pacific Intermediate Water (NEPIW) at σθ ≈ 26.8 kg m−3 forms the lower oxycline of the system [113,114]. The NEPIW enters the Eastern Tropical North Pacific (ETNP) from the west at around 12–15° N as a mixed product of Antarctic Intermediate Water (AAIW), North Pacific Intermediate Water (NPIW), and recirculated equatorial subthermocline water [113]. The 13CW–NEPIW interface sets the lower limit of the OMZ at NORI-D.
These three water mass systems have their own characteristic timescale of variability. The TSW responds mainly to sub-annual and ENSO forcing. The seasonal migration of the Intertropical Convergence Zone (ITCZ) between 5° N (March) and 10° N (August–September) [48,115] modulates trade-wind intensity and Ekman pumping over the 10°NTR, deepening the mixed layer and warming surface water to 28.5 °C in boreal summer–fall and shoaling/cooling it to ~27 °C across November–March [112]. ENSO superimposes this annual cycle. El Niño events drive positive sea surface temperature anomalies of +2 to +3 °C across the ETP warm pool [116]. El Niño events bias the TSW in the CCZ’s warm and slightly fresher than climatology corridor, while La Niña events have the opposite effect [25]. However, no published in situ TSW timeseries has yet resolved ENSO amplitudes at NORI-D.
The 13CW varies on seasonal-to-multidecadal scales tied to its ventilation pathway: more than 50% of the particles entering the ETNP OMZ travel along the Northern Subsurface Countercurrent (NSCC, also known as the northern Tsuchiya Jet) at 4–5° N [117], such that the Equatorial Undercurrent (EUC) system is the principal controller of subsurface oxygen supply. Both the EUC and NSCC undergo strong seasonal modulation [118] and weaken sharply during El Niño. On decadal scales, the Pacific Decadal Oscillation (PDO) modulates the OMZ envelope. During PDO-positive phases the tropical Pacific OMZ volume expands [119], although the ETNP suboxic core north of 10° N is less sensitive to the PDO than the southern OMZ [120]. In contrast, the NEPIW has a renewal timescale of decades to centuries and exhibits no detectable seasonal variability. Multidecadal NEPIW oxygen changes integrate Southern Hemisphere AAIW formation and Pacific Deep Water (PDW) mixing [121]. The AAIW–NEPIW propagation has not yet been quantified for the CCZ region, so we cannot ascertain its role in NORI-D.
The passage of mesoscale anticyclonic eddies introduces transient temperature and salinity anomalies in the upper water column over NORI-D that superimpose climate-mode signals. An automated detection analysis of 24-year satellite altimetry shows that between four and six long-lived (lifetime > 90 days) anticyclonic eddies occur annually in the northeastern tropical Pacific, originating principally from gap-wind forcing at Tehuantepec and Papagayo and spreading westward in a narrow 10–12° N corridor that takes 4–6 months to reach eastern CCZ [122]. In situ sampling of one such eddy at 114° W/11° N in April–May 2019 documented an upper-thermocline core (~92 m water depth) with a +8.2 °C temperature anomaly, a −0.78 PSU salinity anomaly, a +0.8 mg m−3 fluorescence anomaly, and a +137 µmol kg−1 dissolved oxygen anomaly, with major impacts restricted to the upper 300 m and traceable down to 1500 m [123]. Eddy passage in the abyssal eastern CCZ transforms the otherwise low-energy benthic boundary layer (long-term mean 3.8 cm s−1) into a regime an order of magnitude more energetic for periods of weeks [124], with an approximate 3-week lag between the surface eddy signature and the deep-current intensification [122].
All these oceanographic processes that drive physicochemical properties in NORI-D have knock-on effects on NPP rate and POM transfer into the ocean interior. These processes impact water column stratification and nutrient redistribution [49]. On short, (inter)annual timescales, the processes that drive metocean fluctuations in the TSW (e.g., [48,112,113,114,115]) and transient mesoscale anticyclonic eddies (e.g., [122,123,124]) seem to have the main impacts on NPP variability that we observed in NORI-D over 2019–2022.

4.1.2. Temporal Fluctuation in Pelagic Particulate Organic Matter Dynamics

We traced temporal changes in organic matter processes from the sea surface (NPP rate) through the water column (export production rate and OMZ extent) to the abyss (POC rain rate) between 2019 and 2022. Here, we further discuss the biogeochemical processes that drove the (inter)annual variability in organic matter over NORI-D in that timeframe. We hypothesise that these temporal fluctuations in epipelagic organic matter dynamics vertically propagate through the water column and affect POC flux temporal dynamics. As such, they also affect OMZ vertical extent and POC rain rate magnitude.
Model-derived NPP and POC export production timeseries (2019–2022) showed the clear impact that seasonal cycles impose on organic matter production at the sea surface and on its transfer to 100 m depth (Figure 3C and Figure 4). NORI-D experienced greater NPP and export production rate during boreal wintertime relative to boreal summertime. Such seasonality concurs with regional-scale NPP trends over the 10°NTR where wintertime chlorophyl-a concentration is two-fold higher than summertime values [49]. We observed that these seasonal patterns changed in magnitude between 2019 and 2022 due to shifts in ENSO phases [25,26] which we ascertained based on the ONI patterns [57]. The 2019–2020 period displayed positive ONI anomalies that corresponded to the El Niño phase. The El Niño phase resulted in negligible impact on NPP seasonality (annual mean: 503.4 ± 36.2 mg C m−2 d−1 in 2019 and 530.2 ± 37.1 mg C m−2 d−1 in 2020). Meanwhile, the 2021–2022 period experienced persistent negative ONI anomalies that marked a prevalent La Niña phase. As such, the La Niña phase produced substantial spikes in NPP in March–April 2021 (975.2 ± 56.1–851.0 ± 50.6 mg C m−2 d−1) and March 2022 (1463.7 ± 55.9 mg C m−2 d−1) that overlayed the seasonal cycle (Figure 3C). Monthly NPP and export production rate fluctuated nearly four-fold in NORI-D due to seasonality, ENSO fluctuations in El Niño–La Niña phases [49], and mesoscale eddy passage through the 10–12° N corridor [122,123]. Our 2019–2022 findings clearly show that NORI-D experiences broad seasonal and interannual ranges in epipelagic NPP that impact POC export to the ocean interior.
We posit that temporal changes in NPP and export production also played an additional role on OMZ onset (O2 < 5 µmol kg−1 [50]) in NORI-D (Figure 2). The OMZ onset mostly occurred at around 100 m (85–138 m), except for March–April 2021, which displayed the OMZ onset around 400 m. Such deeper OMZ onset coincided with peaks in NPP, export production, and POC flux (Figure 4). A main hypothesis that exists on the biogeochemical drivers of OMZ onset posits that greater organic matter availability from NPP pulses leads to more extensive oxygen consumption in the water column and, thus, to shallower OMZ onset [125]. Our findings from POC production and vertical transfer through the water column in March–April 2021 contradict such a hypothesis. In contrast, we posit that greater NPP alone does not explain shifts in the OMZ onset that we observed in such a timeframe.
Many lines of evidence suggest that several biogeochemical factors control epipelagic oxygen consumption and, thus, the OMZ onset [12,126,127,128]. In particular, POM aggregate size and density (e.g., aggregates that contain large diatoms and/or dense calcite ballast) can play a critical role in pelagic organic matter remineralisation [127]. If NPP peaks result in larger and/or faster sinking POM [127], organic matter residence time in the epipelagic zone decreases, which leads to less intense aerobic remineralisation [129,130]. Thus, the OMZ onset deepens despite the greater POM flux [128]. The production of fast-sinking POM aggregates often happens at the terminus of blooms when nutrient limitation occurs. Phytoplankton increase transparent exopolymer particle (TEP) production and/or carbohydrate storage which leads to denser POM aggregates [127,131].
Fast-sinking and/or large POM aggregate [127,128,129,130,131] appears as a plausible driver for the deeper OMZ onset we observed in March–April 2021. However, we cannot ascertain nor quantify if POM aggregates in this period displayed a sinking velocity that differed from other intervals in our timeseries. The ballast fraction (i.e., sum of PIC, BSi, and lithogenic fractions; Table 2) at 2008 m below sea surface (LM-2000) ranged from 74.8 to 86.8% over the entire timeseries and from 81.6 to 83.5% in March–April 2021. Thus, such limited temporal variability in ballast fraction and the fact that the LM-2000 lay well below the OMZ hamper our ability to attribute changes in OMZ onset to shifts in ballast alone. We lack information on TEP and POM aggregate density. Nonetheless, we hypothesise that large and fast-sinking POM aggregates led to diminished organic matter remineralisation and oxygen consumption in the epipelagic zone in March–April 2021 (e.g., [127,128,129,130,131]).
Short-term changes in metocean conditions also likely have contributed to the OMZ onset deepening. In the Northern Hemisphere, the passage of a long-lived anticyclonic mesoscale eddy along the 10–12° N CCZ corridor depresses isopycnals beneath its core by 100–300 m, displacing the upper oxycline downward and deepening the local OMZ onset [122,123]. Because such anticyclones are generated 4–6 times per year by Tehuantepec/Papagayo gap-wind forcing and take around 5–6 months to reach NORI-D [122,123], a transit during boreal spring 2021 is consistent with the deeper OMZ onset we observed. Such a mechanism would temporarily decouple OMZ onset depth from the local NPP signal and is consistent with the absence of a corresponding shoaling response despite elevated POC export in that period. Alternatively, an intrathermocline lens would have produced a comparable downward displacement of the upper oxycline while simultaneously deepening the lower oxycline over the eddy core (e.g., [132]). However, a precise correlation of anticyclonic mesoscale eddy passage and the OMZ onset deepening would require a specific temporal analysis of satellite altimetry and in situ measurements (e.g., [122]) over NORI-D.
The mean 2019–2022 seafloor POC rain rate totalled 2.1 mg C m−2 d−1 and it exhibited a narrow range (0.8–5.6 mg C m−2 d−1) despite the broad temporal variability in NPP. Most POC flux attenuation occurred in the epipelagic zone above the OMZ (Figure 5), albeit to a lesser extent compared to other open ocean areas [11,126]. We posit that such modest POC flux attenuation in NORI-D (mean exponent b = −0.538) occurred due to increased POM sinking efficiency [127,131]. Our findings broadly concur with observations from the ETP which showed that the most reactive, fresh organic matter compounds become consumed and/or remineralised in the upper water column [18,19,20,21,22,23,24]. Hydrostatic pressure causes leakage of high-reactivity dissolved organic matter components from POM beyond 2000 m, which further decreases POM reactivity towards the abyss [133]. Thus, the POC rain rate delivers altered organic matter with low/medium reactivity to benthic ecosystems [51,134,135]. Nonetheless, large episodic POC flux events occur and produce substantial POC rain rate [20,21,136]. Thus, we posit that NORI-D’s upper-end-range POC rain rate resulted from large episodic POC flux events that followed high NPP periods (Figure 4). It remains possible that our POC flux estimates did not fully capture large POM aggregates due to sediment trap undersampling [20,21,137]. Thus, the POC rain rate can at times underestimate organic matter delivery to NORI-D’s benthic ecosystem. Nonetheless, the relatively narrow range of abyssal POC rain rate compared to the substantially larger temporal variability in the epipelagic NPP remained consistent across the sediment trap records. Therefore, although measurement uncertainty may influence the magnitude of episodic flux events, it does not alter the broader conclusion that most POC attenuation occurred within the upper water column and that temporal variability in organic matter delivery to the seafloor became dampened relative to surface production variability.

4.2. Benthic Natural Variability

We observed a narrow interannual variability range in benthic organic matter components across 2020–2022. Here, we discuss the drivers of such temporal trends, and the main biogeochemical processes that affect benthic organic matter dynamics in NORI-D.

4.2.1. Interannual Shifts in Benthic Organic Matter Characteristics

A PCA summarised the three-year seafloor temporal dynamics in NORI-D, which explained 69.01% of total data variability (Figure 12). PC1 (45.92%) positively correlated with TOC, TN, Db, and porewater oxygen 0–1 linear slope (i.e., a proxy for oxygen consumption rate) and negatively with total lipids concentration. PC2 (23.09%) positively correlated with sediment median particle size and porosity; it negatively correlated with porewater oxygen consumption rate and total lipids concentration. Furthermore, the PCA highlighted a somewhat clear separation between C5A–C5D (2020–2021) and C7A (2022). The distinction from 2022 to 2020–2021 mainly arose from the more heterogeneous sediment physical characteristics and bulk organic matter distribution, as well as the greater oxygen and total lipid consumption at the sediment surface.
Although TOC and TN content displayed no significant temporal differences over 2020–2022, we observed a somewhat more uneven TOC and TN distribution in 2022. Furthermore, we recorded significant temporal differences in δ13C-TOC and C:N ratio (Figure 9). Similarly, total lipid composition drastically changed in 2022 relative to 2020–2021 (Figure 10). Interestingly, neither δ15N-TN (Figure 9) nor total amino acid concentration revealed any significant temporal differences. Amino acid molar composition also remained relatively unaltered over time (Figure 11). Overall, these findings suggest that although organic matter availability did not substantially change over time, changes in organic matter quality, particularly regarding carbon compositional characteristics, played a key role in driving benthic processes in the upper sediment layers between 2020–2021 and 2022. Meanwhile, compositional nitrogen characteristics remained temporally unchanged and had negligible impacts in benthic processes in the three-year timeframe.
We observed greater and deeper sediment bioturbation (Figure 7) alongside lower porewater oxygen consumption at 0–1 cm bsf (Figure 8) in 2020–2021. In contrast, we recorded a shift in 2022 towards more heterogeneous benthic conditions. Porewater oxygen consumption intensified at 0–1 cm bsf whereas bioturbation rate and mixed-layer depth decreased. These biogeochemical changes in 2022 paralleled an overall decline in total phytodetritus concentration and chlorophyll-a relative composition [138]. They also co-occurred with an overall benthic community structure shift [139]. In particular, abundance of macrofauna and meiofauna metazoans decreased, whereas foraminifera and microbes showed an increase in diversity in 2022 [140]. Similar changes in benthic ecology dynamics alongside shifts in biogeochemical processes occur across the ETP (e.g., [22,90,91,141]).
These change in benthic processes that we recorded in 2022 occurred after relatively large peaks in POC flux on 29 March–18 April 2020 (LM-500) and 16 April–7 May 2022 (RM-500) (Figure 4). The seafloor sampling in C7A spanned over 26 July–10 August 2022 (Table 1). Thus, the time lag between POC flux and C7A multicore samples varies between two to four months depending on each sediment trap time interval considered. Such a mismatch between POC flux and benthic ecology shifts represents a typical feature in the abyssal ETP where delayed responses in benthic organic matter respiration often occur in a comparable timeframe (e.g., [8,21,24,136]). Such pulses in POC flux resulted in a benthic ecology succession that favoured foraminifera and microbes assemblages over benthic metazoans [140], which led to biogeochemical shifts that we captured as a snapshot in C7A.

4.2.2. Benthic Organic Matter Sources, Transformation, and Burial

The seafloor experienced modest temporal fluctuations in POC rain rate (Figure 5) in NORI-D, partially in response to variations in epipelagic processes (Figure 4). Between 2020 and 2022, the C:N ratio, δ13C-TOC, δ15N-TN (Figure 9), and phytopigment records [138] largely showed that the POC flux primarily delivered organic matter that originated from phytoplanktonic detritus [96,97,101,142]. Lipid (Figure 10) and amino acid (Figure 11) records also confirmed that benthic organic matter originated from phytodetritus [22,102,107,143]. We also observed a small contribution from long-chain fatty acids, alcohols, and n-alkanes (Supplementary Materials Data) that mainly derive from leaf waxes [144]. Thus, benthic organic matter in NORI-D also contains a minor terrestrial contribution that originates from distal aeolian sources over the Pacific Ocean [10,38]. Notwithstanding, phytodetritus comprises the main source of benthic organic matter in NORI-D despite the apparent lipid compositional change that occurred between 2020–2021 and 2022. Ketones had a larger relative contribution than fatty acids in 2022 which suggests likely compositional changes in POC input with a greater contribution from haptophytes [145]. Such compositional changes in lipids recorded in July–August 2022 followed peaks in POC flux that occurred in March–May 2022 (Figure 4), which suggests a transition in phytoplankton community composition or simply changes in POM sinking velocity [127]. Interestingly, amino acid relative composition remained relatively similar over 2020–2022, which suggests that particulate organic nitrogen input did not change in character [107].
We observed that benthic organic matter underwent extensive consumption and remineralisation in the upper sediment layers, which concurs with typical records from the abyssal ETP [37,141,146,147,148,149,150]. The predominant oxic surface sediment conditions in NORI-D (Figure 8) and well-mixed upper sediment layers (Figure 7) led to great TOC and TN consumption in the top 0–3 cm bsf (Figure 9). Thus, organic matter reactivity decreased in deeper sediment layers [134]. Microbial aerobic organic matter remineralisation represents the main respiration pathway across the ETP [8,20,23,137,151,152]. It accounts for 80–90% of organic matter degradation in the upper 0–1 cm bsf [37,150]. Furthermore, this process shows a tight coupling with microbial nitrification [148,153]. Lipid (Figure 10) and amino acid (Figure 11) records showed that the microbial remineralisation process preferentially consumed the most reactive organic matter compounds and selectively preserved the least reactive ones [100,103,111]. Microbes gradually remineralised fatty acids while selectively preserved n-alkanes, sterols, and ketones. Furthermore, ketones prevailed over fatty acids in 2022, which suggests (besides changes in input) a more extensive fatty acid preferential loss than 2020–2021. The more extensive decline in chlorophyll-a relative to total phytodetritus in 2022 also suggests a preferential remineralisation of more reactive organic matter components [138]. Moreover, the C:N ratio [95], δ15N-TN [97,98,99], hopanoids [38,102], and non-protein amino acids [80,81,110] revealed that bacterial processes progressively altered phytodetritus. Thus, the phytodetritus that escapes remineralisation at the seafloor and becomes buried beyond the bioturbated layer in NORI-D comprises diagenetically altered, low-reactivity organic matter [22,38,102,107,138].

5. Implications and Conclusions

5.1. How Does Short-Term Temporal Variability Affect Benthic–Pelagic Coupling in NORI-D?

NORI-D experienced substantial temporal variability in biogeochemical processes from the sea surface to the abyssal seafloor between 2019 and 2022. The temporal variability mainly owed to episodic mesoscale processes, seasonality, and ENSO cycles, which impacted organic matter dynamics in distinct timescales (e.g., months to years).
Several lines of evidence from the ETP have shown that temporal fluctuations in POM production at the sea surface and supply to the abyssal seafloor affect the timing of benthic organic matter remineralisation, oxygen utilisation, nutrient recycling, and carbon burial efficiency [18,23,137,152]. Furthermore, such temporal fluctuations also modulate benthic ecosystem functioning. The quantity and quality of POM that enters the benthic boundary layer plays a huge role in shaping deep-sea benthic community structure [24,90,136,154] and it has huge impacts on organic matter recycling, burial, and benthic-pelagic coupling [6,155,156]. POM input flux to the abyssal seafloor impacts abundance, diversity, and trophic interactions of metazoans [157,158], protists [159,160], and procaryotes [161,162] in both space and time. Contemporaneous findings from NORI-D’s benthic campaigns in 2020–2022 have captured the ecological transition that followed the (inter)annual variability in epipelagic organic matter production and transfer to the seafloor. Compositional changes in phytodetritus records (i.e., a proxy for organic matter quality and/or reactivity) between 2020–2021 and 2022 [138] occurred alongside a shift in benthic community structure in response to the variability in food supply [139,140].
Based on our findings and those from recent benthic ecology studies [138,139,140], it becomes evident that short-term variability in epipelagic organic matter dynamics affects benthic–pelagic coupling in NORI-D, particularly due to episodic mesoscale processes [122,123,124,132] and ENSO fluctuations that go beyond the seasonal variability ranges over the 10°NTR [48,49]. Therefore, benthic–pelagic coupling and benthic ecology experience different amplitude changes depending on the prevailing metocean conditions (e.g., changes from El Niño years to La Niña years [22,102,107,141,154]).
Climate change poses a risk to dramatically alter water column stratification processes and, thus, affect nutrient availability and epipelagic organic matter production over the ETP. These effects can cascade down to the abyssal seafloor and impose further succession in benthic community structure and benthic–pelagic coupling [163]. A 24-year timeseries study has identified substantial changes in food supply and benthic processes in the ETP due to an increase in punctuated episodic POC super pulses. These regime changes occur due to the connectivity with shifts in upper ocean processes that may result in part from climate change [152]. Current model-derived climate change projections predict a 3 °C warming over the ETP by 2100 [164]. However, uncertainty still remains with respect to the accuracy of these model ensembles in predicting ENSO fluctuations towards the end of the century. Thus, it remains unclear how climate change may affect the cyclicity and magnitude of El Niño–La Niña phases in the near future [165]. Therefore, the understanding of climate change impacts on benthic–pelagic coupling over the ETP and NORI-D still require further advances that addresses these model shortcomings.

5.2. Critical Knowledge for Impact Assessment and Monitoring Purposes

Since the initial commercial interest for polymetallic nodules in the CCZ emerged in the 1970s [166], a few research projects have addressed how DSM would impact the seafloor spatially and temporally (e.g., [31,167,168]). However, these studies often cannot clearly devolve natural variability in seafloor conditions and the impacts that derived from experimental DSM trials. Furthermore, DSM technology has evolved in the past 50 years. Thus, EIA should focus on impacts that arise from modern DSM technology [33].
Our environmental monitoring programme in NORI-D [46] has two implications. First, it represents one of the largest and most comprehensive biogeochemical studies in the ETP since the 1992 Central (140° W) Equatorial Pacific S–N (12° S–10° N) Transect Study [22,102,107] and the over-30-year long-term monitoring of Station M (34°50′ N–123°00′ W) [19,20,21,137,152,169]. It helps to fill the knowledge gap in organic matter cycling at a critically and globally important portion of the abyssal ETP that mostly relies on large-scale studies (e.g., [34,35,36,37,38]). Second, it delivers a detailed characterisation of NORI-D’s current baseline conditions and its natural ranges of variability in physicochemical and biogeochemical dynamics. Alongside the benthic ecology study [139,140], the biogeochemical baseline study will support robust EIA and monitoring programmes for DSM in the CCZ.

Supplementary Materials

The following supporting information can be downloaded at https://www.mdpi.com/article/10.3390/jmse14111019/s1. Supplementary Tables: Table S1. Hydrographic Cast Deployments in NORI-D between 2019 and 2021; Table S2. Mooring Deployment and Recovery in NORI-D between 2019 and 2022; Table S3. Sediment Trap Individual Sample Time Sheet in NORI-D for the Long Mooring at 2000 metres below sea level (LM-2000); Table S4. Sediment Trap Individual Sample Time Sheet in NORI-D for the Long Mooring at 500 metres above seafloor (LM-500); Table S5. Sediment Trap Individual Sample Time Sheet in NORI-D for the Reference Mooring 2 at 500 metres above seafloor (RM-500); Table S6. Multicore Deployments in NORI-D between 2020 and 2022; Table S7. Seafloor Geochemical Analyses in each Multicore Location in NORI-D between 2020 and 2022; Table S8. Multicore Sediment Sample Subsection and Analysis for each Geochemical Parameter in NORI-D at each Campaign (5A, 5D, 7A) between 2020 and 2022.

Author Contributions

Conceptualization, F.S.F., P.D., L.M. and M.C.; Data curation, F.S.F. and P.D.; Writing—original draft, F.S.F.; Writing—review & editing, F.S.F., P.D., A.P.W., J.B., C.D., L.M. and M.C. All authors have read and agreed to the published version of the manuscript.

Funding

This study was funded by TMC the Metals Company Inc. (The Metals Company) through its subsidiary Nauru Ocean Resources Inc. (NORI). NORI holds exploration rights to the NORI-D contract area in the CCZ regulated by the International Seabed Authority and sponsored by the government of Nauru. This is contribution TMC/NORI/D/042.

Institutional Review Board Statement

Not applicable.

Informed Consent Statement

Not applicable.

Data Availability Statement

The satellite-derived data sets for net primary productivity and export production can be accessed at the Oregon State Ocean Productivity (http://orca.science.oregonstate.edu/npp_products.php, accessed on 17 December 2024). All water column physicochemical and seafloor geochemical data sets presented in this study were produced by subcontractors on behalf of NORI/TMC between 2019 and 2022. NORI submitted these data sets to the ISA’s data repository DeepData Database (https://isa.org.jm/deepdata-database/, accessed on 28 April 2026) according to NORI’s exploration licence commitments.

Acknowledgments

The authors would like to thank Scott Wilson, Katie Allen, Toby Adamson, and all personnel that participated in the eight offshore campaigns for their technical and logistic support. The authors also thank Daniel J. Ford for assistance with the satellite net primary production data sets. The authors also acknowledge the subcontractors that collected and analysed the data sets on behalf of NORI/TMC. The University of Leeds was contracted to collect and analyse the seafloor geochemistry data sets (Contract Ref: RG.GEOG. 120433 {1847}). CSA was contract to collect and analyse the water column physicochemical and sediment trap data sets (Contract Ref: 006216). This study was funded by TMC the Metals Company Inc. (The Metals Company) through its subsidiary Nauru Ocean Resources Inc. (NORI). NORI holds exploration rights to the NORI-D contract area in the CCZ regulated by the International Seabed Authority and sponsored by the government of Nauru. This is contribution TMC/NORI/D/042.

Conflicts of Interest

F.S.F., P.D., A.P.W., J.B., C.D. and M.C. are employees at TMC. L.M. was an employee at TMC during project development, data acquisition, and analyses.

Abbreviations

The following abbreviations are used in this manuscript:
10° N Thermocline Ridge10°NTR
13 °C Water13CW
Above Seafloorasf
Antarctic Intermediate WaterAAIW
Below Seafloorbsf
Biogenic SilicaBsi
Bioturbation Length/Mixed-Layer Depthzb
Bioturbation Mixing RateDb
Carbon-Based Production ModelCbPM
Clarion-Clipperton ZoneCCZ
Conductivity, Temperature, DepthCTD
Deep-Sea MiningDSM
Dissolved Oxygen DO 
Eastern Tropical North PacificETNP
Eastern Tropical PacificETP
El Niño Southern OscillationENSO
Environmental Impact AssessmentEIA
Equatorial UndercurrentEUC
International Seabed AuthorityISA
Intertropical Convergence ZoneITCZ
Lead-210210Pb
Lead-210 excess210Pbxs
Long MooringLM
Long Mooring at 2000 mLM-2000
Long Mooring at 500 m asfLM-500
Nauru Ocean Resources Inc. NORI
Net Primary ProductionNPP
Nonlinear Least SquaresNLS
Northern Equatorial Pacific Intermediate WaterNEPIW
North Pacific Intermediate WaterNPIW
Northern Subsurface Counter CurrentNSCC
Ocean Colour Climate Change InitiativeOC-CCI
Ocean Niño IndexONI
Oxygen Minimum ZoneOMZ
Pacific Decadal OscillationPDO
Particulate Inorganic CarbonPIC
Particulate NitrogenPN
Particulate Organic CarbonPOC
Particulate Organic MatterPOM
Particulate Organic Nitrogen PON
Practical Salinity UnitsPSU
Principal Component AnalysisPCA
Radium-226226Ra
Reference Mooring 2RM
Reference Mooring at 500 m asfRM-500
Root Mean Standard ErrorRMSE
The Metals CompanyTMC
TOC-to-TN Molar RatioC:N ratio
Total Hydrolysable Amino AcidsTHAA
Total Lipid Extract TLE
Total NitrogenTN
Total Nitrogen–Nitrogen Isotope Ratioδ15N-TN
Total Organic Carbon TOC
Total Organic Carbon–Carbon Isotope Ratioδ13C-TOC
Transparent Exopolymer ParticleTEP
Tropical Surface WaterTSW

Appendix A. Multicore Deployment and Recovery Assessment

Appendix A.1. Pre-Deployment Procedure

Prior to every new multicore (Oktopus MC20) deployment, the Perspex tubes and rubber bungs (used to cap cores top and bottom after recovery) were thoroughly washed with cold-filtered seawater and 10% bleach solution and stored in closed containers until use. All tube and bung handling occurred whilst using clean nitrile gloves throughout.
A clean set of Perspex tubes was installed on the MC20 for each new deployment. A minimum of four Rhizon-drilled tubes (pre-drilled holes at 0.5 cm intervals and covered with tape for later porewater extractions) were loaded onto the carousel per deployment, with one pre-drilled tube in each side of the multicore frame.

Appendix A.2. Post-Recovery Procedure

Following recovery of the MC20 to deck, clean top and bottom bungs were carefully inserted into all core tubes. Regardless of sampling success, all core tubes were removed from the MC20 unit and individually transferred to the 20-core rack for assessment. Each core was placed on the rack at a corresponding position relative to the MC20 frame (e.g., “MC20-Core 1” placed in the “Core 1” slot on the core rack). Care was taken whilst handling the cores to not disturb the integrity of the sediment–water interface and sediment horizons during core bunging, removal from the MC20 unit, and transfer to the core rack.
All 20 cores (including any empty core tubes where no sediment was recovered) were systematically photographed prior to the quality assurance–quality control (QA-QC) assessment following the NORI multicore photography procedure. All photographs were labelled with the deployment information, a scale bar, and a colour reference bar. The NORI multicore QA-QC assessment procedure was completed for each individual core. The results were recorded in the NORI MC20 QA-QC log sheet. After the QA-QC assessment, each individual core was marked as either ACCEPT, REJECT, or NO SAMPLE.
The QA-QC protocol found an individual core acceptable (i.e., an ACCEPT mark) when the core complied with each of the following criteria:
  • Undisturbed sediment–water interface;
  • No nodule dragging;
  • Horizontal surface and no gaps;
  • Undisturbed stratigraphy for slicing;
  • No cracks, gaps, or air bubbles in the horizons that were required to be sliced;
  • Topwater intact (i.e., not wholly or partially drained due to leakage);
  • Topwater clarity acceptable;
  • A minimum of 24 cm to allow a 4 cm buffer for bung removal and extrusion puck insertion.
The QA-QC protocol rejected any core when it did not meet any of the “ACCEPT” criteria listed above. A NO SAMPLE occurred when no sediment was recovered due to an operational MC20 malfunction. Malfunction includes (but is not limited to): water column trigger, top/bottom caps misfiring, and caps not closing and/or sealing correctly. Malfunction notes were also recorded in the MC20 QA-QC log sheet.
The temperature-sensitive cores for the geochemistry work scope were prioritised in the photography and QA-QC assessment workflow. These cores were assigned and transferred to the temperature-controlled laboratory as quickly as possible for processing.

References

  1. Worden, A.Z.; Follows, M.J.; Giovannoni, S.J.; Wilken, S.; Zimmerman, A.E.; Keeling, P.J. Rethinking the Marine Carbon Cycle: Factoring in the Multifarious Lifestyles of Microbes. Science 2015, 347, 1257594. [Google Scholar] [CrossRef] [PubMed]
  2. Nowicki, M.; DeVries, T.; Siegel, D.A. Quantifying the Carbon Export and Sequestration Pathways of the Ocean’s Biological Carbon Pump. Glob. Biogeochem. Cycles 2022, 36, e2021GB007083. [Google Scholar] [CrossRef]
  3. Eppley, R.W.; Peterson, B.J. Particulate Organic Matter Flux and Planktonic New Production in the Deep Ocean. Nature 1979, 282, 677–680. [Google Scholar] [CrossRef]
  4. Suess, E. Particulate Organic Carbon Flux in the Oceans—Surface Productivity and Oxygen Utilization. Nature 1980, 288, 260–263. [Google Scholar] [CrossRef]
  5. Siegel, D.A.; DeVries, T.; Cetinić, I.; Bisson, K.M. Quantifying the Ocean’s Biological Pump and Its Carbon Cycle Impacts on Global Scales. Annu. Rev. Mar. Sci. 2023, 15, 329–356. [Google Scholar] [CrossRef] [PubMed]
  6. Arndt, S.; Hülse, D. Burned or Buried: What Controls the Long-Term Preservation of Organic Carbon? Elements 2026, 22, 42–47. [Google Scholar] [CrossRef]
  7. Berner, R.A. The Long-Term Carbon Cycle, Fossil Fuels and Atmospheric Composition. Nature 2003, 426, 323–326. [Google Scholar] [CrossRef]
  8. Smith, K.L. Food Energy Supply and Demand: A Discrepancy between Particulate Organic Carbon Flux and Sediment Community Oxygen Consumption in the Deep Ocean. Limnol. Oceanogr. 1987, 32, 201–220. [Google Scholar] [CrossRef]
  9. Honjo, S.; Manganini, S.J.; Krishfield, R.A.; Francois, R. Particulate Organic Carbon Fluxes to the Ocean Interior and Factors Controlling the Biological Pump: A Synthesis of Global Sediment Trap Programs since 1983. Prog. Oceanogr. 2008, 76, 217–285. [Google Scholar] [CrossRef]
  10. Gagosian, R.B.; Peltzer, E.T. The Importance of Atmospheric Input of Terrestrial Organic Material to Deep Sea Sediments. Org. Geochem. 1986, 10, 661–669. [Google Scholar] [CrossRef]
  11. Martin, J.H.; Knauer, G.A.; Karl, D.M.; Broenkow, W.W. Vertex: Carbon Cycling in the Northeast Pacific. Deep Sea Res. Part A Oceanogr. Res. Pap. 1987, 34, 267–285. [Google Scholar] [CrossRef]
  12. Li, R.; DeVries, T.; Siegel, D.A.; Primeau, F.W. Seasonality in Marine Organic Carbon Export and Sequestration Pathways. Glob. Biogeochem. Cycles 2026, 40, e2025GB008603. [Google Scholar] [CrossRef]
  13. Pasquero, C.; Bracco, A.; Provenzale, A. Impact of the Spatiotemporal Variability of the Nutrient Flux on Primary Productivity in the Ocean. J. Geophys. Res. Ocean. 2005, 110, C07005. [Google Scholar] [CrossRef]
  14. Chavez, F.P.; Messié, M.; Pennington, J.T. Marine Primary Production in Relation to Climate Variability and Change. Annu. Rev. Mar. Sci. 2011, 3, 227–260. [Google Scholar] [CrossRef]
  15. Martin, A.P.; Richards, K.J.; Bracco, A.; Provenzale, A. Patchy Productivity in the Open Ocean. Glob. Biogeochem. Cycles 2002, 16, 9-1–9-9. [Google Scholar] [CrossRef]
  16. Seiter, K.; Hensen, C.; Schröter, J.; Zabel, M. Organic Carbon Content in Surface Sediments—Defining Regional Provinces. Deep Sea Res. Part I Oceanogr. Res. Pap. 2004, 51, 2001–2026. [Google Scholar] [CrossRef]
  17. Dunne, J.P.; Sarmiento, J.L.; Gnanadesikan, A. A Synthesis of Global Particle Export from the Surface Ocean and Cycling through the Ocean Interior and on the Seafloor. Glob. Biogeochem. Cycle 2007, 21, GB4006. [Google Scholar] [CrossRef]
  18. Smith, K.L.; Huffard, C.L.; Sherman, A.D.; Ruhl, H.A. Decadal Change in Sediment Community Oxygen Consumption in the Abyssal Northeast Pacific. Aquat. Geochem. 2016, 22, 401–417. [Google Scholar] [CrossRef]
  19. Smith, K.L.; Kaufmann, R.S. Long-Term Discrepancy between Food Supply and Demand in the Deep Eastern North Pacific. Science 1999, 284, 1174–1177. [Google Scholar] [CrossRef]
  20. Smith, K.L.; Ruhl, H.A.; Kaufmann, R.S.; Kahru, M. Tracing Abyssal Food Supply Back to Upper-Ocean Processes over a 17-Year Time Series in the Northeast Pacific. Limnol. Oceanogr. 2008, 53, 2655–2667. [Google Scholar] [CrossRef]
  21. Smith, K.L.; Ruhl, H.A.; Huffard, C.L.; Messie, M.; Kahru, M. Episodic Organic Carbon Fluxes from Surface Ocean to Abyssal Depths during Long-Term Monitoring in NE Pacific. Proc. Natl. Acad. Sci. USA 2018, 115, 12235–12240. [Google Scholar] [CrossRef] [PubMed]
  22. Wakeham, S.G.; Lee, C.; Hedges, J.I. Fluxes of Major Biochemicals in the Equatorial Pacific Ocean. In Dynamics and Characterization of Marine Organic Matter; Handa, N., Tanoue, E., Hama, T., Eds.; Springer: Berlin/Heidelberg, Germany, 2000; pp. 117–140. [Google Scholar]
  23. Smith, K.L.; Baldwin, R.J. Seasonal Fluctuations in Deep-Sea Sediment Community Oxygen-Consumption: Central and Eastern North Pacific. Nature 1984, 307, 624–626. [Google Scholar] [CrossRef]
  24. Smith, K.L.; Baldwin, R.J.; Karl, D.M.; Boetius, A. Benthic Community Responses to Pulses in Pelagic Food Supply: North Pacific Subtropical Gyre. Deep Sea Res. Part I Oceanogr. Res. Pap. 2002, 49, 971–990. [Google Scholar] [CrossRef]
  25. Wang, C.; Fiedler, P.C. ENSO Variability and the Eastern Tropical Pacific: A Review. Prog. Oceanogr. 2006, 69, 239–266. [Google Scholar] [CrossRef]
  26. Fiedler, P.C. Environmental Change in the Eastern Tropical Pacific Ocean: Review of ENSO and Decadal Variability. Mar. Ecol. Prog. Ser. 2002, 244, 265–283. [Google Scholar] [CrossRef]
  27. ISA. Technical Study 6: A Geological Model of Polymetallic Nodule Deposits in the Clarion-Clipperton Fracture Zone; International Seabed Authority: Kingston, Jamaica, 2010. [Google Scholar]
  28. Wang, C.; Zhou, S.; Shu, X.; Song, H. Deep-Sea Mining: A Potential Solution to Secure Critical Energy Minerals Availability. npj Ocean Sustain. 2025, 4, 59. [Google Scholar] [CrossRef]
  29. Hyman, J.; Sonter, L.J.; McDonald-Madden, E.; Watson, J.E.M.; Mervine, E.M.; Bull, J.W.; Dawson, C.; Lloyd, T.J.; Luckeneder, S.; Maron, M.; et al. Growing Nickel Supply from the Tropics Threatens Priority Conservation Areas. Nat. Ecol. Evol. 2026, 1–11. [Google Scholar] [CrossRef]
  30. Jones, D.O.B.; Amon, D.J.; Chapman, A.S.A. Deep-Sea Mining: Processes and Impacts. In Natural Capital and Exploitation of the Deep Ocean; Baker, M., Ramirez-Llodra, E., Tyler, P., Eds.; Oxford University Press: Oxford, UK, 2020; pp. 91–110. ISBN 978-0-19-884165-4. [Google Scholar]
  31. Glover, A.G.; Arias, M.B.; Bribiesca-Contreras, G.; Copley, J.T.; Dahlgren, T.G.; Drazen, J.C.; Drennan, R.; Ingels, J.; Jones, D.O.B.; O’Malley, B.J.; et al. The Environmental Impacts of Deep-Sea Mining. Curr. Biol. 2026, 36, R400–R419. [Google Scholar] [CrossRef]
  32. Hyman, J.; Stewart, R.A.; Sahin, O.; Clarke, M.; Clark, M.R. Visioning a Framework for Effective Environmental Management of Deep-Sea Polymetallic Nodule Mining: Drivers, Barriers, and Enablers. J. Clean. Prod. 2022, 337, 130487. [Google Scholar] [CrossRef]
  33. Ingels, J.; Leduc, D.; Ullmann, A.; Rowden, A. Assessing Mining Impacts in the Deep Sea. Nat. Ecol. Evol. 2026, 10, 172–174. [Google Scholar] [CrossRef] [PubMed]
  34. Washburn, T.W.; Jones, D.O.B.; Wei, C.-L.; Smith, C.R. Environmental Heterogeneity throughout the Clarion-Clipperton Zone and the Potential Representativity of the APEI Network. Front. Mar. Sci. 2021, 8, 661685. [Google Scholar] [CrossRef]
  35. McQuaid, K.A.; Attrill, M.J.; Clark, M.R.; Cobley, A.; Glover, A.G.; Smith, C.R.; Howell, K.L. Using Habitat Classification to Assess Representativity of a Protected Area Network in a Large, Data-Poor Area Targeted for Deep-Sea Mining. Front. Mar. Sci. 2020, 7, 558860. [Google Scholar] [CrossRef]
  36. Simon-Lledó, E.; Amon, D.J.; Bribiesca-Contreras, G.; Cuvelier, D.; Durden, J.M.; Ramalho, S.P.; Uhlenkott, K.; Arbizu, P.M.; Benoist, N.; Copley, J.; et al. Carbonate Compensation Depth Drives Abyssal Biogeography in the Northeast Pacific. Nat. Ecol. Evol. 2023, 7, 1388–1397. [Google Scholar] [CrossRef]
  37. Volz, J.B.; Mogollon, J.M.; Geibert, W.; Arbizu, P.M.; Koschinsky, A.; Kasten, S. Natural Spatial Variability of Depositional Conditions, Biogeochemical Processes and Element Fluxes in Sediments of the Eastern Clarion-Clipperton Zone, Pacific Ocean. Deep Sea Res. Part I Oceanogr. Res. Pap. 2018, 140, 159–172. [Google Scholar] [CrossRef]
  38. Jones, D.O.B.; Simon-Lledó, E.; Amon, D.J.; Bett, B.J.; Caulle, C.; Clément, L.; Connelly, D.P.; Dahlgren, T.G.; Durden, J.M.; Drazen, J.C.; et al. Environment, Ecology, and Potential Effectiveness of an Area Protected from Deep-Sea Mining (Clarion Clipperton Zone, Abyssal Pacific). Prog. Oceanogr. 2021, 197, 102653. [Google Scholar] [CrossRef]
  39. Mewes, K.; Mogollón, J.M.; Picard, A.; Rühlemann, C.; Kuhn, T.; Nöthen, K.; Kasten, S. Impact of Depositional and Biogeochemical Processes on Small Scale Variations in Nodule Abundance in the Clarion-Clipperton Fracture Zone. Deep Sea Res. Part I Oceanogr. Res. Pap. 2014, 91, 125–141. [Google Scholar] [CrossRef]
  40. Mewes, K.; Mogollón, J.M.; Picard, A.; Rühlemann, C.; Eisenhauer, A.; Kuhn, T.; Ziebis, W.; Kasten, S. Diffusive Transfer of Oxygen from Seamount Basaltic Crust into Overlying Sediments: An Example from the Clarion–Clipperton Fracture Zone. Earth Planet. Sci. Lett. 2016, 433, 215–225. [Google Scholar] [CrossRef]
  41. Mogollón, J.M.; Mewes, K.; Kasten, S. Quantifying Manganese and Nitrogen Cycle Coupling in Manganese-Rich, Organic Carbon-Starved Marine Sediments: Examples from the Clarion-Clipperton Fracture Zone. Geophys. Res. Lett. 2016, 43, 7114–7123. [Google Scholar] [CrossRef]
  42. Volz, J.B.; Haffert, L.; Haeckel, M.; Koschinsky, A.; Kasten, S. Impact of Small-Scale Disturbances on Geochemical Conditions, Biogeochemical Processes and Element Fluxes in Surface Sediments of the Eastern Clarion–Clipperton Zone, Pacific Ocean. Biogeosciences 2020, 17, 1113–1131. [Google Scholar] [CrossRef]
  43. Versteegh, G.J.M.; Koschinsky, A.; Kuhn, T.; Preuss, I.; Kasten, S. Geochemical Consequences of Oxygen Diffusion from the Oceanic Crust into Overlying Sediments and Its Significance for Biogeochemical Cycles Based on Sediments of the Northeast Pacific. Biogeosciences 2021, 18, 4965–4984. [Google Scholar] [CrossRef]
  44. Kuhn, T.; Versteegh, G.J.M.; Villinger, H.; Dohrmann, I.; Heller, C.; Koschinsky, A.; Kaul, N.; Ritter, S.; Wegorzewski, A.V.; Kasten, S. Widespread Seawater Circulation in 18–22 Ma Oceanic Crust: Impact on Heat Flow and Sediment Geochemistry. Geology 2017, 45, 799–802. [Google Scholar] [CrossRef]
  45. Hollingsworth, A.L.; Jones, D.O.B.; Young, C.R. Spatial Variability of Abyssal Nitrifying Microbes in the North-Eastern Clarion-Clipperton Zone. Front. Mar. Sci. 2021, 8, 663420. [Google Scholar] [CrossRef]
  46. NORI. Collector Test Study: Environmental Impact Statement; The Metals Company: Vancouver, BC, Canada, 2022. [Google Scholar]
  47. ISA. Draft Guidelines for the Establishment of Baseline Environmental Data (ISBA/27/C/11); International Seabed Authority: Kingston, Jamaica, 2022. [Google Scholar]
  48. Fiedler, P.C.; Talley, L.D. Hydrography of the Eastern Tropical Pacific: A Review. Prog. Oceanogr. 2006, 69, 143–180. [Google Scholar] [CrossRef]
  49. Pennington, J.T.; Mahoney, K.L.; Kuwahara, V.S.; Kolber, D.D.; Calienes, R.; Chavez, F.P. Primary Production in the Eastern Tropical Pacific: A Review. Prog. Oceanogr. 2006, 69, 285–317. [Google Scholar] [CrossRef]
  50. Karstensen, J.; Stramma, L.; Visbeck, M. Oxygen Minimum Zones in the Eastern Tropical Atlantic and Pacific Oceans. Prog. Oceanogr. 2008, 77, 331–350. [Google Scholar] [CrossRef]
  51. Seiter, K.; Hensen, C.; Zabel, M. Benthic Carbon Mineralization on a Global Scale. Glob. Biogeochem. Cycle 2005, 19, GB1010. [Google Scholar] [CrossRef]
  52. Dutkiewicz, A.; Müller, R.D.; O’Callaghan, S.; Jónasson, H. Census of Seafloor Sediments in the World’s Ocean. Geology 2015, 43, 795–798. [Google Scholar] [CrossRef]
  53. Parianos, J.M. Geology of the Clarion-Clipperton Zone: Fundamental Attributes in Polymetallic Nodule Resource Development. Doctoral Thesis, Universidade de Évora, Évora, Portugal, 2021. [Google Scholar]
  54. Ryan-Keogh, T.J.; Thomalla, S.J.; Chang, N.; Moalusi, T. A New Global Oceanic Multi-Model Net Primary Productivity Data Product. Earth Syst. Sci. Data 2023, 15, 4829–4848. [Google Scholar] [CrossRef]
  55. Sathyendranath, S.; Brewin, R.J.W.; Brockmann, C.; Brotas, V.; Calton, B.; Chuprin, A.; Cipollini, P.; Couto, A.B.; Dingle, J.; Doerffer, R.; et al. An Ocean-Colour Time Series for Use in Climate Studies: The Experience of the Ocean-Colour Climate Change Initiative (OC-CCI). Sensors 2019, 19, 4285. [Google Scholar] [CrossRef] [PubMed]
  56. Westberry, T.; Behrenfeld, M.J.; Siegel, D.A.; Boss, E. Carbon-Based Primary Productivity Modeling with Vertically Resolved Photoacclimation. Glob. Biogeochem. Cycles 2008, 22, GB2024. [Google Scholar] [CrossRef]
  57. Webb, E.J.; Magi, B.I. The Ensemble Oceanic Niño Index. Int. J. Climatol. 2022, 42, 5321–5341. [Google Scholar] [CrossRef]
  58. Henson, S.A.; Sanders, R.; Madsen, E.; Morris, P.J.; Le Moigne, F.; Quartly, G.D. A Reduced Estimate of the Strength of the Ocean’s Biological Carbon Pump. Geophys. Res. Lett. 2011, 38, 10–14. [Google Scholar] [CrossRef]
  59. Merchant, C.J.; Embury, O.; Bulgin, C.E.; Block, T.; Corlett, G.K.; Fiedler, E.; Good, S.A.; Mittaz, J.; Rayner, N.A.; Berry, D.; et al. Satellite-Based Time-Series of Sea-Surface Temperature since 1981 for Climate Applications. Sci. Data 2019, 6, 223. [Google Scholar] [CrossRef]
  60. Good, S.A.; Embury, O.; Bulgin, C.E.; Mittaz, J. ESA Sea Surface Temperature Climate Change Initiative (SST_cci): Level 4 Analysis Climate Data Record, Version 2.1; European Space Agency: Paris, France, 2019. [Google Scholar]
  61. Downes, P.; Cuesta, A.; Denny, A.; Tengberg, A.; Hall, P.O.J.; Trellevik, L.-K.; Svellingen, W.; Jaspars, M.; Webber, A.P.; Sales de Freitas, F.; et al. Extraordinary Claims Require Extraordinary Evidence: Evaluating Nodule-Associated Dark Oxygen Production. Front. Mar. Sci. 2025, 12, 1721853. [Google Scholar] [CrossRef]
  62. Glud, R.N. Oxygen Dynamics of Marine Sediments. Mar. Biol. Res. 2008, 4, 243–289. [Google Scholar] [CrossRef]
  63. Froelich, P.N. Analysis of Organic Carbon in Marine Sediments1. Limnol. Oceanogr. 1980, 25, 564–572. [Google Scholar] [CrossRef]
  64. Mortlock, R.A.; Froelich, P.N. A Simple Method for the Rapid Determination of Biogenic Opal in Pelagic Marine Sediments. Deep Sea Res. Part A Oceanogr. Res. Pap. 1989, 36, 1415–1426. [Google Scholar] [CrossRef]
  65. Pilskaln, C.H.; Paduan, J.B. Laboratory Techniques for the Handling and Geochemical Analysis of Water Column Particulate and Surface Sediment Samples. Monterey Bay Aquar. Res. Inst. (MBARI) Tech. Rep. 1992, 92–99. [Google Scholar]
  66. Anderson, L. On the Hydrogen and Oxygen-Content of Marine-Phytoplankton. Deep-Sea Res. Part I-Oceanogr. Res. Pap. 1995, 42, 1675–1680. [Google Scholar] [CrossRef]
  67. Yu, E.-F.; Francois, R.; Bacon, M.P.; Fleer, A.P. Fluxes of 230Th and 231Pa to the Deep Sea: Implications for the Interpretation of Excess 230Th and 231Pa/230Th Profiles in Sediments. Earth Planet. Sci. Lett. 2001, 191, 219–230. [Google Scholar] [CrossRef]
  68. Scholten, J.C.; Fietzke, J.; Vogler, S.; Rutgers van der Loeff, M.M.; Mangini, A.; Koeve, W.; Waniek, J.; Stoffers, P.; Antia, A.; Kuss, J. Trapping Efficiencies of Sediment Traps from the Deep Eastern North Atlantic:: The 230Th Calibration. Deep Sea Res. Part II Top. Stud. Oceanogr. 2001, 48, 2383–2408. [Google Scholar] [CrossRef]
  69. Burdige, D.J. Geochemistry of Marine Sediments; Princeton University Press: Princeton, NJ, USA, 2006. [Google Scholar]
  70. Mason, C. NMBAQC’s Best Practice Guidance. Particle Size Analysis for Supporting Biological Analysis; National Marine Biological AQC Coordinating Committee: Manchester, UK, 2016. [Google Scholar]
  71. van Beek, P.; Souhaut, M.; Lansard, B.; Bourquin, M.; Reyss, J.-L.; von Ballmoos, P.; Jean, P. LAFARA: A New Underground Laboratory in the French Pyrénées for Ultra Low-Level Gamma-Ray Spectrometry. J. Environ. Radioact. 2013, 116, 152–158. [Google Scholar] [CrossRef]
  72. Schelske, C.L.; Peplow, A.; Brenner, M.; Spencer, C.N. Low-Background Gamma Counting: Applications for210Pb Dating of Sediments. J. Paleolimnol. 1994, 10, 115–128. [Google Scholar] [CrossRef]
  73. Peng, T.-H.; Broecker, W.S.; Berger, W.H. Rates of Benthic Mixing in Deep-Sea Sediment as Determined by Radioactive Tracers. Quat. Res. 1979, 11, 141–149. [Google Scholar] [CrossRef]
  74. Boudreau, B.P. Mathematics of Tracer Mixing in Sediments; I, Spatially-Dependent, Diffusive Mixing. Am. J. Sci. 1986, 286, 161–198. [Google Scholar] [CrossRef]
  75. Boudreau, B.P. Mathematics of Tracer Mixing in Sediments; II, Nonlocal Mixing and Biological Conveyor-Belt Phenomena. Am. J. Sci. 1986, 286, 199–238. [Google Scholar] [CrossRef]
  76. DeMaster, D.J.; Cochran, J.K. Particle Mixing Rates in Deep-Sea Sediments Determined from Excess 210Pb and 32Si Profiles. Earth Planet. Sci. Lett. 1982, 61, 257–271. [Google Scholar] [CrossRef]
  77. Yu, W.; Lin, F.; Lin, L. Bioturbation in Sediment Cores from the Clarion-Clipperton Zone in the Northeast Pacific: Evidence from Excess 210Pb. Mar. Pollut. Bull. 2023, 188, 114635. [Google Scholar] [CrossRef] [PubMed]
  78. Faust, J.c.; Knies, J. Organic Matter Sources in North Atlantic Fjord Sediments. Geochem. Geophys. Geosystems 2019, 20, 2872–2885. [Google Scholar] [CrossRef]
  79. Kiriakoulakis, K.; Blackbird, S.; Ingels, J.; Vanreusel, A.; Wolff, G.A. Organic Geochemistry of Submarine Canyons: The Portuguese Margin. Deep Sea Res. Part II Top. Stud. Oceanogr. 2011, 58, 2477–2488. [Google Scholar] [CrossRef]
  80. Vandewiele, S.; Cowie, G.; Soetaert, K.; Middelburg, J.J. Amino Acid Biogeochemistry and Organic Matter Degradation State across the Pakistan Margin Oxygen Minimum Zone. Deep Sea Res. Part II Top. Stud. Oceanogr. 2009, 56, 376–392. [Google Scholar] [CrossRef]
  81. Cowie, G.; Hedges, J.I. Sources and Reactivities of Amino Acids in a Coastal Marine Environment. Limnol. Oceanogr. 1992, 37, 703–724. [Google Scholar] [CrossRef]
  82. The Scientific Python Development Environment Spyder IDE. 2025. Available online: https://www.spyder-ide.org/ (accessed on 28 April 2026).
  83. Harris, C.R.; Millman, K.J.; van der Walt, S.J.; Gommers, R.; Virtanen, P.; Cournapeau, D.; Wieser, E.; Taylor, J.; Berg, S.; Smith, N.J.; et al. Array Programming with NumPy. Nature 2020, 585, 357–362. [Google Scholar] [CrossRef]
  84. The Pandas Development Team. Pandas-Dev/Pandas: Pandas; Zenodo: Geneva, Switzerland, 2025. [Google Scholar]
  85. Hunter, J.D. Matplotlib: A 2D Graphics Environment. Comput. Sci. Eng. 2007, 9, 90–95. [Google Scholar] [CrossRef]
  86. Waskom, M.L. Seaborn: Statistical Data Visualization. J. Open Source Softw. 2021, 6, 3021. [Google Scholar] [CrossRef]
  87. Virtanen, P.; Gommers, R.; Oliphant, T.E.; Haberland, M.; Reddy, T.; Cournapeau, D.; Burovski, E.; Peterson, P.; Weckesser, W.; Bright, J. SciPy 1.0: Fundamental Algorithms for Scientific Computing in Python. Nat. Methods 2020, 17, 261–272. [Google Scholar] [CrossRef]
  88. Pedregosa, F.; Varoquaux, G.; Gramfort, A.; Michel, V.; Thirion, B.; Grisel, O.; Blondel, M.; Prettenhofer, P.; Weiss, R.; Dubourg, V.; et al. Scikit-Learn: Machine Learning in Python. J. Mach. Learn. Res. 2011, 12, 2825–2830. [Google Scholar]
  89. Lutz, M.J.; Caldeira, K.; Dunbar, R.B.; Behrenfeld, M.J. Seasonal Rhythms of Net Primary Production and Particulate Organic Carbon Flux to Depth Describe the Efficiency of Biological Pump in the Global Ocean. J. Geophys. Res. 2007, 112, C10011. [Google Scholar] [CrossRef]
  90. Smith, C.R.; Hoover, D.J.; Doan, S.E.; Pope, R.H.; Demaster, D.J.; Dobbs, F.C.; Altabet, M.A. Phytodetritus at the Abyssal Seafloor across 10° of Latitude in the Central Equatorial Pacific. Deep Sea Res. Part II Top. Stud. Oceanogr. 1996, 43, 1309–1338. [Google Scholar] [CrossRef]
  91. Smith, C.R.; Berelson, W.; Demaster, D.J.; Dobbs, F.C.; Hammond, D.; Hoover, D.J.; Pope, R.H.; Stephens, M. Latitudinal Variations in Benthic Processes in the Abyssal Equatorial Pacific: Control by Biogenic Particle Flux. Deep Sea Res. Part II Top. Stud. Oceanogr. 1997, 44, 2295–2317. [Google Scholar] [CrossRef]
  92. Cochran, J.K.; Krishnaswami, S. Radium, Thorium, Uranium, and 210 Pb in Deep-Sea Sediments and Sediment Pore Waters from the North Equatorial Pacific. Am. J. Sci. 1980, 280, 849–889. [Google Scholar] [CrossRef]
  93. Hyeong, K.; Seo, I.; Lee, H.-B.; Yoo, C.M.; Chi, S.-B.; Um, I.K. Variability in Particle Mixing Rates in Sediments with Polymetallic Nodules in the Equatorial Eastern Pacific as Determined from Measurements of Excess 210Pb. Ocean Sci. J. 2018, 53, 355–368. [Google Scholar] [CrossRef]
  94. Jung, H.-S.; Lee, C.-B. Growth of Diagenetic Ferromanganese Nodules in an Oxic Deep-Sea Sedimentary Environment, Northeast Equatorial Pacific. Mar. Geol. 1999, 157, 127–144. [Google Scholar] [CrossRef]
  95. Grundmanis, V.; Murray, W. Aerobic Respiration in Pelagic Marine-Sediments. Geochim. Cosmochim. Acta 1982, 46, 1101–1120. [Google Scholar] [CrossRef]
  96. Voss, M.; Dippner, J.W.; Montoya, J.P. Nitrogen Isotope Patterns in the Oxygen-Deficient Waters of the Eastern Tropical North Pacific Ocean. Deep Sea Res. Part I Oceanogr. Res. Pap. 2001, 48, 1905–1921. [Google Scholar] [CrossRef]
  97. Tesdal, J.-E.; Galbraith, E.D.; Kienast, M. Nitrogen Isotopes in Bulk Marine Sediment: Linking Seafloor Observations with Subseafloor Records. Biogeosciences 2013, 10, 101–118. [Google Scholar] [CrossRef]
  98. Macko, S.A.; Estep, M.L.F. Microbial Alteration of Stable Nitrogen and Carbon Isotopic Compositions of Organic Matter. Org. Geochem. 1984, 6, 787–790. [Google Scholar] [CrossRef]
  99. Freudenthal, T.; Wagner, T.; Wenzhöfer, F.; Zabel, M.; Wefer, G. Early Diagenesis of Organic Matter from Sediments of the Eastern Subtropical Atlantic: Evidence from Stable Nitrogen and Carbon Isotopes. Geochim. Cosmochim. Acta 2001, 65, 1795–1808. [Google Scholar] [CrossRef]
  100. Zonneveld, K.a.F.; Versteegh, G.J.M.; Kasten, S.; Eglinton, T.I.; Emeis, K.-C.; Huguet, C.; Koch, B.P.; de Lange, G.J.; de Leeuw, J.W.; Middelburg, J.J.; et al. Selective Preservation of Organic Matter in Marine Environments: Processes and Impact on the Sedimentary Record. Biogeosciences 2010, 7, 483–511. [Google Scholar] [CrossRef]
  101. Prahl, F.G.; Bennett, J.T.; Carpenter, R. The Early Diagenesis of Aliphatic Hydrocarbons and Organic Matter in Sedimentary Particulates from Dabob Bay, Washington. Geochim. Cosmochim. Acta 1980, 44, 1967–1976. [Google Scholar] [CrossRef]
  102. Wakeham, S.G.; Hedges, J.I.; Lee, C.; Peterson, M.L.; Hernes, P.J. Compositions and Transport of Lipid Biomarkers through the Water Column and Surficial Sediments of the Equatorial Pacific Ocean. Deep Sea Res. Part II Top. Stud. Oceanogr. 1997, 44, 2131–2162. [Google Scholar] [CrossRef]
  103. Canuel, E.A.; Martens, C.S. Reactivity of Recently Deposited Organic Matter: Degradation of Lipid Compounds near the Sediment-Water Interface. Geochim. Cosmochim. Acta 1996, 60, 1793–1806. [Google Scholar] [CrossRef]
  104. Rontani, J.-F.; Zabeti, N.; Wakeham, S.G. Degradation of Particulate Organic Matter in the Equatorial Pacific Ocean: Biotic or Abiotic? Limnol. Oceanogr. 2011, 56, 333–349. [Google Scholar] [CrossRef]
  105. Freitas, F.S.; Pancost, R.D.; Arndt, S. The Impact of Alkenone Degradation on Paleothermometry: A Model-derived Assessment. Paleoceanography 2017, 32, 648–672. [Google Scholar] [CrossRef]
  106. Ourisson, G.; Rohmer, M. Hopanoids. 2. Biohopanoids: A Novel Class of Bacterial Lipids. Acc. Chem. Res. 1992, 25, 403–408. [Google Scholar] [CrossRef]
  107. Lee, C.; Wakeham, S.G.; Hedges, J.I. Composition and Flux of Particulate Amino Acids and Chloropigments in Equatorial Pacific Seawater and Sediments. Deep Sea Res. Part I Oceanogr. Res. Pap. 2000, 47, 1535–1568. [Google Scholar] [CrossRef]
  108. Gaye, B.; Lahajnar, N.; Harms, N.; Paul, S.A.L.; Rixen, T.; Emeis, K.-C. What Can We Learn from Amino Acids about Oceanic Organic Matter Cycling and Degradation? Biogeosciences 2022, 19, 807–830. [Google Scholar] [CrossRef]
  109. Hecky, R.E.; Mopper, K.; Kilham, P.; Degens, E.T. The Amino Acid and Sugar Composition of Diatom Cell-Walls. Mar. Biol. 1973, 19, 323–331. [Google Scholar] [CrossRef]
  110. Pedersen, A.-G.U.; Thomsen, T.R.; Lomstein, B.A.; Jørgensen, N.O.G. Bacterial Influence on Amino Acid Enantiomerization in a Coastal Marine Sediment. Limnol. Oceanogr. 2001, 46, 1358–1369. [Google Scholar] [CrossRef]
  111. Dauwe, B.; Middelburg, J.J.; Herman, P.M.J.; Heip, C.H.R. Linking Diagenetic Alteration of Amino Acids and Bulk Organic Matter Reactivity. Limnol. Oceanogr. 1999, 44, 1809–1814. [Google Scholar] [CrossRef]
  112. Gillard, B.; Harbour, R.P.; Nowald, N.; Thomsen, L.; Iversen, M.H. Vertical Distribution of Particulate Matter in the Clarion Clipperton Zone (German Sector)—Potential Impacts From Deep-Sea Mining Discharge in the Water Column. Front. Mar. Sci. 2022, 9, 820947. [Google Scholar] [CrossRef]
  113. Evans, N.; Tichota, J.; Ruef, W.; Moffett, J.; Devol, A. Rapid Expansion of Fixed Nitrogen Deficit in the Eastern Pacific Ocean Revealed by 50-Year Time Series. Glob. Biogeochem. Cycles 2023, 37, e2022GB007575. [Google Scholar] [CrossRef]
  114. Evans, N.; Boles, E.; Kwiecinski, J.V.; Mullen, S.; Wolf, M.; Devol, A.H.; Moriyasu, R.; Nam, S.; Babbin, A.R.; Moffett, J.W. The Role of Water Masses in Shaping the Distribution of Redox Active Compounds in the Eastern Tropical North Pacific Oxygen Deficient Zone and Influencing Low Oxygen Concentrations in the Eastern Pacific Ocean. Limnol. Oceanogr. 2020, 65, 1688–1705. [Google Scholar] [CrossRef]
  115. Amador, J.A.; Alfaro, E.J.; Lizano, O.G.; Magaña, V.O. Atmospheric Forcing of the Eastern Tropical Pacific: A Review. Prog. Oceanogr. 2006, 69, 101–142. [Google Scholar] [CrossRef]
  116. Stramma, L.; Fischer, T.; Grundle, D.S.; Krahmann, G.; Bange, H.W.; Marandino, C.A. Observed El Niño Conditions in the Eastern\hack\newline Tropical Pacific in October 2015. Ocean Sci. 2016, 12, 861–873. [Google Scholar] [CrossRef]
  117. Margolskee, A.; Frenzel, H.; Emerson, S.; Deutsch, C. Ventilation Pathways for the North Pacific Oxygen Deficient Zone. Glob. Biogeochem. Cycles 2019, 33, 875–890. [Google Scholar] [CrossRef]
  118. Kessler, W.S. The Circulation of the Eastern Tropical Pacific: A Review. Prog. Oceanogr. 2006, 69, 181–217. [Google Scholar] [CrossRef]
  119. Poupon, M.A.; Resplandy, L.; Lévy, M.; Bopp, L. Pacific Decadal Oscillation Influences Tropical Oxygen Minimum Zone Extent and Obscures Anthropogenic Changes. Geophys. Res. Lett. 2023, 50, e2022GL102123. [Google Scholar] [CrossRef]
  120. Duteil, O.; Oschlies, A.; Böning, C.W. Pacific Decadal Oscillation and Recent Oxygen Decline in the Eastern Tropical Pacific Ocean. Biogeosciences 2018, 15, 7111–7126. [Google Scholar] [CrossRef]
  121. Duteil, O.; Frenger, I.; Getzlaff, J. The Riddle of Eastern Tropical Pacific Ocean Oxygen Levels: The Role of the Supply by Intermediate-Depth Waters. Ocean Sci. 2021, 17, 1489–1507. [Google Scholar] [CrossRef]
  122. Purkiani, K.; Paul, A.; Vink, A.; Walter, M.; Schulz, M.; Haeckel, M. Evidence of Eddy-Related Deep-Ocean Current Variability in the Northeast Tropical Pacific Ocean Induced by Remote Gap Winds. Biogeosciences 2020, 17, 6527–6544. [Google Scholar] [CrossRef]
  123. Purkiani, K.; Haeckel, M.; Haalboom, S.; Schmidt, K.; Urban, P.; Gazis, I.-Z.; de Stigter, H.; Paul, A.; Walter, M.; Vink, A. Impact of a Long-Lived Anticyclonic Mesoscale Eddy on Seawater Anomalies in the Northeastern Tropical Pacific Ocean: A Composite Analysis from Hydrographic Measurements, Sea Level Altimetry Data, and Reanalysis Model Products. Ocean Sci. 2022, 18, 1163–1181. [Google Scholar] [CrossRef]
  124. Aleynik, D.; Inall, M.E.; Dale, A.; Vink, A. Impact of Remotely Generated Eddies on Plume Dispersion at Abyssal Mining Sites in the Pacific. Sci. Rep. 2017, 7, 16959. [Google Scholar] [CrossRef]
  125. Engel, A.; Kiko, R.; Dengler, M. Organic Matter Supply and Utilization in Oxygen Minimum Zones. Annu. Rev. Mar. Sci. 2022, 14, 355–378. [Google Scholar] [CrossRef]
  126. Bressac, M.; Laurenceau-Cornec, E.C.; Kennedy, F.; Santoro, A.E.; Paul, N.L.; Briggs, N.; Carvalho, F.; Boyd, P.W. Decoding Drivers of Carbon Flux Attenuation in the Oceanic Biological Pump. Nature 2024, 633, 587–593. [Google Scholar] [CrossRef] [PubMed]
  127. Zhu, J.; Cheng, J.; Zeng, J.; Zhang, W.; Liu, C.; Effiong, K.S.; Hao, Q. A Review of Phytoplankton Sinking Rates: Mechanisms, Methodologies, and Biogeochemical Implications. Biology 2026, 15, 130. [Google Scholar] [CrossRef] [PubMed]
  128. Bretagnon, M.; Paulmier, A.; Garçon, V.; Dewitte, B.; Illig, S.; Leblond, N.; Coppola, L.; Campos, F.; Velazco, F.; Panagiotopoulos, C.; et al. Modulation of the Vertical Particle Transfer Efficiency in the Oxygen Minimum Zone off Peru. Biogeosciences 2018, 15, 5093–5111. [Google Scholar] [CrossRef]
  129. Rasse, R.; Dall’Olmo, G. Do Oceanic Hypoxic Regions Act as Barriers for Sinking Particles? A Case Study in the Eastern Tropical North Atlantic. Glob. Biogeochem. Cycles 2019, 33, 1611–1630. [Google Scholar] [CrossRef]
  130. Trull, T.W.; Bray, S.G.; Buesseler, K.O.; Lamborg, C.H.; Manganini, S.; Moy, C.; Valdes, J. In Situ Measurement of Mesopelagic Particle Sinking Rates and the Control of Carbon Transfer to the Ocean Interior during the Vertical Flux in the Global Ocean (VERTIGO) Voyages in the North Pacific. Deep Sea Res. Part II Top. Stud. Oceanogr. 2008, 55, 1684–1695. [Google Scholar] [CrossRef]
  131. Tian, D.; Li, X.; Song, J.; Wang, Q.; Zhao, F.; Ma, J.; Liu, S.; Yuan, H.; Duan, L. Underestimating Carbon Export in Oligotrophic Ocean: Evidence From Transparent Exopolymer Particles in Western Pacific Seawaters. J. Geophys. Res. Ocean. 2025, 130, e2025JC022703. [Google Scholar] [CrossRef]
  132. Auger, P.A.; Bento, J.P.; Hormazabal, S.; Morales, C.E.; Bustamante, A. Mesoscale Variability in the Boundaries of the Oxygen Minimum Zone in the Eastern South Pacific: Influence of Intrathermocline Eddies. J. Geophys. Res. Ocean. 2021, 126, e2019JC015272. [Google Scholar] [CrossRef]
  133. Stief, P.; Niggemann, J.; Bligh, M.; Buck-Wiese, H.; Wünsch, U.; Steinke, M.; Hehemann, J.-H.; Glud, R.N. Hydrostatic Pressure Induces Strong Leakage of Dissolved Organic Matter from “Marine Snow” Particles. Sci. Adv. 2026, 12, eaec5677. [Google Scholar] [CrossRef]
  134. Freitas, F.S.; Pika, P.A.; Kasten, S.; Jørgensen, B.B.; Rassmann, J.; Rabouille, C.; Thomas, S.; Sass, H.; Pancost, R.D.; Arndt, S. New Insights into Large-Scale Trends of Apparent Organic Matter Reactivity in Marine Sediments and Patterns of Benthic Carbon Transformation. Biogeosciences 2021, 18, 4651–4679. [Google Scholar] [CrossRef]
  135. Pika, P.A.; Hülse, D.; Eglinton, T.I.; Arndt, S. Regional and Global Patterns of Apparent Organic Matter Reactivity in Marine Sediments. Glob. Biogeochem. Cycles 2023, 37, e2022GB007636. [Google Scholar] [CrossRef]
  136. Smith, K.L.; Sherman, A.D.; Huffard, C.L.; McGill, P.R.; Henthorn, R.; Von Thun, S.; Ruhl, H.A.; Kahru, M.; Ohman, M.D. Large Salp Bloom Export from the Upper Ocean and Benthic Community Response in the Abyssal Northeast Pacific: Day to Week Resolution. Limnol. Oceanogr. 2014, 59, 745–757. [Google Scholar] [CrossRef]
  137. Smith, K.L.; Kaufmann, R.S.; Baldwin, R.J.; Carlucci, A.F. Pelagic-Benthic Coupling in the Abyssal Eastern North Pacific: An 8-Year Time-Series Study of Food Supply and Demand. Limnol. Oceanogr. 2001, 46, 543–556. [Google Scholar] [CrossRef]
  138. Iannotta, I.A.; Schwing, P.T.; Lam, T.S.; Baldrighi, E.; Lemée, J.R.; Downes, P.P.; O’Malley, B.J. Spatiotemporal Characterization of Sedimentary Phytopigments in the Southeastern Clarion-Clipperton Zone: Baseline Time Series and Effects of a Deep-Sea Mining Test. Elem. Sci. Anthr. 2026, 14, 00070. [Google Scholar] [CrossRef]
  139. Stewart, E.C.D.; Wiklund, H.; Neal, L.; Bribiesca-Contreras, G.; Drennan, R.; Boolukos, C.M.B.; King, L.D.; Rabone, M.; Valls Domedel, G.; Serpell-Stevens, A.; et al. Impacts of an Industrial Deep-Sea Mining Trial on Macrofaunal Biodiversity. Nat. Ecol. Evol. 2026, 10, 318–329. [Google Scholar] [CrossRef] [PubMed]
  140. Ingels, J.; O’Malley, B.; Laroche, O.; Schwing, P.; Santos, G. Natural Temporal Variation Drives Biodiversity and Coupled Ecosystem Shifts in Abyssal Benthos Targeted for Mining.
  141. Berelson, W.M.; Anderson, R.F.; Dymond, J.; Demaster, D.; Hammond, D.E.; Collier, R.; Honjo, S.; Leinen, M.; Mcmanus, J.; Pope, R.; et al. Biogenic Budgets of Particle Rain, Benthic Remineralization and Sediment Accumulation in the Equatorial Pacific. Deep Sea Res. Part II Top. Stud. Oceanogr. 1997, 44, 2251–2282. [Google Scholar] [CrossRef]
  142. Meyers, P.A. Preservation of Elemental and Isotopic Source Identification of Sedimentary Organic Matter. Chem. Geol. 1994, 114, 289–302. [Google Scholar] [CrossRef]
  143. Wakeham, S.G.; Canuel, E.A. Degradation and Preservation of Organic Matter in Marine Sediments. In Marine Organic Matter: Biomarkers, Isotopes and DNA; Volkman, J.K., Ed.; Springer: Berlin/Heidelberg, Germany, 2006; pp. 295–321. ISBN 978-3-540-32987-9. [Google Scholar]
  144. Eglinton, G.; Gonzalez, A.G.; Hamilton, R.J.; Raphael, R.A. Hydrocarbon Constituents of the Wax Coatings of Plant Leaves: A Taxonomic Survey. Phytochemistry 1962, 1, 89–102. [Google Scholar] [CrossRef]
  145. Volkman, J.K. Ecological and Environmental Factors Affecting Alkenone Distributions in Seawater and Sediments. Geochem. Geophys. Geosystems 2000, 1, 1036. [Google Scholar] [CrossRef]
  146. Emerson, S.; Jahnke, R.; Bender, M.; Froelich, P.; Klinkhammer, G.; Bowser, C.; Setlock, G. Early Diagenesis in Sediments from the Eastern Equatorial Pacific, I. Pore Water Nutrient and Carbonate Results. Earth Planet. Sci. Lett. 1980, 49, 57–80. [Google Scholar] [CrossRef]
  147. Emerson, S.; Fischer, K.; Reimers, C.; Heggie, D. Organic Carbon Dynamics and Preservation in Deep-Sea Sediments. Deep Sea Res. Part A. Oceanogr. Res. Pap. 1985, 32, 1–21. [Google Scholar] [CrossRef]
  148. Hammond, D.E.; McManus, J.; Berelson, W.M.; Kilgore, T.E.; Pope, R.H. Early Diagenesis of Organic Material in Equatorial Pacific Sediments: Stoichiometry and Kinetics. Deep Sea Res. Part II Top. Stud. Oceanogr. 1996, 43, 1365–1412. [Google Scholar] [CrossRef]
  149. Jahnke, R.A.; Emerson, S.R.; Murray, J. A Model of Oxygen Reduction, Denitrification, and Organic Matter Mineralization in Marine Sediments. Limnol. Oceanogr. 1982, 27, 610–623. [Google Scholar] [CrossRef]
  150. Martin, W.R.; Bender, M.; Leinen, M.; Orchardo, J. Benthic Organic Carbon Degradation and Biogenic Silica Dissolution in the Central Equatorial Pacific. Deep Sea Res. Part A Oceanogr. Res. Pap. 1991, 38, 1481–1516. [Google Scholar] [CrossRef]
  151. Smith, K.L.; Laver, M.B.; Brown, N.O. Sediment Community Oxygen Consumption and Nutrient Exchange in the Central and Eastern North Pacific. Limnol. Oceanogr. 1983, 28, 882–898. [Google Scholar] [CrossRef]
  152. Smith, K.L.; Ruhl, H.A.; Kahru, M.; Huffard, C.L.; Sherman, A.D. Deep Ocean Communities Impacted by Changing Climate over 24 y in the Abyssal Northeast Pacific Ocean. Proc. Natl. Acad. Sci. USA 2013, 110, 19838–19841. [Google Scholar] [CrossRef] [PubMed]
  153. Middelburg, J.J.; Soetaert, K.; Herman, P.M.J.; Heip, C.H.R. Denitrification in Marine Sediments: A Model Study. Glob. Biogeochem. Cycles 1996, 10, 661–673. [Google Scholar] [CrossRef]
  154. Stephens, M.P.; Kadko, D.C.; Smith, C.R.; Latasa, M. Chlorophyll-a and Pheopigments as Tracers of Labile Organic Carbon at the Central Equatorial Pacific Seafloor. Geochim. Cosmochim. Acta 1997, 61, 4605–4619. [Google Scholar] [CrossRef]
  155. Middelburg, J.J. Reviews and Syntheses: To the Bottom of Carbon Processing at the Seafloor. Biogeosciences 2018, 15, 413–427. [Google Scholar] [CrossRef]
  156. LaRowe, D.E.; Arndt, S.; Bradley, J.A.; Estes, E.R.; Hoarfrost, A.; Lang, S.Q.; Lloyd, K.G.; Mahmoudi, N.; Orsi, W.D.; Shah Walter, S.R.; et al. The Fate of Organic Carbon in Marine Sediments: New Insights from Recent Data and Analysis. Earth-Sci. Rev. 2020, 204, 103146. [Google Scholar] [CrossRef]
  157. Shimabukuro, M.; Zeppilli, D.; Leduc, D.; Wenzhöfer, F.; Berg, P.; Rowden, A.A.; Glud, R.N. Intra- and Inter-Spatial Variability of Meiofauna in Hadal Trenches Is Linked to Microbial Activity and Food Availability. Sci. Rep. 2022, 12, 4338. [Google Scholar] [CrossRef]
  158. Ruhl, H.A.; Smith, K.L. Shifts in Deep-Sea Community Structure Linked to Climate and Food Supply. Science 2004, 305, 513–515. [Google Scholar] [CrossRef]
  159. Loubere, P.; Fariduddin, M. Benthic Foraminifera and the Flux of Organic Carbon to the Seabed. In Modern Foraminifera; Sen Gupta, B.K., Ed.; Springer: Dordrecht, The Netherlands, 2003; pp. 181–199. ISBN 978-0-306-48104-8. [Google Scholar]
  160. Gooday, A.J.; Rathburn, A.E. Temporal Variability in Living Deep-Sea Benthic Foraminifera: A Review. Earth-Sci. Rev. 1999, 46, 187–212. [Google Scholar] [CrossRef]
  161. Moeseneder, M.M.; Smith, K.L.; Ruhl, H.A.; Jones, D.O.B.; Witte, U.; Prosser, J.I. Temporal and Depth-Related Differences in Prokaryotic Communities in Abyssal Sediments Associated with Particulate Organic Carbon Flux. Deep Sea Res. Part I Oceanogr. Res. Pap. 2012, 70, 26–35. [Google Scholar] [CrossRef]
  162. Danovaro, R.; Molari, M.; Corinaldesi, C.; Dell’Anno, A. Macroecological Drivers of Archaea and Bacteria in Benthic Deep-Sea Ecosystems. Sci. Adv. 2016, 2, e1500961. [Google Scholar] [CrossRef]
  163. Smith, K.L.; Ruhl, H.A.; Bett, B.J.; Billett, D.S.M.; Lampitt, R.S.; Kaufmann, R.S. Climate, Carbon Cycling, and Deep-Ocean Ecosystems. Proc. Natl. Acad. Sci. USA 2009, 106, 19211–19218. [Google Scholar] [CrossRef] [PubMed]
  164. Torres Parra, R.R.; Bustos Usta, D.F.; Otero Díaz, L.J.; Moreno-Ardila, M.P. Eastern Tropical Pacific Atmospheric and Oceanic Projected Changes Based on CMIP6 Models. Prog. Oceanogr. 2024, 229, 103362. [Google Scholar] [CrossRef]
  165. McGregor, S.; Ong, E.Q.Y.; Planton, Y.Y. Understanding CMIP6 Multi-Model Ensemble Projected Pacific Warming Pattern Variability. Geophys. Res. Lett. 2026, 53, e2025GL118815. [Google Scholar] [CrossRef]
  166. NOAA. Deep Seabed Mining: Draft Programmatic Environmental Impact Statement; National Oceanic and Atmospheric Administration: Washington, DC, USA, 1981. [Google Scholar]
  167. Jones, D.O.B.; Kaiser, S.; Sweetman, A.K.; Smith, C.R.; Menot, L.; Vink, A.; Trueblood, D.; Greinert, J.; Billett, D.S.M.; Arbizu, P.M.; et al. Biological Responses to Disturbance from Simulated Deep-Sea Polymetallic Nodule Mining. PLoS ONE 2017, 12, e0171750. [Google Scholar] [CrossRef] [PubMed]
  168. Jones, D.O.B.; Arias, M.B.; Van Audenhaege, L.; Blackbird, S.; Boolukos, C.; Bribiesca-Contreras, G.; Copley, J.T.; Dale, A.; Evans, S.; Fleming, B.F.M.; et al. Long-Term Impact and Biological Recovery in a Deep-Sea Mining Track. Nature 2025, 642, 112–118. [Google Scholar] [CrossRef]
  169. Smith, K.L., Jr.; Druffel, E.R.M. Long Time-Series Monitoring of an Abyssal Site in the NE Pacific: An Introduction. Deep Sea Res. Part II Top. Stud. Oceanogr. 1998, 45, 573–586. [Google Scholar] [CrossRef]
Figure 1. Multiplatform sampling locations in the environmental baseline programme at NORI-D between 2019 and 2022 (Table 1). (A) NORI-D location (red dot in the insert box) in the Eastern Tropical Pacific. (B,C) Areas in NORI-D that had greater sampling efforts density. See Supplementary Materials for complete list of hydrographic casts (Table S1), moorings (Table S2), and multicores (Table S6).
Jmse 14 01019 g001
Figure 2. Water column physicochemical properties between 2019 and 2021: oxygen, black line; salinity, blue line; temperature, red line.
Jmse 14 01019 g002
Figure 3. Net primary production (NPP) overview in the Eastern Tropical Pacific and in NORI-D. (A) Mean (2015–2022) NPP. The red box indicates NORI-D. (B) Mean (2019–2022) NPP anomaly. (C) Mean NPP in NORI-D and 10°NTR and Oceanic Niño Index (ONI). NPP data source: http://orca.science.oregonstate.edu/npp_products.php (accessed on 17 December 2024).
Jmse 14 01019 g003
Figure 4. Net primary productivity (NPP), export production, and particulate organic carbon (POC) flux between 2019 and 2022. Orange bars represent each campaign (Table 1).
Jmse 14 01019 g004
Figure 5. Mean (solid line) and min–max (shaded area) particulate organic carbon (POC) flux (January 2019–July 2022). The black dots represent monthly satellite-derived export production estimates at 100 m and individual sediment trap POC flux observations at 2008, 3703, and 3808 m.
Jmse 14 01019 g005
Figure 6. Median (solid line) and 25–75% interquartile (shaded area) porosity, dry bulk density (ρs), and median particle size (φ).
Jmse 14 01019 g006
Figure 7. Median (solid line) and 25–75% interquartile (shaded area) excess lead-210 (210Pbxs), bioturbation rate (Db) and mixed-layer depth (zb).
Jmse 14 01019 g007
Figure 8. Median (solid line) and 25–75% interquartile (shaded area) porewater oxygen (O2) composite micro profiles.
Jmse 14 01019 g008
Figure 9. Median (solid line) and 25–75% interquartile (shaded area) total organic carbon (TOC), total nitrogen (TN), carbon-to-nitrogen molar ratio (C:N ratio), stable carbon isotope ratio in TOC (δ13C-TOC), and stable nitrogen isotope ratio in TN (δ15N-TN).
Jmse 14 01019 g009
Figure 10. Median (black bars) and 25–75% interquartile (grey lines) total lipids and relative composition: hopanoids (HOP), ketones (KET), sterols (STR), n-alkanes (ALK), n-alcohols (AOH), and total fatty acids (FAC).
Jmse 14 01019 g010
Figure 11. Median (black bars) and 25–75% interquartile (grey lines) total amino acids and molar composition: aspartic acid (ASP), threonine (THR), serine (SER), glutamic acids (GLU), glycine (GLY), alanine (ALA), valine (VAL), isoleucine (ILE), leucine (LEU), tyrosine (TYR), beta-alanine (βALA), histidine (HIS), ornithine (ORN), and arginine (ARG).
Jmse 14 01019 g011
Figure 12. Multiparameter three-year benthic biogeochemical trends at the seafloor surface.
Jmse 14 01019 g012
Table 1. Pelagic and benthic baseline monitoring campaigns in NORI-D from 2019 to 2022.
CampaignDescriptionOperations StartOperations EndVessel
C4AMetocean Baseline11 October 201916 October 2019Maersk Laucher
C4DMetocean Baseline26 June 20204 July 2020Maersk Laucher
C4EMetocean Baseline16 July 202123 July 2021Maersk Laucher
C5ABenthic Baseline28 October 202024 November 2020Maersk Laucher
C5BPelagic Baseline16 March 202116 April 2021Maersk Laucher
C5CPelagic Baseline2 October 202128 October 2021Maersk Laucher
C5DBenthic Baseline9 May 20212 June 2021Maersk Laucher
C7ABenthic Baseline26 July 202210 August 2022MV Island Pride
Table 2. Pelagic particle flux and composition from 2019 to 2022.
Mass Flux (mg m−2 d−1LM-2000LM-500RM-500
Total Particulate Matter31.4 ± 16.025.9 ± 11.225.3 ± 10.1
Particulate Inorganic Carbon13.6 ± 7.711.4 ± 6.610.6 ± 4.7
Biogenic Silica7.7 ± 4.17.3 ± 3.46.7 ± 3.0
Particulate Organic Matter5.7 ± 2.63.9 ± 1.84.1 ± 1.6
Particulate Organic Carbon3.2 ± 1.52.1 ± 1.02.3 ± 0.9
Lithogenic Matter4.3 ± 3.33.4 ± 2.13.8 ± 3.2
Disclaimer/Publisher’s Note: The statements, opinions and data contained in all publications are solely those of the individual author(s) and contributor(s) and not of MDPI and/or the editor(s). MDPI and/or the editor(s) disclaim responsibility for any injury to people or property resulting from any ideas, methods, instructions or products referred to in the content.