1. Introduction
Seagrass meadows are foundation habitats in shallow coastal waters. They support coastal biodiversity, stabilize seabed sediments, influence nutrient cycling, improve water clarity, and provide nursery habitat for many marine organisms [
1]. They are sensitive to coastal development, poor water quality, physical disturbance, and climate stress. Global assessments have documented long-term losses of seagrass area in many regions, with recovery in some sites after pressure reduction [
2,
3]. Habitat loss reduces ecosystem functions and may expose stored sediment carbon to remineralization [
4]. Seagrass meadows also contribute to coastal adaptation by stabilizing seabed sediments and attenuating wave energy [
5].
Blue carbon was introduced to describe carbon captured and stored by marine living organisms and ocean ecosystems [
6]. In coastal carbon accounting, the term is commonly used for organic carbon stored in vegetated coastal ecosystems, especially seagrass meadows, tidal marshes, and mangroves [
7,
8]. In seagrass meadows, organic carbon is stored in living shoots, roots, rhizomes, litter, and sediments. Sediment organic carbon often forms the largest pool because seagrass canopies trap suspended particles and belowground tissues help stabilize the sediment profile [
9,
10]. Current blue carbon research also separates standing carbon stocks from sequestration or burial rates, since these metrics answer different accounting questions [
4,
11].
Accurate carbon assessment requires regional field data. Seagrass carbon stocks vary with species composition, meadow structure, hydrodynamic exposure, sediment texture, organic matter source, and sampling depth [
9,
10]. This variation is clear in temperate
Zostera meadows. Studies from European and Northeast Pacific
Zostera marina meadows show large site-level differences in sediment organic carbon, and sediment properties can explain an important part of this variation [
12,
13,
14]. Consistent field surveys are needed to place local results within wider seagrass blue carbon research.
China has extensive coastal waters and diverse seagrass habitats. Field-based carbon-stock data remain limited in many northern coastal areas. In the Liaodong Peninsula and the northern Yellow Sea, reported seagrass species include
Zostera marina,
Zostera japonica,
Zostera caespitosa, and
Phyllospadix iwatensis [
15]. Previous surveys documented seagrass occurrence and distribution around the Changshan Islands [
15]. National habitat modeling suggests that potential suitable seagrass habitat may exceed the currently recorded distribution [
16]. These findings indicate a need for standardized carbon-stock assessment in mapped northern seagrass meadows.
The Changshan Archipelago supports temperate seagrass meadows along island coasts, shallow embayments, and sheltered nearshore waters [
15]. These meadows occur across multiple island zones and differ in mapped area, species occurrence, and sediment setting. This setting provides a useful regional case for examining how meadow extent and per-area carbon stock combine to shape total ecosystem carbon storage. Field-based estimates from the 0–100 cm sediment profile can also improve comparison between northern Chinese seagrass meadows and other temperate
Zostera systems.
This study assessed seagrass ecosystem carbon stocks in the Changshan Archipelago, Dalian, northern China. The objectives were to: (1) quantify plant biomass carbon stocks and 0–100 cm sediment organic carbon stocks across mapped seagrass meadow zones; (2) examine how carbon stock per unit area and mapped meadow area jointly determine zone-level total carbon stock; and (3) place this standardized regional baseline within the wider context of temperate Zostera blue carbon studies. The assessment focuses on standing ecosystem carbon stocks. Annual carbon sequestration rates are outside the scope of this assessment.
2. Materials and Methods
2.1. Study Area and Standardized Survey Design
The study was conducted in the Changshan Archipelago, Dalian, Liaoning Province, northern China. The archipelago is located in the northern Yellow Sea. Temperate seagrass meadows occur along island coasts, shallow embayments, and sheltered nearshore waters.
The field survey was conducted from August to September 2025. The survey design follows the
Technical Specification for Carbon Stock Survey and Assessment of Blue Carbon Ecosystems—Seagrass Beds, Trial Version issued by the Ministry of Natural Resources of China [
17]. The mapped seagrass meadow polygons were based on the 2021 marine ecosystem status survey organized by the Ministry of Natural Resources of China. These polygons were checked and confirmed during the 2025 carbon-stock field survey. Field verification recorded meadow presence, boundary location, seagrass species, station position, and local habitat conditions.
The confirmed meadow polygons covered 323.37 ha and were grouped into eight meadow zones: Dachangshan, Guanglu Island, Haxian Island, Haiyang Island, Shichengxiang, Saili Island, Xiaochangshan, and Zhangzi Island. These zones represented spatially separated meadow groups around islands or nearshore areas. They were used as the spatial units for sampling allocation, meadow-area calculation, and zone-level carbon-stock estimation.
A total of 39 sampling stations were placed inside the confirmed meadow polygons. Station allocation considered mapped meadow extent, spatial coverage within each zone, seagrass vegetation type, and local habitat conditions. Seagrass vegetation types were defined by species occurrence and mixed-species composition. Six stations were set in Dachangshan, Guanglu Island, Haxian Island, Xiaochangshan, and Zhangzi Island. Three stations were set in Haiyang Island, Shichengxiang, and Saili Island. The confirmed polygons were used to calculate meadow area for each zone. Zone-level meadow area was used to scale measured carbon stock per unit area to total carbon stock.
2.2. Field Sampling and Laboratory Analysis
At each sampling station, seagrass species, station location, quadrat information, and sediment-core information were recorded. Three 0.25 m2 quadrats were used for living seagrass biomass collection at each station. One sediment core was collected at the same station for 0–100 cm sediment sampling. The survey included 117 biomass quadrats and 39 sediment cores across the eight meadow zones.
Plant biomass sampling and processing. Living seagrass biomass was collected from each quadrat and separated into aboveground and belowground fractions according to the carbon-pool definitions in
Section 2.3. Plant samples were kept cool and protected from light after collection. In the laboratory, visible sediment and epiphytes were removed where necessary. Fresh samples were weighed before drying. They were dried at 60 °C to constant weight and weighed again to obtain dry mass. Dried samples were ground, passed through a 100-mesh sieve, and stored in sealed bags for organic carbon analysis. Biomass values from the three quadrats were averaged to obtain station-level plant biomass carbon stock per unit area.
Sediment-core sampling and processing. Sediment cores covered the 0–100 cm profile and were sectioned into six depth intervals: 0–10, 10–20, 20–30, 30–40, 40–50, and 50–100 cm. The same interval scheme was used for bulk density, organic carbon analysis, grain-size analysis, and sediment carbon-stock calculation. For each interval, a subsample with a recorded volume of 35.325 cm3 was dried at 60 °C to constant weight for bulk density determination. Bulk density was calculated from dry mass and sample volume. The 50–100 cm section was treated as one depth interval and processed in the same way as the shallower intervals.
Sediment grain-size subsampling and carbon-analysis preparation. For each sediment depth interval, a separate unground aliquot was retained for grain-size analysis before the remaining sediment material was ground and sieved for organic carbon analysis. The grain-size procedure follows the national technical specification [
17]. The same six depth intervals were used for grain-size analysis and sediment carbon-stock calculation: 0–10, 10–20, 20–30, 30–40, 40–50, and 50–100 cm. Sediment material used for organic carbon analysis was dried, ground, sieved, and stored in sealed bags.
Organic carbon analysis and quality control. Organic carbon concentrations of plant and sediment samples were determined using an Elementar vario MACRO cube elemental analyzer operated in CN mode (Elementar Analysensysteme GmbH, Langenselbold, Germany). The procedure follows the seagrass blue carbon technical specification [
17] and the organic-carbon method in GB/T 12763.8—2007 [
18]. Plant samples were analyzed after drying, grinding, and sieving, without acidification. Sediment samples were immersed in excess 1 N carbon-free HCl and treated in an ultrasonic water bath for 5 min to remove inorganic carbon. The acidified sediment samples were dried at 60 °C to constant weight, ground, sieved, and sealed before measurement. All plant samples and all sediment depth-interval samples were analyzed. The analyzer used high-temperature combustion, helium as carrier gas, oxygen for combustion, and a thermal conductivity detector. Calibration was performed using acetanilide. One duplicate sample was included after every five samples. The instrument has a carbon concentration range of 0–100% and ppm-range detection capability, with a manufacturer-reported precision of <0.1% absolute under standard test conditions. The sediment carbon stock reported in this study refers to the 0–100 cm sediment profile.
2.3. Carbon Pool Definitions
The regional ecosystem carbon-stock calculation included three reported carbon pools: aboveground biomass carbon, belowground biomass carbon, and sediment organic carbon. Aboveground biomass carbon included carbon stored in leaves and sheaths. Belowground biomass carbon included carbon stored in roots and rhizomes. Sediment organic carbon included organic carbon stored in the 0–100 cm sediment profile.
Plant biomass carbon was defined as the sum of aboveground biomass carbon and belowground biomass carbon. Ecosystem carbon stock was defined as the sum of plant biomass carbon and sediment organic carbon. Litter carbon was not included in the regional ecosystem carbon-stock calculation.
2.4. Carbon Stock Calculation
Carbon stock per unit area was expressed as Mg C ha−1. Total carbon stock was expressed as Mg C. Plant biomass carbon stock per unit area was calculated from aboveground and belowground dry biomass, organic carbon concentration, and quadrat area.
For each sediment depth interval, volumetric sediment organic carbon density was calculated from bulk density and measured organic carbon concentration. Layer-level sediment organic carbon stock per unit area was then calculated by multiplying volumetric organic carbon density by layer thickness. Values were converted to Mg C ha−1. Sediment organic carbon stock per unit area for the 0–100 cm profile was obtained by summing the six depth intervals from each sediment core: 0–10, 10–20, 20–30, 30–40, 40–50, and 50–100 cm.
For each survey zone, the mean carbon stock per unit area of each reported carbon pool was calculated from sampling stations within that zone. Zone-level total carbon stock was calculated by multiplying mean carbon stock per unit area by mapped meadow area. Ecosystem carbon stock was calculated as the sum of plant biomass carbon stock and sediment organic carbon stock.
Regional ecosystem carbon stock was obtained by summing zone-level ecosystem carbon stocks. Area-weighted ecosystem carbon stock per unit area was calculated by dividing regional ecosystem carbon stock by total mapped seagrass meadow area. The contribution of each reported carbon pool was calculated as its percentage of total ecosystem carbon stock.
2.5. Statistical Analysis and Uncertainty Summary
Statistical summaries were prepared by meadow zone. The sampling station was used as the statistical unit. For plant biomass, the three quadrat values at each station were averaged before station-level plant biomass carbon stock per unit area was calculated. Arithmetic means were used for area-based scaling because zone-level total carbon stock was calculated from mean carbon stock per unit area and mapped meadow area.
Medians and interquartile ranges were calculated for ecosystem carbon stock per unit area to describe the distribution of station-level values within each zone. Standard deviations describe within-zone variation among station-level estimates. Shapiro–Wilk tests were used as distribution diagnostics for station-level ecosystem carbon stock per unit area. Ninety-five percent confidence intervals for mean ecosystem carbon stock per unit area were calculated as mean ± t × standard error. Zone-level total-stock intervals were obtained by multiplying the lower and upper limits of per-area stock intervals by mapped meadow area. All statistical calculations were performed using OriginPro 2024. This study reports standing carbon stocks. Annual carbon sequestration rates and sediment carbon accumulation rates were not estimated.
3. Results
3.1. Survey Coverage and Meadow Distribution
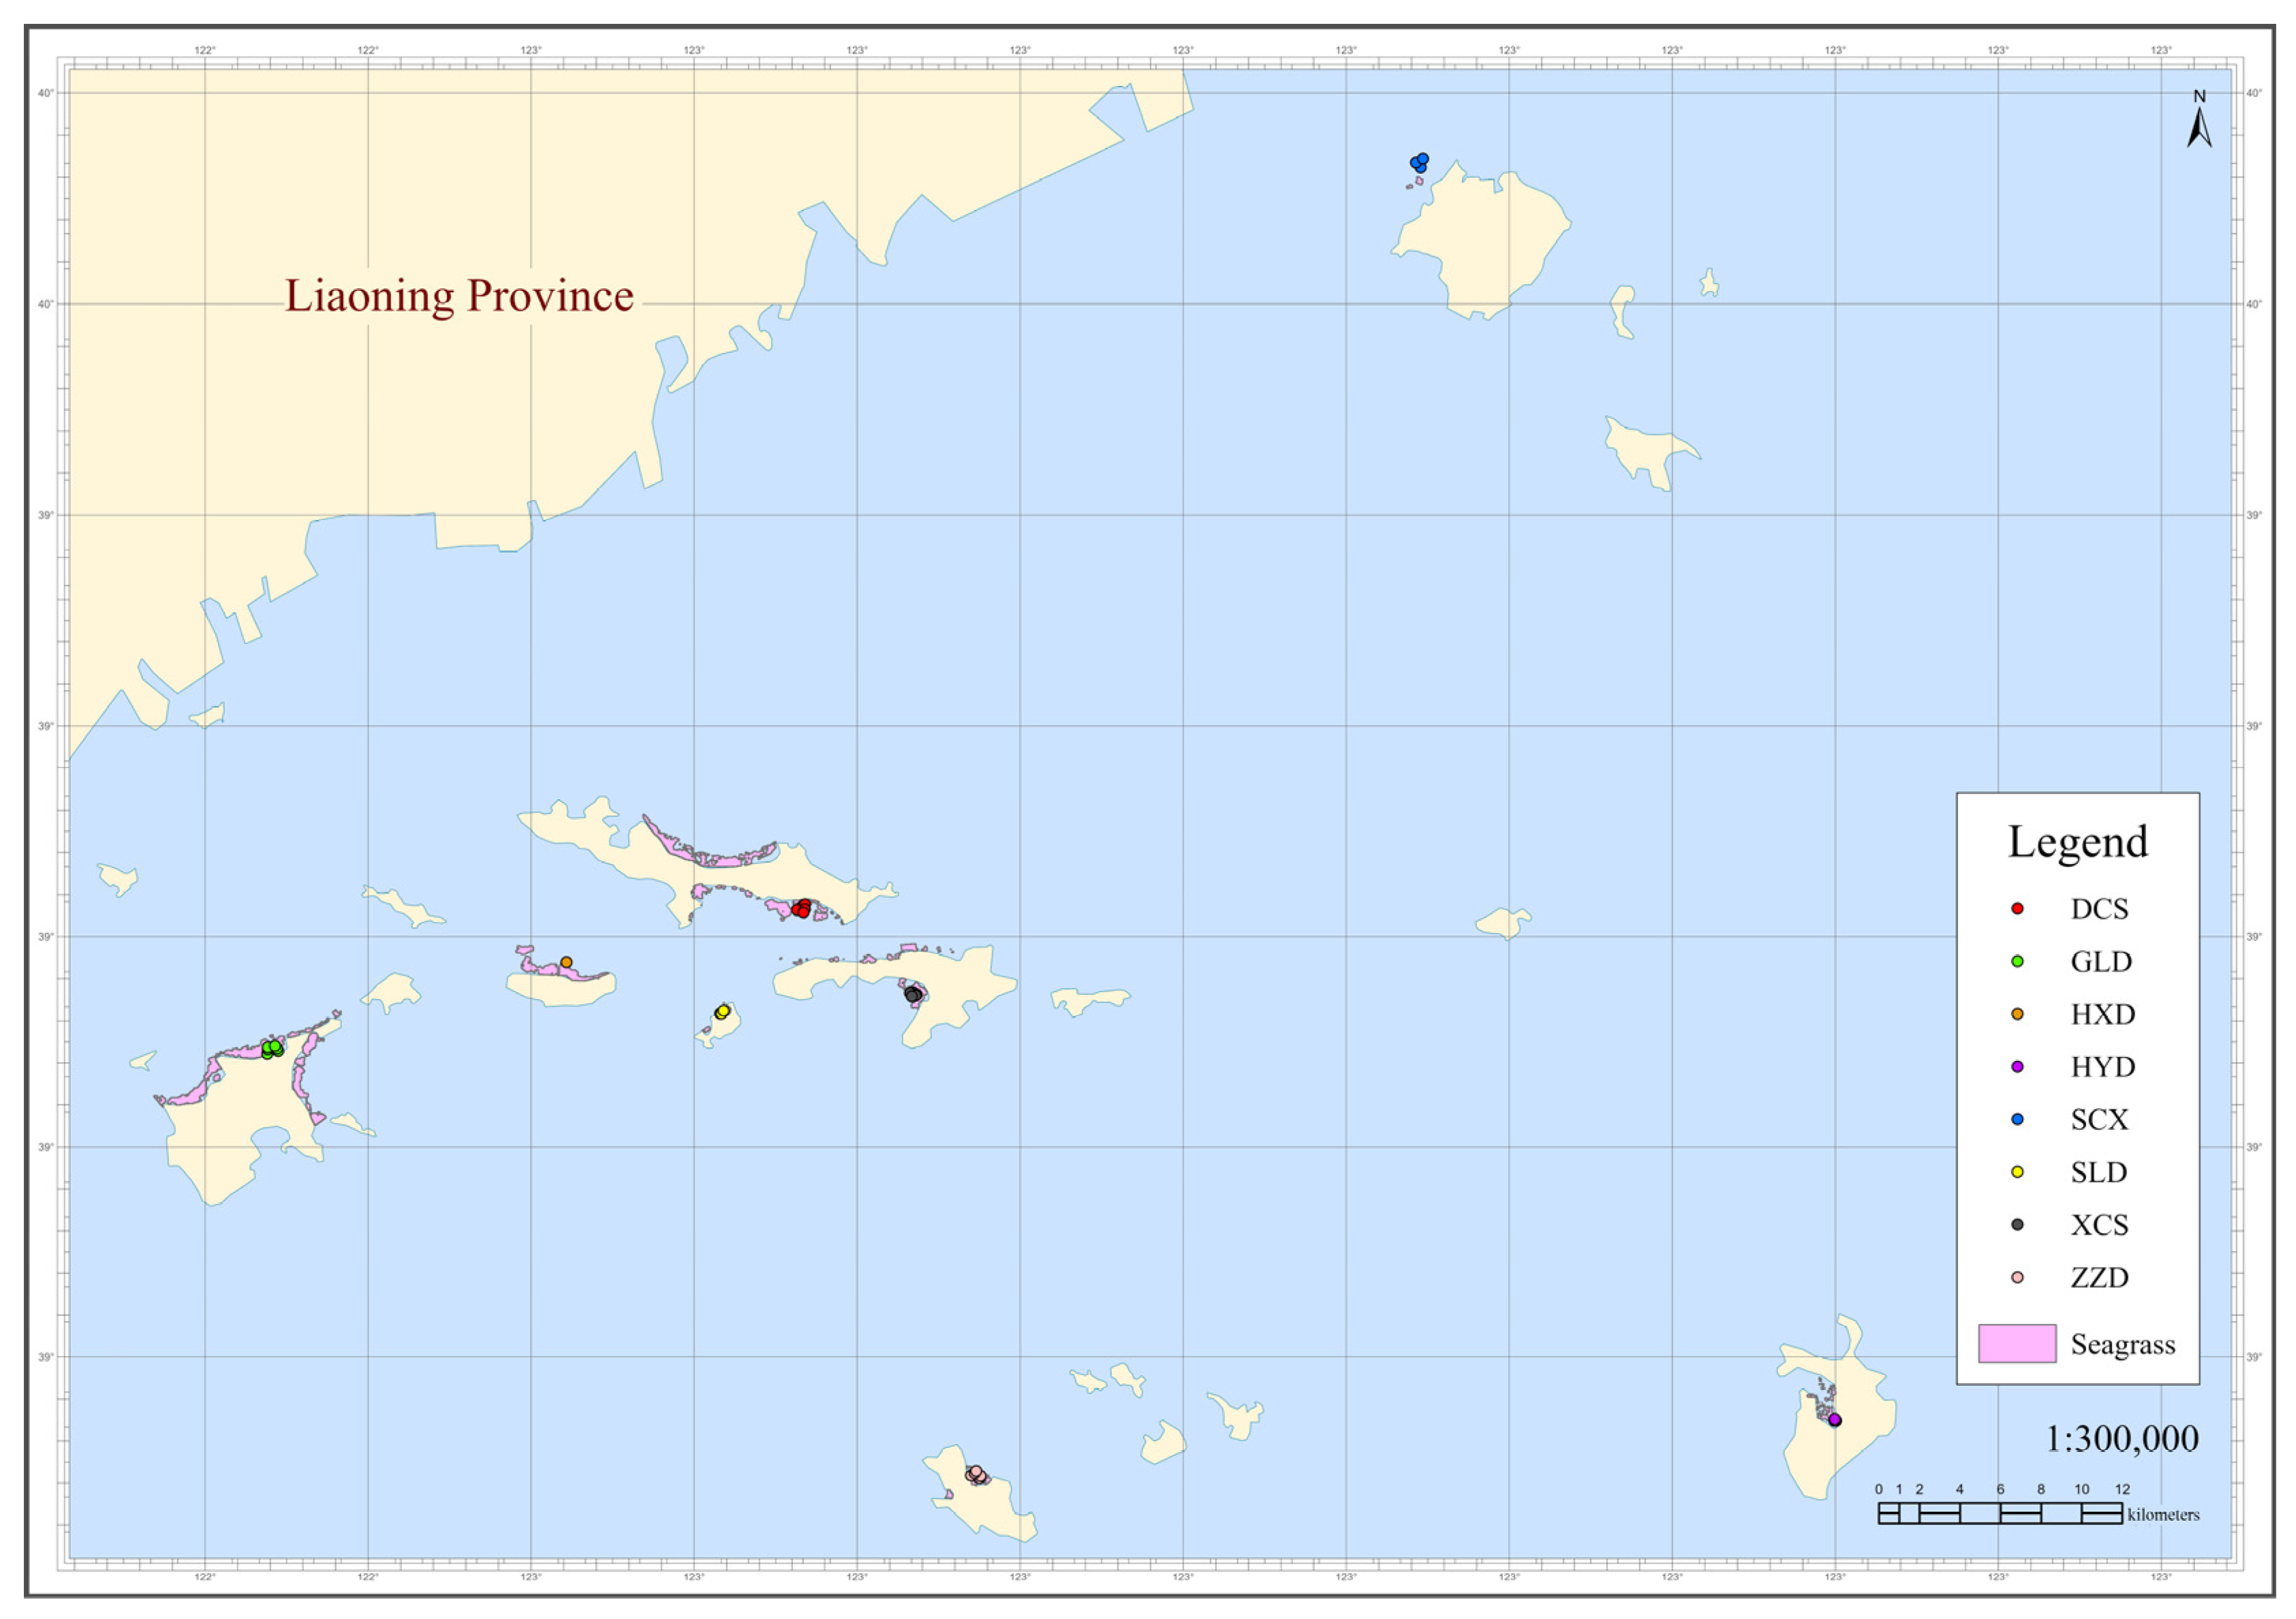
The survey covered eight confirmed seagrass meadow zones in the Changshan Archipelago: Dachangshan, Guanglu Island, Haxian Island, Haiyang Island, Shichengxiang, Saili Island, Xiaochangshan, and Zhangzi Island. The confirmed meadow polygons covered 323.37 ha. A total of 39 sampling stations were distributed within these polygons.
Mapped meadow areas differed among zones. Guanglu Island had the largest mapped area, with 74.49 ha. Xiaochangshan and Dachangshan followed, with 61.92 ha and 54.36 ha, respectively. Haxian Island, Shichengxiang, and Zhangzi Island had similar mapped areas, with 35.06, 34.85, and 34.54 ha, respectively. Haiyang Island and Saili Island had the smallest mapped areas, with 14.77 and 13.39 ha, respectively.
The survey recorded
Zostera marina,
Zostera caespitosa, and
Zostera japonica. Mixed-species meadows were recorded in Zhangzi Island, Haxian Island, and Xiaochangshan. The spatial distribution of mapped seagrass meadow zones and sampling stations is shown in
Figure 1.
3.2. Ecosystem Carbon Stocks and Carbon Pool Composition
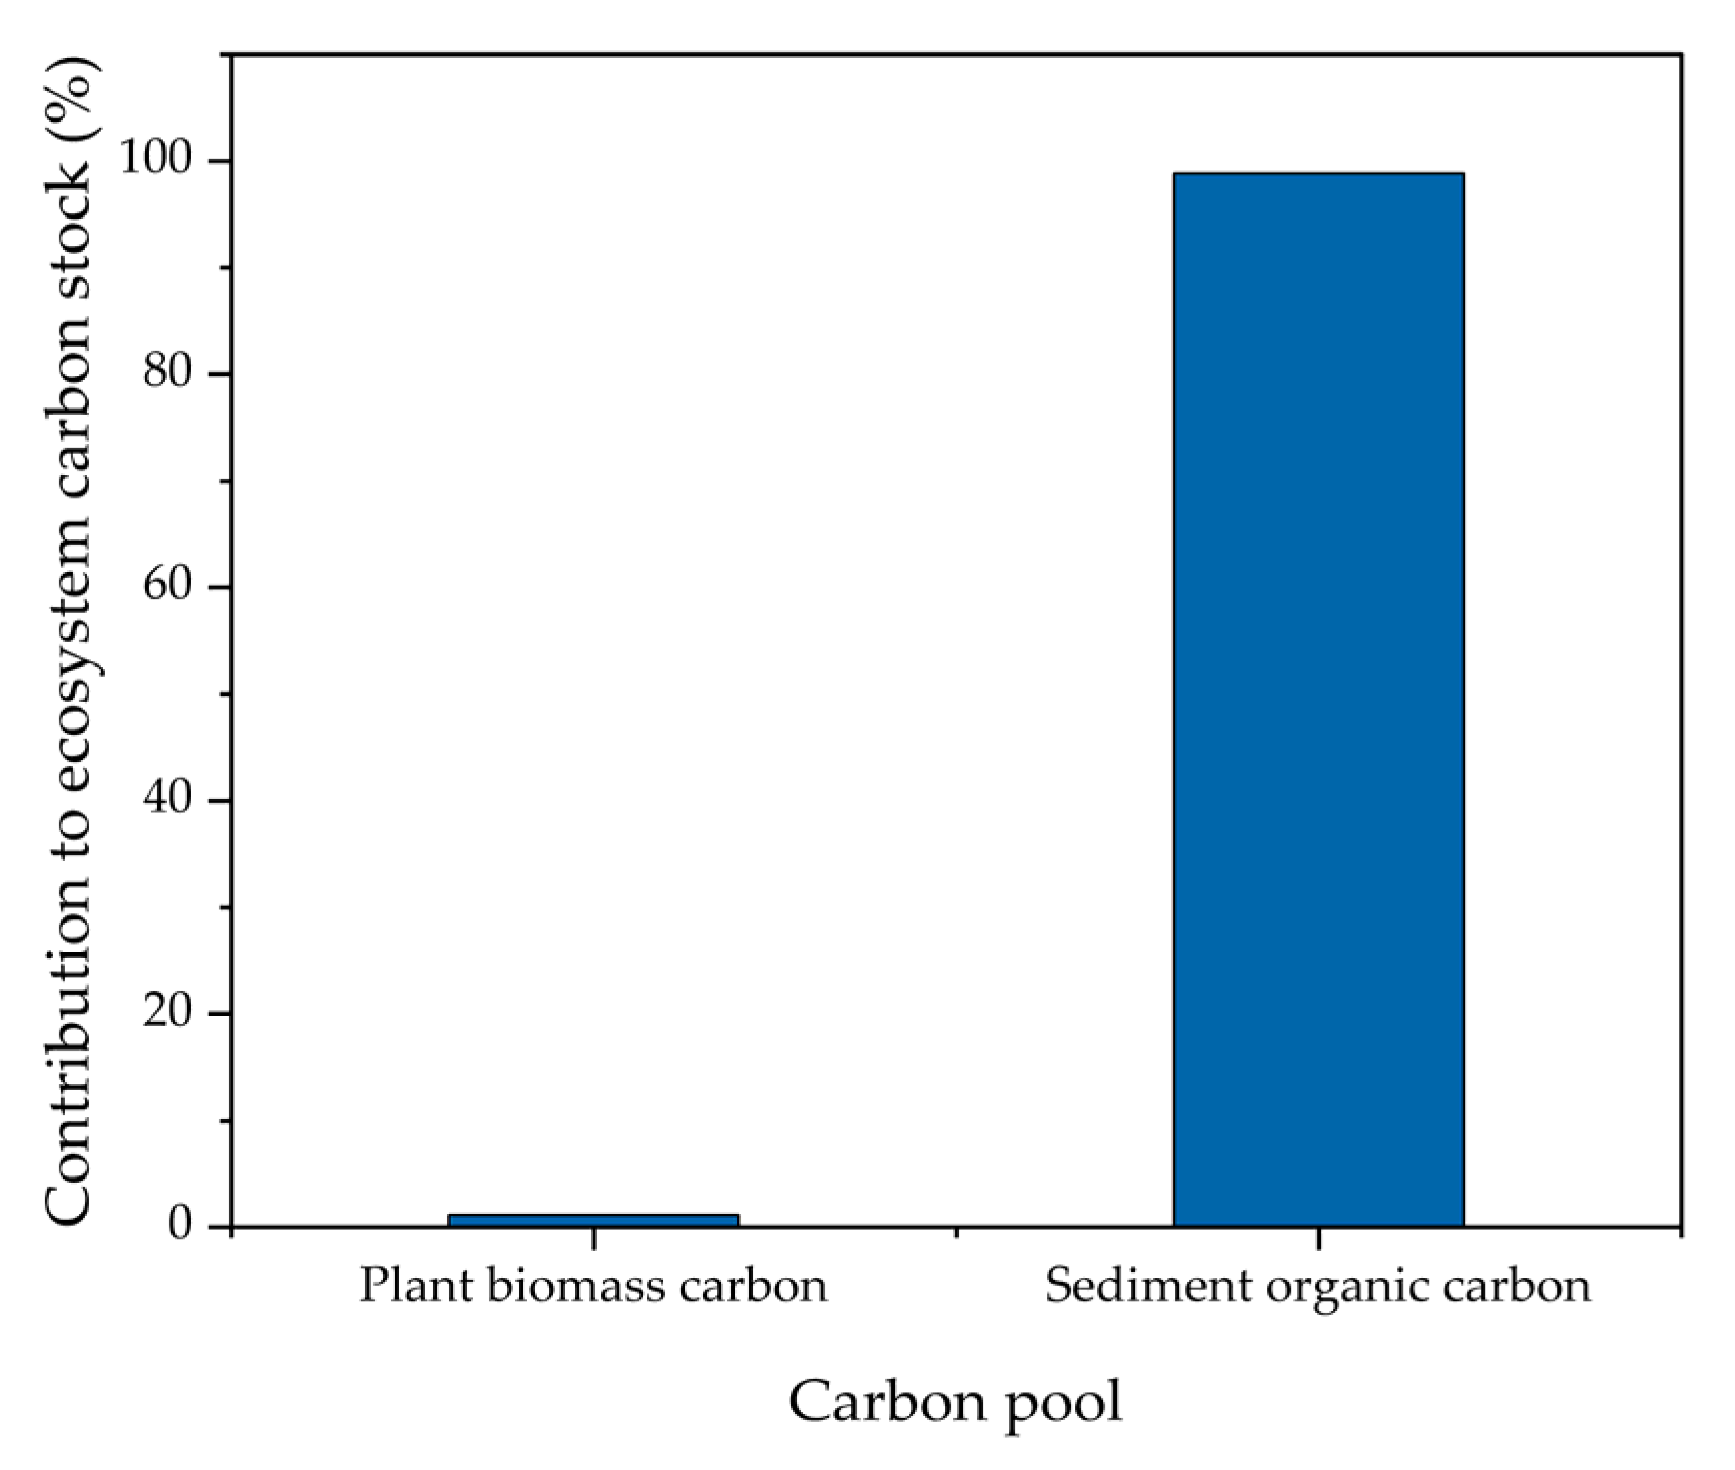
The mapped seagrass meadows stored 29,305.75 Mg C in total ecosystem carbon. Most of this standing stock was stored in the 0–100 cm sediment profile. Sediment organic carbon was 28,965.71 Mg C. Plant biomass carbon was 340.04 Mg C.
Sediment organic carbon contributed 98.84% of total ecosystem carbon stock. Plant biomass carbon contributed 1.16%. These percentages describe the composition of standing organic-carbon stocks in the measured plant and sediment pools. The area-weighted ecosystem carbon stock per unit area was 90.63 Mg C ha
−1. The carbon pool composition of the mapped seagrass meadows is shown in
Figure 2.
3.3. Spatial Variation in Total Carbon Stocks and Carbon Stocks per Unit Area
Total ecosystem carbon stock varied among meadow zones. Guanglu Island had the largest stock, with 9247.73 ± 1790.01 Mg C, and contributed 31.56% of the regional total. Saili Island had the smallest stock, with 1628.59 ± 86.00 Mg C. Other zones ranged from 2259.65 ± 389.81 Mg C in Shichengxiang to 3641.63 ± 564.22 Mg C in Dachangshan.
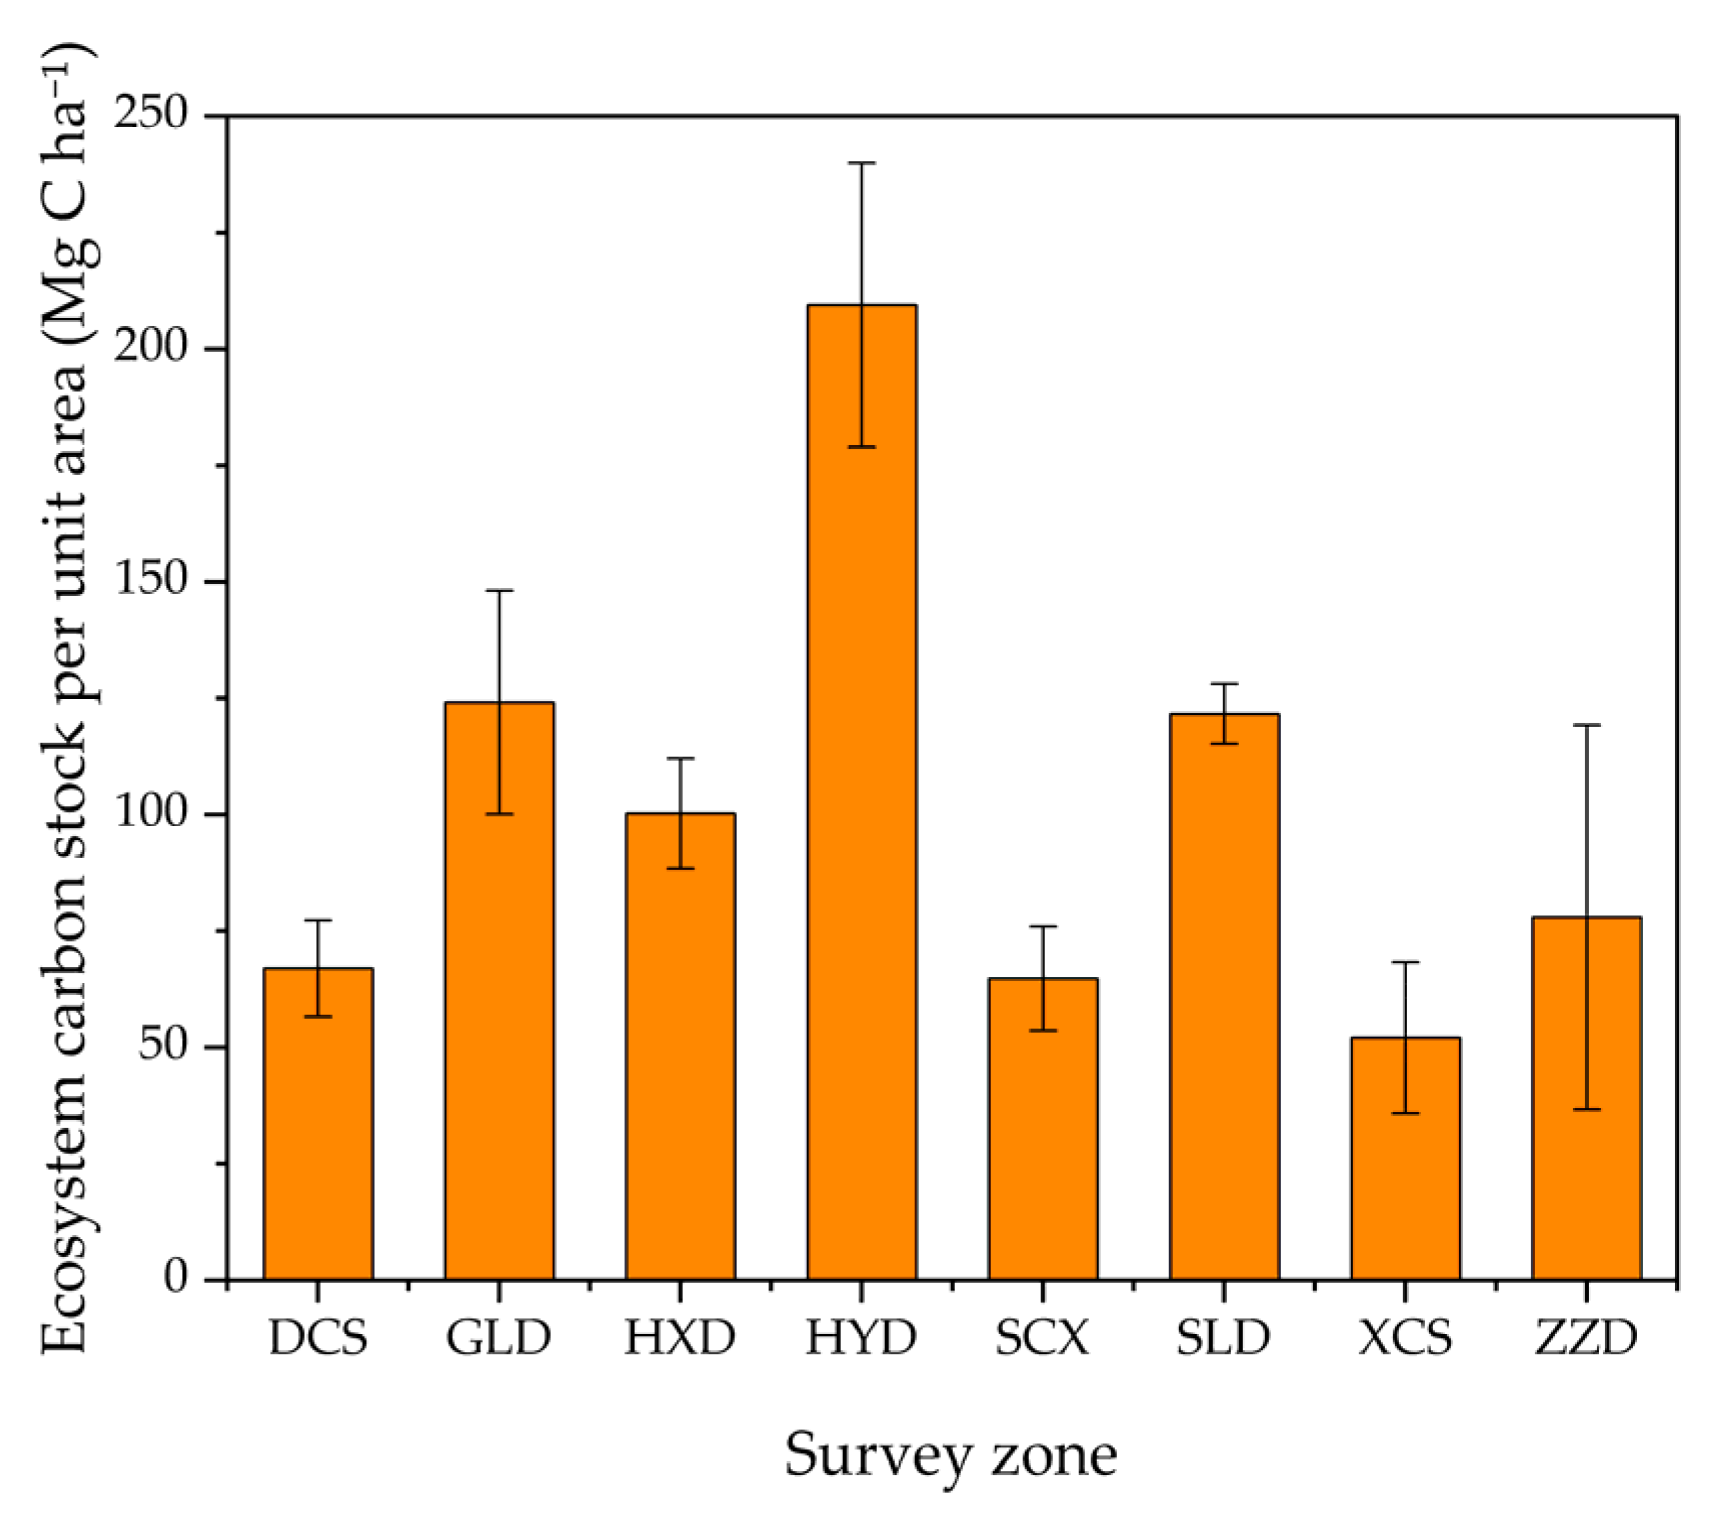
Ecosystem carbon stock per unit area showed a different spatial pattern. Values ranged from 52.11 to 209.50 Mg C ha−1. Haiyang Island had the highest value, with 209.50 ± 30.51 Mg C ha−1. Xiaochangshan had the lowest value, with 52.11 ± 16.29 Mg C ha−1. Guanglu Island and Saili Island also had relatively high values, at 124.15 ± 24.03 and 121.67 ± 6.42 Mg C ha−1, respectively.
The difference between total stock and per-area stock was mainly related to meadow area. Guanglu Island had the largest total stock because it combined the largest mapped area with a relatively high per-area stock. Haiyang Island had the highest per-area stock and a small mapped meadow area. This contrast shows why total stock and per-area stock need to be interpreted together. Zone-level sampling coverage, carbon stocks, ecosystem carbon stock per unit area, standard deviation, and contributions to regional stock are summarized in
Table 1.
Station-level variability also differed among zones. Zhangzi Island showed the largest standard deviation in ecosystem carbon stock per unit area. Saili Island showed the smallest standard deviation. This pattern indicates stronger within-zone heterogeneity in Zhangzi Island.
Sediment type and grain-size composition showed clear differences among meadow zones (
Table S1). The contrast was most evident between the zones with the lowest and highest ecosystem carbon stock per unit area. Xiaochangshan was classified as sand-dominated, with a mean sand content of 96.49%. Haiyang Island was mainly characterized by sandy silt and silt, with a mean silt content of 64.13%.
Zone-level variation in ecosystem carbon stock per unit area is shown in
Figure 3.
4. Discussion
4.1. Regional Baseline and Comparability with Temperate Zostera Meadows
The surveyed seagrass meadows stored 29,305.75 Mg C across 323.37 ha. The area-weighted ecosystem carbon stock per unit area was 90.63 Mg C ha
−1. The 0–100 cm sediment organic carbon stock per unit area was 89.57 Mg C ha
−1. These values provide a field-based estimate for a northern Chinese island meadow system with confirmed meadow polygons and a consistent 0–100 cm sediment profile. The sediment organic carbon value falls within the range reported for temperate
Zostera meadows, where per-area sediment carbon stocks differ strongly among regions and local sediment settings [
12,
13,
19,
20].
A direct comparison with published
Zostera studies is most informative when species type, sediment depth, and carbon-pool definition are considered together. The Changshan Archipelago value is higher than the Baltic Sea and shallow-core European values listed in
Table 2. It is close to the 1 m soil carbon stock reported for
Zostera marina meadows in the Ría de Ferrol and lower than the upper range estimated for temperate eelgrass meadows across broader ocean margins. This comparison places the Changshan Archipelago meadows within the known variability of temperate
Zostera blue carbon systems.
Previous work in the Liaodong Peninsula reported seagrass species occurrence, meadow distribution, water depth, and human pressures [
15]. The present carbon-stock data extend this regional record by adding plant biomass carbon and 0–100 cm sediment organic carbon. The comparison in
Table 2 shows that differences among studies are shaped by environmental variation, sediment depth, carbon-pool definitions, and scaling approaches.
Within the Changshan Archipelago, the same carbon-pool definitions, 0–100 cm sediment profile, and stock calculation framework were applied across all eight meadow zones [
17]. This consistency makes the zone-level contrasts more interpretable. It also separates local spatial patterns from differences caused by sediment-depth definitions or carbon-pool treatments. The dataset therefore supports both regional comparison among island meadow zones and broader comparison with other temperate
Zostera carbon-stock studies.
4.2. Sediment Organic Carbon Dominance and Its Carbon Accounting Implications
Sediment organic carbon accounted for 98.84% of total ecosystem carbon stock. Plant biomass carbon contributed 1.16%. This pool structure is consistent with seagrass blue carbon studies that report large sediment carbon pools in vegetated coastal habitats [
9]. Similar patterns have been reported for temperate
Zostera marina meadows, where living biomass usually forms a small carbon pool compared with sediment organic carbon [
12,
13,
20].
The high sediment share reflects the depth and size of the measured sediment pool. The 0–100 cm sediment profile integrates organic carbon accumulated within the sediment column. Living biomass represents standing plant material at the time of sampling. A biomass-only assessment would therefore capture only a small part of ecosystem carbon storage in the Changshan Archipelago meadows.
Sediment organic carbon reflects both organic matter supply and sediment retention. Seagrass shoots can reduce near-bed flow and enhance particle trapping. Roots and rhizomes can bind sediments and support belowground structure [
9,
21]. These functions help retain organic matter in the sediment profile. Physical disturbance, meadow fragmentation, or sediment erosion may weaken this retention pathway.
The estimates reported here describe standing carbon stocks at the time of survey. Annual sequestration rates require sediment dating, burial rates, or repeated measurements [
21]. This distinction is relevant to blue carbon accounting. Carbon-stock baselines can support monitoring. Carbon accumulation estimates require time-resolved evidence.
4.3. Spatial Heterogeneity Among Meadow Zones
Ecosystem carbon stock per unit area varied strongly among meadow zones. Haiyang Island had the highest value, at 209.50 Mg C ha−1. Xiaochangshan had the lowest value, at 52.11 Mg C ha−1. Total ecosystem carbon stock followed another pattern. Guanglu Island had the largest total stock, with 9247.73 Mg C, due to its large meadow area and relatively high per-area carbon stock.
These results show that carbon stock per unit area should be interpreted together with mapped meadow area. Per-area carbon stock describes the amount of carbon stored in each hectare. Total stock reflects both per-area stock and meadow extent. Haiyang Island represents a high per-area stock zone. Guanglu Island represents the largest regional carbon-stock contributor. These two zones therefore have different carbon-storage roles within the same archipelago.
Sediment texture helps explain part of the spatial pattern. Xiaochangshan had the lowest ecosystem carbon stock per unit area and was classified as sand-dominated, with a mean sand content of 96.49%. Haiyang Island had the highest ecosystem carbon stock per unit area and was mainly characterized by sandy silt and silt, with a mean silt content of 64.13% (
Table S1). Fine sediments can retain organic particles more effectively than coarse sand [
12,
13,
14]. European
Zostera marina studies also show that sediment grain size, porosity, and dry bulk density are closely related to sediment organic carbon storage [
14,
19]. The contrast between sand-dominated sediment in Xiaochangshan and finer sediment in Haiyang Island is consistent with their difference in sediment organic carbon storage.
Other factors also contributed to the zone-level pattern. Shichengxiang also had fine sediment, and its ecosystem carbon stock per unit area was lower than those of Haiyang Island and Guanglu Island. Additional controls may include hydrodynamic exposure, meadow continuity, organic matter supply, and disturbance history. The large standard deviation in Zhangzi Island also indicates strong within-zone heterogeneity. This pattern may reflect patch-level differences in sediment condition, vegetation structure, or local disturbance.
The zone-level pattern indicates three carbon-storage features of the archipelago. Haiyang Island represents a high per-area stock zone. Guanglu Island represents the largest contributor to regional total stock. Zhangzi Island showed strong within-zone variation, which suggests patch-level heterogeneity in sediment condition, vegetation structure, or local disturbance. These contrasts show that regional seagrass carbon storage is shaped by meadow area, per-area stock, and within-zone heterogeneity.
4.4. Implications for Restoration and Long-Term Monitoring
The results provide local reference values for restoration assessment. Meadow area, carbon stock per unit area, sediment carbon, and carbon-pool composition can be used to compare restored sites with nearby reference meadows. Seagrass restoration can deliver long-term climate benefits when restored meadows persist and expand, and restoration success depends on scale, site condition, and sustained establishment [
22,
23].
Reference values should reflect meadow setting in the Changshan Archipelago. Sand-dominated or more exposed settings may have lower per-area carbon-stock values. Sheltered settings with finer sediment may support higher values. This pattern is consistent with temperate
Zostera studies showing large site-level variation in sediment carbon stocks [
12,
13].
Long-term monitoring should track both meadow extent and carbon stock per unit area. Meadow loss reduces total carbon stock through area decline. Changes in sediment organic carbon stock per unit area alter carbon storage within existing meadow boundaries. Repeated surveys using the same 0–100 cm sediment profile can track these changes over time. Monitoring records should include vegetation cover, species composition, belowground biomass, sediment condition, and disturbance history.
Restoration assessment can use staged indicators. Early monitoring can focus on survival, shoot density, meadow cover, and sediment stability. Later monitoring can include sediment organic carbon and carbon accumulation. This sequence reflects the slow recovery of sediment carbon pools in many restored seagrass systems. Sequestration claims require burial-rate evidence from sediment dating or repeated measurements.
4.5. Limitations and Future Work
The assessment was based on one regional survey. The results represent standing ecosystem carbon stocks. Annual carbon sequestration, sediment burial rate, and emissions from meadow loss were outside the scope of the analysis. Future work should combine dated sediment cores with repeated meadow mapping to estimate carbon accumulation rates and temporal change [
21].
The analysis focused on meadow-zone summaries. Environmental-driver tests were outside the scope of the dataset. Future studies should include sediment grain size, hydrodynamic exposure, meadow continuity, species composition, belowground biomass, and disturbance history. These variables can help explain why per-area carbon stock differs among zones.
The reported standard deviations, medians, interquartile ranges, and confidence intervals describe station-level variation within meadow zones. They show spatial variability in the sampled stations and cover part of the full uncertainty. Additional uncertainty may arise from mapped meadow area, laboratory measurement error, and boundary delineation. Future monitoring should use consistent meadow-boundary mapping, field verification, and uncertainty analysis. Depth-interval grain-size records and hydrodynamic data should also be retained in repeated surveys because they help interpret changes in sediment carbon storage.
These limitations define the appropriate use of the dataset. The estimates provide a standing-stock baseline for comparing meadow zones and for placing the Changshan Archipelago within temperate seagrass blue carbon research. Carbon accumulation, emissions from meadow loss, and long-term sequestration require repeated mapping, dated sediment cores, and process-based measurements.
5. Conclusions
This study provides a standardized regional baseline for standing seagrass ecosystem carbon stocks in the Changshan Archipelago, northern China. The surveyed meadows covered 323.37 ha and stored 29,305.75 Mg C. The area-weighted ecosystem carbon stock per unit area was 90.63 Mg C ha−1.
Sediment organic carbon dominated total ecosystem carbon stock. The 0–100 cm sediment profile stored 28,965.71 Mg C and contributed 98.84% of the total stock. Plant biomass carbon, including aboveground biomass carbon and belowground biomass carbon, contributed 340.04 Mg C, or 1.16%. These results support the inclusion of the 0–100 cm sediment profile in seagrass carbon-stock assessment in this region.
Carbon stock per unit area and total carbon stock showed different spatial patterns. Haiyang Island had the highest per-area stock, with 209.50 Mg C ha−1. Guanglu Island had the largest total stock, with 9247.73 Mg C. This contrast shows how meadow extent and per-area stock jointly shape regional carbon storage.
The results represent standing ecosystem carbon stocks. Annual sequestration rates and sediment carbon accumulation rates were outside the scope of this assessment. The dataset provides field-based evidence for comparing island meadow zones in northern China with other temperate Zostera systems. Future studies should combine repeated meadow mapping, long-term monitoring, and sediment dating to assess carbon accumulation and temporal change.