Article

SWAN–WEC: Introducing an Innovative Design for a Deep Water Point Absorber Wave Energy Converter

1
The Interdisciplinary Program for Marine Engineering, Technion–Israel Institute of Technology, Haifa 32000, Israel
2
Faculty of Mechanical Engineering, Technion–Israel Institute of Technology, Haifa 32000, Israel
*
Author to whom correspondence should be addressed.
J. Mar. Sci. Eng. 2026, 14(10), 870; https://doi.org/10.3390/jmse14100870
Submission received: 9 March 2026 / Revised: 28 April 2026 / Accepted: 5 May 2026 / Published: 7 May 2026
(This article belongs to the Special Issue Hydrodynamics of Wave Energy Conversion Systems)

Abstract

Meeting the growing demand for renewable energy production requires tapping into a variety of natural resources. Wave energy, while abundant, remains a challenging and often non-economic field. To address this, the present paper proposes and examines an innovative concept for a wave energy converter (WEC). Alongside survivability capabilities, the novel device enables simultaneous extraction of wave energy in two degrees of freedom and, with additional tuning for a range of sea states, achieves higher efficiency compared to existing technologies. As it does not require a link to the seabed or a wharf for production, the concept is suitable for deep water, hence offering higher potential relative to nearshore WECs. In this study, we present the proposed concept and its engineering simplicity, together with mathematical analysis and preliminary results that evaluate the device’s performance under regular and irregular sea conditions.

1. Introduction

As global energy demand continues to grow [1,2], the environmental and economic limitations of fossil fuels have become increasingly apparent [3,4]. Moving toward sustainable energy systems is vital—not only to safeguard the environment but also to ensure long-term energy security and economic stability [1,3,4,5].
Among the various renewable sources, wave energy stands out due to its high-power density compared to solar and wind energy [6,7,8] and is considered more stable and predictable than other renewable energy sectors [6,9]. Nevertheless, it remains one of the least developed frontiers in the renewable energy sector [6,7,8,9].
The primary challenges for wave energy technologies are cost reduction and survivability enhancement. The levelized cost of energy (LCoE) for wave energy remains exceptionally high, with estimated values ranging from 90 €/MWh to 490 €/MWh [6]. These costs are significantly higher than those of fossil fuels and other renewable energy sources, rendering wave energy currently uncompetitive and largely unfeasible for utility-scale deployment.
It is estimated that wind transfers power to waves globally at an average rate of approximately 56 TW [10]—far exceeding the world’s current power consumption of roughly 21.2 TW [11]. However, as most energy is lost through wave breaking in open seas, it is evaluated that only 2.1 to 2.5 TW [12,13] reaches nearshore environments, where it is again mostly dissipated through coastal wave breaking [10].
That being said, the economic feasibility of wave energy exploitation hinges on deploying large-scale arrays of wave energy converters (i.e., wave farms) located at deep water sites [10]. Deep water sites also present reduced environmental and visual impacts compared to nearshore installations, and they offer the potential for co-location with other marine industries, such as offshore wind farms and aquaculture operations [7].
Moreover, as floating urban developments, either offshore infrastructures or modular floating cities, are increasingly being pursued as a scalable and affordable infrastructure solution, ensuring a stable and autonomous energy supply becomes a critical challenge. Integrating deep water farms of wave energy converters (WECs) provides a site-adapted renewable power source, thereby reducing the dependence on long transmission grids. Furthermore, when optimally positioned, a WEC array can help create sheltered zones in open waters, thereby improving occupant comfort and enhancing the feasibility of floating solutions [14]. These characteristics make deep sea wave energy particularly attractive for future sustainable development, highlighting the need for designs that are independent of the seabed and that simplify both implementation and operation.
WECs systems perform two main processes:
  • Capturing the wave energy and converting it into mechanical energy. The hydrodynamic interaction between the waves and the structure has a primary influence on the efficiency of wave energy extraction. An appropriate hydrodynamic design that enables the conversion of motion from multiple degrees of freedom (DOFs) into mechanical energy effectively and over a broad spectrum of wave frequencies enhances the efficiency of the facility. A common metric used to evaluate the hydrodynamic efficiency of a WEC with an index termed the capture width ratio (CWR), defined as the power captured by a WEC divided by the incident wave power across the projected width of the device [15,16].
  • Converting mechanical energy into a usable form through a Power Take-Off (PTO) system [17]. The PTO system, which may include hydraulic or direct-drive components, is characterized by its own efficiency, which has been investigated in previous studies [18,19]. The PTO system must handle high forces at low velocities (relative to propulsion systems) and efficiently store and release energy under varying wave conditions. Enhancing the efficiency and durability of the PTO is critical to the economic viability of wave energy conversion.
Point absorbers (PAs) are a type of WECs that are relatively small structures compared to the wavelength and may be either floating or submerged. They move with the wave motion in one or more DOFs—typically in heave (vertical motion), which activates the PTO mechanism [6]. According to a dataset published in [20], the CWR of widely reviewed heaving WECs ranges from 0.03 up to 2.05 (for the AWS WEC) where most values are smaller than 0.5. Following an extensive review by [15], it was concluded that oscillating body systems, such as PAs, exhibit higher efficiency relative to their characteristic width compared to other wave energy conversion technologies.
There is a trade-off between device size, captured power, and cost. On the one hand, smaller devices are generally less expensive but capture less power, as the absorbed power scales with a device’s characteristic width; however, due to diffraction effects, they may interact with wave energy beyond their physical width, achieving CWR higher than unity. On the other hand, larger devices are more costly and induce less wave diffraction but may capture more power owing to their greater width. In addition to performance, survivability is a critical design factor for WECs. It fundamentally dictates that the WEC’s displacements remain within safe limits even under severe storms conditions [21] to prevent structural failure or mooring system compromise. Addressing this technical challenge often favors the design of more robust and larger WEC structures [21].
Despite technical and economic challenges, several PA-WEC projects have demonstrated long-term viability. The AWS—Ocean Energy’s Archimedes Waveswing WEC, which is considered one of the most promising WEC projects, completed Stage 3 of Wave Energy Scotland’s NWEC program with successful 1:2 scale at-sea testing in the naturally sheltered Scapa Flow in 2023, demonstrating key subsystems and reducing technical and commercial risk toward commercialization [22]. The AWS WEC is a fully submerged device. Depending on the configuration, a single device can generate between 15 and 500 kW of electrical power. The Lysekil Project in Sweden, operated by Uppsala University since 2006, employs 11 seabed-anchored direct-drive linear generators with a rated capacity of about 260 kW per unit. The device is fully submerged and includes a stationary seabed-mounted stator connected to the buoy, achieving reliable operation and low maintenance even under harsh North Sea conditions [23,24]. CorPower Ocean has advanced its “WaveSpring” tuned PA from half-scale tests at EMEC (2018–2019) to a full-scale C4 device deployed offshore Portugal in 2023, delivering grid-connected power via the HiWave-5 project [25]. The company targets arrays (CorPack) of ~25 devices (~10–30 MW total) and by mid-2025, it has secured over €95 million in funding while advancing to TRL 7–8 certification. In Sweden, Seabased’s station demonstrated ~1 MW capacity with 36 PAs and grid export between 2016 and 2019.
A common feature of all the above-mentioned WECs is their reliance on the seabed for power production, as they consist of a fixed unit anchored to the seabed at a water depth of approximately 25 m and a heaving unit that interacts with incoming waves. The stationary part requires rigid mooring systems, resulting in heavy and costly installation.
A comprehensive research by [7], which surveyed publications on various types of wave energy converters from both research and commercial perspectives, concluded the following: a historical analysis reveals that survivability and ease of deployment are key performance indicators that influence not only the economic viability and success of individual projects, but also play a critical role in shaping sector-wide confidence and investment potential. The coming decade will be pivotal in determining whether wave energy can achieve the necessary breakthrough to become a mainstream renewable energy technology [7].
In this paper, we present a novel and efficient WEC concept for the open sea applications, developed through a combination of CAD design and mathematical modeling. The concept offers high potential efficiency, simplicity, and according to our results also cost-effectiveness relative to existing devices. The proposed WEC is a type of floating PA; however, it is seabed-independent as it does not require reaction from the seabed or a wharf for functioning. No rigid mooring system is required to react with the PTO elements on the ground, resulting in no depth limitation. It captures wave power through relative motion between two floating coaxial cylinder bodies, with a PTO system composed of six hydraulic pistons or linear generators between.
Before presenting our WEC concept, we address the important work that has been done considering a twin vertical cylinder WEC. Building on nearly five decades of extensive research on the hydrodynamic of cylindrical bodies conducted by numerous scholars, Xu et al. [21] solved the hydrodynamics of a PA-WEC consisting of two vertically floating, coaxial cylinders connected by dashpots (which may idealize hydraulic cylinders or linear generators to absorb wave power) mounted at the cylinder’s edges. Their paper presents a parametric study and recommends properties of the ideal parameters for a practical range of sea states. In addition, Xu et al. [21] highlighted the limitations of monochromatic-wave-based design and demonstrated the reduced practical performance at irregular waves, which therefore should also be considered.
Without detracting from the important conceptual contributions of the authors from a theoretical standpoint toward device functionality, it will become evident in the following sections that the concept proposed by [21] presents several problematic design aspects.
In this study, we detail how our design overcomes these functional problems. The main issue is that [21] concluded that the pitch motion has a minor contribution to the captured power and suggests optimizing the size of the structures and the dashpot coefficient to maximize the power captured by heave only. However, Section 4 will demonstrate the critical importance of pitch/roll functionality. Additional issues include the device’s adjustment to only a single sea state, structural instabilities in the WEC system, and insufficient clearance between the two cylindrical hulls, which prevents the PTO elements from completing their full stroke. These issues are discussed in detail in the following sections of this paper and addressed through solutions incorporated into the proposed WEC design.
A WEC with symmetrical geometry about the vertical axis, in a two-dimensional flow approximation, absorbing energy by motion in a single DOF, has a theoretical maximum (ideal) efficiency of 0.5 [26].
This ideal efficiency is obtained by calibration of the WEC under two conditions:
C1—the resonance period in the absorbing DOF matches the period of the incident wave.
C2—for the absorbing DOF, the PTO damping coefficient (PDC) equals the free-floating (with no PTO elements) wave radiation damping at the resonance period (higher PDC slows down the movement of the structure and thus reduces the power, while lower PDC absorbs less energy from the motion of the hull).
Our proposed WEC converts wave energy into mechanical power through motion in two degrees of freedom, heave and roll/pitch. The utilization of two (or more) DOFs of the hull motion, when optimally tuned, enables a theoretical ideal efficiency of unity for monochromatic wave condition. The design incorporates a simple and practical method to tune the WEC for the two DOFs. Applying mathematical models that solve the wave–structure problem for the two interacting bodies, we present the preliminary results demonstrating that the ideal CWR exceeds unity for monochromatic waves at the period of tuning, and that it is on the order 0.4 and 0.6 for broad and relatively narrow real sea spectra respectively.
This paper aims to present the working principles of the proposed WEC to provide a preliminary assessment of its performance and to demonstrate conceptual tuning approaches for matching resonance periods in two DOFs. Section 2 introduces the proposed WEC concept and its design principles. Section 3 presents the mathematical model. Section 4 presents the verifications of our model as well as a conceptual demonstration of optimization in two DOFs. First, we present a barge example. Then we present a PA verification by comparing with the results reported for a twin vertical cylinder WEC [21], applying a more analytical method. Section 5 specifies the geometry and relevant parameters for two design examples of performance analysis of the proposed WEC concept. In addition, a survival state is established for Design Case #1 to enable the analysis under extreme conditions. Section 6 presents the results and discussion and Section 7 presents our conclusions.

2. The Concept of the Proposed WEC and the Design Principles

In the following section we present our WEC concept, which is independent of the water depth and can be calibrated to an ideal efficiency of 1. We suggest practical and simple solutions for the operational challenges of efficient wave energy conversion.
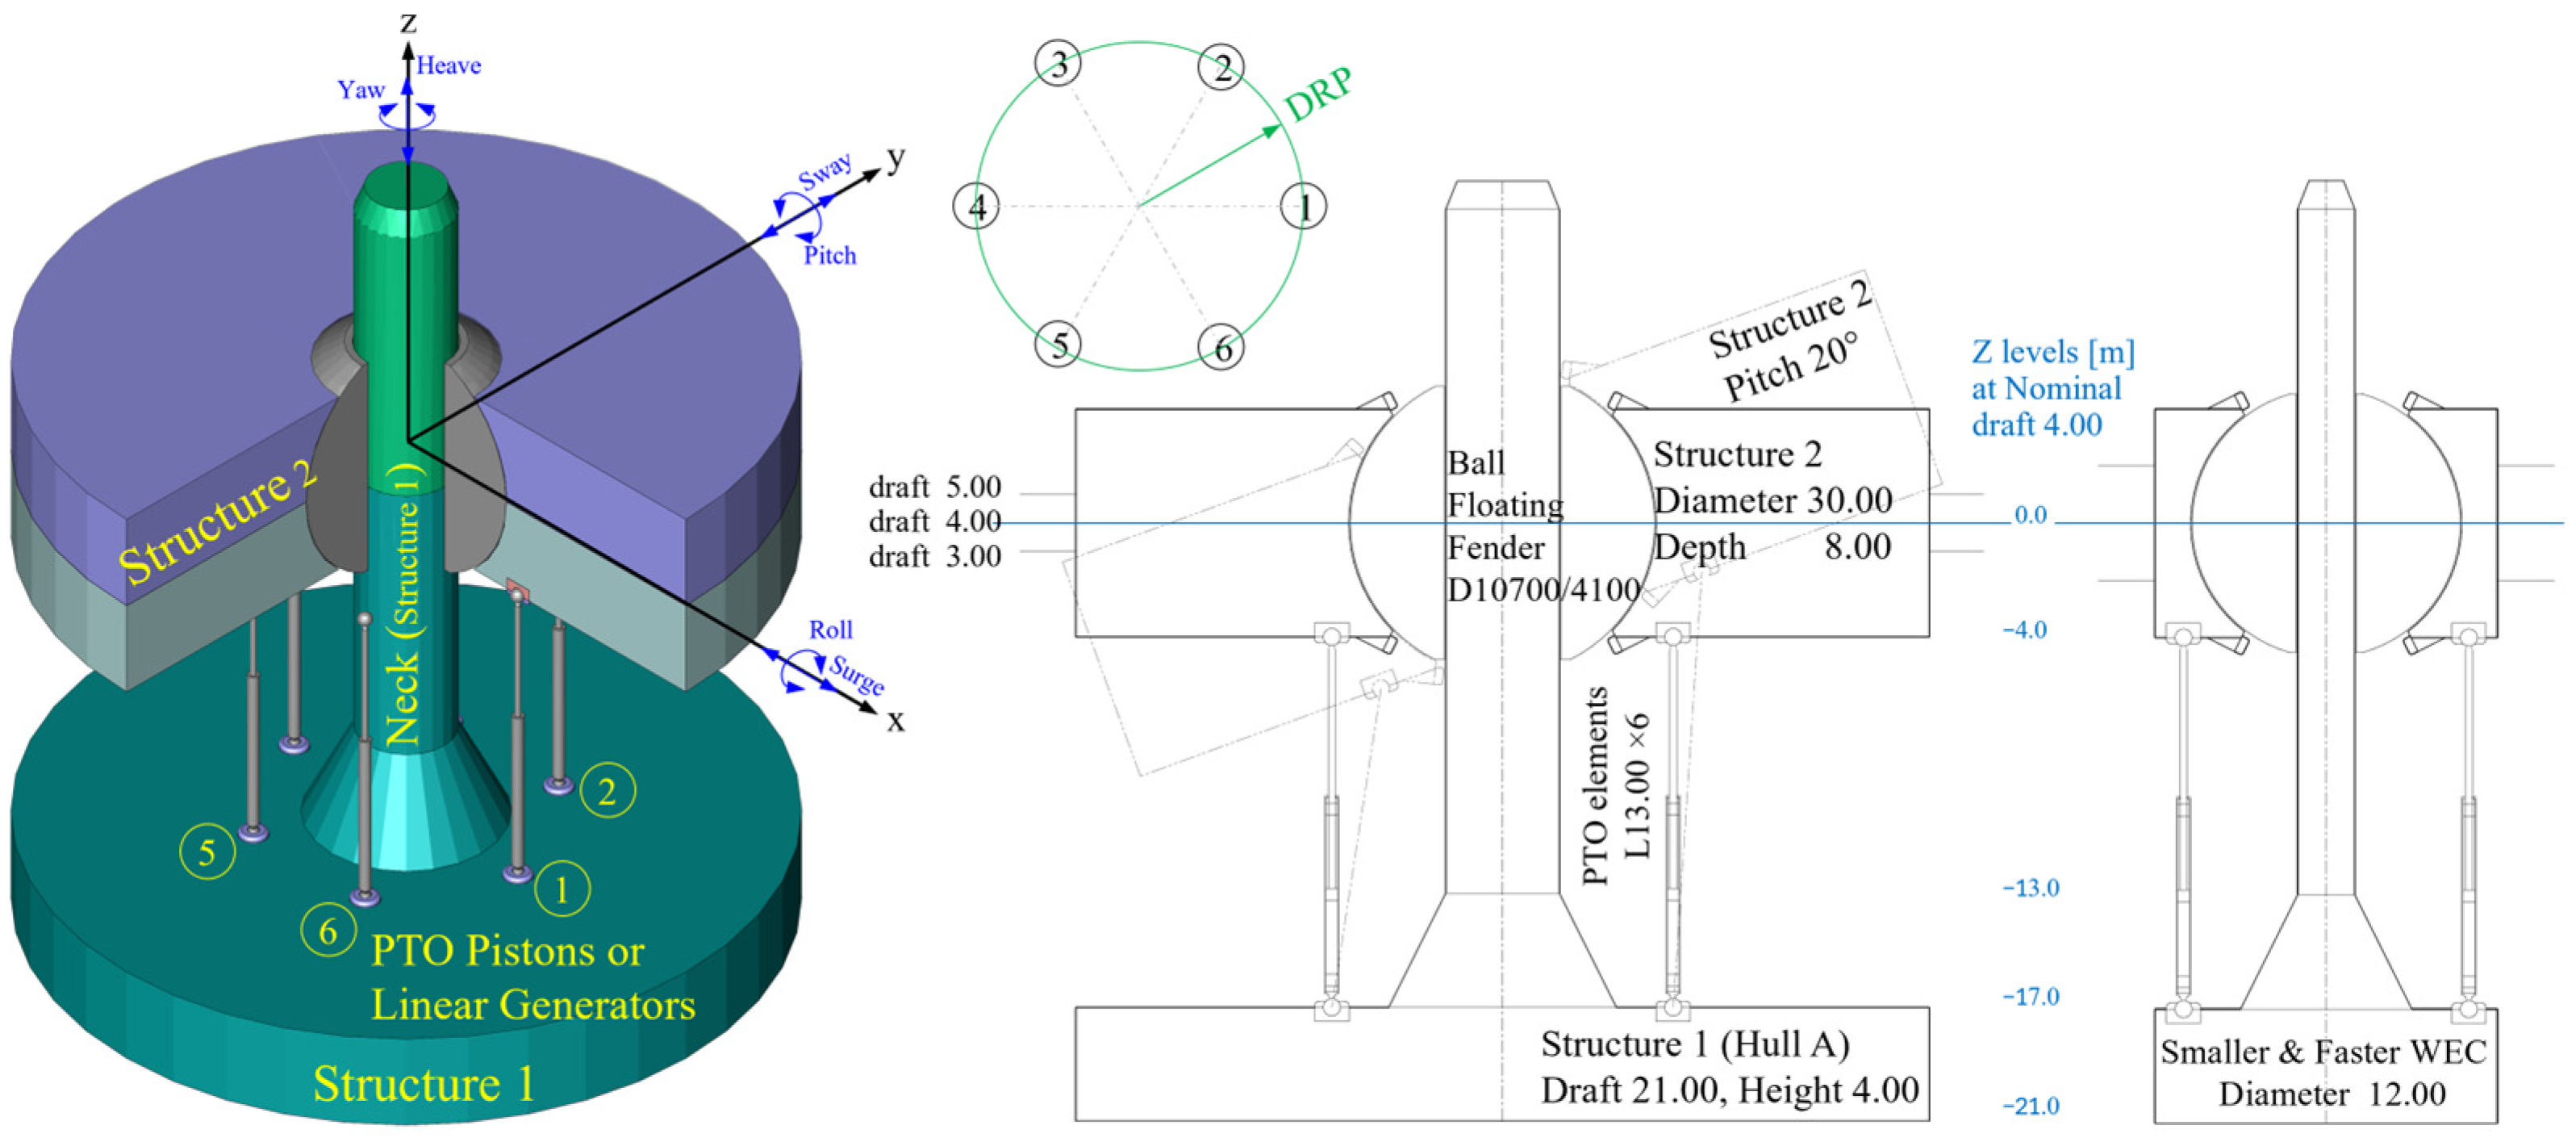
Figure 1 illustrates the concept, with dimensions given in meters. The system consists of two interacting hulls, designed to produce effective relative motion between them, based on hydrodynamic principles derived from the wave–body interaction theory: Structure 1, the Slow Structure, has high resonance periods (in the range of 40–70 s in heave and roll/pitch), due to its neck of small waterplane area. Practically, Structure 1 will remain relatively stationary in the presence of characteristic wind-generated waves. Structure 2, the Fast Structure, has low resonance periods (about 6–8 s in heave, roll/pitch), which are close to the typical peak periods of the most probable wave spectrum at our design site [27]. The aforementioned natural periods correspond to the design example in this study; however, they can be well controlled through the design parameters (geometry, inertia matrix) to fit any other design site conditions. Due to the axial symmetry of the structure, roll and pitch motions are equivalent for any incident wave direction. As a result, the WEC can absorb power from waves approaching from all directions. Accordingly, the analysis is presented in terms of the roll DOF, while the waves propagate along the y-axis. The roll and pitch moments of inertia as well as natural periods are identical.
We named this device SWAN–WEC—Small Waterplane Area Neck Wave Energy Convertor.
A PTO system composed of PTO elements, which may be hydraulic cylinders (pistons) or linear generators, linked between the structures, converts the wave power to hydraulic power or directly to electric power, respectively, by relative motion in two DOFs, which presents theoretical ideal efficiency up to 1.
In the present work, we focus on the hydrodynamic interaction to maximize power capture efficiency. The PTO system is idealized as linear damping elements, consistent with approaches adopted in previous studies [28,29,30]. In practice, the PTO will reduce the overall system efficiency. Nevertheless, for the purpose of evaluating and comparing hydrodynamic energy capture performance, it is justified to adopt an idealized linear damping representation. Incorporating a realistic PTO model at this stage would introduce additional design variables and increase the complexity of the preliminary analysis. Since a constant damping PTO cannot respond effectively to the rapidly changing requirements imposed by irregular waves, many researchers have focused on controllable PTO strategies [31]. These include adjustment of damping, reactive force, and more advanced approaches such as latching, declutching, and predictive control, which can significantly improve the stability of energy transmission and the overall efficiency of the WEC. Within the scope of the present study, no PTO control strategy has yet been analyzed. Prior to offshore prototype deployment, a more detailed and representative PTO model, optimized in conjunction with an appropriate control strategy, will be incorporated into subsequent analyses.
The neck of Structure 1 is housed within an internal moonpool in Structure 2, with proper small gaps and a unique two-DOF Spherical Gimbal Fender, which heaves with Structure 2, sliding over the neck of Structure 1, and allows for a smooth roll motion of Structure 2 over the spherical interface. This structural integration enables low-maintenance and straightforward facilitation of the relative motion, while also allowing motion constraints to be imposed to prevent overloading the PTO elements. From a survivability perspective, our integrated configuration represents a key advantage over the design proposed by [21], which connected the two bodies solely through a dashpot system.
As mentioned before, the economic potential of wave energy lies in large-scale WEC farms. The concept may involve compliant grid mooring for all the WEC units on a farm designed with proper electrical grid. Such a mooring arrangement would also prevent drifting of the WECs.
The resonance periods of the WEC in heave and roll are adjusted by its hydrostatic characteristics, namely mass, radius of inertia, and metacentric height (GM). To control its draft and roll radius of inertia (RRI), Structure 2 has an internal ballast system—radial and circumferential divisions to compartments, allowing seawater to be added or discharged. For the same waterplane area, as the displacement is lower, the heave motion responds to lower incident wave periods. As the weight is distributed outward, the RRI increases, as does the roll resonance period. To allow for additional enhancement of the CWR across different wave periods, the PTO elements are mounted on rails, allowing for the distribution radius of the PTO elements (DRP) to be adjusted to the idealized position.
Structure 1 is also equipped with a ballast system to allow for its adjustment to the draft change in Structure 2. In this way, the nominal gap between the structures does not change, and the capacity of the PTO is not affected, which is a problem introduced by [32]. Structure 1 also leaves dry compartments for all PTO systems, benefiting its low motion responses.
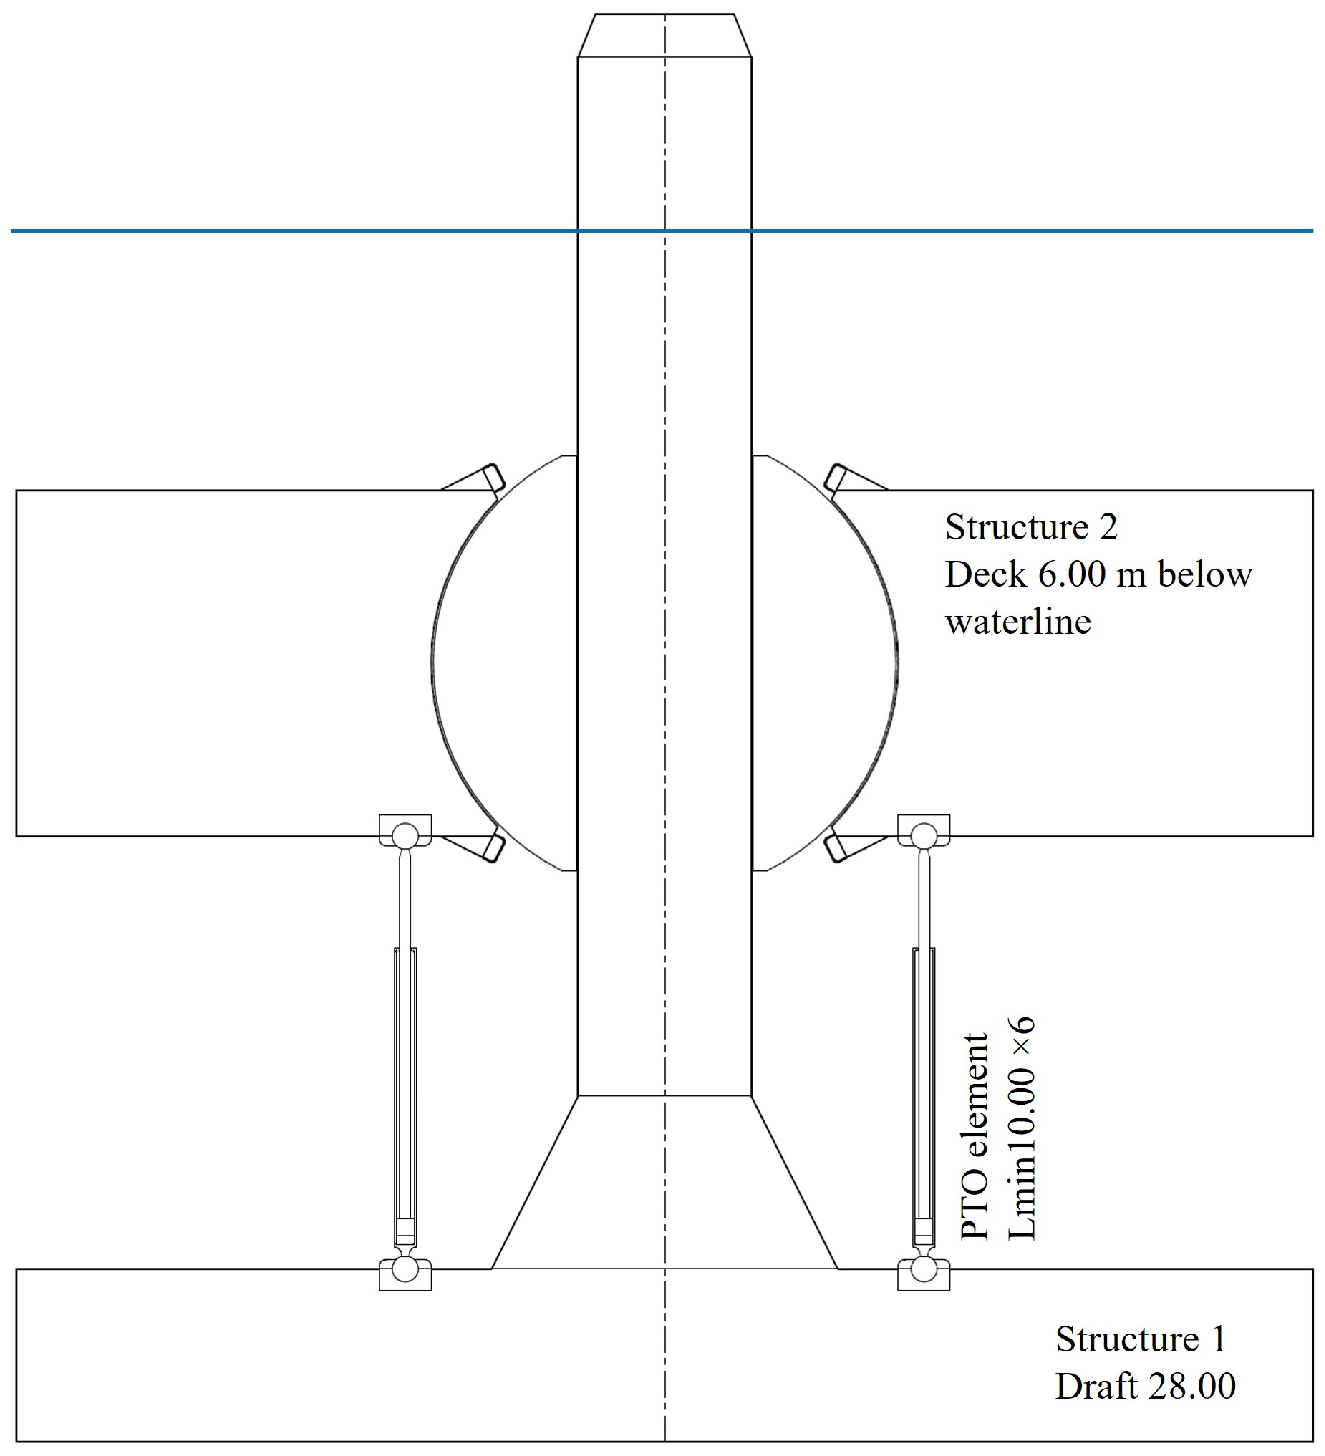
Under high/stormy sea state, when operating conditions become unsafe, additional ballast water will fill the hulls to submerge the device, with only part of the neck of Structure 1 above the water, to maintain positive floatation. At this survival floating state, the loads and motion are much reduced. Figure 2 illustrates the floating state during survival conditions, where the PTO elements are compressed to the minimum length and locked. The relative motion between the structures can be restricted by inflating the Spherical Gimbal Fender.
Tailor design for the site condition and control over parameters such as dimensions, mass, RRI, PTO characteristics, and the DRP, allows for optimal tuning to achieve maximum efficiency. For the implementation of a SWAN–WEC device, the site of interest should be surveyed to characterize its wave regime in aspects of long-term occurrence of significant wave height, H m 0 , and spectral peak periods, T p . This data allows for a customized design of the WEC so that its range of optional resonance periods aligns with the locally most probable peak wave periods. It should be noted that although the SWAN–WEC device might be adjusted to respond optimally within range of specific resonance periods, as the real-sea wave spectrum broadens, the WEC’s efficiency decreases.

3. The Mathematical Model

The hydrodynamic model solves the linear mathematical formulation of wave–structure interaction. For relatively large-scale structures, typically of characteristic size above 0.2 wavelength, where the flow is characterized by high Reynolds numbers, it is a common practice to neglect viscous effects and to apply the potential flow theory. In the present model, the Reynolds number is on the order of 10 7 . In addition, the analysis considers waves of small steepness. These conditions support the use of linear theory and the neglect of higher-order nonlinear and viscous effects. Nevertheless, we may expect some lower efficiency in the future wave flume study, relative to the theoretical results.
The numerical formulation is based on the boundary elements method with a wave source Green’s function, and we apply the ANSYS AQWA 2025 R1 (Ansys Inc., Canonsburg, PA, USA) software. The mathematical formulation of the wave–structure interaction theory, for a single body, as well as for several interacting bodies, is well established and verified to be practical and applicable for design. Since for the hydrodynamic analyses in this study we apply ANSYS AQWA, we recommend the AQWA Theory Manual [33] as a comprehensive reference for a complete formulation of the theory as well as the numerical formulation.
Although ANSYS AQWA enables connection elements between the structures, we formulated and programed a toolbox that we call FSA, Floating Structure Array, for the post-processing of the hydrodynamic results obtained by running AQWA for free-floating interacting structures, with no mooring or connection links between. We consider FSA more flexible and efficient for the setup and solution of the equations of motion (EOM) with the presence of links, as well as for parametric studies for practical ranges of parameters and processing and presentation of results.
FSA processes the following functions:
  • It loads the results of exciting forces and hydrodynamic coefficients (added mass and damping) from a single run of ANSYS AQWA (for all the input wave periods and directions) of free-floating (not linked and not moored) hydrodynamically interacted structures.
  • It formulates a CLM, Connection Link Matrix, of dimensions 12 × 12 , for the representation of each connection link between any two structures of any linear type (spring, damper, or hinge at any DOF).
  • It formulates a MLM, Mooring Line Matrix, of dimensions 6 × 6 , for the representation of each mooring line (between a point on a structure and a fixed anchoring point).
  • It assembles the EOM for free structures (with no connections or mooring), solves the RAOs, and compares with the RAOs listed by ANSYS AQWA (this is a quality check, and we always get practically equal results, identical to the precision of the output by AQWA).
  • It assembles the EOM for the linked and moored structures, where all the CLMs and MLMs are substituted in the system matrix, and it solves for the RAOs.
  • It processes any post results like point RAOs, relative RAOs between any two points on different structures, the motion of the PTO elements and loads, input wave power facing the structure, power absorbed by the PTO elements, and WEC efficiency in terms of CWR.
FSA was programed for any number of structures and it was well verified by setting the geometries, connections, mooring, dynamic parameters, and sea conditions through several published studies of arrays of floating structures that present mathematical models, as well as laboratory experiments [34]. In this study we have two interacting structures, for which we present the formulation of EOM here.
ANSYS AQWA solves the linear wave–body boundary value problem for N (up to 20) interacting structures by decomposing the velocity potential function into a sum of 6N + 1 elementary velocity potential functions: six radiation problems where each of the N structures oscillate at a unit amplitude in a single DOF, while the other structures are at rest, and a diffraction problem, where all the structures are fixed and excited by an incident wave of unit amplitude. The hydrodynamic differential problems provide hydrodynamic coefficients, and then a set of linear algebraic equations is formulated and solved to obtain the harmonic response amplitudes for regular waves, which are commonly referred to as RAOs, response amplitude operators, and are proportional to the incident wave amplitude. The set of linear equations of motion of N hydrodynamic interacting structures with frequency-dependent hydrodynamic coefficients are obtained as:
[ ω 2 M + A i ω B + C + K H + K L ] ξ = f
where M is a 6 N × 6 N block-diagonal matrix with 6 × 6 structural mass submatrices of all the interacted Structures and A = [ a j m , k n ] and B = [ b j m , k n ] are the assembly of the 6 N × 6 N hydrodynamic added mass and damping matrices including the hydrodynamic interaction coupling terms between different Structures (located in off-diagonal submatrices), obtained by integrating the pressure results of the radiation problems, where each structure n oscillates with a unit amplitude in a single DOF k , while the other structures are at rest, and applies force in the DOF j to structure m :
  ω 2 a j m , k n + i ω b j m , k n =   i ρ S o m φ r k n n j m d S ,     Φ r k n = R e φ r k n e i ω t
Here the subscripts m and n correspond to the m -th and n -th Structures, and the subscripts j ,   k refers to the load and motion DOF and Φ r k n is the flow potential function of radiation generated by structure n , oscillating with a unit amplitude at DOF k, while other structures are at rest.
C is the 6N × 6N damping matrix that represents all the PTO elements between the structures; K H is an assembly for all the structures of the hydrostatic stiffness, of which each diagonal 6 × 6 submatrix is the hydrostatic stiffness 6 × 6 matrix of an individual structure (defined by Equation (3.19) in [33]) and all off-diagonal 6 × 6 sub-matrices are null, as there is no hydrostatic interaction between structures; and K L is the stiffness matrix that represents all the links of spring type between the structures.
C and K L are built by assembling all the links of damping and spring type respectively.
For a single link i , connecting a point X a , Y a , Z a of Structure a and a point X b , Y b , Z b of Structure b , a kinematic link matrix, K g i , of size 12 × 12 is formulated as follows:
K g i = I 3 R a T I 3 R b T   K I 3 R a   I 3 R b
Here, I 3 is the 3 × 3 identity matrix. This part is responsible for linear translation of the translations DOFs (surge, sway and heave);
R a = 0 Z a Z g a ( Y a Y g a ) ( Z a Z g a ) 0 X a X g a Y a Y g a ( X a X g a ) 0 is the skew-symmetric cross-product matrix for Structure a ( R b is the same but with subscript b for Structure b ). This part is responsible for the rotation motions (roll, pitch, and yaw). X g a \ b , Y g a \ b , Z g a \ b are the coordinates of the center of gravity of Structure a \ b .
K is the 3 × 3 stiffness matrix of a linear spar of a unit spring coefficient, and it corresponds to the translational movements of the attachment point on the structure relative to a fixed point at the direction of the spar. It is derived by writing it for the local coordinates of the element, where the x coordinate is along the element as K e = 1 0 0 0 0 0 0 0 0 , and rotating it to the link direction applying the rotation matrix.
K g i is interpreted as differences of 6 DOFs motion between the two structures. Each K g i is then multiplied by i ω C d i if the link i is a PTO element with a damping coefficient C d i , or by k i if it is a spring with a spring coefficient k i , and assembled to the global C or K L .
ξ is a column assembly of the complex RAOs of 6 DOFs for all the structures and f is a column assembly of the complex excitation force vectors of 6 DOFs for all the structures.
Let the matrix at the left-hand side of Equation (1) be denoted as H. By solving ξ = H 1 f   we get the frequency-dependent 6 N   RAOs vector ξ about the center of gravity of each structure.
The point RAOs, at any point X a ,   Y a , Z a of Structure a , are given by the multiplication of the translation matrix, T = I R a   , by the RAOs at the center of gravity of Structure a.
Solving the RAOs of all the connected bodies, the mean power absorbed in the WEC is calculated by integrating over a wave period:
P ω = i = 1 N d 1 T 0 T F p t o v i d t = 1 2 ω 2 i = 1 N d C d i L i 2
where the PTO force is given by F p t o = C d i ω d L i and velocity of each damper is given by v i ω = d L i ω . N d is the number of dampers, C d i is the damping coefficient of each damper, and L i is the amplitude of axial displacement of the damper i .
L i   is obtained by calculating the link deformation d L i =   K g i ξ a b , where ξ a b is a column vector of the 6 DOFs RAOs of Structure a followed by the 6 DOFs RAOs of Structure b. d L i is a column vector of size 12. The members ( 1 , 2 , 3 ) are the ( d x , d y , d z ) displacement differences (between the two connection points of the link) calculated by Structure a, while the members ( 7 , 8 , 9 ) are the ( d x , d y , d z ) displacement differences calculated by Structure b. The amplitude of axial displacement is the same at both ends of the PTO element:
L i = d L i 1 2 + d L i 2 2 + d L i 3 2 = d L i 7 2 + d L i 8 2 + d L i 9 2
The CWR for the monochromatic wave is calculated as the ratio of absorbed power to incident power at each frequency.
For the parametric analysis, the frequency-dependent CWR is examined over a range of PDC and DRP values for the PTO elements, together with different RRI and COG values for Structure 2.
For irregular waves, the procedure is as follows. Each sea state is represented by a wave spectrum, which describes the energy density distribution over wave frequencies, S ( f )   (here, f denotes frequency, not force). Numerically, the spectrum is discretized into frequency bins. The area under each bin, multiplied by the water density, ρ w , and gravitational acceleration, g , gives the energy density, E d , of that bin.
E d f i = ρ w g f i f i + 1   S ( f i ) d f ,   J / m 2
Multiplying this value by the device’s characteristic width, D , and the group velocity, c g f i , corresponding to that bin, yields the incident wave power, P i f i , at that frequency projected on the device.
P i f i = E d f i · D · c g f i ,   w a t t
The total incident power is then obtained by summing the contributions of all bins.
Assuming linear behavior, the capture width ratio evaluated at each frequency (under monochromatic wave conditions, C W R m o n o ) can be weighed by the corresponding incident power and then divided by the total incident power. This provides the overall capture width ratio for irregular waves, C W R i r r .
C W R i r r f i = C W R m o n o f i P i f i f P i f i

4. Verifications

4.1. General Principles of WEC Design for Ideal Efficiency in Two DOFs

In this section, we demonstrate, with mathematical models, the tuning of a simplified WEC to its theoretical ideal efficiency, which is closer to the 2D flow approximation for which the theoretical ideal efficiency is valid. This demonstration also serves to verify that the results obtained from our modeling method (APDL + AQWA + our source code FSA, presented hereafter in Section 3) agree with the theoretical results of ideal efficiency of WECs. All these theoretical results are developed for example in [26].
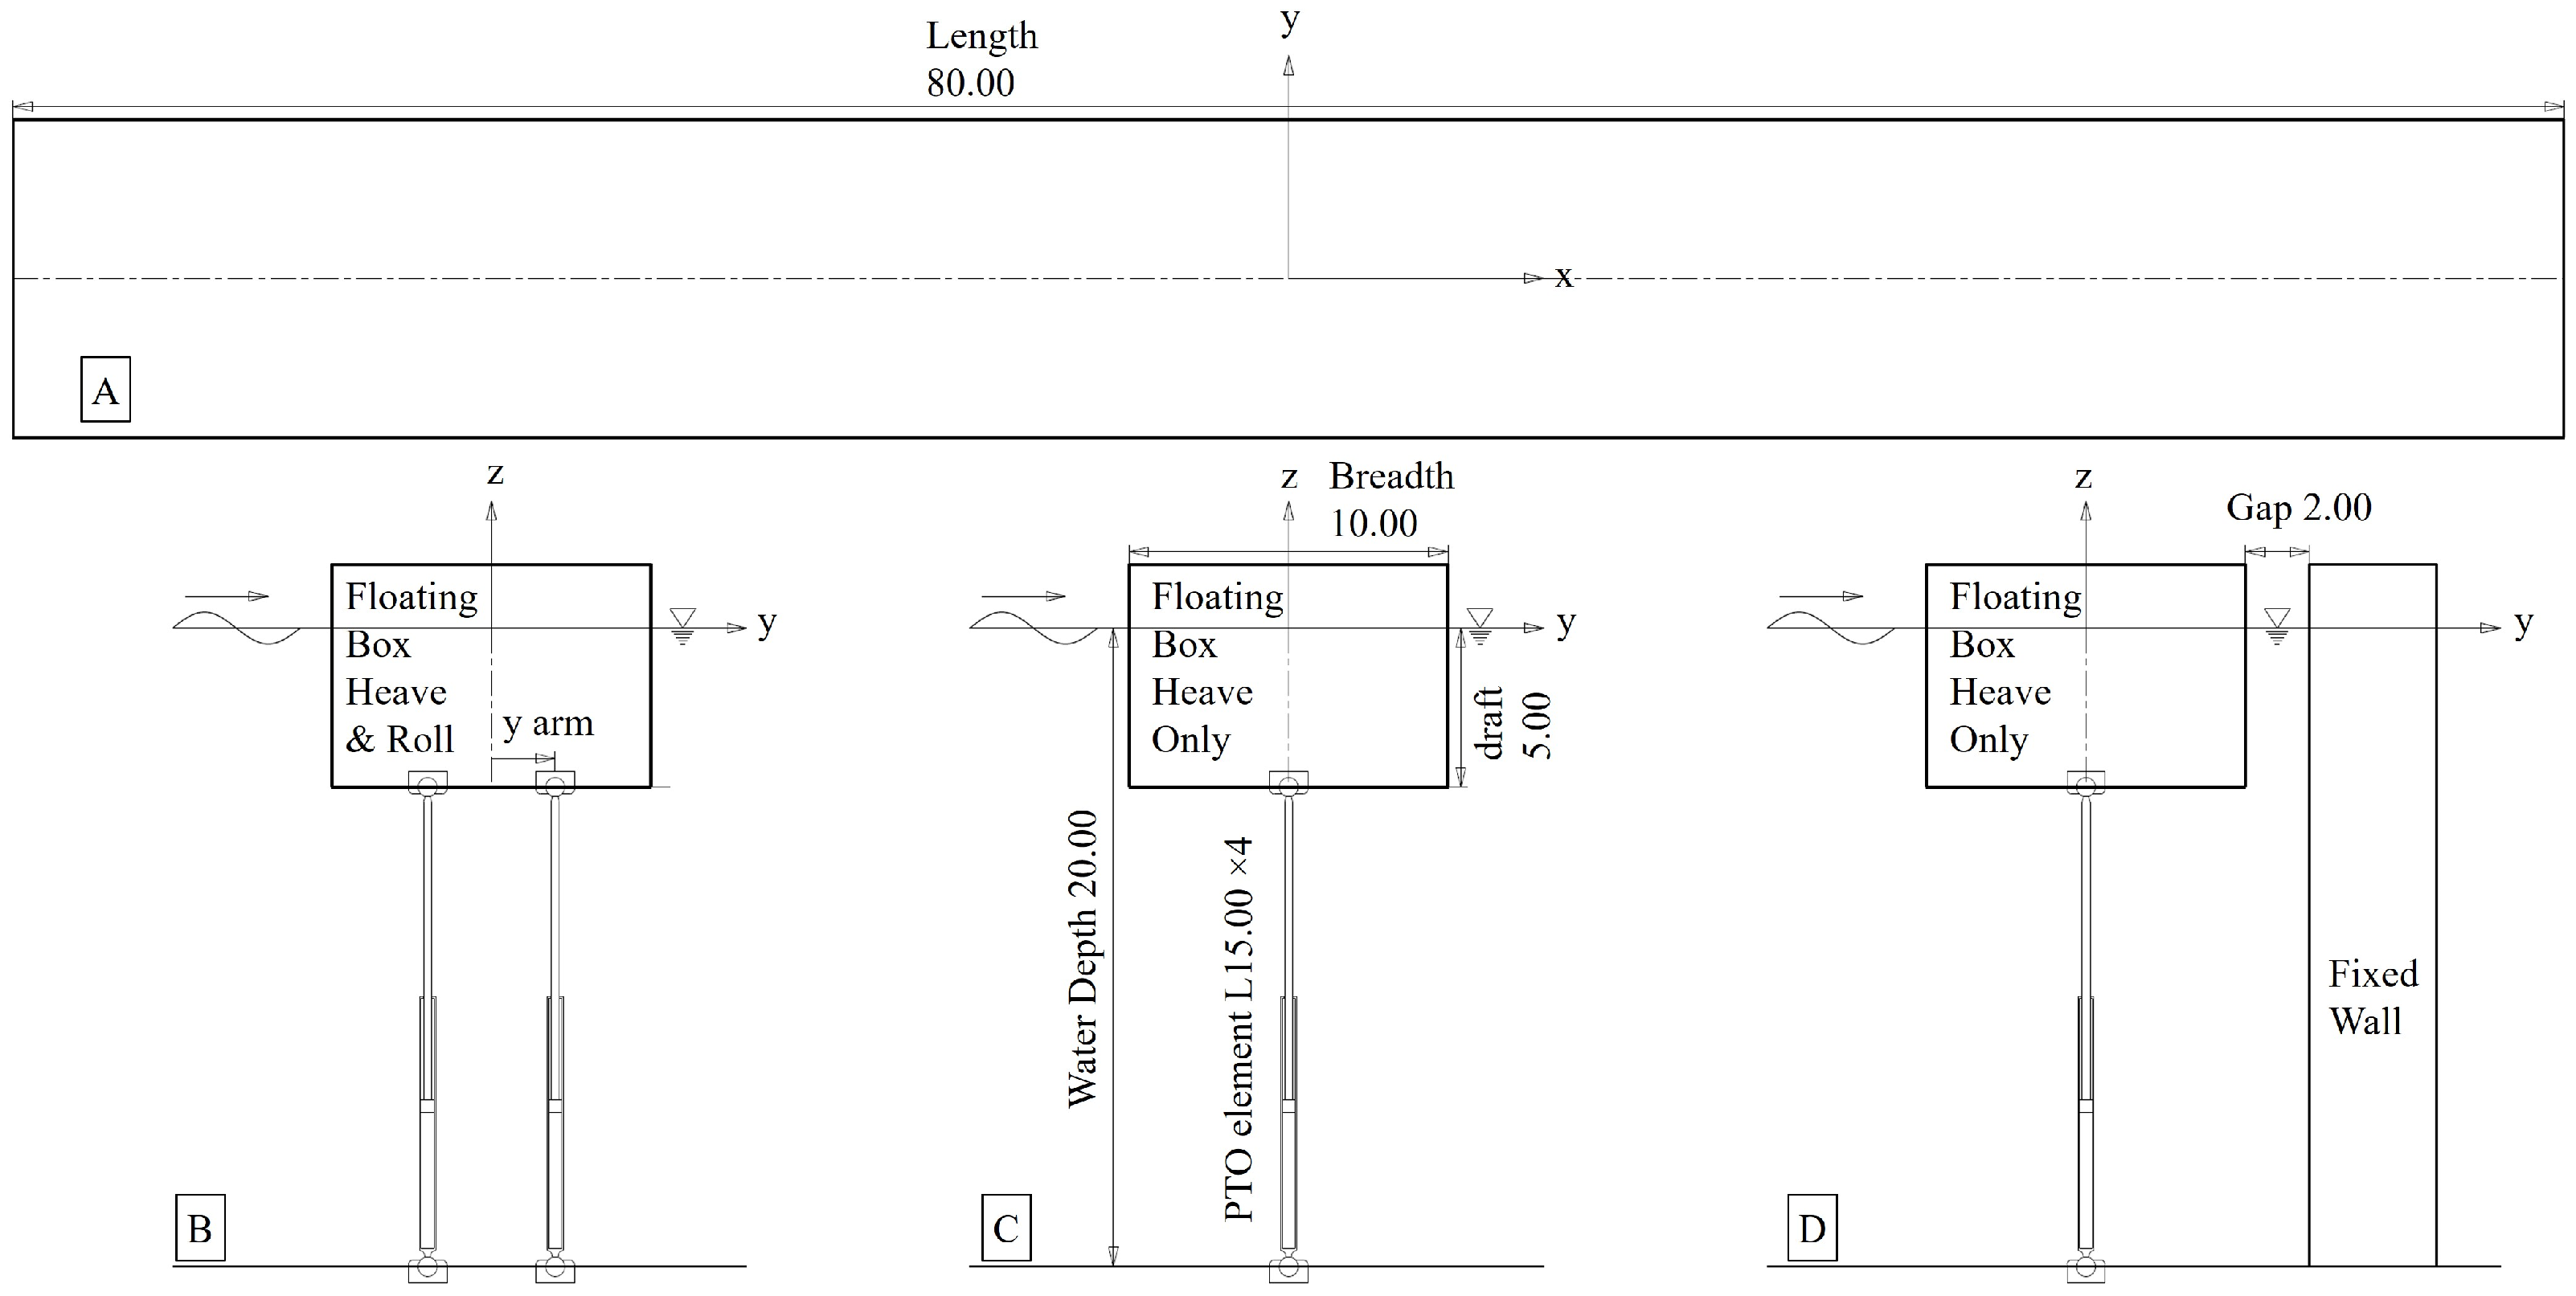
We model a rectangular barge (floating box), absorbs a wave’s energy through vertical PTO elements anchored to the seabed, which are idealized through a linear damping coefficient (force proportional to velocity). While a PA may exceed the theoretical ideal efficiency of a 2D absorber, the barge, with a large length to beam ratio, is used to demonstrate the theoretical ideal efficiency for both a single DOF and two DOFs. Figure 3 presents the floating box WEC in several modes of operation, which are selected to demonstrate our method of tuning. Dimensions are expressed in meters. All the simulations are at beam seas (wave propagation along the y-axis). Table 1 specifies the parameters relevant for this example.
As mentioned before, the ideal efficiency is obtained by calibration of the WEC under two conditions:
C1—the resonance period in the absorbing DOF equals the period of the incident wave.
C2—for the absorbing DOF, the PTO damping coefficient (PDC) equals the free-floating (with no PTO elements) wave radiation damping at the resonance period.
At these two ideal conditions, the RAO (response amplitude operator) in the absorbing DOF equals half of the RAO of a free-floating structure in the same DOF.

4.1.1. A Heave-Only WEC (Configuration Figure 3C)

By connecting the PTO elements at the centerline, we capture the energy only from the heave motion. To obtain the ideal efficiency of 0.5, we need to calibrate the heave resonance period to that of the incoming wave and the PDC to the wave radiation damping of a free-floating structure in heave at this resonance period. For a barge of specified dimensions, hydrostatic stiffness is determined, while we can use a ballast to control the resonance period in heave. For the tuned resonance period, the radiation damping for a free-floating structure can be found (explained in Section 2).
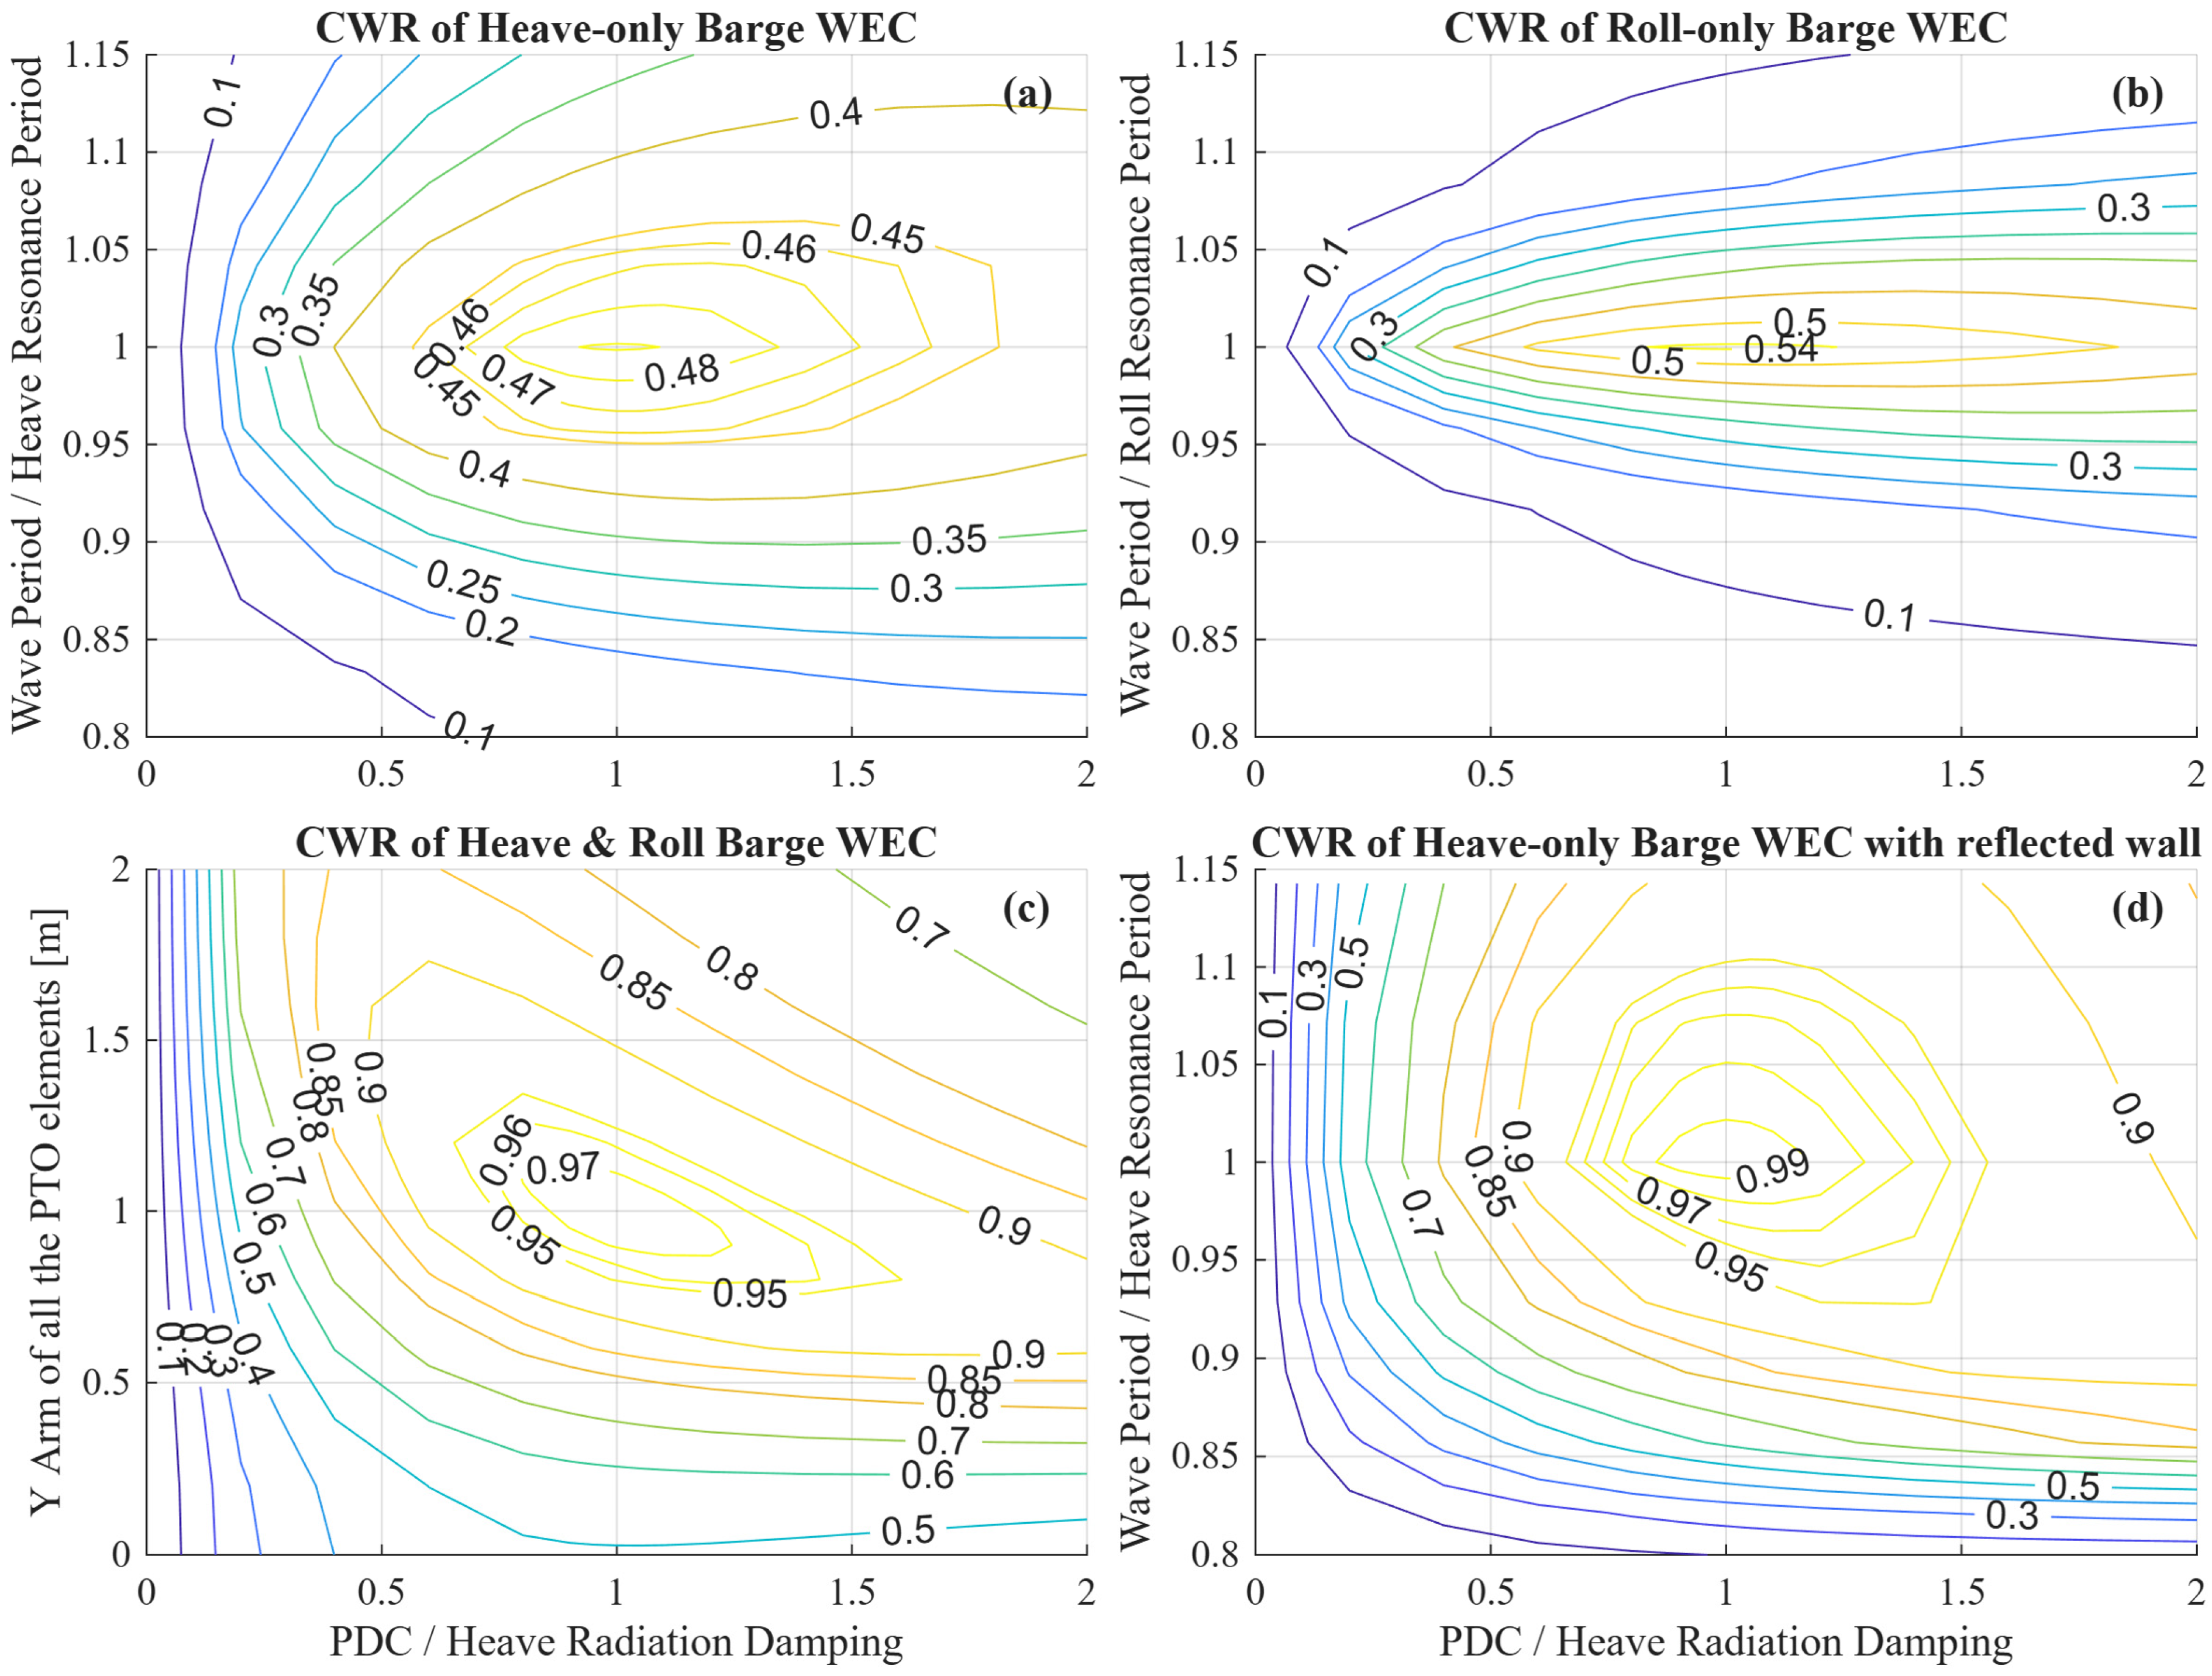
Figure 4a maps the CWR for the heave-only WEC for a range of PDC and the incident wave periods. The ideal efficiency is indeed ~0.5 (0.491 by the model), obtained at the resonance period of 6 s, and at the ideal damping equals the heave wave radiation damping. At the heave resonance period of 6 s, the heave RAO with the ideal WEC is 1.131, exactly half of the free (without PTO elements) heave RAO, which is 2.262.

4.1.2. A Roll-Only WEC (Configuration Figure 3B with Constraint Sway and Heave)

For a roll-only WEC, we tune the roll resonance period to 6 s. For a barge of specified dimensions, we have two ways of modifying the roll resonance period: the first is by increasing the vertical center of gravity (VCG), which reduces the metacentric height, GM, and increases the roll resonance period; and the second is shifting ballast water toward the sides of the barge, which increases the roll radius of inertia (RRI) and thus the resonance period.
Figure 4b maps the CWR for the roll-only WEC for a range of the total roll radiation damping (of all the PTO elements) and the incident wave periods. Roll damping is the sum of the damping coefficient times the y-arm of all the PTO elements.
The theoretical ideal efficiency is 0.5 and 0.546 according to the model. As the model is 3D, the power captured by the WEC induces diffraction of the incident wave, resulting in additional power converges from the WEC’s sides. The maximum efficiency is at the roll resonance period of 6 s, and the ideal damping equals the roll wave radiation damping. At a roll resonance period of 6.0 s, the roll RAO with the ideal WEC is 48°, exactly half of the free roll RAO of 96°.

4.1.3. A 2 DOFs, Heave and Roll, WEC (Configuration Figure 3B with Constraint Sway)

Now we let the barge heave and roll. For ideal power capture by heave, we set the PDC equal to the wave radiation damping in heave and the wave period equal to the resonance period of 6 s, tuned in heave and roll. By scanning the y-arm, we find the ideal arm for the maximum CWR of the two-DOF WEC.
Figure 4c maps the CWR at the resonance period of heave and roll, 6 s, for the range of the two calibration parameters: total PDC and the y-arm of the PTO elements. We obtain an ideal efficiency of ~1 (0.977).

4.1.4. A Heave-Only WEC with a Reflecting Wall (Configuration Figure 3D)

Figure 4d maps the CWR for the heave-only WEC with a reflecting wall for a range of total PDC and the incident wave periods. With the wall, the added mass in heave is higher and increases the heave resonance period to 7 s. The ideal efficiency is 1 (0.997 by the model) at the resonance period of heave of 7 s, and the ideal damping equals the wave radiation damping. The heave RAO with the ideal WEC is 1.16, exactly half of the free heave RAO, which is 2.32.
A simple barge-type WEC, with PTO elements connected to the seabed, is nice for demonstrating the principles of optimizing the efficiency and for verifying the modeling procedure with theoretical results, as shown above; however, it is not very practical. Anchoring the PTO elements to the seabed requires sites of appropriate water depth and a stable seabed. The ball bearings may be grasped or grinded by sand. In addition, the presence of cylinders near the seabed can induce vortices, leading to scouring.
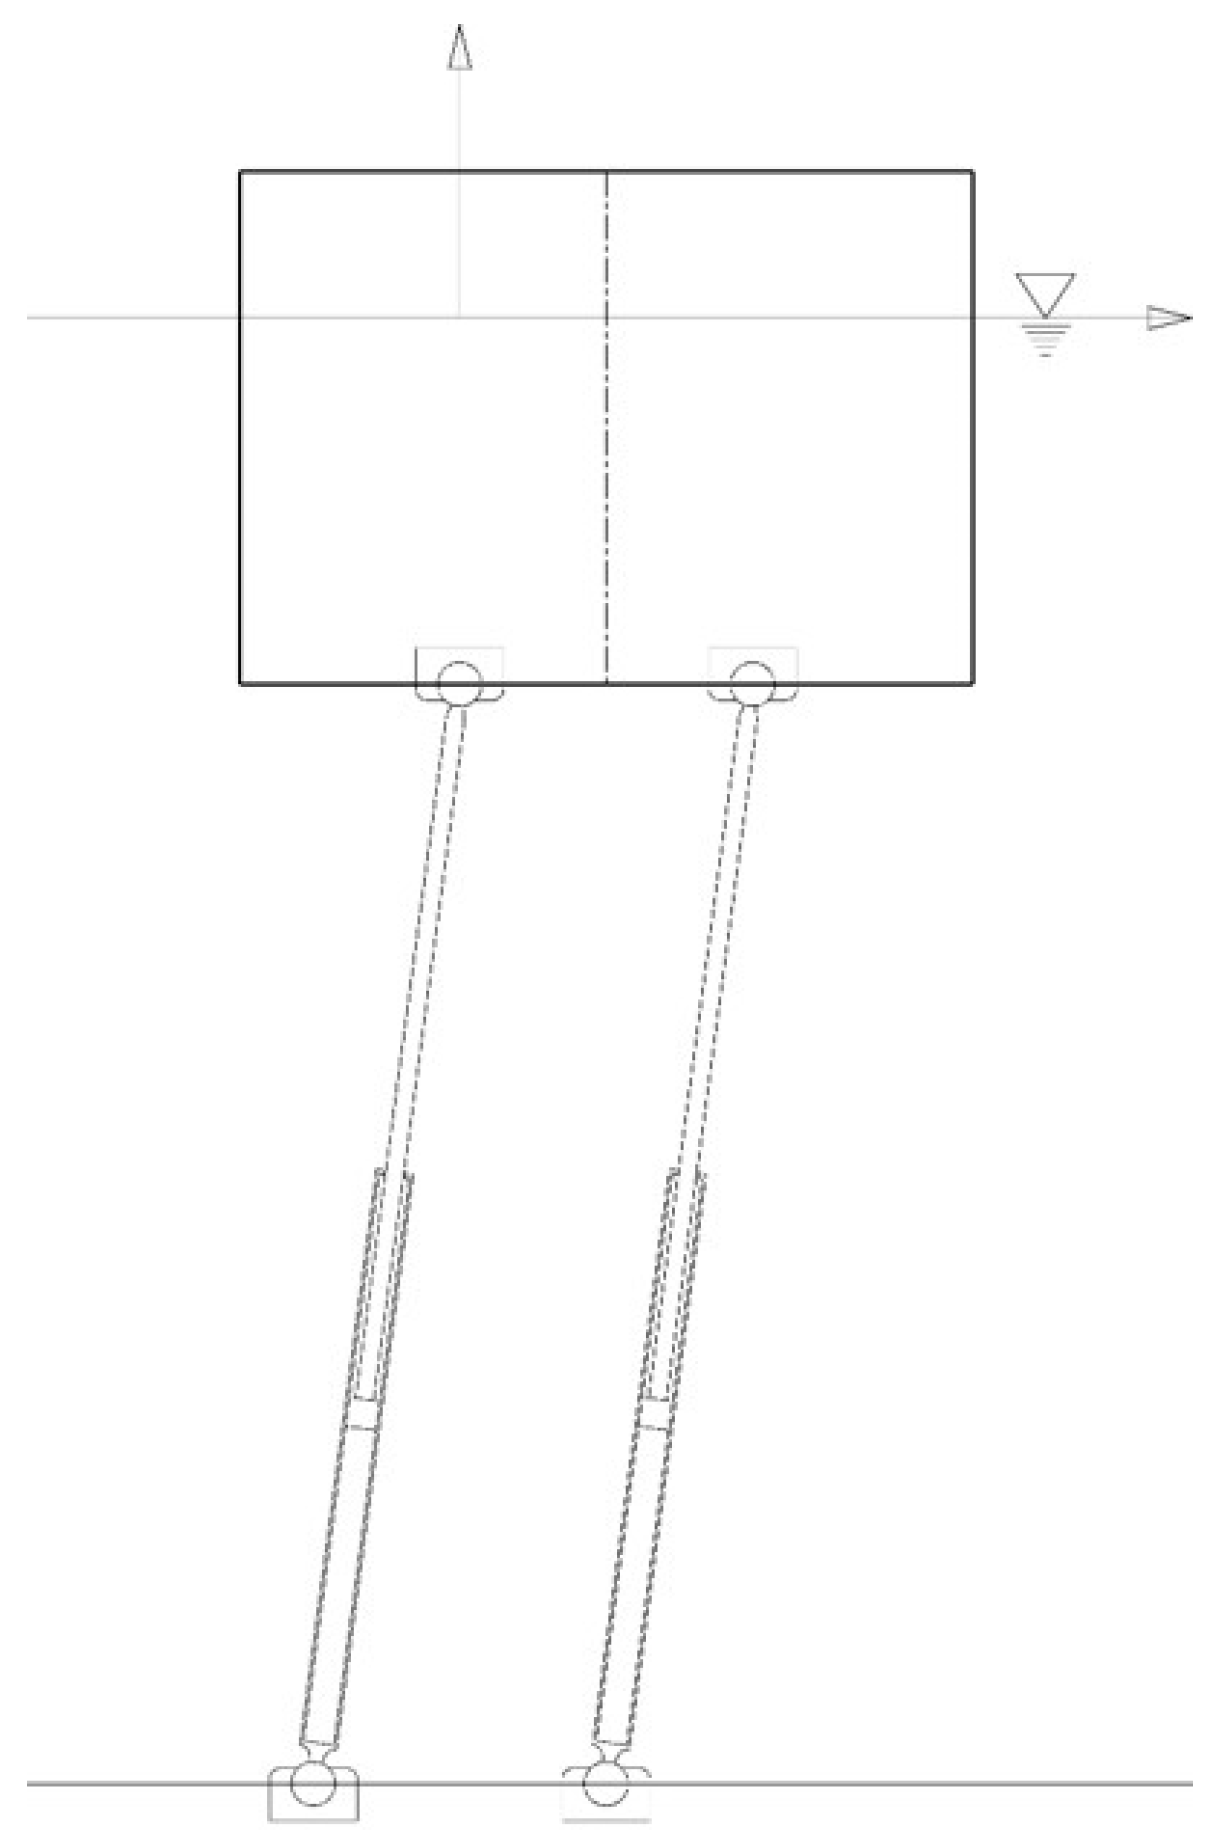
Furthermore, attention must be given to the fact that during the oscillations, when the PTO elements are compressed, the device is laterally unstable. Figure 5 illustrates a small sway motion with compressed PTO elements. This situation is unstable, as the PTO elements push to increase the sway. This may be mitigated by sufficiently stiff lateral mooring, which is problematic and expensive in deep water. We therefore propose an elegant, simple, and inexpensive alternative: pulling the barge down against its floatation, such that the PTO elements remain in tension throughout the entire wave cycle. As the displacement of the structure is an order of magnitude higher than the required load for pre-tensioning, it will have a minor effect on the performance. Nevertheless, a high tide range will cause difficulties with a seabed-reacted WEC.

4.2. The Concept of Two-Cylinder WEC

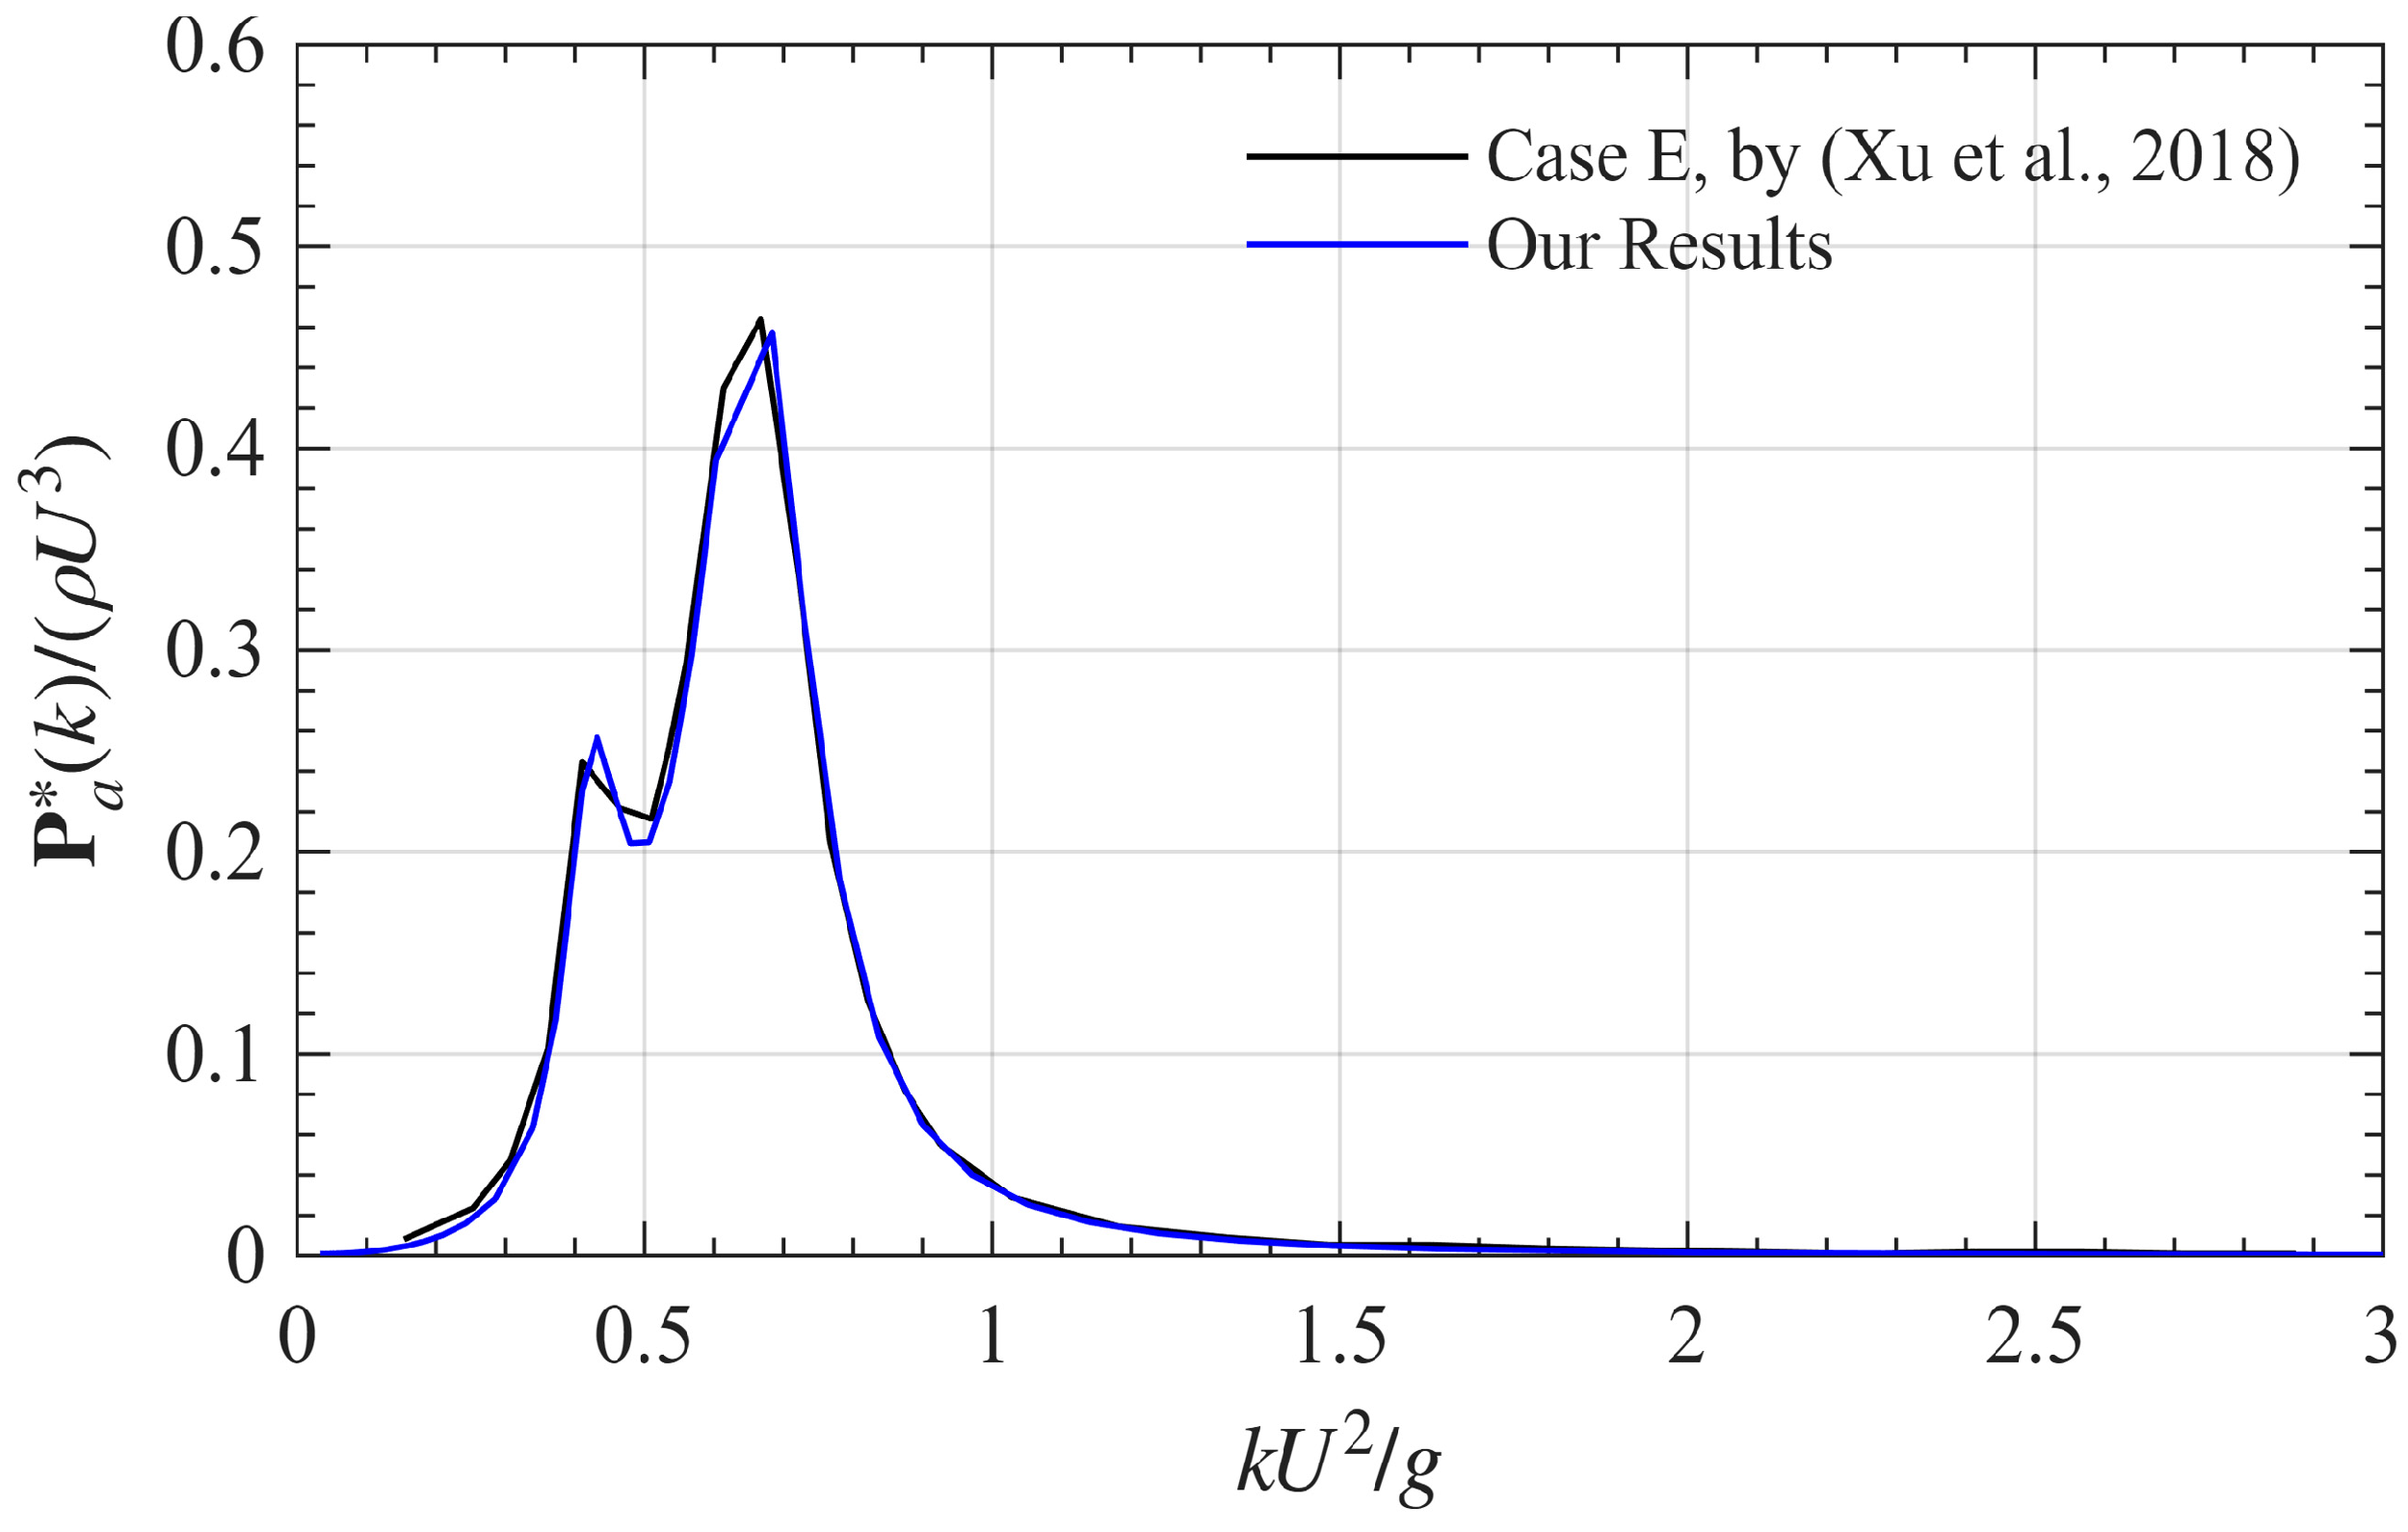
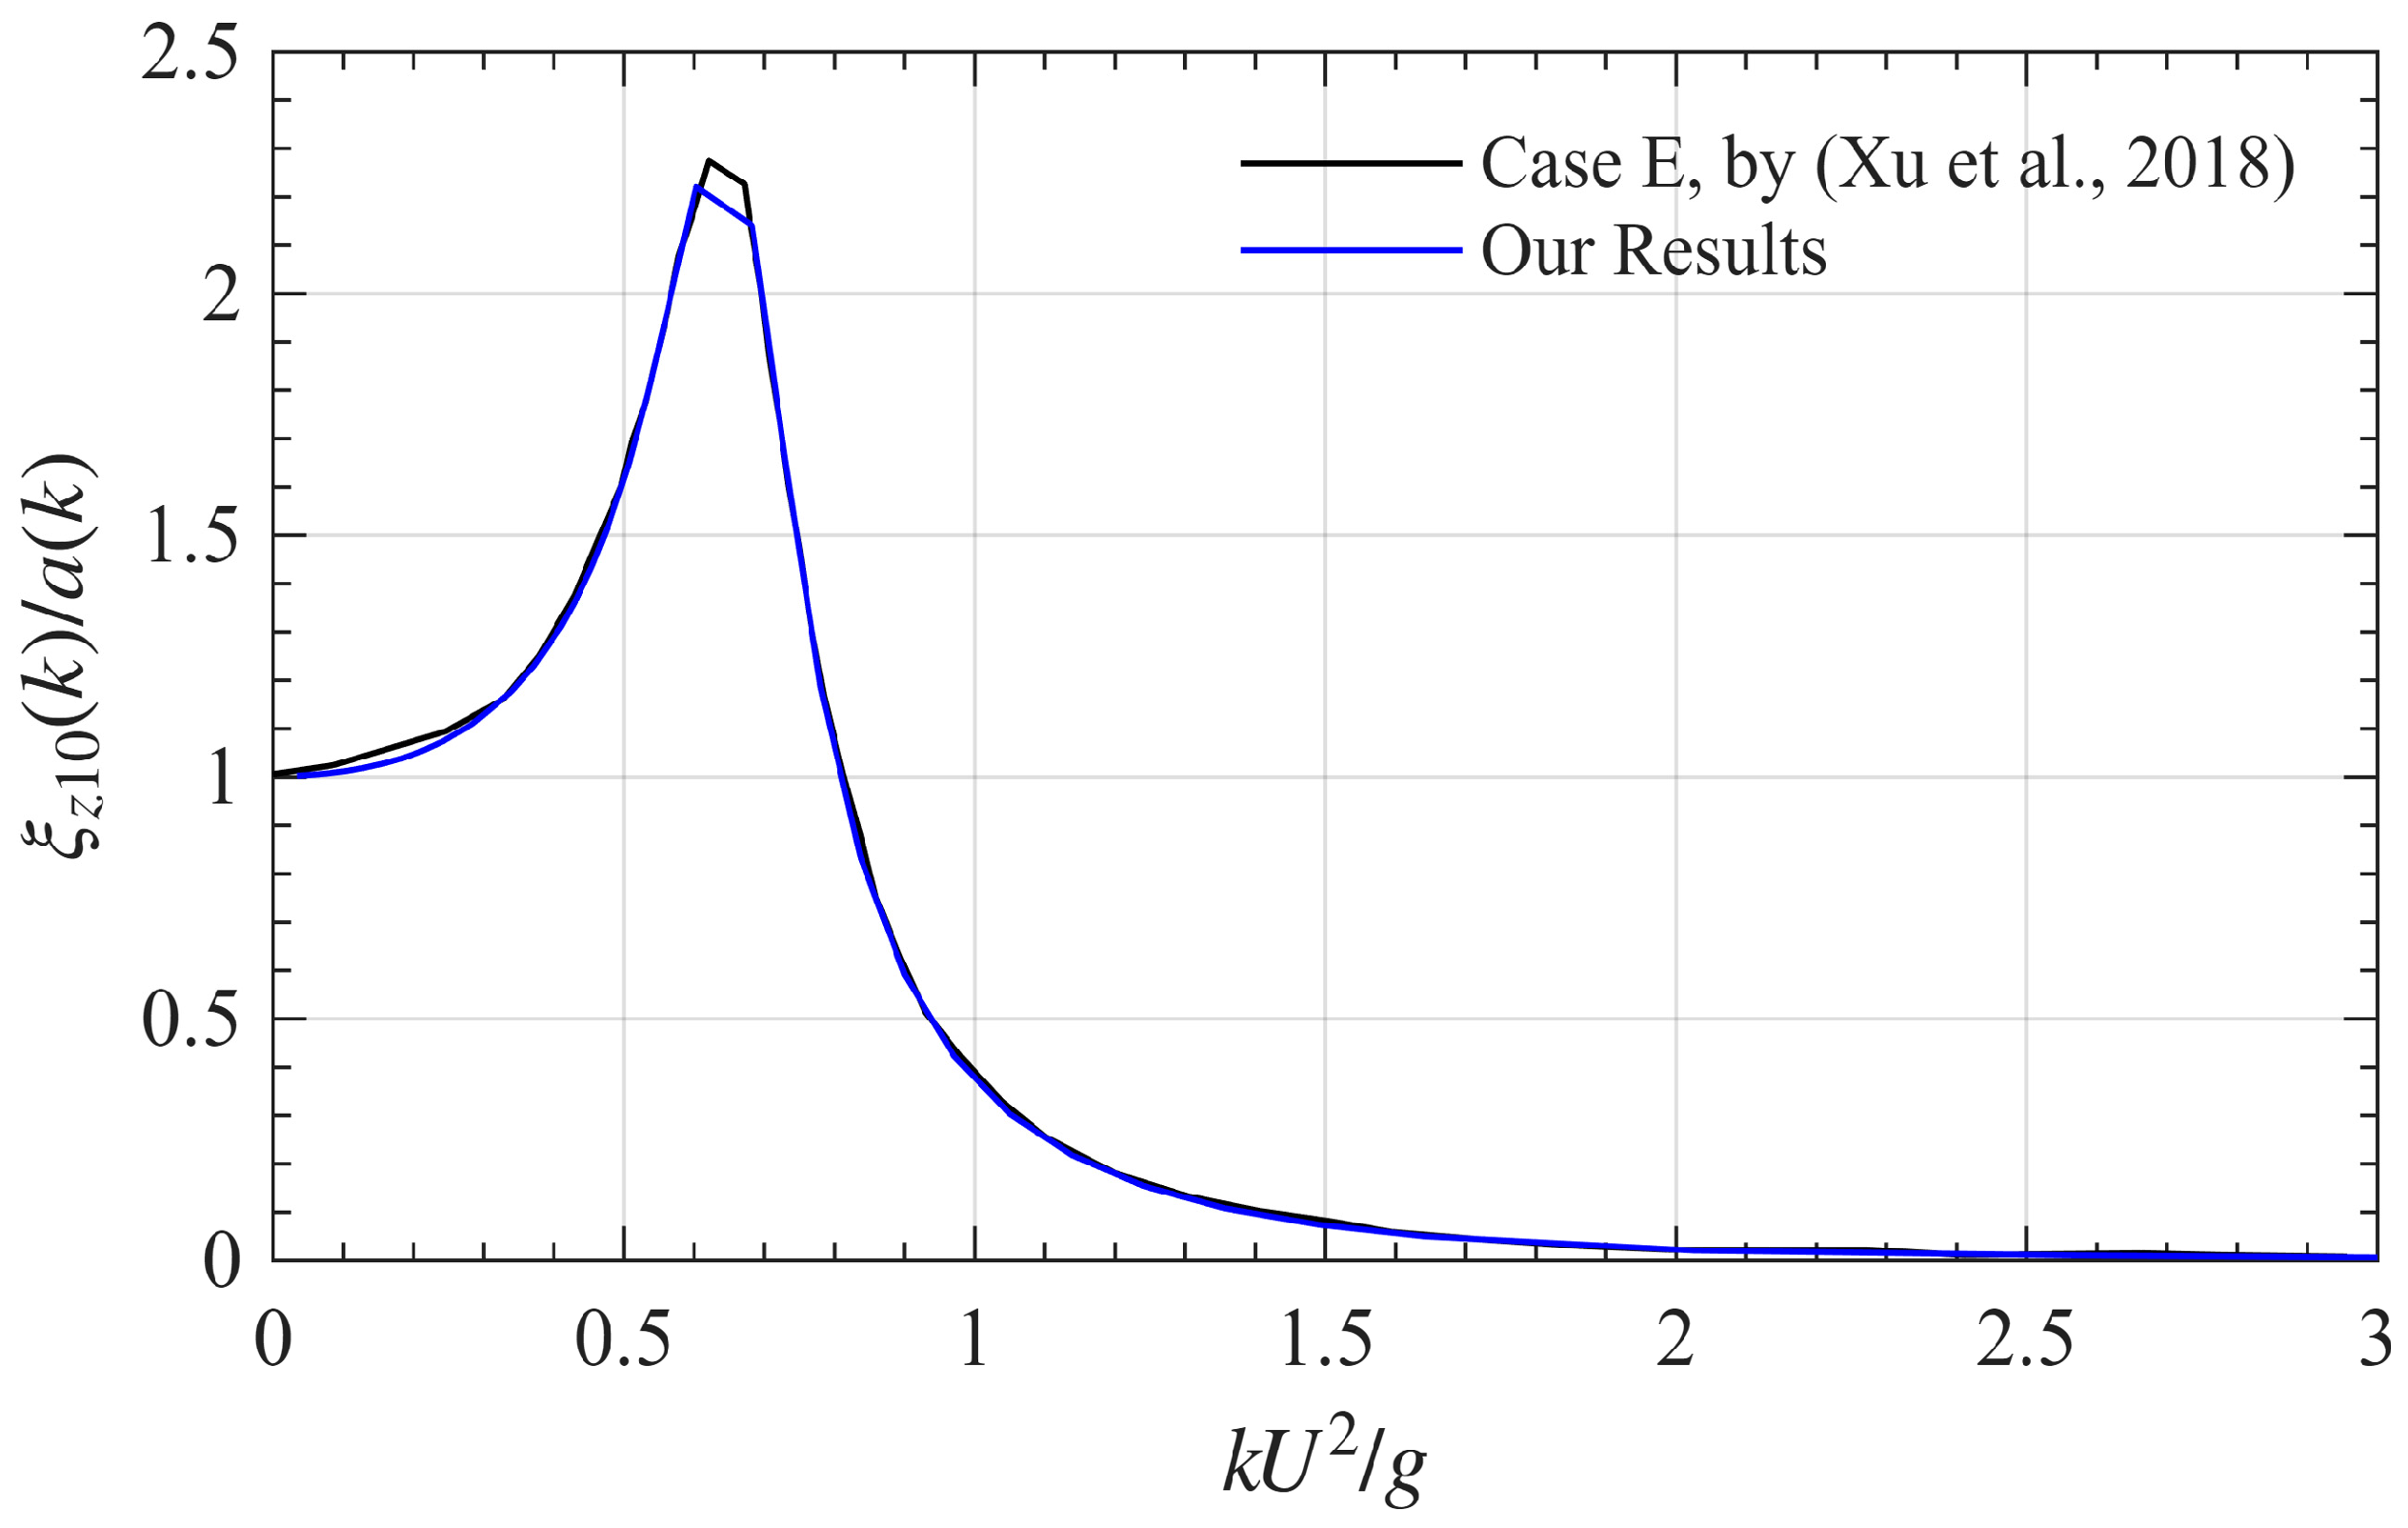
Xu et al. [21] applied analytical methods (domain decomposition, which enables the use of separation of variables techniques, and eigenfunction expansion methods) to solve the wave–structure problem of two vertically floating, coaxial cylinders connected by dashpots. Therefore, we use their results to verify our numerical method: the solution of the hydrodynamics of the interacted structure with no mooring or connections, obtained with AQWA, which applies the boundary elements method with a wave source Green’s function, followed by our source code FSA01, which loads the hydrodynamic coefficients and exciting loads from the output of AQWA, formulates and solves the dynamics equations of motion (EOM) with any moorings (structure to seabed) and links between the structures (like dashpots or springs) and process all the engineering results (like loads and motion, captured power, relative displacement to check functionality, and the evaluation of spectral results). We verify our model by setting and solving an example identical to Case E by [21]. For the reader’s convenience, the details of verifying our model by setting and solving an example identical to Case E by [21], together with explanations for optimization and technical functionality improvement, are presented in the Supplementary Materials. Figure 6 compares the captured power per unit wave amplitude squared, P a * , obtained in the present study with the corresponding Case E results reported by [21] (Figure 7). Figure 7 compares the heave RAOs with the Case E results reported by [21] (Figure 8). In both figures we observe excellent agreement with our results, as shown by the blue line.
In addition to the above agreement for regular waves, we also checked the Pierson–Moskowitz spectrum of wind speed, U =10 m/s, which presents an input power of 19.6 kW/m. The input power facing the WEC diameter of 19.776 m is 388 kW. The captured power obtained by [21] is 106 kW, while we obtained 107 kW.

5. Parameters for Performance Analysis

5.1. Design Case # 1—Optimization for the Israeli Coast

In the following section, we present a design study of a specified SWAN–WEC device, nominally designed to resonate under sea states with wave periods of approximately 6–8 s, which are predominant along the Israeli coast [27]. The 6 s wave period is identified as the most probable condition and is therefore selected as the nominal design point. A device with a radius of 15 m and a draft of 2 m is considered, resonating at this period. To account for higher sea state, the device was designed for optimal power capture at ~8 s wave period as well. This was achieved by incorporating a fixed ballast in the form of a concrete ring, 1 m in width and 6 m in height, located at a radial distance of 14 m over the upper three-quarters of the hull (Structure 2). The concrete mass was selected to match the hull displacement at a 2 m draft. This configuration maximized the mass moment of inertia and raised the VCG. The draft and mass moment of inertia were further adjusted by filling the outer chamber with sea water ballast until resonance at an 8 s period was achieved, thereby setting the internal chamber radii. The corresponding draft for 8 s is 6 m. As a result, the device is now capable of operating over a wave period range of 6–8 s through internal ballast control, meaning that for each possible draft, a corresponding ballast can be applied, enabling the device to resonate at different wave periods.
Table 2 lists the device’s principal dimensions (see with Figure 1).
Table 3 presents the design specifications for the two design states (6 and 8 s), considering the weight and mass moment of inertia of the steel structure and the ballast. The essential differences between the two states (6 and 8 s) are the device draft and mass moment of inertia. In all the simulations the water depth is 40 m.
Using ANSYS APDL we modeled the underwater diffracting elements of the hulls and ran simulations in ANSYS AQWA for a set of 32 monochromatic wave periods in the range of 3 to 35 s with 1 m amplitude. Loading the free-floating results from AQWA to our FSA, inserting inputs of the links (dampers) for the generation of the CLM, solving the linked EOM, the RAOs of the linked structures were obtained. The two-DOF Gimbal spherical fender is modeled using four spring links of stiffness 10 7   N / m between the moonpool of Structure 2 and the neck of Structure 1 at the four quadrant locations. Pre-tension (to stabilize the yaw instability) is introduced by reducing 300 tons from the mass of Structure #2 and adding the same amount of mass to Structure 1, resulting in a mass imbalance that applies a tension of 500 kN to each PTO element. As the submerged volume remained unchanged, the hydrodynamic coefficients were not affected. The power captured by the WEC is then calculated using point RAOS at the ends of the PTO elements.

5.2. Design Case # 2—A More Compact Form

Design Case #1 represents an optimization case in which the draft of Structure 2 is between 0.13 and 0.40 of its radii. Motivated by the work of [21], a more compact design is considered, in which the radius is equals to the draft. To simplify their parametric study, Xu et al. [21] constrained the device geometry so that the hull draft equals both its radius and the gap between the two hulls. Following performance optimization, Xu et al. [21] obtained the size parameter of the WEC to be q = 9.9   m in order for the WEC to resonate at ~7.9 s. We simulate our proposed SWAN–WEC design using the Froude similarity with the parameter size of 6.0 m in order for the WEC to resonate at ~6.0 s. This analysis addresses the question of whether this dimensional configuration yields better power output, with a reflection to smaller device trade-offs discussed in Section 1. As detailed in the Supplementary Materials, for the current configuration, the gap between the two hulls in [21] is insufficient to allow for complete axial motion of the dashpot. Therefore, we set up a larger clearance of 13 m. The device’s principal dimensions (in meters) and specifications important to its dynamic properties are listed in Table 2 and Table 3 respectively.
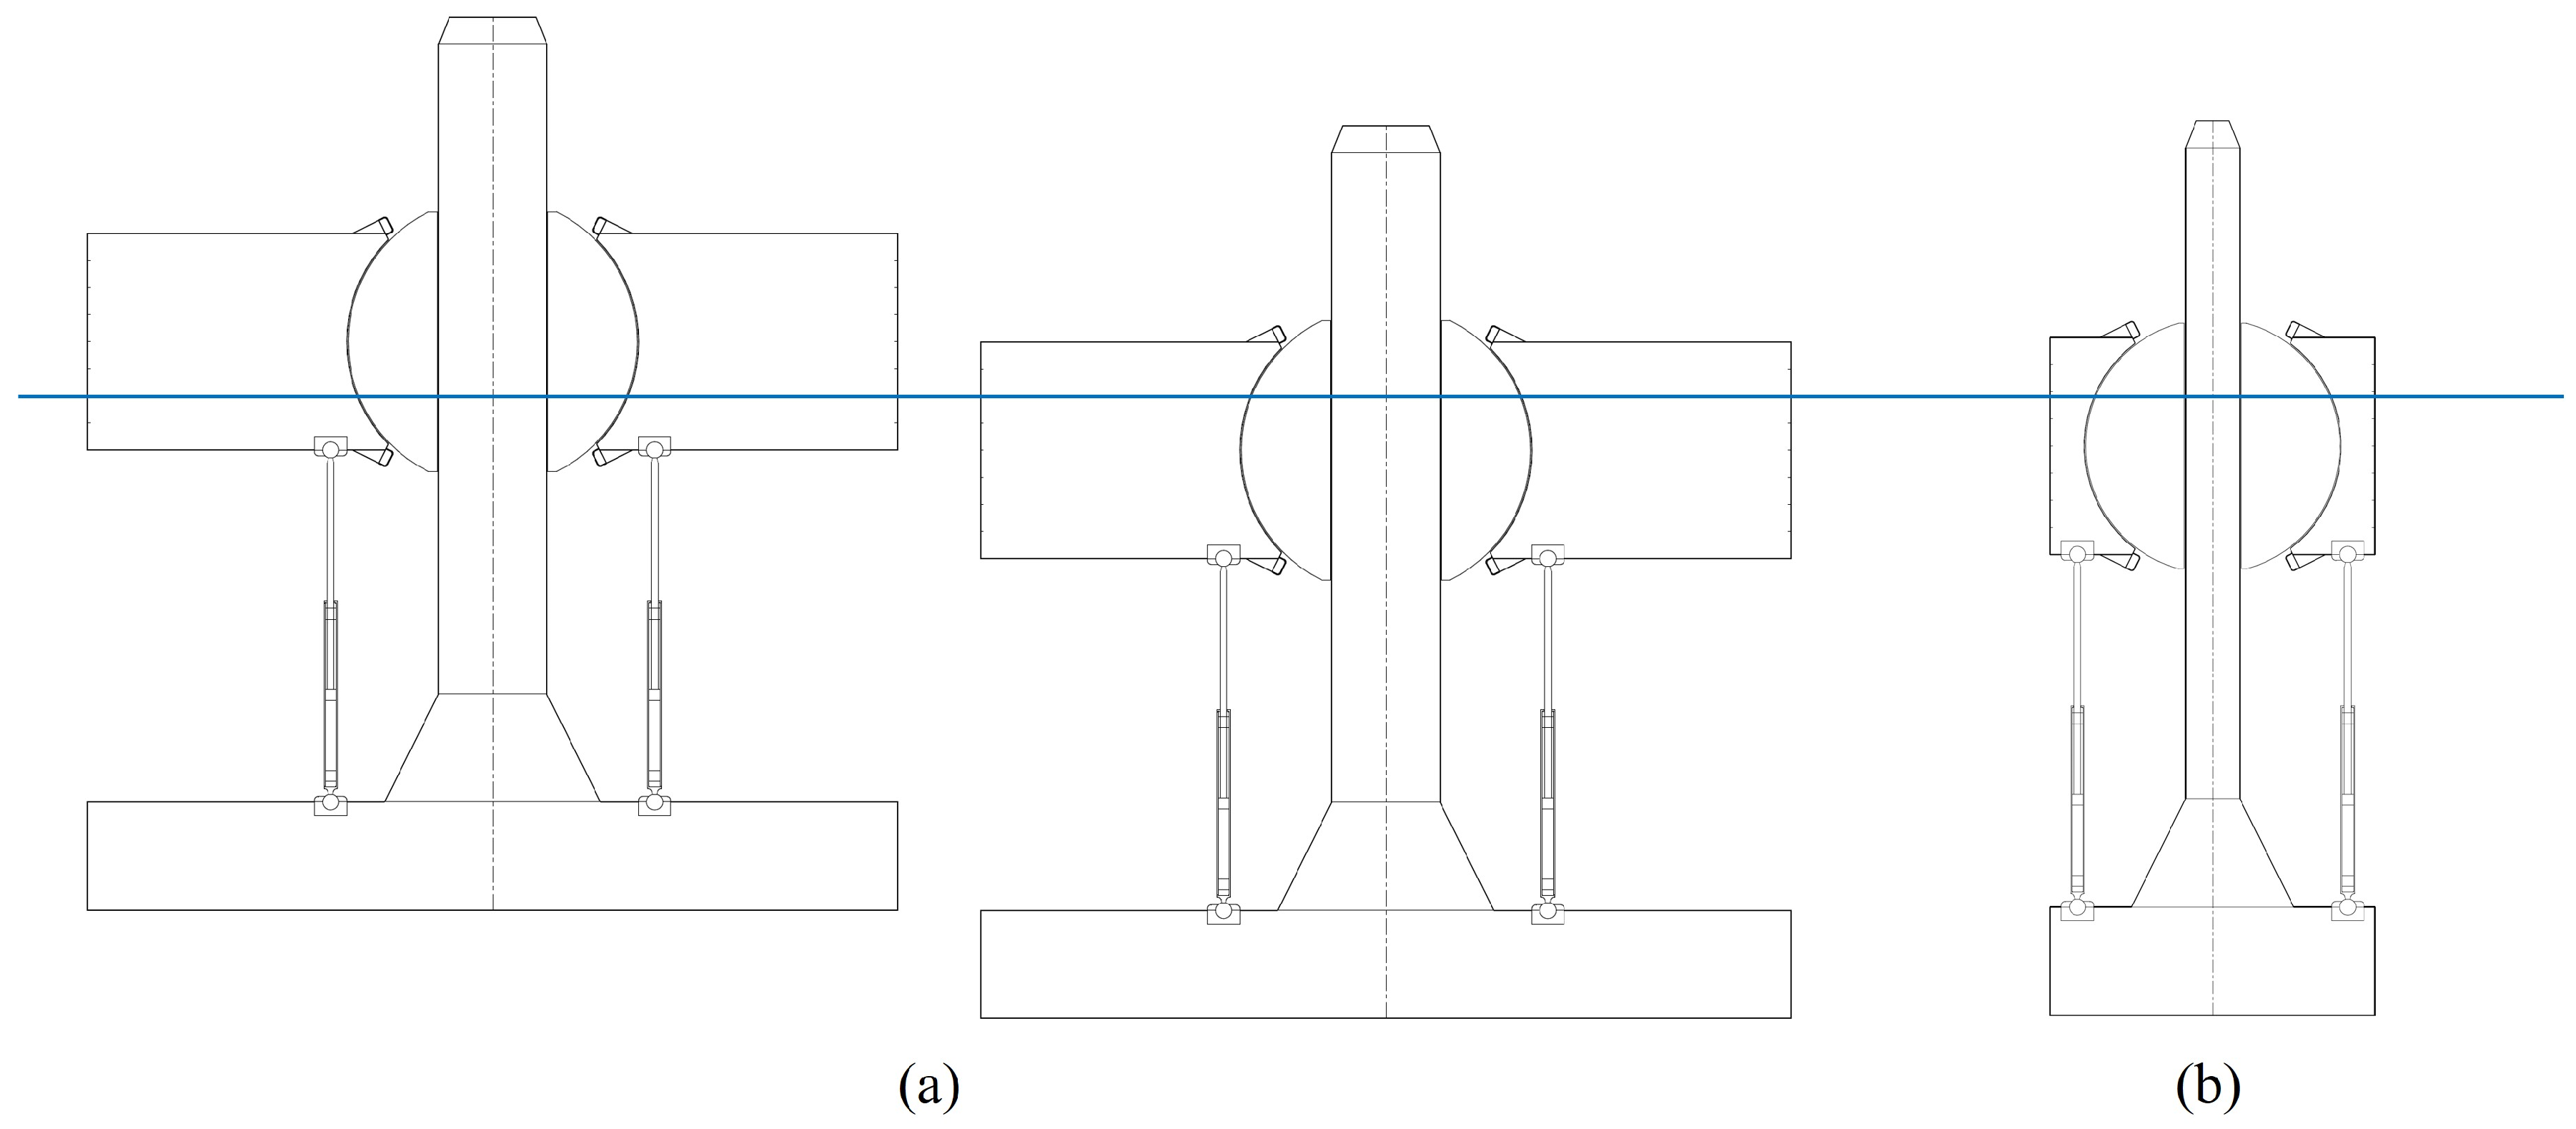
Moments of inertia and VCG of Structure 2 are treated as calibration parameters to practically tune the heave and roll resonance periods to 6 s. Figure 8 schematically presents the device for the three cases, in scale, clearly illustrating the differences among them.
Following the evaluation of device performance under monochromatic wave conditions, the performance of the WEC is examined under two representations of irregular wave conditions: the Joint North Sea Wave Project (JONSWAP) spectrum with the spectrum broadness parameter of γ = 2.8 , which well represents the sea states at the East Mediterranean, and the Pierson–Moskowitz spectrum (PM), a relatively wide spectrum, typical for fully developed sea for a given wind speed. We applied the formulation by the wavenumber, as detailed in [21].
The response amplitude vector obtained from the monochromatic wave analysis for each wave period is used to construct wave spectra based on the JO and PM formulations (with wind speed of 10 m/s), which correspond to relatively narrow- and wide-banded sea states, respectively. Table 4 summarizes the wave conditions (significant wave heights H m 0 and total incident power per device width) for the two design cases, for monochromatic waves and spectra. It should be noted that the power associated with the spectral sea states is approximately 20% and 60% that of the monochromatic waves with a 1 m amplitude, for wave periods of 6 s and 8 s, respectively.
For all the spectral sea states, the peak periods are as that of the monochromatic state. For the Pierson–Moskowitz spectrum we determine the wind speed U by the peak period, and the same U determines H m 0 . For the JONSWAP spectrum H m 0 is determined by the correlation:
T p = 5.45 H m 0  

5.3. Survival State for Design Case #1

In addition to the performance analysis, an assessment of the WEC behavior under extreme conditions is essential. Figure 2 presents the survival state for Design Case #1. Structures 1 and 2 are ballasted to drafts of 28 m and 14 m respectively, where the deck of Structure 2 is submerged 6 m below the water surface. The PTO elements are compressed to the minimum length of 10 m and locked. The purpose of submerging the device is to reduce its motion under extreme conditions, thereby lowering the loads acting on the PTO components and preventing collisions between Structures 1 and 2, which could lead to impact damage. Accordingly, reduced RAOs should be achieved. To demonstrate the seaworthiness of the SWAN–WEC at the survival state, we analyze its hydrodynamics, applying AQWA and FSA.
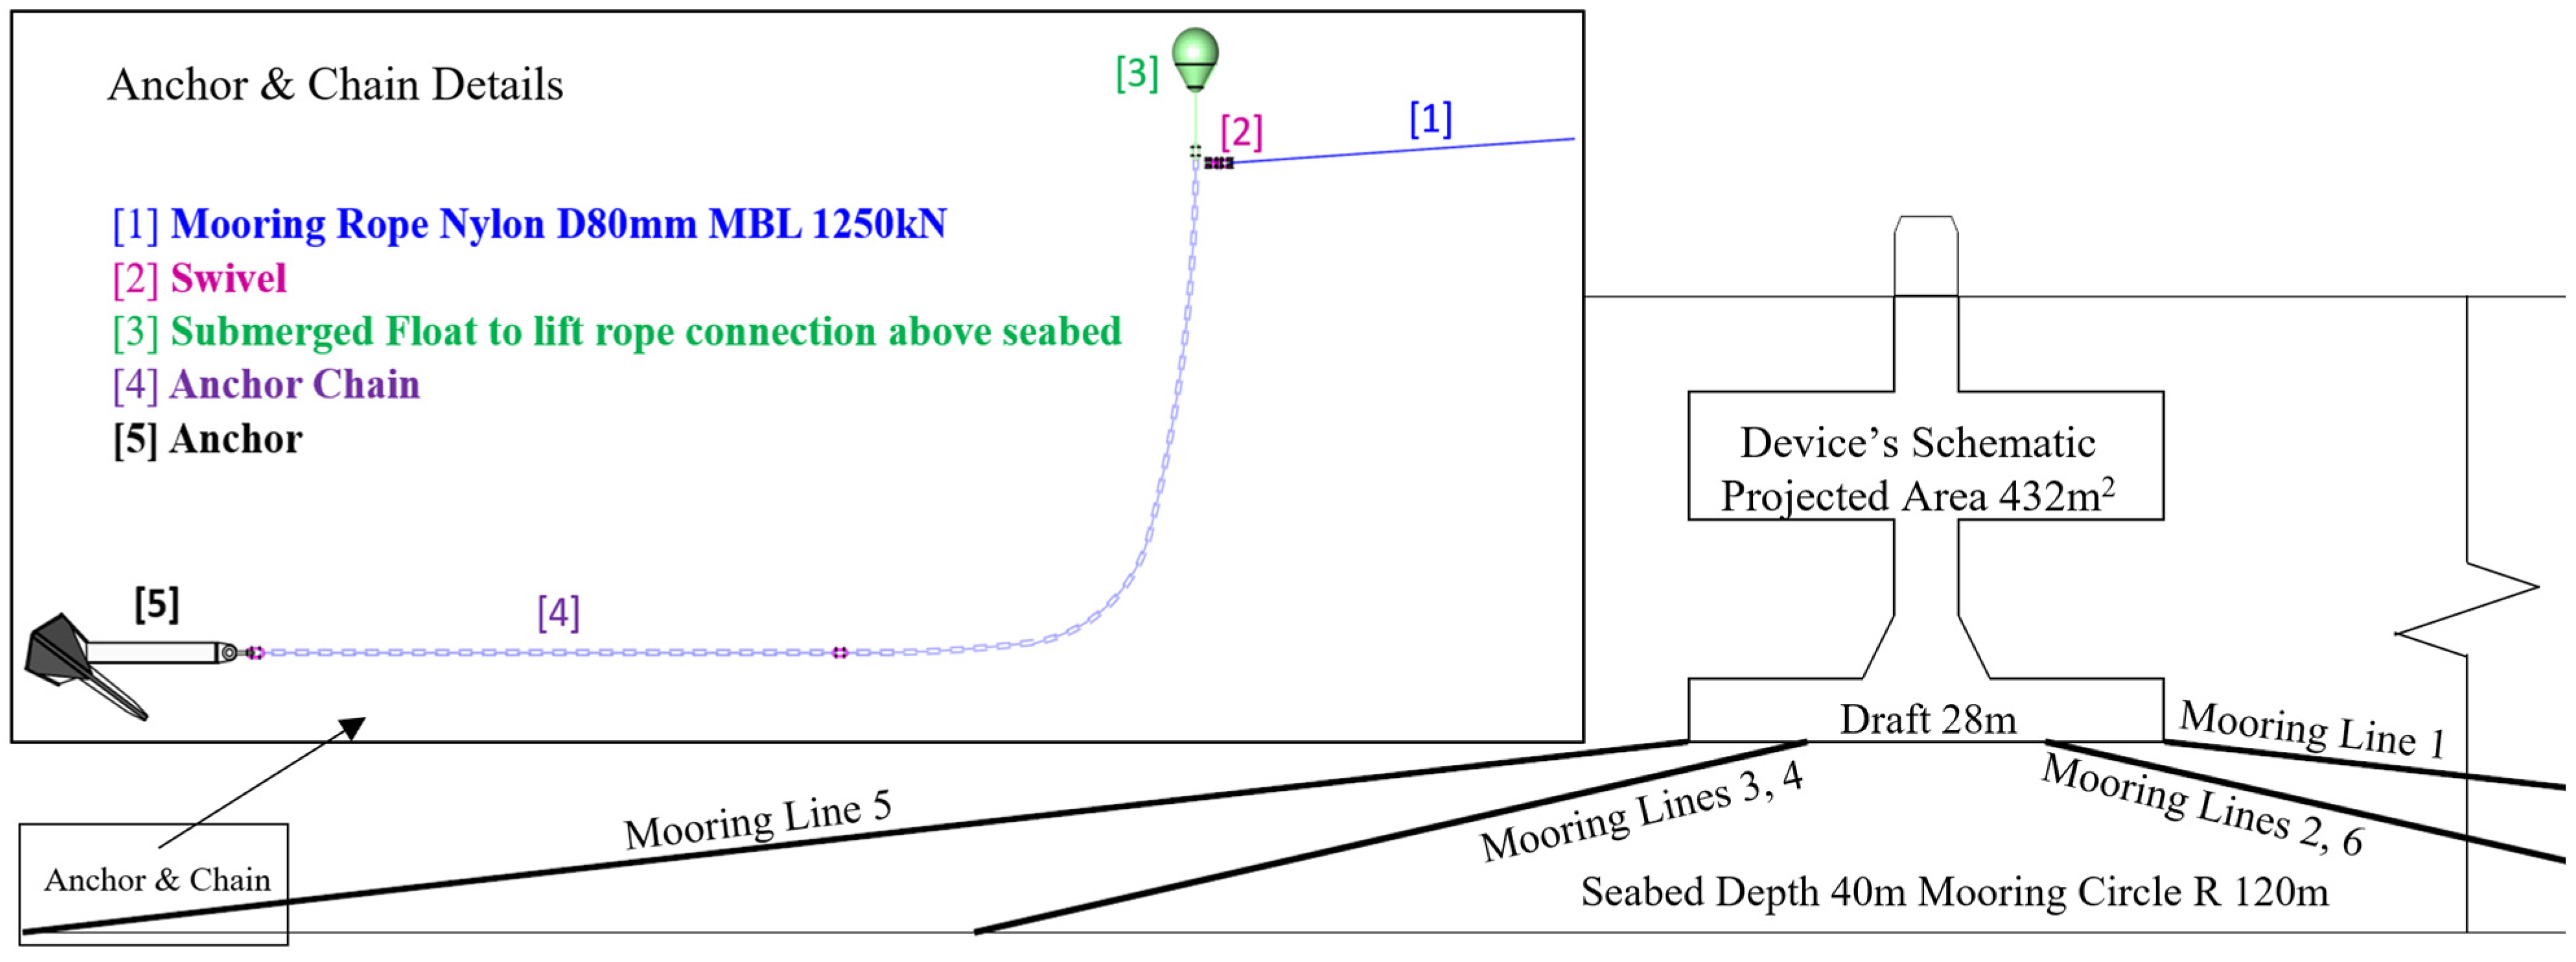
A critical aspect of survivance is the design of safe mooring system. We consider six mooring lines anchored to the seabed at a radial distance of 120 m. Table 5 specifies the relevant parameters for the analysis of a mooring system under extreme conditions. Figure 9 presents the mooring layout and the method for practical anchoring.
For the survival state analysis, we consider an extreme storm of significant wave height of 8 m (about 200 years return period at the design site, which is very high for such an installation that is not occupied and presents no risk of sea pollution). We use the preliminary design method of extreme maximum wave height with the period of the peak of the spectrum. A high peak period of 16 s is assumed. A very conservative ratio of the maximum wave height, equaling twice the significant wave height, is assumed.
The solution approach follows the same methodology as before: the hydrodynamic coefficients of the freely floating bodies are computed using ANSYS AQWA, and the mooring and PTO links are incorporated within the FSA framework. Consequently, the analysis captures the wave frequency dynamic response of the moored WEC.

6. Results and Discussion

6.1. Operetiopnal States

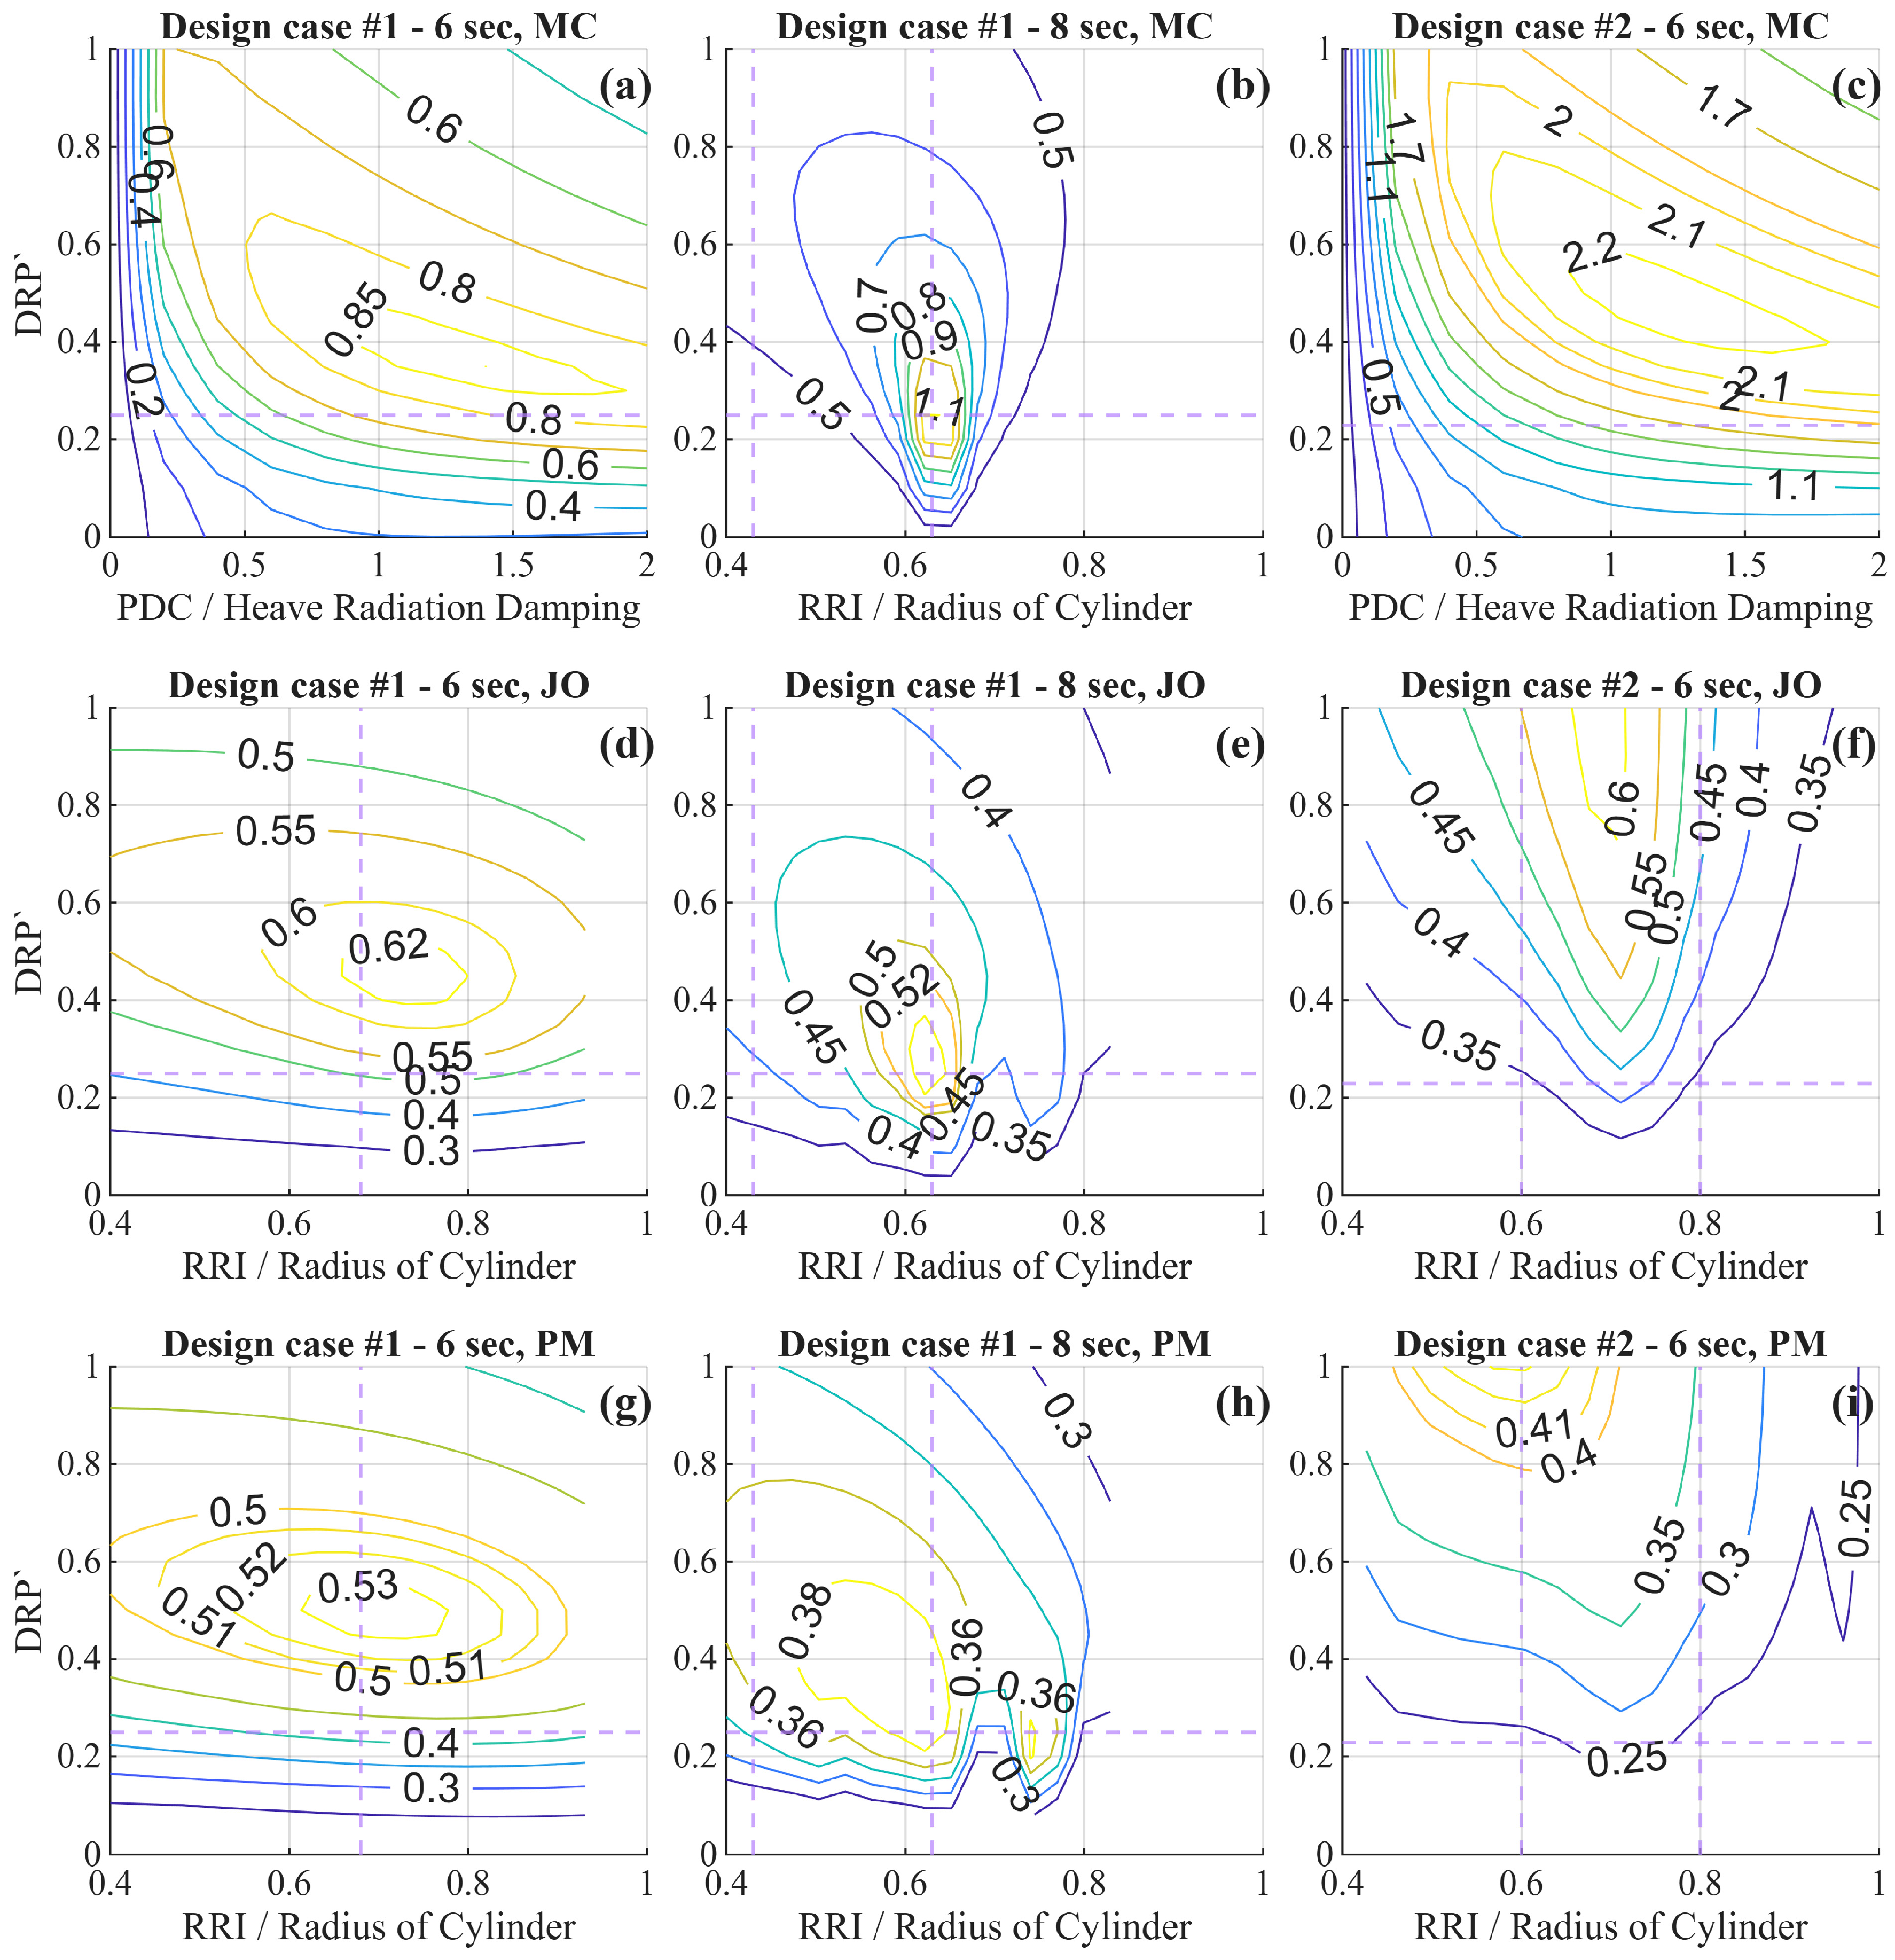
The maximum CWR obtained for the WEC in Design Case #1 at monochromatic waves of 6 s, is 0.86. This occurs at a total PDC of 1.2 times the heave radiation damping ( 2.7 × 10 3 kNs/m) and at a DRP of 9.0 m. As this case represents the nominal design point for the WEC, we set the WEC damping accordingly. The CWR of 1.15 is obtained for the WEC at monochromatic waves of period 8 s and DRP of 6.7 m.
For Design Case #2, a CWR of 2.2 was achieved at monochromatic waves of 6 s. This outcome is remarkable, corresponding to a power capture nearly matching that of Design Case #1, despite being more than twice the size. However, such a sharp resonance will be smoothed at real sea states.
Figure 10 presents the contours of the CWR for Design Cases #1 and #2 under both monochromatic waves and real sea spectra. For monochromatic waves the contours represent efficiency as a function of the ratio between the total PDC and the heave radiation damping, as well as the relative distribution radius of PTO elements, with respect to the radius of the device (DRP). For the 8 s case, since the WEC damping coefficient was already set as that of 6 s, we scanned the roll radius of inertia (RRI) instead. For a wide-banded spectrum such as Pierson–Moskowitz, it is not obvious that the natural periods of heave and roll should be equal; therefore, for spectra, we evaluate efficiency across both the relative PTO elements position (DRP’) and the RRI. In all the contours maps, a gray horizontal dashed line marks the minimum possible DRP, which is constrained by the moonpool radius. Vertical dashed lines mark the limit of the possible relative RRI, which are bound by the dimensions and displacement of Structure 2. Table 6 summarizes the maximum potential CWR and power extraction for both design cases under monochromatic waves and wave spectra. As expected, high CWR values are obtained at monochromatic waves at the natural periods, whereas a noticeable reduction is observed for spectral sea states, particularly for the broader Pierson–Moskowitz spectrum. This reduction arises because the WEC is tuned to a specific resonance period, whereas wave spectra distribute the energy over a range of frequencies. This observed degradation may be mitigated through the implementation of an appropriate dynamic PTO control strategy, either based on phase control [35], an adaptive damping PTO system [31], or a mechanical control strategy that dynamically adjusts parameters such as the DRP or RRI over short time scales. Such adaptive control approaches could be used to broaden the resonance bandwidth and enhance device performance under varying sea states. These control strategies will be further analyzed and optimized in future research. Design Case #2 exhibits a clearly higher CWR under monochromatic wave conditions. However, under spectral wave conditions, the CWRs are similar to those obtained for Design Case #1, resulting in lower extracted power due to its lower width. Consequently, no performance advantage is retained. A key advantage of Design Case #1 is its ability to be tuned to operate over a range of wave periods, whereas for Design Case #2 this capability of tuning by internal ballast adjustment is more limited by its geometry.
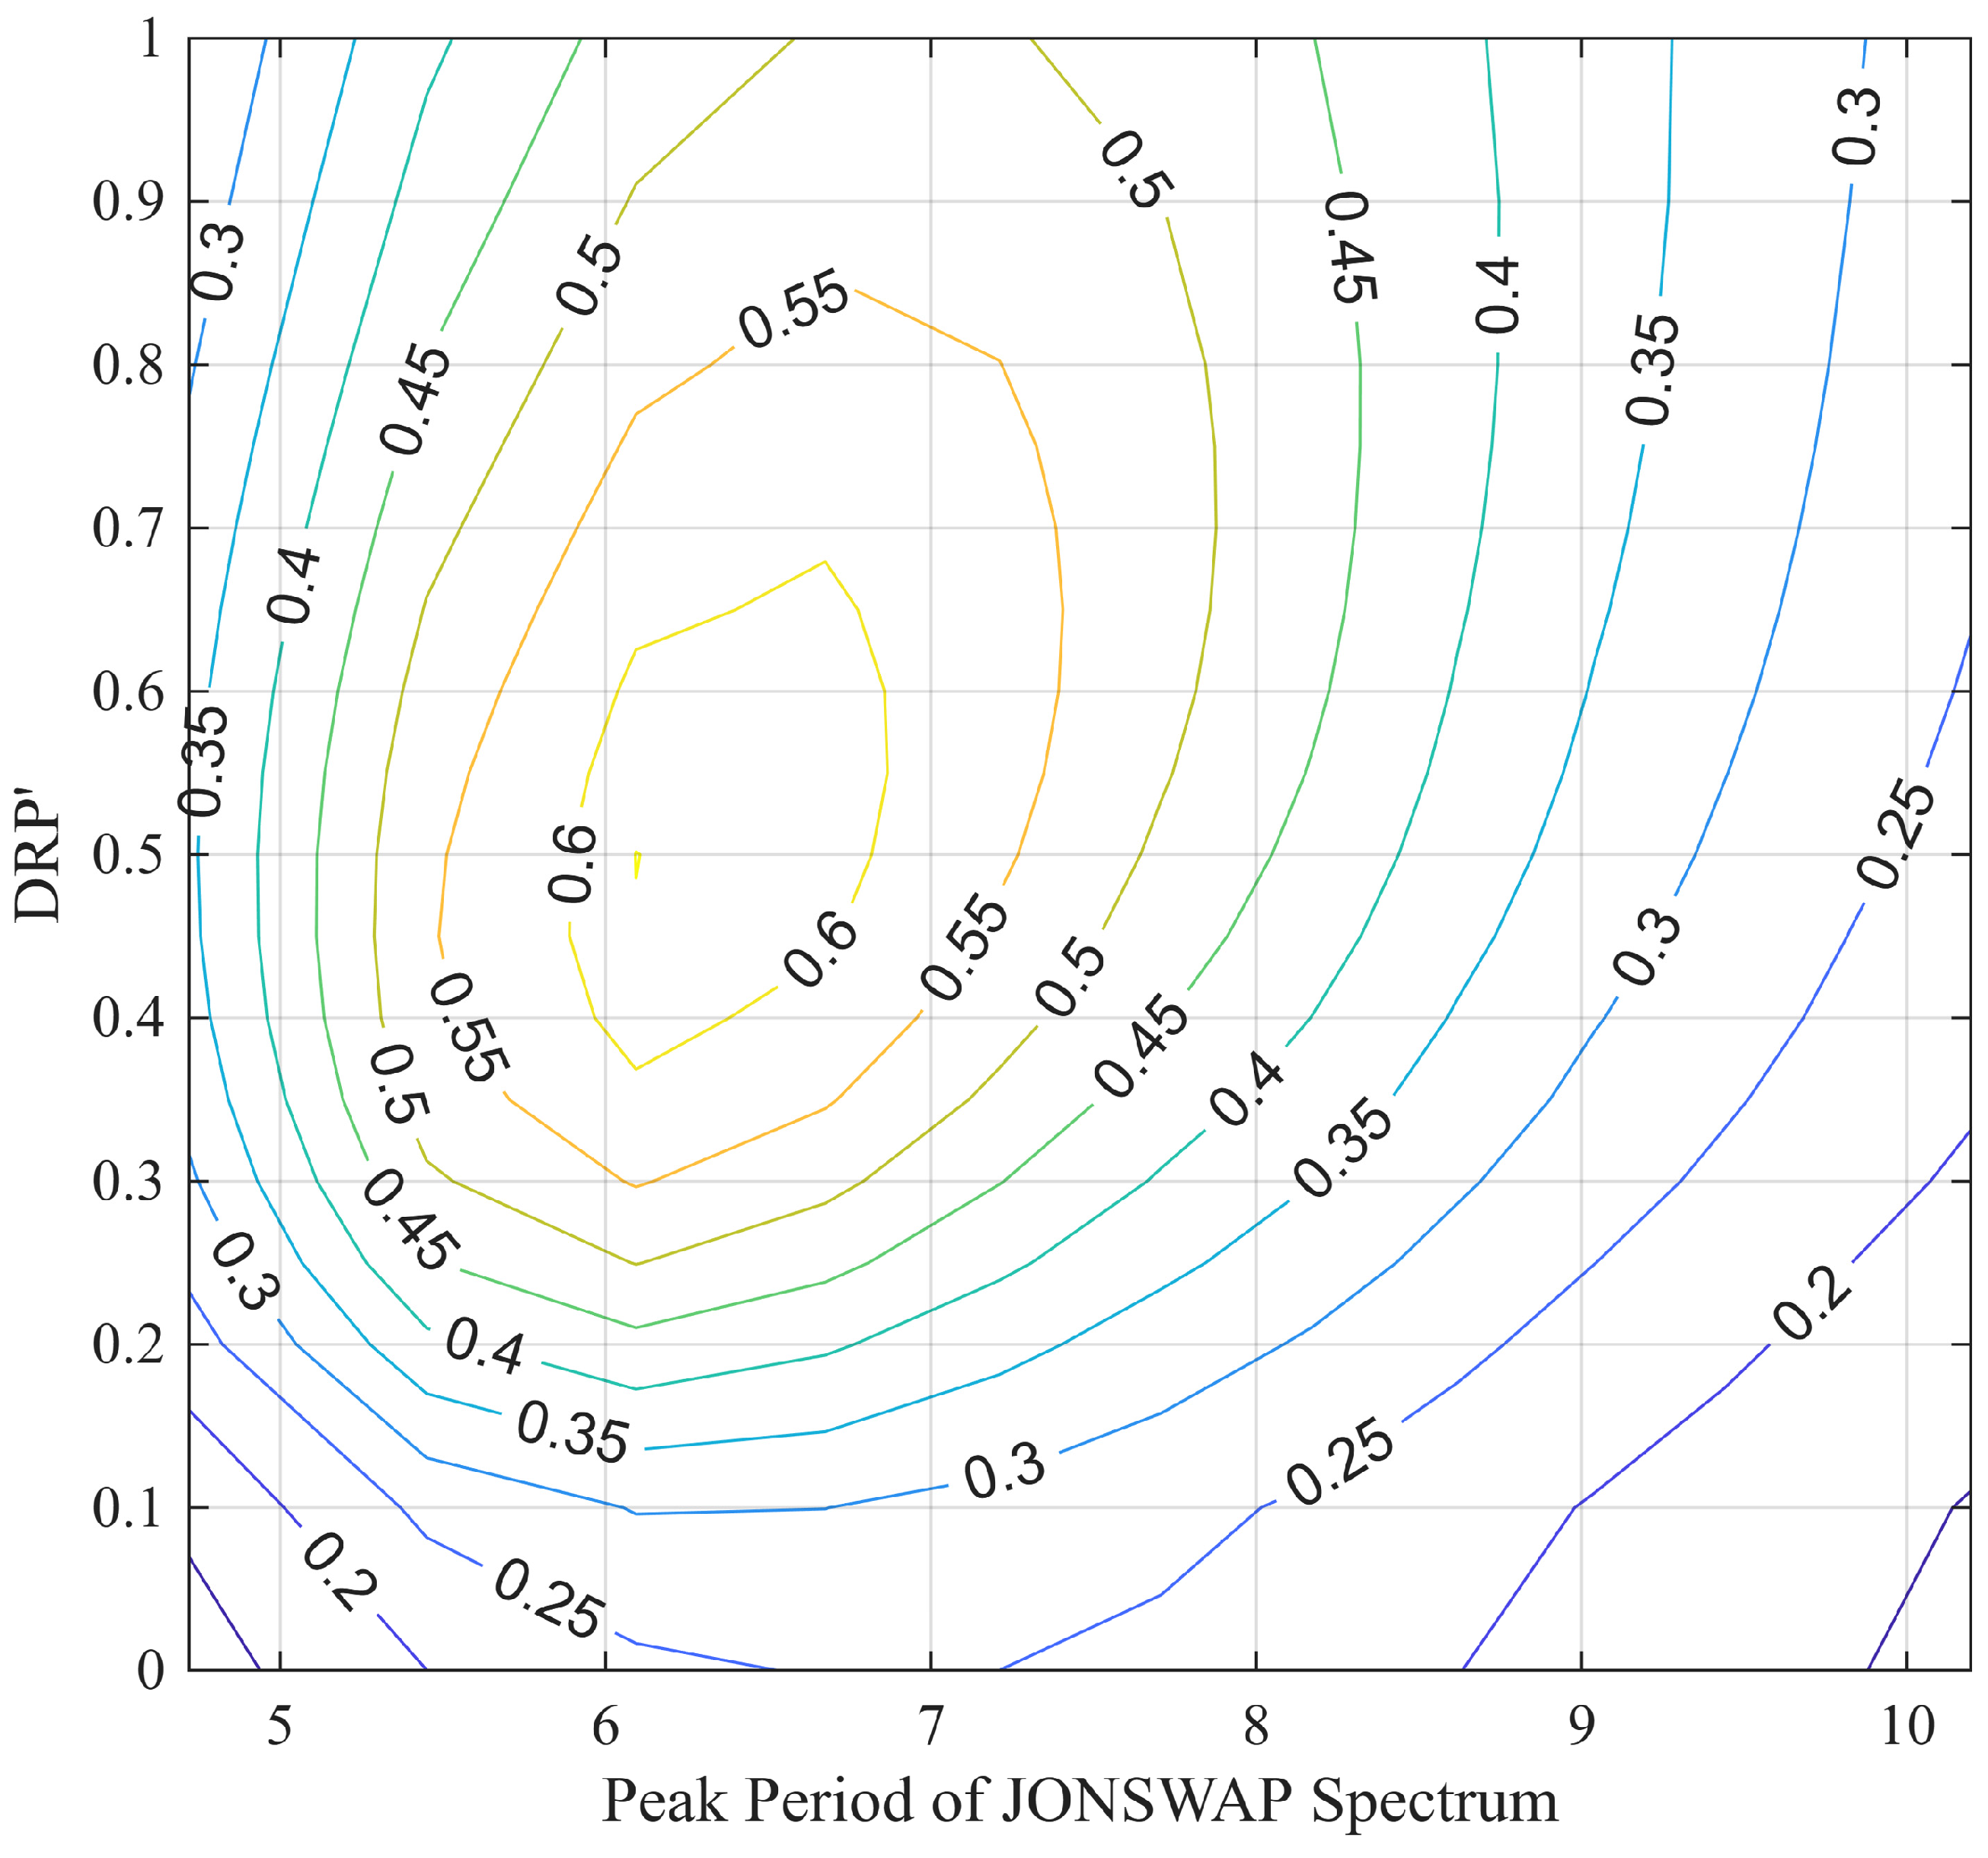
To demonstrate the effect of tuning the distribution radius of the PTO elements (DRP) on the WEC performance, Figure 11 presents the CWR map for Design Case #1 with a 2 m draft at JONSWAP spectrum sea states as a function of the relative distribution radius and peak period. The results indicate that the CWR can be maximized solely by adjusting the DRP, reaching 0.48 for peak period of 8 s and 0.37 for peak period of 9 s. It should be noted that the present results are based on a linear potential flow model and therefore do not account for nonlinear and viscous effects, such as higher-order wave–wave and wave–structure interactions, drag, vortex shedding, and flow separation. These effects may become significant near strong resonance conditions and could reduce the actual response and power absorption compared to the values predicted here. Accordingly, the reported performance should be regarded as a preliminary first-order estimate to be refined in future research through time domain analysis and wave flume experiments.

6.2. Survival State

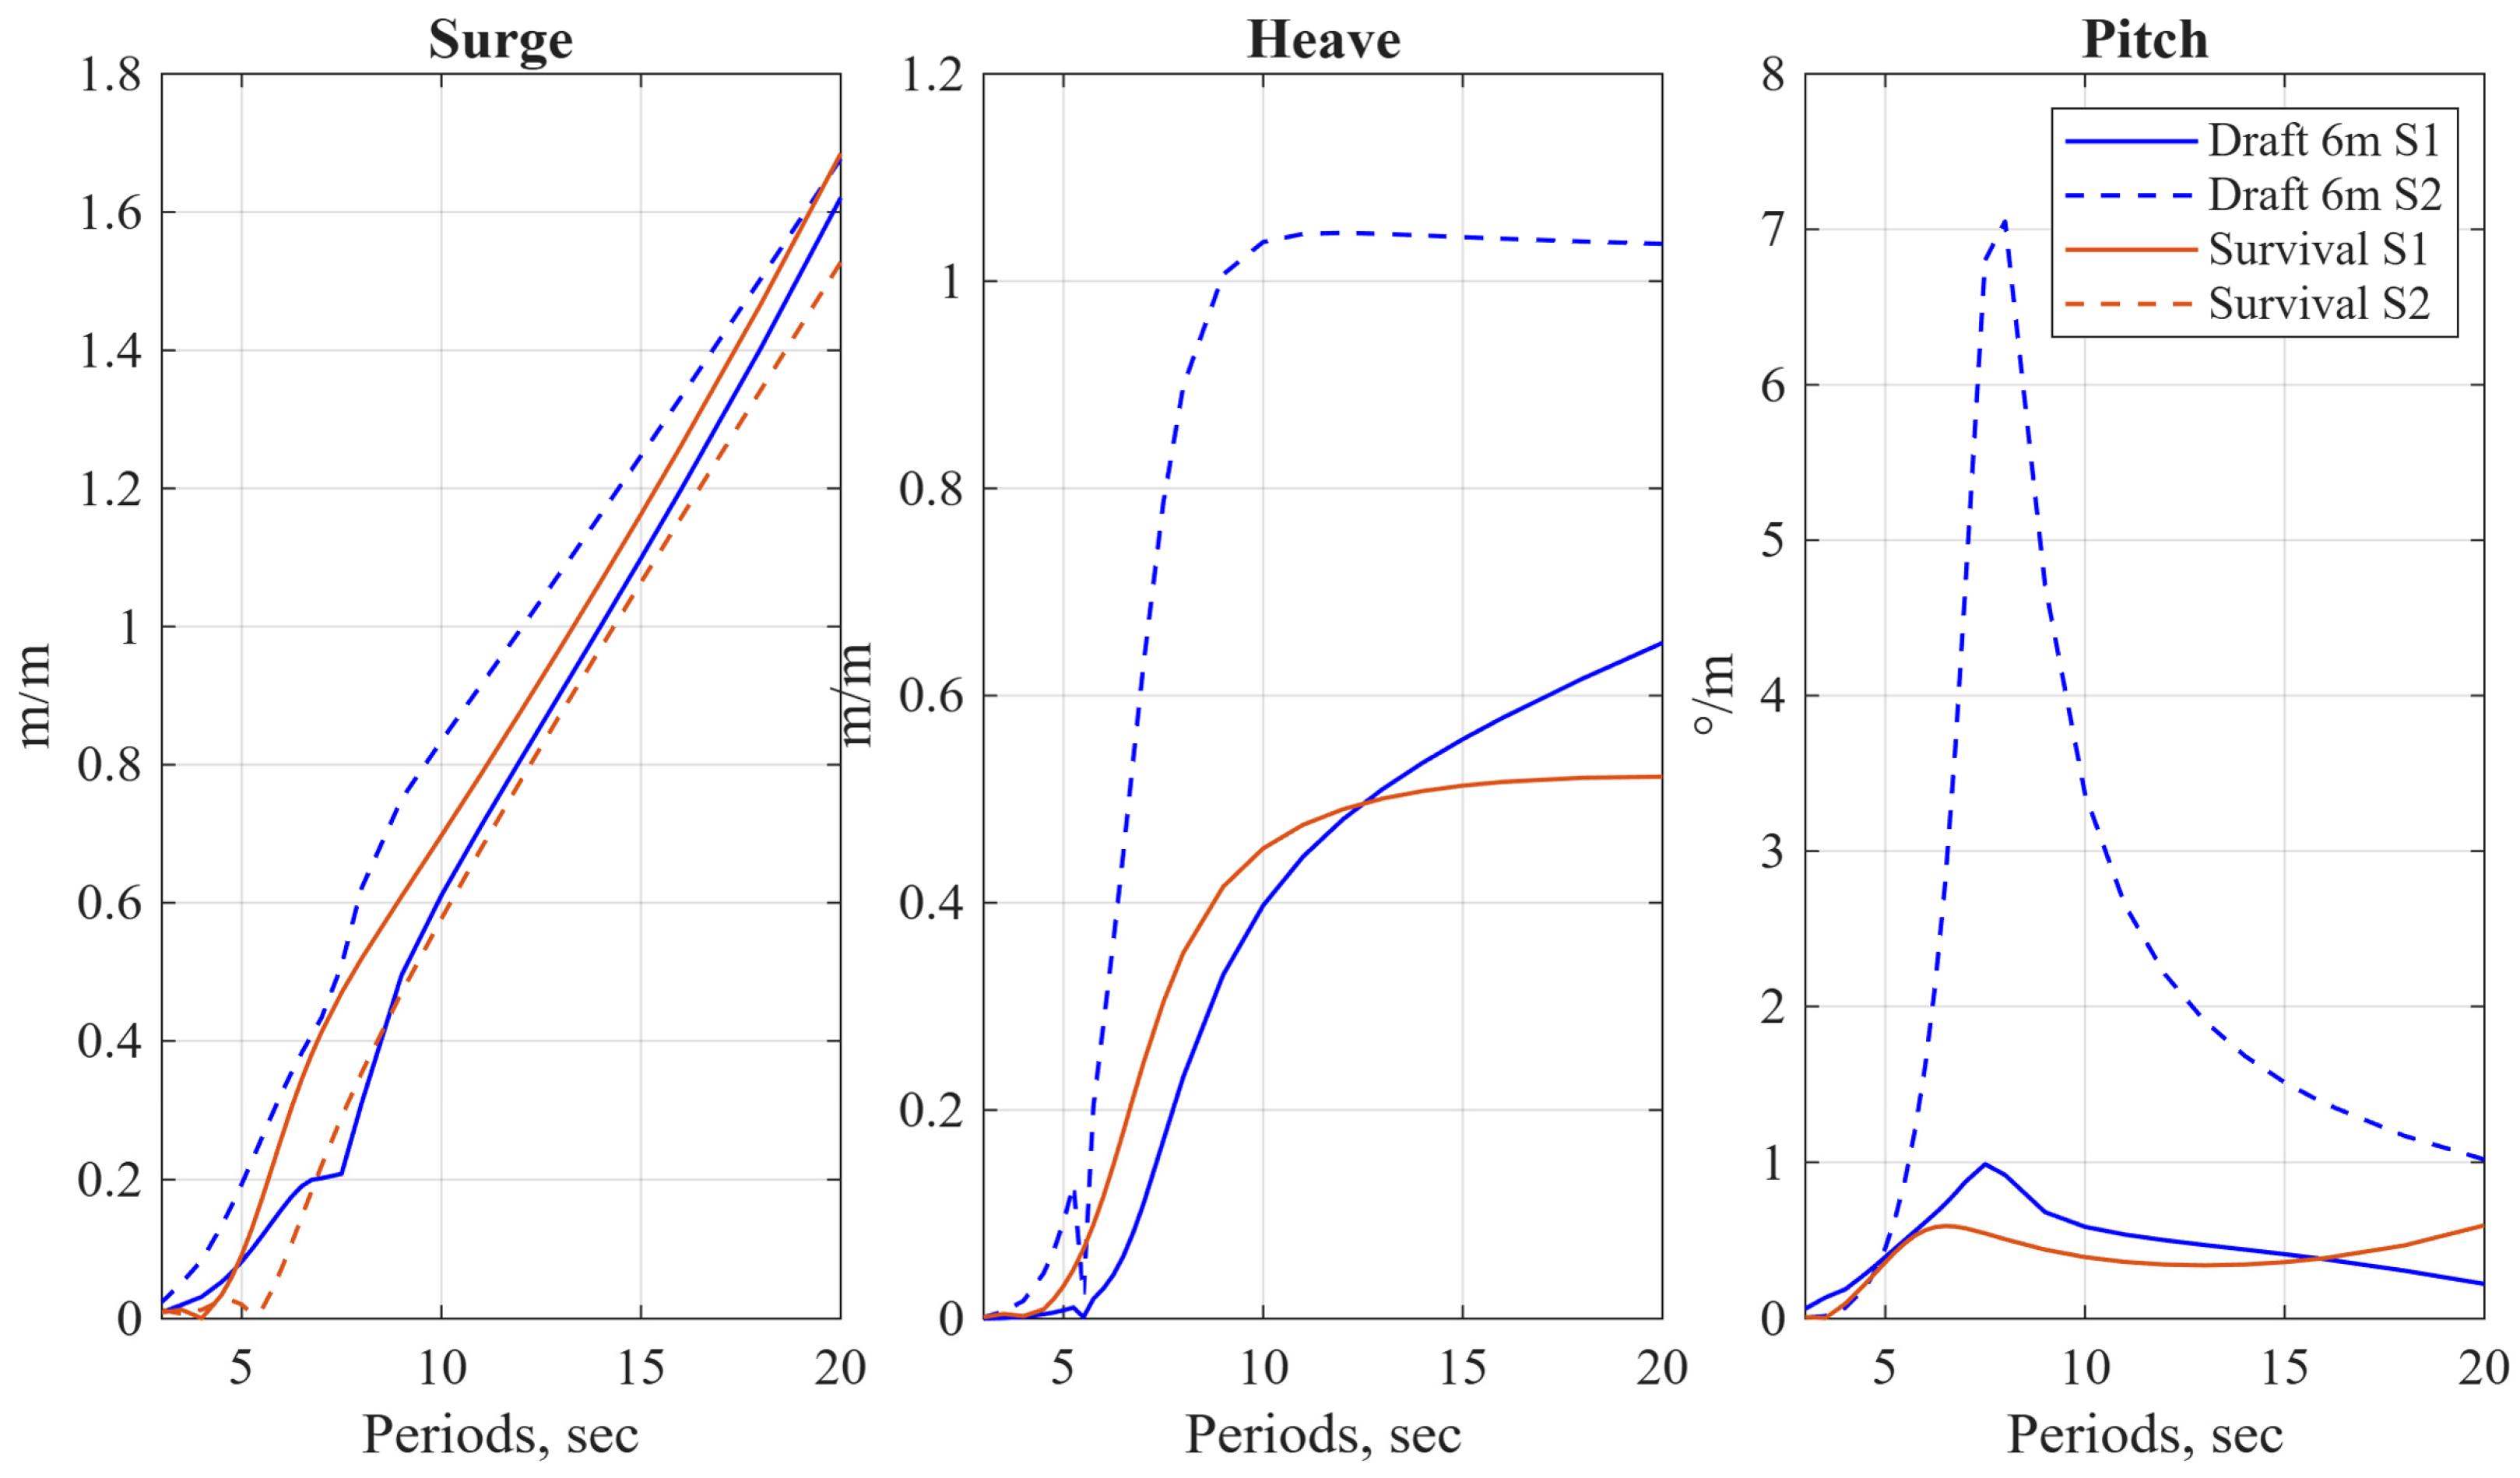
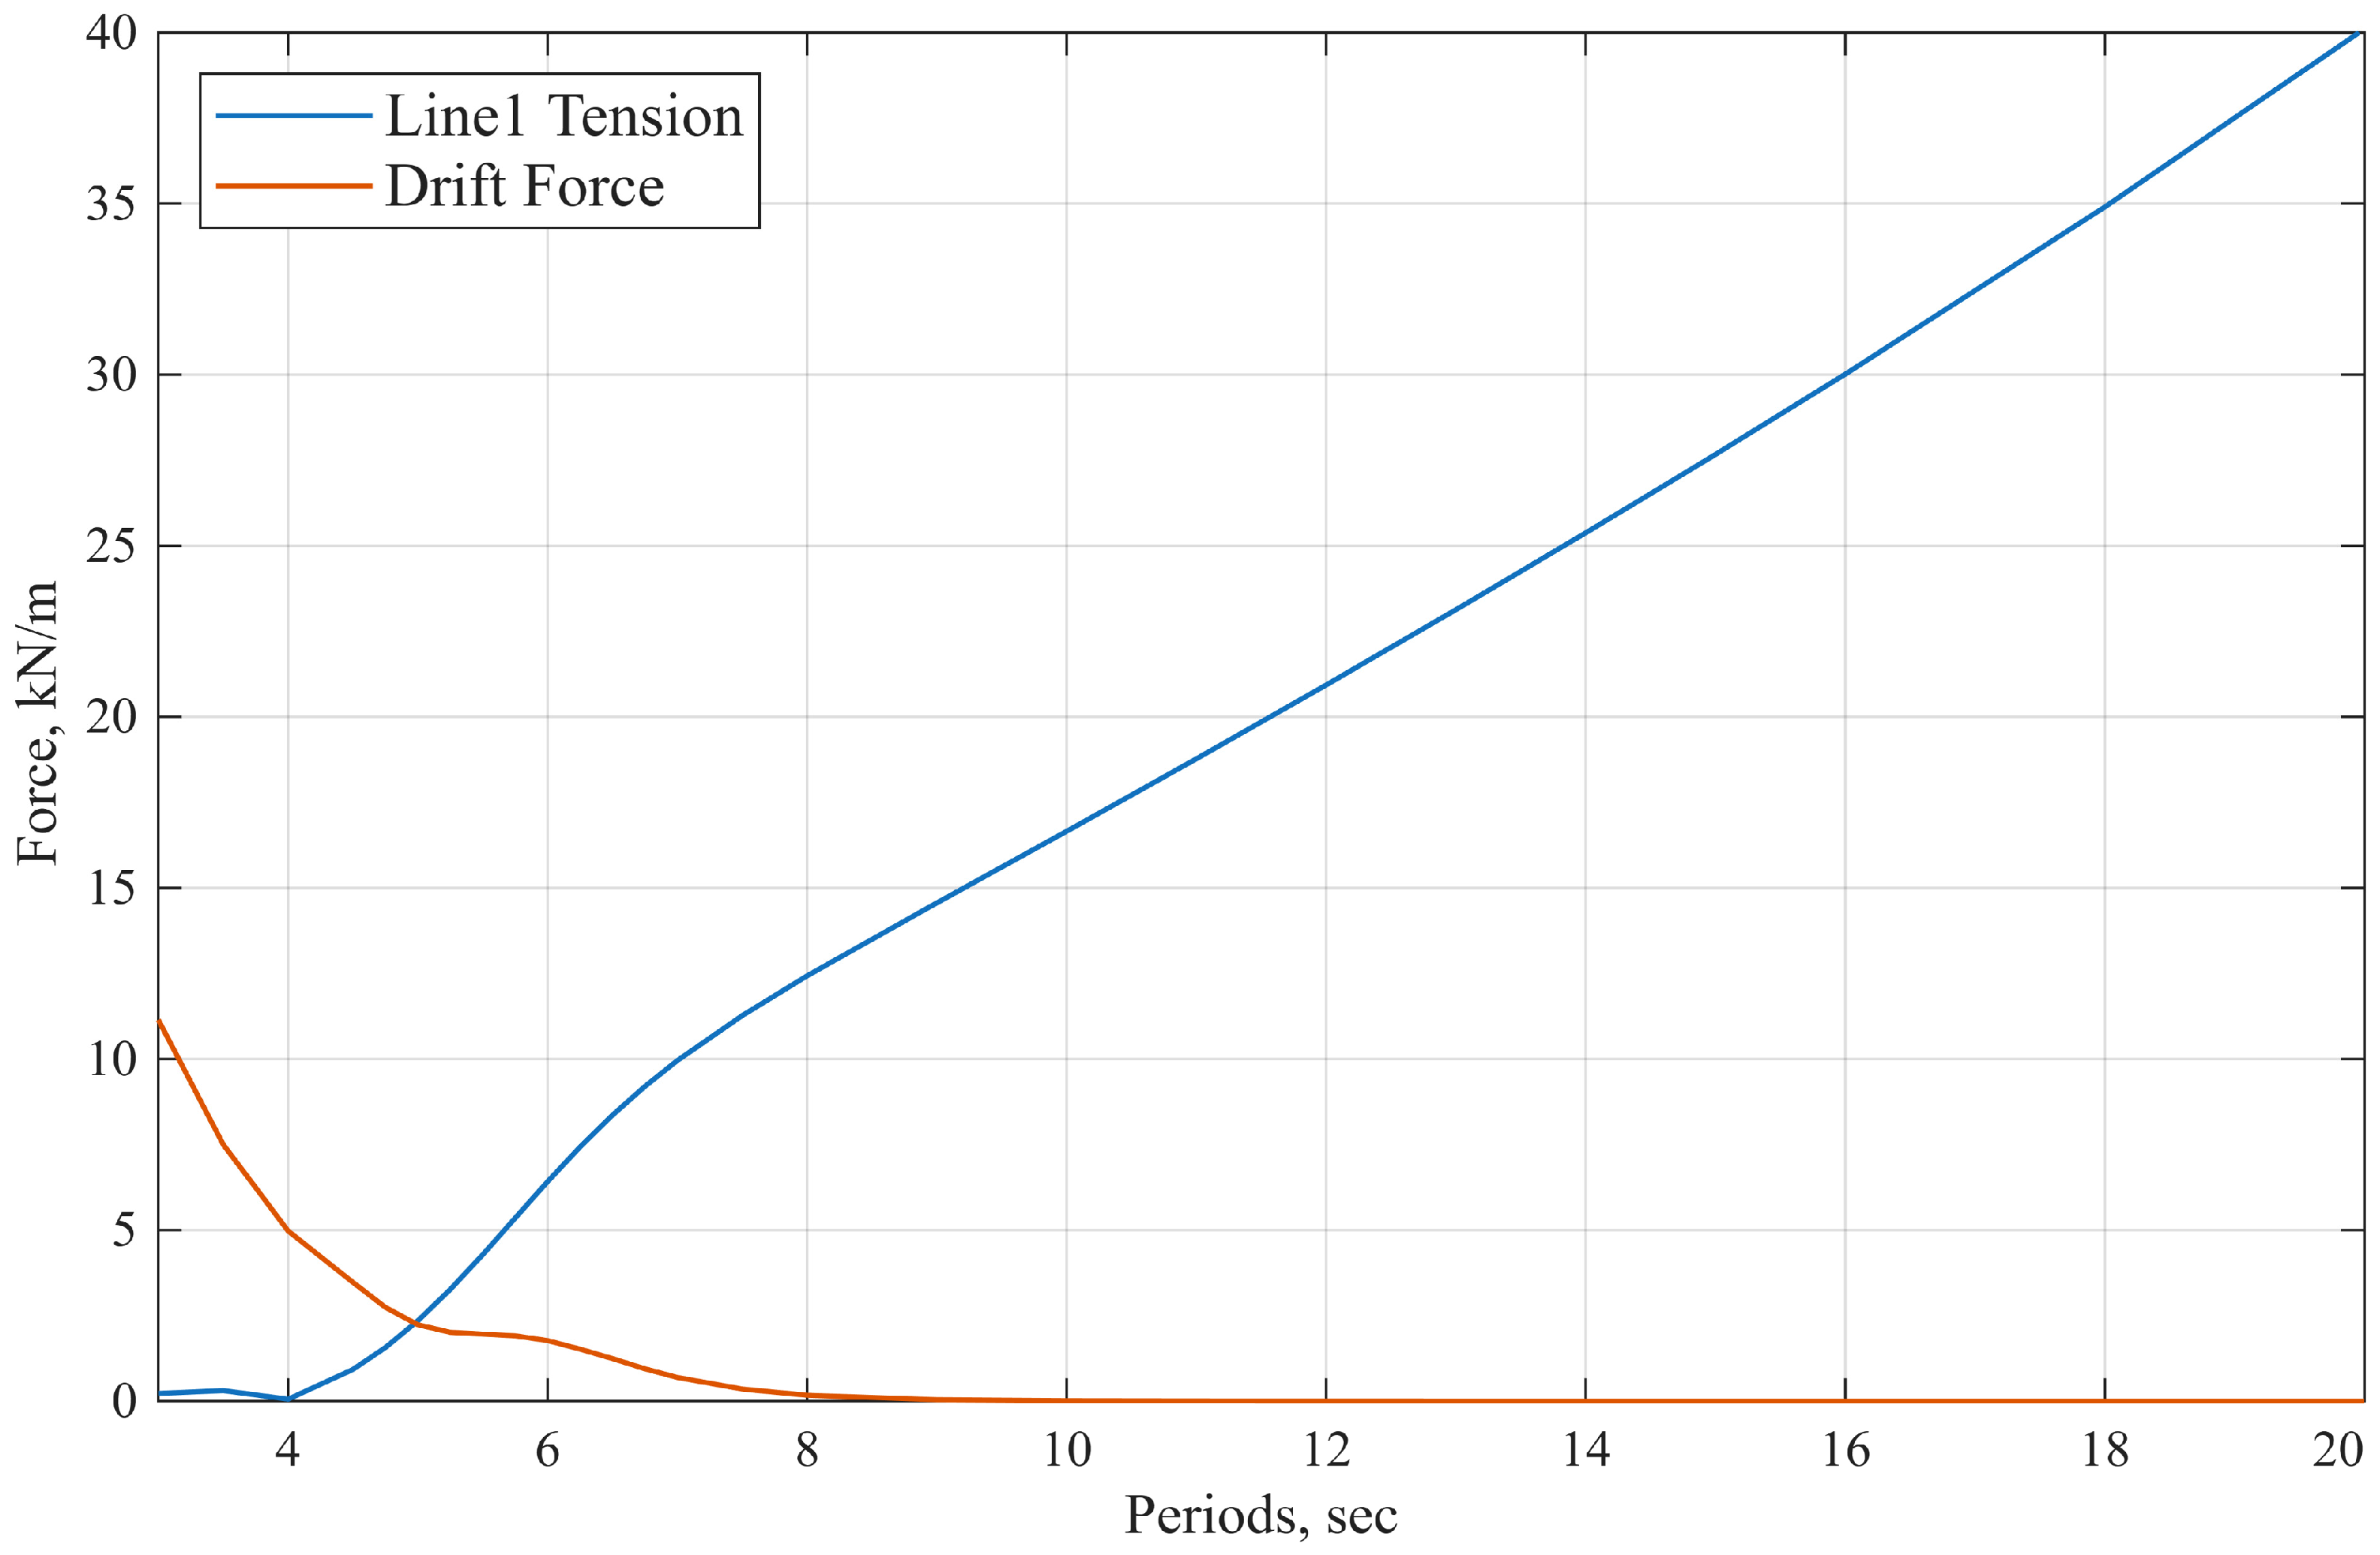
Figure 12 compares the RAOs between the operational state of draft of 6 m and the survival state. The surge RAOs are similar, as may be expected for a practical compliant mooring. The heave RAOs are reduced to about half, while the pitch RAOs are dramatically reduced by an order of magnitude. It should be noted that the vertical RAOs of Structures 1 and 2 are identical under survival state conditions, as the PTO elements are locked. Figure 13 presents the first-order wave loads of the most loaded mooring line, and the total second-order wave drift loads applied to the structure. The drift force at the peak period of 16 s is negligible, as second-order quadratic properties are proportional to the square of the wave steepness. Conservatively, we take the drift force at 6 s as 1.77   k N , which for a wave height of 16 m (amplitude 8 m) is multiplied by 8 2 and equals F d   =   113   k N .
We assume a high current of 1 knots ( V   =   0.514   m s ). When submerged to a draft of 28 m, the projected area of the device is A   = 432   m 2 . Assuming a high drag coefficient for a cylinder, C d r = 1.2 , the current load is: F c   = 1 2 C d r ρ w V 2 A =   70   k N . The total load is F w   +   F d   +   F c   =   423   k N , and the usage factor for an 80 mm diameter nylon rope with an MBL of 1250 kN is 0.34, corresponding to a safety factor of approximately 3. The results demonstrate that a simple compliant mooring system is capable of safely maintaining the WEC in position under extreme design conditions.

7. Conclusions

  • This paper presented the concept and working principles of a novel, seabed-independent, point absorber WEC. The proposed WEC transforms wave energy into mechanical power by simultaneous motion in two degrees of freedom, heave and roll, thereby enabling an ideal theoretical efficiency of approaching unity, and possibly even more, due to wave diffraction.
  • The proposed WEC consists of two coaxial cylinders: an upper, active and fast-responding cylinder with a large waterplane area relative to its mass, tuned to resonate in heave and roll at wave periods in the order of the peak periods of the probable spectra at the design site; and a lower, slow cylinder composed of a narrow neck with a small waterplane area, resonating at much longer periods (above 30 s). We named our concept SWAN–WEC, meaning Small Waterplane Area Neck WEC.
  • Wave power is extracted through the relative motion between the two bodies, which are coupled via hydraulic cylinders or linear generators, which we term PTO elements. By introducing a neck in the lower cylinder, which passes through a moonpool in the upper cylinder, along with a dedicated floating fender between, we improved the kinematics, prevented excessive loads in the PTO links, and stabilized the surge and sway relative motion. The instability in yaw was solved by hydrostatic pre-tensioning of the PTO links.
  • The SWAN–WEC design also suggests a survival mode by lowering the upper hull below the water, with only the neck above water, to reduce the RAOs while keeping hydrostatic stability.
  • A preliminary performance analysis of the SWAN–WEC in terms of the CWR was conducted through a design case representative of the East Mediterranean. For both heave and roll, the resonance periods were tuned to align with the predominant periods in the study area (6–8 s). This was achieved by sizing the WEC to specific dimensions (of 15 m radius) and proper ballasting the active structure. The CWR contours were obtained for the combined power absorption by two DOFs, while investigating the influence of the distribution radius of the PTO elements and the total PTO damping coefficient to identify the optimal solution. In light of cost-effective trade-offs, additional more compact WEC design (of 6 m radius) resonating at a period of 6 s only was considered.
  • For both designs, we examined three representations of the sea state: MC—monochromatic waves (regular sea); JO—JONSWAP spectrum (real sea); and PM—Pierson–Moskowitz spectrum (real sea), a relatively wide spectrum.
  • The favorable performance obtained for the compact design under monochromatic wave conditions highlights the advantages of a more compact WEC design, as it can absorb wave power approaching from out of its width due to diffraction effects. However, at irregular wave conditions, the advantage of the smaller WEC design disappears, as its sharp resonance is smoothed.
  • For the first design case, which is capable of power production over a range of wave periods, CWRs of about 0.4 and 0.6 were achieved at irregular sea states of broad (PM) and relatively narrow (JO) spectra respectively.
To expand the resonance bandwidth of the device, adaptive control strategies capable of modifying either the PTO characteristics or hydrodynamic parameters, such as the DRP and RRI, over short time scales may be considered to enhance WEC performance under irregular wave conditions. Further optimization of these control processes is expected to lead to improved overall performance.
  • It should be noted that, although monochromatic wave conditions are not representative of real sea states, the resulting device performance remains important for the analysis of irregular waves, since the device is nominally designed to produce maximum power at the peak of the wave spectrum.
  • In addition to the performance analysis, the response of the WEC under survival state conditions was also investigated. When submerged, the device exhibits sufficiently small motion amplitudes, thus meeting the objective of the survival mode. It was further presented that a compliant mooring system using an 80 mm diameter nylon rope with an MBL of 1250 kN can safely withstand the loads acting on the device under extreme conditions.
As multiple approaches exist for controlling device performance, future work will extend this research by developing a dedicated optimization tool capable of tuning the WEC over a targeted range of sea states, thereby enabling systematic performance enhancement for different deployment sites. In the extended optimization framework, the cost of the WEC will be evaluated relative to energy production, accounting for the annual distribution of incident wave power at a given site. Survivability is critical to long-term WEC reliability and will be quantified and incorporated into the analysis as a key design criterion. In addition, the analysis will be extended to the time domain to capture the nonlinear response of the PTO, thereby achieving a more accurate performance assessment. In parallel, an adapted PTO system is under development, and its control strategy will be examined. Wave flume experiments of the SWAN–WEC are also planned. Together, these developments will support a deeper understanding of system performance and advance the path toward a practical and robust SWAN–WEC design.

Supplementary Materials

The following supporting information can be downloaded at: https://www.mdpi.com/article/10.3390/jmse14100870/s1, Figure S1. A comparison of the captured power with Figure 7 by [21], for case E. Figure S2. A comparison of the Heave RAOs with Figure 8 by [21], for case E. Figure S3. Contours of the capture length efficiency for the improved case E. Figure S4. Contours of the capture length efficiency for period 7.75 s. Figure S5. Contours of the capture length efficiency for PM spectrum of U = 10.

Author Contributions

Conceptualization, N.D.; Methodology, D.B. and N.D.; Software, D.B. and N.D.; Validation, D.B. and N.D.; D.B. and Formal analysis, N.D.; Investigation, D.B. and N.D.; Resources, N.D.; Writing—original draft, D.B.; Writing—review & editing, N.D.; Visualization, D.B. and N.D.; Supervision, N.D.; Project administration, N.D.; Funding acquisition, N.D. All authors have read and agreed to the published version of the manuscript.

Funding

This research was funded by “BRIDGING THE VARIABILITY GAPS TO RESOLVE THE LONG-TERM IMPACTS OF CLIMATE CHANGE ON THE SE LEVANTINE BASIN” obtained from the Israel Planning and Budgeting Committee (PBC) program for Marine Research Centers.

Data Availability Statement

The data presented in this study are available on request from the corresponding author due to patent registration procedure.

Conflicts of Interest

The authors declare no conflict of interest.

Abbreviations

The following abbreviations are used in this manuscript:
CLMConnection Link Matrix
CWRcapture width ratio
DOFdegree of freedom
DRPdistribution radius of the PTO elements
EOMequations of motion
MBLminimum breaking load
MLMMooring Line Matrix
PApoint absorber
PDCPTO damping coefficient
PTOPower Take-Off
RAOsresponse amplitude operators
RRIroll radius of inertia
WECwave energy converter

References

  1. Dincer, I.; Rosen, M.; Khalid, F. 3.8 Ocean (Marine) Energy Production. In Comprehensive Energy Systems; Elsevier: Amsterdam, The Netherlands, 2018; pp. 335–379. [Google Scholar] [CrossRef]
  2. Energy Institute. Statistical Review of World Energy 2025; Energy Institute: London, UK, 2025; Available online: https://www.energyinst.org/statistical-review/home (accessed on 9 July 2025).
  3. Alkhafaji, A.I.; Albajjari, A.I.H.; Abdul-Majeed, A.F. Environmental Impacts of Renewable Energy Use and Economic Growth within the Framework of Sustainable Development Goal. Am. J. Ind. Bus. Manag. 2025, 8, 2717–2727. [Google Scholar]
  4. Holechek, J.L.; Geli, H.M.E.; Sawalhah, M.N.; Valdez, R. A Global Assessment: Can Renewable Energy Replace Fossil Fuels by 2050? Sustainability 2022, 14, 4792. [Google Scholar] [CrossRef]
  5. Kim, J.; Jaumotte, F.; Panton, A.J.; Schwerhoff, G. Energy Security and the Green Transition. Energy Policy 2025, 198, 114409. [Google Scholar] [CrossRef]
  6. Guo, B.; Wang, T.; Jin, S.; Duan, S.; Yang, K.; Zhao, Y. A Review of Point Absorber Wave Energy Converters. J. Mar. Sci. Eng. 2022, 10, 1534. [Google Scholar] [CrossRef]
  7. Guo, B.; Ringwood, J.V. A Review of Wave Energy Technology from a Research and Commercial Perspective. IET Renew. Power Gener. 2021, 15, 3065–3090. [Google Scholar] [CrossRef]
  8. Wang, J.; Chen, Z.; Zhang, F. A Review of the Optimization Design and Control for Ocean Wave Power Generation Systems. Energies 2022, 15, 102. [Google Scholar] [CrossRef]
  9. Veerabhadrappa, K.; Suhas, B.G.; Mangrulkar, C.K.; Kumar, R.S.; Mudakappanavar, V.S.; Narahari; Seetharamu, K.N. Power Generation Using Ocean Waves: A Review. Glob. Transit. Proc. 2022, 3, 359–370. [Google Scholar] [CrossRef]
  10. Stiassnie, M.; Kadri, U.; Stuhlmeier, R. Harnessing Wave Power in Open Seas. J. Ocean. Eng. Mar. Energy 2016, 2, 47–57. [Google Scholar] [CrossRef]
  11. Our World in Data. Primary Energy Consumption. Available online: https://ourworldindata.org/grapher/primary-energy-cons?utm_source=chatgpt.com (accessed on 9 April 2026).
  12. Gunn, K.; Stock-Williams, C. Quantifying the Global Wave Power Resource. Renew. Energy 2012, 44, 296–304. [Google Scholar] [CrossRef]
  13. Mørk, G.; Barstow, S.; Kabuth, A.; Teresa Pontes, M. Assessing the Global Wave Energy Potential. In OMAE2010; American Society of Mechanical Engineers (ASME): New York, NY, USA, 2010; Volume 3. [Google Scholar] [CrossRef]
  14. Wang, G.; Bar, D.; Schreier, S. Floating Seawall and the Circular Economy of End-of-Life Ships. Ocean. Eng. 2023, 298, 117246. [Google Scholar] [CrossRef]
  15. Aderinto, T.; Li, H. Review on Power Performance and Efficiency of Wave Energy Converters. Energies 2019, 12, 4329. [Google Scholar] [CrossRef]
  16. Babarit, A.; Hals, J.; Muliawan, M.J.; Kurniawan, A.; Moan, T.; Krokstad, J. Numerical Benchmarking Study of a Selection of Wave Energy Converters. Renew. Energy 2012, 41, 44–63. [Google Scholar] [CrossRef]
  17. Ahamed, R.; McKee, K.; Howard, I. Advancements of Wave Energy Converters Based on Power Take off (PTO) Systems: A Review. Ocean. Eng. 2020, 204, 107248. [Google Scholar] [CrossRef]
  18. Li, D.; Sharma, S.; Wang, T.; Borthwick, A.G.L.; Dong, X.; Shi, H. Optimal Hydraulic PTO and Linear Permanent Magnet Generator for a Floating Two-Buoy Wave Energy Converter. Renew. Energy 2024, 234, 121231. [Google Scholar] [CrossRef]
  19. Yang, B.; Duan, J.; Chen, Y.; Wu, S.; Li, M.; Cao, P.; Jiang, L. A Critical Survey of Power Take-off Systems Based Wave Energy Converters: Summaries, Advances, and Perspectives. Ocean. Eng. 2024, 298, 117149. [Google Scholar] [CrossRef]
  20. Babarit, A. A Database of Capture Width Ratio of Wave Energy Converters. Renew. Energy 2015, 80, 610–628. [Google Scholar] [CrossRef]
  21. Xu, D.; Stuhlmeier, R.; Stiassnie, M. Assessing the Size of a Twin-Cylinder Wave Energy Converter Designed for Real Sea-States. Ocean. Eng. 2018, 147, 243–255. [Google Scholar] [CrossRef]
  22. Wave Energy Scotland. Novel Wave Energy Converter-Advanced Archimedes Waveswing. Available online: https://www.waveenergyscotland.co.uk/wave-technology/novel-wave-energy-converter/advanced-archimedes-waveswing/ (accessed on 17 December 2025).
  23. Leijon, M.; Boström, C.; Danielsson, O.; Gustafsson, S.; Haikonen, K.; Langhamer, O.; Stromstedt, E.; Rahm, M.; Sundberg, J.; Svensson, O.; et al. Wave Energy from the North Sea: Experiences from the Lysekil Research Site. Surv. Geophys. 2008, 29, 221–240. [Google Scholar] [CrossRef]
  24. Parwal, A.; Remouit, F.; Hong, Y.; Francisco, F.; Castellucci, V.; Hai, L.; Ulvgård, L.; Li, W.; Lejerskog, E.; Baudoin, A.; et al. Wave Energy Research at Uppsala University and The Lysekil Research Site, Sweden: A Status Update. In Proceedings of the 11th European Wave and Tidal Energy Conference, Nantes, France, 6–11 September 2015. [Google Scholar]
  25. CorPower Ocean. Available online: https://corpowerocean.com/ (accessed on 27 July 2025).
  26. Mei, C.C.; Stiassnie, M.; Yue, D.K.-P. Theory and applications of ocean surface waves. In Advanced Series On Ocean Engineering; World Scientific: Hackensack, NJ, USA, 2010; Volume 33. [Google Scholar]
  27. Zavadsky, A. Wave Recording and Analysis at Haifa-Annual Report/Long-Term Wave and Wind Statistics; PN1049; CAMERI–Coastal And Marine Engineering Reaearch Institute Ltd.: Haifa, Israel, 2024. [Google Scholar]
  28. Cheng, Z.; Yang, J.; Hu, Z.; Xiao, L. Frequency/Time Domain Modeling of a Direct Drive Point Absorber Wave Energy Converter. Sci. China Phys. Mech. Astron. 2013, 57, 311–320. [Google Scholar] [CrossRef]
  29. Liu, H.X.; Zhang, W.C.; Zheng, X.B.; Zhang, L.; Zhang, X.W.; Cui, L. Wave Energy Conversion by Cylinder Array with a Floating Platform Considering Linear/Nonlinear PTO Damping. J. Mar. Sci. Technol. 2017, 22, 747–757. [Google Scholar] [CrossRef]
  30. Thanh Ta, D.; Phan, Q.N.; Truong, T.T. Hydrodynamic Analysis of Point Absorber Wave Energy Converters Using ANSYS Aqwa. J. Phys. Conf. Ser. 2025, 2949, 012047. [Google Scholar] [CrossRef]
  31. He, R.; He, G.; Jing, P.; Luan, Z.; Liu, C. Adaptive Damping PTO Control of Wave Energy Converter for Irregular Waves Supported by Wavelet Transformation. Energies 2025, 18, 3328. [Google Scholar] [CrossRef]
  32. Tan, J.; Polinder, H.; Laguna, A.J.; Miedema, S. A Wave-to-Wire Analysis of the Adjustable Draft Point Absorber Wave Energy Converter Coupled with a Linear Permanent-Magnet Generator. Ocean. Eng. 2023, 276, 114195. [Google Scholar] [CrossRef]
  33. ANSYS, Inc. AQWA Theory Manual; 174; ANSYS, Inc.: Canonsburg PA, USA, 2013; Volume 15317. [Google Scholar]
  34. Gafter, R.; Álvarez Castillo, K.; Drimer, N.; Schreier, S.; Wang, G. Benchmark Study on the Motion Response and Connectors Load in a Modular Floating Structure: An Ongoing Numerical Investigation. In Proceedings of the WCFS 2025, Espoo, Finland, 1–3 September 2025. in press. [Google Scholar]
  35. Falcao, A. Phase Control through Load Control of Oscillating-Body Wave Energy Converters with Hydraulic PTO System. Ocean. Eng. 2008, 35, 358–366. [Google Scholar] [CrossRef]
Figure 1. SWAN–WEC concept drawing.
Jmse 14 00870 g001
Figure 2. SWAN–WEC survival state.
Jmse 14 00870 g002
Figure 3. Floating barge WEC: (A) view on, (B) heave and roll or roll-only WEC, (C) heave-only WEC, (D) heave-only WEC with reflecting wall.
Jmse 14 00870 g003
Figure 4. CWR maps for barge WEC; (a) heave-only; (b) roll-only; (c) heave and roll; (d) heave-only with reflected wall.
Jmse 14 00870 g004
Figure 5. Lateral instability.
Jmse 14 00870 g005
Figure 6. A comparison of the captured power with Figure 7 by [21] for Case E.
Jmse 14 00870 g006
Figure 7. A comparison of the heave RAOs with Figure 8 by [21] for Case E.
Jmse 14 00870 g007
Figure 8. The schematic drawings in scale of the SWAN–WEC for the two design cases: (a) Design Case #1 at two operational states (left: 6 s and right: 8 s) and (b) Design Case #2 for 6 s.
Jmse 14 00870 g008
Figure 9. Mooring system design schema.
Jmse 14 00870 g009
Figure 10. Capture width ratio (CWR) contours for three sea states: monochromatic (MC) (ac), JONSWAP (df), and Pierson–Moskowitz (gi). Within each row, results are shown for Design Case #1–6s (left column), Design Case #1–6s (center column), and Design Case #2–6s (right column).
Jmse 14 00870 g010
Figure 11. Capture width ratio (CWR) map for Design Case #1 at a range of JONSWAP sea states.
Jmse 14 00870 g011
Figure 12. Comparison of RAOs between an operational state and the survival state.
Jmse 14 00870 g012
Figure 13. First-order and second-order (drift) forces acting on the most heavily loaded mooring line for a unit wave amplitude.
Jmse 14 00870 g013
Table 1. Dimensions and parameters for the barge WEC example.
ParameterValue
Box length80.0 m
Box breadth10.0 m
Box draft5.0 m
Box displacement (at seawater density of 1.025 ton/m3)4100.0 ton
Vertical center of gravity above keel2.8 m
Roll radius of inertia3.0 m
Heave natural period (including added mass)6.0 s
Roll natural period (including added mass)6.0 s
Water depth20.0 m
Gap between box side and wall (if existing)2.0 m
Wall width (not critical, however, it should be specified)4.0 m
Table 2. Geometry of the SWAN–WEC for the two design cases.
Principal DimensionsDesign Case #1Design Case #2Units
Structure 1
Hull radius15.006.00
Hull height4.004.00
Cone base radius4.003.00 m
Cone height4.004.00
Neck radius2.001.00
Neck height25.0025.00
Structure 2
Hull radius15.006.00
Moonpool radius3.752.75 m
Hull height8.008.00
Table 3. Design specifications of the two design cases.
Design SpecificationsDesign Case #1Design Case #2Units
Draft 2 mDraft 6 mDraft 6 m
Str #1 Str #2 Str #1 Str #2 Str #1 Str #2
Draft19.02.023.06.023.06.0 m
Vertical center of gravity−16.52.8−20.5−1.1−20.5−1.7 m
Metacentric height GM2.526.12.58.02.52.7 m
Displaced mass at sea water of 1.025 ton/m33160.01358.53211.54075.5542.1549.4 t o n
Moments of inertia Ixx = Iyy3.501.353.503.220.100.10 10 8   k g m 2
Moment of inertia Izz3.602.723.506.300.100.10 10 8   k g m 2
Table 4. Wave conditions.
Sea StateDesign Case #1Design Case #2Units
Draft 2 m—6 sDraft 6 m—8 sDraft 6 m—6 s
MCJOP-MMCJOP-MMCJOP-M
H/ H m 0 2.001.191.412.02.142.542.001.191.41 m
Incident power per WEC width7081151569894856652834662 K W
Table 5. Mooring system specifications.
Mooring arrangement6 lines from the base of Structure 2 to seabed, every 60º
Mooring line specificationNylon rope diameter 80 mm
MBL—minimum breaking load1250 kN
Mooring line spring coefficient24 kN/m
Table 6. Maximum capture width ratio and corresponding captured power, DRP, and RRI.
Design Case #1Design Case #2Units
Draft 2 m—6 sDraft 6 m—8 sDraft 6 m—6 s
MCJOP-MMCJOP-MMCJOP-M
CWR0.860.630.541.150.570.402.220.610.43
Incident power per device width7081151569894856652834662 K W
Captured power per device width611728311342762646292827 K W
DRP9.06.87.58.33.84.53.06.06.0 m
RRI9.011.010.56.79.39.34.34.13.6 m
RRI/radius of cylinder0.600.730.700.440.620.620.710.680.60
Disclaimer/Publisher’s Note: The statements, opinions and data contained in all publications are solely those of the individual author(s) and contributor(s) and not of MDPI and/or the editor(s). MDPI and/or the editor(s) disclaim responsibility for any injury to people or property resulting from any ideas, methods, instructions or products referred to in the content.