Article

Power-Load Characteristics of Fixed Oscillating Water Column Chambers for Potential Integration with Offshore Wind Jacket Foundations
1
PowerChina Huadong Engineering Corporation Limited, Hangzhou 311122, China
2
State Key Laboratory of Coastal and Offshore Engineering, Dalian University of Technology, Dalian 116024, China
*
Author to whom correspondence should be addressed.
J. Mar. Sci. Eng. 2026, 14(13), 1224; https://doi.org/10.3390/jmse14131224
Submission received: 23 May 2026 / Revised: 24 June 2026 / Accepted: 29 June 2026 / Published: 1 July 2026
(This article belongs to the Special Issue Hydrodynamics of Wave Energy Conversion Systems)

Abstract

The integration of wave energy converters with offshore wind foundations offers a potential route to improving the utilization of offshore renewable energy infrastructure. This study numerically investigates the power-load characteristics of fixed oscillating water column (OWC) chambers intended for potential installation near offshore wind jacket foundations. A preliminary jacket comparison is first used to delimit the scope, after which the main parametric study is performed on isolated OWC chambers so that pneumatic response and local chamber loads can be compared consistently. The simulations are conducted under regular waves with a wave height of H = 0.05 m, a water depth of h = 1.6 m, and wave periods of T = 0.9–1.7 s. Three baseline geometries, namely cylindrical, sandglass-shaped, and bottle-shaped OWCs, are first screened in order to identify the most suitable reference chamber family. The cylindrical chamber is then retained as the reference configuration for subsequent local parameter studies of the frustum-contraction parameter D2 and the front-wall draft d2. The results indicate that the geometric effect is strongly dependent on the incident-wave period. The sandglass-shaped and bottle-shaped chambers can enhance short-period pneumatic power or reduce loads at longer periods, whereas the cylindrical chamber provides a more consistent reference response over the tested range. Under the wave conditions adopted in this study, further analysis reveals that D2 exerts a non-monotonic tuning effect varying with wave period. For the selected frustum-shaped configuration, increasing d2 reduces hydrodynamic loads yet simultaneously weakens pneumatic power output and CWR. Because the air phase is treated as incompressible and the orifice represents an orifice-only damping condition rather than a turbine-controlled PTO system, the reported Pe should be interpreted as a pneumatic/hydrodynamic comparison metric and not as wave-to-wire electrical power. The conclusions are therefore positioned as regular-wave geometry-tuning trends for the present model scale rather than as full coupled jacket-OWC design rules.

1. Introduction

Offshore wind development is moving toward larger installed capacities, more severe sea states, and a wider range of water depths, making the support structure an important part of the overall system design. For fixed-bottom turbines, the substructure forms the load-transfer path between the rotor-tower system and the seabed, and recent review and optimization studies indicate that jacket concepts remain attractive in intermediate water depths because of their stiffness, modularity, and efficient material distribution under combined environmental loading [1,2]. Meanwhile, the high capital cost of offshore infrastructure has encouraged research on multi-purpose offshore platforms in which a common support system can host more than one renewable-energy function [3,4]. Hybrid wind-wave concepts are therefore relevant because wind and wave resources frequently coexist in energetic sea areas and may partly share offshore space, installation logistics, export infrastructure, and maintenance operations [3,4,5,6,7].
Among wave energy converters, the oscillating water column (OWC) is a mature concept in which the turbine-generator system can be located above the waterline, while the water column and the air chamber are formed by relatively simple structural surfaces [8,9]. Earlier fixed-OWC studies mainly addressed shoreline, caisson, or breakwater applications, where the chamber opening, front-wall draft, and local confinement were shown to control water-column oscillation, pressure build-up, and absorbed wave power [9,10,11]. More recent studies have extended this idea to offshore wind support structures. Lee et al. investigated OWCs installed in jacket foundations and showed the sensitivity of efficiency to chamber shape and opening conditions [12,13]; Qiao et al. examined the dynamic response of a jacket platform integrated with an OWC [14]; and Perez-Collazo et al. experimentally demonstrated that a jacket-mounted OWC with a variable aperture skirt exhibits strong geometry-dependent pneumatic power and capture-width behavior [15].
A substantial portion of the OWC geometry literature has focused on improving hydrodynamic or pneumatic efficiency. Early numerical studies examined the effects of chamber size, device proportions, and turbine-induced damping on resonance and absorbed power [16,17]. Subsequent offshore and three-dimensional studies showed that underwater geometry, submerged profile, and chamber shape can modify free-surface amplification and pneumatic response [18,19]. Other investigations addressed chamber width, front-wall draft, and related dimensional ratios, showing that even simple geometric changes can shift the favorable operating period [20,21,22]. Modified front-wall concepts, including L-shaped and elliptical walls, have also been proposed for selected wave conditions [23,24], and U-shaped OWCs have been examined as broader chamber-family variants [25]. These studies provide useful energy-oriented design knowledge; however, a jacket-related OWC also raises a load issue: the same geometric change that strengthens internal oscillation may also alter the horizontal and vertical loads acting on the chamber surfaces.
This power-load coupling is also evident in dual- and multi-chamber OWC systems. Additional chambers can broaden the response bandwidth or redistribute the oscillating water mass [26,27], while numerical studies show that front-lip motion, chamber coupling, and chamber number can modify pressure fields and hydrodynamic loads in a non-trivial manner [28,29,30,31,32,33]. Integrated concepts involving wave-focusing or supporting structures further show that improved power capture depends strongly on local geometry and boundary conditions [34]. This paper aims to clarify how OWC chamber geometry redistributes pneumatic energy capture and local chamber loading when the chamber is considered for integration near an offshore wind jacket foundation. The emphasis is not on obtaining a universal optimum, but on identifying geometry-dependent power–load trade-offs under representative regular waves.
What is new in this study is the combined treatment of pneumatic response and local chamber loading for jacket-relevant fixed OWC chamber geometries. Previous jacket-mounted or offshore OWC studies have mainly emphasized energy conversion efficiency, chamber opening conditions, or the global dynamic response of the supporting structure. A remaining gap is the lack of a compact comparison showing how the same geometric change redistributes both useful pneumatic power and local hydrodynamic load. The present work therefore provides: (i) a common CFD-based comparison of three representative chamber families, (ii) targeted parameter studies of the frustum-contraction parameter D2 and the front-wall draft d2, and (iii) a period-dependent design interpretation in which power enhancement and load reduction are treated as coupled, and sometimes competing, objectives.
The remainder of this paper is organized as follows. Section 2 describes the investigated geometries, numerical wave tank, governing equations, boundary conditions, mesh arrangement, and post-processing definitions. Section 3 presents the numerical convergence and validation assessment. Section 4 discusses the geometry-dependent power-load responses under the tested regular wave conditions. Finally, Section 5 summarizes the main conclusions.

2. Numerical Model

2.1. Problem Definition and Investigated Configurations

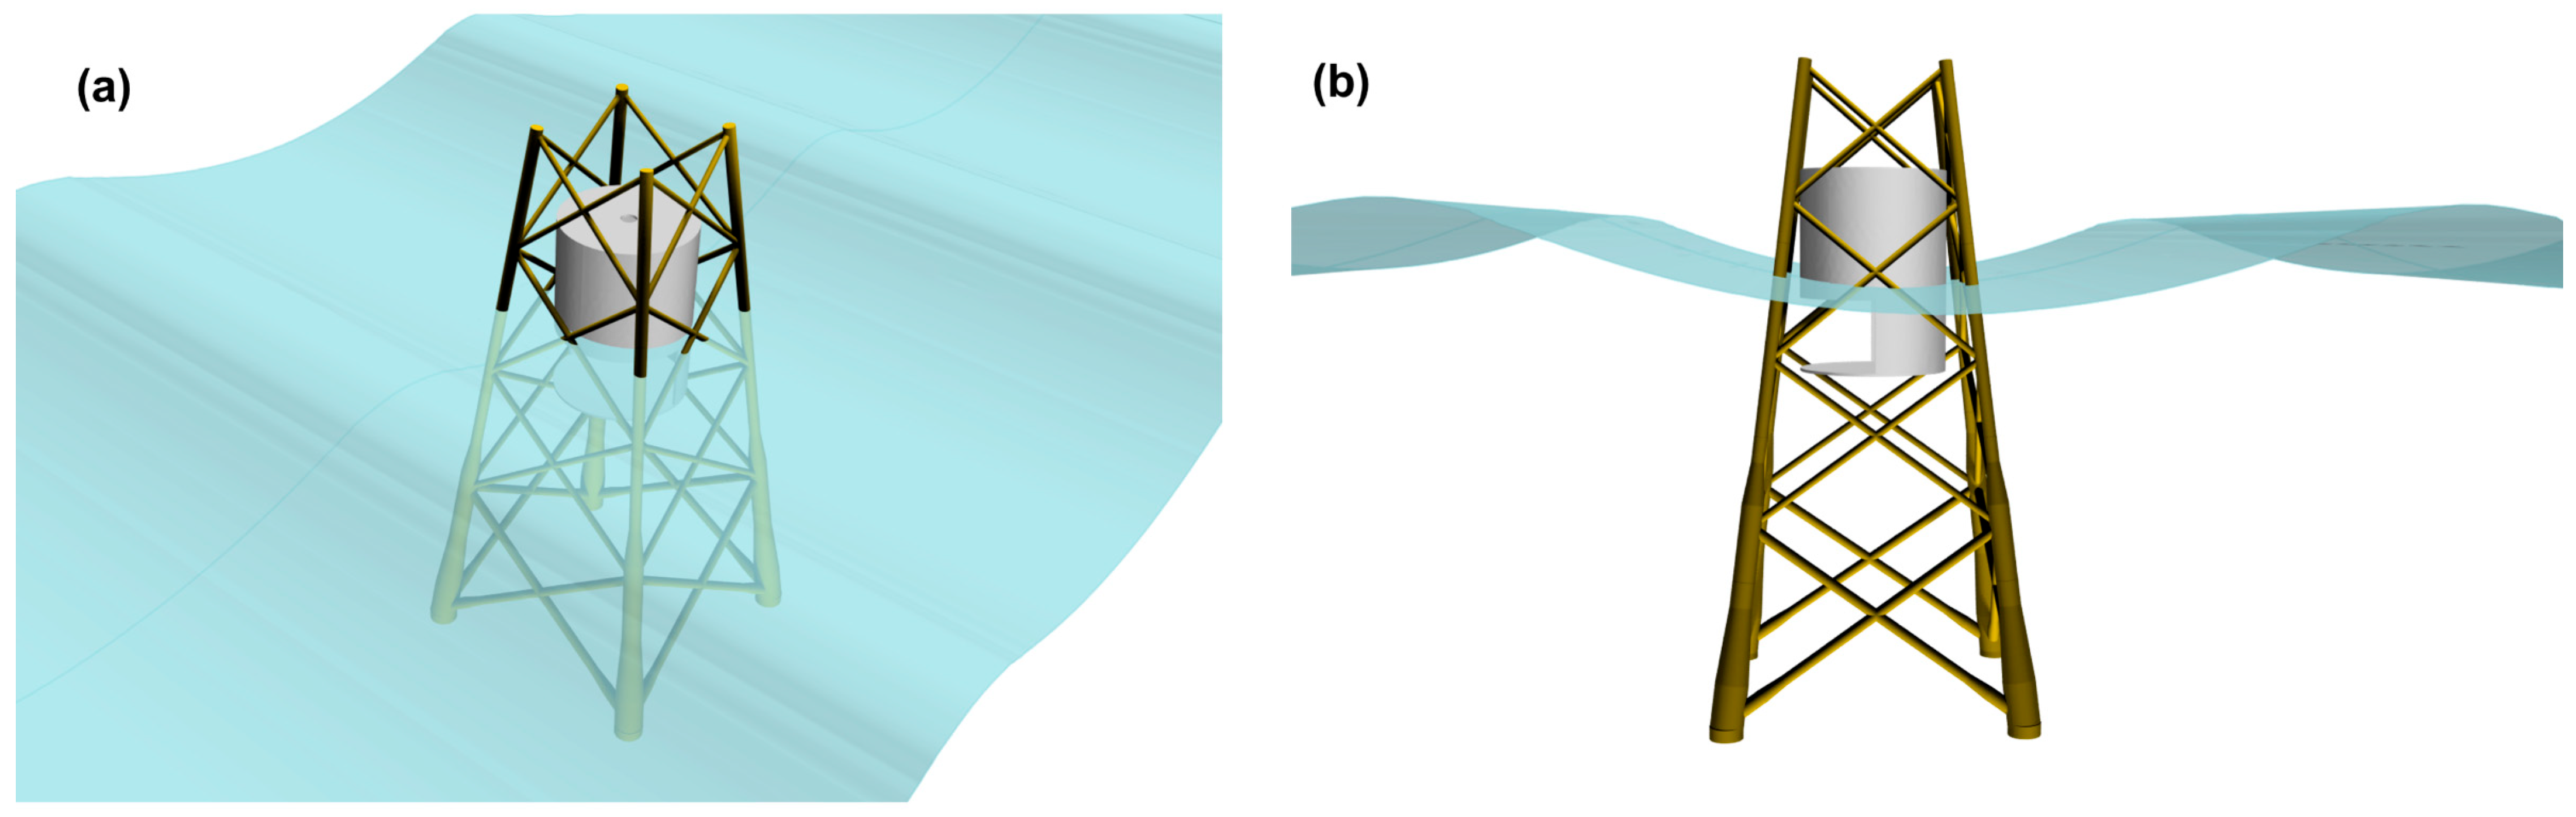
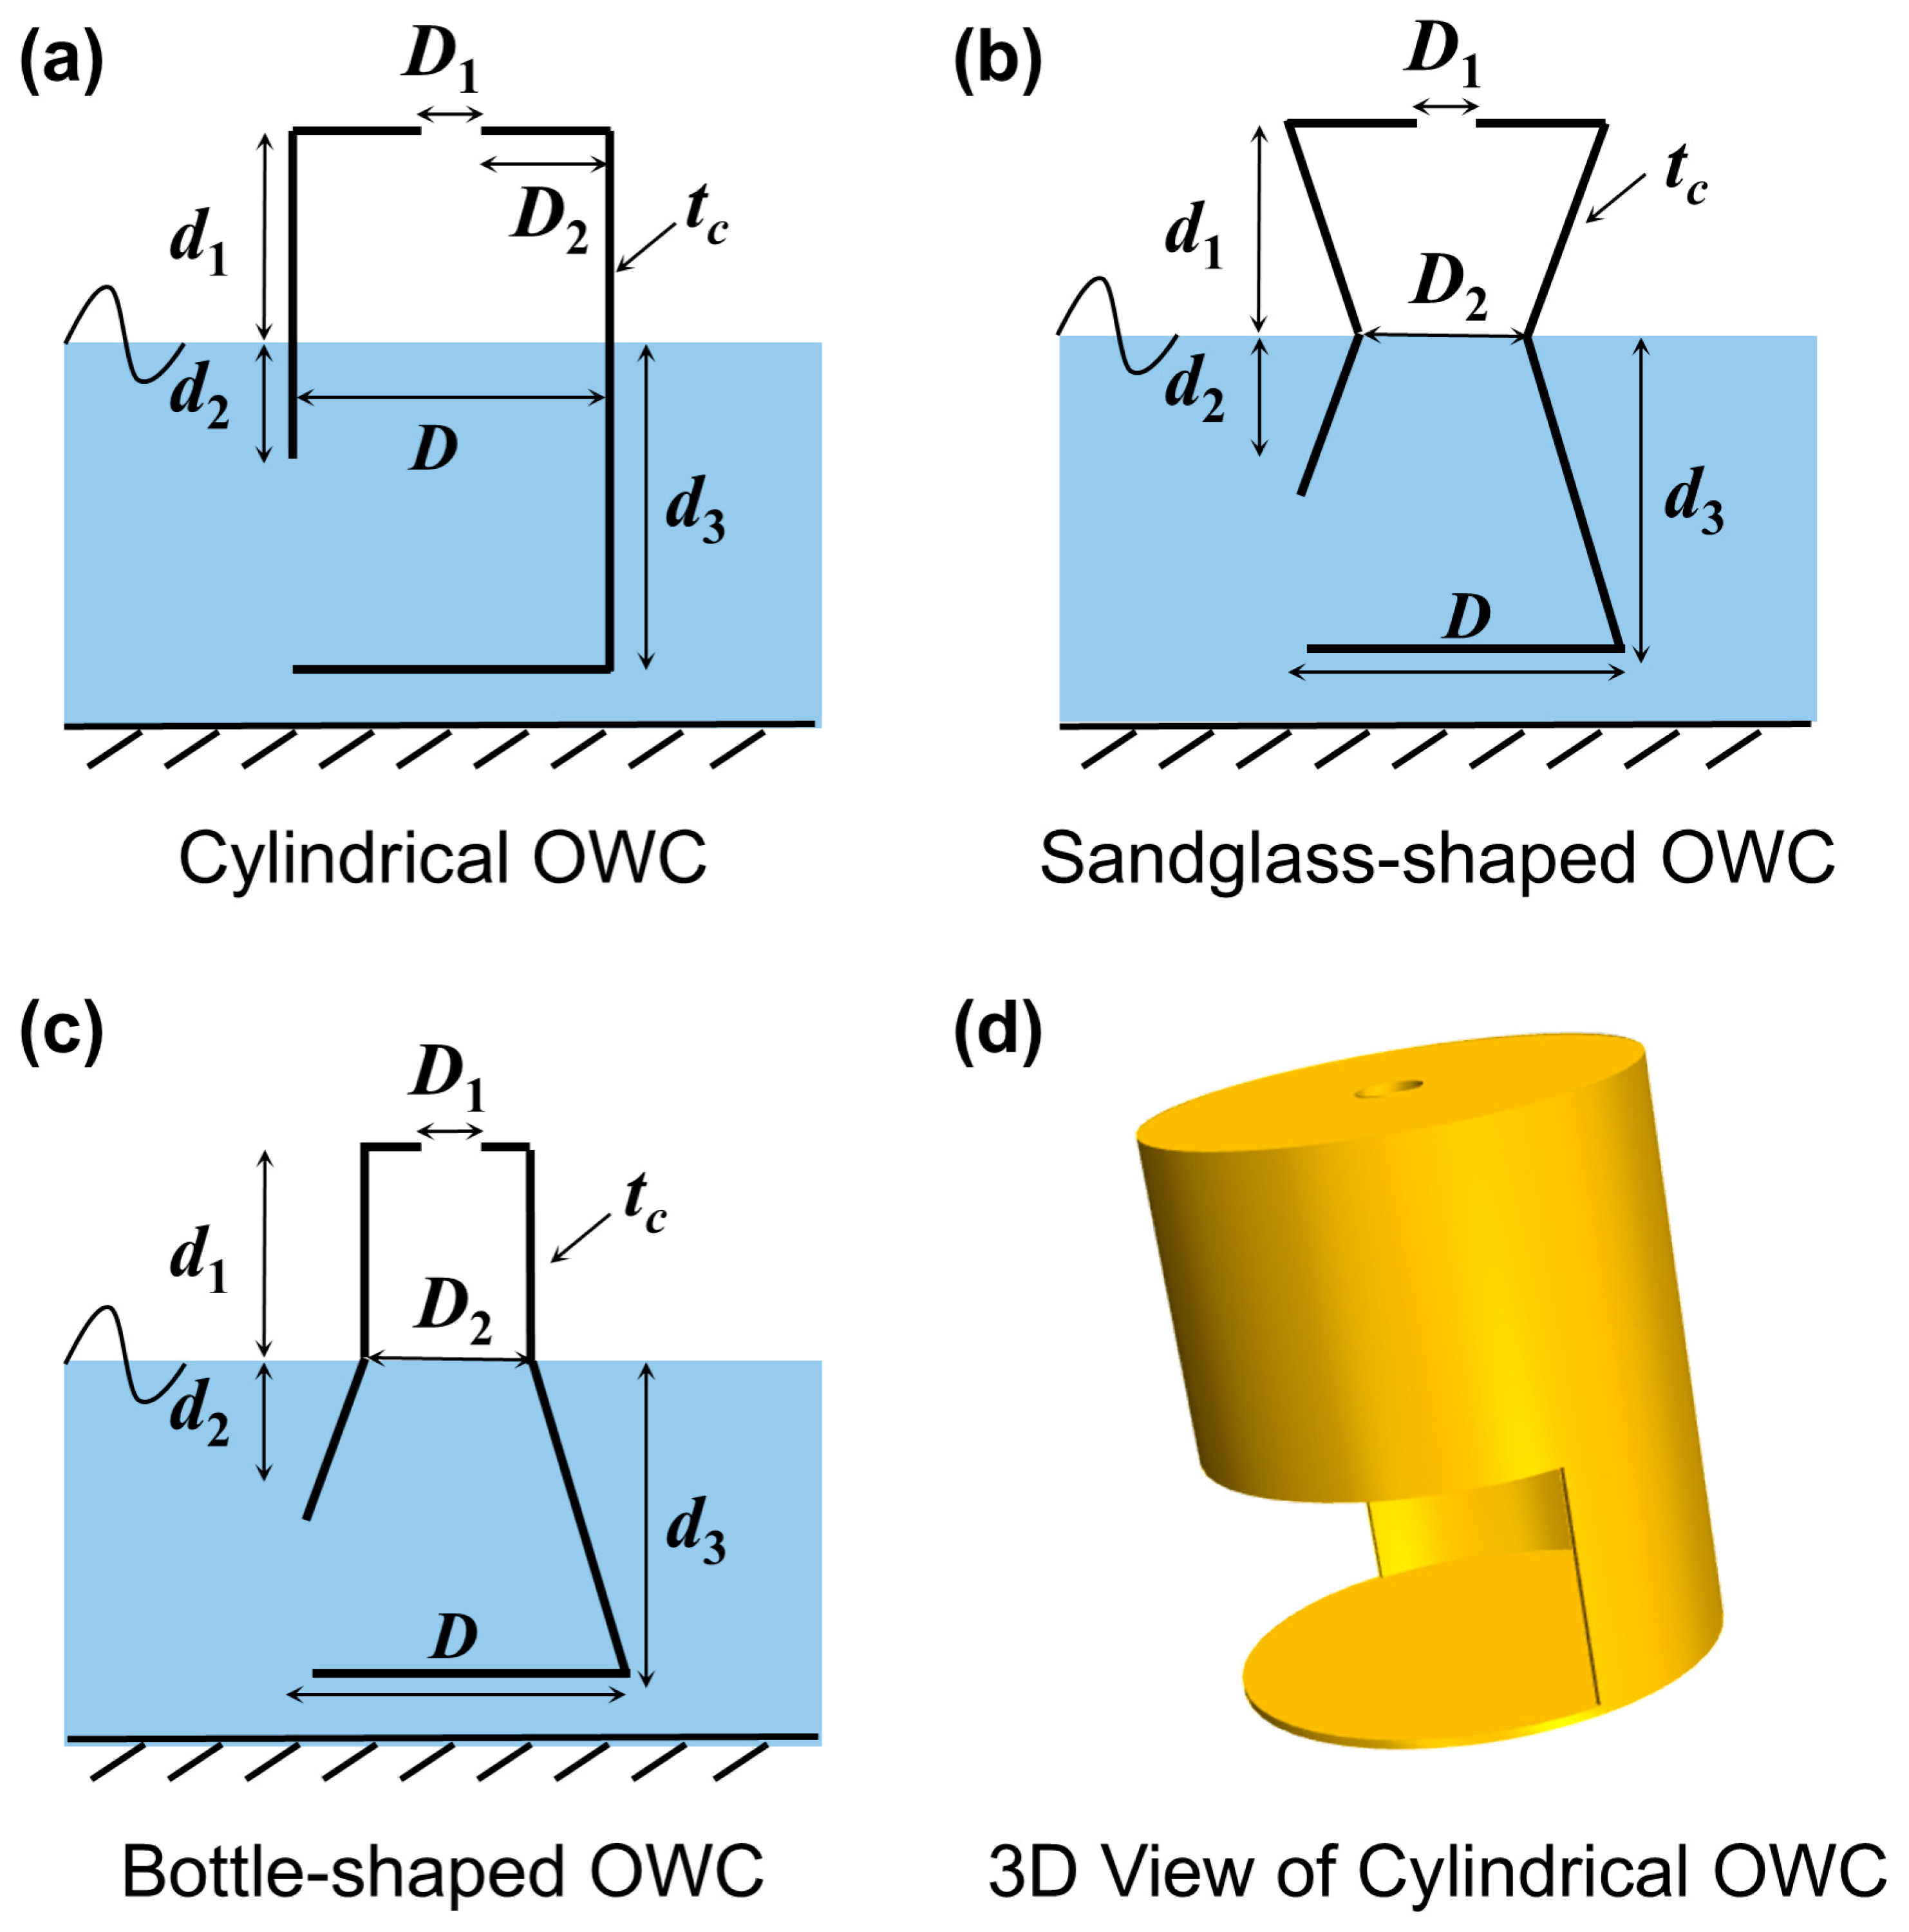
The investigated geometry is a 1:35 reduced-scale model of the target OWC chamber considered for offshore wind jacket integration. A fixed OWC chamber intended for installation within an offshore wind jacket foundation was modeled in a numerical wave tank. Figure 1 presents the application context of integrating a fixed OWC into a jacket support. To balance the power take-off and the wave loads, three different OWC configurations are considered, as shown in Figure 2.
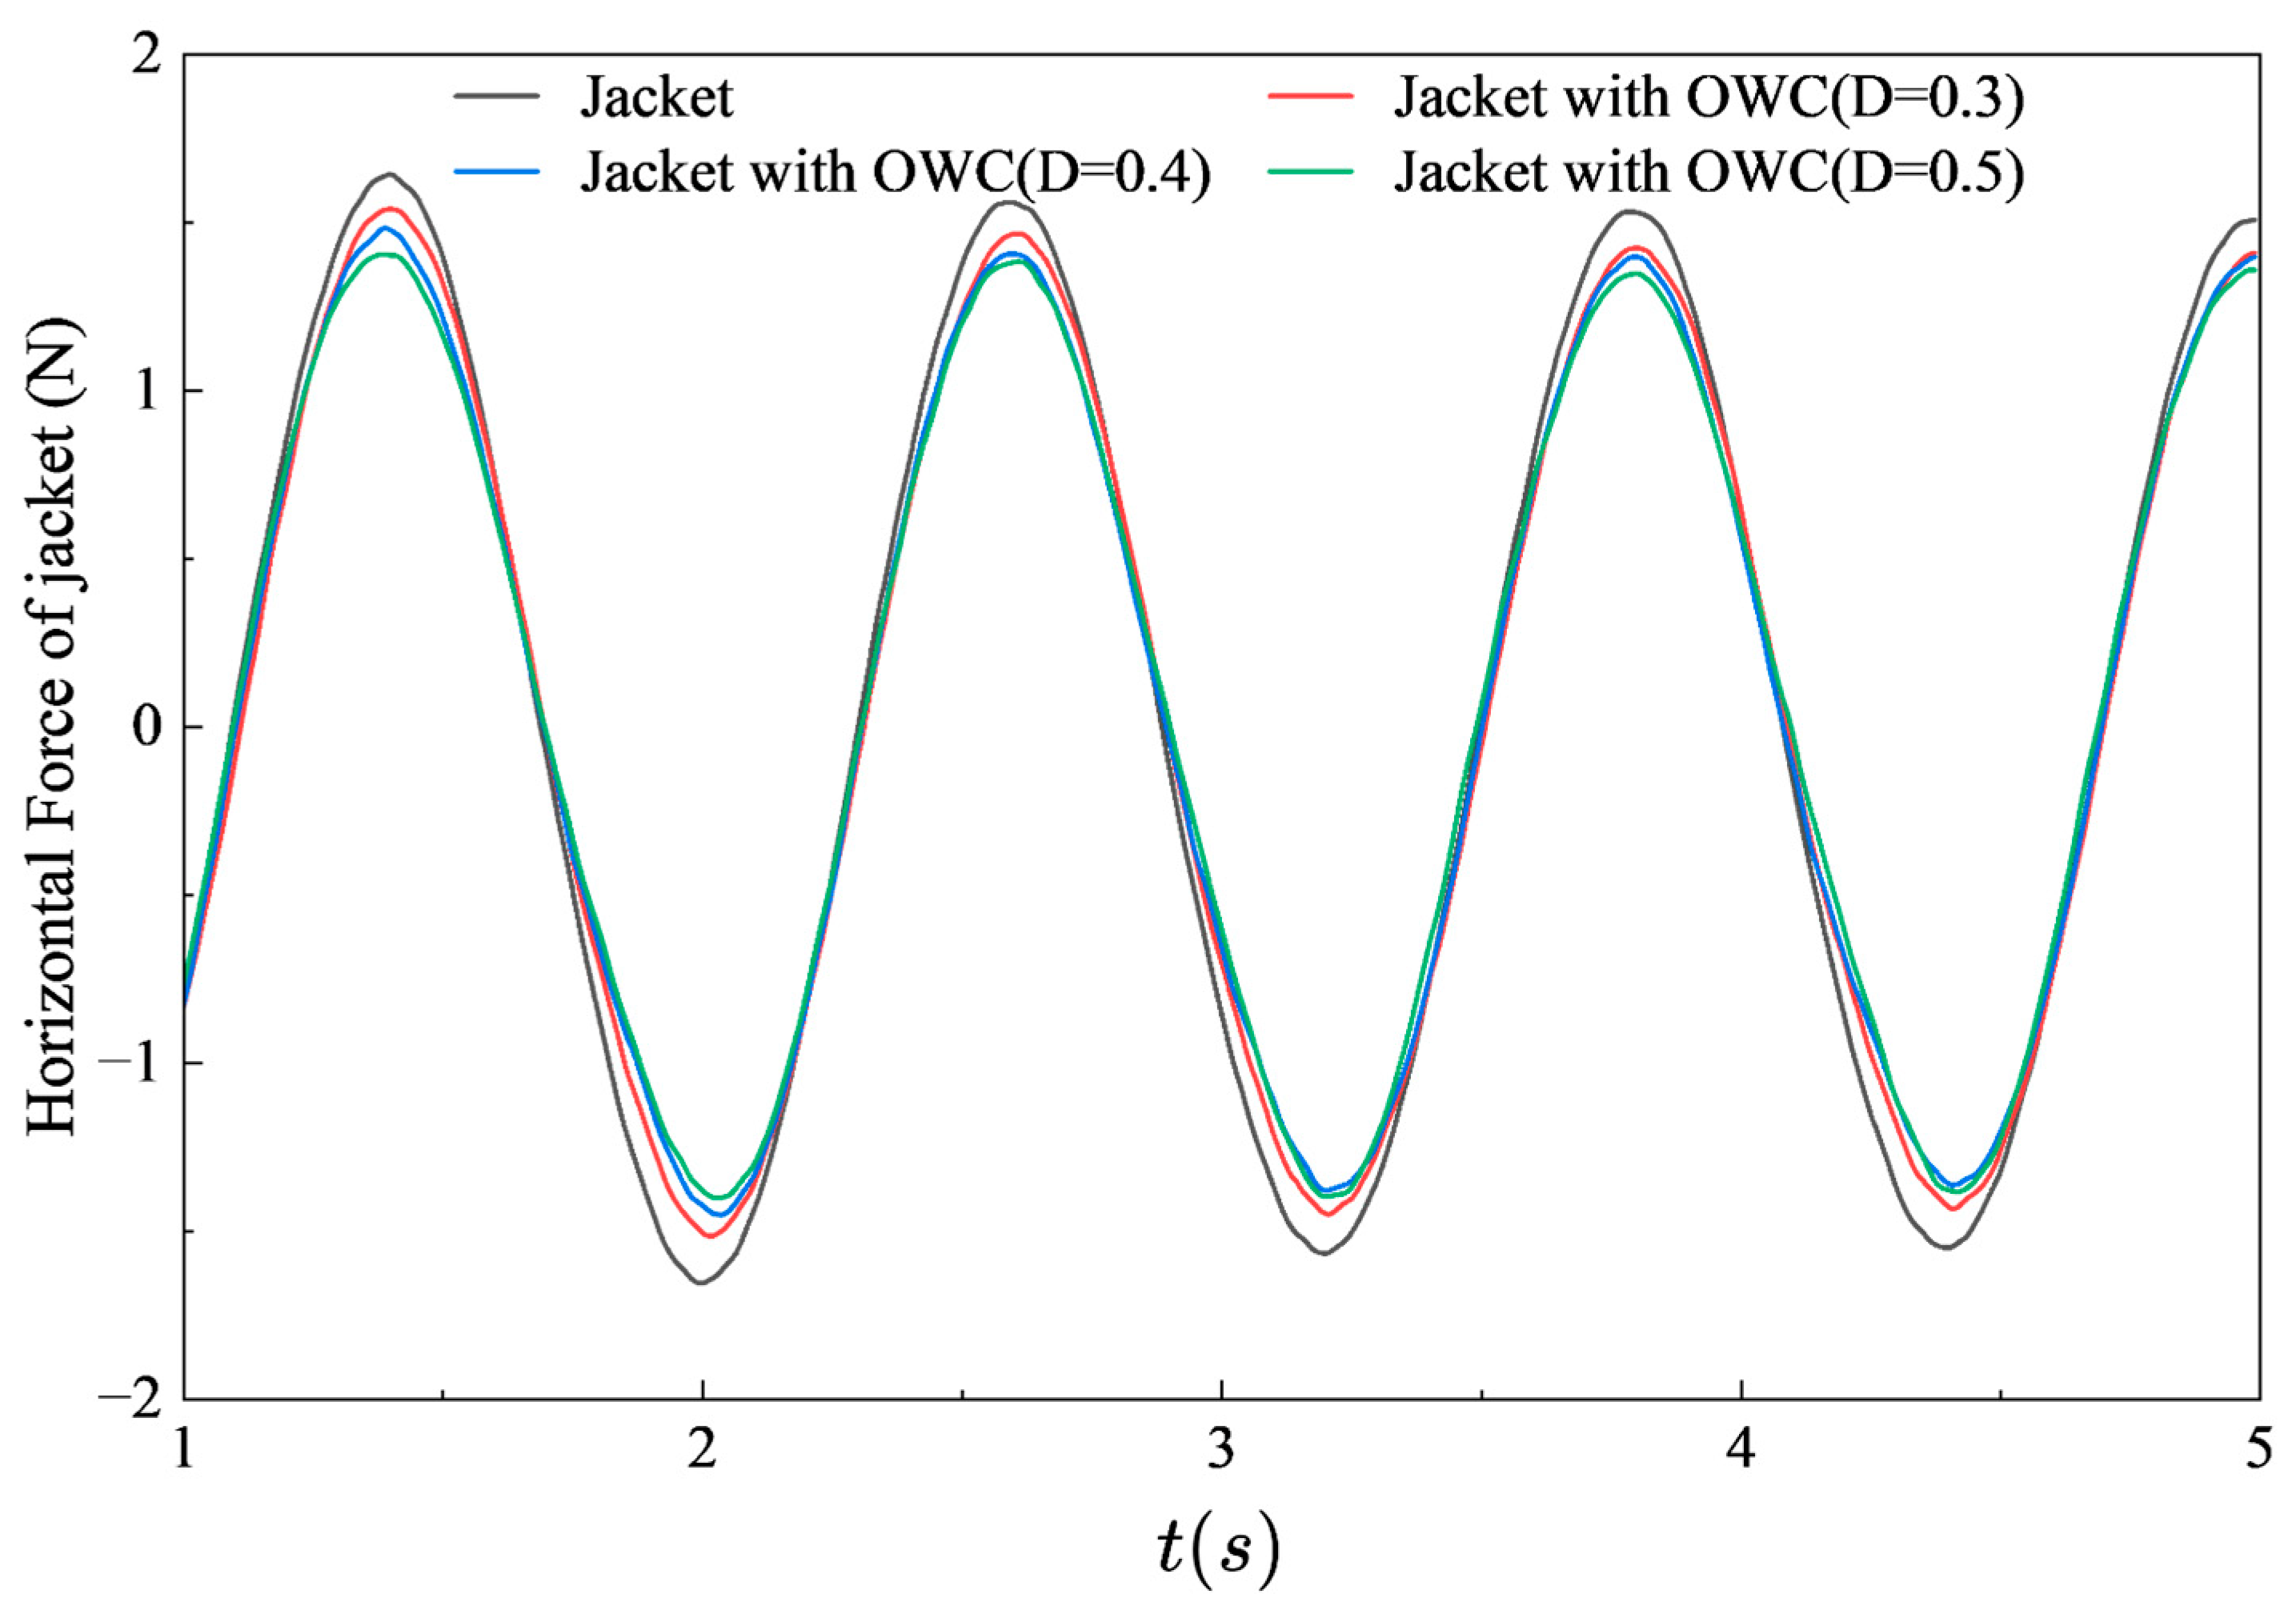
A comparison of horizontal forces was conducted between the standalone jacket frame and jacket-frame cases with OWCs of different diameters. Figure 3 shows that the jacket horizontal force histories remain almost in phase for all tested cases, while the force amplitude exhibits only a moderate decrease as the OWC diameter increases. Over the stable interval of 1–5 s, the jacket horizontal force is about 1.65 N for the jacket-only case, compared with about 1.53, 1.47, and 1.40 N for the cases with 0.3, 0.4, and 0.5 m OWC chambers, respectively. In other words, the OWC-induced variation in the global jacket horizontal force is only about 0.12–0.25 N. By comparison, the local chamber loads obtained in the subsequent isolated OWC calculations are on the order of several tens of newtons. This indicates that, under the present simplified regular wave setup, varying the attached OWC diameter affects the global jacket horizontal response only at a secondary level, whereas the chamber scale load variation is much more pronounced. The subsequent simulations therefore focus on the isolated OWC chamber, allowing the pneumatic response and local chamber loads to be compared more directly among different geometries.
The fixed values of D and D1 were selected to define a consistent 1:35 model-scale reference chamber before changing the local geometric parameters. The chamber diameter D = 0.50 m gives a sufficiently large internal water-column area within the present numerical wave tank while remaining compatible with the investigated jacket-context geometry. The orifice diameter D1 = 0.071 m corresponds to an orifice-to-chamber area ratio of approximately 2.0%, which is within the range commonly adopted in fixed-OWC numerical studies to provide finite pneumatic damping [16,17,35]. Therefore, variations in Pe can be attributed mainly to chamber geometry under the same orifice-only damping condition rather than to changes in PTO control.
Three baseline OWC chamber configurations were considered in the first screening stage: a cylindrical chamber, a sandglass-shaped chamber, and a bottle-shaped chamber. For the baseline comparison, the sandglass-shaped and bottle-shaped chambers were both defined with a fixed geometric parameter of D2 = 0.16 m and d2 = 0.05 m. These three configurations represent different cross-sectional transitions between the chamber roof and the submerged opening. They are used here not as finalized engineering alternatives, but as representative geometry families for examining whether a given wave condition favors stronger pneumatic response, lower local loading, or an intermediate balance.
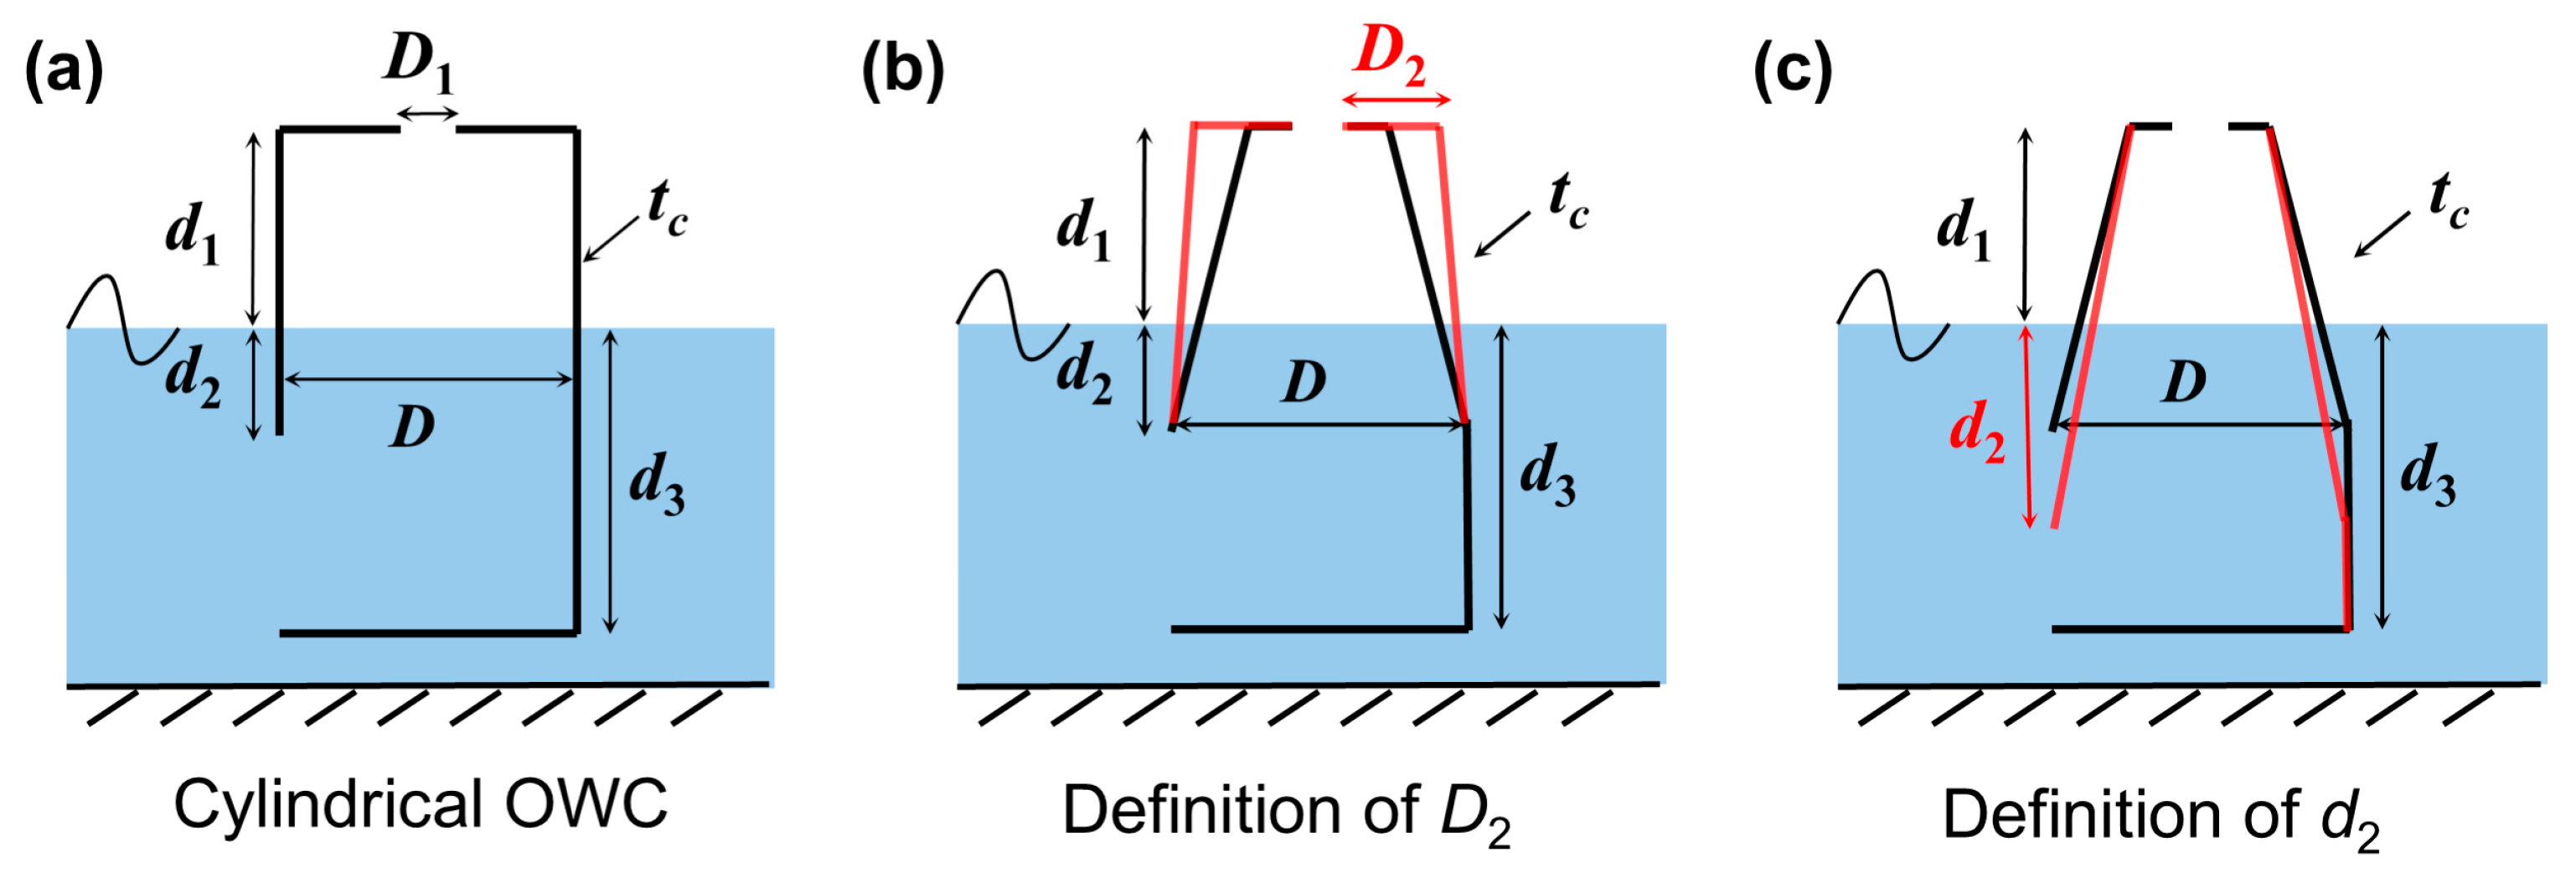
After the baseline comparison, the cylindrical chamber was retained as the reference configuration for local parameter studies. On this reference geometry, a frustum-type contraction was described by D2, with values of 0.12, 0.14, 0.16, 0.18, and 0.20 m. In the final stage, the front-wall draft d2 was varied within the D2 = 0.18 configuration set to examine how entrance immersion changes the response level. The definitions of the local geometric parameters D2 and d2 are illustrated in Figure 4. The main geometric parameters of the investigated OWC model are summarized in Table 1.

2.2. Numerical Formulation and Evaluated Quantities

OWC hydrodynamics can be studied at several levels of model fidelity. Potential-flow formulations remain attractive for rapid screening and PTO-oriented studies [35], whereas Navier–Stokes-based CFD is generally preferred when the objective is to resolve free-surface deformation, viscous dissipation, local pressure gradients, and geometry-dependent structural loading [36]. The present simulations therefore adopt a pressure-based finite-volume solver in Simcenter STAR-CCM+ 2310 for a two-phase air-water system.
The air-water interface is tracked by the volume-of-fluid (VOF) method originally proposed by Hirt and Nichols [37]. Within this framework, a single mixture momentum equation is solved for the two phases, while the local density and viscosity are reconstructed from the water volume fraction. The present simulations use the shear-stress-transport (SST) k-ω turbulence closure of Menter [38], which is commonly adopted in marine CFD when near-wall behavior and separated free surface flow may both influence the solution. The air phase is treated as incompressible in this geometry comparison study. For reduced-scale OWC devices of the type considered here, previous studies have shown that the effect of air compressibility can be small, and the incompressible air assumption can provide reasonable agreement with experimental results in laboratory-scale analyses [39,40,41].
u = 0
The transport of the water volume fraction is written as
α w t + ( α w u ) = 0
The water-volume-fraction equation is therefore reported not as an independent concentration result, but as the interface-tracking equation used to determine the local air-water distribution, mixture properties, internal free-surface elevation, and pressure field acting on the chamber walls.
The mixture momentum equation can be expressed as
( ρ u ) t + ( ρ u u ) = p + μ eff ( u + u T ) + ρ g
where u is the velocity vector, p is pressure, g is the gravitational acceleration, and μeff is the effective viscosity, including the molecular viscosity and the eddy-viscosity contribution from the SST k-ω turbulence closure.
The local mixture properties are evaluated from the phase fraction as ρ = α w ρ w + ( 1 α w ) ρ a and μ = α w μ w + ( 1 α w ) μ a .
In the present STAR-CCM+ implementation, interface advection is handled with the HRIC scheme. Pressure and velocity are solved in segregated form through a SIMPLE-type workflow, which is representative of pressure-based STAR-CCM+ free-surface solvers used in marine wave-load problems [42]. Comparable CFD-based fluid–structure interaction studies for ships and barges likewise rely on the same solver family when wave-induced pressures and motions must be resolved simultaneously [43,44]. For WEC numerical wave tanks, Windt et al. [45] emphasize that interface treatment, wave absorption, and discretization sensitivity should be documented explicitly because resonant responses are highly sensitive to numerical diffusion and residual boundary reflection.
The incident waves are regular waves with a constant wave height H = 0.05 m, water depth h = 1.6 m, and wave periods T = 0.9, 1.1, 1.3, 1.5, and 1.7 s. For each case, the hydrodynamic response is evaluated through the chamber pressure p(t), the orifice flow rate Q(t), the mean pneumatic power Pe, the capture width ratio CWR, and the horizontal and vertical force amplitudes Fx and Fz.
For nondimensional interpretation, the tested periods correspond to ω2h/g = 7.95, 5.32, 3.81, 2.86, and 2.23, while kh = 7.95, 5.32, 3.81, 2.88, and 2.28 for T = 0.9, 1.1, 1.3, 1.5, and 1.7 s, respectively, based on the linear dispersion relation. These indicators show that the favorable geometry is linked to the relative wave period and wavelength rather than to the dimensional period alone. For the production mesh, the wave direction was resolved with approximately λx = 80 cells per wavelength, and the free-surface band was resolved with approximately Hz = 20 cells per wave height.
The mean pneumatic power over the selected stable stage time window [ts, te] is computed as
P e = 1 t e t s t s t e p ( t ) Q ( t ) d t
where p(t) denotes the chamber gauge pressure relative to atmospheric pressure and Q ( t ) = A o u n d A is the symmetry-corrected volumetric air flow rate through the orifice opening Ao. Unless otherwise stated, Pe in this paper denotes mean pneumatic power estimated from the chamber pressure–flow-rate product. It is therefore a hydrodynamic comparison metric rather than a full wave-to-wire electrical power prediction.
CWR = P e P w , P w = 1 8 ρ g H 2 C g B
where B = 0.50 m is the characteristic width, and Cg is the wave group velocity. Under linear wave theory, the group velocity is obtained from
C g = ω 2 k 1 + 2 k h sinh ( 2 k h ) , with ω 2 = g k tanh ( k h )
The horizontal and vertical hydrodynamic force histories acting on the OWC chamber were obtained by surface integration of pressure and viscous shear over the wetted solid surfaces of the chamber, including the inner and outer chamber walls and the submerged front/rear wall surfaces exposed to water. The symmetry plane was not treated as a physical load-bearing wall, and the reported full-device values were obtained by applying the symmetry correction described below. To characterize the oscillatory load level, the force amplitudes were defined using the half range over the selected stable window.
The monitored wave and velocity fields around the OWC are local total fields, consisting of the imposed incident wave together with diffraction, chamber-induced radiation-like response, and residual reflected components generated by the fixed chamber. Because a constant water depth and a flat bottom are used, bathymetric refraction is not considered in the present numerical wave tank. The velocity field is solved throughout the water domain, not only along the free surface; therefore, the subsurface wave motion and chamber-entrance exchange are included in the CFD solution. The inlet and outlet forcing zones were used to reduce end reflections, so the reported chamber responses should be interpreted as the local response to the imposed regular incident wave rather than as a pure incident-wave record at every monitoring point.
F x = F x , max F x , min 2 , F z = F z , max F z , min 2
When symmetry was employed in the production simulations, the reported Fx, Fz, and Q were converted to full device values through symmetry correction. The average pneumatic power Pe was therefore calculated from the full-device pressure–flow-rate product within the same stable interval. The wave conditions, nondimensional wave indicators, and mesh resolution indicators used in the production simulations are summarized in Table 2.

2.3. Computational Setup and Discretization

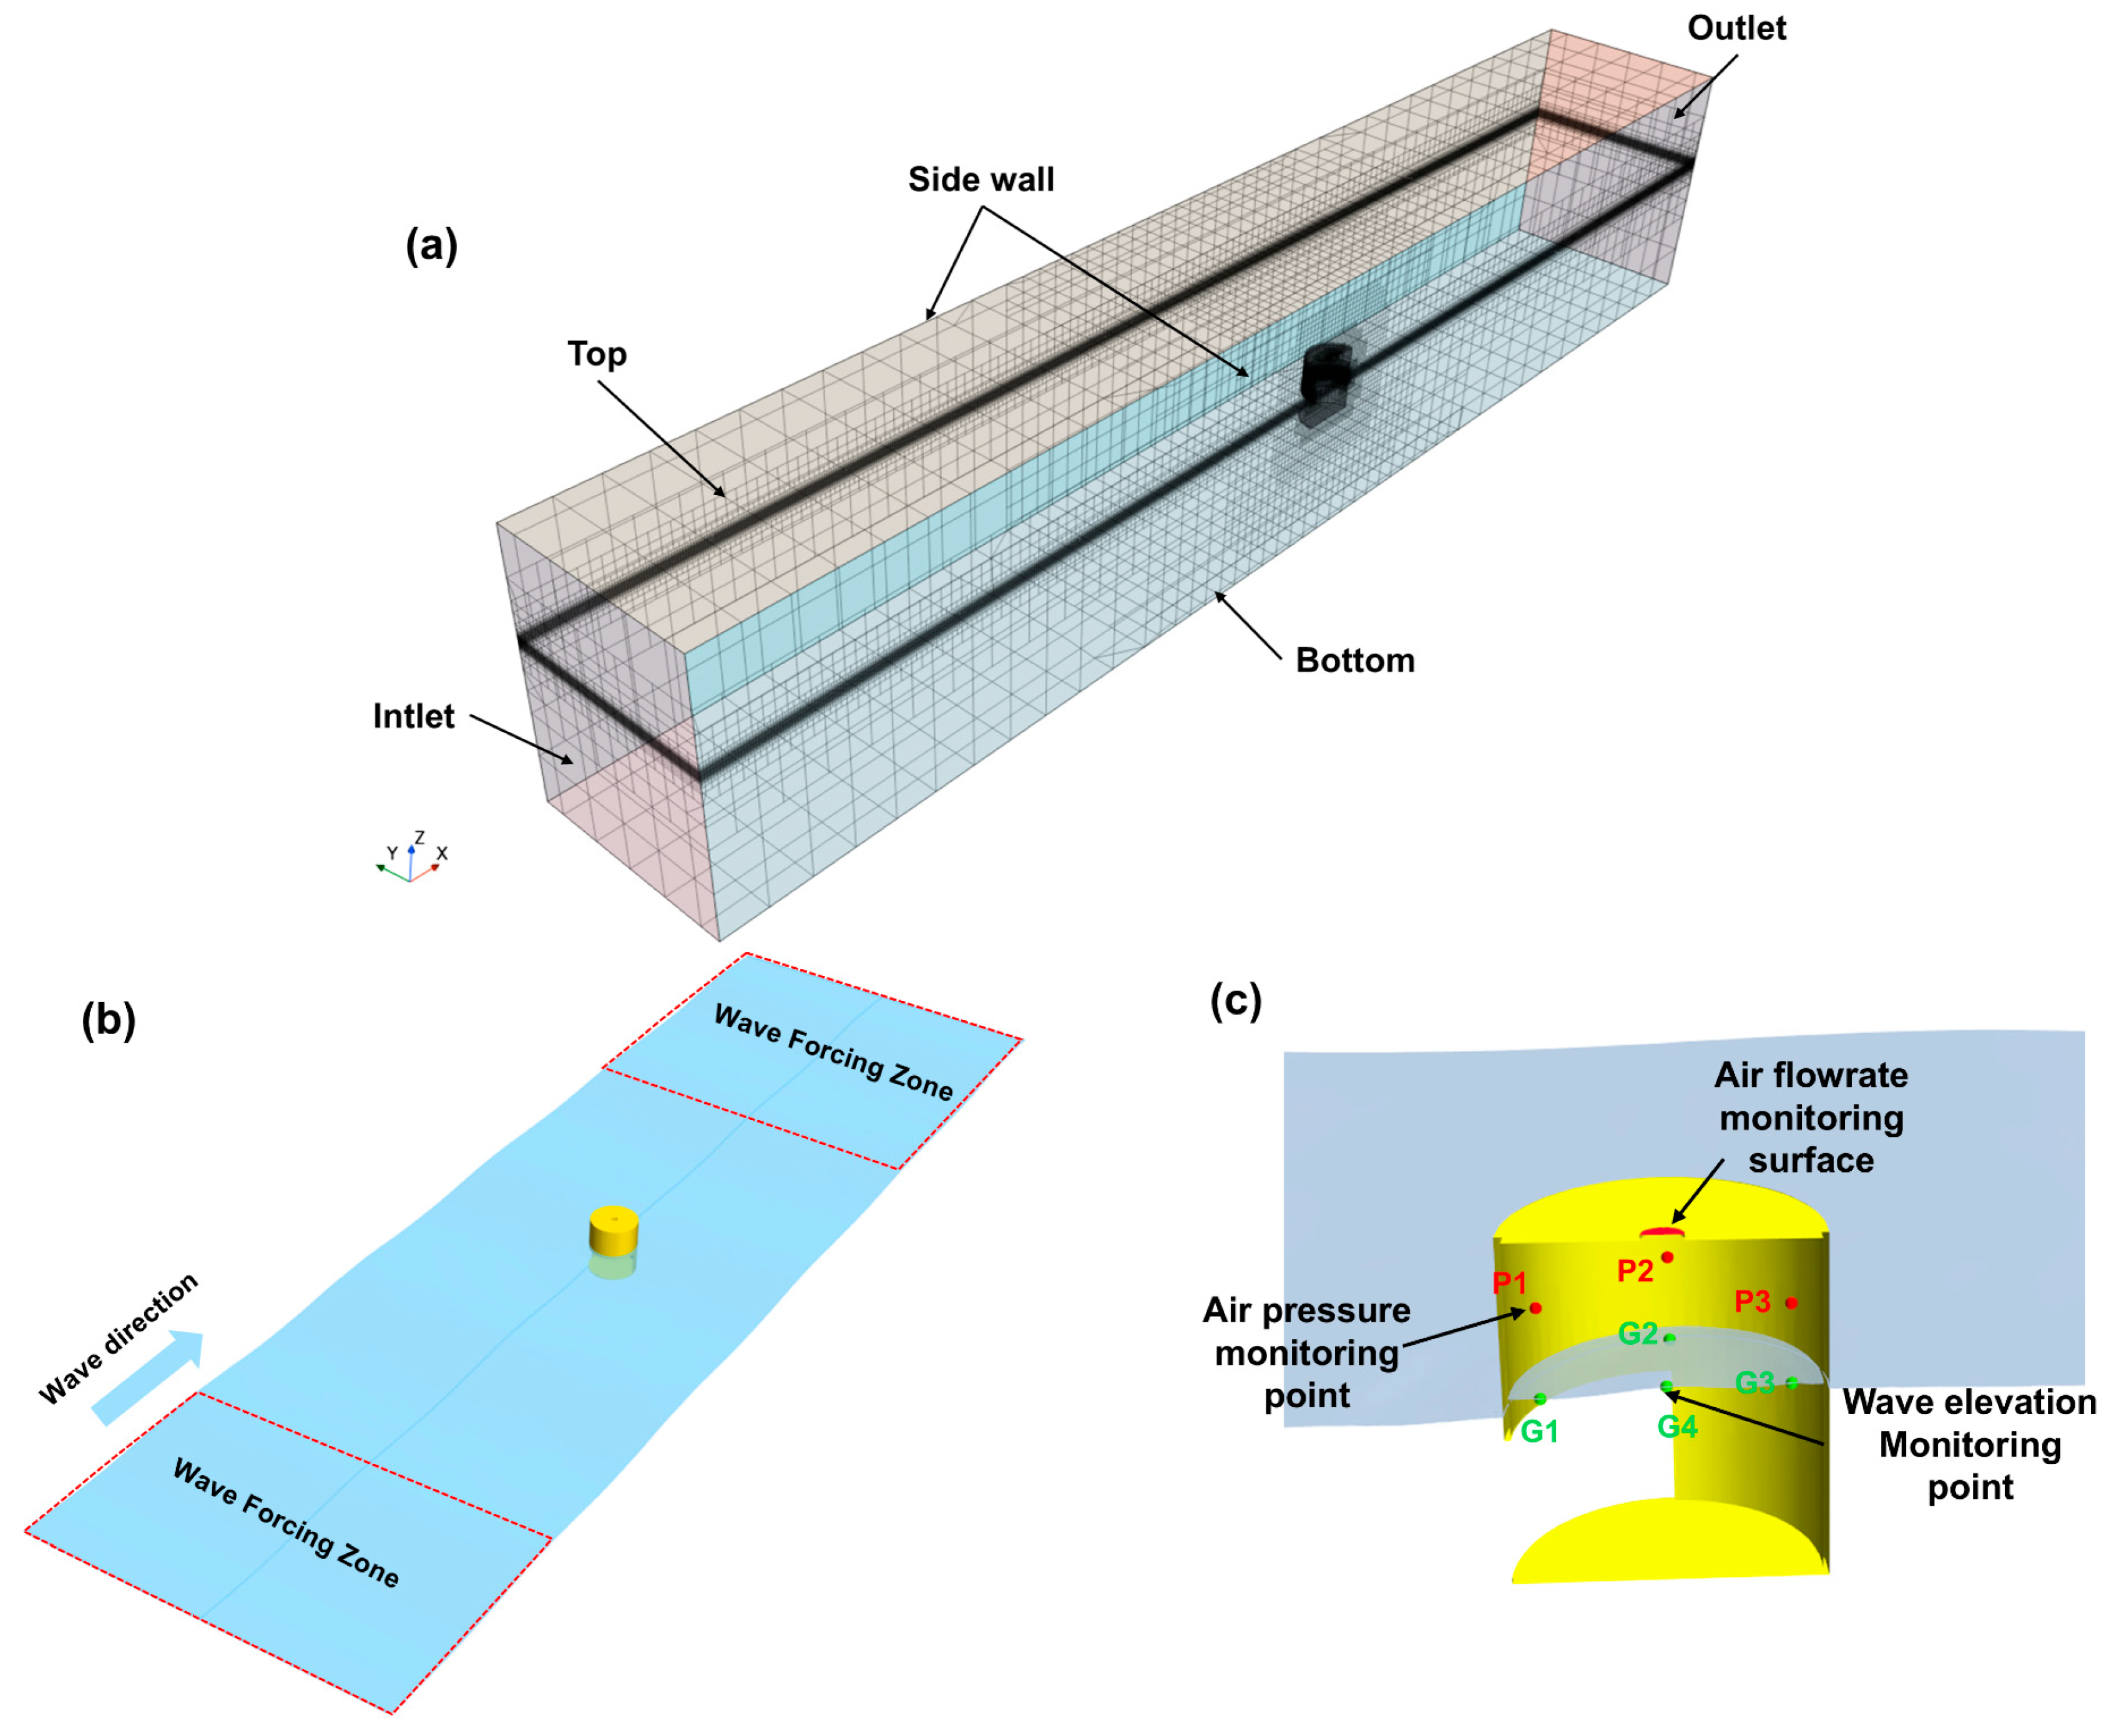
Whereas Figure 4 defines the local geometric parameters, Figure 5 summarizes the numerical wave tank, boundary conditions, and monitor arrangement. The computational domain is 14 m long in the wave propagation direction, 2 m wide in the transverse direction, and 2.5 m high. The still-water depth is 1.6 m, leaving a 1.0 m air region above the free surface. A Cartesian coordinate system is used, with the origin located at the center of the OWC chamber on the still-water level. The x-axis is aligned with the wave-propagation direction, the y-axis denotes the transverse direction, and the z-axis is positive upward, with z = 0 corresponding to the still-water level. The inlet and outlet boundaries were defined as velocity-inlet boundaries, and regular-wave kinematics were imposed through the built-in STAR-CCM+ wave-forcing zones. A 3 m forcing zone was arranged at both the inlet and the outlet, so that incident waves could be generated while end reflections were attenuated within the same numerical wave tank framework. The top boundary was set as a pressure outlet to allow air exchange, the bottom boundary and solid OWC surfaces were specified as walls, and the lateral boundaries were treated as symmetry planes. Forcing-zone approaches are widely used in CFD numerical wave tanks for wave generation and absorption [42,46,47,48].
The monitor layout adopted in the present chamber is shown in Figure 4c. Four wave gauges G1–G4 were located on the still water surface at (0.2, 0, 0), (0, 0.2, 0), (−0.2, 0, 0), and (0, 0, 0), with the coordinate origin at the chamber center and z = 0 at the still water level. Three pressure probes P1–P3 were placed at the same x-y locations except the center point, namely (0.2, 0, 0.18), (0, 0.2, 0.18) and (−0.2, 0, 0.18). The volumetric air flow rate Q was obtained by surface integration over the orifice monitoring section. As a half-domain model was employed under symmetry conditions, Q, Fx, and Fz were converted to full device values during post-processing.
Trimmed cells were used throughout the domain, with local refinement in the free-surface band, around the chamber walls, at the submerged opening, near the orifice section, and inside the wave-forcing zones. The free-surface refinement band extended approximately one wave height above and below the still-water level. The mesh resolution was selected so that the vertical direction contained about 40 cells per wave height near the free surface, the wave-propagation direction contained about 80 cells per wavelength, and the transverse cell size was approximately one quarter of the streamwise cell size in the locally refined region. This resolution strategy follows the common numerical-wave-tank practice of concentrating cells around the air-water interface and the device, where interface sharpness, pressure-flow phase, and chamber exchange are most sensitive [35,36,45].
For the validation and convergence analyses, three systematically refined meshes were considered, with background base sizes of 0.57, 0.40, and 0.28 m. The local refinement ratios were preserved across the three grids so that the comparison reflects discretization sensitivity rather than a change in mesh topology. A constant time step of Δt = 0.005 s was used in the production runs after a separate sensitivity check. Chamber free-surface elevations, pressure, and orifice flow rate were extracted from the monitoring points and surface described above. The same stable-stage definition was used in all cases so that comparisons of Pe, CWR, Fx, and Fz were not affected by inconsistent sampling windows.
The present numerical model corresponds to a 1:35 reduced-scale OWC configuration. Since the chamber response is mainly governed by free-surface gravity-wave effects, Froude similarity provides the primary basis for scaling the present dimensionless trends to prototype conditions. Reynolds-number effects and local viscous dissipation near the chamber opening may vary with scale, but the comparative trends of chamber geometry, wave period, and front-wall draft are still useful for prototype-scale design screening.

3. Mesh Convergence and Validation

3.1. Mesh Convergence

A separate mesh-convergence analysis was carried out for the cylindrical validation case. Three systematically refined meshes were considered, with background base sizes of 0.57, 0.40, and 0.28 m. The local refinement ratios were preserved across the three grids so that the comparison reflected discretization sensitivity rather than a change in mesh topology. A constant time step of Δt = 0.005 s was used in this analysis, consistent with the production simulations after the separate time-step sensitivity check. Chamber free-surface elevation and orifice flow rate were extracted from the monitoring locations and surface defined above. The same stable-stage definition was used in all cases so that the comparisons were not affected by inconsistent sampling windows.
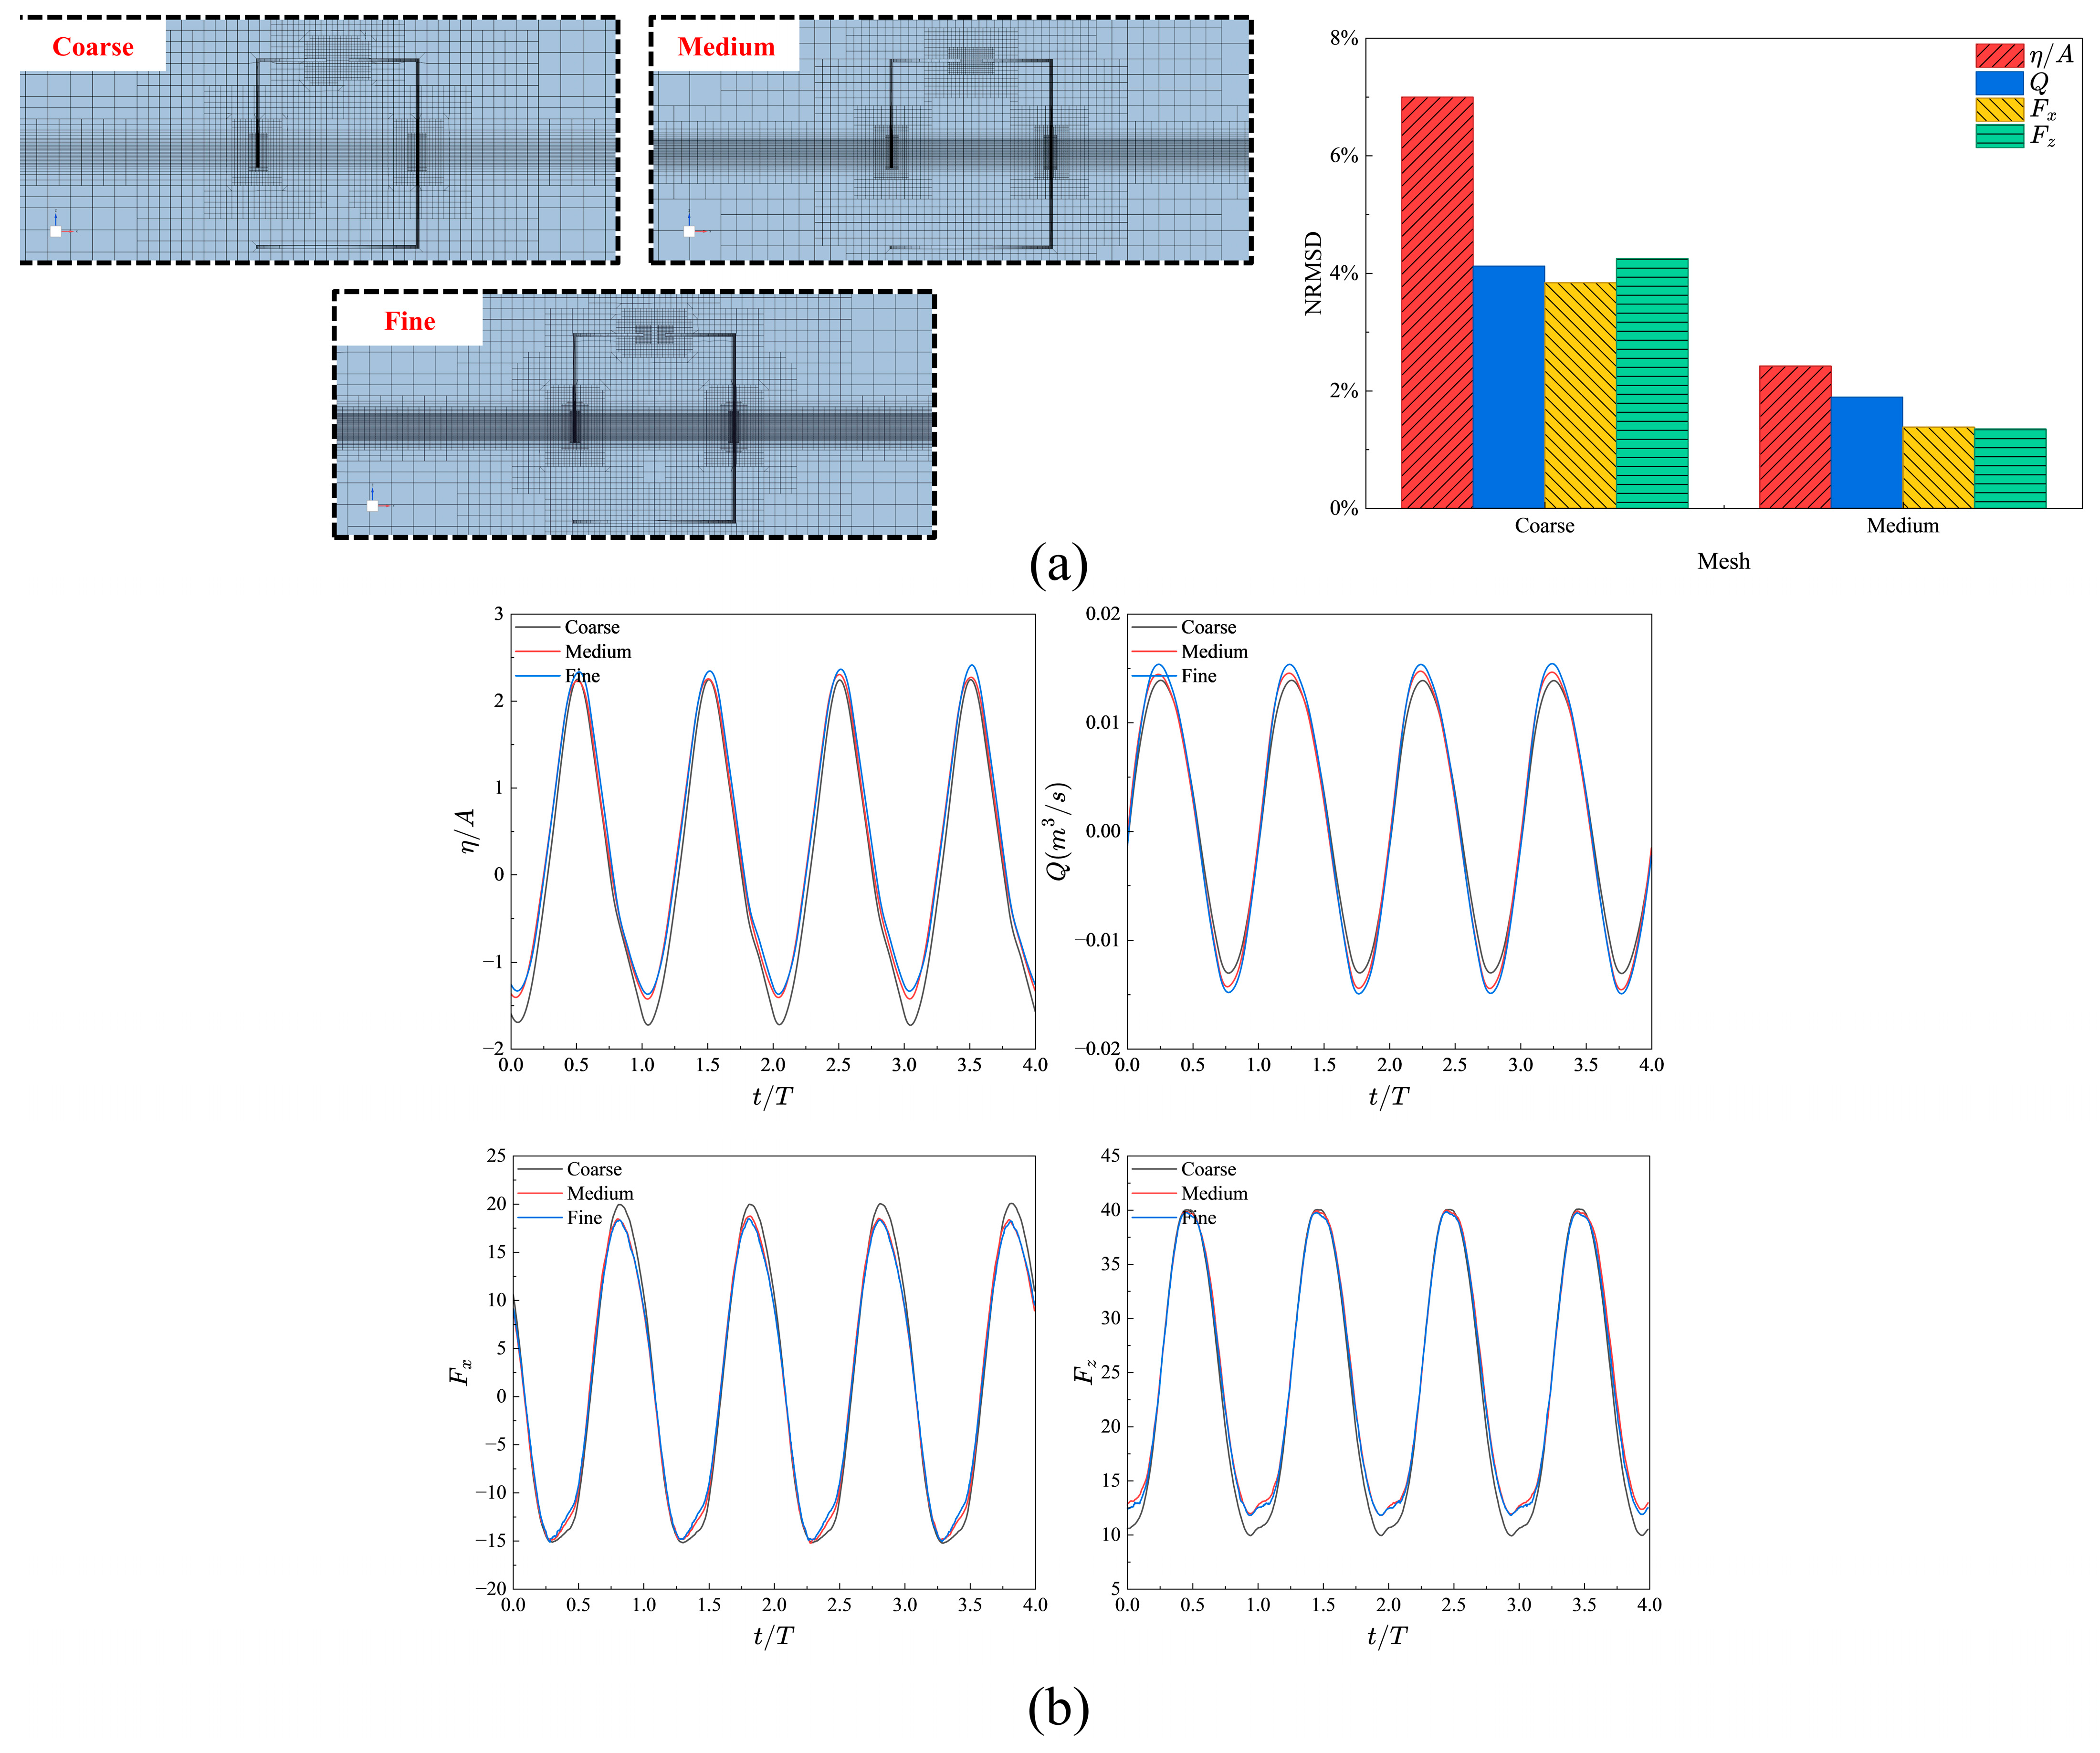
Figure 6 summarizes the mesh-convergence assessment. Figure 6a presents the coarse, medium, and fine mesh layouts together with the corresponding NRMSD comparison, while Figure 6b shows representative stable-stage time histories of the normalized chamber free-surface elevation and the symmetry-corrected chamber flow rate and integrated force components Fx and Fz. The three meshes exhibit the same overall response pattern, whereas the coarse mesh shows more noticeable deviations in both amplitude and phase. To quantify the mesh-induced deviation more clearly, the normalized root-mean-square deviation (NRMSD) was evaluated by taking the fine mesh as the reference solution.
NRMSD ( % ) = 1 N k = 1 N x k x k , ref 2 x ref , max x ref , min × 100 %
The corresponding NRMSD values of the coarse and medium meshes are 7.00% and 2.42% for the chamber free-surface elevation, and 4.12% and 1.89% for the symmetry-corrected chamber flow rate, respectively. These results indicate that the medium and fine grids are much closer to each other for both monitored quantities. Considering both numerical consistency and computational cost, the medium grid was adopted for the subsequent parametric study.
In addition to the free-surface elevation and orifice-flow histories, the integrated horizontal and vertical force amplitudes were checked using the same stable-stage window. These additional quantities showed the same practical convergence tendency: the coarse grid produced more visible phase and amplitude deviations, whereas the medium and fine grids gave close response levels. After phase alignment with the fine-mesh result, the NRMSD values of the coarse and medium meshes were 3.84% and 1.38% for Fx, and 4.25% and 1.35% for Fz, respectively. The NRMSD and the medium-to-fine differences in the key response amplitudes were used as practical mesh-convergence indicators for selecting the production grid.

3.2. Validation

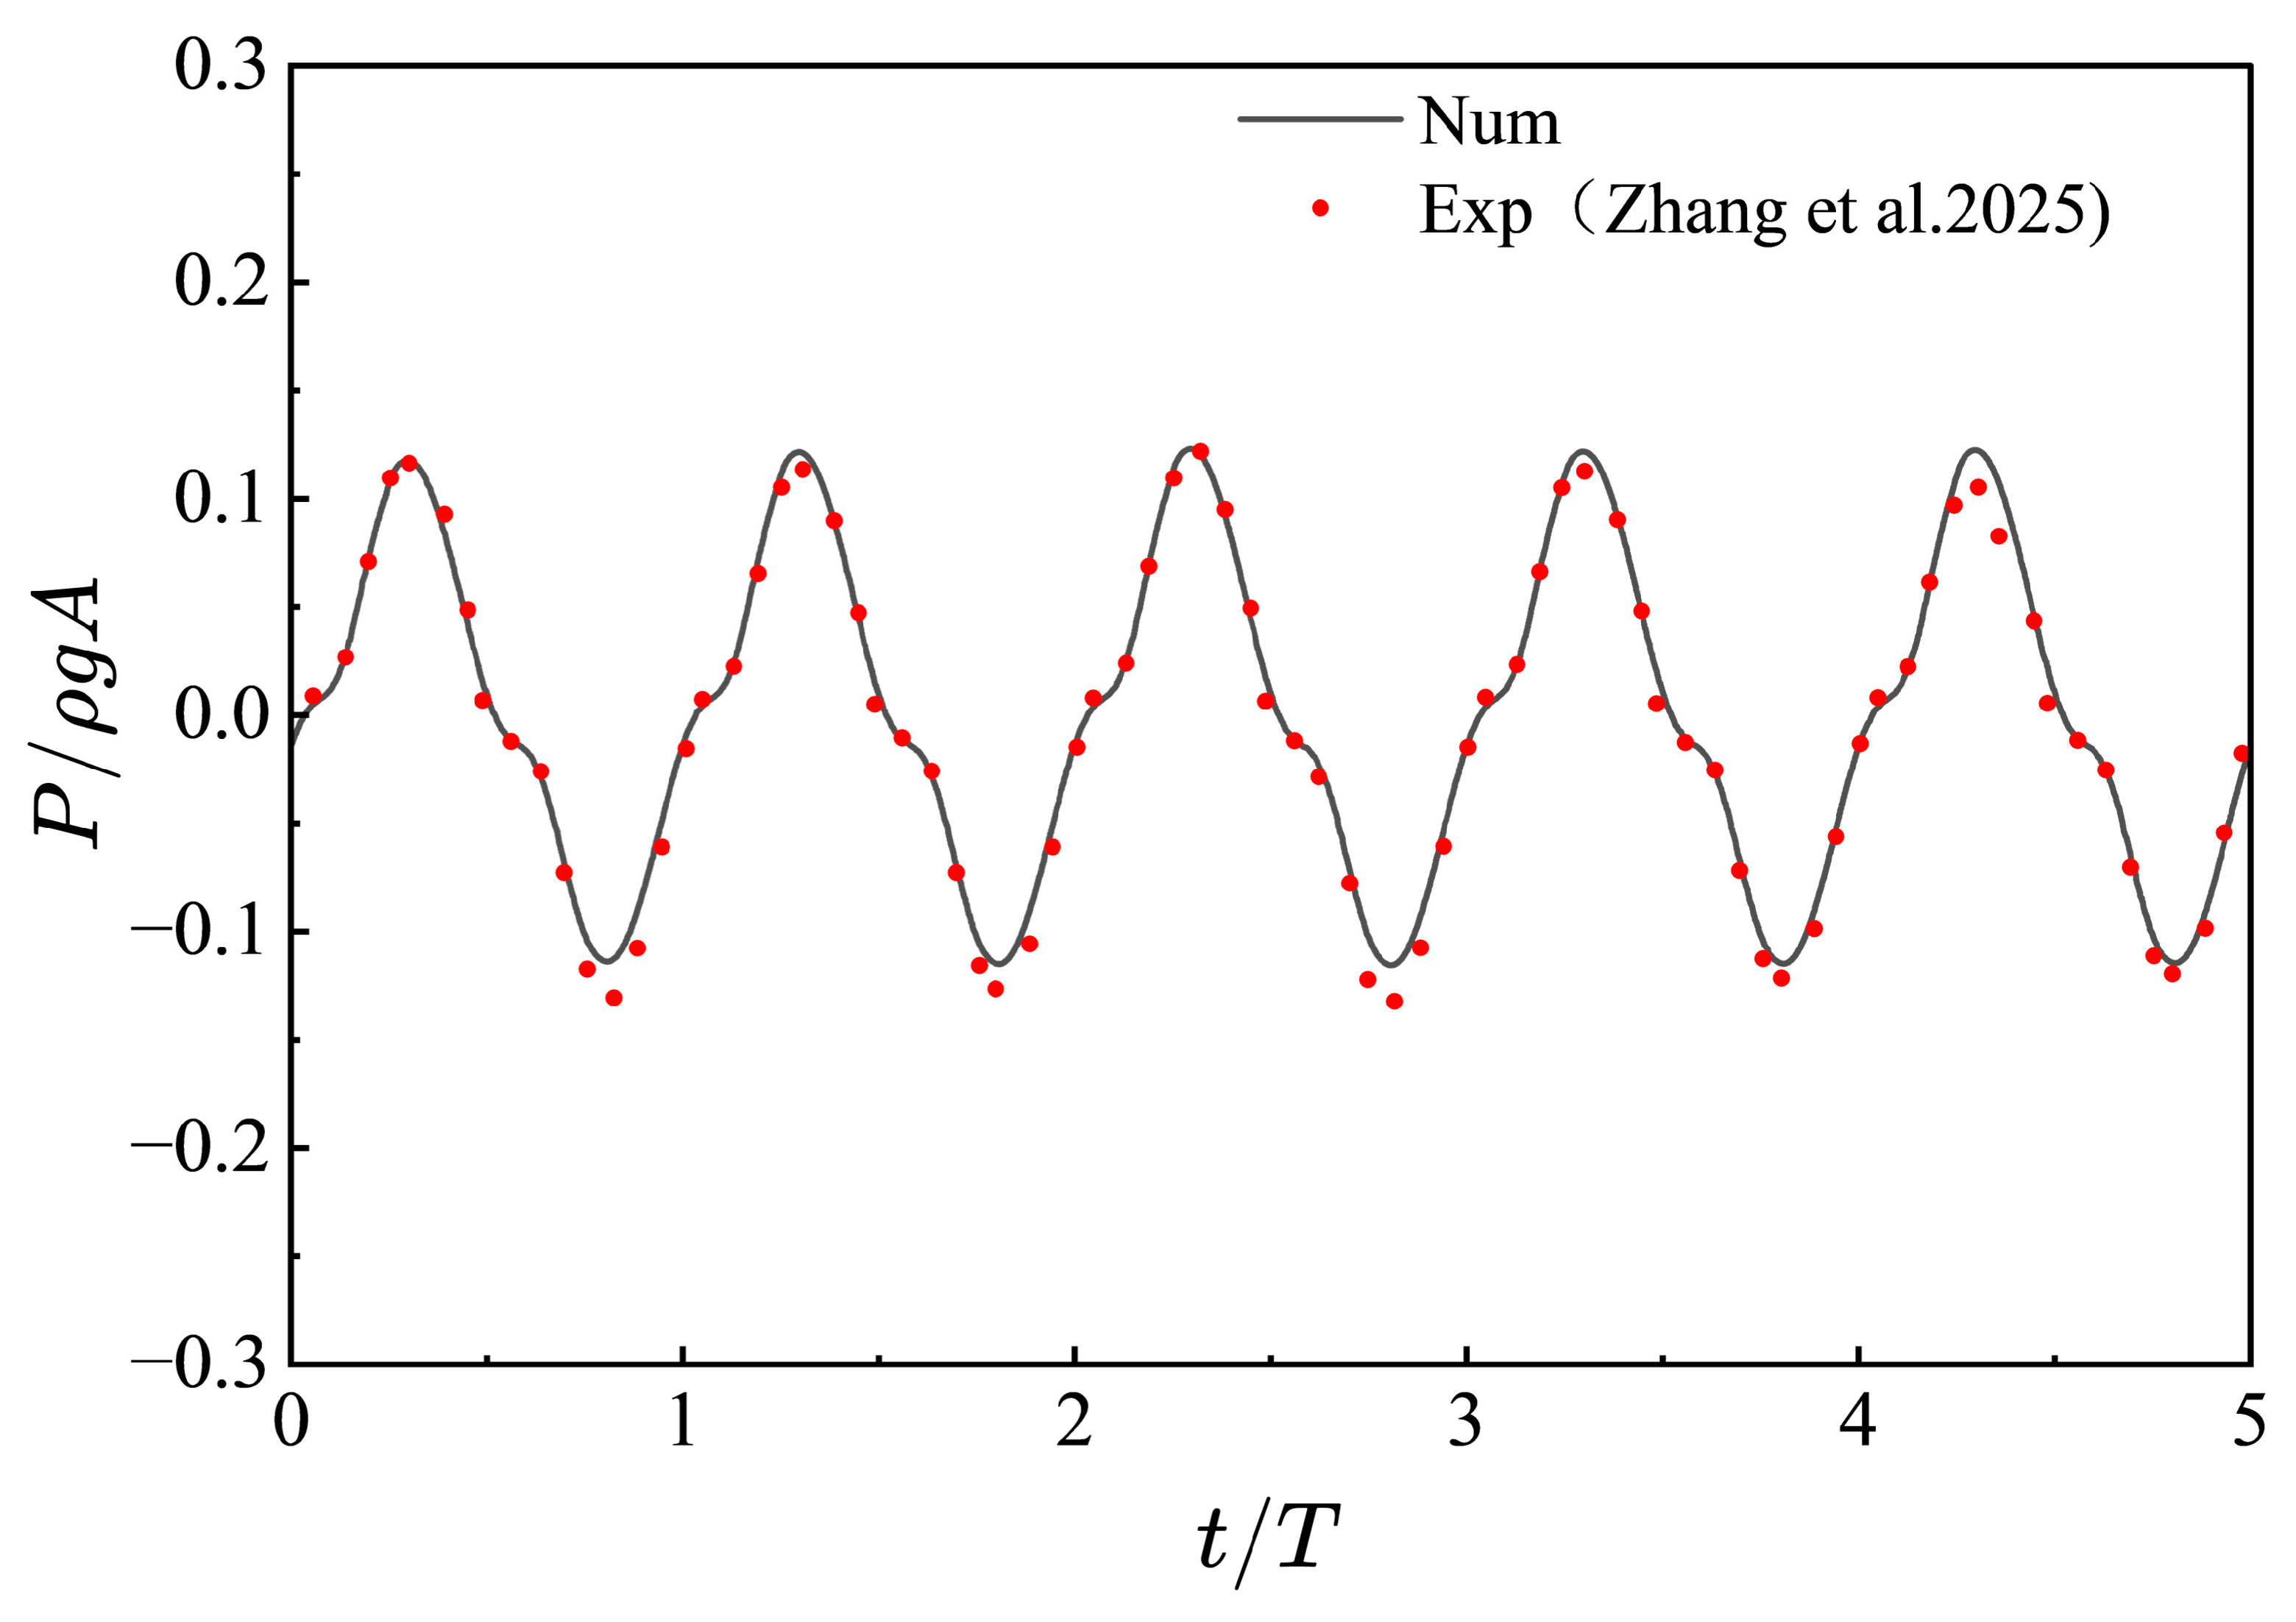
The numerical model was validated against the cylindrical open-sea OWC experiment reported by Zhang et al. [34]. In that study, a single-chamber cylindrical OWC was tested in a wave basin, and both the internal free-surface elevations and the chamber pressure were measured. These data provide suitable reference quantities for assessing whether the present CFD model can reproduce the water-column motion and pneumatic response of the OWC chamber.
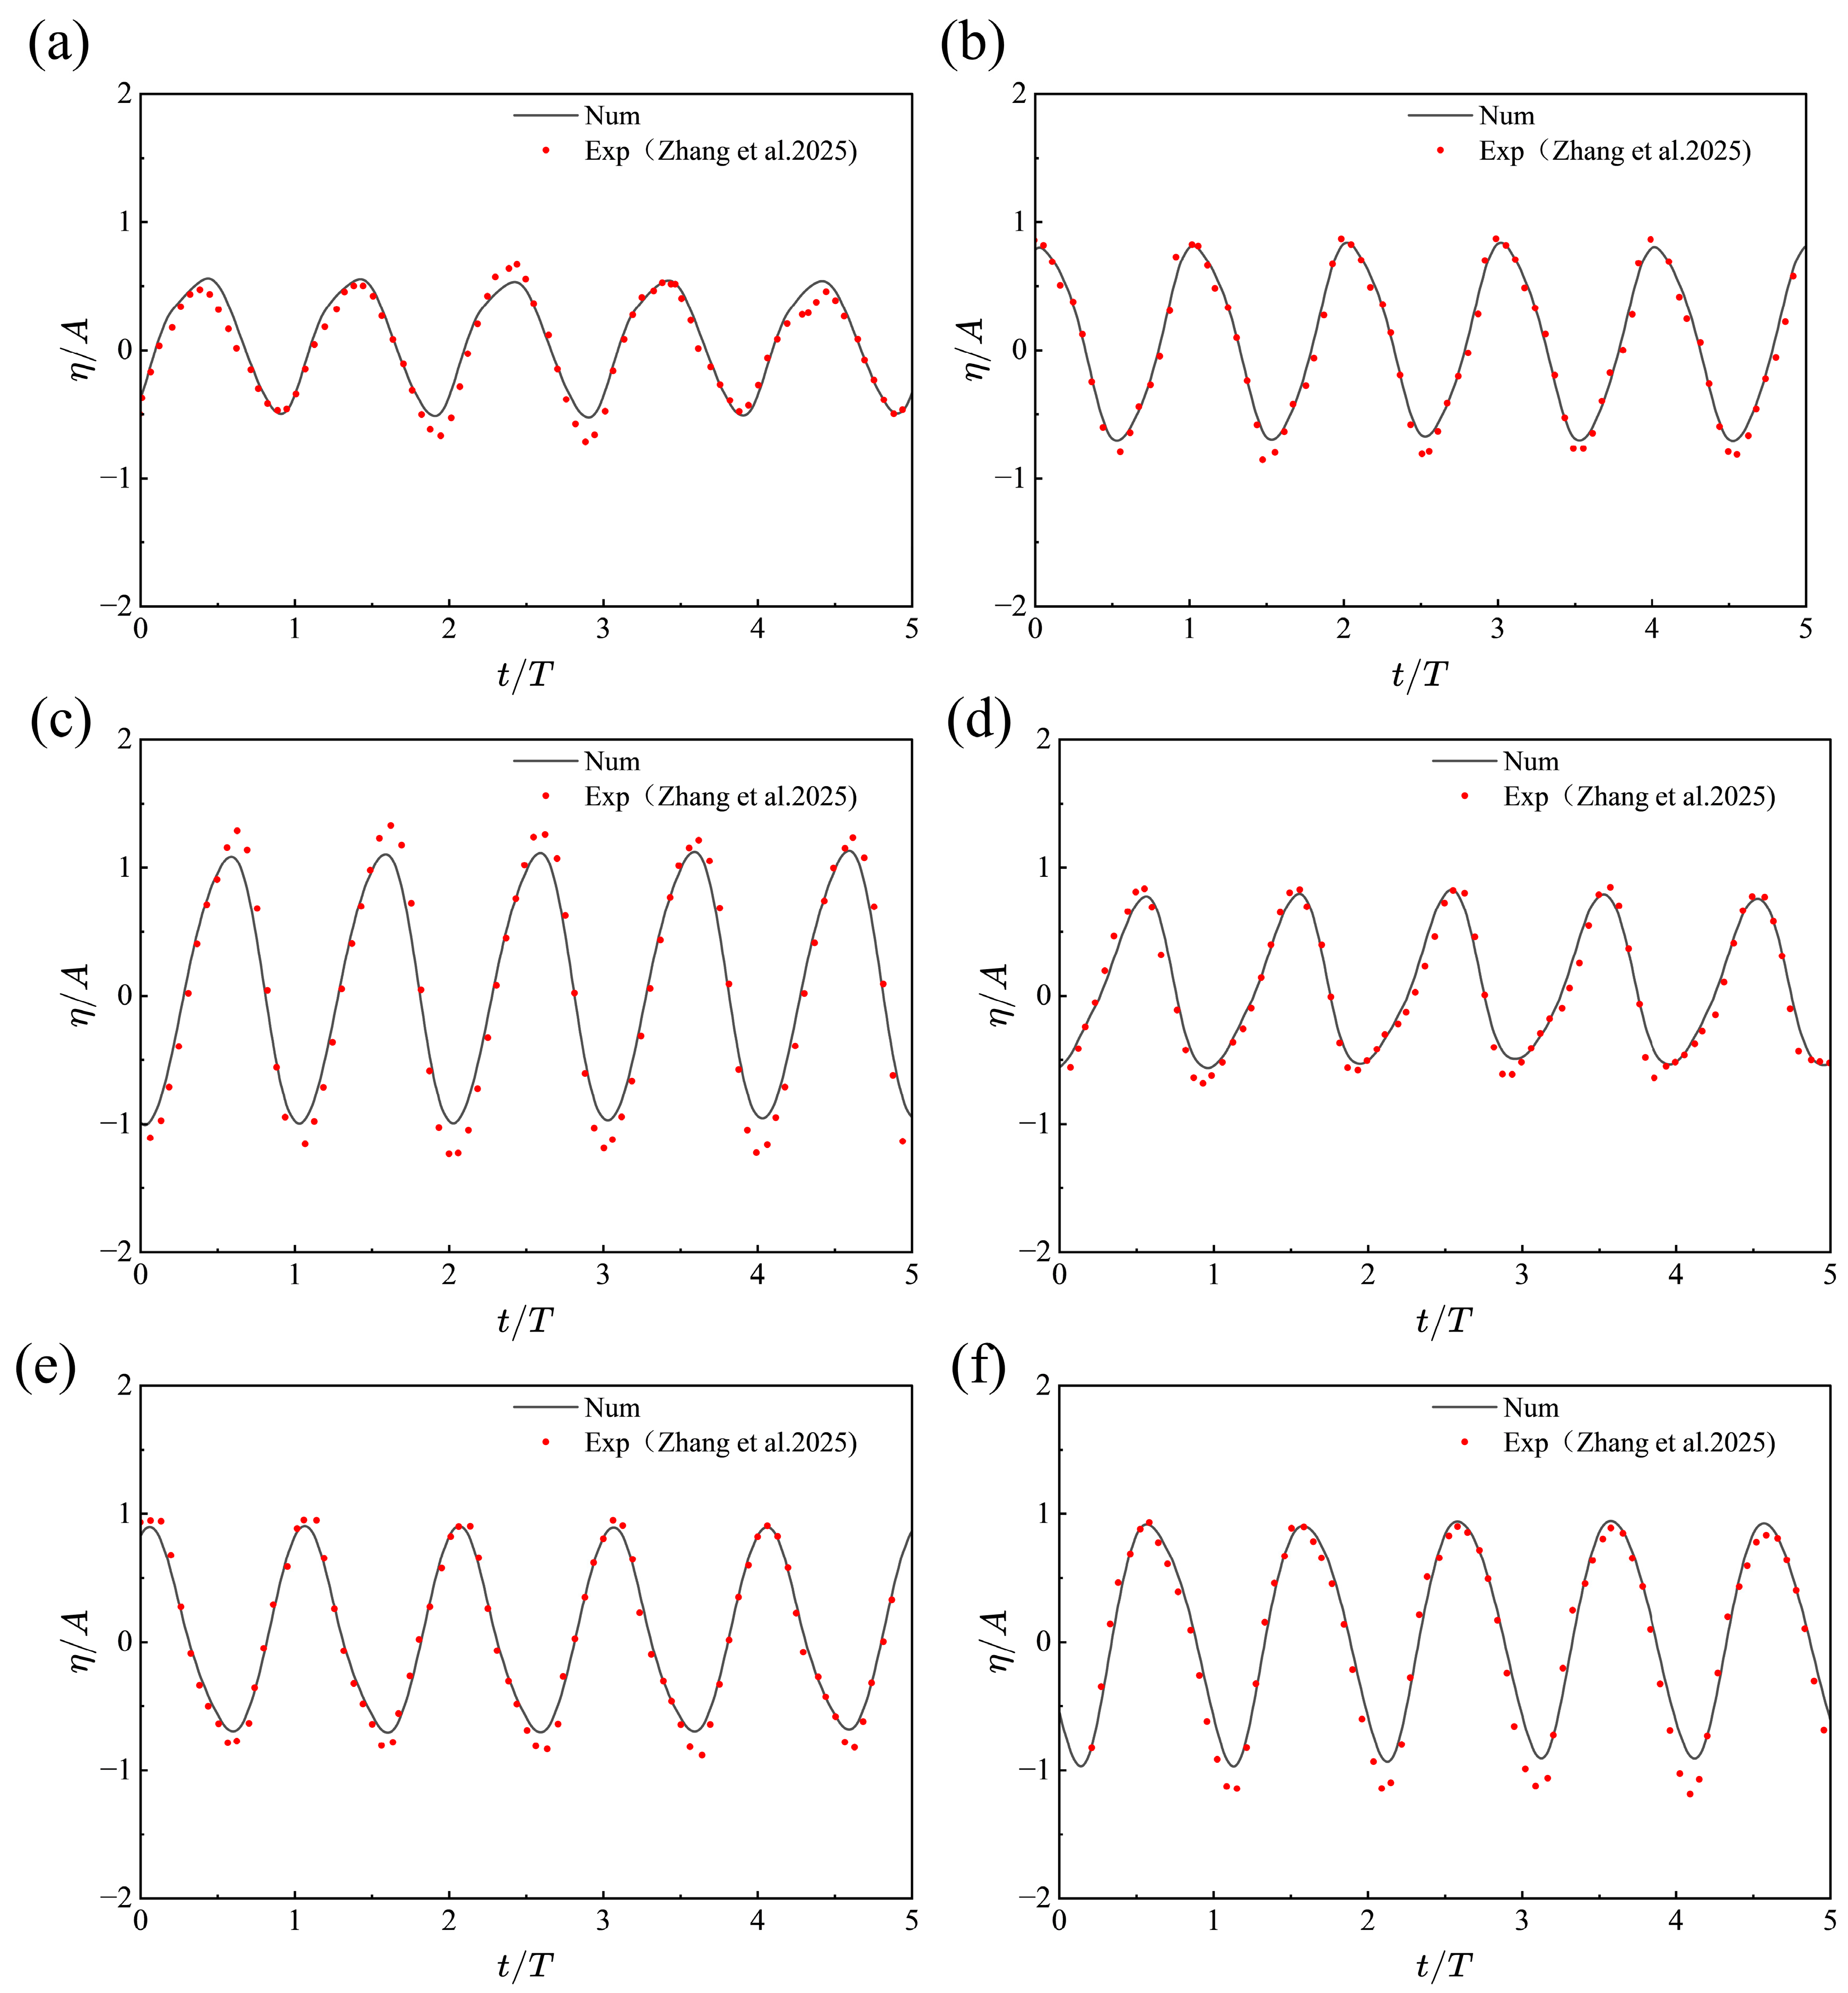
The geometry, wave conditions, and measurement layout in the validation simulation were set according to Zhang et al. [34]. Figure 7 and Figure 8 compare the simulated and experimental time histories of the internal wave gauges and chamber pressure. In general, the numerical results reproduce the principal phase and amplitude characteristics of the experimental records with satisfactory agreement. This confirms that the adopted CFD framework is able to capture the dominant response behavior of the cylindrical OWC and is therefore suitable for the subsequent comparative geometry analysis.
It should be noted that the validation case was reproduced according to the cylindrical OWC experiment of Zhang et al. [34]. The purpose of this validation is to confirm that the present CFD model can capture the main water-column oscillation and chamber-pressure response of a cylindrical OWC. After validation, the same numerical framework, mesh strategy, boundary conditions, and post-processing definitions were applied to the comparative calculations of the cylindrical, sandglass-shaped, bottle-shaped, and locally modified OWC chambers. Therefore, the validation should be regarded as a model-level verification for the OWC hydrodynamic and pneumatic response, rather than a direct prototype-to-prototype comparison for all geometries investigated in the parametric study.

4. Results and Discussion

The results are discussed from the baseline chamber comparison to the local geometric parameters. Section 4.1 compares the three baseline chamber configurations, Section 4.2 examines D2 as a local modification of the cylindrical reference, and Section 4.3 evaluates d2 within the D2 = 0.18 configuration set. This sequence separates changes in the overall response category from local contraction effects and from entrance-depth response suppression.

4.1. Power–Load Performance of the Baseline Chamber Geometries

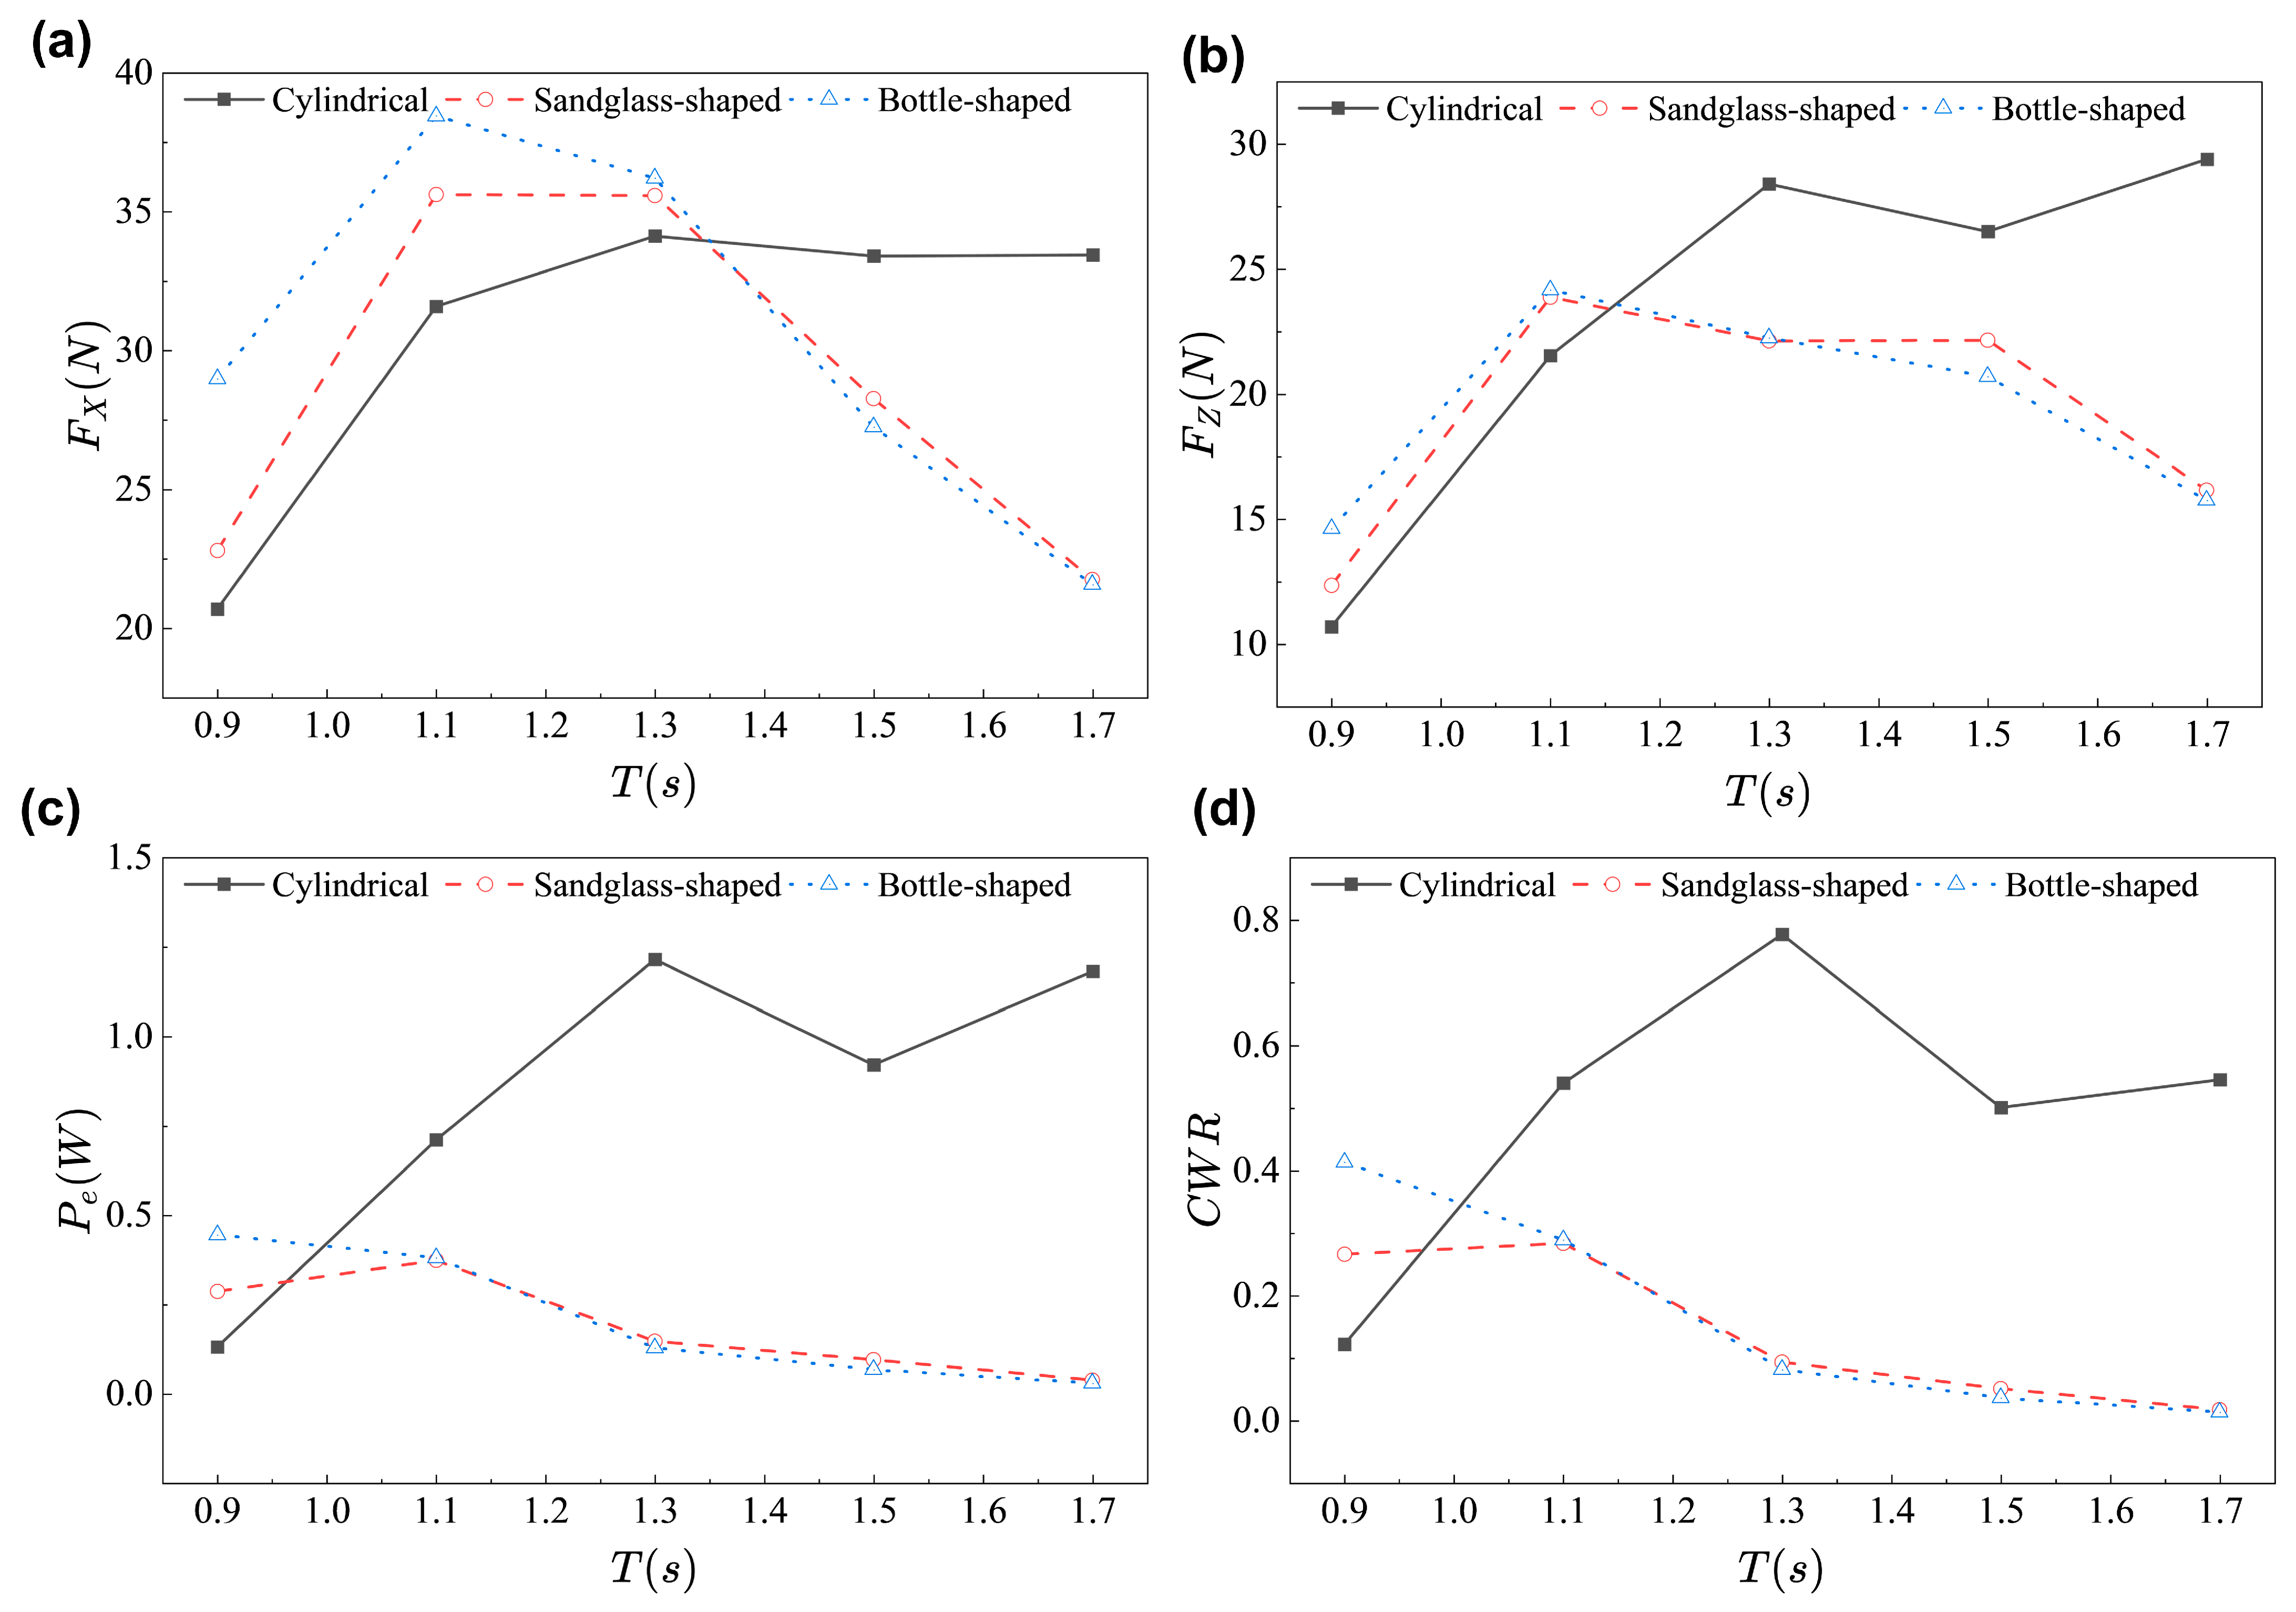
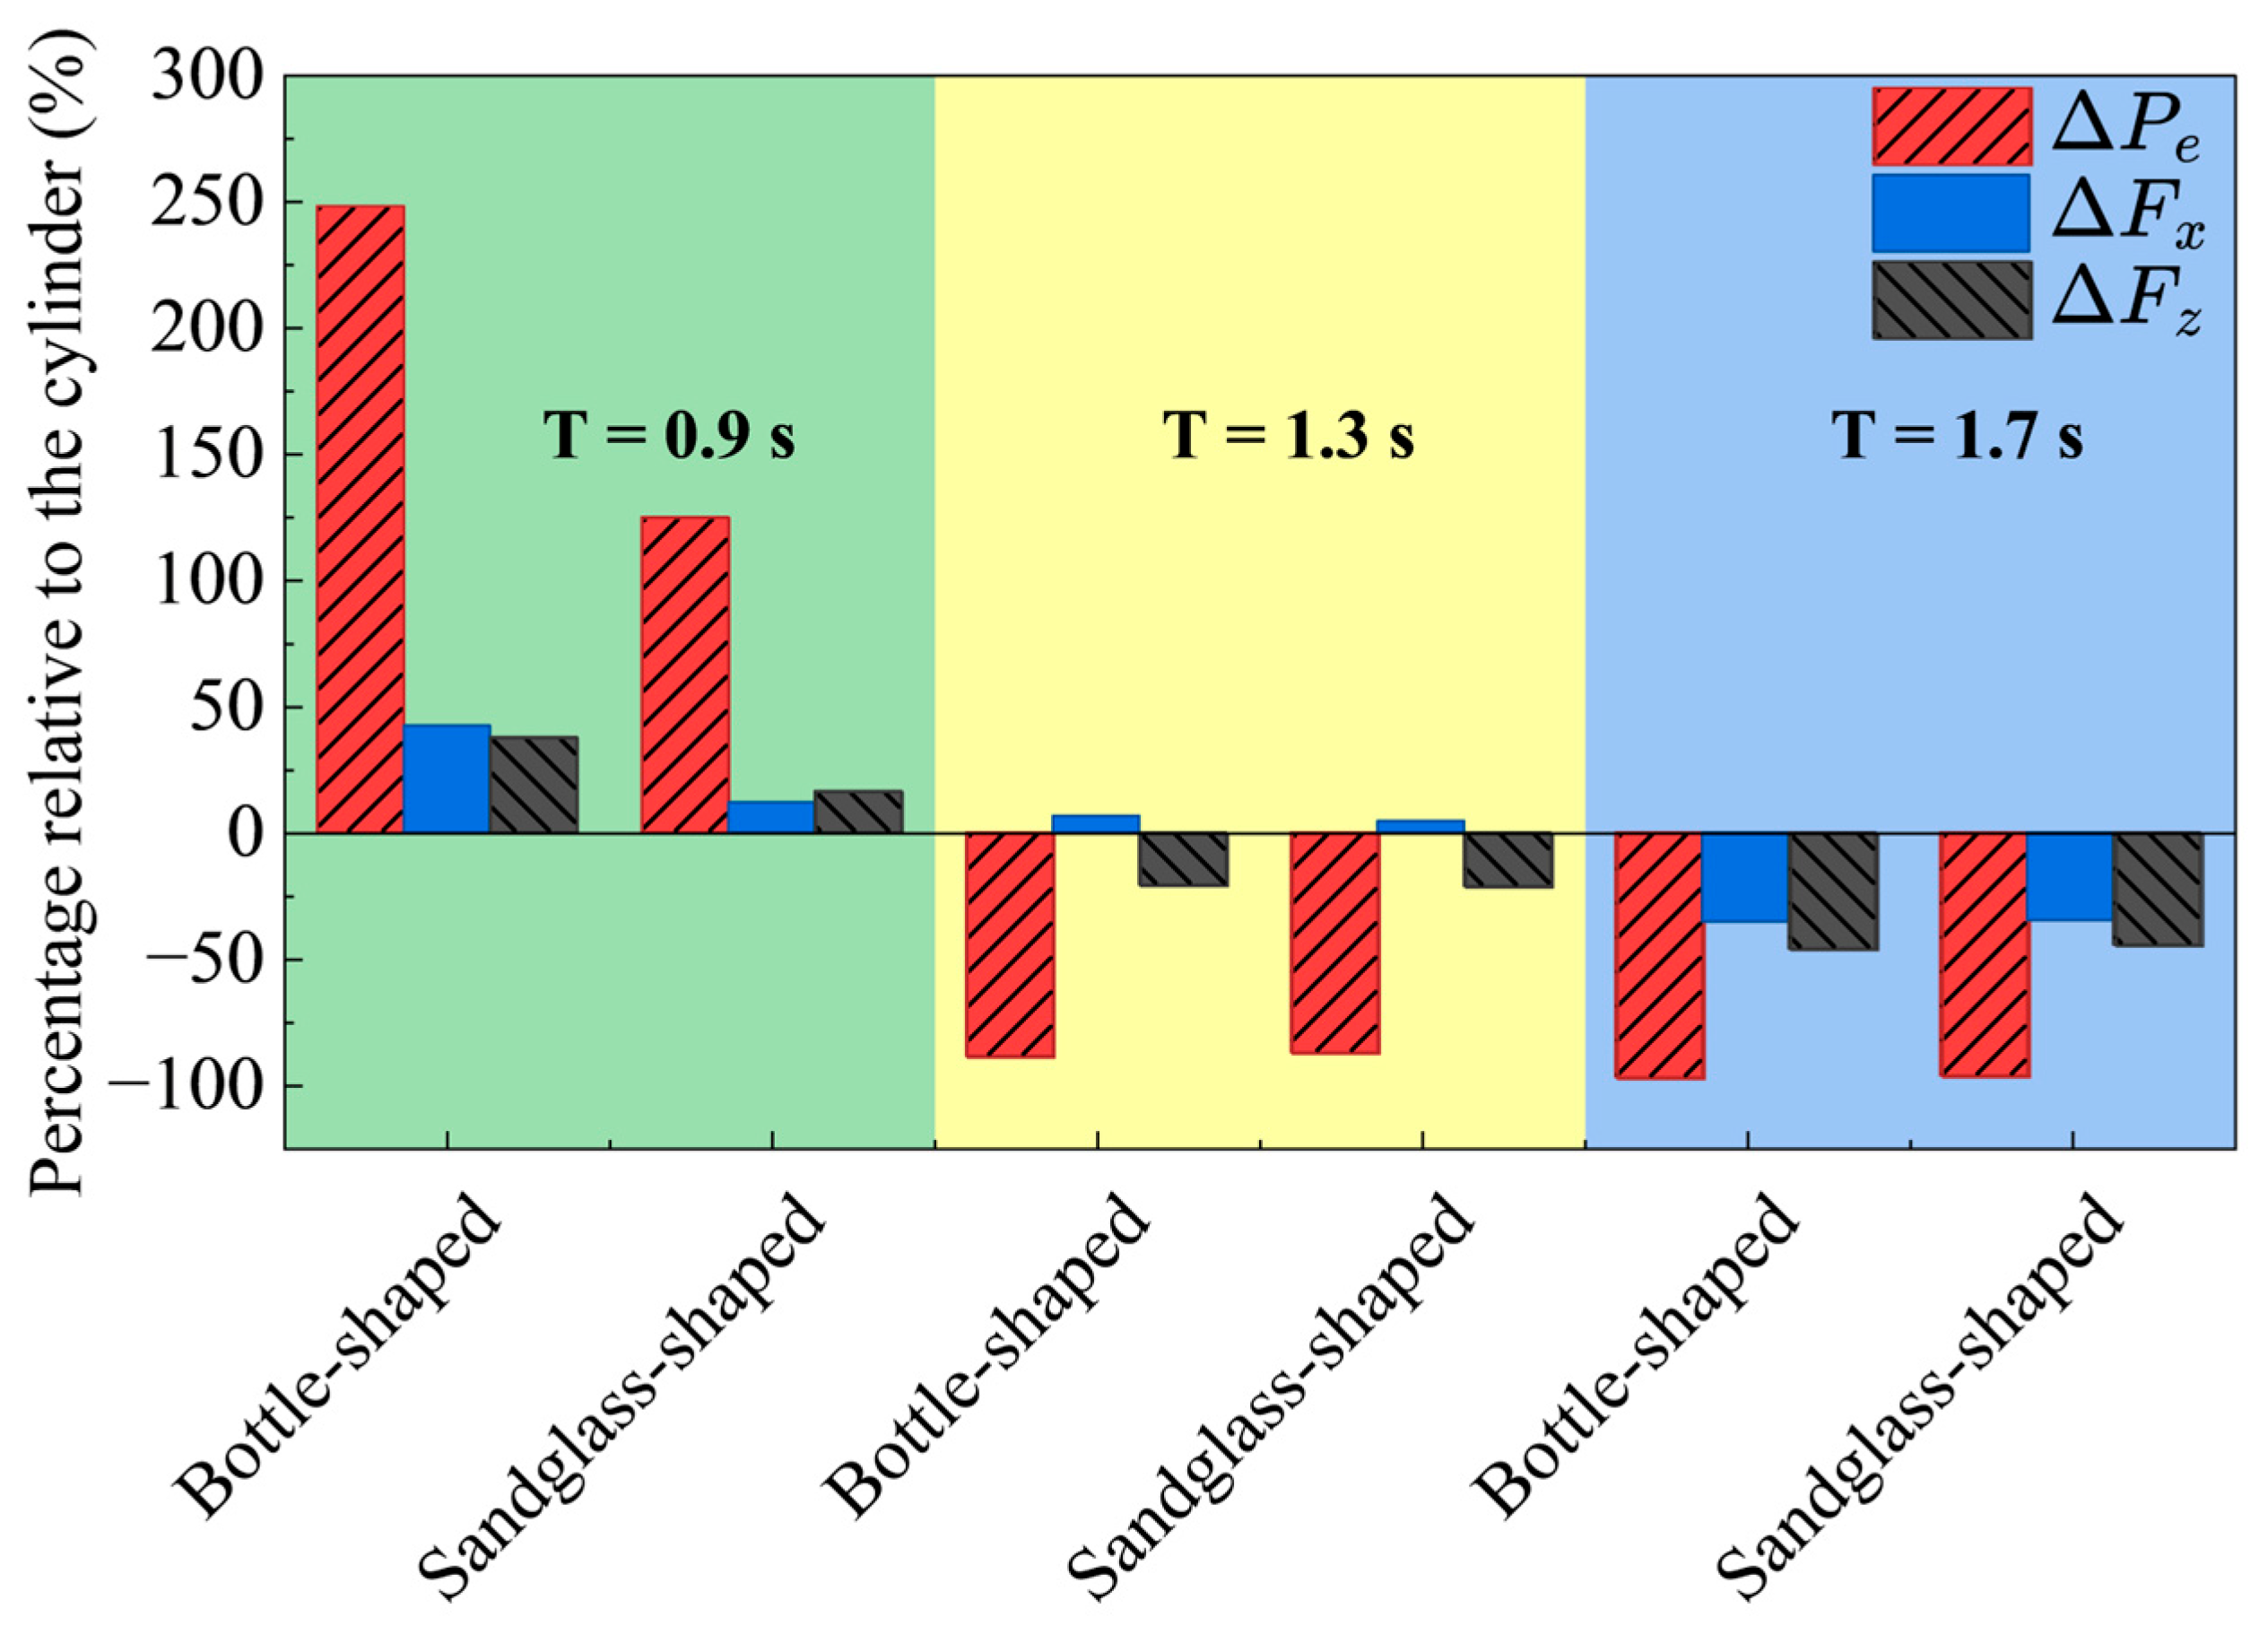
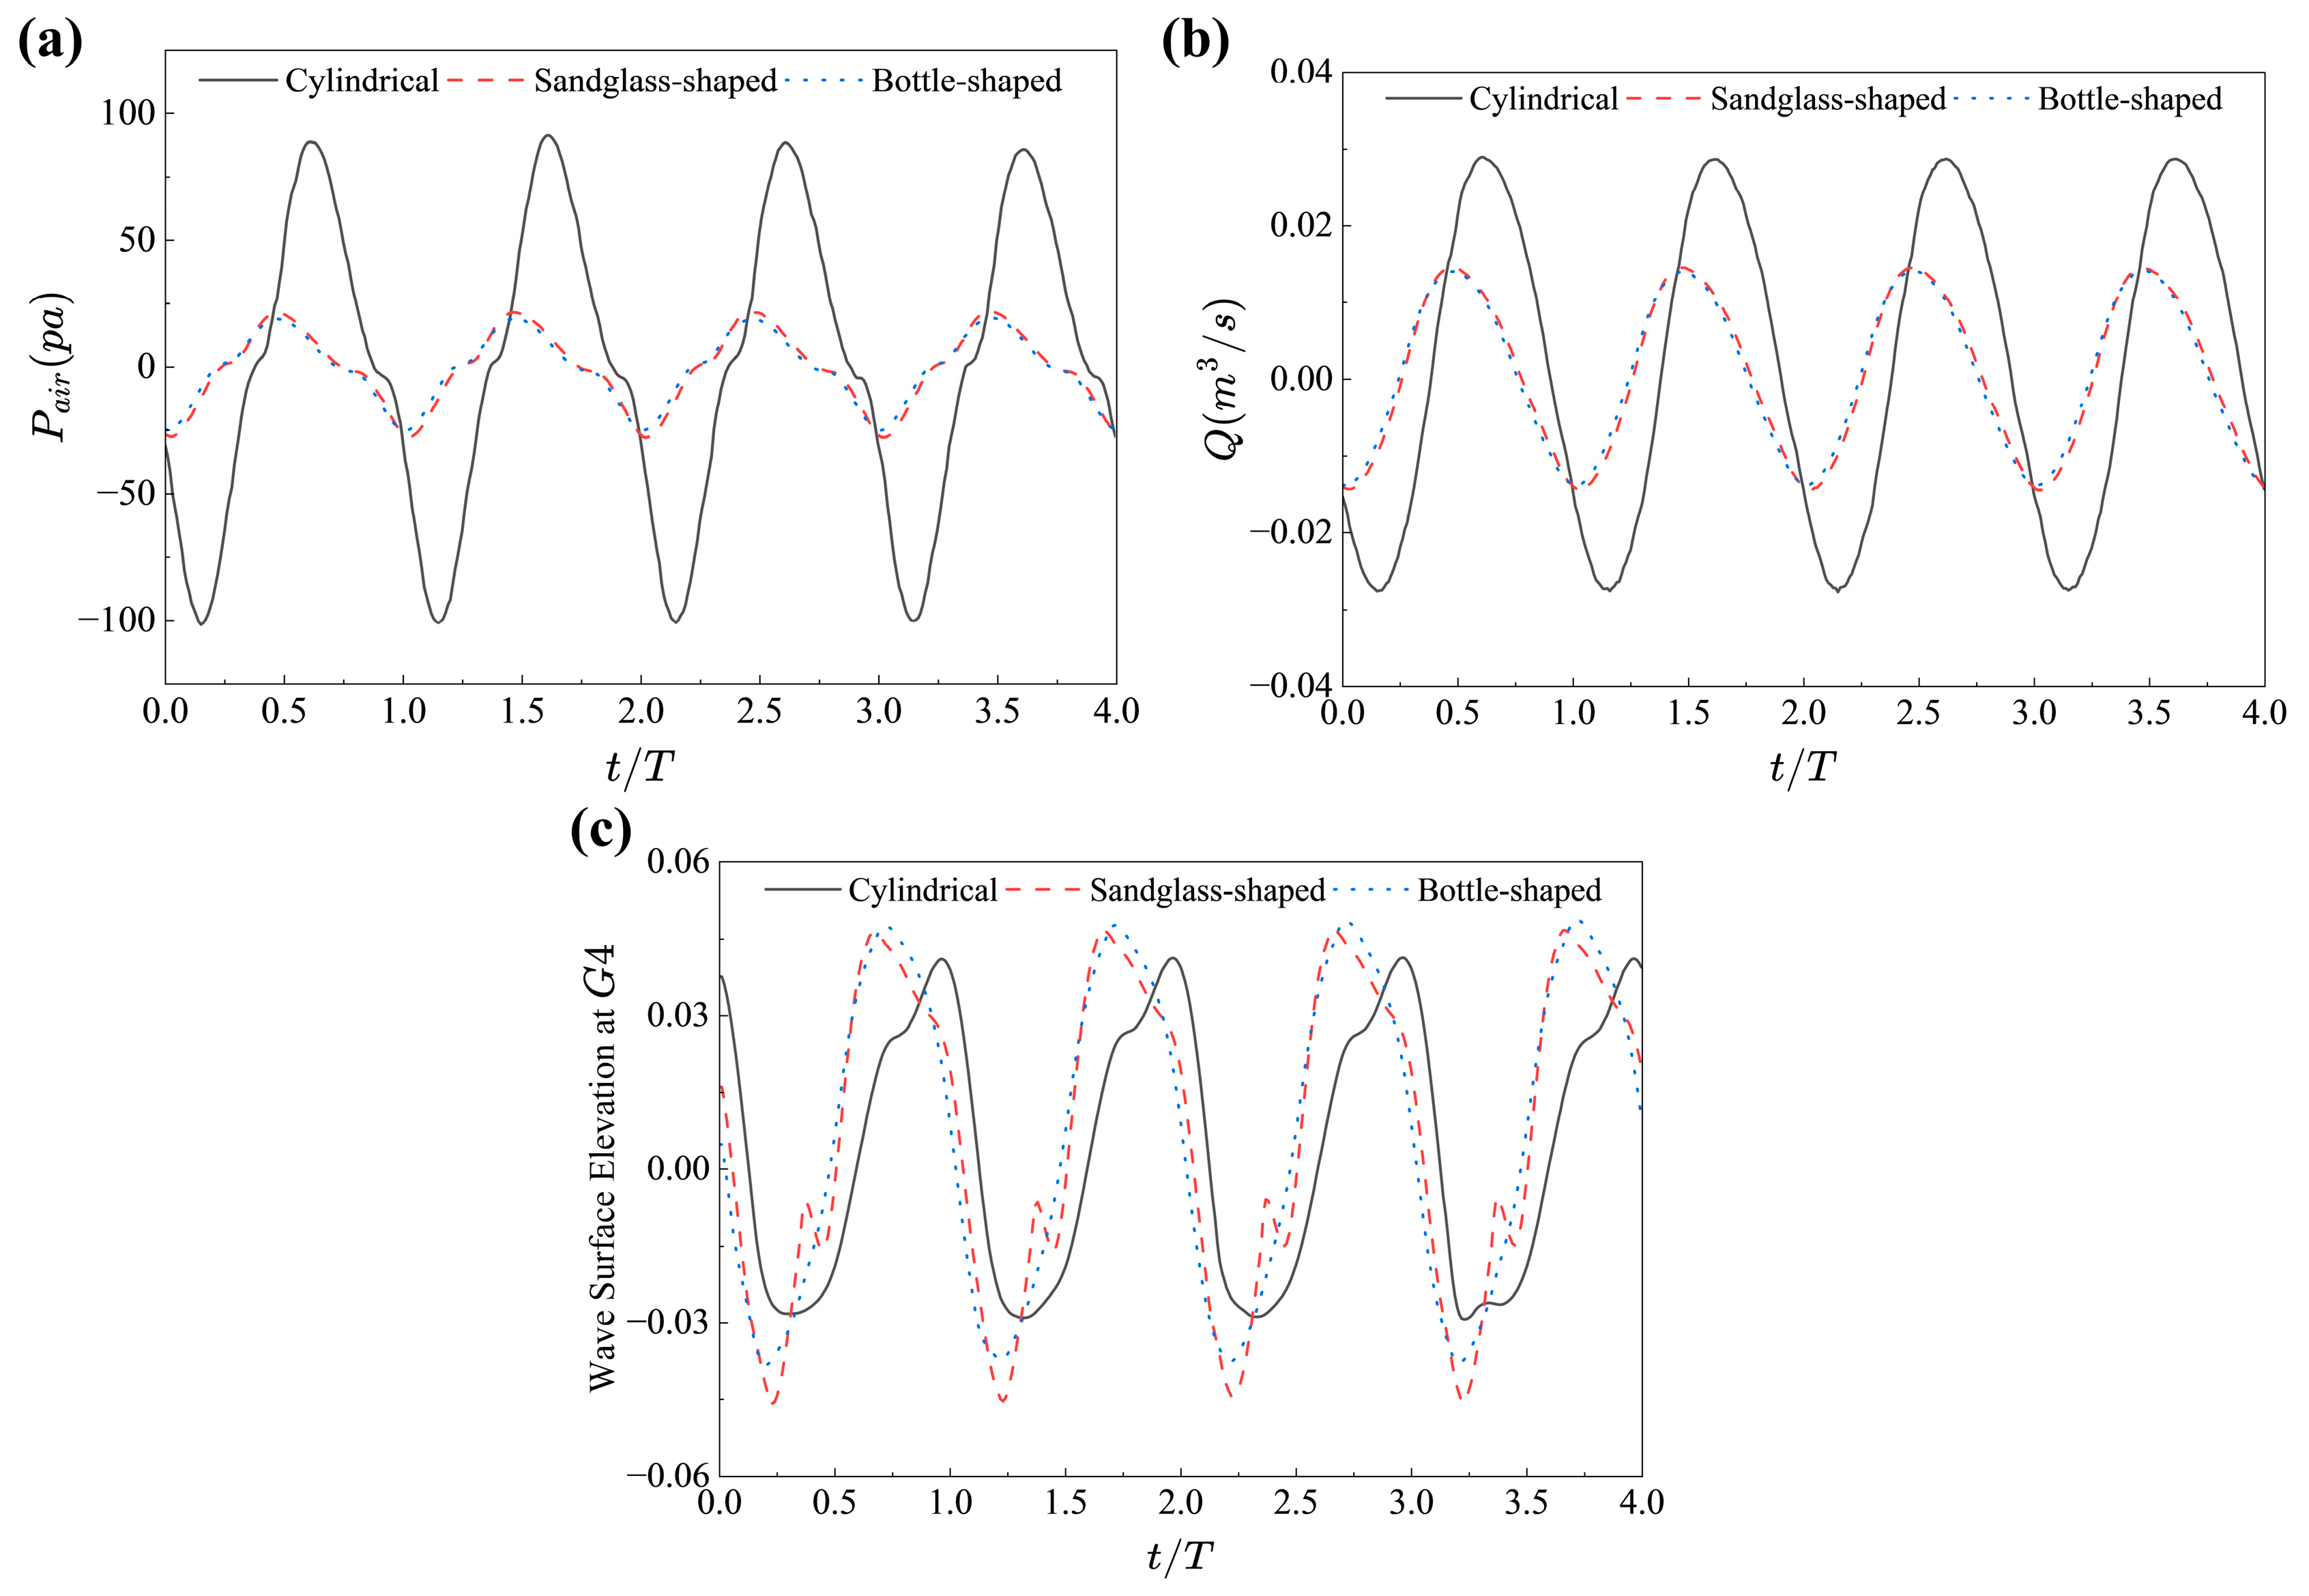
Figure 9 compares the horizontal force amplitude Fx, vertical force amplitude Fz, mean pneumatic power Pe, and capture width ratio (CWR) of the cylindrical, sandglass-shaped, and bottle-shaped OWCs under H = 0.05 m and h = 1.6 m. To highlight the differences more clearly, Figure 10 summarizes the relative changes in the sandglass-shaped and bottle-shaped chambers with respect to the cylindrical reference at three representative wave periods, namely T = 0.9, 1.3, and 1.7 s. Figure 11 further presents representative stable-stage pressure, flow-rate, and internal free-surface histories at T = 1.3 s, where the cylindrical chamber shows the most favorable power–load balance.
At T = 0.9 s, both the sandglass-shaped and bottle-shaped chambers produce higher Pe and CWR than the cylindrical chamber. Relative to the cylindrical reference, Pe increases by 117.8% for the sandglass-shaped chamber and by 238.1% for the bottle-shaped chamber, while Fx increases by 10.2% and 40.1%, and Fz increases by 15.4% and 36.6%, respectively. The corresponding time histories indicate that the short-period power gain is associated with larger chamber-pressure and flow-rate amplitudes. Therefore, the short-period advantage of the sandglass-shaped and bottle-shaped chambers should be interpreted as stronger chamber excitation rather than as a uniform improvement in both power output and structural loading.
The most important contrast appears at T = 1.3 s. In this case, the cylindrical chamber yields the highest Pe, whereas the sandglass-shaped and bottle-shaped chambers show severe reductions in pneumatic performance. Relative to the cylindrical chamber, Pe decreases by 87.9% for the sandglass-shaped chamber and by 89.4% for the bottle-shaped chamber. However, the corresponding force amplitudes do not change in the same proportion: Fx increases only slightly by 4.3% and 6.1%, while Fz decreases by 22.1% and 21.7%, respectively. Figure 10 helps explain this behavior. At T = 1.3 s, the cylindrical chamber develops much larger pressure and flow-rate amplitudes than the other two geometries, indicating a much stronger chamber-scale breathing motion. The central wave-gauge response at G4 inside the cylindrical chamber is also stronger, suggesting that the internal water column oscillates more effectively as a whole, rather than being concentrated in a more localized region. This is why the cylindrical chamber can generate a much larger Pe without a proportionate increase in the resultant load amplitudes. In other words, Pe is governed primarily by the chamber pressure–flow response, whereas Fx and Fz are determined by the surface-integrated hydrodynamic pressure distribution on the wetted chamber walls; these two response types therefore do not have to reach their maxima simultaneously.
The weaker response of the sandglass-shaped and bottle-shaped chambers at the intermediate period can be interpreted from the pressure-flow phase relationship and the local entrance/transition geometry. Their stronger contraction or expansion changes the effective water-column inertia and can promote local flow separation and vortical exchange near the submerged opening and transition region. As a result, part of the wave-induced motion is dissipated locally or becomes out of phase with the chamber-pressure fluctuation, so the internal free-surface motion is not converted into a proportionally large pressure-flow product. This explains why the bottle-shaped chamber may show load reduction or short-period amplification in some cases but performs poorly at T = 1.3 s in terms of Pe.
At T = 1.7 s, the sandglass-shaped and bottle-shaped chambers reduce both Fx and Fz, but this reduction is accompanied by a much weaker pneumatic response. Compared with the cylindrical chamber, Pe decreases by 96.7% for the sandglass-shaped chamber and by 97.4% for the bottle-shaped chamber, while Fx decreases by 35.0% and 35.5%, and Fz decreases by 45.0% and 46.4%, respectively. At the same time, the corresponding pressure and flow-rate amplitudes are far smaller than those of the cylindrical chamber. This indicates that the lower load level at long period mainly results from weaker chamber excitation, rather than from a better power–load balance. In other words, the chambers become less effective not only in transmitting local load, but also in converting the oscillatory water-column motion into useful pneumatic output.
Overall, the results do not indicate a universally superior baseline geometry over the tested regular wave range. Instead, the relative performance of the three chambers is clearly period-dependent. The sandglass-shaped and bottle-shaped chambers can be advantageous when short-period pneumatic amplification is desired, and higher local chamber loads can be tolerated, whereas the cylindrical chamber provides the strongest and most balanced pneumatic response in the intermediate period case and maintains the highest useful pneumatic output in the long-period case examined here.

4.2. Effect of D2 on the Power–Load Characteristics of the Frustum-Shaped OWC

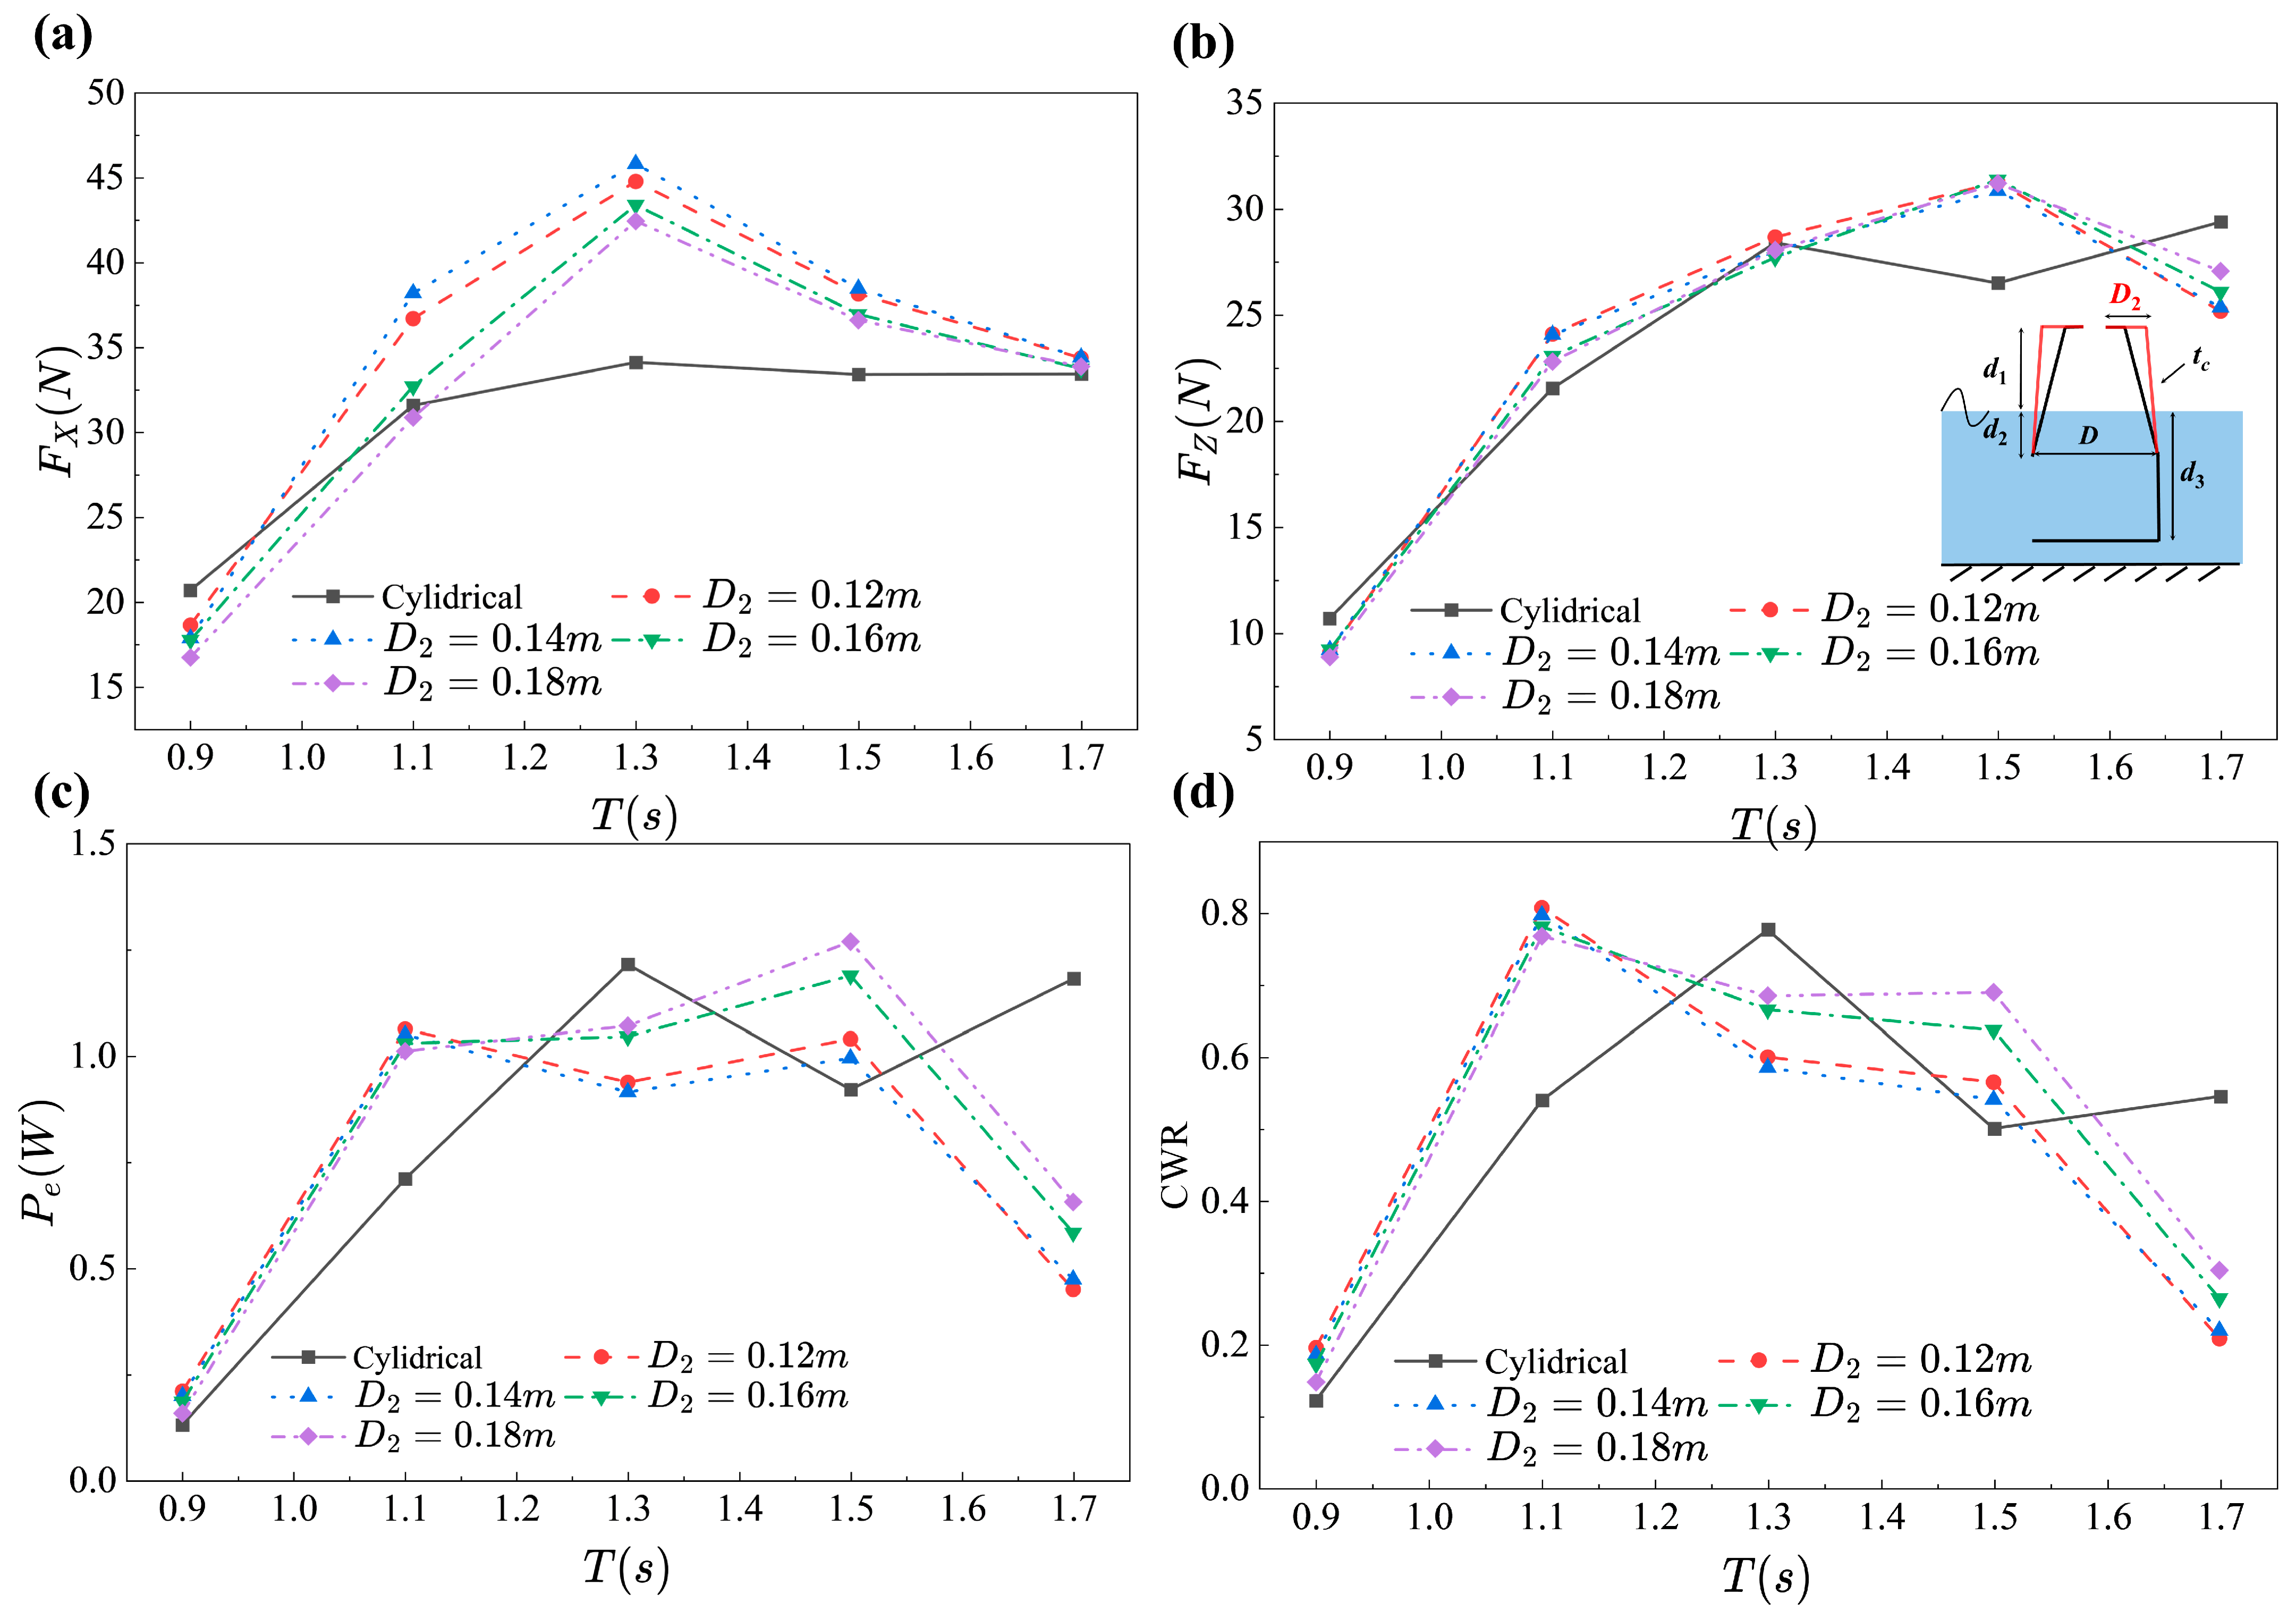
After the baseline comparison in Section 4.1, the cylindrical chamber was retained as the reference configuration for the subsequent D2 study. Figure 12 compares the horizontal force amplitude Fx, vertical force amplitude Fz, mean pneumatic power Pe, and capture width ratio (CWR) of the cylindrical chamber and the frustum-shaped chambers with different D2 values under H = 0.05 m and h = 1.6 m. Overall, the influence of D2 is strongly dependent on wave period, and the favorable D2 value is not the same for all tested cases. At T = 0.9 s, a mild contraction gives the clearest benefit. Among the tested cases, D2 = 0.12 m increases Pe by 59.7% relative to the cylindrical chamber, while Fx and Fz decrease by 10.0% and 15.1%, respectively. This indicates that, at this short period, a small contraction can improve the chamber pressure–flow response while keeping the local load level lower than that of the cylindrical chamber. By contrast, at T = 1.3 s the cylindrical chamber remains more favorable. For example, D2 = 0.18 reduces Pe by 11.8% relative to the cylindrical chamber, while Fx increases by 24.4% and Fz remains at a similar level. Thus, the contraction no longer improves the overall balance at this period.
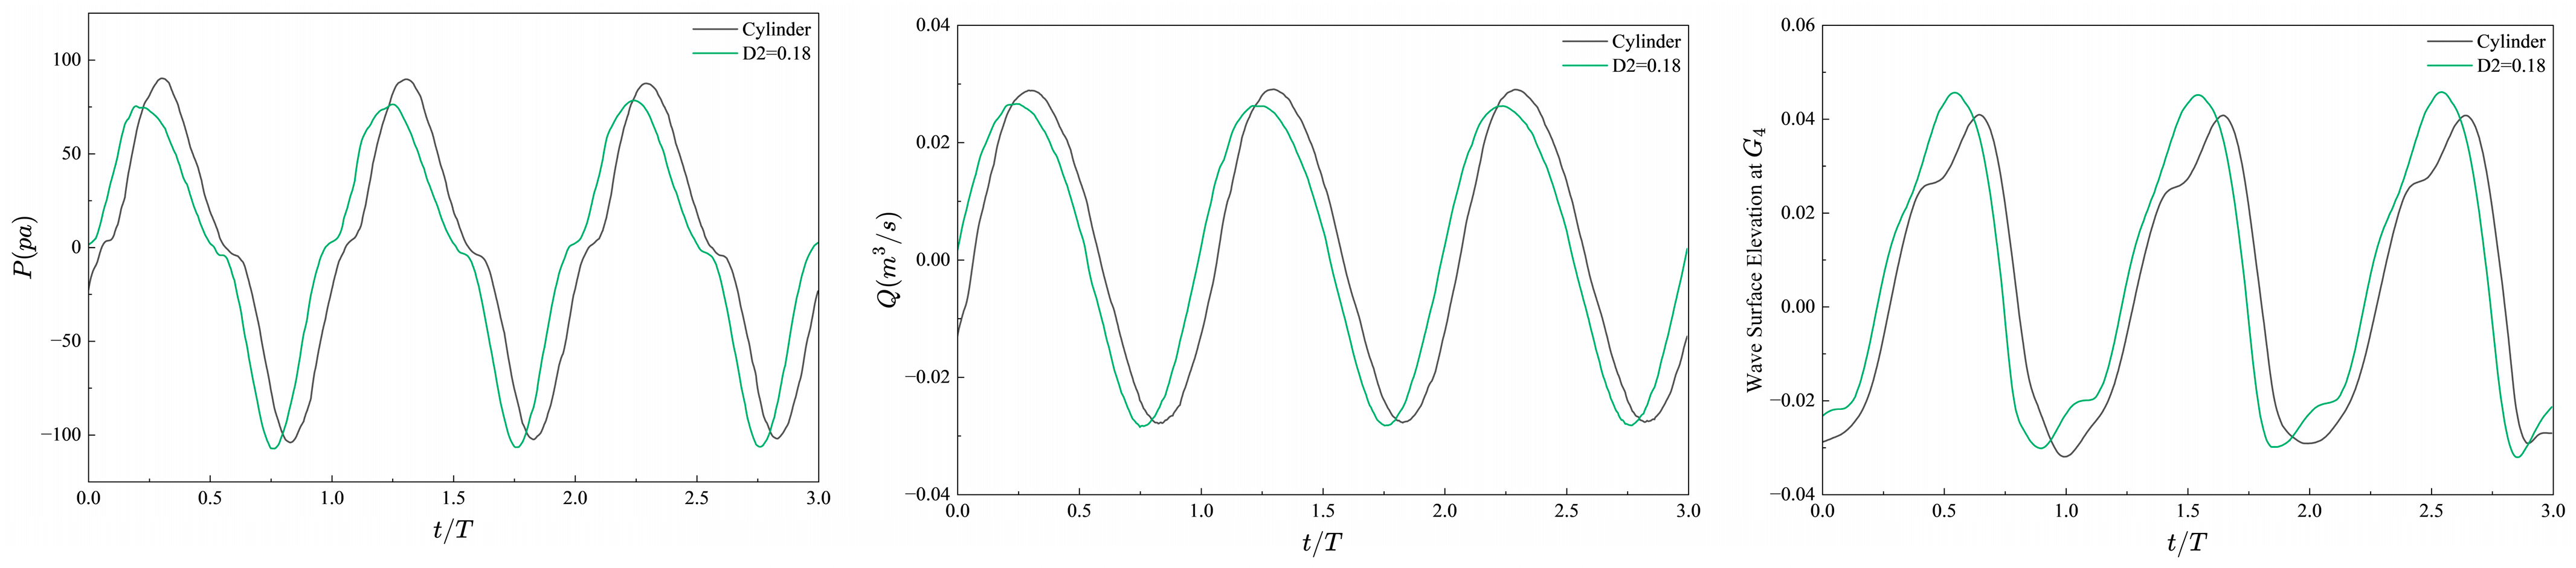
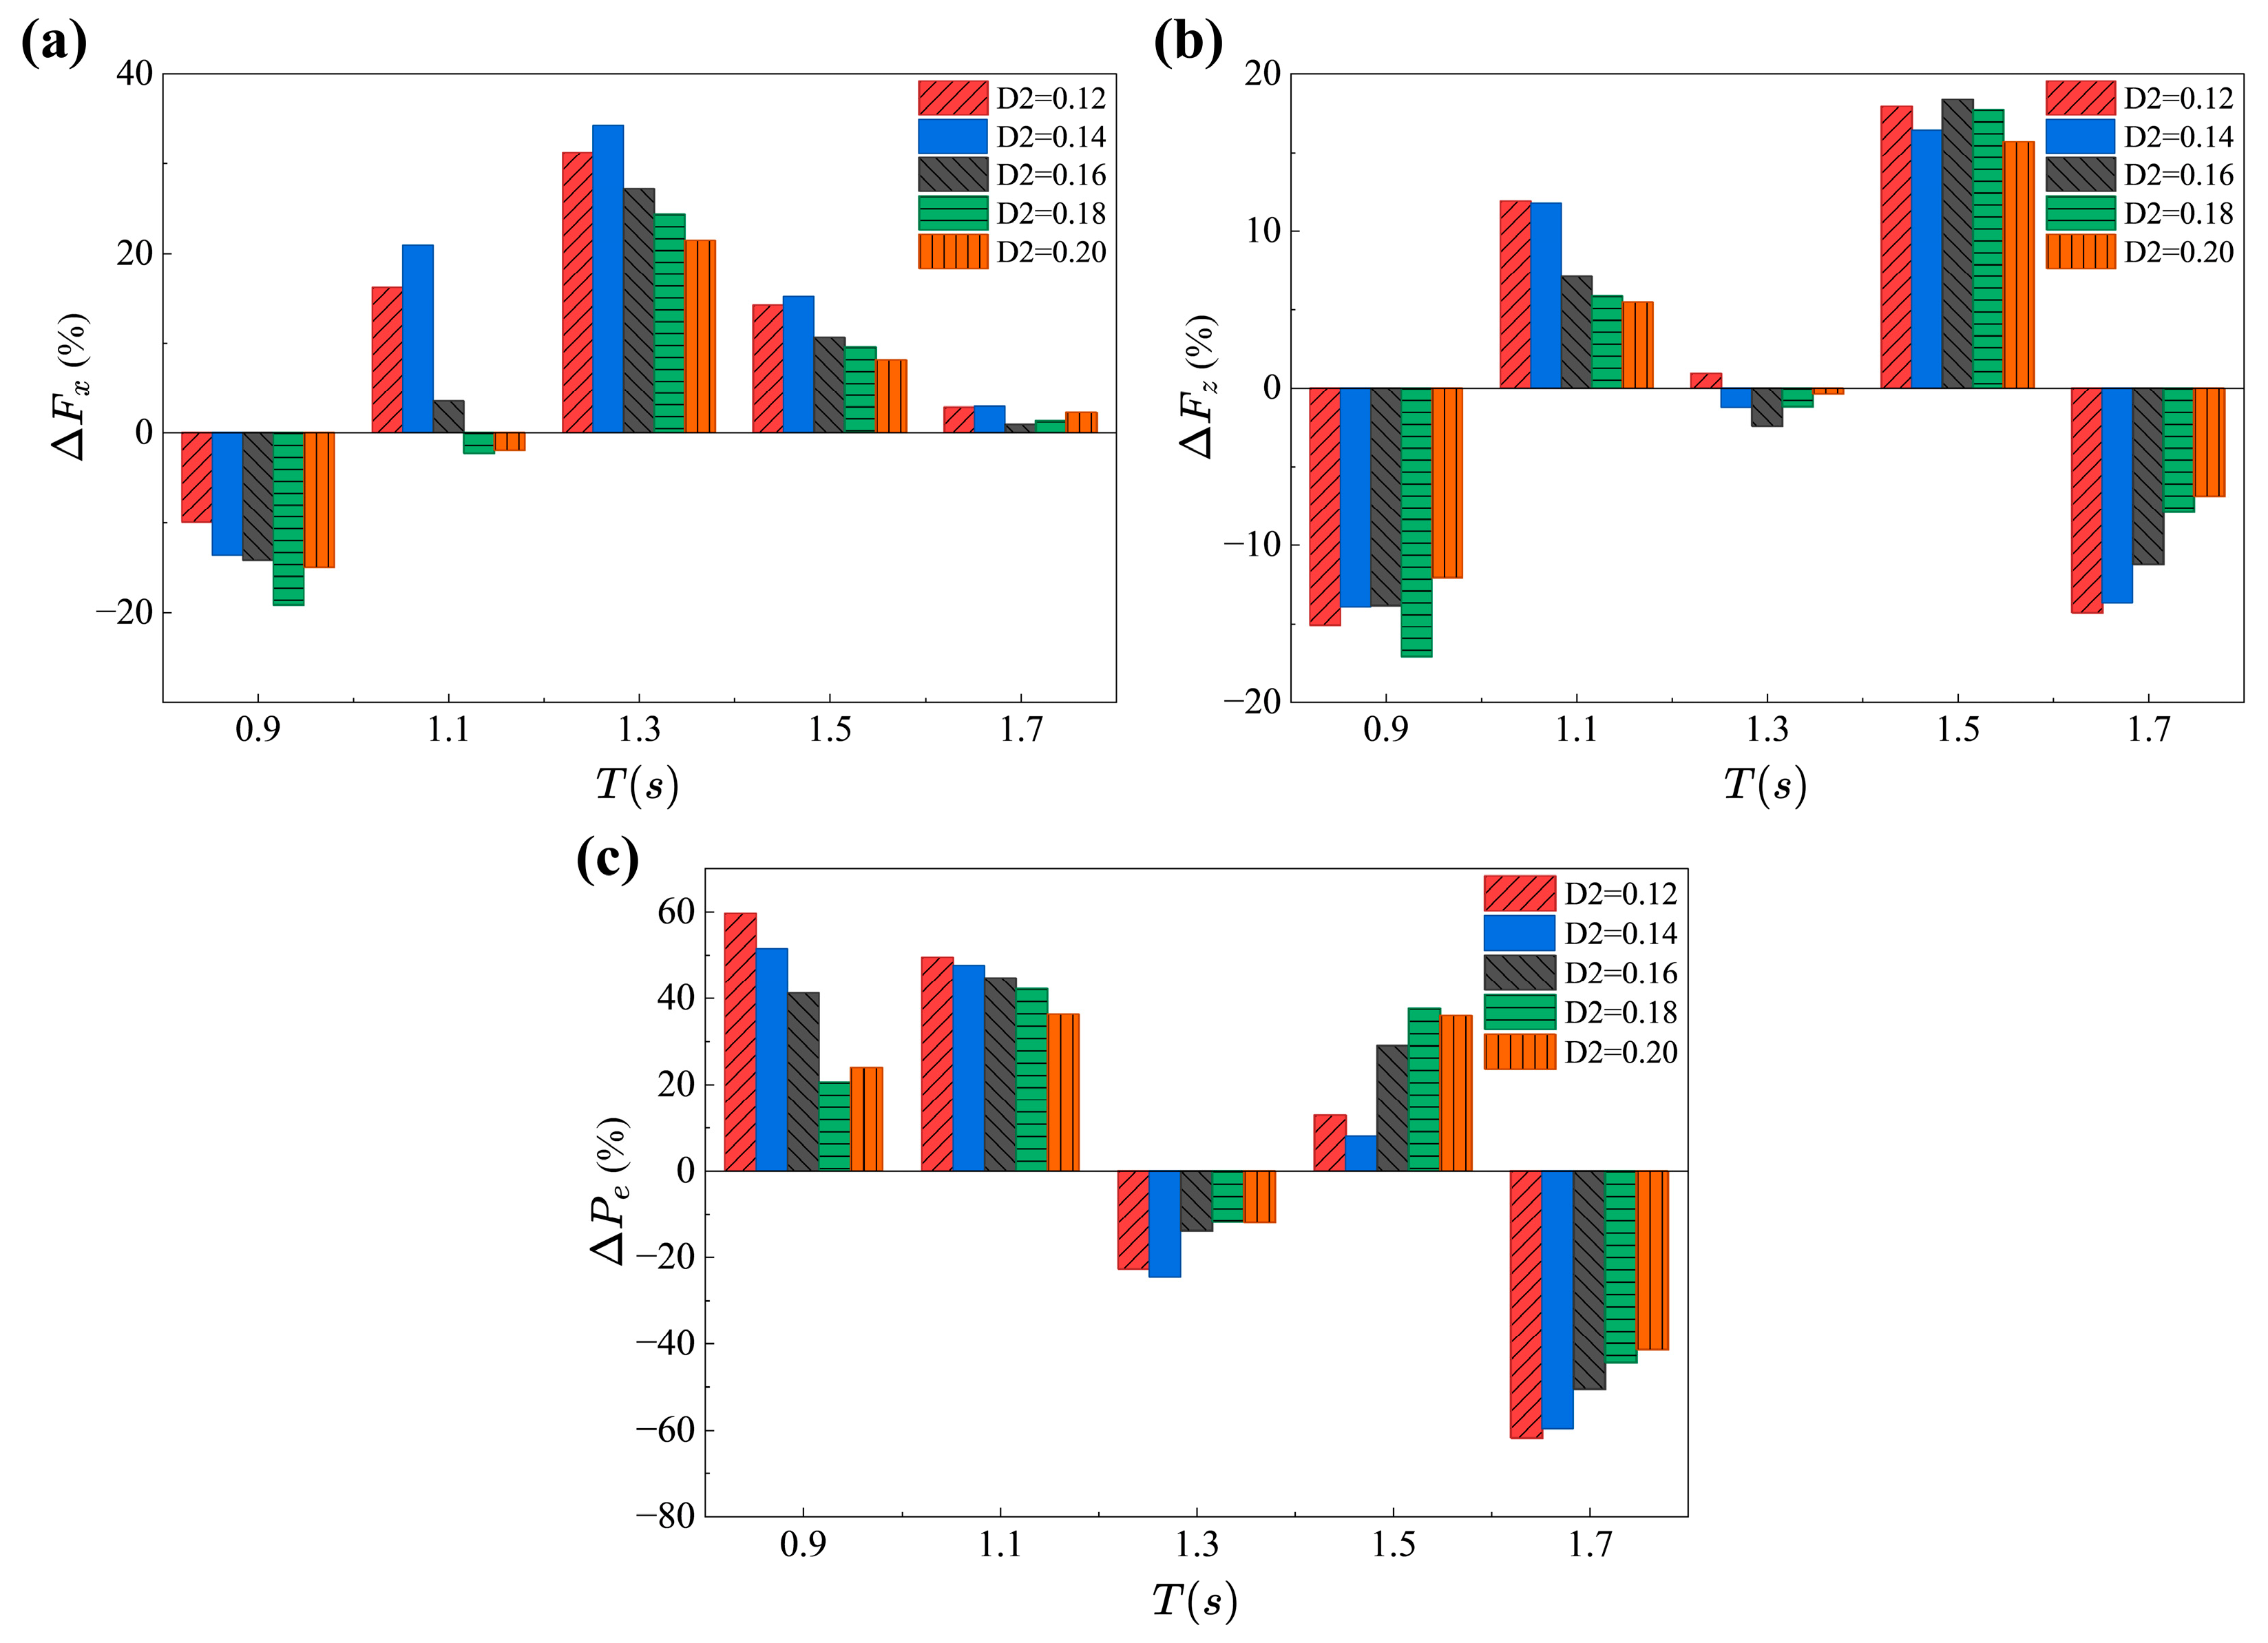
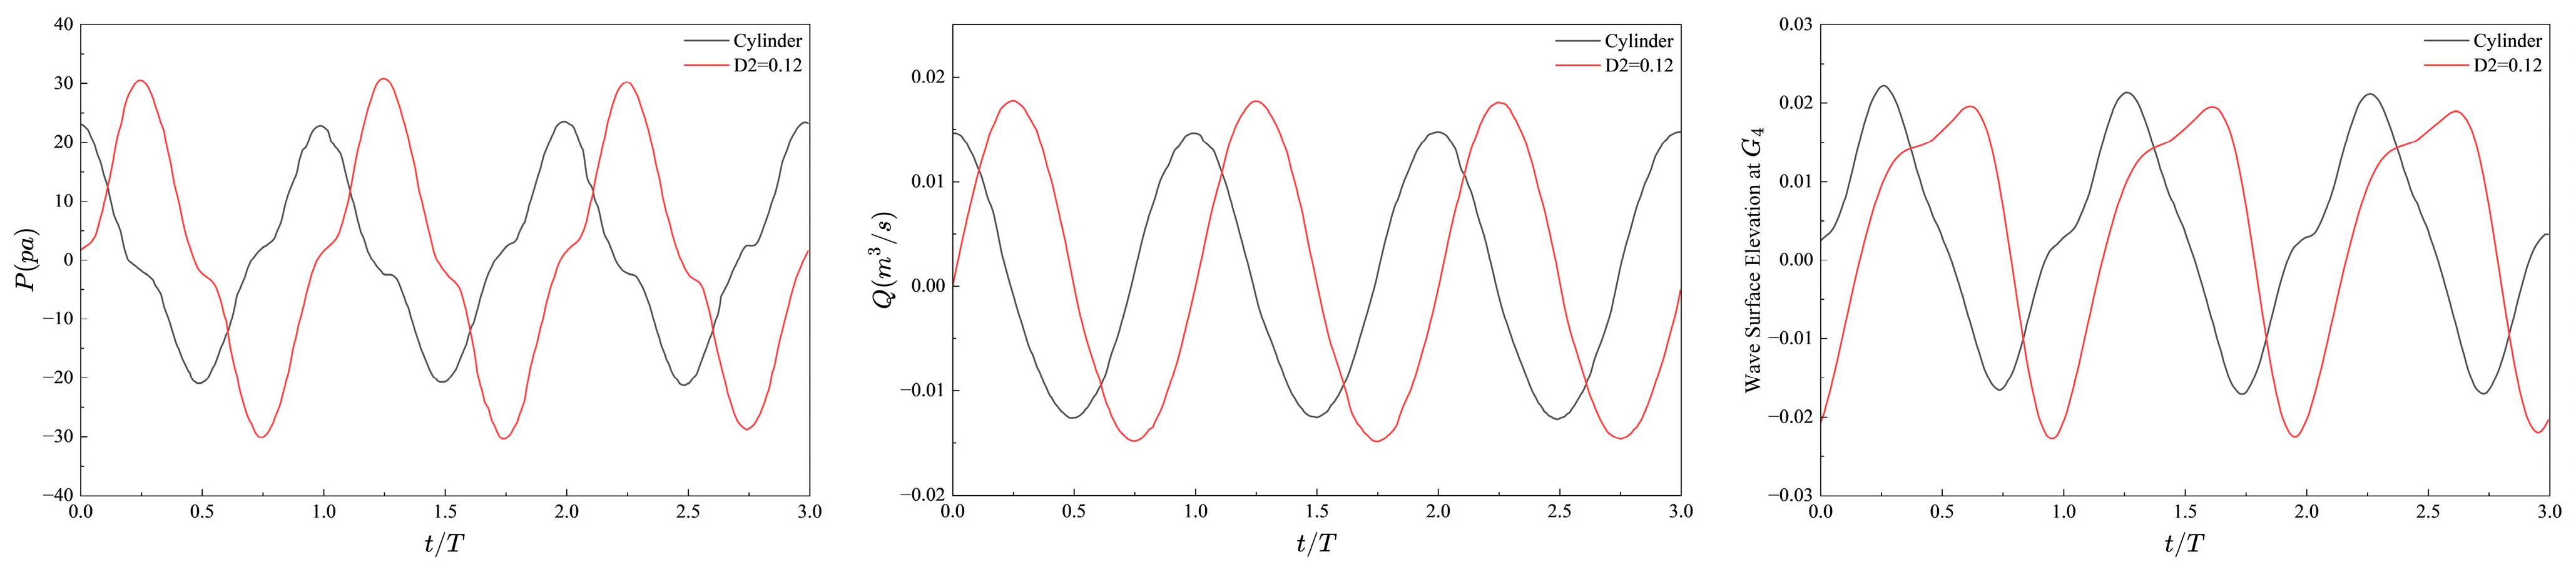
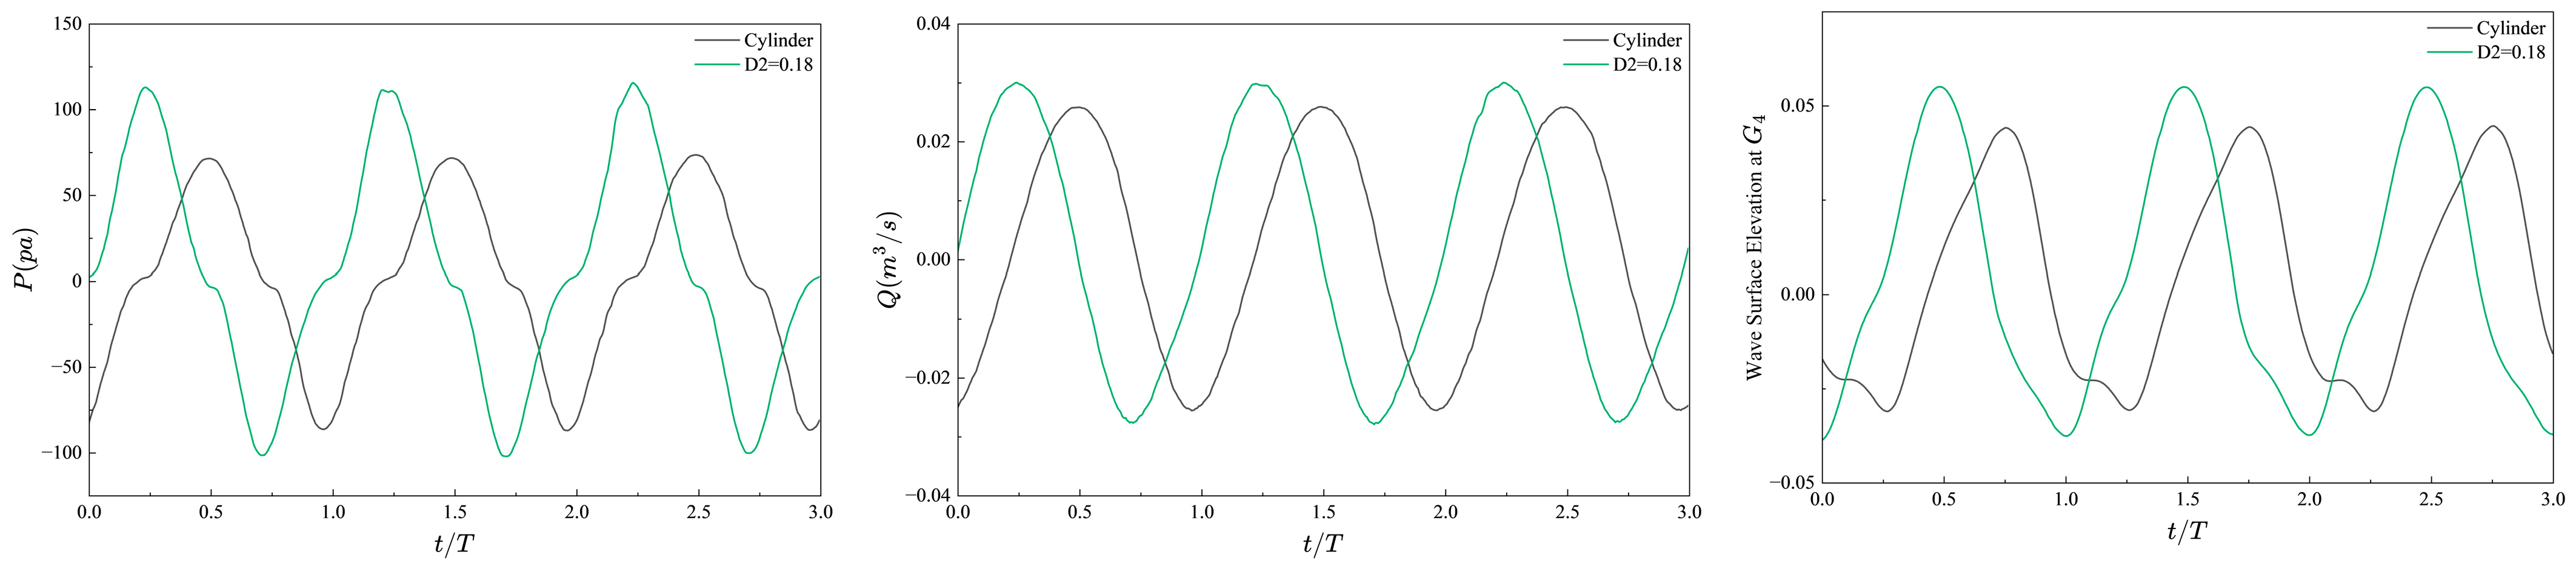
To make these trends clearer, Figure 13 summarizes the relative changes in representative D2 cases with respect to the cylindrical chamber. At T = 0.9 s, the result for D2 = 0.12 can be regarded as a favorable short-period tuning case because the power increases while both load components decrease. The corresponding stable-stage histories are shown in Figure 14. However, this behavior does not persist as the period increases. At T = 1.3 s, the cylindrical chamber still gives the stronger pneumatic response. As shown in Figure 15, although the free-surface oscillation at G4 for D2 = 0.18 is comparable to, or slightly larger than, that of the cylindrical chamber, the corresponding chamber-pressure amplitude and orifice-flow amplitude are both smaller. This shows that, at T = 1.3 s, the cylindrical chamber converts the internal water-column motion into pneumatic output more effectively. In other words, a similar internal free-surface motion does not necessarily produce a similar pressure–flow response once the local contraction is introduced.
The role of D2 changes again at T = 1.5 s. In this period range, D2 = 0.18 gives the highest Pe, increasing it by 37.7% relative to the cylindrical chamber, but Fx and Fz also increase by 9.6% and 17.8%, respectively. As shown in Figure 16, the pressure amplitude, flow-rate amplitude, and central free-surface amplitude are all higher than those of the cylindrical chamber, indicating that the power gain is obtained by strengthening the chamber response itself, and the increase in local load is the corresponding cost. At the longer period of T = 1.7 s, the cylindrical chamber becomes preferable again. For the representative case D2 = 0.20, Pe decreases by 41.4% relative to the cylindrical chamber, and both the pressure amplitude and flow-rate amplitude are also smaller. This indicates that, in this longer-period range, a larger contraction is no longer beneficial for improving the pneumatic response of the chamber. Taken together, these results show that the effect of D2 is clearly period-dependent: D2 = 0.12 is favorable at T = 0.9 s, the cylindrical chamber remains more suitable at T = 1.3 s, D2 = 0.18 is favorable when higher pneumatic power is targeted at T = 1.5 s, and the cylindrical chamber again performs better at T = 1.7 s. Therefore, D2 is better regarded as a wave-condition-dependent tuning parameter, for which the favorable value varies with wave period.

4.3. Influence of Front-Wall Draft d2 on Pneumatic Response and Hydrodynamic Loads

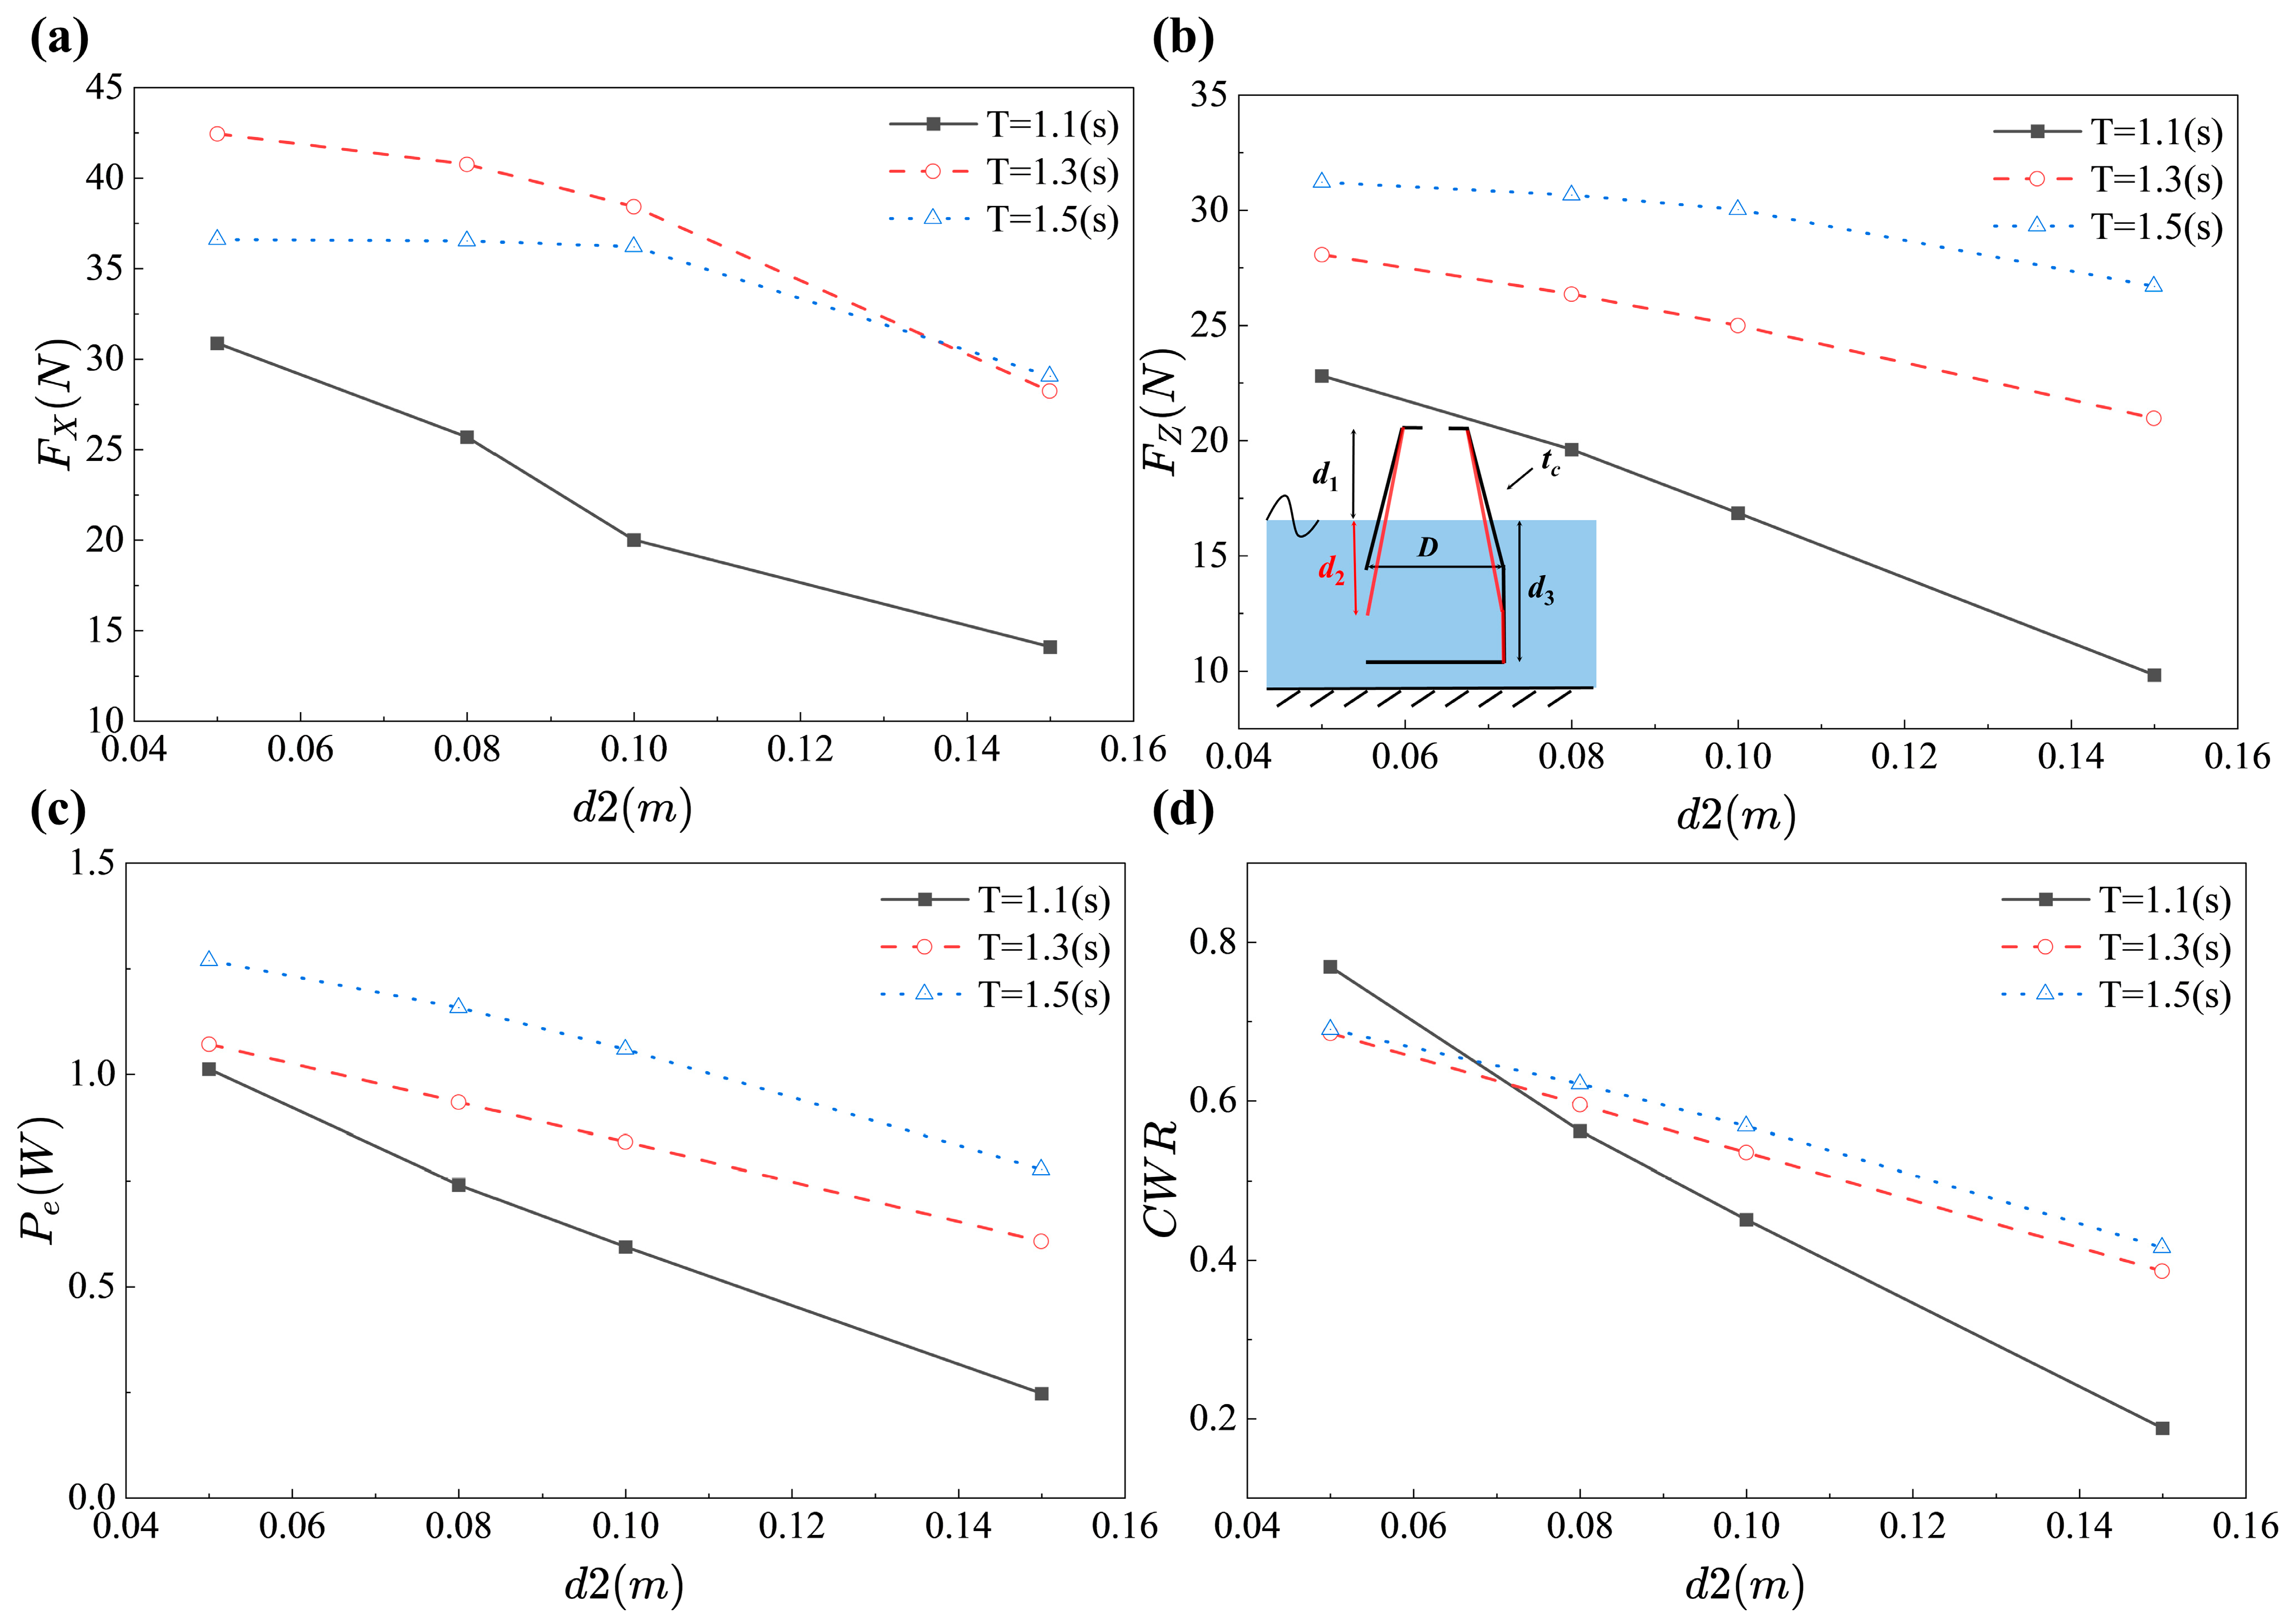
Based on the D2 analysis above, the influence of d2 was further examined within the D2 = 0.18 configuration set. Figure 17 compares the corresponding Fx, Fz, Pe, and CWR results. Unlike D2, which shows a strongly period-dependent tuning effect, increasing d2 produces a more consistent reduction in response level. For T = 1.1, 1.3, and 1.5 s, both Fx and Fz decrease as d2 increases, indicating that a deeper front wall can reduce the wave-induced loading on the chamber. However, Pe and CWR decrease at the same time, showing that the load reduction is mainly associated with a weakened pneumatic response rather than an improved power-load balance. This tendency is most pronounced at T = 1.1 s, where Pe decreases from about 1.01 W to 0.25 W as d2 increases from 0.05 m to 0.15 m, while Fx decreases from about 31.1 N to 14.1 N.
A compact way to express this trade-off is that, at T = 1.1 s, increasing d2 from 0.05 m to 0.15 m reduces Fx by approximately 54.7%, but Pe decreases by about 75.2%. Thus, in the tested configuration, the load-reduction benefit is obtained at a higher relative cost in pneumatic power, which is important when selecting d2 for design-oriented screening.
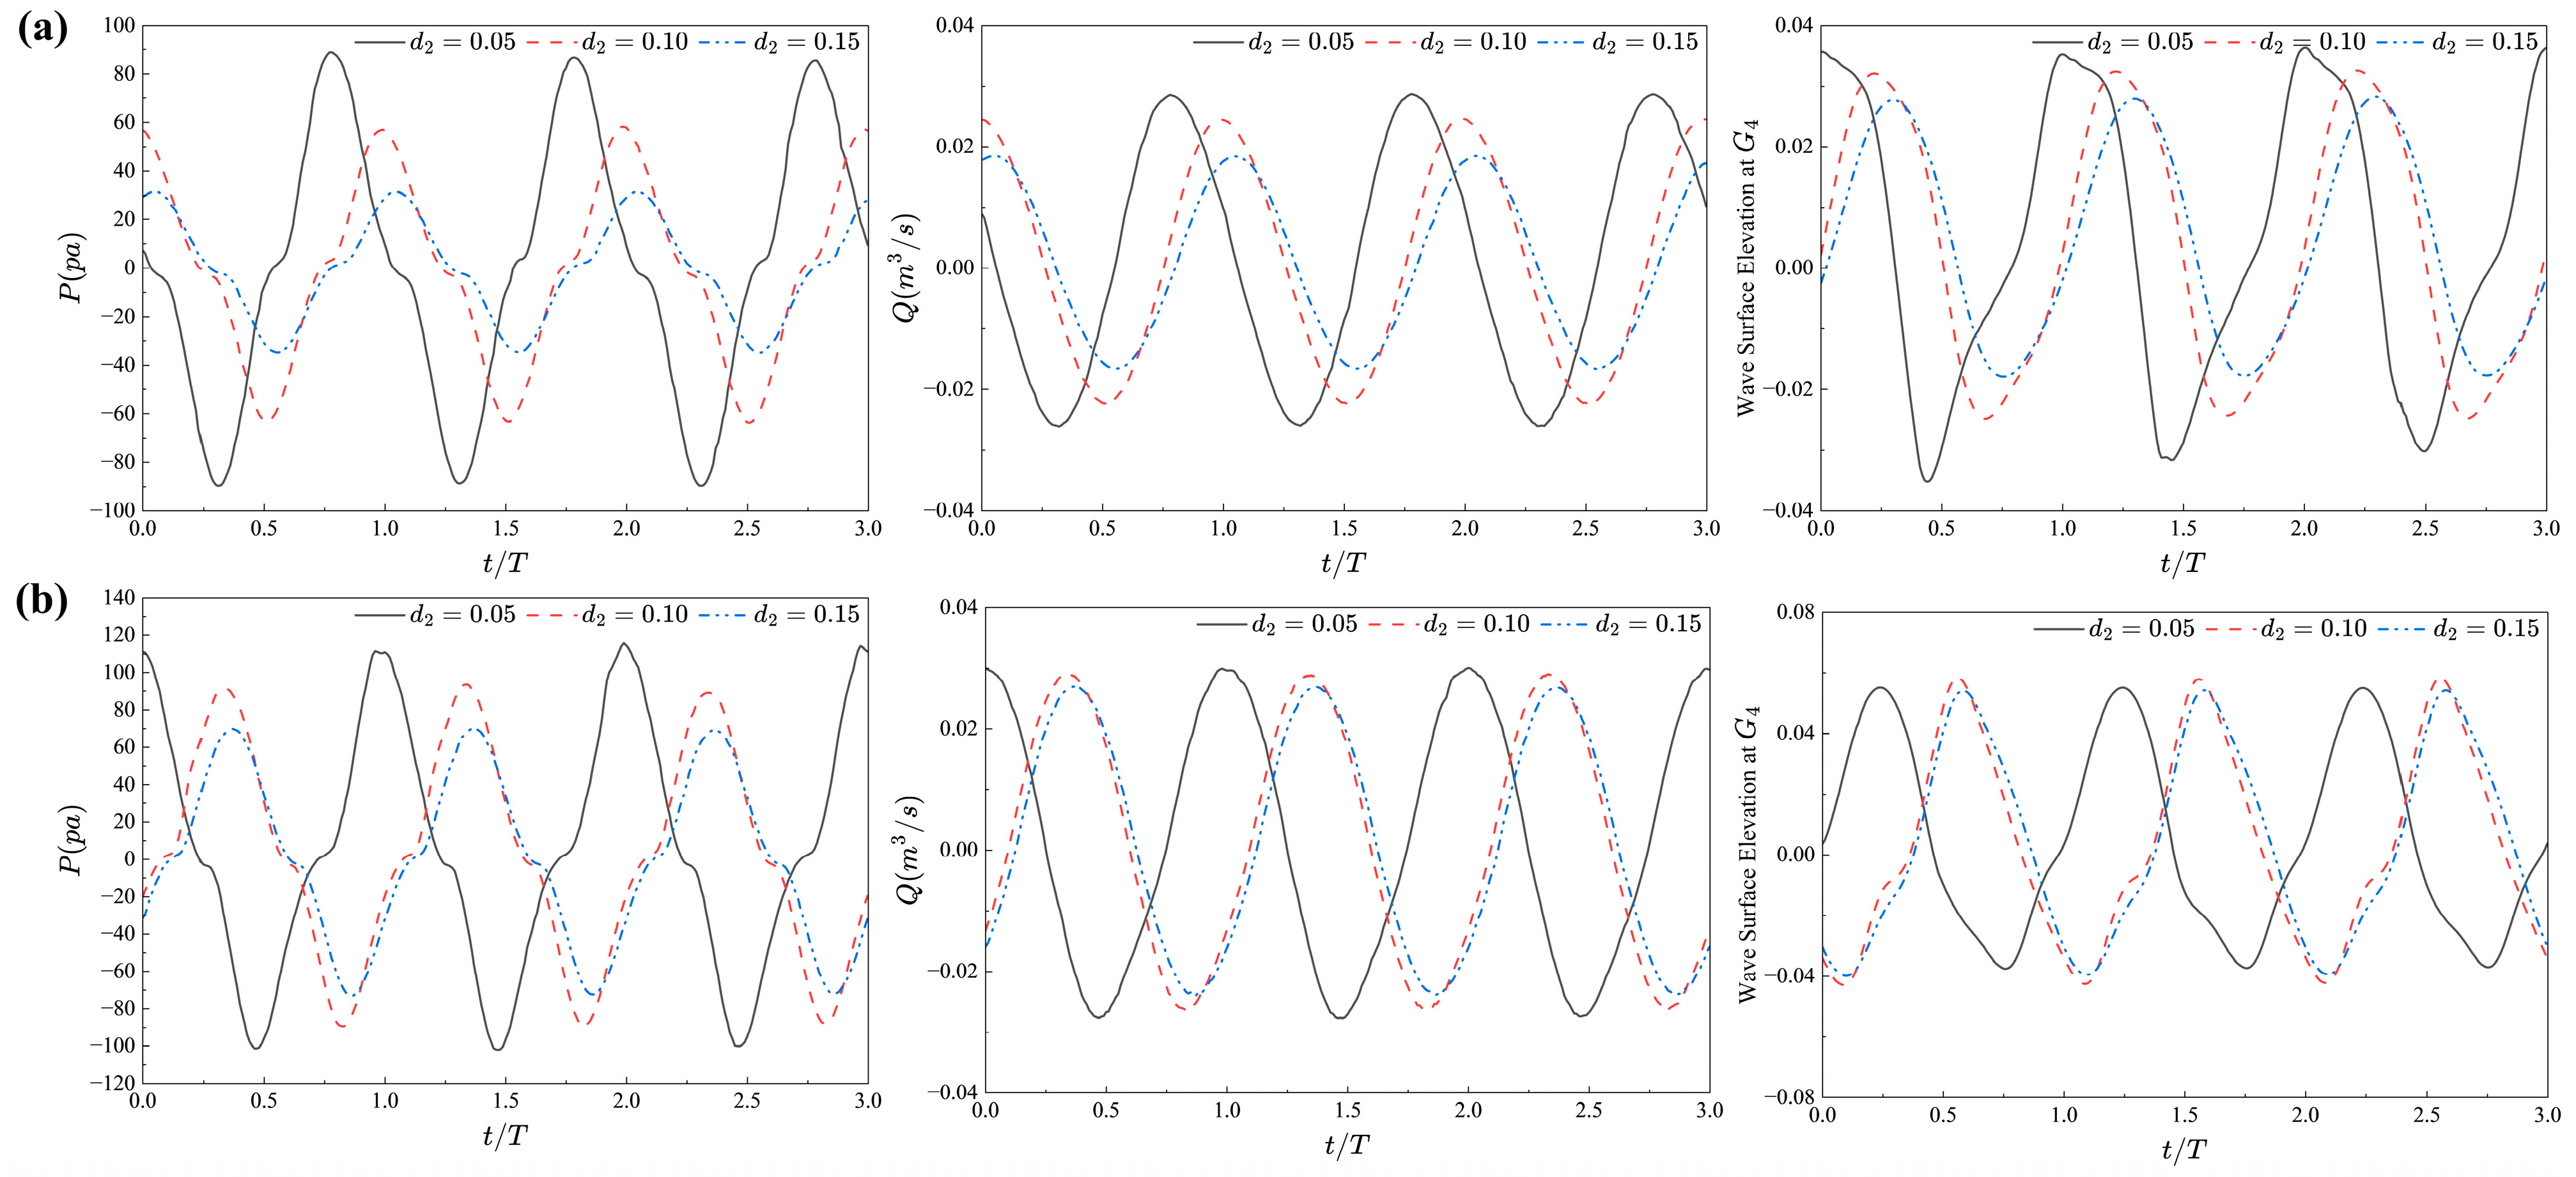
The stable-stage time histories in Figure 18 further explain this behavior. With increasing d2, the chamber-pressure fluctuation, the orifice flow-rate amplitude, and the free-surface oscillation at G4 are all weakened. At T = 1.1 s, for example, the pressure amplitude decreases from about 89.5 Pa for d2 = 0.05 m to about 33.4 Pa for d2 = 0.15 m, while the full-device flow-rate amplitude decreases from approximately 0.0274 m3/s to 0.0176 m3/s. Since the pneumatic power is determined by the coupled pressure-flow product, the simultaneous reduction in pressure and flow rate directly leads to the decrease in Pe and CWR.
The physical mechanism is related to the submerged entrance condition. A larger d2 increases the obstruction at the front opening and weakens the exchange between the external wave field and the internal water column. Consequently, the internal free-surface motion is suppressed, the chamber pressure and air-flow response are reduced, and the unsteady pressure acting on the chamber walls becomes smaller. Thus, in the present D2 = 0.18 cases, d2 acts mainly as an entrance-depth control parameter: a smaller d2 helps maintain pneumatic response, whereas a larger d2 is more suitable when reducing local chamber loads is prioritized under a given wave condition.

4.4. Limitations, Scaling, and Applicability

Several modeling assumptions should be considered when transferring the present trends to engineering design. First, the air phase was treated as incompressible, and the orifice was used as an orifice-only damping element. These assumptions are reasonable for a comparative laboratory-scale geometry study, but they can affect the absolute chamber-pressure amplitude and the pressure-flow phase once a full-scale air volume, air compressibility, turbine damping, and PTO control strategy are introduced.
Second, all production simulations used regular waves with H = 0.05 m. Irregular sea states would introduce multiple frequency components, broader spectral energy distribution, and possible short-term constructive or destructive interference between the external wave field and the internal water-column oscillation. The regular-wave results should therefore be interpreted as period-by-period tuning trends. A design-stage assessment should repeat the analysis using representative spectra, such as JONSWAP-type sea states, and evaluate spectral averages of both power and loads.
Third, the present 1:35 model-scale results can be interpreted through Froude similarity because gravity and free-surface motion dominate the chamber oscillation. Under a geometric scale ratio SL, the characteristic time scales as SL0.5, force as SL3, and power as SL3.5. Reynolds similarity cannot be satisfied simultaneously in a single Froude-scaled model, so viscous losses, turbulence, and orifice-flow details may affect absolute prototype-scale magnitudes. The SST k-ω model was used to provide a consistent viscous/turbulent treatment for all cases; therefore, the geometry ranking and power-load trade-off trends are considered more reliable than direct full-scale absolute values.
Finally, after the preliminary jacket-force comparison, the main simulations were performed for isolated OWC chambers. This choice allows the local power-load behavior of the chamber to be compared clearly, but it neglects full flow interference with jacket members, structural coupling, and possible three-dimensional shielding effects. The conclusions should therefore be understood as chamber-level guidance for potential jacket integration rather than as final coupled jacket-OWC design recommendations.

5. Conclusions

This study numerically investigated the power-load characteristics of fixed Oscillating Water Column (OWC) chambers considered for potential integration near offshore wind jacket foundations. A two-phase CFD model was used to compare three baseline chamber configurations and two local geometric parameters under regular waves with H = 0.05 m, h = 1.6 m, and T = 0.9–1.7 s. The main conclusions are valid within this isolated-chamber, orifice-only, regular-wave framework and are summarized as follows:
  • The baseline chamber configuration has a clear period-dependent influence on both pneumatic response and local hydrodynamic loading. The sandglass-shaped and bottle-shaped chambers enhance short-period pneumatic power, but this is accompanied by higher load amplitudes. At longer periods, these configurations reduce loads but also lead to a substantial decrease in Pe and CWR. The cylindrical chamber therefore provides a more stable reference response over the tested range.
  • The frustum-contraction parameter D2 produces a non-monotonic tuning effect. A small contraction, D2 = 0.12 m, improves the response at T = 0.9 s, whereas D2 = 0.18 m increases Pe at T = 1.5 s but also increases the local loads. This indicates that D2 is strongly dependent on the incident-wave period and should be treated as a local tuning parameter rather than a generally beneficial modification.
  • Increasing the front-wall draft d2 weakens the chamber response within the tested D2 = 0.18 cases. The reductions in Fx and Fz occur together with decreases in Pe and CWR. The time-history analysis indicates that a deeper front wall suppresses the chamber-pressure fluctuation, orifice flow rate, and internal free-surface motion, so the load reduction is mainly caused by reduced water-column excitation.
Overall, the results show that the preferred geometry depends on the target wave-period range and on whether pneumatic response or load reduction is emphasized. The baseline configuration mainly controls the overall response type, D2 provides period-dependent local tuning, and d2 mainly adjusts the excitation level through the submerged entrance.
Future work should consider irregular waves, broader H-D2-d2 combinations, turbine/PTO damping, air-compressibility effects, and fully coupled jacket-OWC simulations to further evaluate the applicability of these trends under realistic offshore conditions.

Author Contributions

Conceptualization, G.X. (Guohu Xie), Q.L., F.Y., R.W., G.X. (Gen Xiong), D.N. and B.H.; Methodology, G.X. (Guohu Xie), Q.L., F.Y., R.W., D.N. and B.H.; Software, Q.L., F.Y. and D.N.; Validation, G.X. (Guohu Xie), Q.L., F.Y. and R.W.; Formal analysis, Q.L. and B.H.; Investigation, G.X. (Guohu Xie) and G.X. (Gen Xiong); Writing—original draft, G.X. (Guohu Xie), Q.L., F.Y. and R.W.; Writing—review & editing, G.X. (Guohu Xie), Q.L., F.Y., R.W., G.X. (Gen Xiong), D.N. and B.H.; Supervision, R.W., D.N. and B.H.; Funding acquisition, B.H. All authors have read and agreed to the published version of the manuscript.

Funding

This research was funded by the “Pioneer” and “Leading Goose” R&D Program of Zhejiang (Grant No. 2024C03031) and the National Natural Science Foundation of China (Grant Nos. 52271294, 52571281 and W2421072).

Data Availability Statement

The data presented in this study are available on request from the corresponding author.

Conflicts of Interest

Authors Guohu Xie, Gen Xiong and Ben He were employed by the PowerChina Huadong Engineering Corporation Limited. The remaining authors declare that the research was conducted in the absence of any commercial or financial relationships that could be construed as a potential conflict of interest.

References

  1. Wang, X.; Zeng, X.; Li, J.; Yang, X.; Wang, H. A Review on Recent Advancements of Substructures for Offshore Wind Turbines. Energy Convers. Manag. 2018, 158, 103–119. [Google Scholar] [CrossRef]
  2. Häfele, J.; Gebhardt, C.G.; Rolfes, R. A Comparison Study on Jacket Substructures for Offshore Wind Turbines Based on Optimization. Wind Energy Sci. 2019, 4, 23–40. [Google Scholar] [CrossRef]
  3. Pérez-Collazo, C.; Greaves, D.; Iglesias, G. A Review of Combined Wave and Offshore Wind Energy. Renew. Sustain. Energy Rev. 2015, 42, 141–153. [Google Scholar] [CrossRef]
  4. Perez-Collazo, C.; Greaves, D.; Iglesias, G. A Novel Hybrid Wind-Wave Energy Converter for Jacket-Frame Substructures. Energies 2018, 11, 637. [Google Scholar] [CrossRef]
  5. Perez-Collazo, C.; Pemberton, R.; Greaves, D.; Iglesias, G. Monopile-Mounted Wave Energy Converter for a Hybrid Wind-Wave System. Energy Convers. Manag. 2019, 199, 111971. [Google Scholar] [CrossRef]
  6. Zhou, Y.; Ning, D.; Shi, W.; Johanning, L.; Liang, D. Hydrodynamic Investigation on an OWC Wave Energy Converter Integrated into an Offshore Wind Turbine Monopile. Coast. Eng. 2020, 162, 103731. [Google Scholar] [CrossRef]
  7. Wei, Z.; Shi, H.; Cao, F.; Yu, M.; Li, M.; Chen, Z.; Liu, P. Study on the power performance of wave energy converters mounted around an offshore wind turbine jacket platform. Renew. Energy 2024, 221, 119786. [Google Scholar] [CrossRef]
  8. Falcão, A.F.O.; Henriques, J.C.C. Oscillating-Water-Column Wave Energy Converters and Air Turbines: A Review. Renew. Energy 2016, 85, 1391–1424. [Google Scholar] [CrossRef]
  9. Mustapa, M.A.; Yaakob, O.B.; Ahmed, Y.M.; Rheem, C.-K.; Koh, K.K.; Adnan, F.A. Wave Energy Device and Breakwater Integration: A Review. Renew. Sustain. Energy Rev. 2017, 77, 43–58. [Google Scholar] [CrossRef]
  10. Zheng, S.; Zhang, Y.; Iglesias, G. Coast/Breakwater-Integrated OWC: A Theoretical Model. Mar. Struct. 2019, 66, 121–135. [Google Scholar] [CrossRef]
  11. Chen, J.; Wen, H.; Wang, Y.; Ren, B. Experimental Investigation of an Annular Sector OWC Device Incorporated into a Dual Cylindrical Caisson Breakwater. Energy 2020, 211, 118681. [Google Scholar] [CrossRef]
  12. Lee, H.H.; Chen, G.-F.; Hsieh, H.-Y. Study on an Oscillating Water Column Wave Power Converter Installed in an Offshore Jacket Foundation for Wind-Turbine System Part I: Open Sea Wave Energy Converting Efficiency. J. Mar. Sci. Eng. 2021, 9, 133. [Google Scholar] [CrossRef]
  13. Lee, H.H.; Wen, C.-Y.; Chen, G.-F. Study on an Oscillating Water Column Wave Power Converter Installed in an Offshore Jacket Foundation for Wind-Turbine System Part II: Experimental Test on the Converting Efficiency. Processes 2022, 10, 418. [Google Scholar] [CrossRef]
  14. Qiao, D.; Feng, C.; Ning, D.; Wang, C.; Liang, H.; Li, B. Dynamic Response Analysis of Jacket Platform Integrated with Oscillating Water Column Device. Front. Energy Res. 2020, 8, 42. [Google Scholar] [CrossRef]
  15. Pérez-Collazo, C.; Greaves, D.M.; Iglesias, G. A Jacket-Frame Mounted Oscillating Water Column with a Variable Aperture Skirt. J. Mar. Sci. Eng. 2023, 11, 2383. [Google Scholar] [CrossRef]
  16. Simonetti, I.; Cappietti, L.; Elsafti, H.; Oumeraci, H. Optimization of the Geometry and the Turbine Induced Damping for Fixed Detached and Asymmetric OWC Devices: A Numerical Study. Energy 2017, 139, 1197–1209. [Google Scholar] [CrossRef]
  17. Hayati, M.; Nikseresht, A.H.; Haghighi, A.T. Sequential Optimization of the Geometrical Parameters of an OWC Device Based on the Specific Wave Characteristics. Renew. Energy 2020, 161, 386–394. [Google Scholar] [CrossRef]
  18. Elhanafi, A.; Fleming, A.; Macfarlane, G.; Leong, Z. Underwater Geometrical Impact on the Hydrodynamic Performance of an Offshore Oscillating Water Column–Wave Energy Converter. Renew. Energy 2017, 105, 209–231. [Google Scholar] [CrossRef]
  19. Mahnamfar, F.; Altunkaynak, A. Comparison of Numerical and Experimental Analyses for Optimizing the Geometry of OWC Systems. Ocean Eng. 2017, 130, 10–24. [Google Scholar] [CrossRef]
  20. Dizadji, N.; Sajadian, S.E. Modeling and Optimization of the Chamber of OWC System. Energy 2011, 36, 2360–2366. [Google Scholar] [CrossRef]
  21. Bouali, B.; Larbi, S. Contribution to the Geometry Optimization of an Oscillating Water Column Wave Energy Converter. Energy Procedia 2013, 36, 565–573. [Google Scholar] [CrossRef]
  22. Chen, J.; Wen, H.; Wang, Y.; Wang, G. A Correlation Study of Optimal Chamber Width with the Relative Front Wall Draught of Onshore OWC Device. Energy 2021, 225, 120307. [Google Scholar] [CrossRef]
  23. Samak, M.M.; Elgamal, H.; Nagib Elmekawy, A.M. The Contribution of L-Shaped Front Wall in the Improvement of the Oscillating Water Column Wave Energy Converter Performance. Energy 2021, 226, 120421. [Google Scholar] [CrossRef]
  24. Qu, M.; Yu, D.; Xu, Z.; Gao, Z. The Effect of the Elliptical Front Wall on Energy Conversion Performance of the Offshore OWC Chamber: A Numerical Study. Energy 2022, 255, 124428. [Google Scholar] [CrossRef]
  25. Ning, D.; Guo, B.; Wang, R.; Vyzikas, T.; Greaves, D. Geometrical Investigation of a U-Shaped Oscillating Water Column Wave Energy device. Appl. Ocean Res. 2020, 97, 102105. [Google Scholar] [CrossRef]
  26. Ning, D.; Zhou, Y.; Zhang, C. Hydrodynamic Modeling of a Novel Dual-Chamber OWC Wave Energy Converter. Appl. Ocean Res. 2018, 78, 180–191. [Google Scholar] [CrossRef]
  27. Ning, D.; Zhou, Y.; Mayon, R.; Johanning, L. Experimental Investigation on the Hydrodynamic Performance of a Cylindrical Dual-Chamber Oscillating Water Column Device. Appl. Energy 2020, 260, 114252. [Google Scholar] [CrossRef]
  28. Taherian Haghighi, A.; Nikseresht, A.H.; Hayati, M. Numerical Analysis of Hydrodynamic Performance of a Dual-Chamber Oscillating Water Column. Energy 2021, 221, 119892. [Google Scholar] [CrossRef]
  29. Wang, C.; Zhang, Y.; Deng, Z. Theoretical Analysis on Hydrodynamic Performance for a Dual-Chamber Oscillating Water Column Device with a Pitching Front Lip-Wall. Energy 2021, 226, 120326. [Google Scholar] [CrossRef]
  30. Mia, M.R.; Zhao, M.; Wu, H.; Palmer, H. Numerical Simulation of a Stationary Offshore Multi-Chamber OWC Wave Energy Converter. Ocean Eng. 2022, 265, 112546. [Google Scholar] [CrossRef]
  31. Ning, D.; Fu, L.; Zhou, Y.; Mayon, R.; Zhang, Y. Hydrodynamic Performance of a Land-Based Multi-Chamber OWC Wave Energy Capture System: An Experimental Study. Coast. Eng. 2024, 190, 104510. [Google Scholar] [CrossRef]
  32. Fu, L.; Wang, R.; Kar, P.; Ning, D. Experimental and Numerical Investigation of Wave Loads on Land-Based Multi-Chamber OWC Converters. Energy 2024, 310, 133281. [Google Scholar] [CrossRef]
  33. Qian, K.; Chen, L.; Zhou, Y.; Ning, D. Hydrodynamics of an Offshore Multi-Chamber OWC Wave Energy Converter. Energy 2024, 304, 132239. [Google Scholar] [CrossRef]
  34. Zhang, X.; Mayon, R.; Zhou, F.; Ning, D. Experimental and Numerical Investigation on a Novel Dual-Chamber OWC-WEC Integrated with an Energy-Focusing Breakwater. Coast. Eng. 2025, 201, 104814. [Google Scholar] [CrossRef]
  35. Zhao, M.; Ning, D. A Review of Numerical Methods for Studying Hydrodynamic Performance of Oscillating Water Column (OWC) Devices. Renew. Energy 2024, 233, 121177. [Google Scholar] [CrossRef]
  36. Opoku, F.; Uddin, M.N.; Atkinson, M. A Review of Computational Methods for Studying Oscillating Water Columns–the Navier-Stokes Based Equation Approach. Renew. Sustain. Energy Rev. 2023, 174, 113124. [Google Scholar] [CrossRef]
  37. Hirt, C.W.; Nichols, B.D. Volume of Fluid (VOF) Method for the Dynamics of Free Boundaries. J. Comput. Phys. 1981, 39, 201–225. [Google Scholar] [CrossRef]
  38. Menter, F.R. Two-Equation Eddy-Viscosity Turbulence Models for Engineering Applications. AIAA J. 1994, 32, 1598–1605. [Google Scholar] [CrossRef] [PubMed]
  39. Falcão, A.F.O.; Henriques, J.C.C. The Spring-like Air Compressibility Effect in Oscillating-Water-Column Wave Energy Converters: Review and Analyses. Renew. Sustain. Energy Rev. 2019, 112, 483–498. [Google Scholar] [CrossRef]
  40. Simonetti, I.; Cappietti, L.; Elsafti, H.; Oumeraci, H. Evaluation of Air Compressibility Effects on the Performance of Fixed OWC Wave Energy Converters Using CFD Modelling. Renew. Energy 2018, 119, 741–753. [Google Scholar] [CrossRef]
  41. Elhanafi, A.; Macfarlane, G.; Fleming, A.; Leong, Z. Scaling and Air Compressibility Effects on a Three-Dimensional Offshore Stationary OWC Wave Energy Converter. Appl. Energy 2017, 189, 1–20. [Google Scholar] [CrossRef]
  42. Jiao, J.; Huang, S.; Wang, S.; Guedes Soares, C. A CFD–FEA two-way coupling method for predicting ship wave loads and hydroelastic responses. Appl. Ocean Res. 2021, 117, 102919. [Google Scholar] [CrossRef]
  43. Lakshmynarayanana, P.A.K.; Hirdaris, S. Comparison of nonlinear one- and two-way FFSI methods for the prediction of the symmetric response of a containership in waves. Ocean Eng. 2020, 203, 107179. [Google Scholar] [CrossRef]
  44. Lakshmynarayanana, P.A.; Temarel, P. Application of CFD and FEA Coupling to Predict Dynamic Behaviour of a Flexible Barge in Regular Head Waves. Mar. Struct. 2019, 65, 308–325. [Google Scholar] [CrossRef]
  45. Windt, C.; Davidson, J.; Ringwood, J.V. High-Fidelity Numerical Modelling of Ocean Wave Energy Systems: A Review of Computational Fluid Dynamics-Based Numerical Wave Tanks. Renew. Sustain. Energy Rev. 2018, 93, 611–630. [Google Scholar] [CrossRef]
  46. Perić, R.; Abdel-Maksoud, M. Reliable Damping of Free-Surface Waves in Numerical Simulations. Ship Technol. Res. 2016, 63, 1–13. [Google Scholar] [CrossRef]
  47. Poguluri, S.K.; Kim, D.; Bae, Y.H. Hydrodynamic Analysis of a Multibody Wave Energy Converter in Regular Waves. Processes 2021, 9, 1233. [Google Scholar] [CrossRef]
  48. Windt, C.; Davidson, J.; Schmitt, P.; Ringwood, J.V. On the Assessment of Numerical Wave Makers in CFD Simulations. J. Mar. Sci. Eng. 2019, 7, 47. [Google Scholar] [CrossRef]
Figure 1. Conceptual arrangement of a fixed OWC integrated with an offshore wind jacket foundation: (a) perspective view of the jacket-OWC concept and (b) front view of the integrated configuration.
Jmse 14 01224 g001
Figure 2. The configurations of the OWC device: (a) cylinder OWC, (b) sandglass-shaped OWC, (c) bottle-shaped OWC, and (d) three-dimensional view of cylinder OWC.
Jmse 14 01224 g002
Figure 3. Comparison of horizontal wave force time histories between the jacket-only case and jacket-frame cases with attached OWCs of different diameters.
Jmse 14 01224 g003
Figure 4. Definition of the local geometric parameters: (a) cylindrical OWC, (b) D2, (c) d2.
Jmse 14 01224 g004
Figure 5. Computational setup of the present STAR-CCM+ model: (a) numerical wave tank and boundary types; (b) wave-forcing regions applied at the inlet and outlet; and (c) monitor arrangement, including the four wave gauges, three pressure probes, and the orifice flow-rate section.
Jmse 14 01224 g005
Figure 6. Mesh-convergence results: (a) coarse, medium, and fine mesh layouts together with the corresponding NRMSD values; (b) representative stable-stage time histories of normalized free-surface elevation and symmetry-corrected chamber flow rate, and integrated force components Fx and Fz.
Jmse 14 01224 g006
Figure 7. Comparison of the numerical and experimental results for normalized free-surface elevations at gauges: (a) G1; (b) G2; (c) G3; (d) G4; (e) G5; and (f) G6. Experimental data are from Zhang et al. [34].
Jmse 14 01224 g007
Figure 8. Comparison of the numerical and experimental results for normalized chamber pressure. Experimental data are from Zhang et al. [34].
Jmse 14 01224 g008
Figure 9. Comparison of the baseline OWC geometries under H = 0.05 m and h = 1.6 m: (a) horizontal force amplitude Fx, (b) vertical force amplitude Fz, (c) mean pneumatic power, Pe and (d) capture width ratio (CWR).
Jmse 14 01224 g009
Figure 10. Relative changes in ΔPe, ΔFx, and ΔFz for the sandglass-shaped and bottle-shaped chambers with respect to the cylindrical OWC at representative wave periods.
Jmse 14 01224 g010
Figure 11. Representative stable-stage histories at T = 1.3 s for the baseline chamber geometries: (a) chamber pressure P, (b) symmetry-corrected orifice flow rate Q, and (c) internal free surface elevation at gauge G4.
Jmse 14 01224 g011
Figure 12. Effect of the frustum-contraction parameter D2 on the cylindrical baseline under H = 0.05 m and h = 1.6 m: (a) Fx, (b) Fz, (c) Pe, and (d) CWR.
Jmse 14 01224 g012
Figure 13. Relative changes in representative frustum-shaped chambers with respect to the cylindrical OWC at selected wave periods: (a) ΔPe, (b) ΔFx, and (c) ΔFz.
Jmse 14 01224 g013
Figure 14. Stable-stage histories of P, Q, and G4 elevation for the cylindrical chamber and the D2 = 0.12 case at T = 0.9 s.
Jmse 14 01224 g014
Figure 15. Stable-stage histories of P, Q, and G4 elevation for the cylindrical chamber and the D2 = 0.18 case at T = 1.3 s.
Jmse 14 01224 g015
Figure 16. Stable-stage histories of P, Q, and G4 elevation for the cylindrical chamber and the D2 = 0.18 case at T = 1.5 s.
Jmse 14 01224 g016
Figure 17. Effect of the front-wall draft d2 within the D2 = 0.18 configuration set at T = 1.1, 1.3, and 1.5 s: (a) horizontal force amplitude Fx; (b) vertical force amplitude Fz; (c) mean pneumatic power Pe; and (d) capture width ratio (CWR).
Jmse 14 01224 g017
Figure 18. Stable-stage time histories of chamber pressure p, orifice flow rate Q, and free-surface elevation at G4 for selected d2 cases within the D2 = 0.18 configuration set: (a) T = 1.1 s and (b) T = 1.5 s.
Jmse 14 01224 g018
Table 1. Main geometric parameters of the investigated OWC model.
SymbolDescriptionValue
DChamber diameter0.50 m
D1Orifice diameter0.071 m
d1Chamber height above still water level0.25 m
d2Front-wall draft0.05 (baseline and D2 study);
0.05, 0.08, 0.10, 0.15 m (d2 study)
d3Rear-wall draft0.30 m
tcWall thickness0.01 m
D2Frustum-contraction parameter0.16 m (baseline);
0.12, 0.14, 0.16, 0.18, 0.20 m (D2 study)
Table 2. Wave conditions and nondimensional indicators.
Wave Condition ParametersValue
Wave height, H0.05 m
Wave periods, T0.9, 1.1, 1.3, 1.5, 1.7 s
Water depth, h1.6 m
ω2h/g2.23–7.95
kh2.28–7.95
Mesh resolution indicatorsλx = 80; Hz = 20
Disclaimer/Publisher’s Note: The statements, opinions and data contained in all publications are solely those of the individual author(s) and contributor(s) and not of MDPI and/or the editor(s). MDPI and/or the editor(s) disclaim responsibility for any injury to people or property resulting from any ideas, methods, instructions or products referred to in the content.