Article

Research on Water Surface Object Detection Method Based on Image Fusion

1
China Ship Scientific Research Center, Wuxi 214082, China
2
Taihu Laboratory of Deepsea Technological Science, Wuxi 214082, China
*
Author to whom correspondence should be addressed.
J. Mar. Sci. Eng. 2025, 13(9), 1832; https://doi.org/10.3390/jmse13091832
Submission received: 6 August 2025 / Revised: 13 September 2025 / Accepted: 16 September 2025 / Published: 22 September 2025
(This article belongs to the Special Issue The Control and Navigation of Autonomous Surface Vehicles)

Abstract

Accurate and rapid detection of surface targets is a key technology for autonomous navigation of intelligent and unmanned ships. Faced with complex maritime environments and ever-changing maritime targets, it is impossible to consistently obtain accurate target detection results based on a single sensor. Infrared and visible light have strong complementarity. By fusing infrared and visible images, a more comprehensive and prominent fused image can be obtained, effectively improving the accuracy of target detection. This article constructs a lightweight convolutional neural network image fusion model based on the fusion framework of convolutional neural networks and then uses the constructed water surface dataset for comprehensive experimental testing of image fusion and object detection. The test results show that the object detection model trained using fused images has better detection performance than the object detection model trained using infrared and visible light images alone. So, integrating two types of images can provide better results for object detection and help promote the development of related technologies.

1. Introduction

Marine equipment undertakes important functions such as transportation, scientific research and exploration, and military security. Intelligence and unmanned technology are the trends in the development of ships and marine equipment, and comprehensive perception and intelligent target recognition are the key cores of autonomous navigation. Detection equipment is generally mounted on marine equipment and can rely on its own characteristics to detect the required marine information in different environments and conditions, providing support for the decision-making of marine equipment. However, the complex and ever-changing marine environment cannot guarantee accurate object detection results based on a single sensor, and effective detection cannot even be carried out under extreme conditions.
Visible cameras and infrared thermal imagers are commonly used water surface detection devices. Visible images have clear textures and rich background information, which can intuitively understand the situation of water surface targets in a detailed way. However, the imaging quality is affected by lighting, making it difficult to effectively detect at night and in backlighting, and difficult to detect disguised and obstructed targets. Infrared sensor imaging, based on thermal radiation, is not affected by lighting conditions, but the infrared image obtained lacks color features, the background information is fuzzy, and the spatial resolution and image contrast are low, so it is difficult to detect a variety of water surface targets directly.
Visible images and infrared images both contain a large amount of target feature information and have strong complementarity in maritime detection. The fusion of visible images and infrared images can retain significant contour information in infrared images and the rich texture information in visible images, improve the image quality, and contain more complex information. The fusion of visible images and infrared images can enhance the understanding ability of the scene, more accurately and comprehensively identify the maritime target, and provide support for all-weather maritime object detection.
Object detection technology can provide support for unmanned surface vessel navigation and positioning at sea; however, relying solely on a single sensor for object detection technology cannot always achieve accurate and error-free object detection results in backlit and low-light environments. This paper constructs a dataset applied to marine image fusion and object detection, and proposes an object detection method based on image fusion, which fuses the infrared image and visible image at the same time to obtain a fusion image with comprehensive information and prominent features of marine targets. This can effectively improve the accuracy of object detection results, effectively reduce object detection omissions and object detection errors, and improve the comprehensive perception ability of unmanned surface vessel in the environment of backlight and low illumination.

2. Literature Review

Before the widespread application of deep learning technology, image fusion research was generally conducted in the spatial and transform domains by designing activity level metrics or proprietary fusion rules. In the past few decades, many image fusion methods based on different principles have been proposed, such as multi-scale transformation-based methods [1], saliency-based methods [2], sparse representation-based methods [3], optimization-based methods, and hybrid methods [4]. Some researchers have proposed hybrid models to pursue better image fusion performance by combining the advantages of different frameworks [5]. Although traditional image fusion methods have made some progress, the increasingly complex transformations and representations cannot meet the needs of real-time image fusion [6], and fusion methods rely too much on manual design, lacking generalization and diversity.
In recent years, with the development and application of deep learning, image fusion methods based on deep learning can fully utilize the extraction ability of networks, adaptively update model parameters, and significantly improve the quality of fused images. Image fusion technology can be divided into the following categories: image fusion technology based on convolutional neural networks (CNNs); image fusion technology based on generative adversarial networks (GANs); image fusion technology based on autoencoder network (AE); image fusion technology based on transformer [7] framework.
The image fusion technology based on CNNs achieves end-to-end image fusion by designing network structure and loss function. Liu et al. first applied CNNs to the field of image fusion technology [8]. Some scholars improved the image fusion performance by modifying the network model structure. Ma et al. introduced the residual idea, which can effectively preserve the texture information in the image [9]. Zhu et al. designed a skip connected convolutional attention network to effectively reduce information loss during the fusion process [10]. Yang et al. introduced local saliency attention to extract infrared salient target heat source features and visible light detail features [11]. Xie et al. introduced attention mechanism in feature extraction to enhance the complementarity of different spectral information in fusion.
Goodfellow et al. first proposed the concept of generative adversarial networks [12], and Ma et al. first applied GANs to image fusion tasks in infrared and visible light [13]. A large number of scholars have conducted related research to alleviate the problem of information loss in visible light and infrared images. Yang et al. integrated guided filters into the generator [14], Yin et al. proposed a cross-scale pyramid attention mechanism [15], Xu et al. first proposed an image fusion model with dual discriminators [16], and Zhou et al. optimized the dual discriminators and designed an information discrimination module to guide the image fusion process [17].
Autoencoders train encoding and decoding networks through a large amount of data. The encoding network is used to extract image features, while the decoding network reconstructs the fused image based on the fused features. A large number of scholars extract different deep features by modifying the model structure [18,19,20,21].
The transformer framework uses attention mechanisms to better control the connection between global and local information. Wang introduced the self-attention mechanism to image fusion technology to capture the internal information connections between infrared images and visible images [22]. Li et al. combined the self-attention mechanism to perceive the long short-term dependencies between different modalities [23]. Zhao et al. extracted local high-frequency information and global low-frequency information through transformer and CNN dual-branch structures [24].
With the development and progress of science and technology, infrared and visible image fusion technology is widely used in the field of multiple object detection. In 2009, Bulanon et al. used the fusion image to complete the obstacle detection task of road scene at night [25]. In 2019, the Royal Swedish Institute of technology used deep learning to realize the fusion of remote sensing images and analyze the fire situation. In 2019, Sun et al. fused the collected visible image and infrared image on the sea [26]. In 2020, Xu et al. propose a novel method for infrared and visible image fusion with a deep learning framework based on a generative adversarial network (GAN) and a residual network and use it in road scene [27]. In 2024, Liu et al. used infrared and visible light fusion technology to detect various types of damage of asphalt concrete pavement [28], and in 2024, Wang et al. used Gan’s visible light and infrared image fusion technology to detect the deterioration degree of building facades [29]. Compared with the target detection results of single sensor, the fusion image can improve the target detection accuracy without increasing the amount of computation and greatly optimizes the target detection model. In 2025, Eum et al. proposed an enhanced object detection method that integrates a transformer-based backbone network into the You Only Look Once (YOLO-version 10) framework and applies it to large construction sites, achieving significant improvements in detecting heavy equipment of different sizes. Comparisons with other detectors show that this model is well suited for real-time deployment [30]. In 2025, Wang introduce a deep learning-based automated classification framework, which can analyze entire building façades and examine first-story façades, and evaluated five transformer-based architectures—Swin Transformer, ViT, PVT, MobileViT, and Axial Transformer. The Swin Transformer demonstrated the highest performance [31].
Marine targets are mostly small targets, and the size of the same target varies greatly in different scenes. In addition, infrared images and visible light images are often accompanied by a large amount of wave reflection information and complex background information interference. It is necessary to extract feature information for targets of different sizes and effectively fuse the extracted features. The image fusion technology based on CNN has strong feature extraction capabilities, which can utilize the deep feature extraction ability of convolutional networks to extract different feature information. It can also fuse visible image features and infrared image features through convolution technology, making it very suitable for maritime target fusion tasks. Therefore, this paper chooses the image fusion technology based on convolutional neural networks to conduct research on image fusion technology.

3. Object Detection Technology Based on Image Fusion

3.1. Image Fusion Model

The end-to-end CNN image fusion framework mainly includes three steps: feature extraction, feature fusion, and image reconstruction. Currently, most lightweight and efficient image fusion models [32,33,34] adopt the image fusion framework shown in Figure 1.
The feature extraction part is the core of image fusion technology. The feature extractor consists of two identical and parallel infrared and visible light feature extraction streams. The kernel size of a regular convolutional layer is 3 × 3 , and the activation function is Leaky Rectified Linear Unit (Leaky ReLU), which is used to extract shallow features. Subsequently, it includes two feature extraction modules for extracting fine-grained features from shallow features.
The feature fusion part concatenates the feature maps of infrared and visible images and then obtains the fused feature map through a convolution. The fused feature map is then fed to the image reconstruction module.
Image reconstruction aims to effectively restore the fused features and ultimately generate a fused image that includes infrared image features and visible light image features. The image reconstruction part consists of three residual connection modules and a convolutional layer. The residual module effectively preserves the features of each layer through residual connections, efficiently utilizes the fused infrared and visible features, and ultimately generates a fused image that combines both infrared and visible light features.

3.2. Object Detection Process

The target recognition process based on image fusion first requires preprocessing of the images. The collected visible and infrared images are preprocessed separately to obtain high-quality infrared and visible images. Then, an image fusion model is used to fuse them. The object detection and recognition process of the fused image is shown in Figure 2.

3.3. Evaluation Index

3.3.1. Evaluation Indicators for Image Fusion Technology

In order to demonstrate the rationality of the structural design and parameter selection of the image fusion model proposed in this article, objective evaluation indicators need to be used to evaluate the fused images.
Image fusion requires sufficient fusion of maritime target feature information from infrared and visible images. The fused image should have a high correlation with the source image, so mutual information (MI) [35] is used to measure the correlation between the fused image and the source image from the perspective of information entropy. The correlation coefficient (CC) is selected to calculate the degree of correlation between the fused image and the source image from a mathematical and statistical perspective.
The MI calculation formulas between the fused image and the source image are, respectively, shown in (1) and (2).
I X F = x , f p X F x , f l o g 2 · p X F x , f p X x p F f
M A B F = I A F + I B F
I X F is the mutual information between the source image X and the fused image F. X can be taken as A and B, where A and B are the source images of infrared and visible, respectively; p X F x , f is the joint histogram distribution of the fused image F and the infrared image A, and the normalized visible image B of the fused image F; the normalized edge histogram distributions of infrared image A, visible light image B, and fused image F are represented by p X x and p F f , respectively. MI is used to measure the amount of information that the source image is fused into the fused image, that is, to measure the correlation between the fused image and the source image. The greater the amount of information, the stronger the correlation between the fused image and the source image, and the higher the quality of the fused image.
The CC calculation formula is shown in (3) and (4); the larger the CC, the higher the similarity between the fused image and the source image.
r X , F = i = 1 H j = 1 W X i , j X ¯ F i , j μ i = 1 H j = 1 W X i , j X ¯ 2 i = 1 H j = 1 W F i , j μ 2
C C = r A , F + r B , F 2
r X , F represents the correlation coefficient between the fused image F and the source image X, H and W are the length and width of the image, respectively; X ¯ is the mean of source image; μ is the mean value of the fused image.
The fusion of infrared and visible images can result in a certain degree of loss of infrared and visible information. Therefore, the Peak Signal-to-Noise Ratio (PSNR) is selected to quantitatively evaluate the degree of information loss generated during the fusion process from the perspective of peak power and noise power. The Structural Similarity Index Measure (SSIM) [36] is used to evaluate the information loss during the image fusion process from the dimensions of brightness, contrast, and structure.
The larger the PSNR, the higher the similarity between the fused image and the source image. The calculation formula is shown in (5). r 2 is the peak value of the fused image; MSE is the mean squared error.
P S N R = 10 l o g 10 r 2 M S E
The larger the SSIM, the smaller the information loss during the fusion process. The calculation formulas are shown in (6) and (7).
S S I M X , F = x , f 2 μ X μ F + C 1 μ X 2 + μ F 2 + C 1 × 2 σ X σ F + C 2 σ X 2 + σ F 2 + C 2 × σ X F + C 3 σ X σ F + C 3
S S I M = S S I M A , F + S S I M B , F 2
σ X , F is the covariance between the fused image F and the source image X, while σ X X and σ F are the standard deviations between the fused image F and the source image X; μ X and μ F are the mean values of the fused image F and the source image X, respectively. C1, C2, and C3 are constants introduced to prevent constant denominators of 0. In order to approximate the fractional term to the same order as the numerator and denominator, ensuring numerical stability while maintaining fidelity to the original structure as much as possible, C1, C2, and C3 are usually set to 1. Therefore, in this paper, their values are all set to 1.
In the fusion of infrared and visible images, there may sometimes be artifact interference in the fused image. The artifact index N A B / F is selected to measure the number of artifacts in the fused image. The smaller the N A B / F , the better the fusion effect. The calculation formula is shown in (8), as follows:
N A B / F = x = 1 H y = 1 W A M ( x , y ) [ 1 Q A F w A + ( 1 Q B F w B ) ] x = 1 H y = 1 W ( w A x , y + w B x , y )
A M ( x , y ) represents the location of artifacts in the fused image; Q i . F represents the edge strength at x , y , where w i represents the importance of the source image.
In order to measure the features of the infrared and visible light images retained in the fused image, Feature Measurement Index (FMI) is selected to measure the feature information of the infrared and visible light images retained in the fused image. FMI evaluates the quality of the fused image from the aspects of the integrity, recognizability, and contrast of the target features in the fused image and selects the pixel level feature evaluation index FMI_pixel for evaluation. The larger the indicator, the more feature information in the fused image. The calculation formula is shown in (9), as follows:
F M I = M I A , F   +   M I B , F
M I X , F represents the amount of feature information about the source image contained in the measured fused image.
Considering the motion of ships equipped with sampling devices and the movement of maritime targets, image fusion technology needs to have a certain degree of real-time performance. This article uses the fusion time of a single image to measure the fusion efficiency of fusion technology.
In summary, this article selects the seven objective evaluation indicators mentioned above: MI, CC, PSNR, SSIM, N A B / F , FMI_pixel, and fusion time to comprehensively analyze the rationality of the fusion model design.

3.3.2. Evaluation Indicators for Object Detection Technology

Precision (P) and recall (R) are commonly used objective evaluation indicators in target recognition tasks. Using P as the vertical axis and R as the horizontal axis can draw a PR curve. The PR curve considers both precision and recall, which can more comprehensively measure the target recognition effect. The larger the area enclosed by the PR curve, the better the model’s target recognition performance for sea targets. Average Precision (AP) refers to the PR curve area of a specific class in all recognized images.
For multi-category object recognition, Mean Average Precision (mAP) is commonly used to measure the performance of object recognition. The calculation formula for mAP is shown in Formula (10), where C is the target category.
m A P = 1 C i = 1 C A P C

4. Optimization of Image Fusion Technology

4.1. Optimization of Feature Extraction Module

The infrared image and visible light image feature extraction networks adopt the same structural design, both including a convolutional layer module and two feature extraction modules. Firstly, a 3 × 3 convolution is used for preliminary feature extraction. For the initially extracted feature information, the batch normalization operation is used for feature normalization, and the Leaky ReLU activation function is used for activation. Then, the preliminarily extracted features enter the feature extraction module.
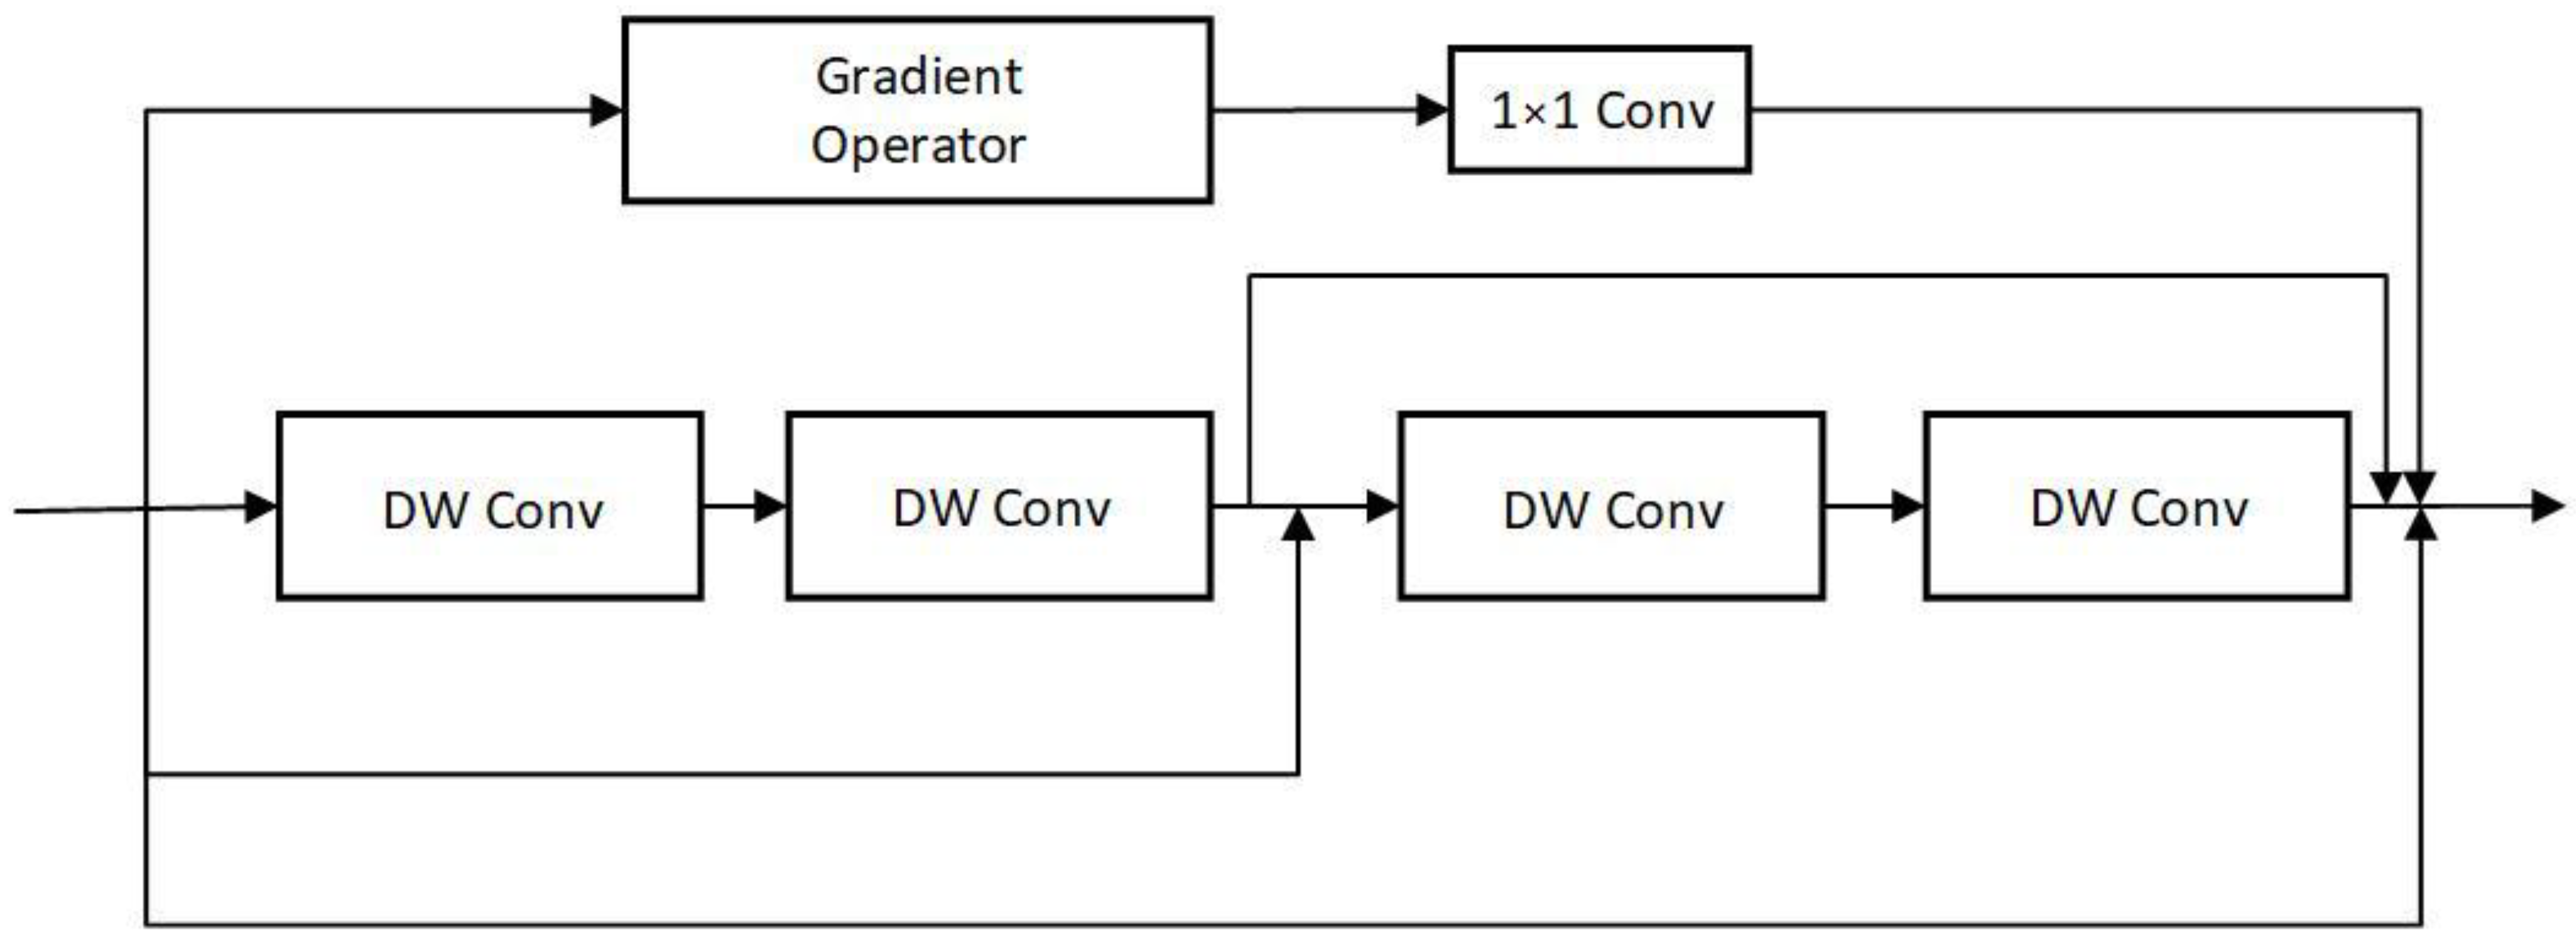
The feature extraction module follows the principles of lightweight and efficient design and introduces multiple different feature extraction modules to comprehensively and fully extract feature information of marine targets at different scales. The feature extraction module is shown in Figure 3. The main process of the feature extraction branch includes two 3 × 3 Depth-wise separable convolutions (DW Conv). DW Conv is an efficient convolution operation that reduces computation and parameter count, thereby improving the speed and efficiency of the model [37], aiming to further extract the extracted features.
The gradient branch aims to preserve the overall structural strength of the image, calculate the gradient amplitude of the features extracted from the preliminary feature image using the gradient branch, and use a 1 × 1 regular convolution layer to eliminate channel dimension differences. Introducing 1 × 1 can also improve the generalization performance of this branch without increasing the computational complexity [38]. The convolution kernel used for gradient branches is shown in Formula (11). Gradient operations are performed in both horizontal and vertical directions to extract edge information from the image, and the absolute values of the horizontal and vertical calculation results are then summed as the extraction result of the gradient extraction branch.
1 0 1 2 0 2 1 0 1
The feature extraction module proposed in this article consists of two convolution modules and a gradient extraction branch. In order to demonstrate the rationality of the selection of the convolutional network module design, the gradient branch was removed and the number of convolutions in the feature extraction module was changed for comparative experiments. A total of 750 sets of registered visible light and infrared images were randomly selected from the offshore target dataset to train the image fusion models of different feature extraction modules. A total of 100 sets of images from different scenes were randomly selected for testing, with batch size set to 4 and training epochs set to 100. Except for the feature extraction module, the network structure and parameters remain unchanged.
Using an objective evaluation method, 100 sets of sea dataset images were randomly selected for objective analysis. MI, PSNR, N A B / F , CC, SSIM, FMI_pixel, and fusion time were used to evaluate the fused images. Seven indicators were used to evaluate 100 images, and the average value was taken as the experimental result. The results obtained are shown in Table 1. For image fusion test, the Adam solver was used for network training, and 150 rounds of training were conducted. The initial learning rate was set to 10−3, and it was halved every 10 rounds until the end of training.
The results show that the feature extraction module designed in this paper can achieve the best performance on MI, PSNR, N A B / F , CC, SSIM, and FMI_pixel. The generated fusion image has the highest similarity with infrared and visible images, and is closely related to the source image, with strong correlation. The generated fusion image has fewer artifacts and retains the most feature information. The fusion time of a single image is only slightly longer compared to using a CNN module alone and a feature extraction module without gradients, still having a good speed.

4.2. Optimization of Loss Function

Referring to the structural tensor loss function proposed by Jung et al. for optimization [33], let I be the M-channel image. The gradient of image I at pixel points ( x   ,   y ) can be represented by a Jacobian matrix as shown in (12):
J I x , y = x I 1 x , y y I 1 x , y x I M x , y y I M x , y
where I i is the I-th channel of the M-channel image I, x represents the horizontal derivative, y represents the derivative in the vertical direction. The gradient at direction v = [ c o s θ   s i n θ ] T is given by J I x , y v . The 2 × 2 matrix Z θ x , y = ( J I x , y ) T J I x , y is a structural tensor. The combination-derived structure of multi-channel images can be defined using this structural tensor as shown in Formula (13).
Z I x , y = i = 1 M ( x I i x , y ) 2 i = 1 M ( x I i x , y ) ( y I i x , y ) i = 1 M ( y I i x , y ) ( x I i x , y ) i = 1 M ( y I i x , y ) 2
The basic idea of image fusion based on structural tensors is that the fused image should have the same structural tensor as the original image, and contrast information should be preserved during the fusion process. Using the structural tensor as the loss function for the fusion model is shown in Formula (14):
L u , I = L L u , I p u t + λ L T u , I
L L is the intensity fidelity item, which is used to emphasize the fidelity of fusion results at the pixel intensity level, and try to keep the pixel intensity information of the original source image from being distorted. L T is the structure tensor fidelity term, and λ is the balance parameter between the two terms. To ensure that the structure tensor can be introduced as a fusion reference rather than as a model reference, λ is usually set to 10−2, based on relevant experimental results of image fusion technology using the structural tensor for the best fusion effect. The calculation formula for L L is shown in Formula (15):
L L u , I p u t = 1 H W ( x , y ) Ω u x , y I p u t x , y F 2
where Ω represents the coordinate domain of the image, A 2 represents the L2 norm of vector A, and ( x , y ) is the corresponding coordinate in the coordinate domain. The strength fidelity term forces the fused image u to be similar to the assumed image I p u t . The assumed image is usually set to one of the following three types: infrared image, visible image, and the weighted average of infrared image and visible image.
The fusion strategy did not consider the specific performance of infrared images and visible images under different lighting environments and conditions. This article redesigns the assumed image and distinguishes it based on the performance of infrared and visible images under different conditions. In daytime scenes, visible images usually contain more details, and infrared images have better representation of the edge contours and thermal distribution details of sea targets. At this time, it is assumed that the calculation formula for the image is shown in Formula (16).
In daytime scenes, visible images usually contain more details than infrared images. Infrared images have better representation of the edge contours and thermal distribution details of sea targets. Therefore, it is assumed that the image needs to contain both visible image feature information and infrared image feature information. Considering that visible images have a higher resolution, the weight of infrared images is set to 0.4 and the weight of visible light images is set to 0.6. It can effectively preserve the thermal information and edge contour information of maritime targets in infrared images, while also retaining more texture details and color information in visible images.
I p u t x , y d a y = 0.4 I R x , y + 0.6 V I S x , y
In nighttime and overexposed scenes, visible devices cannot effectively detect maritime targets and there is limited useful information in visible light images. Image fusion aims to preserve the position and background information of light sources in visible images. Infrared images are not affected by lighting and can effectively detect the distance and position information of sea targets in both low light and overexposed scenes at night. In nighttime and overexposed scenes, the calculation formula of the assumed image is shown in (17). In nighttime and overexposed scenes, visible devices cannot effectively detect maritime targets, and there is limited useful information in visible images. Image fusion aims to preserve the position and background information of light sources in visible images. Infrared images are not affected by lighting and can effectively detect the distance and position information of sea targets in both low light and overexposed scenes. In summary, assuming that the image needs to contain more infrared image feature information and has a certain amount of visible image information, it is assumed that the image only needs to have a small amount of visible characteristic information in night scenes and overexposed scenes, and a large amount of infrared image feature information needs to be retained. Therefore, the weight of the infrared image is set to 0.8 and the weight of the visible image is set to 0.2. At this point, assigning a higher weight to the infrared image aims to preserve the edge contour information and heat distribution information of maritime targets in the infrared image, while assigning a lower weight to the visible light image aims to preserve a small amount of light source information and background information.
I p u t x , y n i g h t = 0.8 I R x , y + 0.2 V I S x , y
The selection and use of I p u t x , y d a y and I p u t x , y night are judged by calculating the average brightness in visible images. If the average brightness of the visible image is greater than 100, it is judged as a daytime image; otherwise, it is judged as a nighttime image. The process is shown in Formula (18):
I p u t x , y = I p u t x , y day ,     brightness 100 I p u t x , y night ,     brightness <   100
The calculation formula for the fidelity term L T in the structural tensor is shown in Formula (19):
L T u , I = 1 H W x , y Ω Z u x , y Z I x , y F 2
where B F represents the Frobenius norm of B. This item aims to preserve the overall contrast of multiple images in the output image.

4.3. Analysis of the Impact of Fusion Parameters

4.3.1. Feature Extraction Dimension

To effectively preserve the effective feature information in infrared and visible images, the image fusion model proposed in this paper does not use downsampling, upsampling, and pooling techniques throughout the entire process. The convolution step size used is set to 1, and the size of the feature images remain unchanged in the image fusion process. Comparative experiments were conducted on the design of feature map dimensions. The feature map dimensions extracted by convolution were set to 2, 4, 8, 16, 32, 64, 96, 128, and 256. The corresponding parameters were adjusted in the feature fusion and image reconstruction sections to maintain consistency in the feature dimensions. Finally, 9 different feature map dimensions were obtained as comparative experimental models.
A total of 750 sets of infrared and visible images were randomly selected from the dataset for training and 100 sets of infrared and visible light images were randomly selected for testing. Using Adam solver for network training, 150 rounds of training were conducted. The initial learning rate is set to 10−3, and the learning rate was halved every 10 rounds until the end of training. The experimental results obtained are shown in Table 2.
MI measures the correlation between fused images and infrared and visible light images. Before dimension 8, the correlation increases significantly with the increase in dimension. After dimension 8, the mutual information does not improve significantly with the increase in dimension. At dimension 32, the correlation does not increase but decreases. PSNR measures the similarity between the fused image and the source image, which increases the most when the feature map dimension is 4. Subsequently, as the dimension increases, the correlation between the fused image and the source image slightly increases. CC measures the relationship between the fused image and the source image. The correlation coefficient increases the most at dimension 4, then slowly increases, reaches its maximum at dimension 64, and then decreases with the increase in dimension. N A B / F measures the number of artifacts in the fused image. The number of artifacts in the fused image is the lowest when the feature map dimension is set to 8. The higher the SSIM, the higher the similarity between the fused image and the infrared and visible images, and the smaller the information loss during the fusion process. The SSIM continues to increase with the enhancement of the dimension before reaching dimension 8, decreases after dimension is greater than 8, then increases, and reaches its peak at feature image dimension 96. The larger the FMI_pixel, the more feature information there is in the fused image. The feature information is well represented at dimension 4, then slowly increases and reaches its peak at 96.
In summary, when the feature image dimension is set to 8, the overall performance is the best, and the fusion time of a single image is relatively short. Therefore, this article designs the feature image dimension as 8.

4.3.2. Image Reconstruction Module

Image reconstruction aims to effectively restore the fused features and ultimately generate a fused image that includes infrared image features and visible light image features. In order to effectively generate fused images without excessive computation, the image reconstruction part consists of three residual connection modules and a convolutional layer.
To further study the impact of the number of residual modules in the image reconstruction part on image fusion performance, this paper only changes the number of residual connection modules in the image reconstruction part, on the basis of keeping the network structure and parameters of feature extraction and feature fusion part unchanged, and selects four different numbers of residual connection modules to carry out experimental research. The experimental results are shown in Table 3.
The experimental results show that when the number of residual modules in the image reconstruction part is 3, the best performance can be achieved in the six indicators of MI, PSNR, N A B / F , CC, SSIM, and FMI-pixel. The number of residual modules in the image reconstruction part has little effect on the fusion image effect and the generation time of the fusion image. Taking into account all factors, the optimal number of residual modules is 3.

5. Analysis of the Impact of Object Detection Models

Compared to terrestrial environments, maritime environments are complex and varied, requiring a comprehensive consideration of the deployment and performance of target recognition models. For model deployment, it is usually necessary to deploy it in the industrial computer of the ship. Industrial control computers usually need to monitor the real-time status of unmanned ships, carry ship control systems for real-time control, and carry sensing devices to perceive the status of sea targets and ships themselves. Therefore, object detection models need to be easy to deploy and able to achieve efficient computation with less computing power consumption. Considering the motion of the ship itself and the movement of detecting targets at sea, it is necessary for the object detection model to have speed and be able to quickly recognize moving targets at sea during the ship’s movement.
YOLO [38] is an efficient object detection model that can quickly identify target information in images end-to-end. Its detection speed and computational cost have been significantly improved compared to traditional two-stage models. YOLOv5 [39] and YOLOv8 [40] are commonly used object detection models in the field of industrial object detection. YOLOv10 [41] further advances the performance of the YOLO series from both post-processing and model architecture, bringing high performance and low latency. YOLOv10 has a small number of parameters, is easy to deploy on ships, has low computation latency, and has the highest target recognition confidence, making it suitable for ship motion scenes and fast motion scenes of sea targets.
The same 1000 fusion images were randomly selected from the dataset to train the object detection model, and the training set and verification set were divided according to the ratio of 4:1. In this paper, model parameters are selected to evaluate memory usage during deployment. The single image detection time is selected to evaluate object detection efficiency, while the mAP@0.5 and mAP@[0.5:0.95] indices are used to evaluate the accuracy of object detection. To sum up, this paper selects four indicators to evaluate yolov10, and the experimental results are shown in Table 4.
Compared with YOLOv10-n, YOLOv10-s has significantly improved its object detection ability, especially in the mAP@[0.5:0.95] metric, where the number of parameters has increased. However, the number of parameters is still relatively small, and the recognition time for a single image is shorter. Compared to YOLOv5-s and YOLOv8-s, YOLOv10-s maintains the same number of parameters, but has a shorter single image objection time, higher mAP@0.5 indicator, and higher mAP@[0.5:0.95] indicator. Taking all factors into consideration, YOLOv10-s is selected as the target recognition model for this article.
In summary, the image fusion model based on convolutional neural networks constructed in this article is shown in Figure 4. The whole model is divided into two parts: image fusion and target detection. Firstly, the visible light image is converted to YCrCb color space, which separates the brightness information from the color information. The Y channel represents the brightness of the image, which is a component without color features. The Y channel has the strongest correlation with the infrared image. The CR channel represents the difference between the red component and brightness, and the CB channel represents the difference between the blue component and brightness. Cr and CB channels jointly represent the color information of the image. The y-channel input of the visible light branch with the strongest correlation to the infrared image was selected. Finally, the generated single channel image is spliced with the previously extracted Cb and Cr channels to obtain a color fusion image.

6. Experimental Verification of Maritime Object Detection

This paper conducted extensive experiments on image fusion and object detection in different maritime situations to evaluate the improvement of image fusion technology on maritime object detection performance. The computer hardware environment used in the experiment is i5-12500H CPU, NVIDIA RTX2050 graphics processing GPU, and the software environment used is CUDA11.8, python3.9.21. The deep learning framework used is pytorch 2.0. The model was trained using YOLOv10-s with batch size set to 4 and training epochs set to 500.

6.1. Marine Object Detection Dataset

At present, most infrared and visible light fusion datasets are aimed at the field of road traffic and have not been involved in the field of maritime applications. There is a lack of corresponding maritime target recognition and detection datasets. The open-source VAIS infrared and visible light fusion image dataset is classified according to ship types, but the sampling scene is single and does not fully consider the respective characteristics of infrared and visible images and the specific applications of maritime image fusion and object detection.
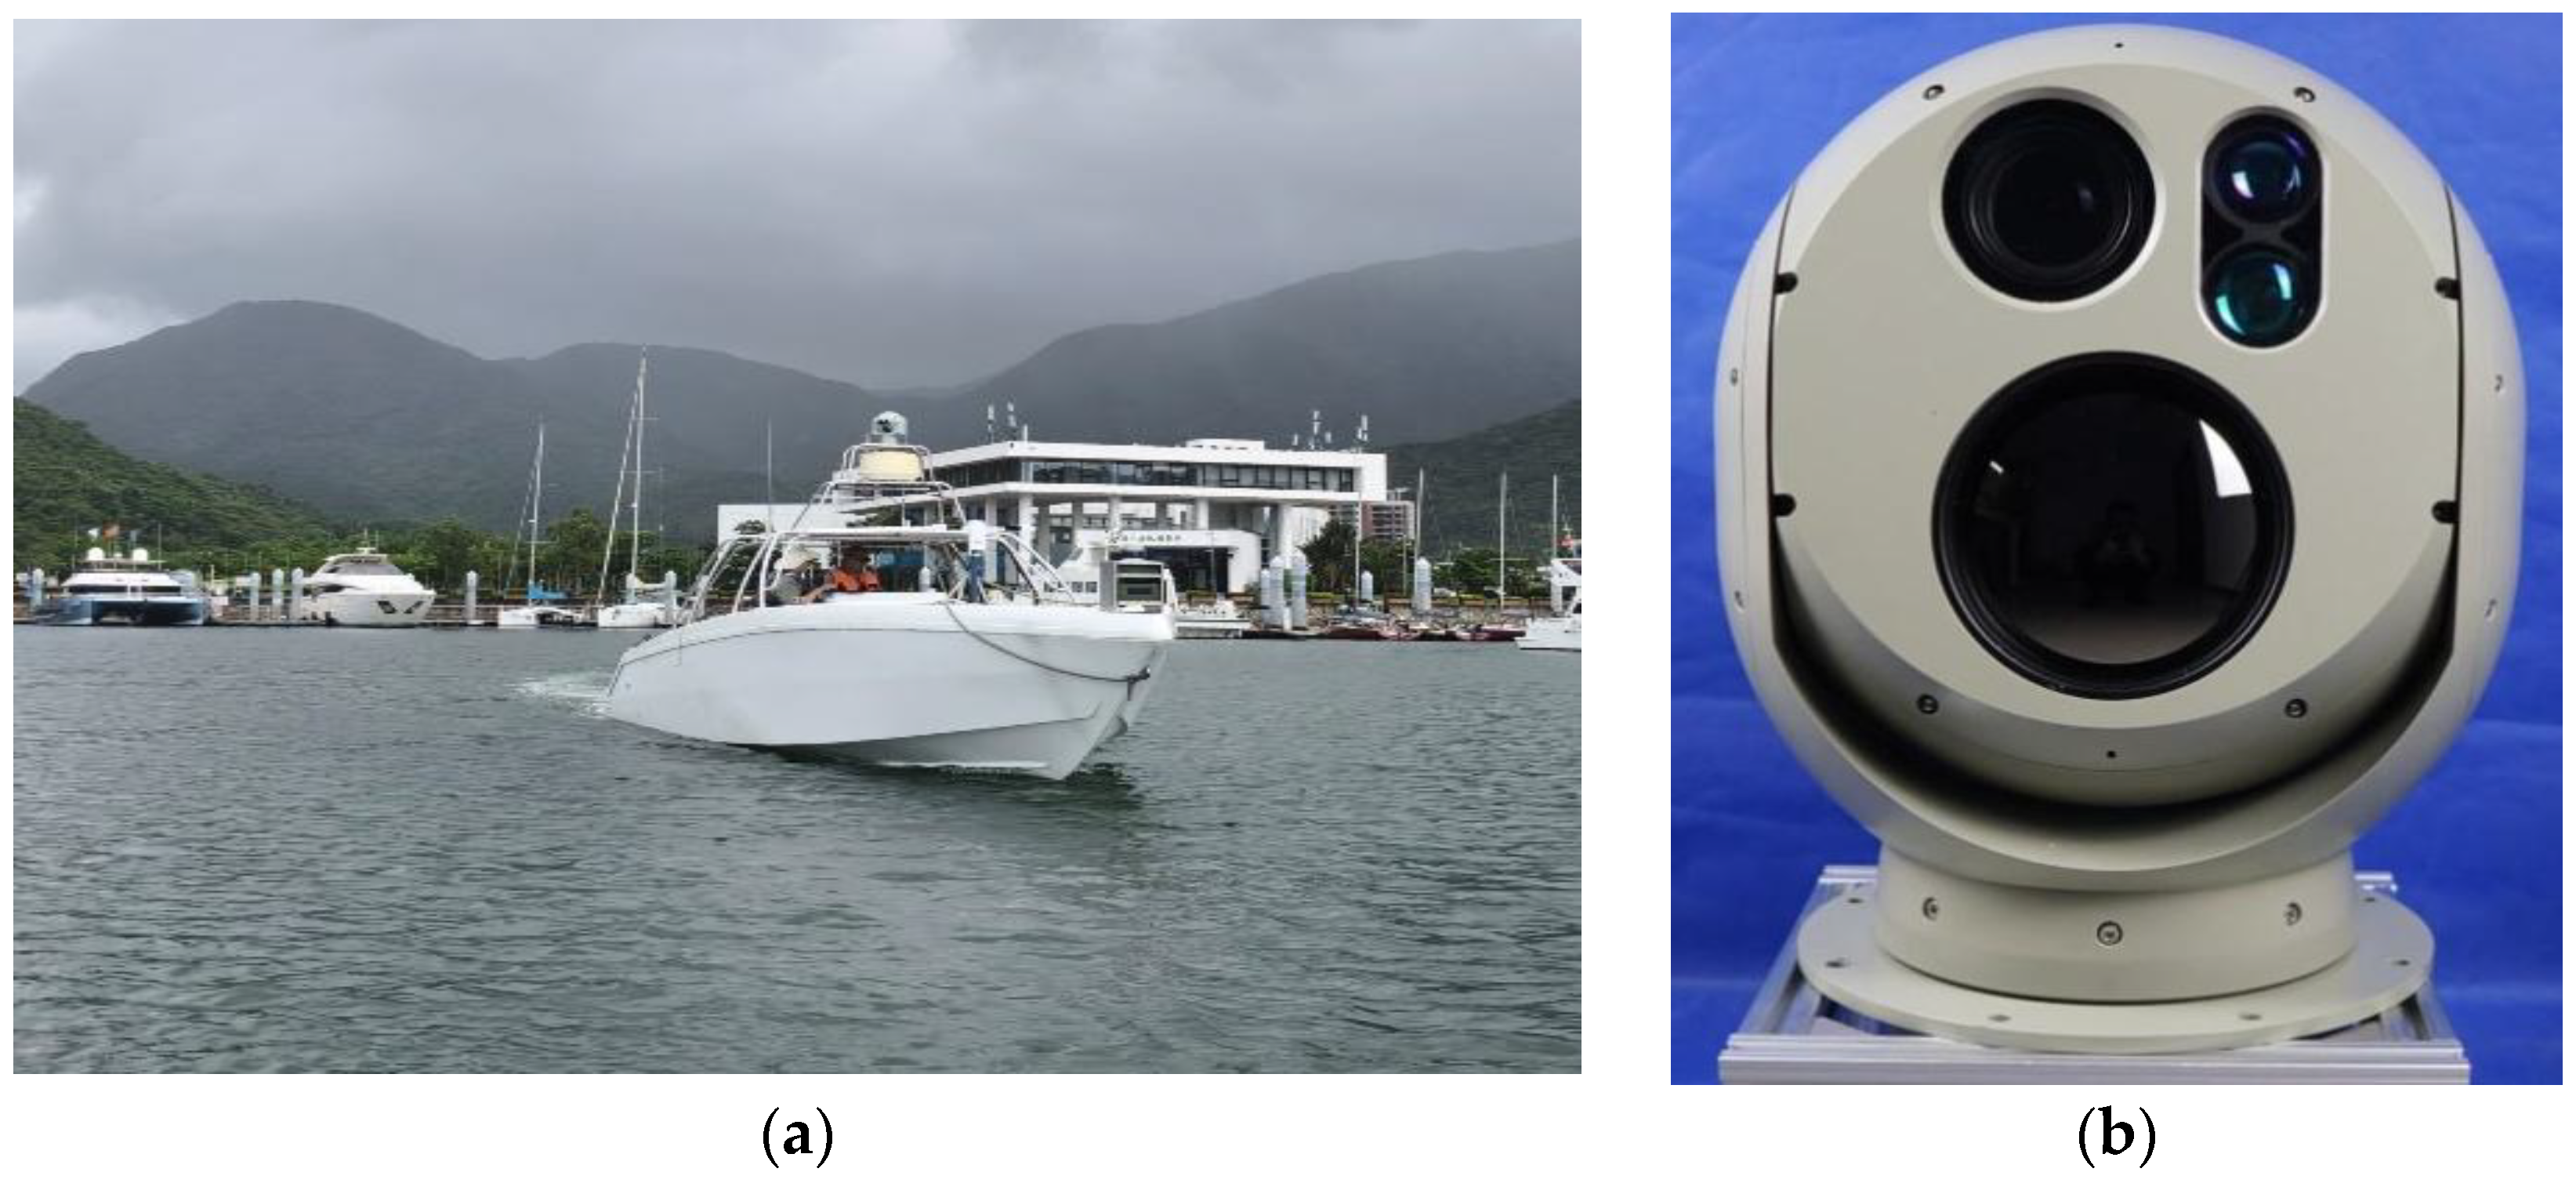
This paper presents a visible and infrared image dataset suitable for marine image fusion and object detection. The SCB350 spherical photoelectric equipment, mounted on the top of the ship, collected visible and infrared image data on the sea through several sea trials in Gonghu Bay of Taihu Lake, along the Beijing Hangzhou Grand Canal in Wuxi, and Qixing Bay in Shenzhen. The SCB350 spherical optoelectronic gimbal integrates optical sensors such as visible cameras and infrared thermal imagers internally. The device has a compact design structure, high cost-effectiveness, quick installation, high control accuracy, and can be equipped on various types of shipborne platforms. The data sampling vessel and the sampling equipment SCB350 used are shown in Figure 5.
This paper combines the Laplace operator with Unsharp Masking to enhance the edge information of the collected infrared and visible images. To address the issue of spatial misalignment between visible and infrared images caused by different positions and sizes of the images, a center-target-matching-based image registration method is used to optimize Canny edge detection, and template matching is used to achieve the registration of visible and infrared images. Finally, a visible and infrared image is obtained with a pixel size of 640 × 460 px that is aligned in time and space.
The collected sea targets include sailboats, cruise ships, personnel, buoys, test boats, and small boats, with a total of 29,007 aligned visible and infrared images. The sampled images were filtered, and those containing salient targets were selected to form the dataset. The resulting dataset comprises 3544 aligned infrared and visible image pairs. The open-source tool LabelImg was subsequently used to annotate the data. Due to the one-to-one correspondence between infrared and visible image numbers, the infrared and visible images in the same group are perfectly aligned in time and space. Therefore, a clear image was manually selected in each group of infrared and visible images for marking the sea target and generating the corresponding label file.
For visible cameras, lighting conditions have the greatest impact on the imaging quality of visible images. According to different lighting environments, marine application scenes are divided into normal lighting scene, low lighting scene, and backlight scene based on lighting conditions. As shown in Figure 6, under normal lighting conditions at sea, both visible and infrared images can obtain clear sea target images. Visible cameras cannot effectively perceive some targets in low light conditions, while infrared thermal imagers can still work normally. The strong reflection of light sources in the backlight scene leads to the loss of detailed information of sea targets, resulting in visible cameras being unable to clearly perceive the information of sea targets in backlight areas. Infrared thermal images are not affected by strong light and can perceive the thermal radiation information of maritime targets in areas affected by strong light sources.
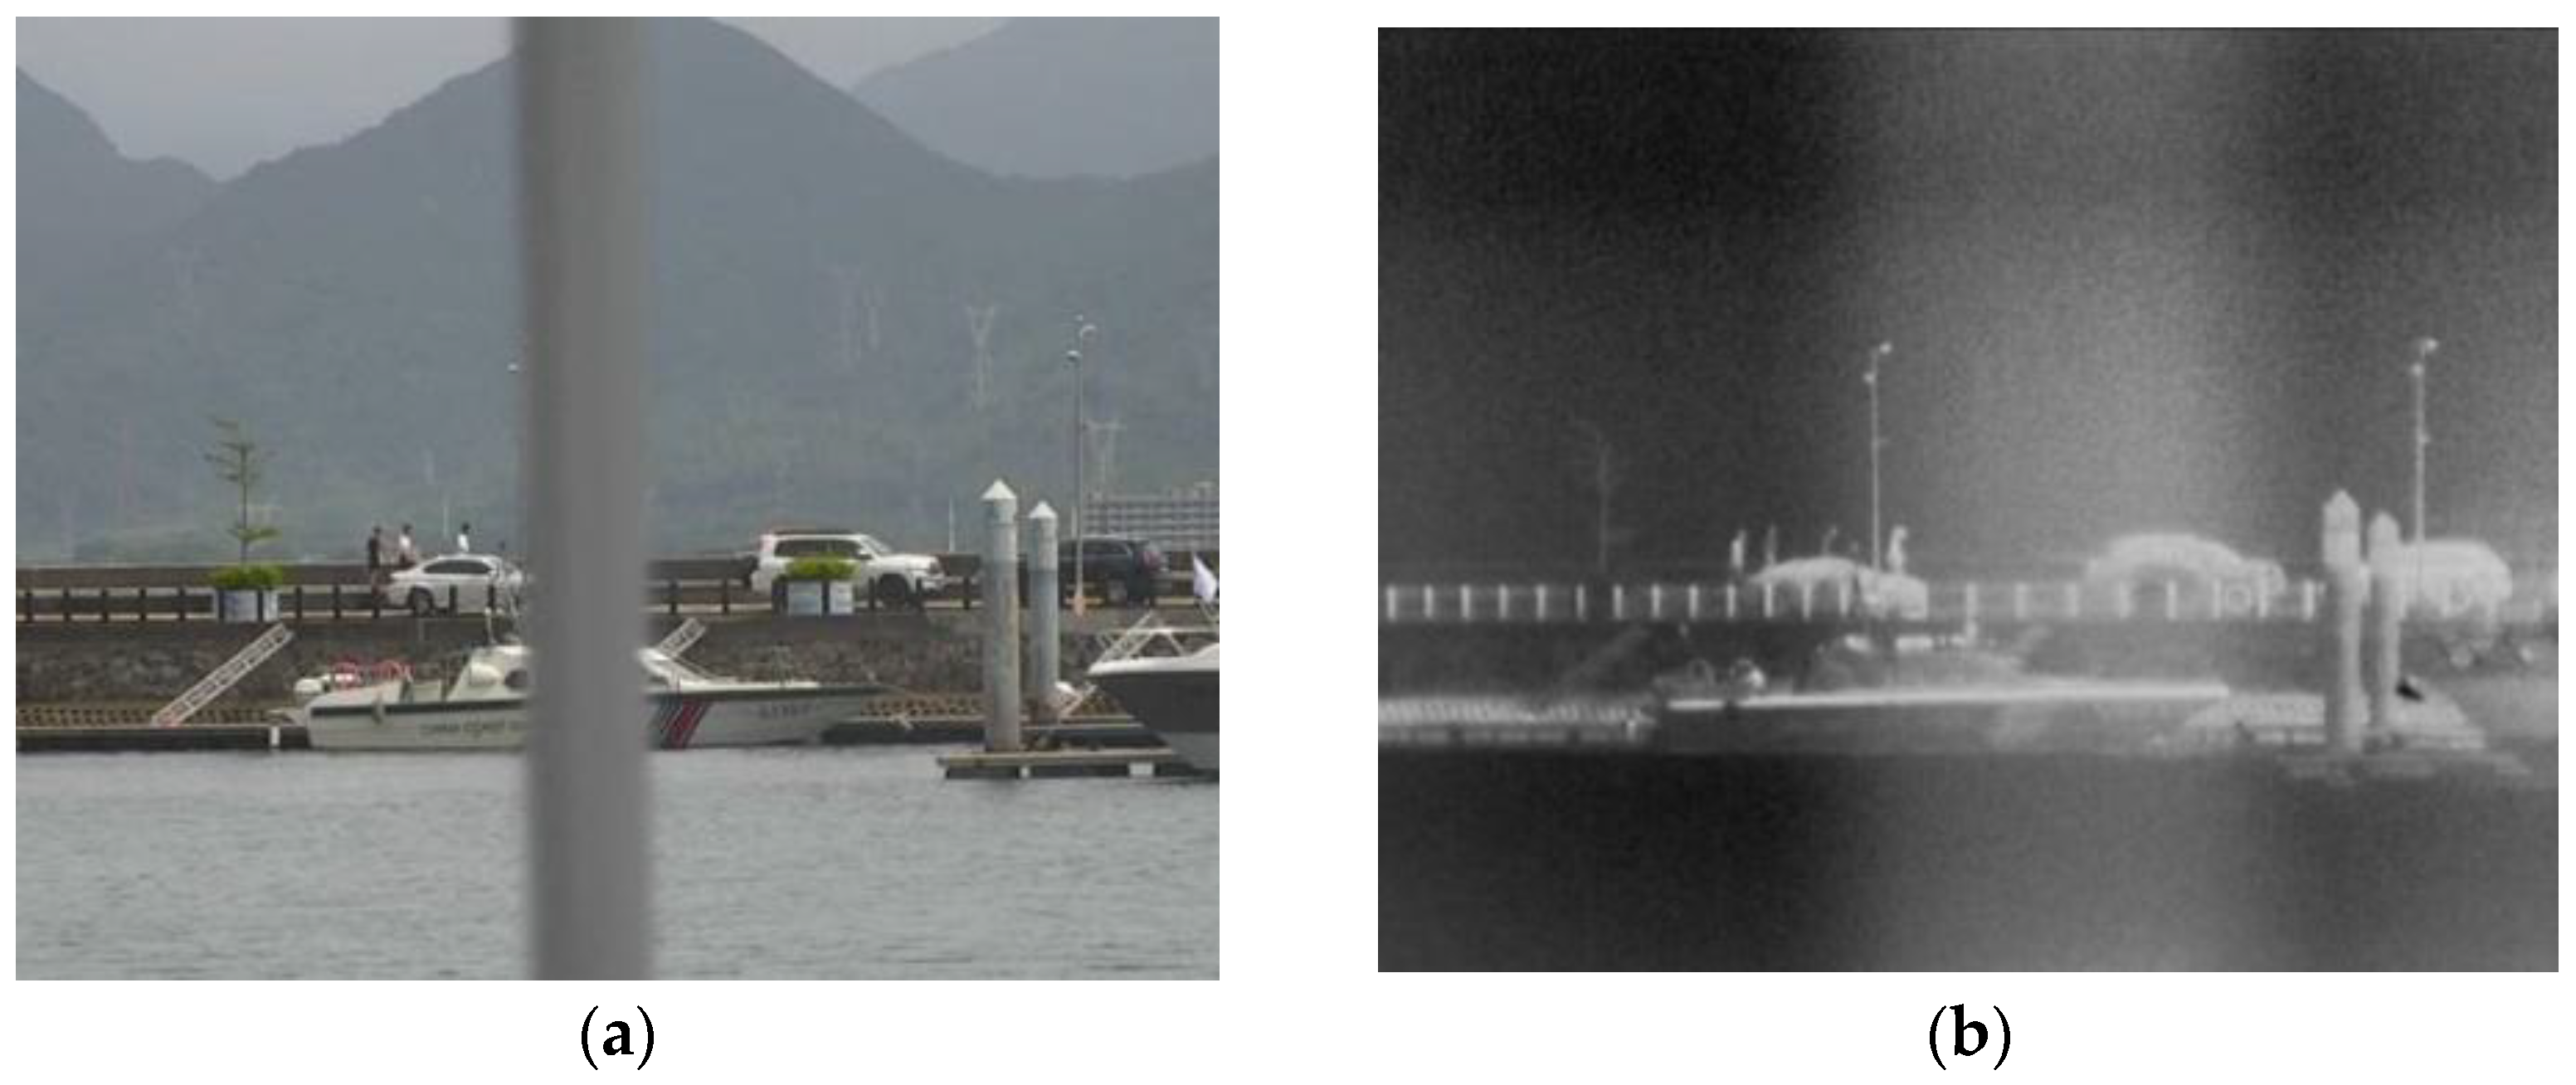
Infrared images are not easily affected by lighting conditions and can penetrate obstructions. However, infrared images lack color feature information and have low resolution. Under unchanged lighting conditions, the sea target occlusion scene can be further subdivided within the normal lighting scene. An example of a maritime target occlusion scene is shown in Figure 7.
The 3544 aligned visible and infrared images in the dataset were classified according to the 4 typical scenes mentioned above. The classification results are shown in Table 5.
For the four different scenarios mentioned above, the training set, test set, and validation set are divided into a 4:1:1 ratio. In different target experiments at sea, the confidence threshold of the object detection model is set to 0.5. The average confidence of the target is used to measure the detection effect in the test data, and the mAP@[0.5:0.95] index is used for quantitative analysis in the test data.

6.2. Multi-Object Detection Experiment in Normal Lighting Scenes

In a normal lighting scene, there are multiple sea targets of different sizes and types in the image, and the object detection model needs to accurately identify multiple sea targets. Due to the large number of targets at sea, both infrared and visible images cannot accurately represent the significant feature information of all targets at the same time, resulting in object detection errors in both visible and infrared images. The object detection results of the multiple target scenes are shown in Figure 8, showing a group of multiple target scenes including test boat, buoy, and personnel as an example.
In Figure 8a, the visible object detection model can accurately identify the buoy target with an object detection confidence level of 0.85, correctly detecting the test speedboat target with a confidence level of 0.82. However, it fails to recognize the personnel target. In Figure 8b, the infrared object detection model can only identify the test speedboat target and with a low target detection confidence level of 0.59 and is unable to detect the distant buoy and personnel targets. In Figure 8c, the fusion image object detection model can accurately identify all three types of targets. The buoy target has an object detection confidence level of 0.92, the personnel target has a confidence level of 0.67, and the test speedboat target has a confidence level of 0.80. The fusion image technology can effectively fuse the color information of visible images and the heat source information of infrared images, and supplement and strengthen the personnel feature information. Therefore, the target detection model can effectively detect personnel targets with a confidence of 0.67. Image fusion technology can effectively combine the heat source distribution feature information in infrared images with the detail contour feature information and color information in visible images and further strengthen the feature information of sea targets; therefore, the speedboat target and buoy target have high confidence.
Image fusion technology can leverage the strengths and compensate for the weaknesses of different imaging modalities. It can effectively enhance the feature information of different targets in a multi-target marine scene at the same time. Therefore, the fusion image can achieve correct object detection results and possess higher confidence levels.
In maritime multi-target scenes, the selected maritime targets include pleasure boats, personnel, test boats, buoys, sailboats, and small boats. The experimental results of average detection confidence for different maritime targets in complex maritime environments are presented in Table 6.
Quantitative analysis was conducted on the test data in this scenario using P and R indicators, and the results are shown in Table 7.
Quantitative analysis was conducted on the test data in this scenario using the mAP metric. The selected test metric was mAP@[0.5:0.95], and the test results are shown in Table 8.
The average detection confidence experimental results, P, R, and mAP@[0.5:0.95] for sea multi-target scenes show that, in maritime multi-target scenes, the object detection results of visible images are slightly better than those of infrared images. Both types of target detection results contain errors, and the average object detection confidence for small targets, such as personnel and buoys, is relatively low. In the fusion image object detection results, all targets have a relatively high average object detection confidence. In maritime multi-target scenes, image fusion technology can effectively enhance the characteristic information of small targets and reduce the missed detections and errors in the object detection results.
In the case of small-scale object occlusion, a visible camera cannot penetrate the hidden object and detect the hidden sea target in the scene of sea target occlusion. The infrared thermal imager is not affected by small-scale occlusion and can effectively detect the information of the hidden sea target. Taking a group of occlusion scenes including small boats, cars, and personnel as an example, the target recognition result of the target occlusion scene is shown in Figure 9.
In Figure 9a, the visible object detection model can correctly identify partially occluded cars and small boats, with detection confidences of 0.95 and 0.94. However, it fails to detect the completely occluded personnel and exhibits detection omissions. In Figure 9b, the infrared object detection model is unaffected by occlusion and can correctly identify partially occluded cars and small boats, with detection confidences of 0.93 and 0.97. However, it cannot detect the personnel target or the cruise ship that is only partially visible from its bow on the right side. In Figure 9c, the fusion image target detection model can accurately detect all targets, including the occluded cars, small boats, and personnel, with detection confidences of 0.98, 0.94, and 0.71. In occlusion scenes, fusing infrared and visible images can further enhance the information of small targets such as personnel on the basis of visible images.
The selected sea targets in the normal illumination target occlusion scene at sea are pleasure boats, small boats, sailboats, and personnel. The target recognition test results of different sea targets in the sea target occlusion scene are shown in Table 9.
Quantitative analysis was conducted on the test data in this scenario using P and R indicators, and the results are shown in Table 10.
Quantitative analysis was conducted on the test data in this scenario using the mAP metric. The selected test metric was mAP@[0.5:0.95], and the test results are shown in Table 11.
The experimental results indicate that, in target occlusion scenes, there are numerous errors and omissions in both the visible object detection results and the infrared object detection results. By using the infrared feature information to supplement the occlusion information in visible images and to further enhance the feature information of visible images, the object detection performance in occlusion scenes can ultimately be improved.
In conclusion, in normal illumination maritime scenes, the fusion technology of visible images and infrared images can effectively integrate the infrared target features with the visible target features. It can effectively prevent missed target detections, and while obtaining correct object detection results, it also has a relatively high object detection confidence level.

6.3. Object Detection Experiment in Low Illumination and Backlight Scenes

The lighting factor has a huge impact on visible light images. Visible light target detection models cannot accurately detect targets in the dark. Infrared target detection models are not affected by lighting and can obtain correct target detection results. However, infrared images lack color features, and some target detection confidence is not high. Take a group of low illumination scenes including pleasure boats and personnel as an example, and the object detection results of the low illumination scenes are shown in Figure 10.
In Figure 10a, the visible object detection model can only identify a pleasure boat target with a detection confidence of 0.73 and fails to correctly detect the personnel target in the dark. In Figure 10b, the infrared object detection model can obtain correct object detection results. The pleasure boat target and the personnel target have target detection confidences of 0.97 and 0.63, respectively. In Figure 10c, the fusion image object detection model can also obtain correct object detection results. It can accurately detect both the pleasure boat and the personnel, with detection confidences of 0.97 and 0.81, respectively.
The selected sea targets in low illumination scenes are pleasure boats, small boats, and personnel. The results of different sea targets are shown in Table 12.
Quantitative analysis was conducted on the test data in this scenario using P and R indicators, and the results are shown in Table 13.
Quantitative analysis was conducted on the test data in this scenario using the mAP metric. The selected test metric was mAP@[0.5:0.95], and the test results are shown in Table 14.
The experimental results show that in low illumination scenes, the object detection results of infrared images are superior to visible images. Image fusion technology can fuse visible image light source information with infrared image heat source information and use the heat source contour information of the target in the infrared image to enhance the edge contour information of thin formations and visible images.
In backlight scenes, visible images are affected by strong light sources, resulting in the widespread contamination of light source information and inaccurate display of characteristic information of maritime targets. At this point, the infrared images can obtain accurate target recognition results but lack information on the position of the light source. Taking a group of backlit scenes containing a pleasure boat as an example, the object detection results of the backlit scene are shown in Figure 10.
In Figure 11a, the visible object detection model cannot detect the pleasure boat in the night backlight. In Figure 11b, the infrared object detection model can correctly detect the pleasure boat in the night backlight with a confidence of 0.87. In Figure 11c, the fused image object detection model can correctly detect the pleasure boat in the night backlight with a confidence of 0.94.
The selected sea targets in backlight illumination scenes are pleasure boats and test boats. The results of different sea targets are shown in Table 15.
Quantitative analysis was conducted on the test data in this scenario using P and R indicators, and the results are shown in Table 16.
Quantitative analysis was conducted on the test data in this scenario using the mAP metric. The selected test metric was mAP@[0.5:0.95], and the test results are shown in Table 17.
The experimental results show that infrared image object detection results are better than visible object detection results in backlight scenes, and the fused image has the highest average confidence level in object detection results in backlight scenes. Image fusion technology in backlight scenes can supplement certain infrared target information while retaining significant visible light target information.
Overall, in low illumination and backlight scenes at sea affected by illumination, the infrared image object detection model performs better than the visible object detection model, but not as well as the image fusion object detection model. The fusion technology of visible and infrared images can supplement the color features in visible images based on infrared images, and fuse infrared target features with visible target features to obtain accurate and high confidence object detection results.

6.4. Quantitative Analysis of Object Detection Results

The object detection performance was analyzed using an image test set, and P, R mAP@0.5, and mAP@[0.5:0.95] were selected. The results are shown in Table 18.
The fusion image object detection model has the highest P, indicating that the fusion model has a low false detection rate, reliable object detection results, and can correctly detect maritime targets. The highest R of the fusion model indicates that the model detects more comprehensive targets and has fewer missed detections. Both the visible image object detection model and the infrared image object detection model exhibit lower accuracy in mAP@0.5 and mAP@[0.5:0.95] than models trained on fused images. In the mAP@[0.5:0.95] metric, the accuracy of fused image object detection increased by 10.88%, compared to visible light object detection models, and by 6.76%, compared to infrared object detection models.
To further explore the targeting of different image object detection models for different maritime targets, this paper selects typical maritime targets from the data for specific analysis. The selected targets include buoys, cruise ships, sailboats, personnel, speedboats, and small boats. P, R, and mAP@[0.5:0.95] indices were selected for separate analysis. Quantitative analysis was conducted on different maritime targets using P and R indicators, and the results are shown in Table 19.
The selected test metric was mAP@[0.5:0.95], and the test results are shown in Table 20.
From the table, it can be seen that the object detection model, trained using fused images, has the best object detection performance for six types of targets: buoys, pleasure boats, sailboat boats, personnel, test boats and small boats. The accuracy of target recognition is higher than that of visible light image recognition models and infrared image recognition models.
For pleasure boats, sailboat boats, personnel and small boats, the fusion image object detection model has the highest detection accuracy, and the infrared object detection model has higher object detection accuracy than the visible object detection model. The experimental results show that infrared images contain most of the characteristic information of pleasure boats, sailboats, personnel and small boats, since the infrared object detection model can capture these features during training. Visible images have a certain color and detailed feature information of such targets but lack easily recognizable heat source information. At this point, image fusion can be carried out to supplement the color and detail information in visible images while retaining the main heat source information in infrared images.
For buoys and test boats, visible image object detection models have good object detection results. Buoys are small targets on the sea and usually do not have significant heat source information. Infrared thermal imagers cannot accurately capture the distribution characteristics of heat sources. However, buoys have distinct color features, so visible object detection results are better than infrared image object detection results. For fast test boat targets, the infrared target recognition model cannot effectively identify the heat distribution information of the test boat target and has weak control over the contour information of the test boat at different angles, resulting in relatively poor detection results. The significant features in the infrared image and visible image are joined together to obtain a fused image that combines the significant features of the infrared image and visible image of the buoy and test speedboat. Therefore, using the fused image can achieve the best object detection effect.
In summary, in different maritime scenes, the features that are beneficial for object detection in infrared images are not exactly the same as those in visible images. By fusing infrared and visible images, the features that are beneficial for object detection can be combined to improve the confidence of object detection.

7. Discussion

The image fusion technology based on deep learning can rely on the powerful information extraction ability of deep learning to extract significant sea target features from infrared images and visible light images, which can effectively improve the accuracy of sea object detection. This paper optimizes, based on a CNN image convolution network, designs a more comprehensive feature extraction module for sea target characteristics, and optimizes the loss function and model parameters for analysis. A visible and infrared image fusion and object detection dataset was constructed to meet the practical needs of maritime image fusion and object detection, for the application analysis of image fusion technology and object detection technology. Subsequently, this article conducted object detection experiments on different sea scenes data using the YOLOv10 object detection model. The experimental results showed that image fusion technology can effectively fuse infrared image features that are conducive to object detection with visible image features and can effectively improve object detection accuracy in various sea scenes.
However, there is still a lot of room for improvement in the sample size and quality of the dataset proposed in this article. We plan to further expand the dataset through sea trials, add more types of sea targets, and combine sample generation technology to further enrich the difficulty of collecting sea-scene data in practice, ultimately forming a more diverse category.

8. Conclusions

This paper, in response to the actual needs of maritime image fusion and object detection, proposes a lightweight object detection technology based on image fusion. It focuses on the optimized design of CNN-based image fusion technology. On the basis of the CNN image fusion technology framework, this paper redesigns a lightweight feature extraction module. The feature extraction module combines convolution modules, residual connections, and gradient extraction modules to comprehensively extract the feature information of maritime targets. It enhances the ability to extract and fuse the feature information of small maritime targets and combines the actual lighting conditions to optimize the loss function and model parameters.
We constructed a visible light and infrared image fusion and object detection dataset to meet practical object detection needs. The dataset covers normal lighting multi-target scenes, normal lighting target occlusion scenes, low light scenes, and backlight scenes. Sea scene experiments on image fusion and object detection technology were conducted using this visible and infrared image dataset. The experimental results show that the fusion of visible images and infrared images can effectively fuse the feature information in infrared images and visible images and can effectively complement each other’s strengths and weaknesses in different typical maritime scenes, improving the detection effect of maritime targets. The mAP@[0.5:0.95] of target detection in fused images is 10.88% higher than that in visible object detection results and 6.76% higher than that in infrared object detection results.
However, there is still a lot of room for improvement in the future. This article preprocesses images for fusion and detection but directly collected images are usually unregistered and have different resolutions. Subsequent research can embed image registration into image fusion models, which can fuse misaligned infrared images with visible light images. Positioning and ranging of maritime targets are also common tasks in maritime object detection. The image fusion technique employed in this article operates in two-dimensional space and does not incorporate depth information, and thus does not provide distance measurements for maritime targets.

Author Contributions

Conceptualization, Y.C. and X.M.; methodology, Y.C.; software, X.M.; validation, S.X., Y.H. and Q.W.; formal analysis, Y.H.; resources, Y.C.; writing—original draft preparation, X.M.; writing—review and editing, Q.W.; visualization, S.X. All authors have read and agreed to the published version of the manuscript.

Funding

This research received no external funding.

Data Availability Statement

Dataset available on request from the authors.

Conflicts of Interest

The authors declare no conflicts of interest.

Abbreviations

The following abbreviations are used in this manuscript:
CNNsConvolutional Neural Networks
GANsGenerative Adversarial Networks
AEAutoencoder
LReLULeaky Rectified Linear Unit
MIMutual Information
CCCorrelation Coefficient
PSNRPeak Signal-to-Noise Ratio
SSIMStructural Similarity Index Measure
FMIFeature Measurement Index
mAPmean Average Precision
DW ConvDepth-Wise separable Convolution
YOLOYou Only Look Once

References

  1. Li, H.; Wu, X.J.; Kittler, J. MDLatLRR: A novel decomposition method for infrared and visible image fusion. IEEE Trans. Image Process. 2020, 29, 4733–4746. [Google Scholar] [CrossRef]
  2. Bavirisetti, D.P.; Dhuli, R. Two-scale image fusion of visible and infrared images using saliency detection. Infrared Phys. Technol. 2016, 76, 52–64. [Google Scholar] [CrossRef]
  3. Liu, Y.; Chen, X.; Ward, R.K.; Wang, Z.J. Image fusion with convolutional sparse representation. IEEE Signal Process. Lett. 2016, 23, 1882–1886. [Google Scholar] [CrossRef]
  4. Ma, J.; Chen, C.; Li, C.; Huang, J. Infrared and visible image fusion via gradient transfer and total variation minimization. Inf. Fusion 2016, 31, 100–109. [Google Scholar] [CrossRef]
  5. Liu, Y.; Liu, S.; Wang, Z. A general framework for image fusion based on multi-scale transform and sparse representation. Inf. Fusion 2015, 24, 147–164. [Google Scholar] [CrossRef]
  6. Li, S.; Kang, X.; Fang, L.; Hu, J.; Yin, H. Pixel-level image fusion: A survey of the state of the art. Inf. Fusion 2017, 33, 100–112. [Google Scholar] [CrossRef]
  7. Vaswani, A.; Shazeer, N.; Parmar, N.; Uszkoreit, J.; Jones, L.; Gomez, A.N.; Kaiser, Ł.; Polosukhin, I. Attention is all you need. Adv. Neural Inf. Process. Syst. 2017, 30. [Google Scholar]
  8. Liu, Y.; Chen, X.; Peng, H.; Wang, Z. Multi-focus image fusion with a deep convolutional neural network. Inf. Fusion 2017, 36, 191–207. [Google Scholar] [CrossRef]
  9. Ma, J.; Tang, L.; Xu, M.; Zhang, H.; Xiao, G. STDFusionNet: An infrared and visible image fusion network based on salient target detection. IEEE Trans. Instrum. Meas. 2021, 70, 5009513. [Google Scholar] [CrossRef]
  10. Zhu, D.; Ma, J.; Li, D.; Wang, X. SCGAFusion: A skip-connecting group convolutional attention network for infrared and visible image fusion. Appl. Soft Comput. 2024, 163, 111902. [Google Scholar] [CrossRef]
  11. Yang, Y.; Zhou, N.; Wan, W.; Huang, S. MACCNet: Multiscale Attention and Cross-Convolutional Network for Infrared and Visible Image Fusion. IEEE Sens. J. 2024, 24, 16587–16600. [Google Scholar] [CrossRef]
  12. Goodfellow, I.J.; Pouget-Abadie, J.; Mirza, M.; Xu, B.; Warde-Farley, D.; Ozair, S.; Courville, A.; Bengio, Y. Generative adversarial nets. Adv. Neural Inf. Process. Syst. 2014, 27, 1–9. [Google Scholar]
  13. Ma, J.; Yu, W.; Liang, P.; Li, C.; Jiang, J. FusionGAN: A generative adversarial network for infrared and visible image fusion. Inf. Fusion 2019, 48, 11–26. [Google Scholar] [CrossRef]
  14. Yang, X.; Huo, H.; Li, J.; Li, C.; Liu, Z.; Chen, X. DSG-Fusion: Infrared and visible image fusion via generative adversarial networks and guided filter. Expert Syst. Appl. 2022, 200, 116905. [Google Scholar] [CrossRef]
  15. Yin, H.; Xiao, J.; Chen, H. CSPA-GAN: A cross-scale pyramid attention GAN for infrared and visible image fusion. IEEE Trans. Instrum. Meas. 2023, 72, 5027011. [Google Scholar] [CrossRef]
  16. Xu, H.; Liang, P.; Yu, W.; Jiang, J.; Ma, J. Learning a generative model for fusing infrared and visible images via conditional generative adversarial network with dual discriminators. In Proceedings of the Twenty-Eighth International Joint Conference on Artificial Intelligence (IJCAI-19), Macao, China, 10–16 August 2019. [Google Scholar]
  17. Zhou, H.; Wu, W.; Zhang, Y.; Ma, J.; Ling, H. Semantic-supervised infrared and visible image fusion via a dual-discriminator generative adversarial network. IEEE Trans. Multimed. 2021, 25, 635–648. [Google Scholar] [CrossRef]
  18. Ram Prabhakar, K.; Sai Srikar, V.; Venkatesh Babu, R. Deepfuse: A deep unsupervised approach for exposure fusion with extreme exposure image pairs. In Proceedings of the 2017 IEEE International Conference on Computer Vision (ICCV), Venice, Italy, 22–29 October 2017; pp. 4724–4732. [Google Scholar]
  19. Li, H.; Wu, X.J.; Kittler, J. RFN-Nest: An end-to-end residual fusion network for infrared and visible images. Inf. Fusion 2021, 73, 72–86. [Google Scholar] [CrossRef]
  20. Tang, L.; Xiang, X.; Zhang, H.; Gong, M.; Ma, J. DIVFusion: Darkness-free infrared and visible image fusion. Inf. Fusion 2023, 91, 477–493. [Google Scholar] [CrossRef]
  21. Huang, J.; Li, X.; Tan, H.; Yang, L.; Wang, G.; Yi, P. DeDNet: Infrared and visible image fusion with noise removal by decomposition-driven network. Measurement 2024, 237, 115092. [Google Scholar] [CrossRef]
  22. Wang, Z.; Chen, Y.; Shao, W.; Li, H.; Zhang, L. SwinFuse: A residual swin transformer fusion network for infrared and visible images. IEEE Trans. Instrum. Meas. 2022, 71, 5016412. [Google Scholar] [CrossRef]
  23. Li, J.; Yang, B.; Bai, L.; Dou, H.; Li, C.; Ma, L. TFIV: Multigrained token fusion for infrared and visible image via transformer. IEEE Trans. Instrum. Meas. 2023, 72, 2526414. [Google Scholar] [CrossRef]
  24. Zhao, Z.; Bai, H.; Zhang, J.; Zhang, Y.; Xu, S.; Lin, Z.; Timofte, R.; Van Gool, L. Cddfuse: Correlation-driven dual-branch feature decomposition for multi-modality image fusion. In Proceedings of the 2023 IEEE/CVF Conference on Computer Vision and Pattern Recognition (CVPR), Vancouver, BC, Canada, 17–24 June 2023. [Google Scholar]
  25. Bulanon, D.; Burks, T.; Alchanatis, V. Image fusion of visible and thermal images for fruit detection. Biosyst. Eng. 2009, 103, 12–22. [Google Scholar] [CrossRef]
  26. Lin, X.; Sun, H.; Wang, Y. Dynamic positioning particle filtering method based on the EnKF. In Proceedings of the 2017 IEEE International Conference on Mechatronics and Automation (ICMA), Takamatsu, Japan, 6–9 August 2017; pp. 1871–1876. [Google Scholar]
  27. Xu, D.; Wang, Y.; Xu, S.; Zhu, K.; Zhang, N.; Zhang, X. Infrared and visible image fusion with a generative adversarial network and a residual network. Appl. Sci. 2020, 10, 554. [Google Scholar] [CrossRef]
  28. Liu, F.; Liu, J.; Wang, L.; Al-Qadi, I.L. Multiple-type distress detection in asphalt concrete pavement using infrared thermography and deep learning. Autom. Constr. 2024, 161, 105355. [Google Scholar] [CrossRef]
  29. Wang, P.; Xiao, J.; Qiang, X.; Xiao, R.; Liu, Y.; Sun, C.; Hu, J.; Liu, S. An automatic building facade deterioration detection system using infrared-visible image fusion and deep learning. J. Build. Eng. 2024, 95, 110122. [Google Scholar] [CrossRef]
  30. Eum, I.; Kim, J.; Wang, S.; Kim, J. Heavy equipment detection on construction sites using you only look once (yolo-version 10) with transformer architectures. Appl. Sci. 2025, 15, 2320. [Google Scholar] [CrossRef]
  31. Wang, S. Development of approach to an automated acquisition of static street view images using transformer architecture for analysis of Building characteristics. Sci. Rep. 2025, 15, 29062. [Google Scholar] [CrossRef] [PubMed]
  32. Li, H.; Wu, X.J.; Kittler, J. Infrared and visible image fusion using a deep learning framework. In Proceedings of the 2018 24th International Conference on Pattern Recognition (ICPR), Beijing, China, 20–24 August 2018. [Google Scholar]
  33. Jung, H.; Kim, Y.; Jang, H.; Ha, N.; Sohn, K. Unsupervised deep image fusion with structure tensor representations. IEEE Trans. Image Process. 2020, 29, 3845–3858. [Google Scholar] [CrossRef]
  34. Tang, L.; Yuan, J.; Ma, J. Image fusion in the loop of high-level vision tasks: A semantic-aware real-time infrared and visible image fusion network. Inf. Fusion 2022, 82, 28–42. [Google Scholar] [CrossRef]
  35. Roberts, J.W.; Van Aardt, J.A.; Ahmed, F.B. Assessment of image fusion procedures using entropy, image quality, and multispectral classification. J. Appl. Remote Sens. 2008, 2, 023522. [Google Scholar]
  36. Wang, Z.; Bovik, A.C. A universal image quality index. IEEE Signal Process. Lett. 2002, 9, 81–84. [Google Scholar] [CrossRef]
  37. Chen, J.; Kao, S.-H.; He, H.; Zhuo, W.; Wen, S.; Lee, C.-H.; Chan, S.-H.G. Run, don’t walk: Chasing higher FLOPS for faster neural networks. In Proceedings of the IEEE/CVF Conference on Computer Vision and Pattern Recognition (CVPR), Vancouver, BC, Canada, 17–24 June 2023; pp. 12021–12031. [Google Scholar]
  38. Redmon, J.; Divvala, S.; Girshick, R.; Farhadi, A. You only look once: Unified, real-time object detection. In Proceedings of the IEEE Conference on Computer Vision and Pattern Recognition (CVPR), Las Vegas, NV, USA, 27–30 June 2016; pp. 779–788. [Google Scholar]
  39. Wang, J.; Chen, Y.; Dong, Z.; Gao, M. Imp roved YOLOv5 network for real-time multi-scale traffic sign detection. Neural Comput. Appl. 2023, 35, 7853–7865. [Google Scholar] [CrossRef]
  40. Varghese, R.; Sambath, M. Yolov8: A novel object detection algorithm with enhanced performance and robustness. In Proceedings of the 2024 International Conference on Advances in Data Engineering and Intelligent Computing Systems (ADICS), Chennai, India, 18–19 April 2024; pp. 1–6. [Google Scholar]
  41. Wang, A.; Chen, H.; Liu, L.; Chen, K.; Lin, Z.; Han, J. Yolov10: Real-time end-to-end object detection. Adv. Neural Inf. Process. Syst. 2024, 37, 107984–108011. [Google Scholar]
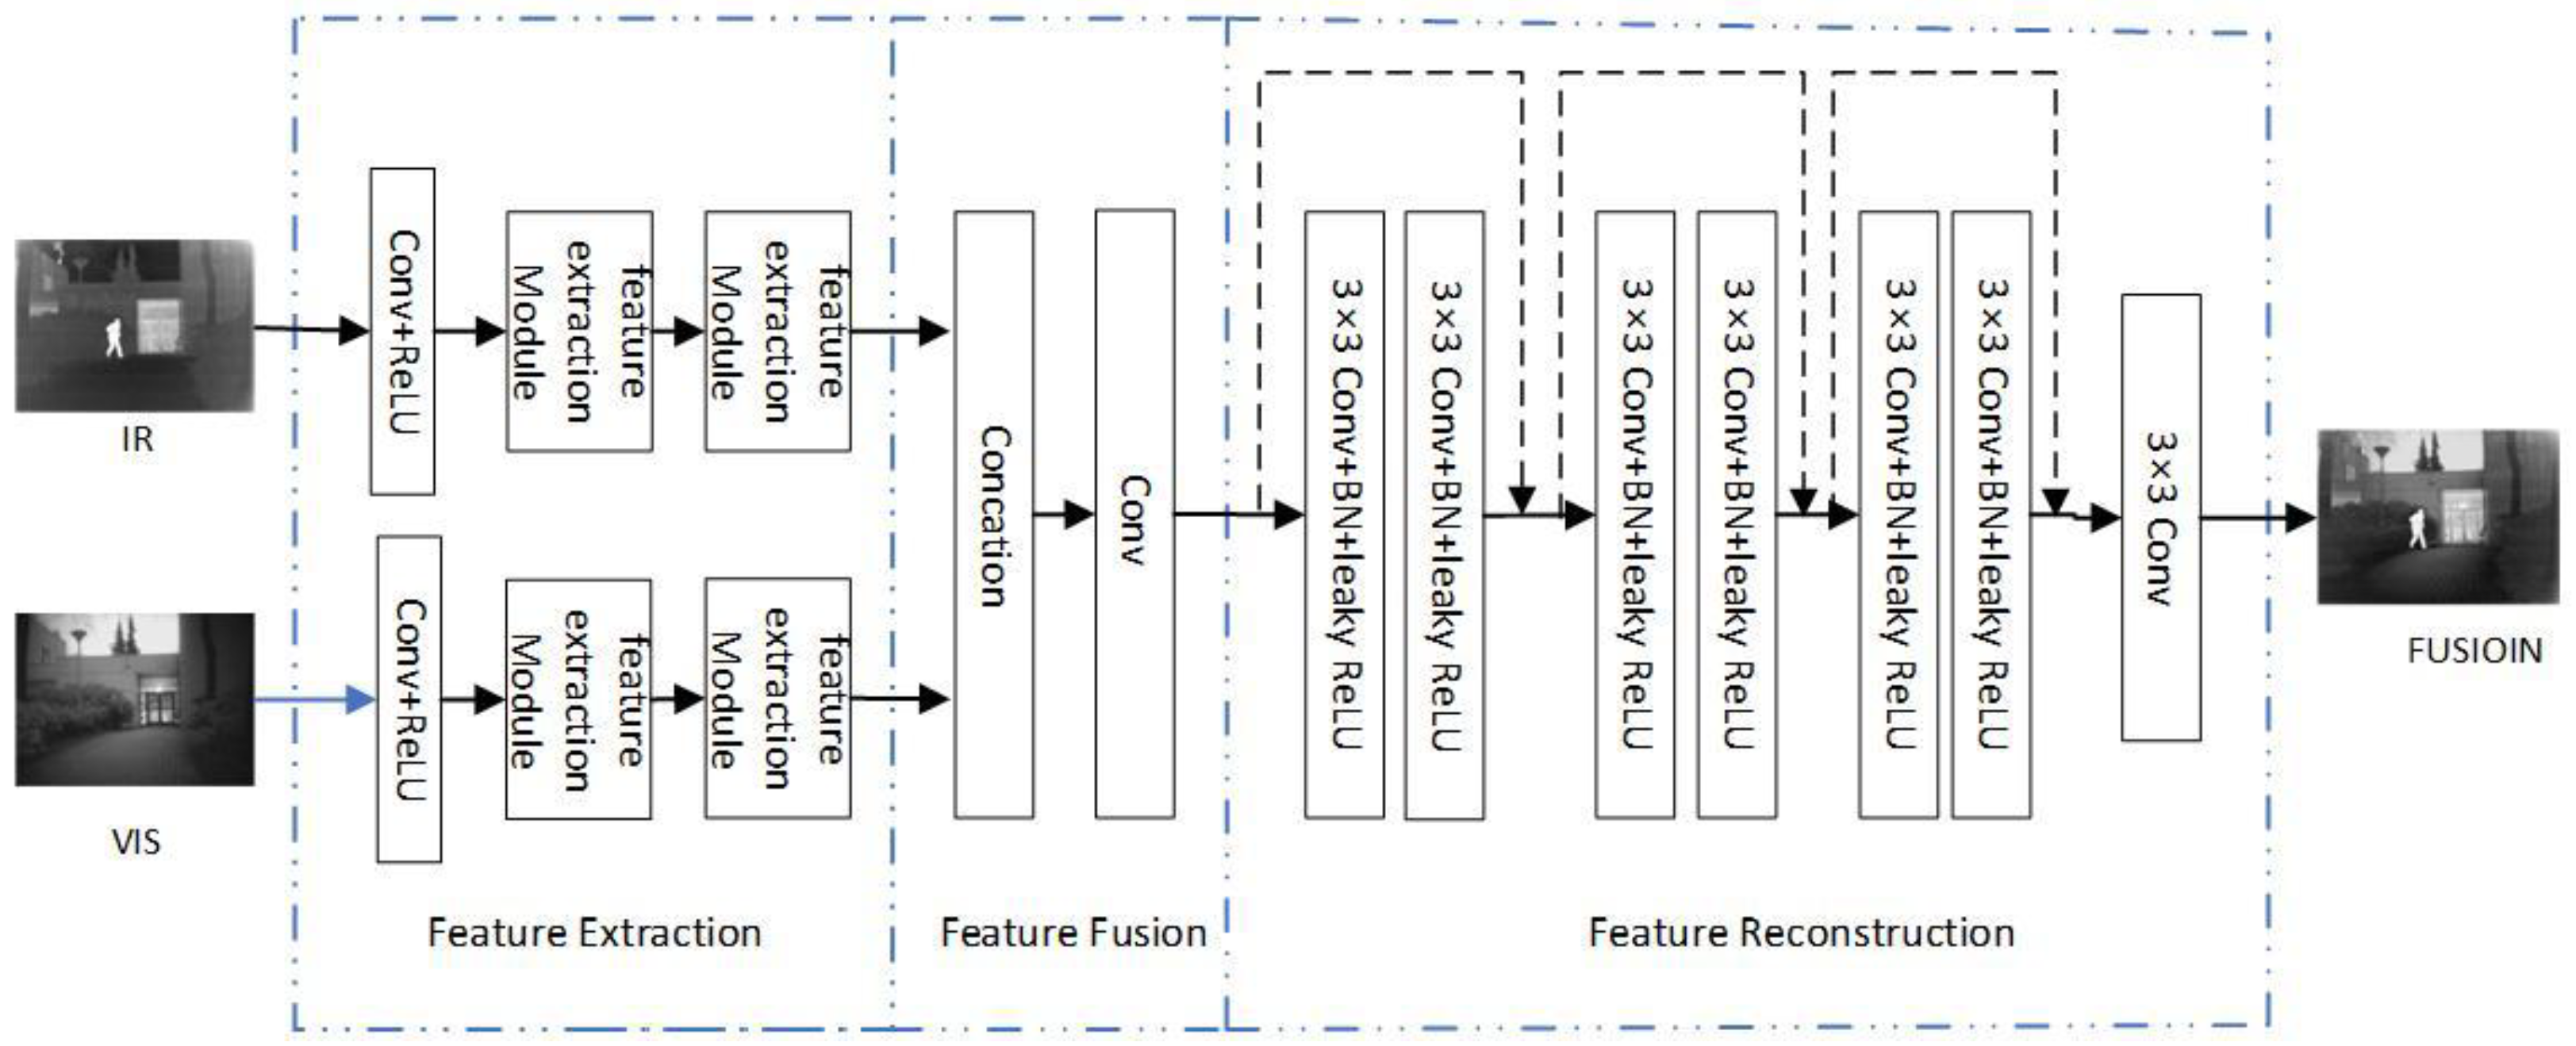
Figure 1. Lightweight image fusion model based on CNN.
Jmse 13 01832 g001
Figure 2. Process diagram of object detection using fused images.
Jmse 13 01832 g002
Figure 3. The feature extraction module proposed in this article.
Jmse 13 01832 g003
Figure 4. The image fusion model based on convolutional neural network proposed in this article.
Jmse 13 01832 g004
Figure 5. Ships and equipment used for data collection. (a) Ship used for data collection. (b) SCB350 ball type photoelectric pan tilt device.
Jmse 13 01832 g005
Figure 6. Visible images and infrared images under different lighting conditions. (a) Normal illumination visible image. (b) Low illumination visible image. (c) Backlight visible image. (d) Normal illumination infrared image. (e) Low illumination infrared image. (f) Backlight infrared image.
Jmse 13 01832 g006
Figure 7. Maritime target occlusion scene. (a) Visible images. (b) Infrared images.
Jmse 13 01832 g007
Figure 8. Object detection results in multi-target scene. (a) Visible image object detection result. (b) Infrared image object detection result. (c) Fusion image object detection result.
Jmse 13 01832 g008
Figure 9. Object detection results in target occlusion scene. (a) Visible image object detection result. (b) Infrared image object detection result. (c) Fusion image object detection result.
Jmse 13 01832 g009
Figure 10. Object detection results in the low illumination scene. (a) Visible image object detection result. (b) Infrared image object detection result. (c) Fusion image object detection result.
Jmse 13 01832 g010
Figure 11. Object detection results in backlight scene. (a) Visible image object detection result. (b) Infrared image object detection result. (c) Fusion image object detection result.
Jmse 13 01832 g011
Table 1. Objective evaluation test results of feature extraction module.
ModuleMIPSNRCC N A B / F SSIMFMI_pixelTime (/s)
1CNN block1.96362.55610.41310.09170.85830.87100.0082
Non gradient2.00164.16240.58560.09040.89380.89560.0981
2CNN block2.17266.26570.59560.00870.90570.90050.1033
Table 2. Experimental results of image fusion under different feature map dimensions.
DimensionMIPSNRCC N A B / F SSIMFMI_pixelTime
22.519166.10130.71640.05510.90270.86430.046
42.526366.15990.71770.04730.91930.87530.053
82.547266.16130.71780.04660.92060.87490.102
162.535366.16780.71780.04930.91810.87410.204
322.505466.16920.71810.05470.90490.86960.378
642.533066.16180.71840.04760.92000.87610.551
962.547166.14080.71740.04780.92140.87560.820
1282.539866.16970.71820.04810.92090.87541.451
2562.542966.15430.71770.04760.92160.87583.544
Table 3. Experimental results of ablation of residual module quantity in image reconstruction section.
NumberMIPSNRCC N A B / F SSIMFMI_pixelTime
12.167666.26330.59560.00910.90490.90020.0891
22.169266.26350.59560.00890.90550.90030.0989
32.172666.26570.59560.00870.90570.90050.1033
42.170466.26100.59510.00910.90030.90020.1045
Table 4. Experimental results of different YOLOv10 object detection models in maritime fusion data.
ModuleParameter/MInference Time per ImagemAP@0.5mAP@[0.5:0.95]
YOLOv5-s7.220.540.9170.665
YOLOv8-s7.219.570.9200.669
YOLOv10-n2.311.40.8930.616
YOLOv10-s7.214.40.9280.694
YOLOv10-m15.432.50.9540.717
YOLOv10-b19.145.80.9230.706
YOLOv10-l24.454.70.9670.728
Table 5. Divided and collected data according to typical scene.
Data SceneNormal IlluminationTarget OcclusionLow IlluminationBacklight
number1802540716486
Table 6. Average detection confidence results for different targets in maritime multi-target scenes.
Types of Maritime TargetsDetection Results of Visible ImagesDetection Results of Infrared ImagesDetection Results of Fusion Images
Pleasure boats0.8470.8210.895
Personnel0.3150.2820.725
Test boats0.5530.5700.738
Buoys0.4380.3300.593
Sailboats0.5510.5460.784
Small boats0.5770.6200.826
Average0.5470.5280.760
Table 7. P and R for sea multi-target scenes.
Types of Maritime TargetsDetection Results of Visible ImagesDetection Results of Infrared ImagesDetection Results of Fusion Images
PRPRPR
Pleasure boats0.6460.8810.7040.7750.7921
Personnel0.7140.6250.7670.2740.9540.958
Test boats0.4710.7960.7830.66710.799
Buoys10.4641010.586
Sailboats0.89810.44810.9141
Small boats0.7440.6670.5290.5670.8920.667
All0.7170.80.6790.5510.8760.903
Table 8. mAP@[0.5:0.95] for sea multi-target scenes.
Types of Maritime TargetsDetection Results of Visible ImagesDetection Results of Infrared ImagesDetection Results of Fusion Images
Pleasure boats0.7730.7720.819
Personnel0.4930.4570.652
Test boats0.6070.7300.826
Buoys0.6220.5390.732
Sailboats0.6240.7720.757
Small boats0.7730.7720.819
Average0.4930.4570.652
Table 9. Average detection confidence results for different targets in target occlusion scenes.
Types of Maritime TargetsDetection Results of Visible ImagesDetection Results of Infrared ImagesDetection Results of Fusion Images
Pleasure boats0.4700.6820.911
Small boats0.9010.9090.932
Sailboats0.2350.0800.669
Personnel0.5700.6160.871
Average0.4700.6820.911
Table 10. P and R for occlusion scenes.
Types of Maritime TargetsDetection Results of Visible ImagesDetection Results of Infrared ImagesDetection Results of Fusion Images
PRPRPR
Pleasure boats0.8750.6360.91510.9621
Small boats0.59610.9520.9740.7121
Sailboats0.37510.6900.8890.7961
Personnel0.4500.5000.6120.2080.6690.875
All0.5740.7840.7920.7680.9490.917
Table 11. mAP@[0.5:0.95] for occlusion scenes.
Types of Maritime TargetsDetection Results of Visible ImagesDetection Results of Infrared ImagesDetection Results of Fusion Images
Pleasure boats0.7160.7760.778
Small boats0.7850.7870.878
Sailboats0.2880.2310.483
Personnel0.6480.6420.746
Average0.7160.7760.778
Table 12. Average detection confidence results for different targets in low illumination scenes.
Types of Maritime TargetsDetection Results of Visible ImagesDetection Results of Infrared ImagesDetection Results of Fusion Images
Pleasure boats0.8690.8470.950
Small boats0.8550.9350.917
Personnel0.2730.5730.768
Average0.6660.7850.878
Table 13. P and R for low illumination scenes.
Types of Maritime TargetsDetection Results of Visible ImagesDetection Results of Infrared ImagesDetection Results of Fusion Images
PRPRPR
Pleasure boats0.8390.980.8840.9710.9680.994
Small boats0.80410.97810.9721
Personnel0.7220.5790.9340.7930.9410.891
All0.7900.9080.9160.9470.9420.976
Table 14. mAP@[0.5:0.95] for low illumination scenes.
Types of Maritime TargetsDetection Results of Visible ImagesDetection Results of Infrared ImagesDetection Results of Fusion Images
Pleasure boats0.8830.8960.912
Small boats0.8090.8740.878
Personnel0.4230.6800.734
Average0.7050.8160.841
Table 15. Average detection confidence results for different targets in backlight scenes.
Types of Maritime TargetsDetection Results of Visible ImagesDetection Results of Infrared ImagesDetection Results of Fusion Images
Pleasure boats0.7650.8330.832
Test boats0.8200.8820.900
Average0.7930.8570.866
Table 16. P and R for backlight scenes.
Types of Maritime TargetsDetection Results of Visible ImagesDetection Results of Infrared ImagesDetection Results of Fusion Images
PRPRPR
Pleasure boats0.78204770.4570.9330.9320.986
Test boats0.8250.9470.43010.8281
All0.7930.5950.5280.9500.9450.976
Table 17. mAP@[0.5:0.95] for backlight scenes.
Types of Maritime TargetsDetection Results of Visible ImagesDetection Results of Infrared ImagesDetection Results of Fusion Images
Pleasure boats0.8170.8270.859
Test boats0.8050.8190.840
Average0.8110.8230.850
Table 18. Evaluation results of different object detection models.
ModelPRmAP@0.5mAP@[0.5:0.95]
Visible object detection0.8690.8570.9330.726
Infrared object detection0.8620.8570.9290.754
Fusion object detection0.9490.9170.9710.805
Table 19. P and R for different maritime targets.
Types of Maritime TargetsDetection Results of Visible ImagesDetection Results of Infrared ImagesDetection Results of Fusion Images
PRPRPR
Pleasure boats0.9330.890.9300.9530.9740.957
Personnel0.8060.5870.8260.6190.9620.824
Test boats0.8850.9210.9270.7640.9770.847
Buoys0.9620.7320.9060.6570.9940.800
Sailboats0.7650.9440.7610.8890.8630.944
Small boats0.8830.9450.9180.9460.9730.964
Table 20. mAP@[0.5:0.95] for different targets on different object detection models.
Types of Maritime TargetsDetection Results of Visible ImagesDetection Results of Infrared ImagesDetection Results of Fusion Images
Buoys0.7700.7320.777
Pleasure boats0.8290.8570.873
Sailboats0.7730.7960.815
Personnel0.4010.4320.618
Test boats0.7380.7180.800
Small boats0.7650.7870.853
Disclaimer/Publisher’s Note: The statements, opinions and data contained in all publications are solely those of the individual author(s) and contributor(s) and not of MDPI and/or the editor(s). MDPI and/or the editor(s) disclaim responsibility for any injury to people or property resulting from any ideas, methods, instructions or products referred to in the content.