Article

Development of a Model for Increasing the Capacity of Small and Medium-Sized Ports Using the Principles of Probability Theory

by
Vytautas Paulauskas
1,*,
Donatas Paulauskas
2 and
Vytas Paulauskas
3
1
Marine Engineering Department, Klaipeda University, H. Manto g. 84, LT-92219 Klaipeda, Lithuania
2
Maritime Engineering Department, Klaipeda University, H. Manto g. 84, LT-92294 Klaipeda, Lithuania
3
Faculty of Electrical and Electronics Engineering, Kaunas Technological University, Studentu str. 48, LT-51367 Kaunas, Lithuania
*
Author to whom correspondence should be addressed.
J. Mar. Sci. Eng. 2025, 13(9), 1833; https://doi.org/10.3390/jmse13091833
Submission received: 28 August 2025 / Revised: 16 September 2025 / Accepted: 18 September 2025 / Published: 22 September 2025
(This article belongs to the Special Issue Smart Seaport and Maritime Transport Management, Second Edition)

Abstract

Every year, more and more general and other types of cargo are transported by containers, and many ports, including small and medium-sized ones, are trying to join the container transportation processes. Port connectivity with container shipping is associated with easier and faster cargo processing and reduced environmental impact by optimizing ship arrivals and processing in small and medium-sized ports. Small and medium-sized ports are often limited by port infrastructure, especially suitable quays; therefore, it is very important to correctly assess the capabilities of such ports so that ships do not have to wait for entry and so that quays and other port infrastructure are optimally used. The research is relevant because small and medium-sized ports are increasingly involved in the activities of logistics chains and are becoming very important for the development of individual regions. The wider use of small and medium-sized ports in logistics chains is a new and original research direction. Optimal assessment of port or terminal and berth utilization is possible using the principles of probability theory. The article develops and presents a probabilistic method for assessment of port and terminal and ship mooring at their berths, using possible and actual time periods, based on the principles of transport process organization and linked to the capabilities of the port infrastructure and terminal superstructure. The conditional probability method was used to assess port and terminal capacity, as well as a method for assessing ship maneuverability under limited conditions. The developed probabilistic method for assessing port terminals and ship berthing at port quays can be used in any port or terminal, taking into account local conditions. Combined theoretical research and experimental results of the optimal use of small and medium-sized ports ensure sufficient research quality.

1. Introduction

Large, medium, and small ports are important and most of them handle passengers and cargo, and each of them aims to be beneficial to countries and regions, to be modern, to use new technologies, and to create the best possible conditions for people living nearby. The declared goals of ports force them to look for more optimal and efficient ways of transporting cargo through ports [1,2]. Many small and medium-sized ports are located close to densely populated places, i.e., in or very close to cities; therefore, ports try to minimize any possible negative impact on residents (minimum environmental pollution, noise, etc.) and, at the same time, perform their functions and be economically beneficial, aiming to mechanize and automate ship processing processes as much as possible, which can help reduce the environmental impact [3,4,5]. One of the main problems of small and medium-sized ports is the limited economic and financial development opportunities of ports; therefore, ports try to adapt to new transport technologies, accept as many large ships as possible, and have a positive impact on the city and region [5,6,7].
When assessing the size of ports, it is necessary to indicate the port, and it is important to classify them according to their importance in passenger service and cargo handling. This is necessary because ports, especially small and medium-sized ones, may have different opportunities and resources for the implementation and development of new technologies.
It is noted that the activities of seaports are diverse, taking into account not only the organization of their activities but also their capacity and productivity. In order to conduct a comprehensive analysis on the performance of ports, it is proposed to classify ports into small, medium-sized, and large ports, taking into account the relevant criteria [8]. Depending on the number of passengers served (in the case of passenger ports or ferry terminals)
-
Up to 50,000 passengers per year (small ports);
-
From 50,000 to 100,000 passengers per year (medium-sized);
-
More than 100,000 passengers per year (large ports).
In the case of cargo ports, depending on the cargo turnover of the ports or terminals
-
Small ports (with an annual turnover of up to 1 million tons);
-
Medium-sized ports (with an annual turnover of 1 million tons to 10 million tons);
-
Large ports (with an annual turnover exceeding 10 million tons).
One of the trends that has been going on for many years is cargo containerization, since this method of cargo processing in ports, including small and medium-sized ones, requires less labor, allows for mechanization and automation of loading processes, and reduces the negative impact on the environment due to dust, noise, and other negative consequences. At the same time, it is necessary to assess the large investments required in the port or terminal, processing containers, and adapting small and medium-sized ports to receive container ships, given the relatively limited number of berths. The above-mentioned difficulties of small and medium-sized ports force us to look for rational and optimal ways so that such ports can remain on the market, have minimal impact on the environment, and be beneficial to the regions.
When assessing the possibility of a ship to use small and medium-sized ports, it is very important to take into account several main factors and their possible use with the conditional probabilities method [9]. With the help of this method, it is possible to assess the probability of individual factors and their possible mutual influence, i.e., the navigation factor, which means the possibilities of ships entering and the probability of minimal downtime; the possible areas of the port or terminal and their possibilities, and the probability of using them for cargo processing; the available or possible parameters of the port or terminal’s loading equipment for ship processing and the probability of using them; the preparation of port or terminal specialists and employees and their attitude to work and the probability of good quality work; and the possibilities of coastal transport connections (railways, roads, inland waterways, etc.) and the probability of their effective use [10,11].
When assessing the investment opportunities of small and medium-sized ports, as well as the necessary development of the territories near the port quays, it is very important to accurately balance the port infrastructure (entrance and internal channels, ship turning basins, and common railways and roads), possible opportunities for territory development, and acquisition of port superstructure [12]. One important element of the port infrastructure is the port quays and the possibility to attract as many ships as possible and process them.
Most of the research conducted focuses on the activities of large ports, their optimization, autonomy and other aspects of port operations. At the same time, small and medium-sized ports, which have their own specifics due to their limited technical, financial, and organizational capabilities, are little studied, although the importance of small and medium-sized ports for individual countries and regions is very high; therefore, research into such ports is very important.
The article develops and presents a probabilistic method for assessing the mooring of ships at the port or terminal quays, the existing and/or potential areas of the port or terminal for cargo processing, the port or terminal’s available or potential equipment for ship loading, the sufficiency and qualification of existing or potential specialists, shore transport connections linked to the port or terminal’s infrastructure and superstructure capabilities, and the principles of transport process organization. The developed methodology allows for probabilistic assessments of individual factors or their groups, which can be used to determine the optimal parameters of ships that can moor at the quay(s), the available parameters of the territory near the quays, the capabilities of the terminal superstructure, and the organizational features of the terminal.
The novelty and innovation of the article is based on the possibility, using probabilistic methods [9], to assess the capabilities of a port, especially small and medium-sized ports, to receive the optimal number of ships, taking into account the limited number of quays, to harmonize the development possibilities (restrictions) of the port territory, to make optimal use of the terminal superstructure and to assess the optimal cargo processing in the port or terminal, and other important, especially in small and medium-sized ports or terminals, probabilistic parameters that are very important in optimizing the activities of ports or terminals.
The article uses the usual structure for scientific articles, which includes a review of the activities of small and medium-sized ports, existing problems and the literature, a presentation of the developed research methodology, a case study, i.e., presentation and evaluation of the research results, as well as a discussion and conclusions sections.

2. Small and Medium-Sized Ports and Literature Review

There are thousands of small and medium-sized ports in the world, for example, in Sweden there are more than 60 registered small and medium-sized ports; in some other countries of the world, there are even more of them, and they are very important for local regions, as they attract cargo and passenger flows and develop local economies [3,13,14]. Small and medium-sized ports are of even greater importance in island countries such as the Philippines, Indonesia, and other countries [4,15]. The transformation of ports for new cargo flows, especially focused on container handling, first requires an accurate assessment or adaptation of quays to accommodate container ships and then other elements of the port superstructure can be adapted for cargo handling, especially containers [16,17].
Since port activities are related to many factors, they can be conditionally divided as follows: maximum parameters of ships that can enter the port; cargo handling equipment that allows for servicing possible ships and cargo; available cargo handling areas; land transport system connections between the port and the hinterland; and specialists who could provide qualified service to ships [18,19,20]. Many small and medium-sized ports have limited opportunities to receive larger ships; therefore, in order to optimally use the available port or terminal capacities, the probability of receiving larger ships is important. Since small and medium-sized ports are usually located in cities; cargo handling capabilities are also limited due to environmental impact [21]. Cargo handling equipment is quite expensive, and small and medium-sized ports have limited opportunities to purchase very expensive cargo handling equipment. Many small and medium-sized ports have land connections, such as roads and railways that connect the ports with the country’s transport system, but their capacities are also often limited. Small and medium-sized ports often face a shortage of specialists who can service ships, load equipment, and perform other logistics functions [22,23].
The infrastructure of small and medium-sized ports capable of receiving larger ships is often limited, although currently, many ports are trying to receive as many large ships as possible, sometimes creating unreasonably high risks or, by accepting very large stocks, not using the optimal capabilities of the port infrastructure [16]. For the development of ports, especially small and medium-sized ones, it is very important to optimally use the capabilities of the port infrastructure, having accurately assessed in advance the probability of safe entry and the mooring of ships of the appropriate parameters into the port.
Ports, especially small and medium-sized ones, are often located in cities or near other residential and industrial regions and therefore usually have limited territorial areas and opportunities for expansion [24]. Therefore, it is very important to conduct a probabilistic assessment of the areas allocated for cargo handling in order to balance the possibilities of port infrastructure and superstructure with the existing areas of port territories.
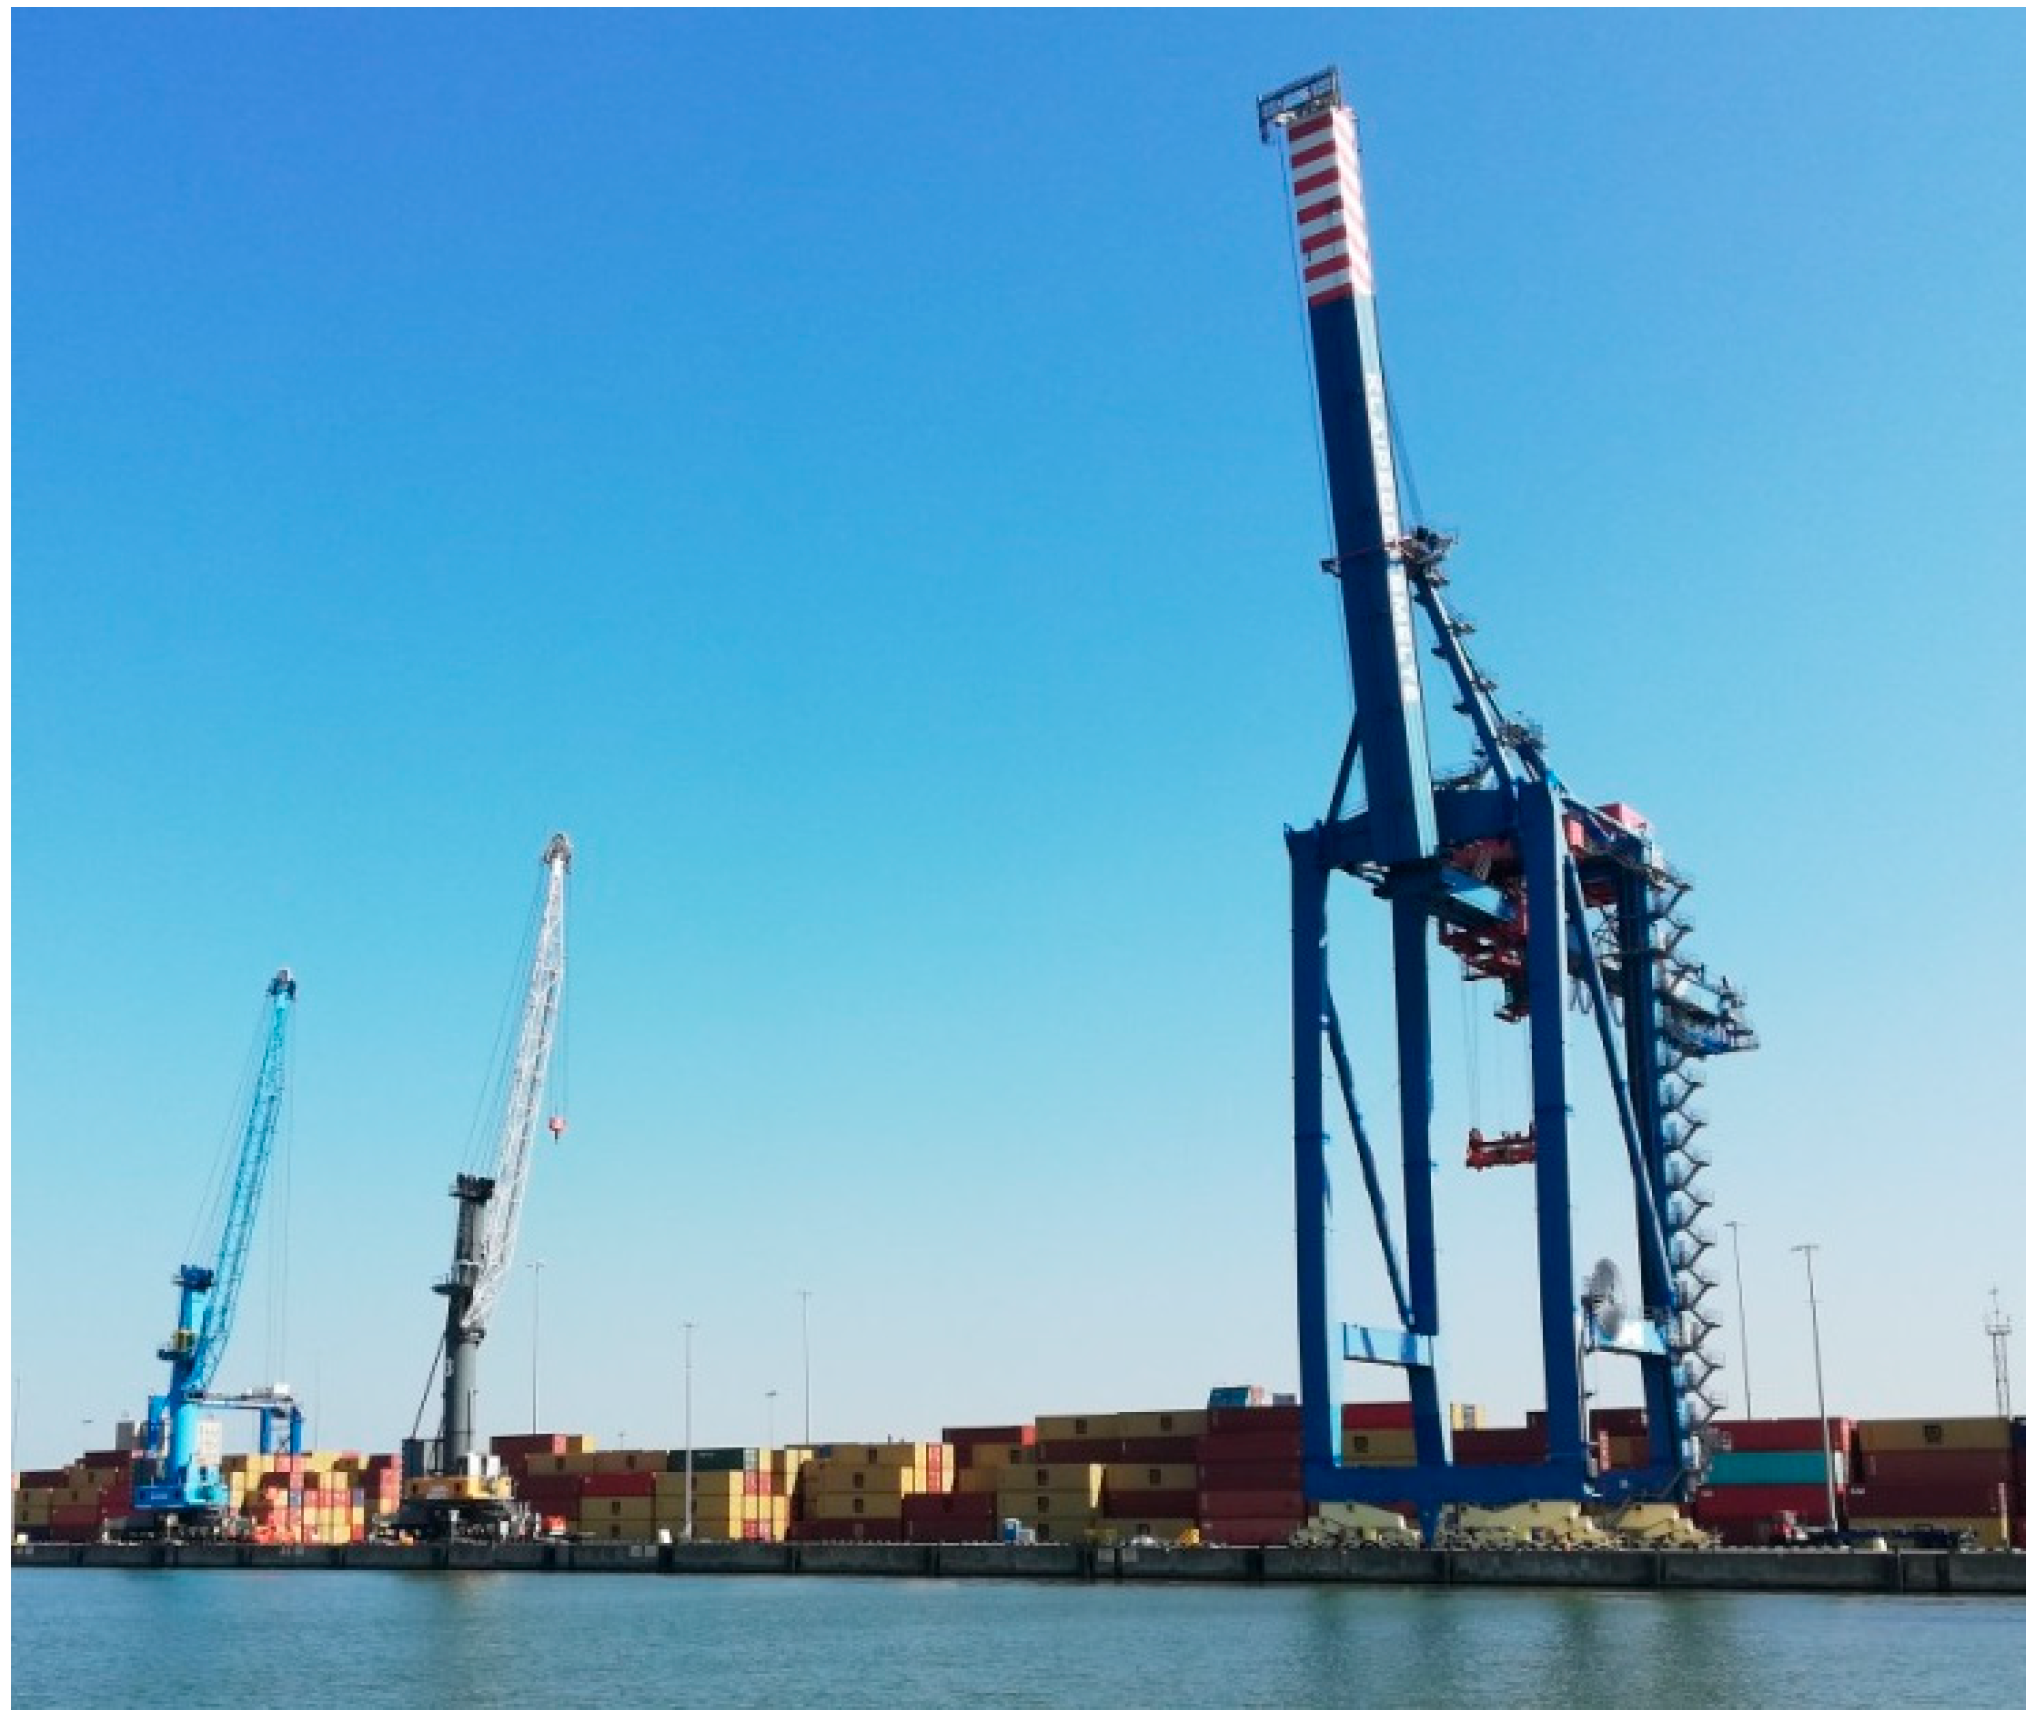
Port handling equipment for ship handling is expensive and sometimes difficult to access for small and medium-sized ports [25,26,27]; therefore, when planning port development, it is very important to perform a probabilistic assessment of the optimal amount of such equipment and its parameters (Figure 1 and Figure 2).
Specialists are one of the most difficult factors to implement, especially for small and medium-sized ports [28], as the recruitment and training of specialists requires significant investment and often a lot of time. Therefore, an optimal probabilistic assessment of the available and necessary specialists, depending on the forecasted port activity, is very important.
Land transport connections are very important, especially for small and medium-sized ports, since, in many cases and in many regions (where there are no large ports or large industrial facilities), they have been and are mainly passenger-oriented [29]. Therefore, when developing small and medium-sized ports, it is very important to assess as accurately as possible the probable capacity and feasibility of these connections and to balance them with the forecasted port activity.
The literature analysis shows that existing methods, mostly focused on large ports, do not address the specifics of small and medium-sized ports due to the limitations of their infrastructure and superstructure; therefore, this article focuses on the specifics of assessing small and medium-sized ports. The main difference in the proposed probabilistic method, compared to deterministic or simulation-based models, such as the queuing theory, discrete event modeling, and others used in port capacity planning, is the ability to relatively easily assess and identify the “weak” points of factors in small and medium-sized ports and, based on the obtained probabilistic factors, purposefully correct and develop them.
The totality of the factors above affects the capacity of small and medium-sized ports’ ship throughput and cargo processing volume in the port; therefore, for the optimal development of small and medium-sized ports, it is very important to create a sufficiently accurate and practically acceptable methodology based on the optimal operations of such ports and the assessment of ship moorings at port quays, based on the principles of the probability theory.

3. Methodology for Assessing the Possibilities of Small and Medium-Sized Ports and Ship Mooring at Quays Using the Principles of Probability Theory

The assessment of the activities of small and medium-sized ports and the possibilities of mooring ships at the quays, based on the principles of the probability theory [9,29,30], minimizing ship time losses while waiting to enter the port, and processing ships at the port terminal are important and are related to the coordination of the main port factors.
The entry of ships into the port and mooring and the necessary assistance of tugs are directly related to hydrometeorological and hydrological conditions, ship maneuverability and available ship auxiliary control devices (thrusters), depth in port channels, ship turning basins, and approaches to quays [31].
The probabilistic assessment of ship entry into the port, their mooring at the quays, and the performance of loading operations is related to navigational restrictions, such as the maximum permissible wind and current speeds, the tide situation, and other possible restrictions [6,9,16,20,31].
The theoretical assessment of the activities of small and medium-sized ports can be carried out in a complex manner or by assessing each factor separately and further searching for optimal compatibility between them. Therefore, it is very important to assess all the main factors, their possible limits of variation, and possibilities of regulation. The developed mathematical model allows us to assess the possible factors and their probable limits of variation in order to comprehensively assess the possibilities of small and medium-sized ports and mooring ships at the quays, in order to optimize the entry of ships into the port and their processing at terminals, using the principles of the probability theory [29].

3.1. Steps of Research Methodology

The following stages of the research methodology were used to conduct the study: an analysis of small and medium-sized ports and the literature was performed; data on such ports and ship moorings in them were collected, and their analysis was performed under various conditions. The mathematical model was created using the principles of probability theory; calculations were performed using the created mathematical model and using the collected experimental data, and the mathematical model was adjusted based on the results obtained; and directions for discussions were formulated and conclusions were prepared (Figure 3).
Based on the presented basic methodology (Figure 3), a theoretical model for assessing the activities of small and medium-sized ports and ship mooring at quays was developed, taking into account various factors.
In order to improve and verify the developed model, experiments were carried out in real small and medium-sized ports and terminals with real ships, under various conditions (ship sizes, different parameters of loading equipment, etc.) and based on the experimental results obtained, a theoretical model for assessing the activities of small and medium-sized ports and ship mooring opportunities was improved. During the research, possible conditions for the activities of small and medium-sized ports and their expected limits of variation were determined. The experiment’s results were processed using the Kalman filter [30] and the maximal distribution method [32].
The probabilistic assessment of the technical and organizational capabilities and berthing capabilities of small and medium-sized ports is important because such ports often have limited cargo handling and tugboat and other auxiliary equipment capacities. When assessing limited capabilities, it is very important to balance the available real capabilities to receive ships into the port and process them.
In order to confirm the theoretical results, it is very important to conduct experiments with real objects such as small and medium-sized ports and the ships entering such ports, especially under boundary conditions. Based on the experimental results obtained, it is possible to adjust the created mathematical models so that they can be applied to forecasting the future activities of small and medium-sized ports and the ship servicing within them.

3.2. Mathematical Assessment of Small and Medium-Sized Port Activities and Ship Mooring Opportunities at Quays, Applying the Principles of Probability Theory

When evaluating the main factors, using the principles of probability theory, the probabilistic parameters of the factors can be evaluated separately, in separate groups, or all together. In most cases, when evaluating the main factors together, the total probability can be written as follows [29]:
P = 1 ɳ P P N P S P E q P S l P o t ,
Here, ɳ P —the correlation coefficient is meaningful when there are similarities between the factors, for example, if the ship cannot enter the port due to high wind speed and, at the same time, the terminal cranes cannot work due to high wind speed. In the studied situation, the correlation coefficient can be taken as about 0.95–0.99. If there is only one factor or if there is no relationship between the factors, the correlation coefficient will be equal to one; P N —the safe mooring of ships in the port probability factor, which means the possibility of the largest possible ship entering (depends on the existing parameters of the berths intended for such ships); P S —the probability factor of the available terminal area for cargo processing, which means the possibility of maximum use of the area located near the berth for cargo processing; P E q —the probability factor of the use of the loading equipment in the terminal, which means the maximum use of the loading equipment; P S l —the probability factor of the capacity of the terminal connections with the shores (railways, roads, inland waterways, and pipelines), which means the maximum possibilities of cargo delivery and removal to and from the terminal; and P o t —other possible probabilistic factors, such as the sufficiency of specialists and their training, additional administrative restrictions, and the like.
The overall probability of a ship entering the port and being processed at the terminal is important in that it allows for a comprehensive assessment of the conditions of a ship’s presence in the port and the adjustment of individual factors to optimize the functionality of small and medium-sized ports.
The safe mooring of ships in the port probability factor, which represents the possibility of entry for the largest possible vessel and depends on the existing parameters of the berths intended for such vessels, can be calculated as follows:
P N = 1 L q ( L S n s + L ) L q
where L S —length of the vessel moored at the quay; n s —number of vessels moored at the quay; L q —total length of the quay(s) to which the largest vessels can be moored; and L —spacing between moored ships (recommended up to 20% of the length of the largest vessel to be moored).
In the event that the length of the berth occupied by a ship or ships becomes greater than the length of the berth itself (sometimes ships are moored in such a way that part of the ship “exits” beyond the length of the berth), the probability is assumed to be about 0.9999…, and this probability factor shows the efficiency of berth usage.
The probability factor of the available terminal area for cargo handling, which means the possibility of maximum use of the area located near the quay for cargo handling, depends on the size of the area itself, the area utilization factor, depending on the type of cargo and the technology used, as well as on the time of cargo storage at the terminal. In this way, the probability factor of cargo handling for the available terminal area can be calculated as follows:
P S = 1 ( S T S F k T F ) t T F S T k T t T ,
Here, S T —total terminal area; S F —actual usable terminal area for loading cargo; k T F —actual terminal area utilization factor; t T F —actual average cargo storage time at the terminal (in days); k T —theoretical terminal area utilization factor (estimates cargo arrival and departure routes, as well as necessary additional technological areas, for example, work areas for loading technicians near cargo storage areas); and t T —maximum permissible cargo storage time at the terminal (in days).
Terminal area utilization is one of the most important indicators of small and medium-sized ports; therefore, assessing and increasing this probabilistic indicator by using new loading and cargo storage technologies is very important for increasing terminal efficiency.
The probability coefficient of terminal loading equipment utilization, which indicates the maximum utilization of loading equipment such as STS or mobile cranes for cargo transshipment from or to ships, can be calculated as follows:
P E q = 1 n T E F q T E F k T E F n T E q T E k T E ,
Here, n T E F —the number of terminal handling equipment for ships actually used at the terminal; q T E F —the actual average throughput of the terminal equipment, for example, containers per hour; k T E F —the actual utilization factor of the terminal equipment over time; n T E —the total number of handling equipment for ships; q T E —the possible maximum throughput of the terminal equipment, for example, about 35 movements per hour are assumed for an STS crane; and k T E —the possible maximum utilization factor of the terminal handling equipment on ships.
When assessing the performance of terminal handling equipment, especially in small and medium-sized ports, possible additional constraints must be taken into account, such as possible equipment limitations due to the possible arrangement of equipment in relation to the ship, the ability to reach the most distant cargo, such as containers, so as not to have to additionally re-moor (turn around) the ship, and other possible technological and organizational constraints.
Small and medium-sized ports are often limited in their financial capabilities to purchase the latest equipment and technology; therefore, the factor of probabilistic terminal equipment utilization is important in finding more efficient solutions for increasing terminal capacity.
Connections to land transport systems (rail, road, inland waterways, and pipelines) are very important for a port or terminal to bring cargo to and from the terminal. The capacity probability coefficient of connections to land transport systems of small and medium-sized ports, which represents the maximum possibilities for bringing cargo to and from the terminal, can be calculated as follows:
P S l = 1 Q R k R + Q R O k R O + η Σ ( Q R F k R F + Q R O F k R O F + ) η Σ F ( Q R k R + Q R O k R O + ) η Σ ,
Here ,   Q R —maximum possible capacity of the railway connecting the terminal to the national railway network; k R —maximum possible utilization coefficient of the railway connecting the terminal to the national railway network; Q R O —maximum possible capacity of road transport connecting the terminal to the national road network; k R O —maximum possible utilization coefficient of roads connecting the terminal to the national road network; η Σ —actual maximum possible correlation coefficient of transport connections connecting the terminal to the national transport networks; Q R F —actual capacity of the railway connecting the terminal to the national railway network per year; k R F —actual utilization coefficient of the railway connecting the terminal to the national railway network; Q R O F —actual capacity of road transport connecting the terminal to the national road network; k R O F —actual utilization coefficient of roads connecting the terminal to the national road network; and η Σ F —actual correlation coefficient of transport connections connecting the terminal to the national transport network.
Small and medium-sized ports are often located in cities or close to residential areas, which makes it sometimes difficult to develop transport infrastructure, especially railways, connecting the terminal to the country’s public transport networks; therefore, the probabilistic assessment of this factor is very important for the overall development of the port and the city.
Other possible probabilistic factors, such as the sufficiency of specialists and their training, additional administrative restrictions, etc., usually have a direct impact on the results of terminal operations; therefore, it is appropriate to assess them when planning terminal capacities and calculating the expected mooring of ships at the quays. The probability coefficient of other possible factors, such as the sufficiency of specialists and their training, additional administrative restrictions, etc., can be calculated as follows:
P o t = 1 T S p k S p + T L k L + η L ( T S p F k S p F + T L F k L F + ) η L F ( T S p k S p + T L k L + ) η L ,
Here ,   T S p —necessary (normative) number of specialists at the terminal; k S p —importance of the impact of specialists on ship processing operations at the terminal (weight coefficient); T L —other possible restrictions, such as various necessary inspections of the ship, for example, a sanitary inspection before the ship receives a sanitary certificate before loading cargoes of animal origin and the like; k L —weight coefficient of other possible restrictions (in all cases, the sum of the weight coefficients in the numerator, as well as in the numerator, must be equal to one); η L —correlation coefficient of the effects in the denominator, in the case of interconnected processes; T S p F —actual total working time of specialists at the terminal per day; k S p F —actual influence of specialists on the ship processing process (weight); T L F —other actual restrictions that hinder ship loading processes per day, falling on specialists; k L F —weight coefficient of other actual restrictions (the sum of the weight coefficients of actual restrictions must be equal to one); and η L F —correlation coefficient of actual restrictions, which makes sense in the case of interconnected processes.
Existing port and terminal research and development methods are mostly focused on large ports and usually do not assess the potential development aspects of ports located in cities or close to residential areas, problems related to the transport infrastructure connecting small and medium-sized ports with the country’s public transport networks, and other features specific to small and medium-sized ports.
In addition to the probability coefficients of factors, it is very important for the assessment of the performance of small and medium-sized ports to assess their potential capacity or the potential capacity of individual terminals, which is mainly related to the capacity of the terminal’s loading equipment and storage capabilities. After evaluating the indicated factors, the terminal capacity per year can be estimated using the following mathematical equation:
Q T = T T n T E q T E k T E
Here, T T —the number of hours a terminal operates per year.
For specific cargoes, the available terminal area for cargo storage is very important; for example, when storing containers, it is necessary to assess the area occupied by the container and the number of containers stacked on top of each other. Then, for example, the terminal container capacity ( Q T C in TEU) can be calculated as follows:
Q T C =   S T C T n h k T C S C t c ,
Here, S T C —terminal area intended for container storage; T —terminal working time per year (days); n h —average number of containers stacked vertically (one on top of the other); k T C —container storage area utilization factor (on average, about 0.3–0.5); S C —area occupied by a container (for a 20’ container, TEU, it is about 15 m2); and t c —containers’ average storing days in the terminal (days).
The operating hours of the container and other terminals may be affected by navigation restrictions related to tides, especially if the so-called “window” of ship navigation is used, where ships are brought into and out of the port one hour before high tide and one hour after high tide (or another “window” period is set). In individual small and medium-sized ports, restrictions on the time of bringing ships into and out of the port are applied; for example, ships are not brought into and out of the port at night, ships are not brought into and out of the port due to difficult ice conditions, and the like.
Knowing the terminal capacity, it is possible to calculate the maximum possible number of ships per year by estimating the average carrying capacity of ships arriving at the terminal, for example, the number of containers arriving at and leaving the terminal. The number of ships arriving at the terminal can then be calculated as follows:
N S = Q T Q S k S ,
Here, Q S —average carrying capacity of ships arriving at the terminal; k S —average capacity utilization factor of ships.
Knowing the terminal’s loading intensity and its operating hours per day or other time period, it is possible to calculate whether the terminal’s loading capacities will be able to service the number of ships arriving at the terminal or whether additional measures need to be taken, for example, increasing the number of work shifts, equipment, and employees, to ensure the transportation of the planned cargo volume. The processing time for one ship can be calculated as follows:
T S = Q S k S n T E q T E k T E .
The time of a ship’s service in the port, using the principles of the probability theory, can be calculated by evaluating the pilot waiting time, the time for ships to enter the port and moor, the time required to prepare ships for loading operations, and the time required to perform loading operations, including securing the cargo, preparing the ship for departure, and the time it takes for the ship to depart the port as follows:
T S P = 1 ɳ S P ( t P v / P P v + ( 2 S P v P ) / P P S + t S m P S m + t S p P S p + t S h P S h + t S p l P S p l + t S u m P S u m ) ,
Here, t P v —pilot waiting time; P P v —pilot waiting time probability; S P —sailing distance from the pilot reception point to the ship’s mooring place; v P —average ship sailing speed from the pilot reception point to the ship’s mooring place; P P S —ship sailing time probability, as the ratio of the actual sailing time to standard time; t S m —ship mooring time; P S m —ship mooring time probability as the ratio of standard time to the actual time; t S p —ship preparation time for loading operations; P S p —ship preparation loading operation probability as the ratio of standard (average statistical) time to the actual time; t S h —ship loading operations time; P S h —ship loading operations time probability, as the ratio between the ship’s standard (average statistical) and actual time; t S p l —cargo securing time; P S p l —probability of cargo securing time, as the ratio of standard (average statistical) and actual time; t S u m —the ship unmooring operation time; and P S u m —the probability of the ship’s unmooring, as the ratio of the standard time to the actual time. In all cases, if the probability obtained is above unity, unity is accepted.
When assessing the probability of port operational factors that influence the entry of ships into the port and the terminal berths, the total number of ships that can be accommodated at the terminal berths can be calculated as follows:
N S P = N S P .
where P —the total probability coefficient of port (terminal) activity factors that affect the mooring of ships at quays.
Having the ship’s processing time in the port, the number of ships that must transport a specific amount of cargo, and the number of ships that can be moored in the port at the same time, it is possible, using the developed methodology, to assess the terminal’s capabilities or knowing the likely “weak” areas of the port, to look for specific solutions to process the predicted cargo flow in the port, since the basis of the transport system as a service system is the cargo flow.

4. Case Study of Probabilistic Assessment of Port Activities and Ship Moorings at Port Quays

The terminal selected for the case study, which handles containers and other cargo, has two quays where ships up to 150 m long can be moored. The terminal’s cargo storage area is about 6 hectares; the terminal area intended for container storage is about 5 hectares; the average number of containers stacked vertically (one on top of the other) is between two and four; the container storage area utilization factor (on average, is from 0.3 up to 0.5); the number of terminal operating hours per year is between 2800 and 8400 h; the total length of the quays to which the largest vessels can be moored is 330 m; and the spacing between moored vessels required to perform mooring procedures is 20 m.
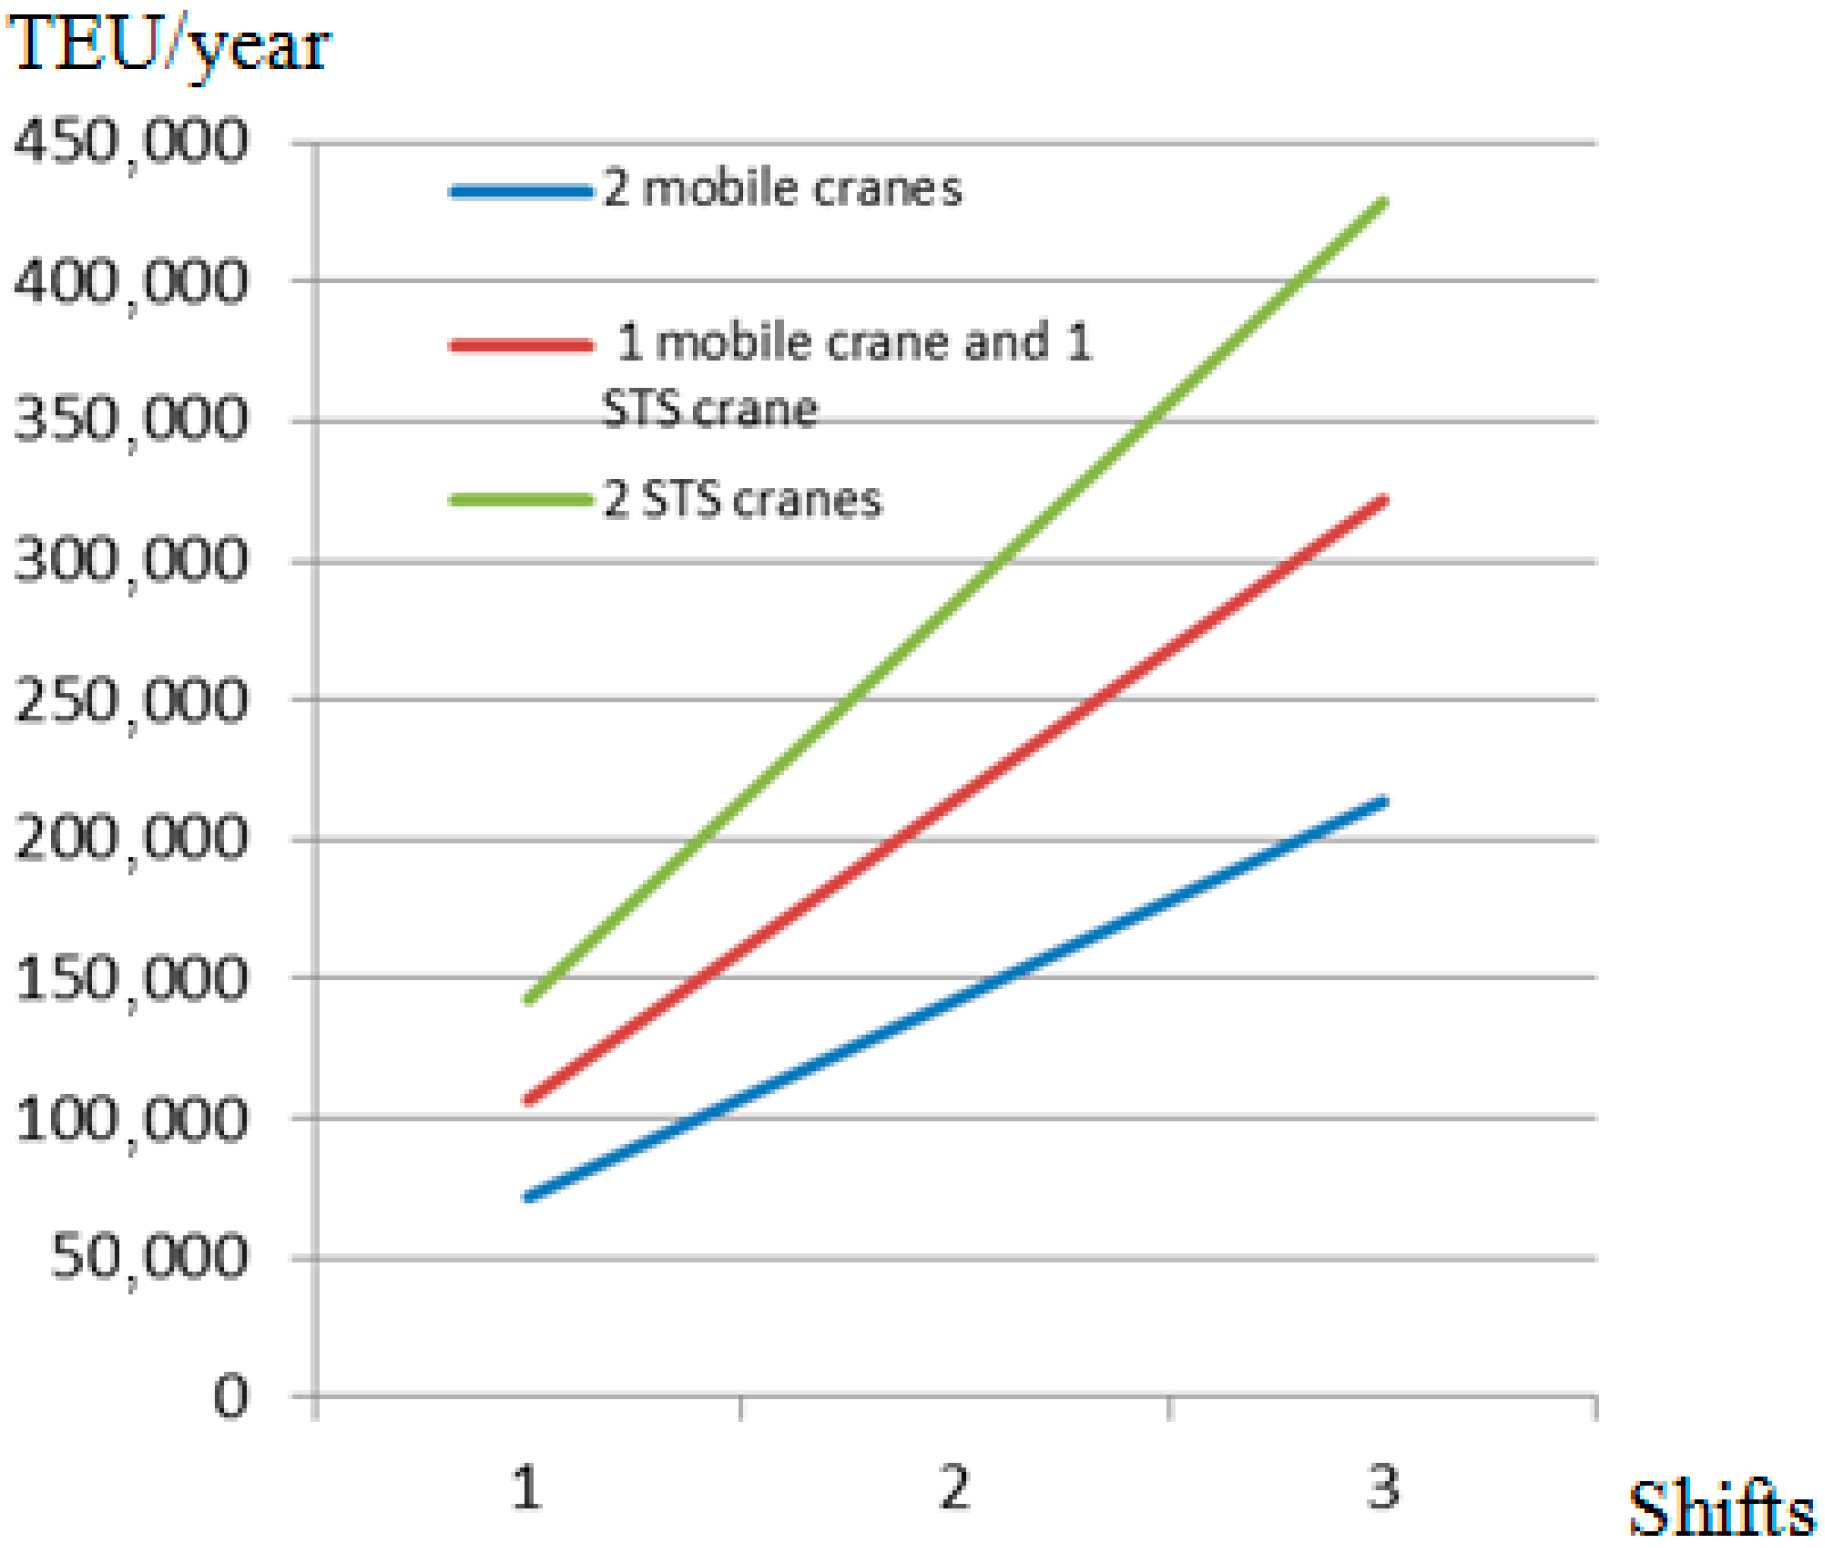
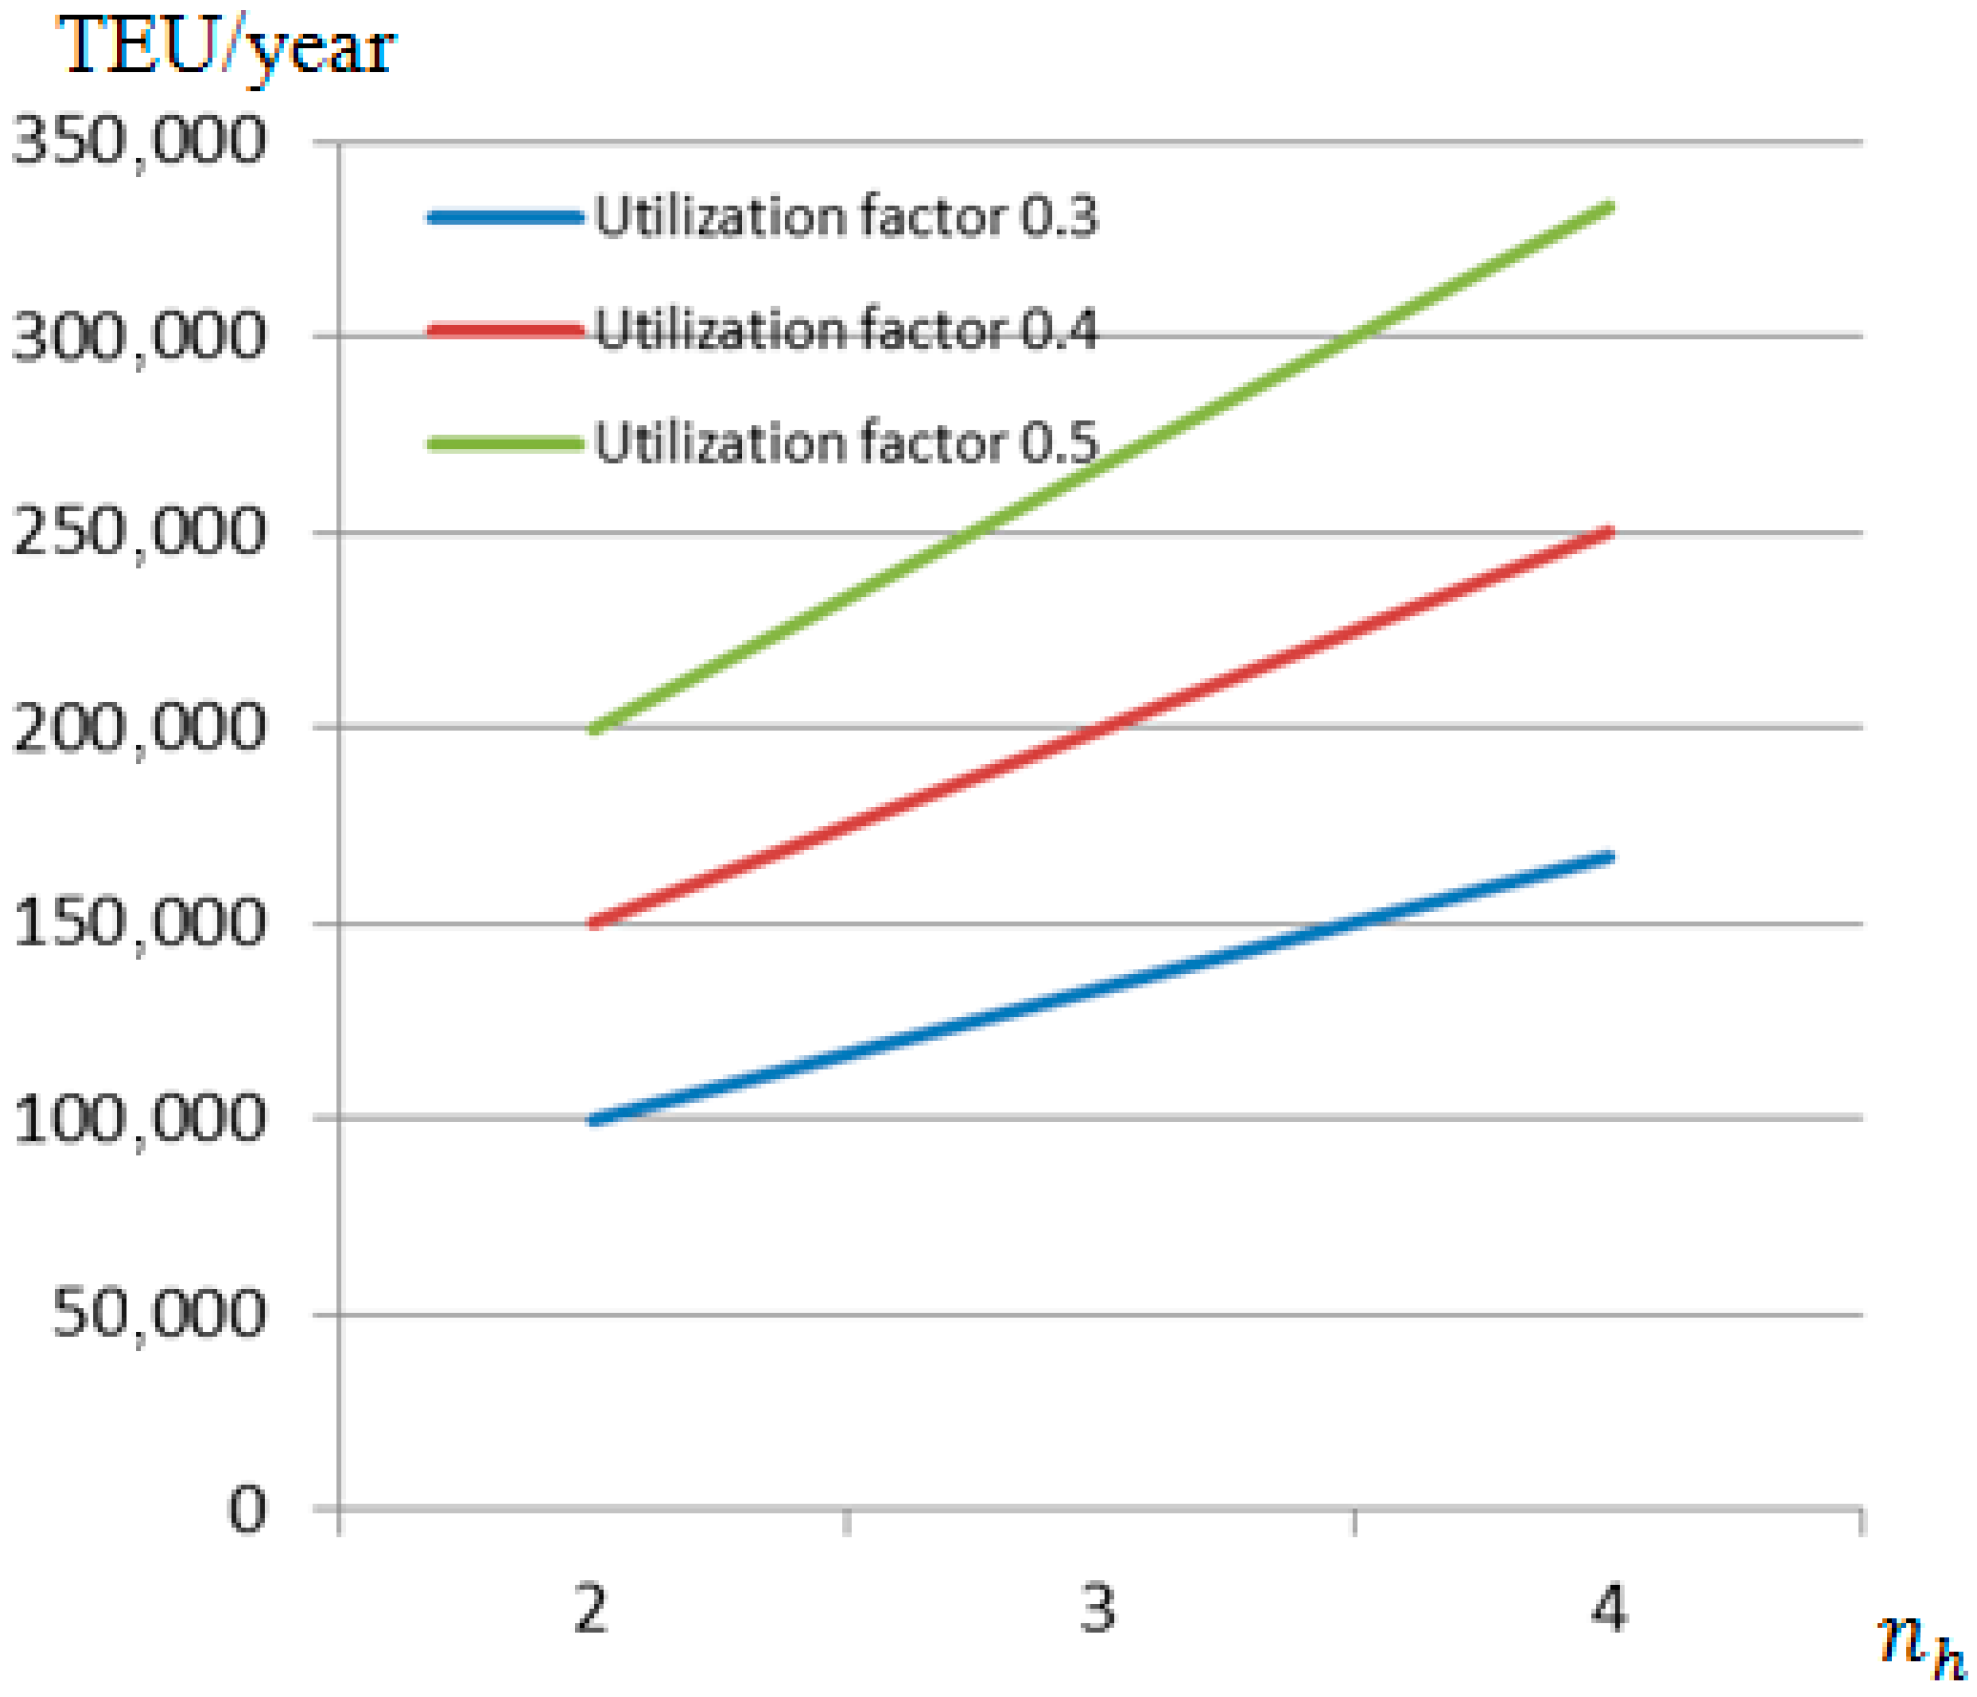
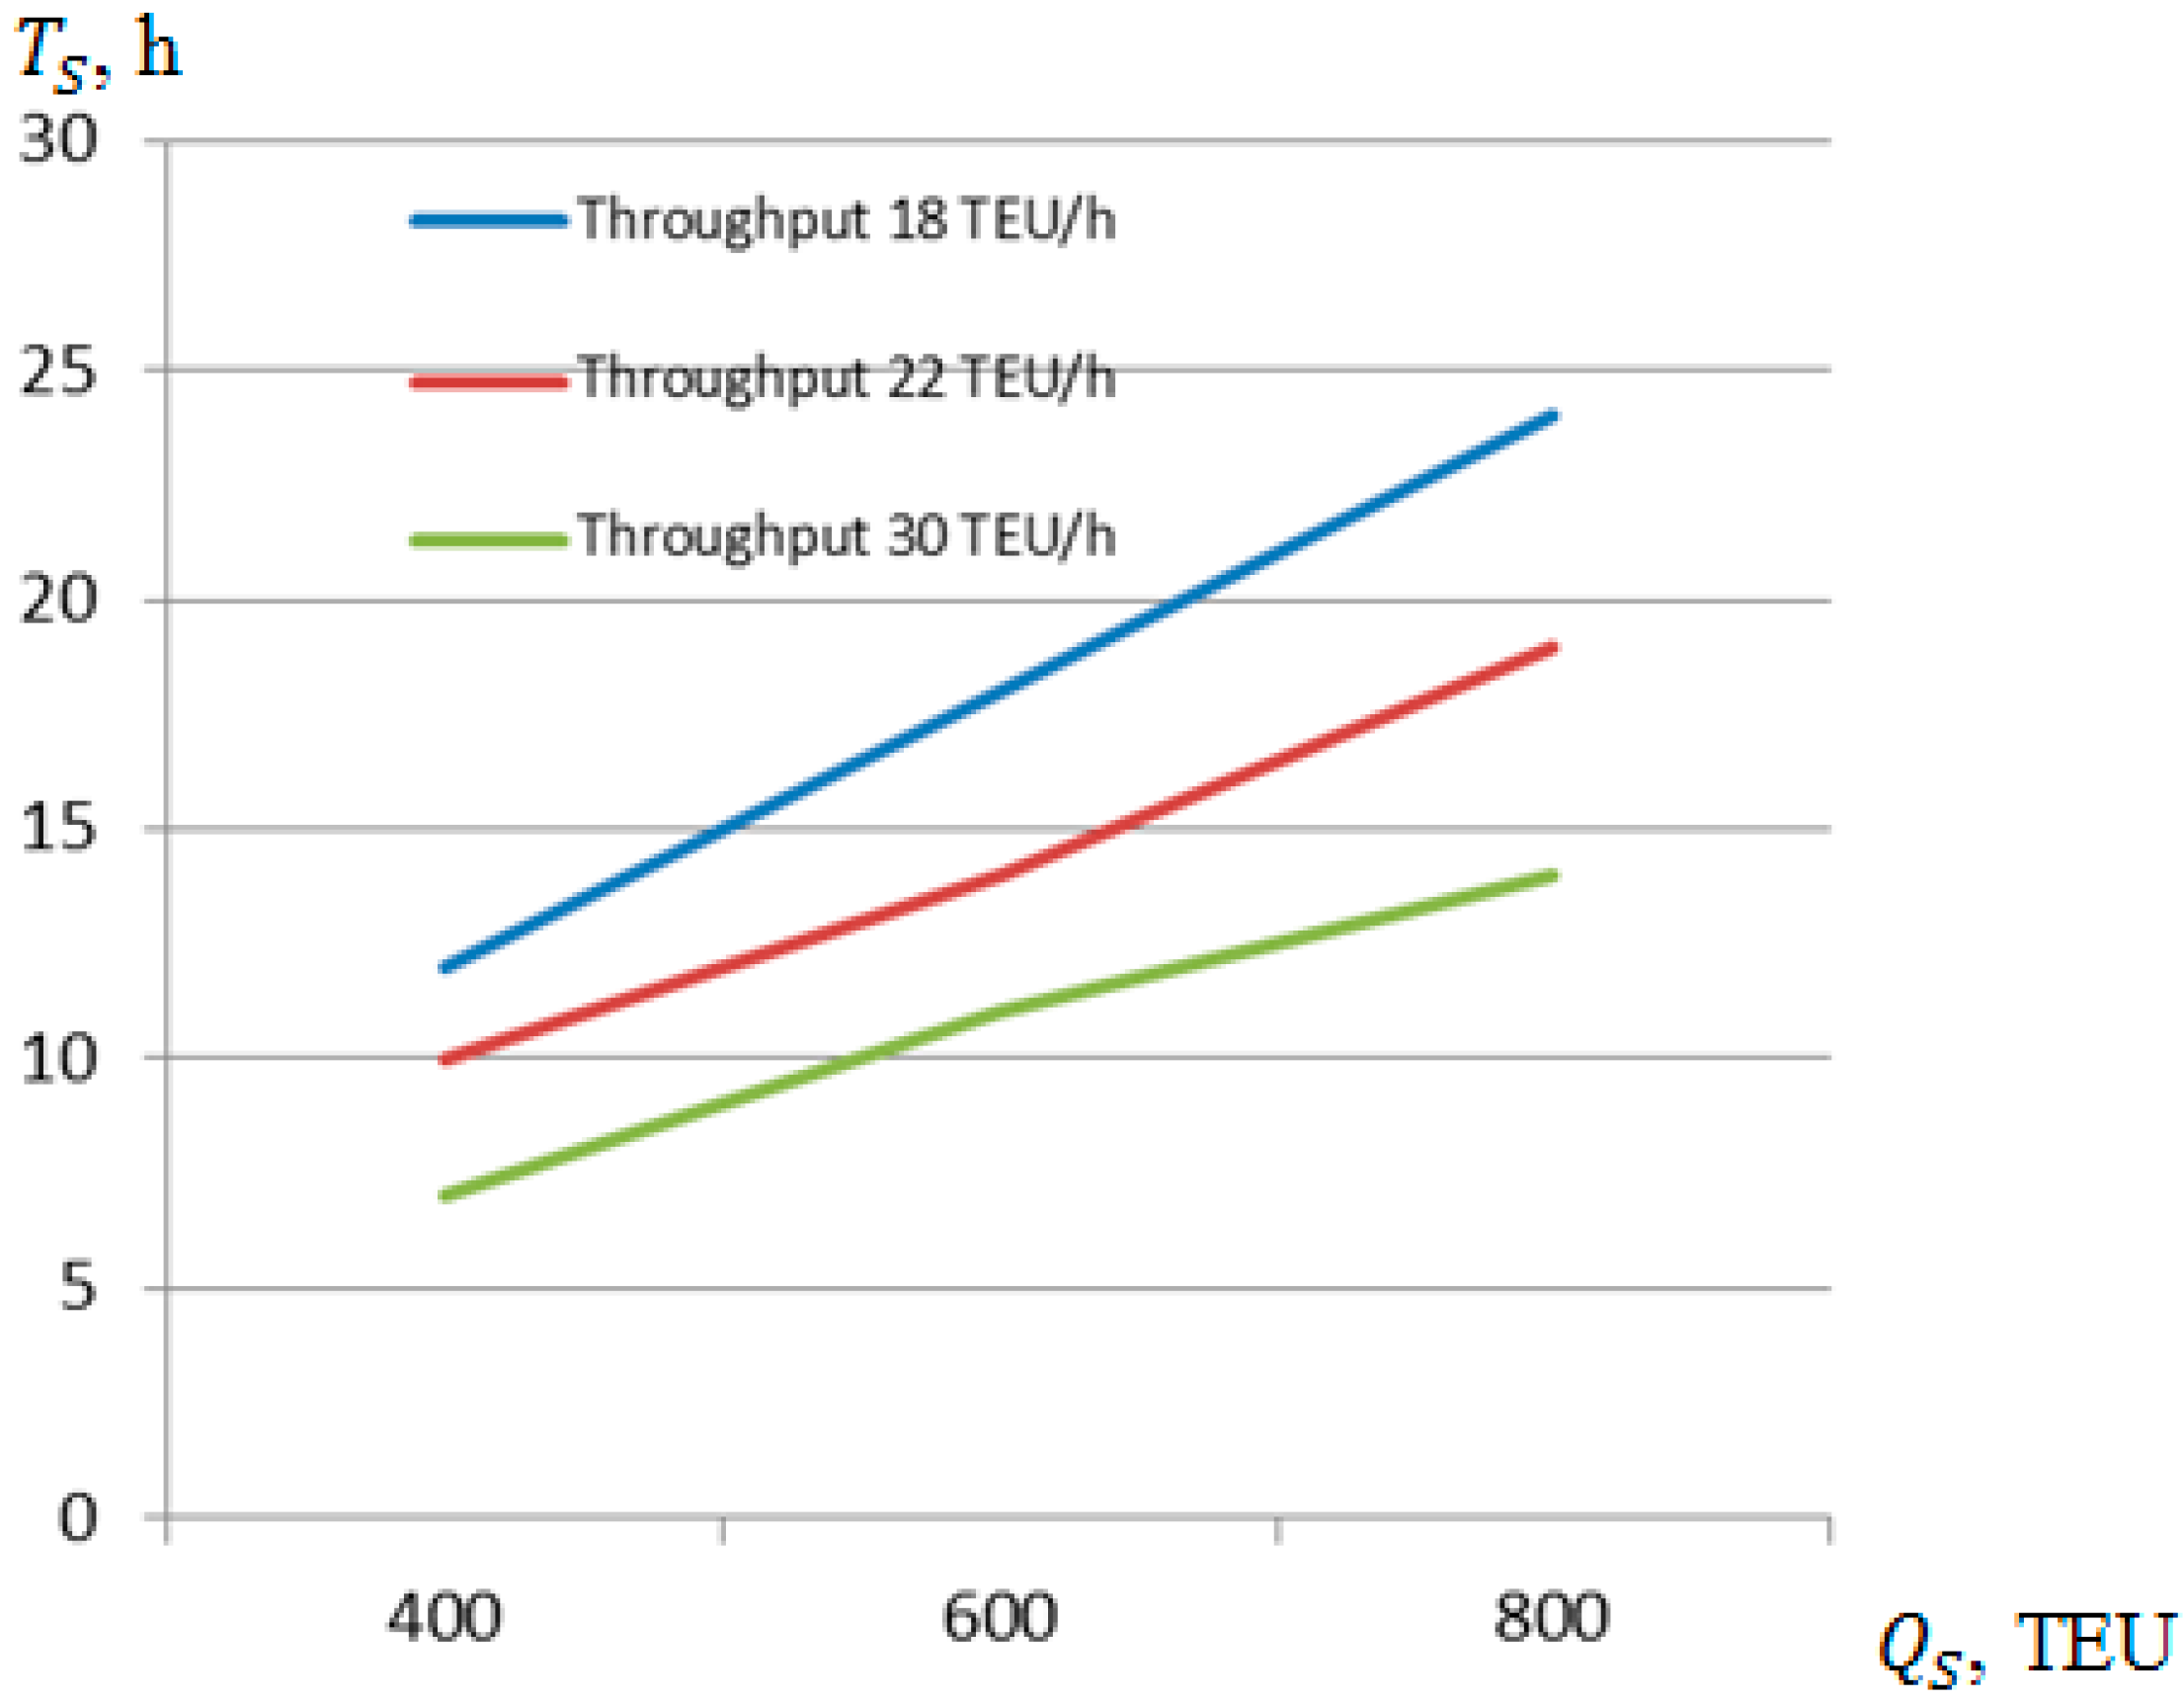
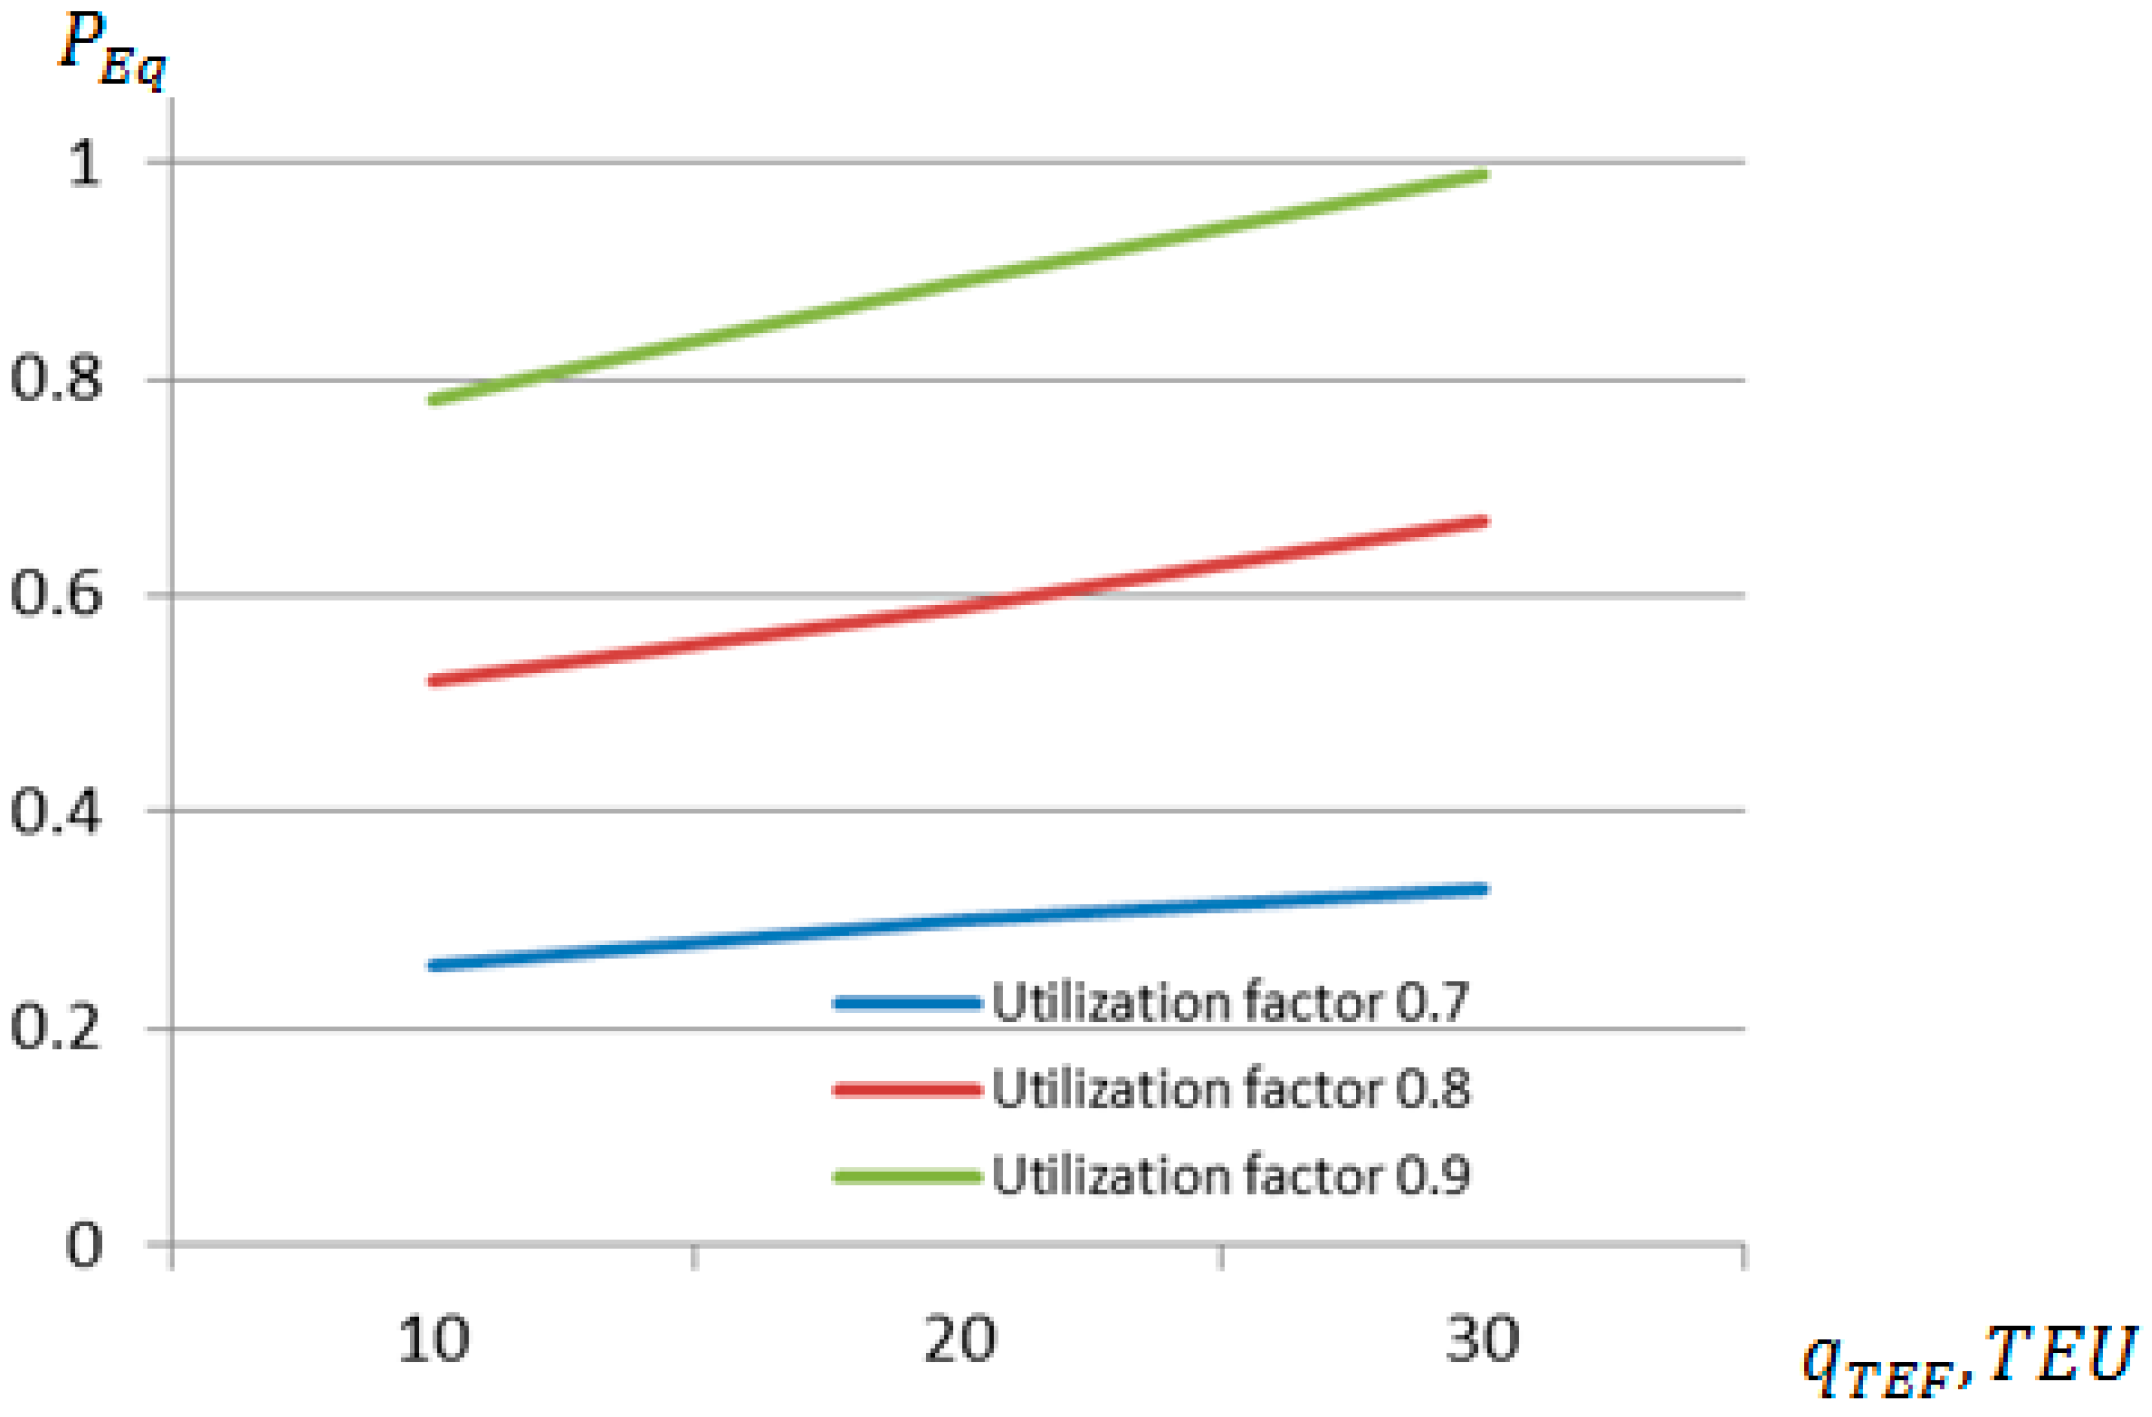
Using the developed methodology, having primary data recorded, and analyzing the work of the terminal and its ship handling equipment for a period of one year, i.e., that one mobile crane loads about 15 and one STS crane loads about 30 containers per hour [32,33], and the terminal can work in one, two, or three shifts, the terminal’s expected capacity to process the possible amount of containers was calculated. The assessments assume that the crane utilization factor can vary from 0.7 to 0.9 (Figure 4). Depending on the terminal area utilization factor for container storage, assuming it to be from 0.3 to 0.5 [34,35,36], and the container loading level (number of vertically stored containers in the terminal) from two to four, the expected annual capacity of the terminal was estimated (Figure 5). The expected loading time of a container ship at the terminal, assuming various possible combinations of container handling cranes and expected utilization factors (with one crane handling from 10 to 30 containers per hour) and the average expected number of containers arriving per ship, is estimated in Figure 6.
The number of work shifts and the types of loading equipment used, together with the optimal use of terminal space, can significantly increase the terminal capacity, speed up ship loading operations, and, at the same time, reduce emissions generated by ships while in the port.
The results of the research presented in Figure 4, Figure 5 and Figure 6 clearly show that, depending on the organization of work (multiple shifts), it is possible to achieve a sufficiently high annual terminal turnover (Figure 4), and by using different container handling technologies and, accordingly, loading equipment at the container storage site, the terminal’s possible annual container turnover can be specified (Figure 5). Depending on the terminal’s loading equipment used for ship processing, the time spent by ships at the quay can be minimized (Figure 6), the possible number of ships at the terminal per unit of time, for example, a year, can be increased, and the environmental impact is reduced by reducing the amount of fuel consumed by ships when ships are at the quays and, accordingly, reducing the emissions generated.
The total expected time of the ship’s stay in the port can be calculated using the developed methodology and evaluating the possible expected times and their probability coefficients. This expected time of the ship’s stay in the port is very important in assessing the probability of occupancy of the terminal berths so that, given the projected cargo volume processed per year, the terminal does not create ship “traffic jams” when ships have to wait until the berth(s) become free [37].
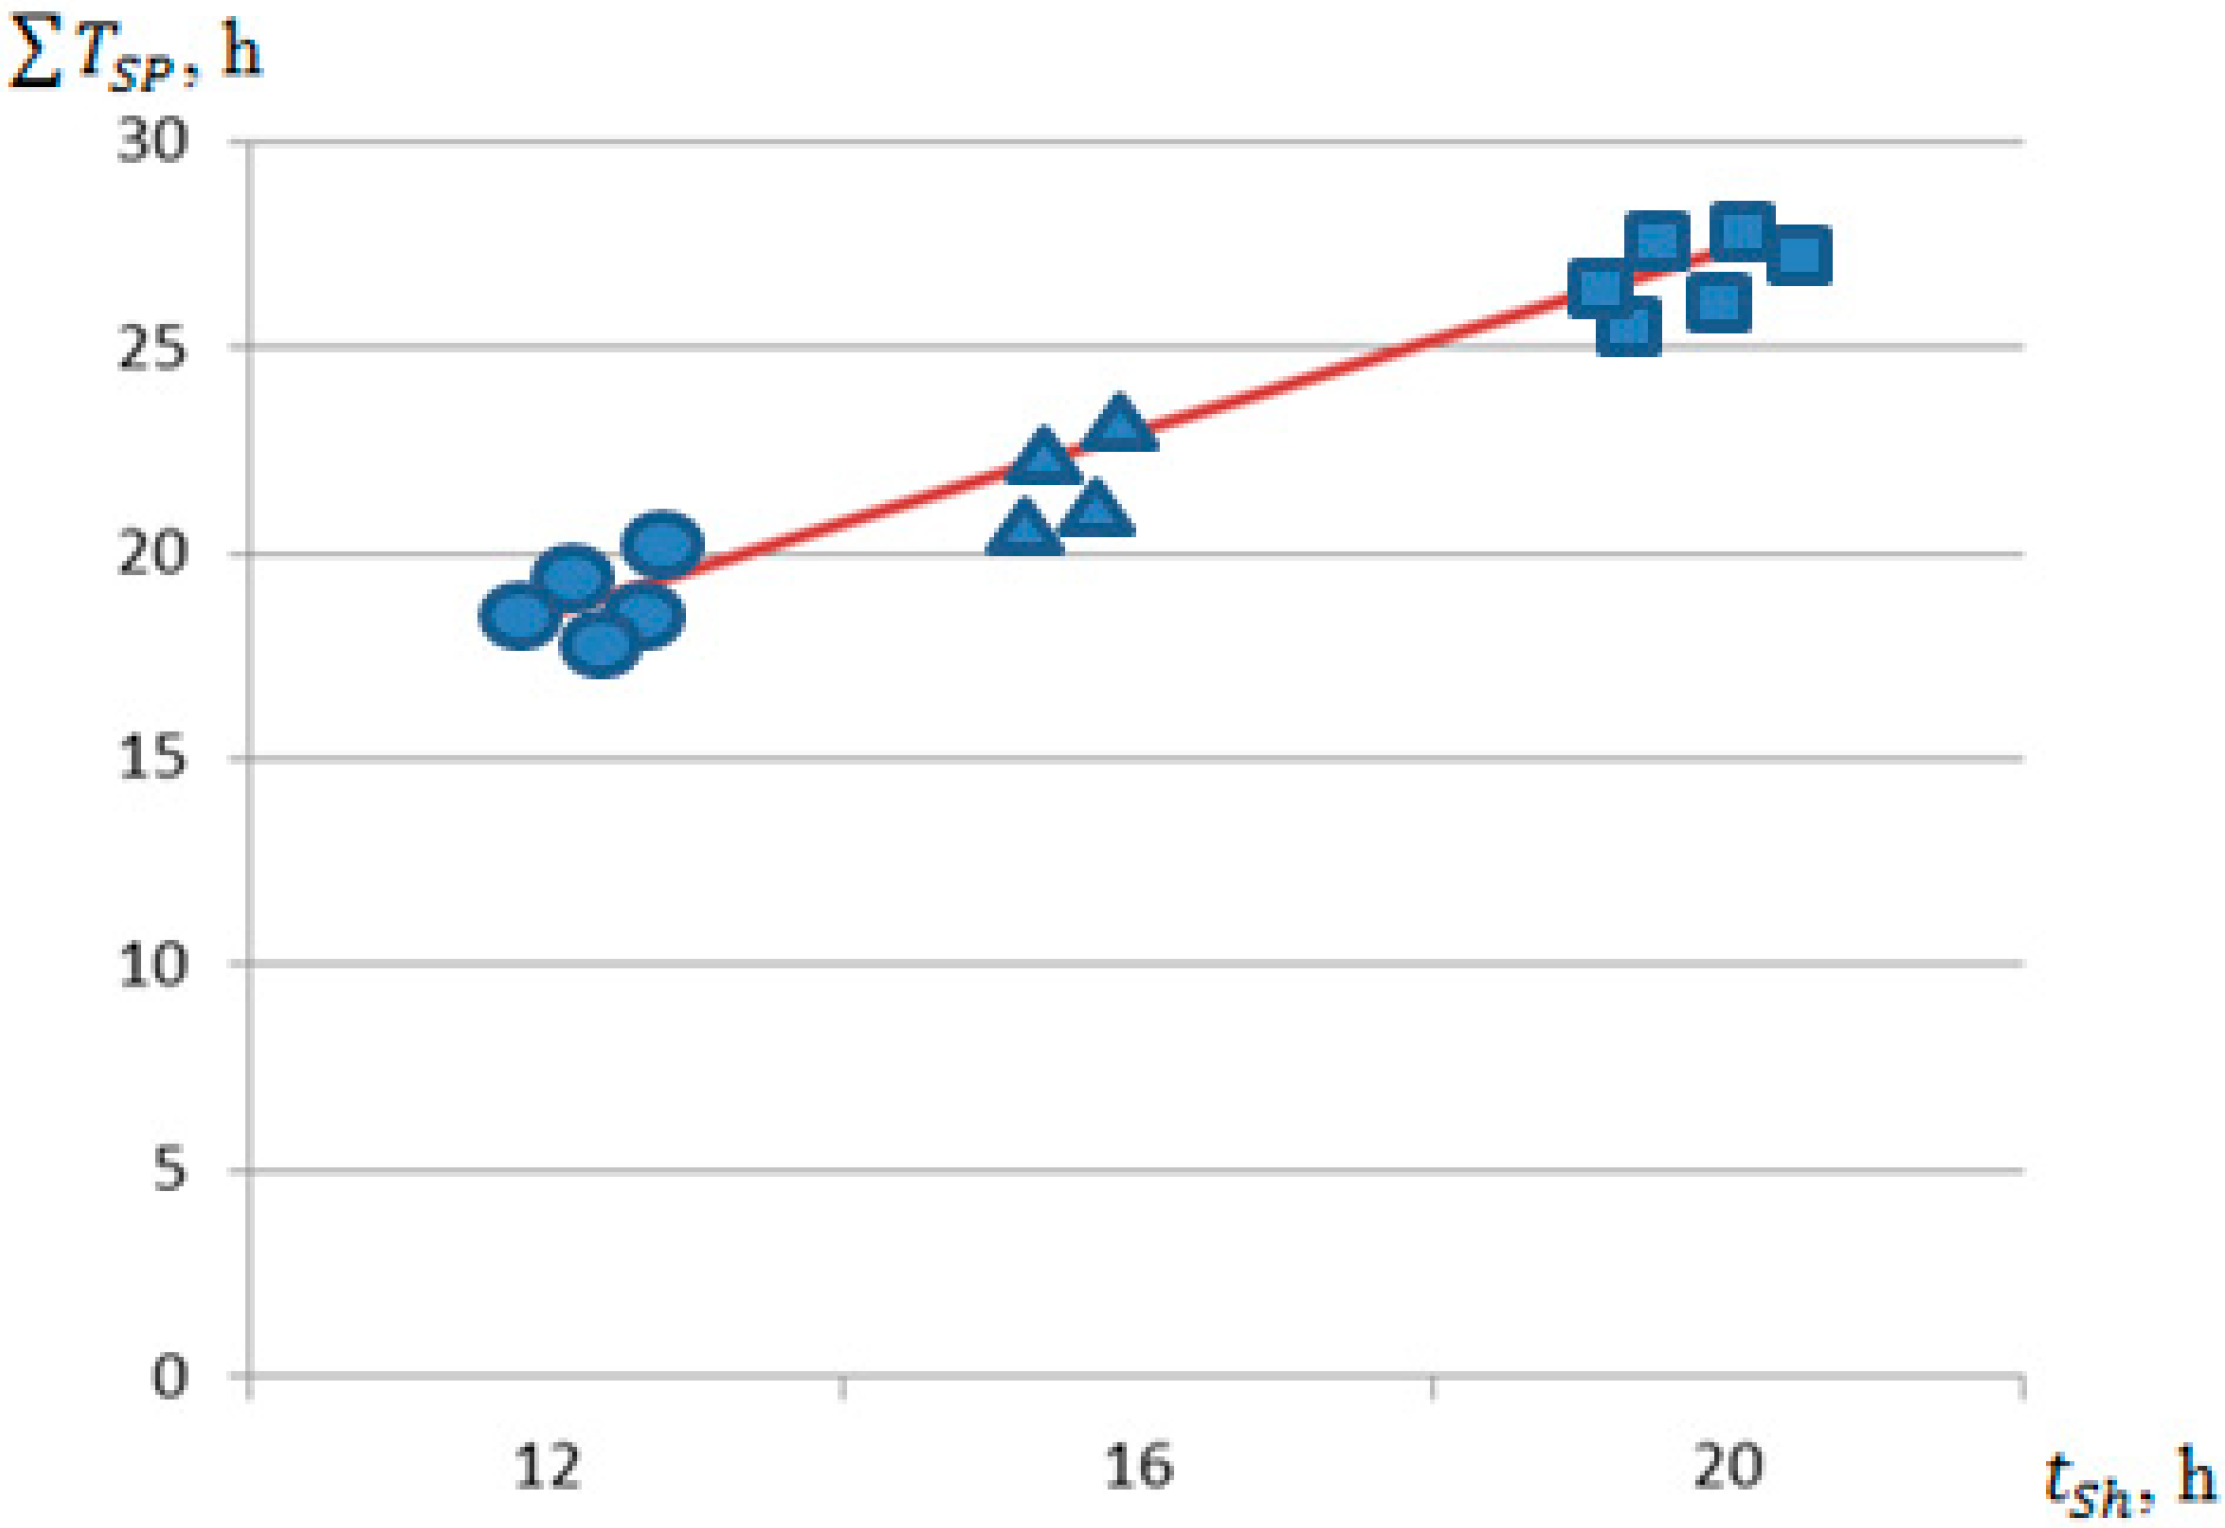
For the theoretical assessment of the ship presence in the port and experiments conducted in real terminals, which are similar in size and accepted ships but use different ship handling equipment, the following primary data was adopted for the probabilistic assessment of ship presence in the port: on average, the carrying capacity of ships arriving at the terminal is about 700 TEU; average capacity utilization factor of ships is about 0.9; pilot waiting time on average is about 0.5 h; the pilot waiting time probability is about 0.90; sailing distance from the pilot reception point to the ship’s mooring place is about 6 miles; average ship sailing speed from the pilot reception point to the ship’s mooring place is about 7 knots; ship sailing time probability, as the ratio of actual sailing time to standard time, is about 0.92; ship mooring time is about 0.4 h; ship mooring time probability as the ratio of standard time to actual time is about 0.97; ship preparation time for loading operations on average is about 0.5 h; ship preparation loading operation probability as the ratio of standard (average statistical) time to actual time is about 0.95; the ship loading operations time depends of the number of mobile or STS cranes being used: using two STS cranes, the ship average loading time is about 12 h, using one STS and one mobile crane is about 16 h, and using two mobile cranes, the ships loading time is about 20 h (Figure 6); the ship loading operations time probability, as the ratio between the ship’s standard (average statistical) and actual time is about 0.90 (use one mobile and one STS crane); cargo securing time is about 1 h; cargo securing time probability, as the ratio of standard (average statistical) and actual time is about 0.90; the ship unmooring operation time is about 0.3 h; and the probability of the ship’s unmooring, as the ratio of the standard time to the actual time, is about 0.95, with a correlation coefficient of 0.98.
The average ship’s port stay time, depending on the type and quantity of cranes used for ship loading operations, when processing one ship handling approximately 700 TEU, is presented in Figure 7. The vessel berthing time was measured at the feeder terminal, where container loading was carried out using STS cranes, mobile cranes, and their combinations (one STS crane and one mobile crane). The measurements of the berthing time of feeder vessels at the quays, when about 700 TEU, were processed on the vessels and were carried out for about a year; the results obtained were processed using the variance method [29].
Different combinations of cranes used for ship loading allow for the regulation of the ship’s berthing time at the quays and, at the same time, optimize the ship’s utilization and terminal work when the terminal receives several container ships at the same time. Optimizing the ship’s berthing time at the quays also reduces the ships’ environmental impact, as they consume less fuel and generate fewer emissions.
When assessing the expected optimal capabilities of the terminal based on the use of loading equipment and the terminal area, the most appropriate terminal capacity would be about 200,000 TEU per year.
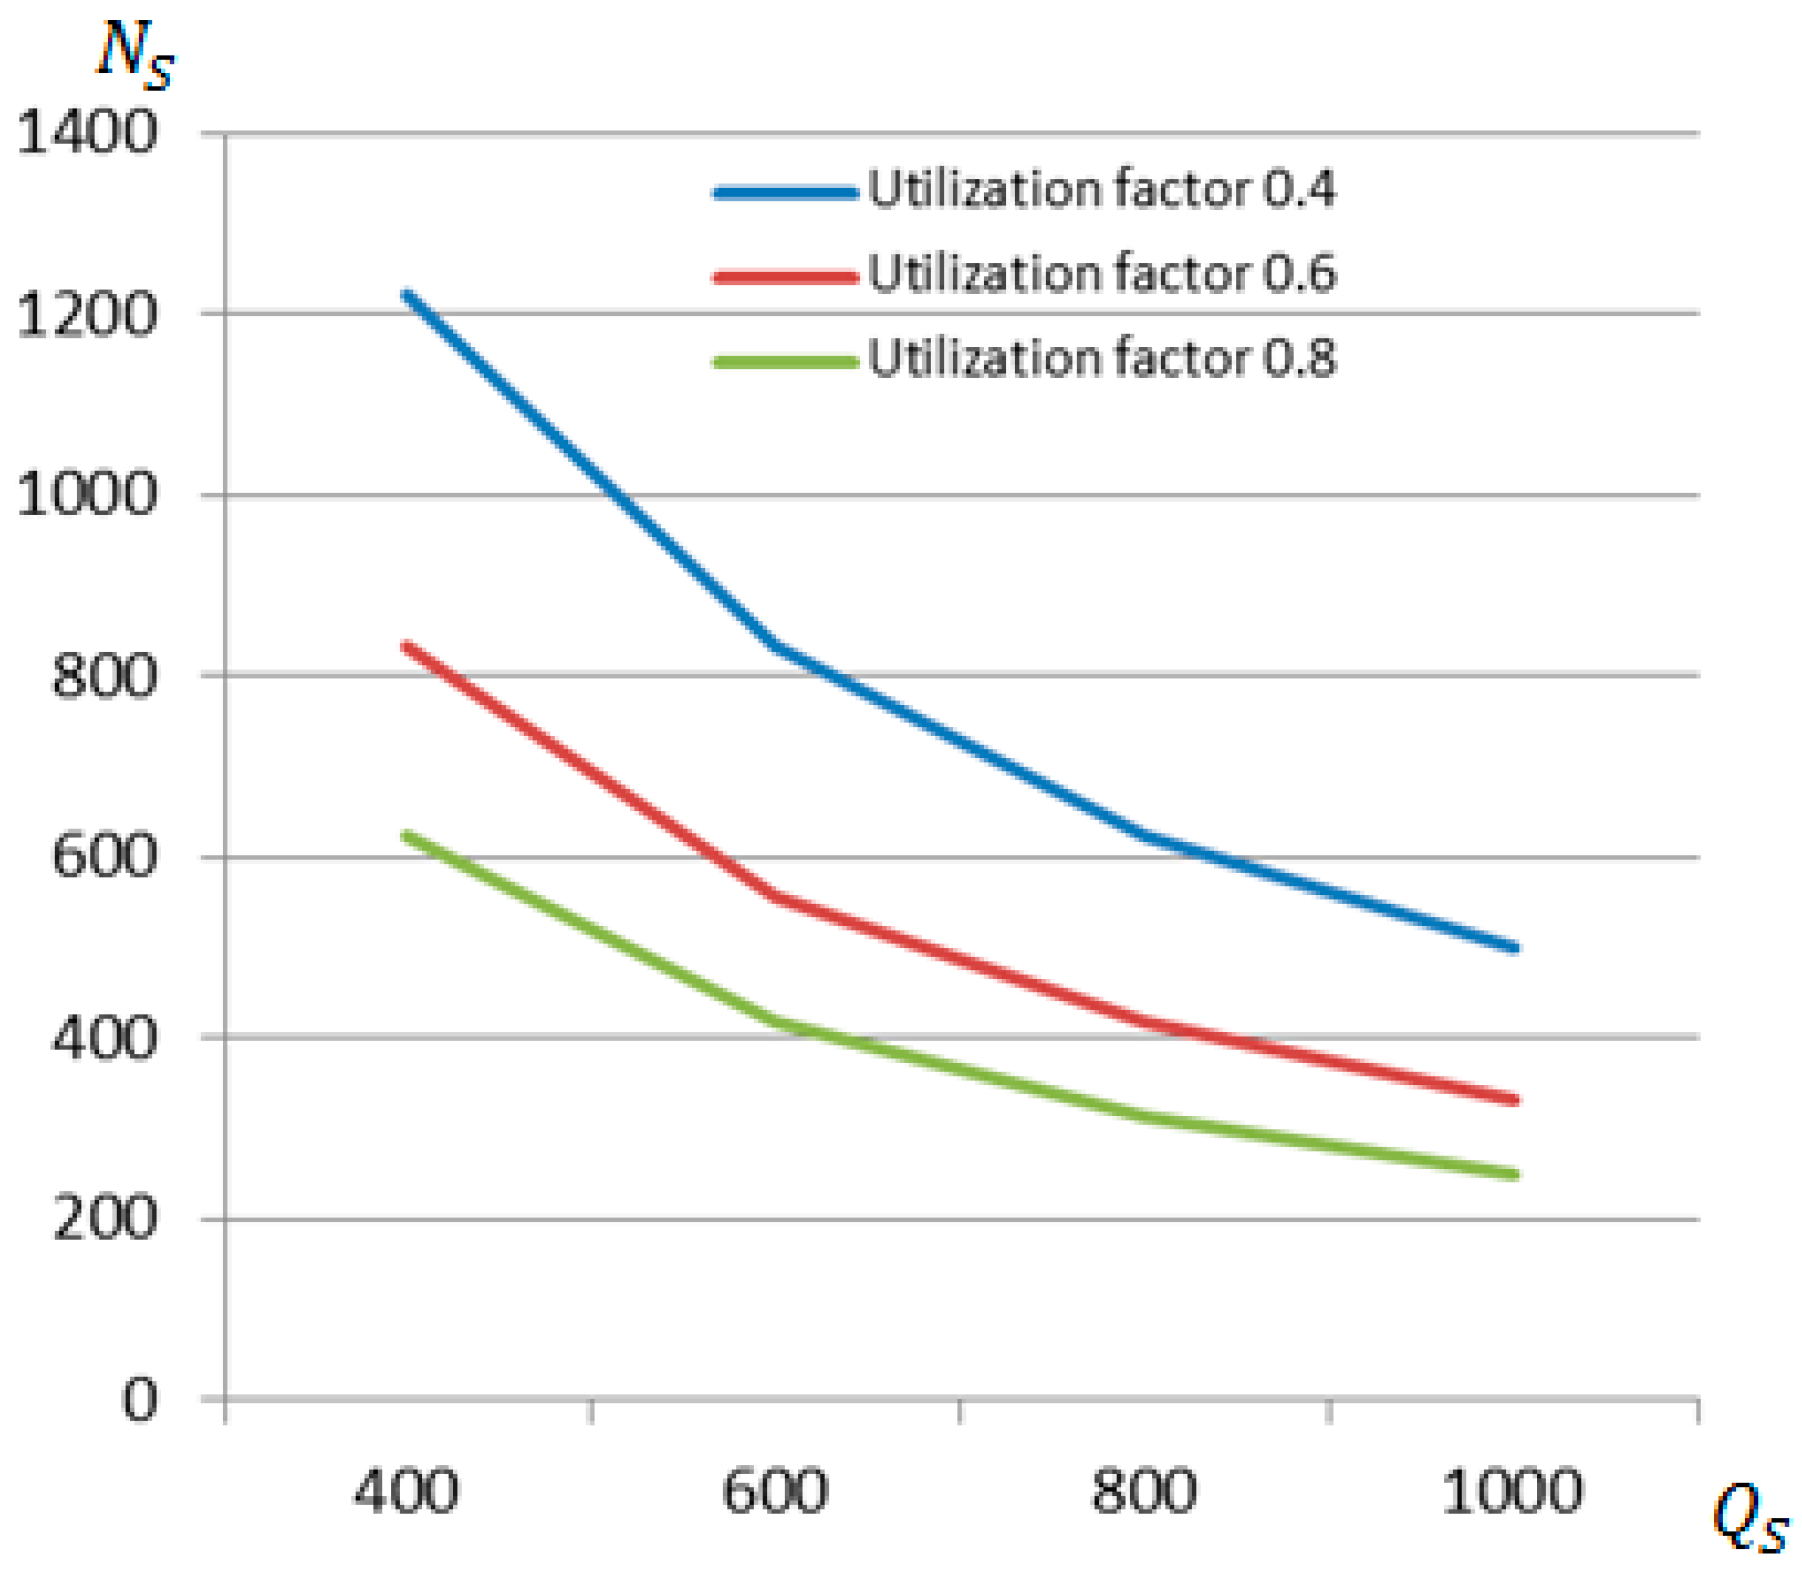
Assuming the optimal terminal capacity (about 200,000 TEU per year), the average ship that brings to and leaves the terminal during one call is about 700 TEU, which is typical for small and medium-sized ports, and assuming that the ship stays in the port for no longer than one day, it is appropriate to estimate the expected number of ships calling at the terminal per year (Figure 8).
The total number of ships that should enter the terminal per year, especially in small and medium-sized ports, is very important, because then it is possible to assess not only the total number of ships arriving at the port, but also to optimally use the port infrastructure for other cargo flows and ships.
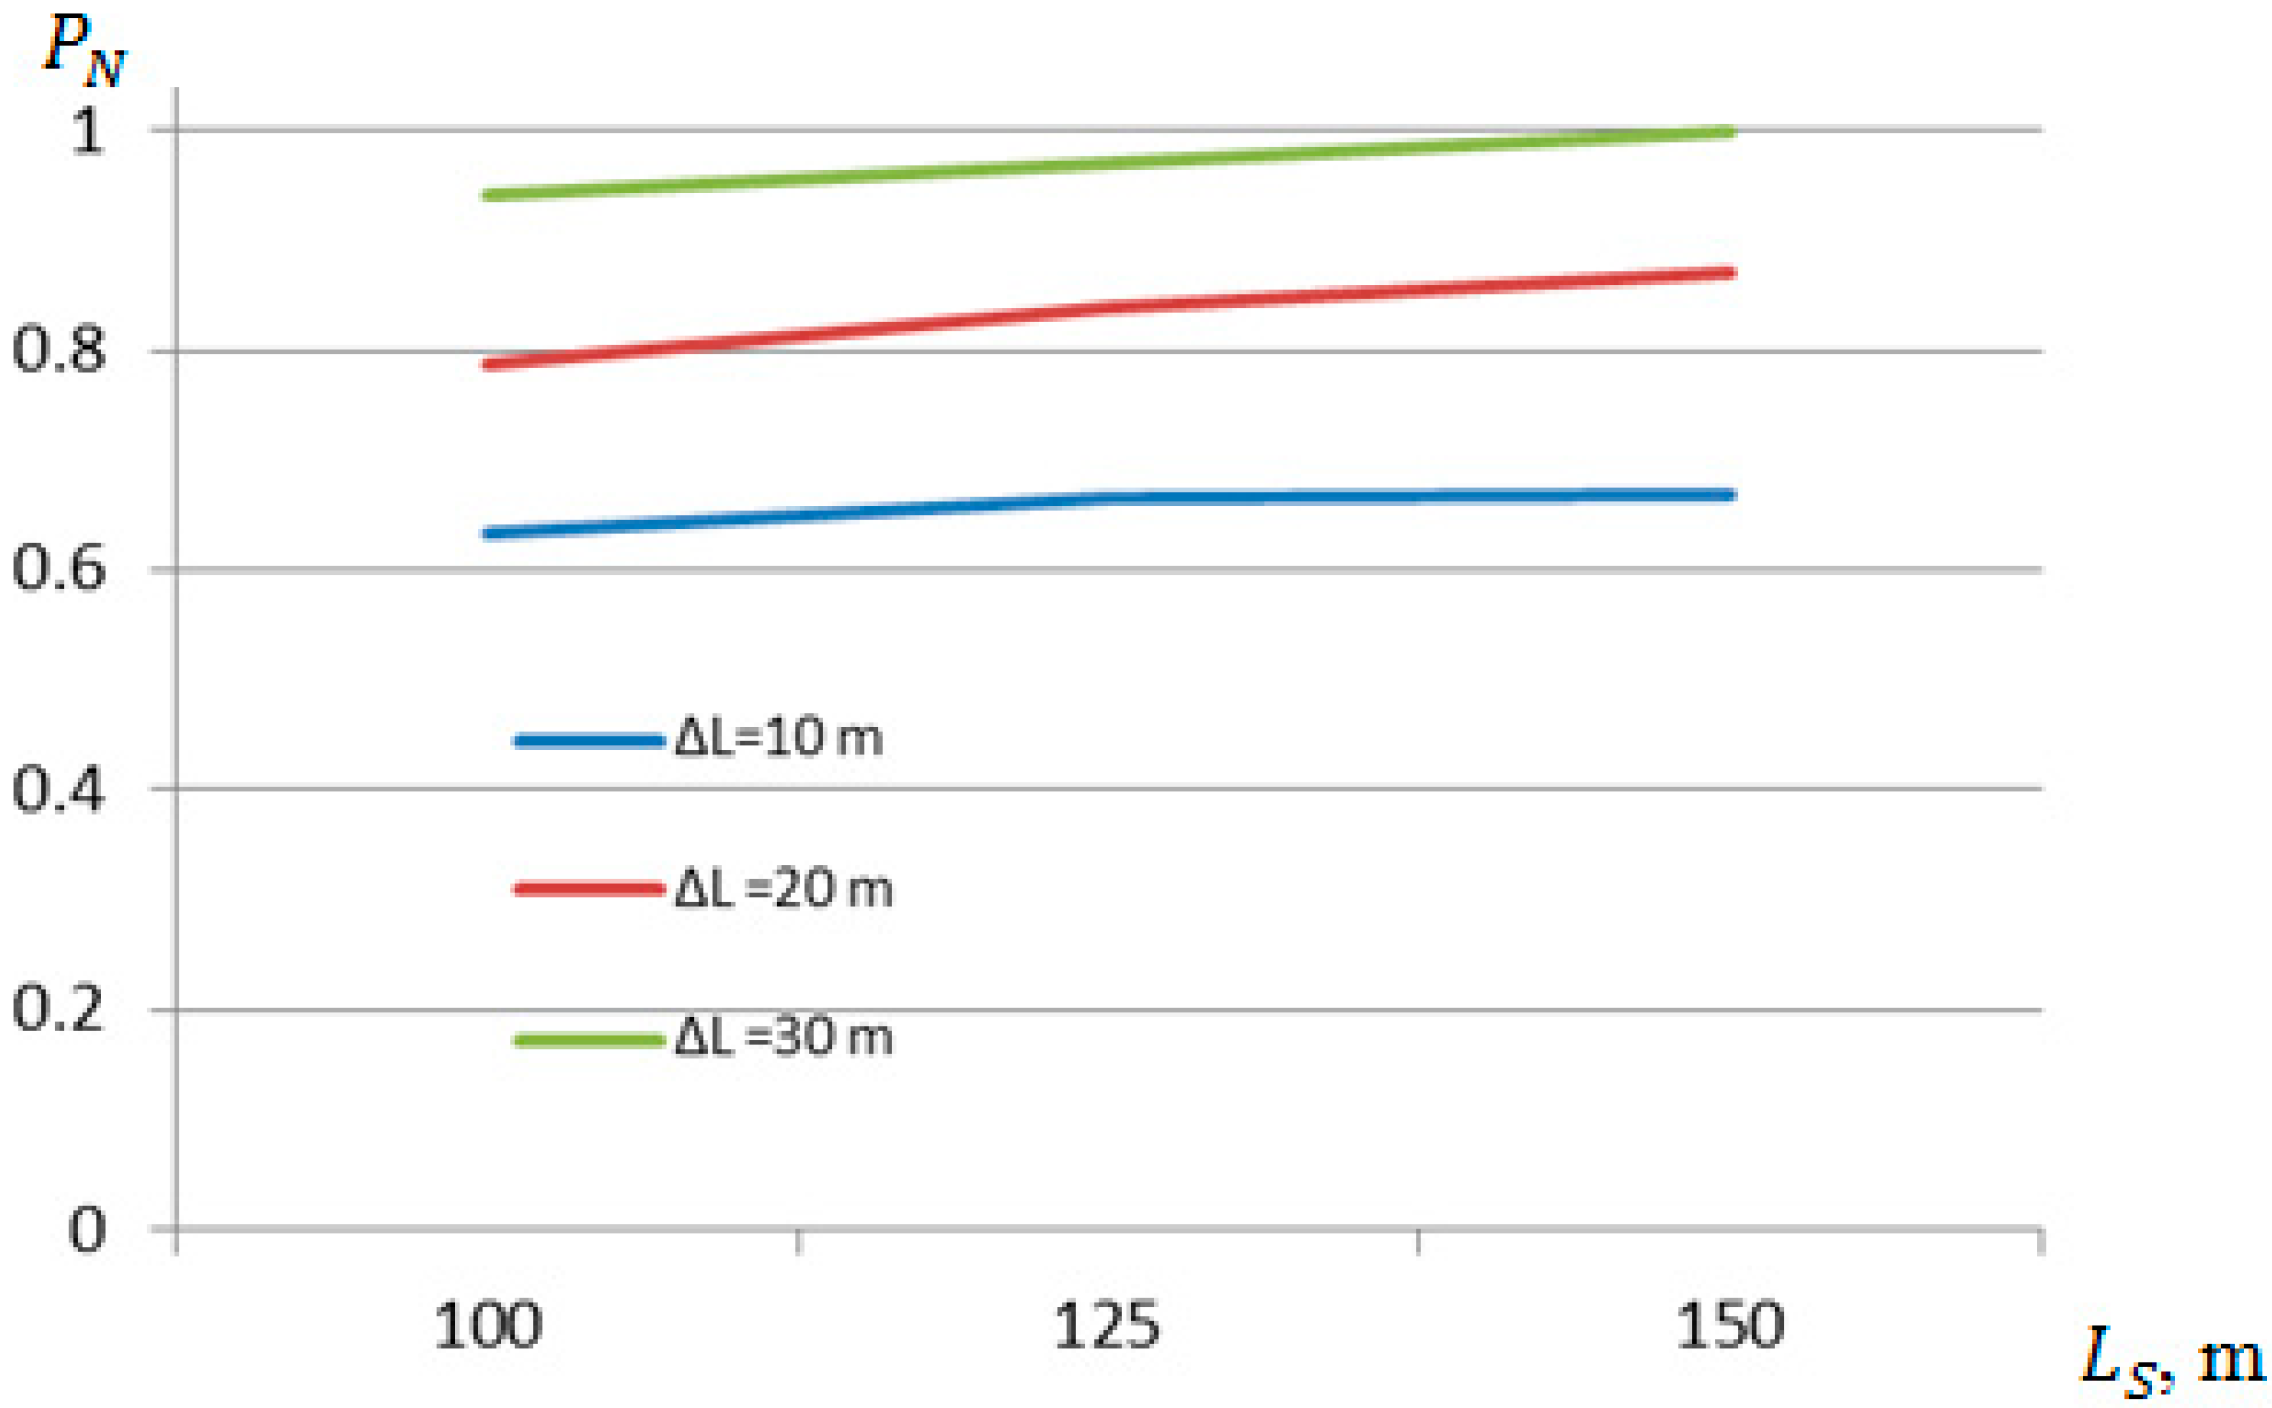
When assessing potential disruptions to ship arrivals and processing, the probability of using a berth for ships, depending on the length of arriving ships and the distance between them, is presented in Figure 9.
Assessing the probability of using quays is important for optimizing the port’s reception capabilities, avoiding downtime for mooring ships at quays, and improving port work planning.
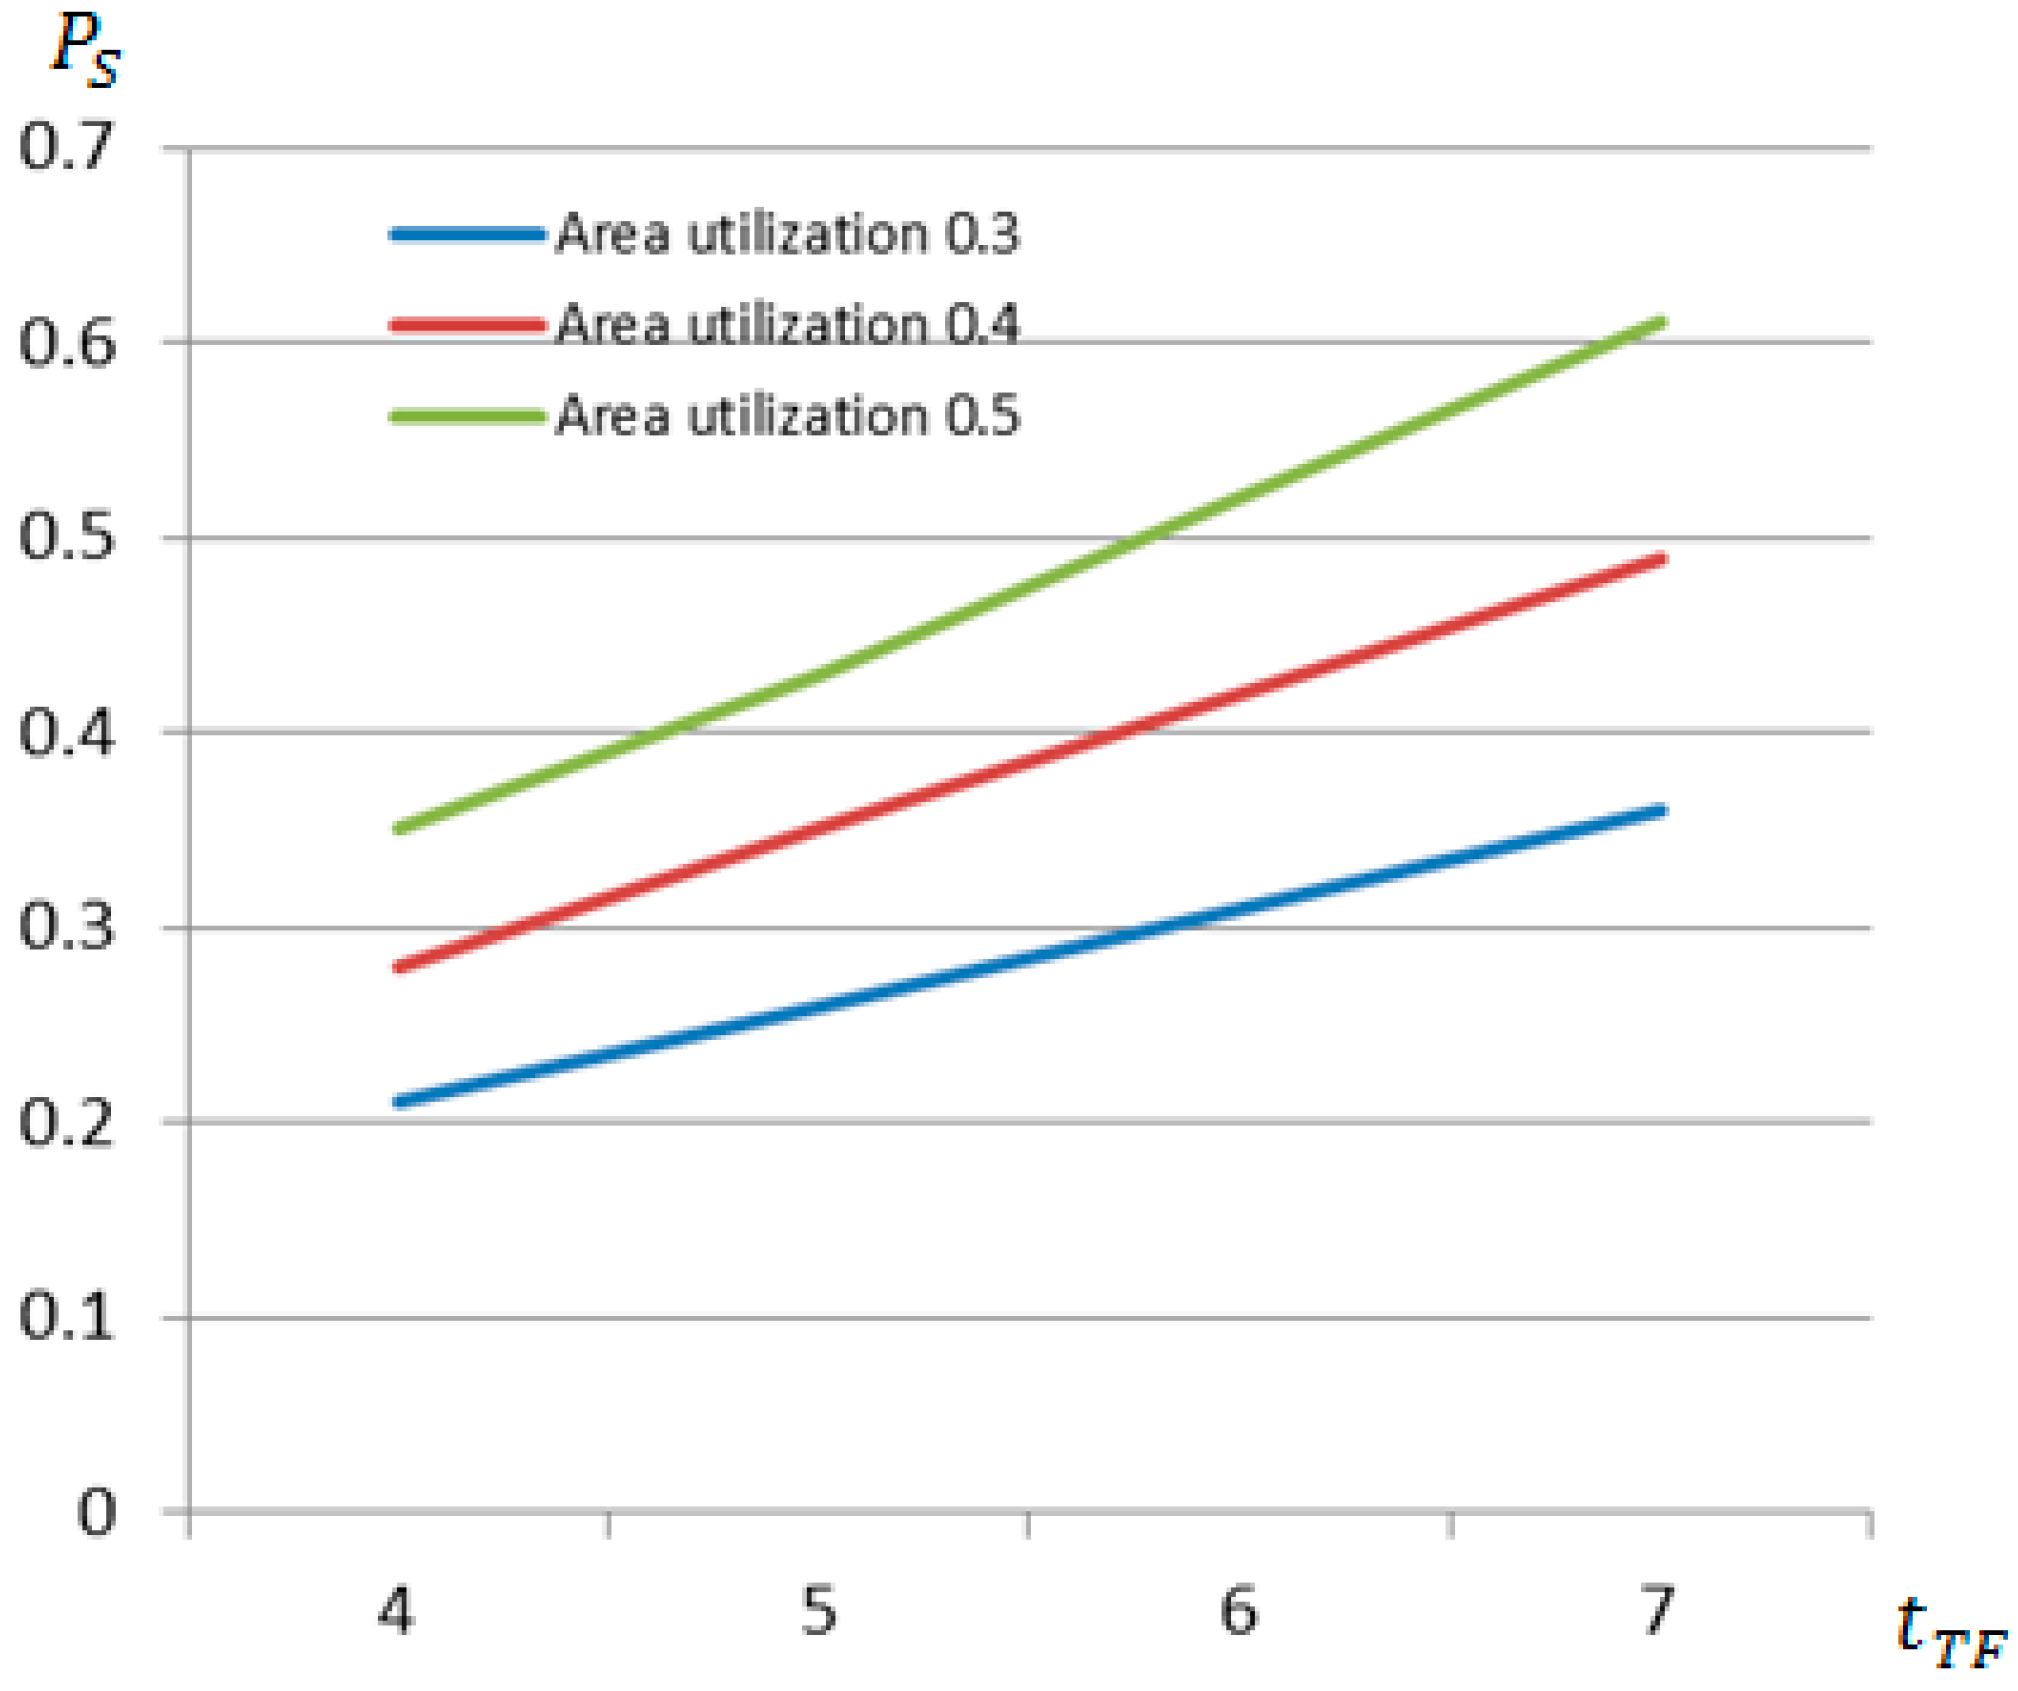
For the assessment of the probable use of the terminal area, it is assumed that the total terminal area is 6 ha, the actual terminal area used for loading containers is about 5 hectares (500,000 m2), the possible terminal area utilization factor for storing containers is from 0.3 to 0.5, and, also, the average cargo storage time at the terminal is from 4 to 7 days; from this, the theoretical probable utilization factor of the terminal area has been calculated. The assessment also takes into account the routes for the arrival and departure of cargo (containers) at the terminal, as well as the necessary additional technological zones, for example, workplaces for maneuvering loading equipment near the container storage areas and the maximum permissible cargo storage time at the terminal, which stands at 8 days (Figure 10).
Assessing the probability of terminal space utilization allows understanding terminal space utilization problems, which is important for optimizing terminal space utilization and implementing new technologies and work methods.
The following data was adopted for the probabilistic assessment of the terminal equipment utilization: the terminal equipment used in the terminal serving ships consists of two mobile cranes, and two STS cranes can be used; the actual average productivity of one mobile crane of the terminal is on average up to 15 movements per hour, and the actual average productivity of an STS crane is up to 30 movements per hour. The terminal equipment utilization factor in terms of time is from 0.7 up to 0.9. The maximum possible throughput of the terminal equipment is assumed: for an STS crane—about 35 movements per hour, and for a mobile crane—up to 18 movements per hour; the maximum possible utilization factor of the terminal equipment serving ships can be up to 0.95. Calculation results are presented in Figure 11.
Probabilistic assessment of terminal loading equipment utilization allows for identifying the weak points of loading equipment due to inaccuracies in work organization and searching for optimal solutions for loading equipment utilization.
For the assessment of the probability coefficient of the capacity of the land transport system connections of small and medium-sized ports, the actual annual capacity of the railway connecting the terminal with the national railway network up to 125,000 TEU and the actual utilization coefficient of the railway connecting the terminal with the national railway network from 0.70 to 0.90 were adopted [38,39]. The actual capacity of the road transport connecting the terminal with the national road network up to 125,000 TEU and the actual utilization coefficient of roads connecting the terminal with the national road network from 0.70 to 0.90 were adopted. The correlation coefficient of transport connections connecting the terminal with the national transport networks was adopted at about 0.98. At the same time, the maximum possible capacity of the railway connecting the terminal to the national railway network is up to 130,000 TEU, and the maximum possible utilization factor of the railway connecting the terminal to the national railway network is about 0.95. The maximum possible capacity of road transport connecting the terminal to the national road network is about 135,000 TEU, and the maximum possible utilization factor of roads connecting the terminal to the national road network is about 0.92. The correlation coefficient of transport links connecting the terminal to national transport networks is assumed to be about 0.98. The evaluation results are presented in Figure 12.
Probabilistic assessment of transport systems connecting the port and terminal with the country’s public transport system networks allows for identifying weak points in the interfaces between transport systems and the port and seeking optimal solutions, which is very important for small and medium-sized ports where opportunities for the development of shore infrastructure are often limited due to the city and residential areas located near the port.
Other possible probabilistic factors are mostly related to specialists working at the terminal and their qualifications. The data accepted for the assessment of other possible probabilistic factors are those that are important for the terminal’s operations. Terminals in most small and medium-sized ports operate 8 or 16 h a day, i.e., one or two shifts, and only some operate for 24 h a day; therefore, all possible working time options are accepted for the assessment. At the same time, it is necessary to assess the influence of specialists’ working hours and their restrictions on ship loading, since in small and medium-sized ports, specialists often have many additional functions and, at the same time, there are restrictions that affect ship processing at the terminal.
The assessment assumes that the actual influence of specialists on the ship processing process (weight) is from 0.70 to 0.90 and other actual restrictions that hinder ship loading processes, which account for up to one hour a day, and the weight coefficient of other actual restrictions are from 0.7 to 0.90. The correlation coefficient of actual restrictions on interrelated ship loading processes is assumed to be about 0.98. The theoretical (normative) number of working hours of specialists at the terminal is from 8 to 24 h per day (depending on the number of shifts), and the importance of the influence of specialists on ship processing operations at the terminal (weight coefficient) is assumed to be about 0.9 (ideal case). Other possible restrictions, i.e., various necessary ship inspections, for example, a sanitary inspection before loading a ship with animal products, which is necessary to obtain a sanitary certificate, and other possible inspections, can take up about 1 h. The weight coefficient of other possible restrictions is assumed to be about 0.95, and the correlation coefficient of other impacts on ship loading operations, in the presence of interrelated processes, is assumed to be about 0.99. The results of the probability coefficient of other possible factors, depending on the number of working hours (shifts) of the terminal, and the coefficients of the impact of interference, are presented in Figure 13.
A probabilistic assessment of other factors affecting the operations of small and medium-sized ports is important for identifying various factors other than those mentioned above in order to seek optimal solutions for port and terminal operations.
After analyzing the obtained expected terminal parameters, it is possible to plan an optimal terminal and, accordingly, perform a probabilistic assessment of ship mooring at the quays of small and medium-sized ports.
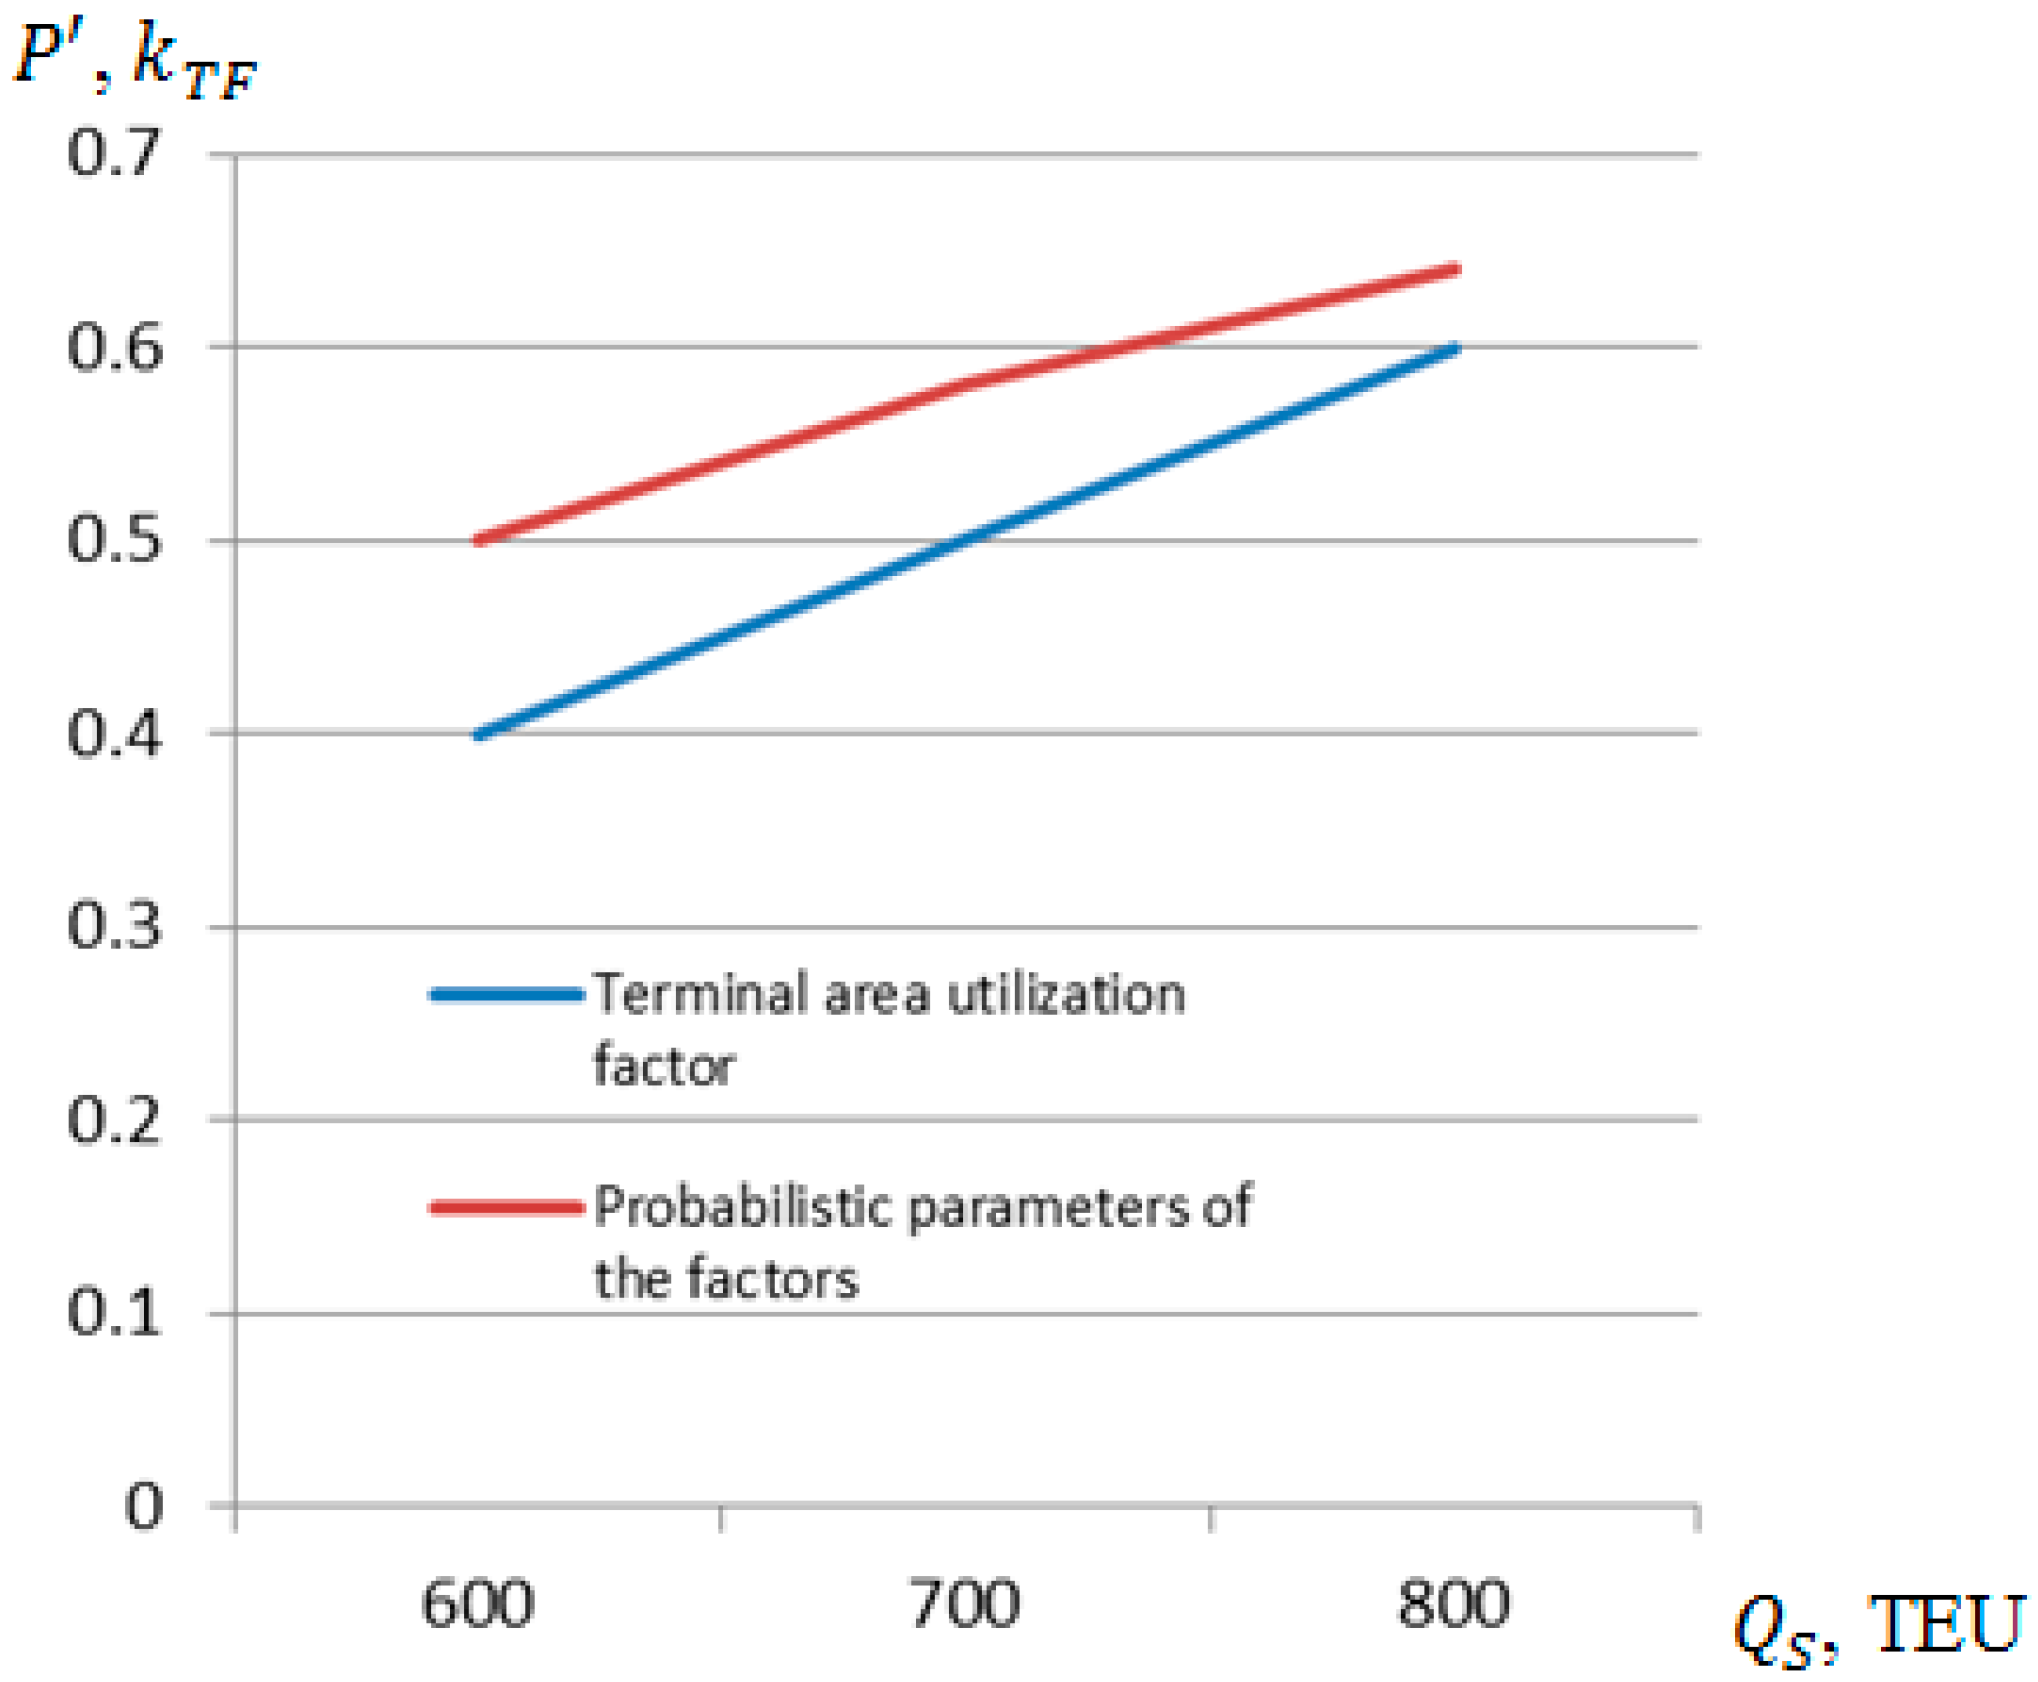
Based on the analysis of the probabilistic assessment of the terminal’s activities and ship mooring at the terminal quays, the following optimal terminal parameters were obtained: for terminal capacity, when the total terminal area is 6 ha, the container processing area is 5 ha, and the total annual terminal capacity should be up to 200,000 TEU when the average number of containers brought to and taken out of the terminal by one ship is from 600 to 800 TEU. In this case, the probability coefficient of ship utilization is about 0.8, the average container storage time at the terminal is about 6 days, and the terminal area utilization coefficient is from 0.4 to 0.6; thus, the expected terminal utilization coefficient should be from 0.5 to 0.65. For the analyzed case, the capacity utilization factor of land transport connections to the terminal should be about 0.8, and the probability coefficient of land transport connections should be about 0.66. The terminal should operate at least two shifts per day (special working hours are 15 h per day), then the terminal utilization factor would be about 0.8, and the total probability coefficient of the terminal activity would reach up to 0.58–0.62 (Figure 14), which is a good result for small and medium-sized ports or individual small terminals.
An overall probabilistic assessment of a port or terminal is very important when comparing small and medium-sized ports with each other, identifying problematic areas of ports and terminals, and seeking optimal solutions to improve port operations.
The identification of “weak” areas in the activities of small and medium-sized ports and terminals and the optimization of activities based on that identification not only improves the activities of small and medium-sized ports but also reduces the impact on the environment due to the possible shorter stay of ships in ports, carrying out loading operations, and more rational use of port equipment.
The presented methodology for the assessment of terminal activities and opportunities based on the principles of the probability theory and the probabilistic assessment of ships arriving and berthing at the terminal quays, given the forecasted cargo flow, can be applied to ports, especially small and medium-sized ones, or individual terminals, after adapting it to the conditions of a specific port or terminal.
The conducted research showed that the operational problems of small and medium-sized ports and individual terminals can be identified using the developed model, which is based on the principles of the probability theory and innovative solutions. The developed model can be successfully used to solve the identified problems and optimize and improve the operational results of small and medium-sized ports.

5. Discussions

The large variety of small and medium-sized ports provides a large number of possible terminal solutions; therefore, it is very important to use probabilistic methods to find optimal solutions. Small and medium-sized ports are important for specific cities and regions [3,13,14,40], but compared to large ports, they often have smaller development opportunities; therefore, it is very important to find optimal opportunities for their implementation and optimal use, which should be the direction of breakthrough scientific research. Individual small and medium-sized ports have limited infrastructure and superstructure parameters to receive and process modern ships [41,42], and this hinders the optimal use of such ports; therefore, a very important direction of scientific research is to harmonize the infrastructure and technological capabilities of modern ships and ports in order to maximize the use of the existing infrastructure and superstructure of small and medium-sized ports in receiving and processing modern ships (container, RoRo and Ro-Pax, and other modern ships).
Probabilistic assessment results allow for the identification of problem areas in small and medium-sized ports, and once identified, it is easier to find optimal solutions to the problem areas. The research results obtained in the case study are very important for the port or terminal itself, especially when comparing ports and terminals with similar parameters in order to effectively use the opportunities for good practice.
The problems of small and medium-sized ports, such as administration, an insufficient number of specialists and their qualifications, and other similar limitations in many countries, compared to large ports, are solved with much more difficulty, since often one specialist performs several functions. The identification and highlighting of problems allows us to search for optimal solutions by distributing duties and responsibilities between specialists to better understand what small and medium-sized ports need most in order to optimize and improve their activities. The functions studied and evaluated by the probabilistic methods in the article are very important directions for further research.
Training specialists for small and medium-sized ports, adapting to the specifics of such ports, and their employment is one of the challenges of small and medium-sized ports; therefore, this research direction is also important in order to optimally utilize the opportunities of specialists in developing small and medium-sized ports and applying modern technologies in them [43,44]. Various administrative and other restrictions in small and medium-sized ports are associated not only with the application of new technologies in such ports but also with the fact that, in individual cases, specialists, due to their small number, have to take on other functions, and, in individual cases, cannot concentrate on searching for and implementing new opportunities in such ports.
The research on the problems and “weak points” of small and medium-sized ports, supported by probabilistic assessments of specific factors and research on methods for solving specific port performance factors, is one of the most important challenges in the optimal use of small and medium-sized ports. Small and medium-sized ports are important for the economic development of many countries and regions, for reducing the environmental impact of cargo flows, and finally, for creating sustainable and modern small and medium-sized ports, and this should be the focus of future research.

6. Conclusions

Small and medium-sized ports are becoming increasingly important in passenger and cargo transportation processes; therefore, their research, with the aim of optimizing the activities of such ports, is very important.
A methodology for assessing the activities of small and medium-sized ports has been developed, applying the principles of the probability theory, allowing for a more accurate and clear assessment of individual factors of such ports’ activities and, at the same time, seeking possible common solutions or the improvement of individual factors of port activities. A methodology for assessing the activities of small and medium-sized ports has been developed, allowing for the identification of problematic areas of such ports’ activities and seeking their optimal solutions, i.e., the optimal use of port quays, optimal use of territories and other infrastructure, optimal use of small and medium-sized port loading equipment, and the safe reception of the largest possible ships into ports. The developed methodology, using the probability coefficients of factors, also allows for the assessment of aspects of the use of specific operational factors and search for their optimal use and, at the same time, improves the internal structures of ports and optimize management systems.
Optimization of the activities of small and medium-sized ports, supported by probabilistic assessments, not only improves the activities of such ports but also, by minimizing the presence of ships in the port and optimally using loading equipment, reduces the impact on the environment due to a possible reduction in energy (fuel) used.
Research has shown that the developed methodology for evaluating the performance of small and medium-sized ports can be applied not only to the evaluation and optimization purposes of small and medium-sized ports but can also be applied to the evaluation and optimization of individual terminal operations of other ports.

Author Contributions

Conceptualization, V.P. (Vytautas Paulauskas); methodology, V.P. (Vytautas Paulauskas), D.P. and V.P. (Vytas Paulauskas); software, V.P. (Vytautas Paulauskas) and D.P.; validation, V.P. (Vytautas Paulauskas) and V.P. (Vytas Paulauskas); formal analysis, V.P. (Vytautas Paulauskas) and D.P.; investigation, V.P. (Vytautas Paulauskas); resources, V.P. (Vytautas Paulauskas) and D.P.; data curation, D.P. and V.P. (Vytas Paulauskas); writing—original draft preparation, V.P. (Vytautas Paulauskas) and D.P.; writing—review and editing, D.P. and V.P. (Vytas Paulauskas); visualization, D.P.; supervision, V.P. (Vytautas Paulauskas); project administration, V.P. (Vytautas Paulauskas); funding acquisition, V.P. (Vytautas Paulauskas). All authors have read and agreed to the published version of the manuscript.

Funding

This research received no external funding.

Data Availability Statement

The original contributions presented in this study are included in the article. Further inquiries can be directed to the corresponding author.

Acknowledgments

This article is based on the research conducted by the Maritime Engineering Department of the Klaipeda University.

Conflicts of Interest

The authors declare no conflicts of interest.

References

  1. Pereira, M.T.; Rocha, N.; Silva, F.G.; Moreira, M.Â.L.; Altinkaya, Y.O.; Pereira, M.J. Process Optimization in Sea Ports: Integrating Sustainability and Efficiency Through a Novel Mathematical Model. J. Mar. Sci. Eng. 2025, 13, 119. [Google Scholar] [CrossRef]
  2. Danladi, C.; Tuck, S.; Tziogkidis, P.; Tang, L.; Okorie, C. Efficiency analysis and benchmarking of container ports operating in lower-middle-income countries: A DEA approach. J. Shipp. Trd. 2024, 9, 7. [Google Scholar] [CrossRef]
  3. Gerlitz, L.; Meyer, C. Small and Medium-Sized Ports in the TEN-T Network and Nexus of Europe’s Twin Transition: The Way towards Sustainable and Digital Port Service Ecosystems. Sustainability 2021, 13, 4386. [Google Scholar] [CrossRef]
  4. Karimah, I.D.; Yudhistira, M.H. Does small-scale port investment affect local economic activity? Evidence from small-port development in Indonesia. Econ. Transp. 2020, 23, 100–180. [Google Scholar] [CrossRef]
  5. Merk, O.; Notteboom, T. The Competitiveness of Global Port-Cities; OECD Publishing: Paris, France, 2014. [Google Scholar] [CrossRef]
  6. Krivokapic, R. Perspectives for the Development of Small Seaports, with Reference to the Adriatic Seaports. Transform. Bus. Econ. 2022, 21, 21–33. [Google Scholar]
  7. Park, J.S.; Seo, Y.-J. The impact of seaports on the regional economies in South Korea: Panel evidence from the augmented Solow model. Transp. Res. Part E Logist. Transp. Rev. 2016, 85, 107–119. [Google Scholar] [CrossRef]
  8. Paulauskas, V.; Filina-Dawidowicz, L.; Paulauskas, D. Ports Digitalization Level Evaluation. Sensors 2021, 21, 6134. [Google Scholar] [CrossRef] [PubMed]
  9. Knill, O. Probability Theory and Stochastic Processes with Applications; Overseas Press: New York, NY, USA, 2009; 382p. [Google Scholar]
  10. Cao, B.; Shahraki, A.A. Planning of Transportation Infrastructure Networks for Sustainable Development with Case Studies in Chabahar. Sustainability 2023, 15, 5154. [Google Scholar] [CrossRef]
  11. Notteboom, T.; Pallis, A.; Rodrigue, J.-P. Port Economics, Management and Policy; Routledge: New York, NY, USA, 2021; Available online: https://porteconomicsmanagement.org (accessed on 10 August 2025).
  12. Ettorre, B.; Daldanise, G.; Giovene di Girasole, E.; Clemente, M. Co-Planning Port–City 2030: The InterACT Approach as a Booster for Port–City Sustainable Development. Sustainability 2023, 15, 15641. [Google Scholar] [CrossRef]
  13. Gerlitz, L.; Meyer, C.; Henesey, L. Sourcing Sustainability Transition in Small and Medium-Sized Ports of the Baltic Sea Region: A Case of Sustainable Futuring with Living Labs. Sustainability 2024, 16, 4667. [Google Scholar] [CrossRef]
  14. Meyer, C. Integration of Baltic Small and Medium-Sized Ports in Regional Innovation Strategies on Smart Specialisation (RIS3). J. Open Innov. Technol. Mark. Complex. 2021, 7, 184. [Google Scholar] [CrossRef]
  15. Kawasaki, T.; Hanaoka, S.; Saito, Y.; Hoshi Tagawa, H. Port choice problem in a linear city: Application to Manila and Batangas ports in the Philippines. Marit. Transp. Res. 2021, 2, 100010. [Google Scholar] [CrossRef]
  16. Wagner, N.; Kotowska, I.; Pluciński, M. The Impact of Improving the Quality of the Port’s Infrastructure on the Shippers’ Decisions. Sustainability 2022, 14, 6255. [Google Scholar] [CrossRef]
  17. Tijan, E.; Jović, M.; Žgaljić, D.; Aksentijević, S. Factors Affecting Container Seaport Competitiveness: Case Study on Port of Rijeka. J. Mar. Sci. Eng. 2022, 10, 1346. [Google Scholar] [CrossRef]
  18. Wu, B.; Yip, T.L.; Yan, X.; Guedes Soares, C. Review of Techniques and Challenges of Human and Organizational Factors Analysis in Maritime Transportation. Reliab. Eng. Syst. Saf. 2022, 219, 108249. [Google Scholar] [CrossRef]
  19. Weerasinghe, B.A.; Perera, H.N.; Bai, X. Optimizing container terminal operations: A systematic review of operations research applications. Marit. Econ. Logist. 2023, 26, 307–341. [Google Scholar] [CrossRef]
  20. Chu, L.; Zhang, J.; Chen, X.; Yu, Q. Optimization of Integrated Tugboat–Berth–Quay Crane Scheduling in Container Ports Considering Uncertainty in Vessel Arrival Times and Berthing Preferences. J. Mar. Sci. Eng. 2024, 12, 1541. [Google Scholar] [CrossRef]
  21. Meyer, C.; Gerlitz, L.; Henesey, L. Cross-Border Capacity-Building for Port Ecosystems in Small and Medium-Sized Baltic Ports. Baltic J. Eur. Stud. 2021, 11, 113–132. [Google Scholar] [CrossRef]
  22. Argyriou, I.; Nisiforou, O.; Tsoutsos, T. Setting Sail for a Sustainable Growth in Small/Medium Ports. Sustainability 2025, 17, 3330. [Google Scholar] [CrossRef]
  23. Kong, Y.; Liu, J. Sustainable Port Cities with Coupling Coordination and Environmental Efficiency. Ocean. Coast. Manag. 2021, 205, 105534. [Google Scholar] [CrossRef]
  24. Bottasso, A.; Conti, M.; Ferrari, C.; Tei, A. Ports and regional development: A spatial analysis on a panel of European regions. Transp. Res. A Policy Pract. 2014, 65, 44–55. [Google Scholar] [CrossRef]
  25. Li, T.; Dong, Q.; Sun, X. Integrated Scheduling of Handling Equipment in Automated Container Terminal Considering Quay Crane Faults. Systems 2024, 12, 450. [Google Scholar] [CrossRef]
  26. Zheng, S.; Sha, J.; Wang, A. An improved storage-space selection model and algorithm for outbound shipping containers: Considering the synchronous operation of multiple gantry cranes in port terminals worldwide. J. Coast. Resour. 2019, 35, 1120–1130. [Google Scholar]
  27. Tierney, K.; Pacino, D.; Jensen, R.M. On the complexity of container stowage planning problems. Discret. Appl. Math. 2014, 169, 225–230. [Google Scholar] [CrossRef]
  28. Kaliszewski, A. Fifth and Sixth Generation Ports (5gp, 6gp)—Evolution of Economic and Social Roles of Ports. Stud. Mater. Inst. Marit. Transp. Trade 2017, 14, 93–123. [Google Scholar] [CrossRef]
  29. Bronshtein, I.N.; Semendyayev, K.A.; Musiol, G.; Muehlig, H. Probability Theory and Mathematical Statistics. In Handbook of Mathematics; Springer: Berlin/Heidelberg, Germany, 2004. [Google Scholar] [CrossRef]
  30. Chauhan, S.; Patil, C.; Sinha, M.; Halder, A. Fuzzy state noise-driven Kalman filter for sensor fusion. Proc. Inst. Mech. Eng. Part G. J. Aerosp. Eng. 2009, 223, 1091–1097. [Google Scholar] [CrossRef]
  31. Paulauskas, V.; Paulauskas, D.; Simutis, M. Estimation of Tug Pulling Power (Bollard Pull) and Number of Tugs Require During Ship Mooring Operations. J. Mar. Sci. Eng. 2024, 12, 1959. [Google Scholar] [CrossRef]
  32. Jin, H.; Peng, S. Optimal unbiased estimation for maximal distribution. Am. Inst. Math. Sci. 2021, 6, 189–198. [Google Scholar] [CrossRef]
  33. Zheng, H.; Wang, Z.; Liu, H. The Integrated Rescheduling Problem of Berth Allocation and Quay Crane Assignment with Uncertainty. Processes 2023, 11, 522. [Google Scholar] [CrossRef]
  34. Luo, M.; Liu, L.; Gao, F. Post-entry container port capacity expansion. Transp. Res. Part B Methodol. 2012, 46, 120–138. [Google Scholar] [CrossRef]
  35. Jurjević, M.; Hess, S. The operational planning model of transshipment processes in the port. Promet-Trafic Transp. 2016, 28, 81–89. [Google Scholar] [CrossRef]
  36. A Systematic Analysis of Port Capacity Literature: Trends and Future Research Avenues. Available online: https://www.researchgate.net/publication/350754695_A_systematic_Analysis_of_Port_Capacity_Literature_Trends_and_Future_Research_Avenues (accessed on 24 August 2025).
  37. Han, D.; Cheng, X.; Chen, H.; Xiao, C.; Wen, Y.; Sui, Z. Simulation Modeling for Ships Entering and Leaving Port in Qiongzhou Strait Waters: A Multi-Agent Information Interaction Method. J. Mar. Sci. Eng. 2024, 12, 1560. [Google Scholar] [CrossRef]
  38. Burdett, R.L. Optimisation models for expanding a railway′s theoretical capacity. Eur. J. Oper. Res. 2016, 251, 783–797. [Google Scholar] [CrossRef]
  39. Jensen, L.W.; Schmidt, M.; Nielsen, O.A. Determination of infrastructure capacity in railway networks without the need for a fixed timetable. Transp. Res. Part C Emerg. Technol. 2020, 119, 102751. [Google Scholar] [CrossRef]
  40. Ding, Z.-Y.; Jo, G.-S.; Wang, Y.; Yeo, G.-T. The relative efficiency of container terminals in small and me-dium—Sized ports in China. Asian J. Shipp. Logist. 2015, 31, 231–251. [Google Scholar] [CrossRef]
  41. Rusu, M. Smart specialization a possible solution to the new global challenges. Procedia Econ. Financ. 2013, 6, 128–136. [Google Scholar] [CrossRef]
  42. New Technologies in Small and Medium-Sized Ports: Its Impacts on the Future of Work. Available online: https://www.researchgate.net/publication/387645114_New_Technologies_in_Small_and_Medium-sized_Ports_Its_Impacts_on_the_Future_of_Work (accessed on 24 August 2025).
  43. Chowdhury, P.; Paul Sanjoy, K. Applications of MCDM methods in research on corporate sustainability: A systematic literature review. Manag. Environ. Qual. Int. J. 2020, 31, 385–405. [Google Scholar] [CrossRef]
  44. Bottasso, A.; Conti, M.; Ferrari, C.; Merk, O.; Tei, A. The impact of port throughput on local employment: Evidence from a panel of European regions. Transp. Policy 2013, 27, 32–38. [Google Scholar] [CrossRef]
Figure 1. Two STS cranes used for container loading.
Jmse 13 01833 g001
Figure 2. Container loading using one STS crane and one or two mobile cranes.
Jmse 13 01833 g002
Figure 3. The algorithm for the research methodology.
Jmse 13 01833 g003
Figure 4. The terminal’s expected capacity to handle the number of containers per year, depending on the equipment used and the number of shifts.
Jmse 13 01833 g004
Figure 5. The terminal’s expected annual container throughput capacity, depending on the terminal’s load factor and the vertical loading level of containers.
Jmse 13 01833 g005
Figure 6. Container ship loading time at the terminal, depending on the number of containers being handled and the throughput of one average loading unit.
Jmse 13 01833 g006
Figure 7. Average time of ship’s stay in port depending on the ship’s loading time and the type and number of cranes used, obtained by calculation (line) and experiment: circles—2 STS cranes; triangles—1 STS crane and 1 mobile crane; and quadrilateral—2 mobile cranes.
Jmse 13 01833 g007
Figure 8. Expected number of ships at the terminal, processing about 200,000 TEU/year, depending on the vessel’s container capacity utilization factor.
Jmse 13 01833 g008
Figure 9. Probability coefficient use of quays for ships with a length of 100 m to 150 m and a spacing between ships of 10 to 30 m.
Jmse 13 01833 g009
Figure 10. Probability of terminal space utilization depending on the actual time containers are stored at the terminal and the terminal space utilization factor for containers.
Jmse 13 01833 g010
Figure 11. Probability utilization rate of terminal equipment depending on equipment type and utilization rate.
Jmse 13 01833 g011
Figure 12. Probability coefficient of land transport systems depending on terminal capacity and transport system utilization coefficients.
Jmse 13 01833 g012
Figure 13. Results of the probability coefficient of other possible factors depending on the number of terminal operating hours (shifts) and interference impact coefficients.
Jmse 13 01833 g013
Figure 14. Probability of terminal activity (use of quays for ships, terminal equipment, land transport systems, and other possible factors) summed up by the average number of containers delivered by ships.
Jmse 13 01833 g014
Disclaimer/Publisher’s Note: The statements, opinions and data contained in all publications are solely those of the individual author(s) and contributor(s) and not of MDPI and/or the editor(s). MDPI and/or the editor(s) disclaim responsibility for any injury to people or property resulting from any ideas, methods, instructions or products referred to in the content.