Article

Break-Out Resistance of Offshore Pipelines Buried in Inclined Sandy Seabed

1
College of Civil Engineering, Fuzhou University, No.2 Xueyuan Rd., Fuzhou 350116, China
2
Center for Hypergravity Experimental and Interdisciplinary Research, College of Civil Engineering and Architecture, Zhejiang University, 866 Yuhangtang Rd., Hangzhou 310058, China
*
Author to whom correspondence should be addressed.
J. Mar. Sci. Eng. 2025, 13(9), 1669; https://doi.org/10.3390/jmse13091669 (registering DOI)
Submission received: 4 August 2025 / Revised: 25 August 2025 / Accepted: 27 August 2025 / Published: 30 August 2025
(This article belongs to the Section Coastal Engineering)

Abstract

Submarine pipelines are highly susceptible to lateral buckling failure under service conditions of high temperature and pressure. While existing bearing capacity evaluation methods mainly focus on flat seabeds, research on the ultimate bearing capacity of pipelines buried in sloping seabeds is limited. This study applies the FELA method to analyze the ultimate bearing capacity of pipelines buried in inclined sandy seabeds under various loading directions. The results reveal that in sloping seabeds, the minimum ultimate bearing capacity (Pu,b) does not occur in the vertical direction, but rather deviates toward the outward normal direction of the seabed surface, moving toward the foot of the slope. The Pu,b is only 57% of the uplift bearing capacity in the extreme case. A predictive model was proposed to accurately determine the direction of Pu,b. The results also indicated that increasing the seabed slope angle leads to a significant reduction of bearing capacity, while increases in the internal friction angle of the seabed and the pipeline–soil interface friction angle enhance the bearing capacity. Moreover, the design code of DNV (2017) was identified as unsafe due to its omission of seabed inclination effects, and the Pu,b is only 75% of the best estimate of DNV (2017) in the extreme case. A reduction factor model was developed to mitigate this gap, offering a more reliable framework for evaluating the bearing capacity of pipelines.

1. Introduction

Pipelines serve as the primary mode of transportation for offshore oil and gas resources, offering an efficient, cost-effective, and reliable means of delivering hydrocarbons from reservoirs to floating production storage and offloading units (FPSOs) or onshore terminals. Often referred to as the “lifelines” of offshore oil and gas production systems, pipelines play a critical role in ensuring continuous operations. During service life, pipelines are subjected to high-temperature and high-pressure conditions, which can induce significant lateral buckling. Such deformations may result in the pipelines breaking through the surrounding soil, deviating from their intended alignment, or even rupturing. These failures can lead to severe economic losses and environmental damage. To mitigate these risks, offshore pipelines are typically buried within the seabed to provide adequate lateral restraint. A precise understanding of pipe–soil interaction and an accurate evaluation of the ultimate bearing capacity (or breakout resistance) are essential to offshore pipelines to ensure long-term safety and reliability.
The bearing capacity of pipelines embedded in seabeds, particularly in the upward direction, where constraints are considered to be minimal, has attracted a long history of research interest. Various seabed characteristics, including soil friction angle, dilation angle, relative density, and pipeline burial depth, have been explored to better understand the failure mechanism. Trautmann et al. [1] introduced the widely adopted vertical slip model, in which a vertical slip surface through the seabed surface is assumed. However, subsequent research identified limitations in this model. Centrifuge model tests conducted by White et al. [2,3]. demonstrated that failure planes are inclined at approximately the dilation angle (ψ) relative to the vertical. Specifically, Trautmann et al. [1] may overestimate the bearing capacity due to the dilatancy of ideal frictional materials, which do not conform to the associated flow rule [4,5,6,7]. Based on the above findings, an inclined slip model that incorporates factors such as dilation angle, unit weight, and relative density was developed, resulting in more accurate predictions of uplift resistance for pipelines on flat seabeds. Zhuang et al. [8] further refined the inclined slip model by incorporating the slip surface initiation point, which is influenced by pipe roughness. Research findings also indicate that the bearing capacity ceases to increase when the pipeline reaches a critical burial depth, and the failure mode transitions to a localized flow-around mechanism. However, the critical burial depth varies greatly [9,10,11]. Mukherjee and Sivakumar [12] examined the behavior of horizontal anchor foundations buried in sand under the influence of uplift and lateral loads, and a failure envelope was proposed for the horizontal anchor foundation subjected to oblique loads. Yang et al. [13] investigated the lateral pipe–soil interaction in an inclined seabed, and the effects of burial depth ratio, interface roughness, and slope angle on soil resistances are also discussed.
Although significant progress has been made in previous research, two key discrepancies in the research remain. Firstly, pipelines are inevitably installed in inclined seabeds [14,15,16]; slope inclination has been shown to significantly reduce the uplift resistance of shallow foundations in earlier studies like those of Kumar [17] and Banza-Zurita et al. [18]; and research on the bearing capacity of pipelines buried in sloping seabeds is still limited and requires further exploration. Secondly, existing studies typically assume that pipeline bearing capacity is assessed in the vertical upward or horizontal direction. However, on sloping seabeds, these directions do not correspond to the minimum bearing capacity. Identifying and evaluating the minimum bearing capacity of pipelines on inclined seabeds requires further investigation.
Addressing these gaps is critical for ensuring the safety and reliability of offshore pipelines, the finite element limit analysis (FELA) of pipeline–soil interaction in inclined sandy seabeds under various loading directions was conducted using Optum G2. In the simulations, the seabeds soil was modeled as ideal rigid plastic material governed by the Mohr–Coulomb criterion, and the numerical model was validated against published studies. By applying loads in multiple directions, the direction of minimum bearing capacity was identified, and the underlying failure mechanisms were clarified. Key factors influencing ultimate bearing capacity, including seabed friction angle, inclination angle, roughness of pipe surface, and embedment depth, were systematically analyzed. Furthermore, safety concerns associated with the DNV [19] guidelines are revealed, and a reduction factor model for the bearing capacity tailored to inclined seabeds is proposed. These findings offer a valuable reference for assessing pipeline ultimate breakout resistance.

2. Methodology

FELA is widely used for its efficiency and precision in analyzing ultimate bearing capacity by offering strict upper- and lower-bound solutions [7,20,21,22]. The FELA method can be summarized as discretizing the accurate plasticity-based Lower bounds problem domain into triangular elements and solving two independent Second-Order Cone Programming (SOCP) problems; detailed methodologies are available in Krabbenhøft et al. [23], and Makrodimopoulos and Martin [24,25]. Martin and White [20] successfully analyzed the bearing capacity of a rigid pipe embedded in undrained clay using FELA, considering the effects of pipeline burial depth, strength distribution, and pipe–soil interface parameters. Extensive applications of FELA to ultimate bearing capacity problems in sandy foundations have been documented [7,26,27,28]. Although it has been observed that FELA slightly overestimates the ultimate bearing capacity of granular materials due to the assumption of the associated flow rule, which disregards the dilatancy behavior of granular materials [5,7], the associated flow rule assumption was still adopted in this study to enhance computational efficiency and reduce resource consumption. Despite the potential overestimation, the primary conclusions of the study remain unaffected, as demonstrated in subsequent analyses. When considering dilatancy, a conversion method may be employed to adjust the parameters of materials that follow the associated flow rule to align with those that follow the non-associated flow rule [27,29].

2.1. Finite Element Limit Analysis

The limit analysis was employed by commercial software OptumG2 (2021 2.2.21) in this study to ensure generality and repeatability. Widely applied in ultimate bearing capacity research, OptumG2 is recognized for its computational efficiency and accuracy [23,28]. This software features adaptive mesh refinement, which iteratively enhances precision by adjusting the mesh based on prior results. All simulations were conducted using command-line control mode to solve upper- and lower-bound solutions.

2.2. Numerical Details

The object investigated in this paper is a plane-strain pipeline section that is fully buried in an inclined sandy seabed. The model configuration and the notations are illustrated in Figure 1. The pipe, characterized by a diameter, D, is positioned at the horizontal center of the foundation. The pipe embedment depth, w, is defined as the vertical distance from the seabed surface to the pipe bottom. Trial calculations confirmed that, when the foundation length was set to 50 D and the central depth was maintained at 20 D, the boundary effect could be ignored. This is further validated by the subsequent calculations in this paper. Due to space limitations, these results are not presented here. An inclination angle, β, was applied to the seabed surface relative to the horizontal plane. Fixed bottom conditions of the seabed were assumed, and the left and right boundaries were fixed in the x direction and free in the y direction, while the seabed surface was treated as a free boundary. To determine the ultimate breakout resistance of the pipe in various displacement directions for each working condition and to generate a smoother yield envelope, a multiplier load, directed at 2° intervals in all possible displacement directions, is applied at the center of the pipe. Both the upper bound (UB) and lower bound (LB) solutions were computed; the final bearing capacity is defined as the average of the UB and LB solutions. The initial mesh element was set to 1000, with 5 strain-based adaptive iterations. After the adaptation, the number of mesh elements increases to 5000.
The parameters employed in this study are summarized in Table 1. The seabed was modeled as cohesionless soil with a constant submerged unit weight (γ’) of 10 kN/m3, following the Mohr–Coulomb failure criterion with an associated flow rule. Only the friction angle was considered in order to cover a wider range, and the internal friction angle ranges from 24° to 44°, at an interval of 4°. Pipelines are inevitably buried in slopes [30,31]. Continental shelf slopes typically range from 2° to 5°, whereas they can exceed 20° in extreme cases [14,15,16]. Seabed slopes are modeled at intervals of 5°, ranging from 0° to 20°, to ensure the simulations encompass realistic and extreme scenarios.
In shallow seas, pipes are commonly buried to depths of 2.0 D to 3.0 D for protection. Embedment depths in this study range from 1.5 D to 8.0 D, at an interval of 0.5 D, given that deeper embedment depths have been achievable in recent years, with advancing construction technologies. The pipe is modeled as a rigid body with a unit weight of 0 kN/m3. Pipes are coated with epoxy resin for corrosion protection or with concrete for added weight [20]. Epoxy-coated and concrete-coated pipes are modeled as fully rough, with interface friction equal to the friction angle of soil. To cover a wider range, both extremes—smooth and fully rough conditions—are simulated [8,21,28]. The voids beneath the pipe after trenching may prevent it from developing suctions [20,32,33]. Many studies, including DNV [19] guidelines, assume no tension at the pipe–soil interface [27,34]. This study adopts the same assumption, confirmed by trial calculations showing negligible impact on pipe uplift capacity in sandy seabeds.
The V-H yield envelope is widely utilized to analyze the ultimate bearing capacity of pipelines in different displacement directions [20,22,34]. In this study, specifically, the magnitude of the multiplier load, along with the corresponding pipe displacement angle, is plotted in a polar coordinate system. This approach provides a straightforward visualization of the ultimate bearing capacity under various loading directions. For simplicity, the term “yield envelope” is retained to describe the bearing capacity of polar representation.

2.3. Model Verification

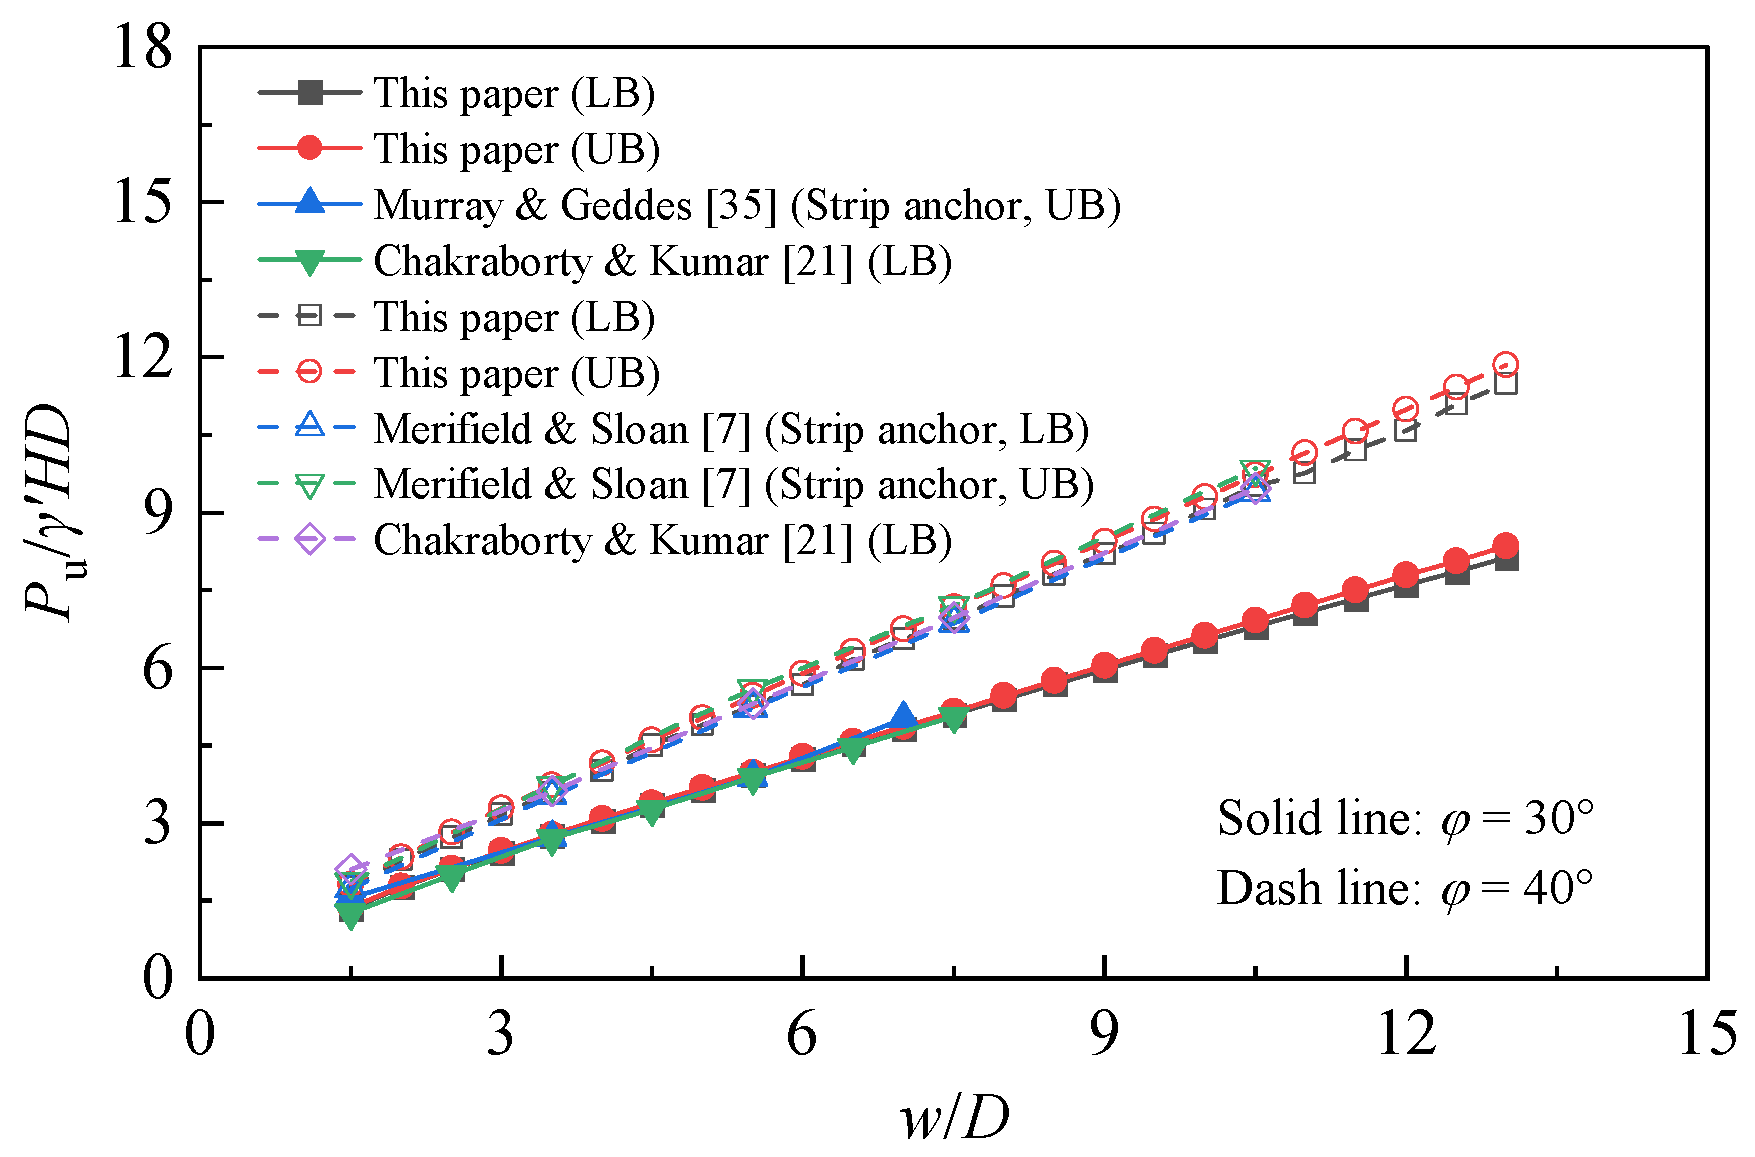
To validate the methodology, the uplift resistance of pipes on flat seabeds with friction angles of 30° and 40° was compared to established research, including numerical and physical analysis. For the friction angle of 30°, results were compared with those of Chakraborty and Kumar [21], and Murray and Geddes [35]. For the friction angle of 40°, results were compared with those of Kumar [36], Merifield and Sloan [7], and Chakraborty and Kumar [21]. It should be noted that the results of Murray and Geddes [35], and Merifield and Sloan [7] correspond to flat plate anchors. Numerous studies have suggested that the uplift resistance of flat plate anchors is similar to that of pipes [8,37]. Therefore, the flat plate anchor results are used for comparison. The comparison results, shown in Figure 2, reveal that the results for both the 30° and 40° friction angles align closely with those of Chakraborty and Kumar [21], as well as the uplift resistance values for anchors from Murray and Geddes [35], and Merifield and Sloan [7]. These findings confirm the accuracy and correctness of the methodology. Furthermore, the consistency between the upper-bound and lower-bound results demonstrates that the mesh density and iteration settings are appropriate.
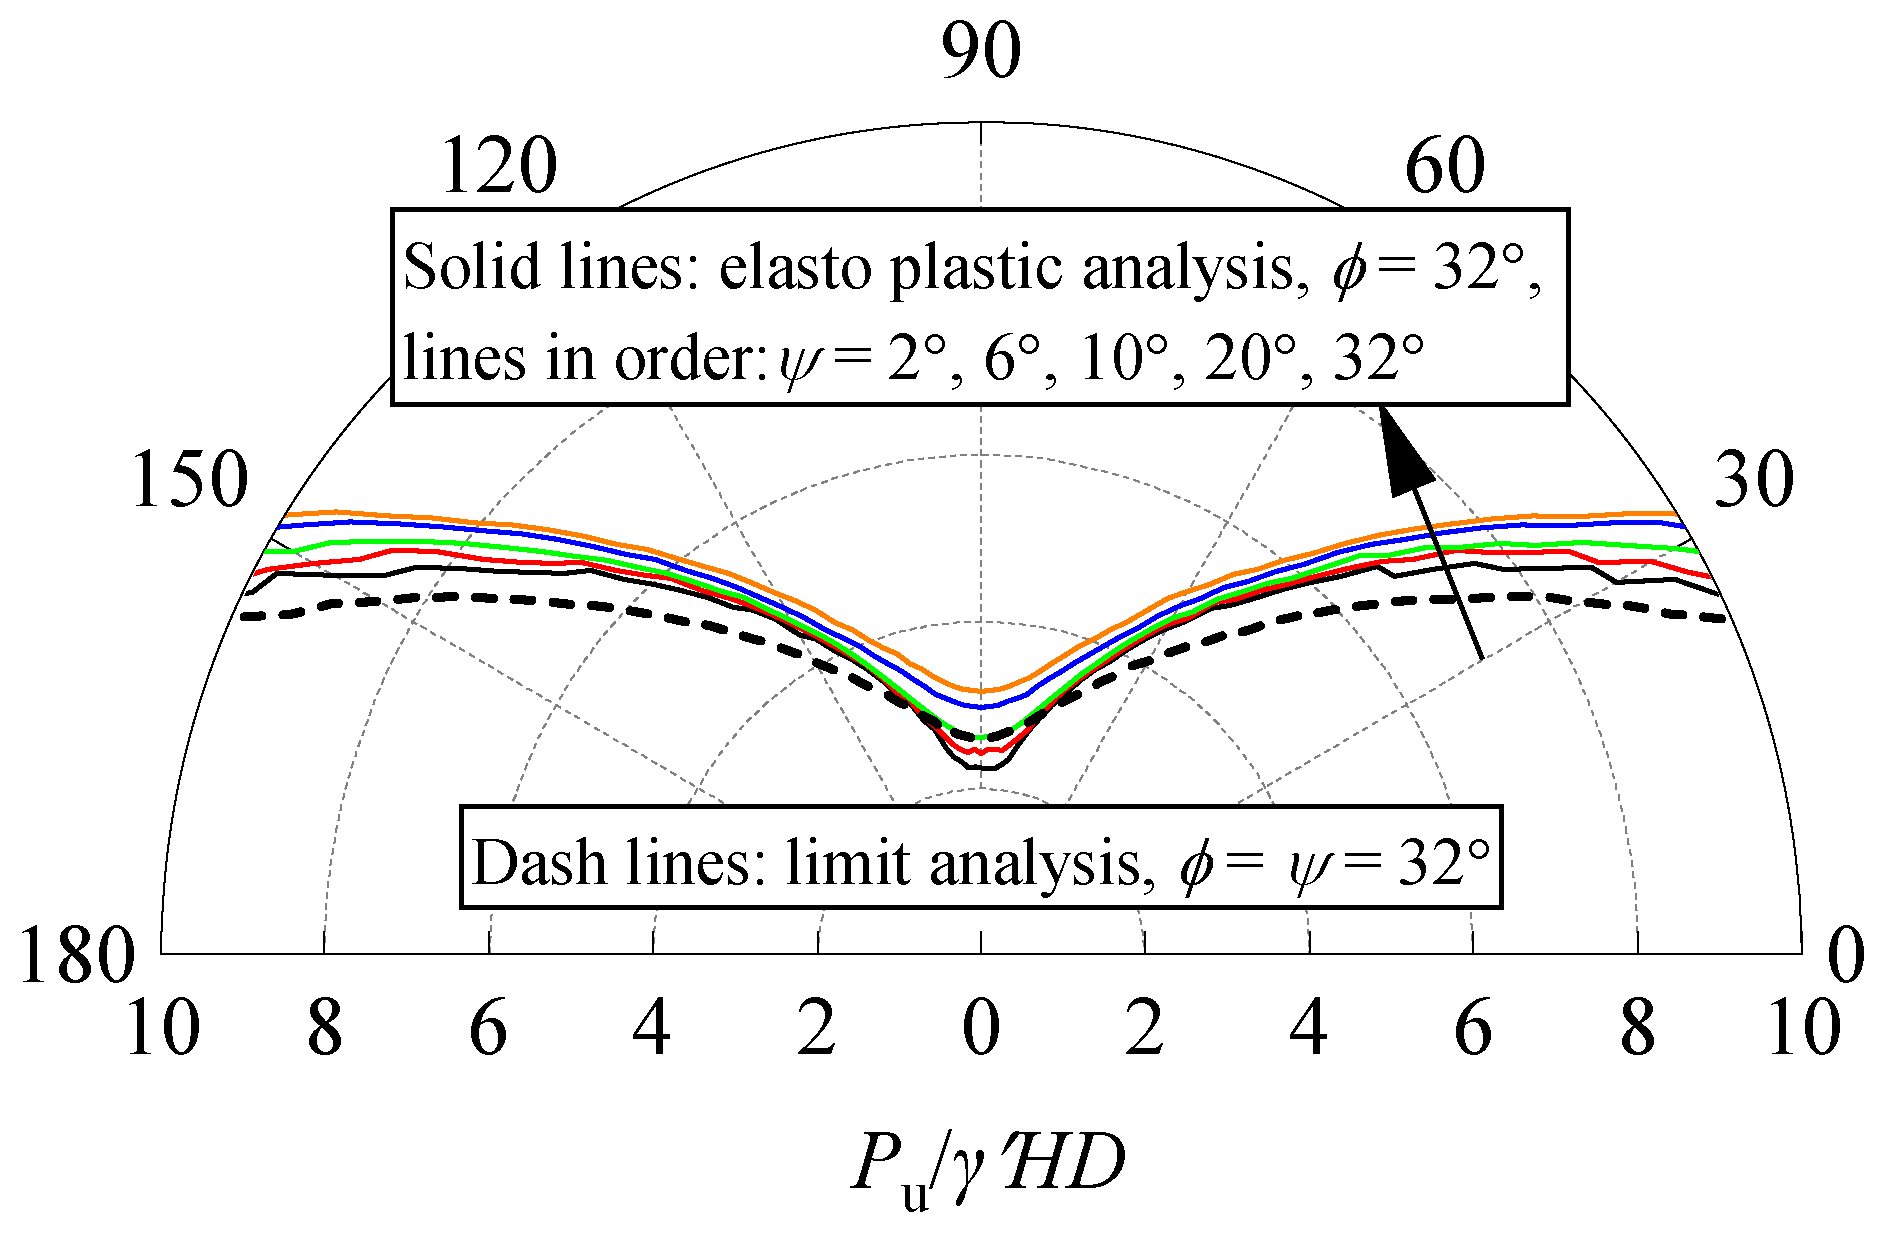
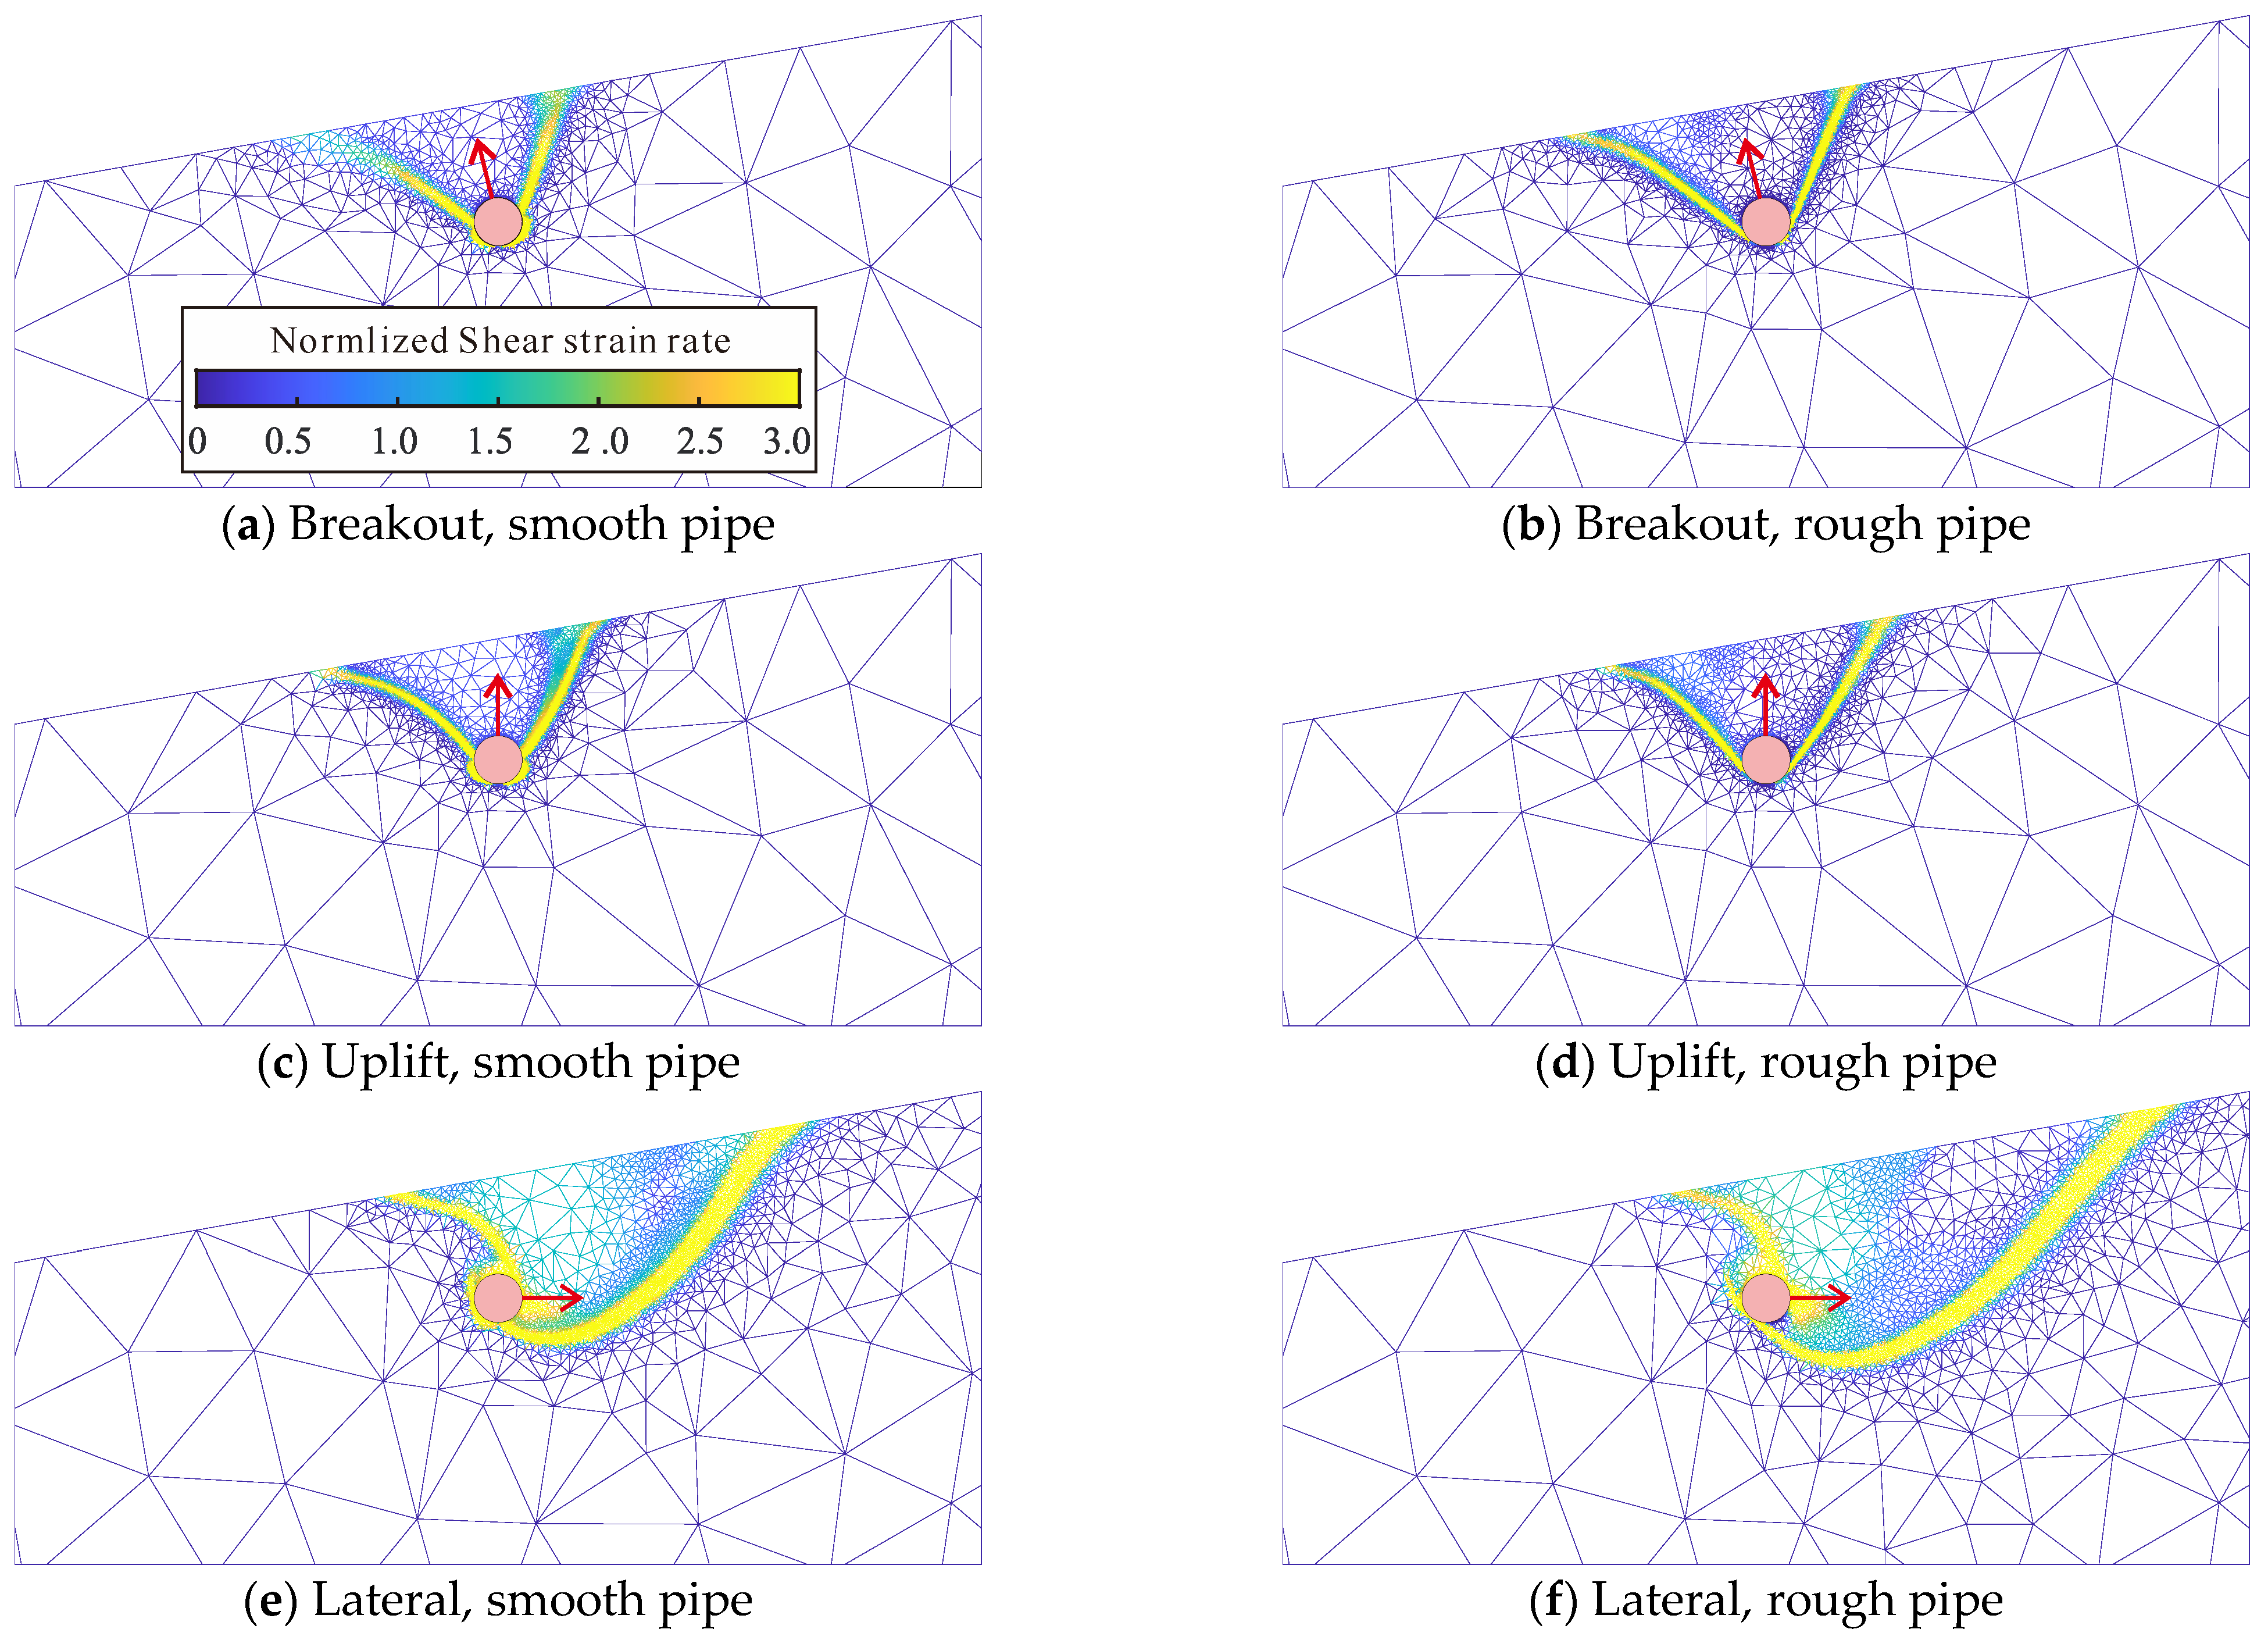
Limit analysis obeys the associated flow rule, which can slightly overestimate the ultimate bearing capacity of seabeds [4,5,6,7]. To evaluate the validity of predicting the bearing capacity of pipes buried in sandy soils, a comparison was conducted between limit (rigid plastic) analysis and elastoplastic analysis performed using OptumG2 [28,38]. Simulations were conducted with parameters of w/D = 3, φ = 32°, β = 0°, and fully rough pipe–soil interfaces, considering sand dilatancy angles of ψ = 2°, 6°, 10°, 20°, and 32°. Yield envelopes, presented in Figure 3, indicate that both methods exhibit similar overall trends. Uplift resistance is minimal in the vertical direction and increases as the displacement angle deviates. Within ±30° of the vertical direction, limit analysis underestimates bearing capacity for low dilatancy angles (ψ = 2° and 6°) but overestimates for higher dilatancy angles (ψ = 20° and 32°). Beyond ± 30° of the vertical direction, limit analysis consistently predicts lower resistance. Failure mechanisms for vertical uplift, illustrated in Figure 4, reveal identical patterns between the two methods. The red arrow represent the displacement direction of pipe. The red arrows in all failure mechanism diagrams represent the displacement direction of the pipeline. To avoid redundancy and maintain visual clarity, this explanation is not repeated in the later figures. Dilatancy primarily affects the orientation of sliding bands, without significant changes to failure modes. These results are consistent with prior studies [3,28]. In summary, although limit analysis tends to overestimate capacities for low dilatancy angles, it captures trends in uplift resistance and failure mechanisms effectively, confirming its applicability in this context.

3. Results and Discussions

3.1. Breakout Resistances at Differing Probing Directions

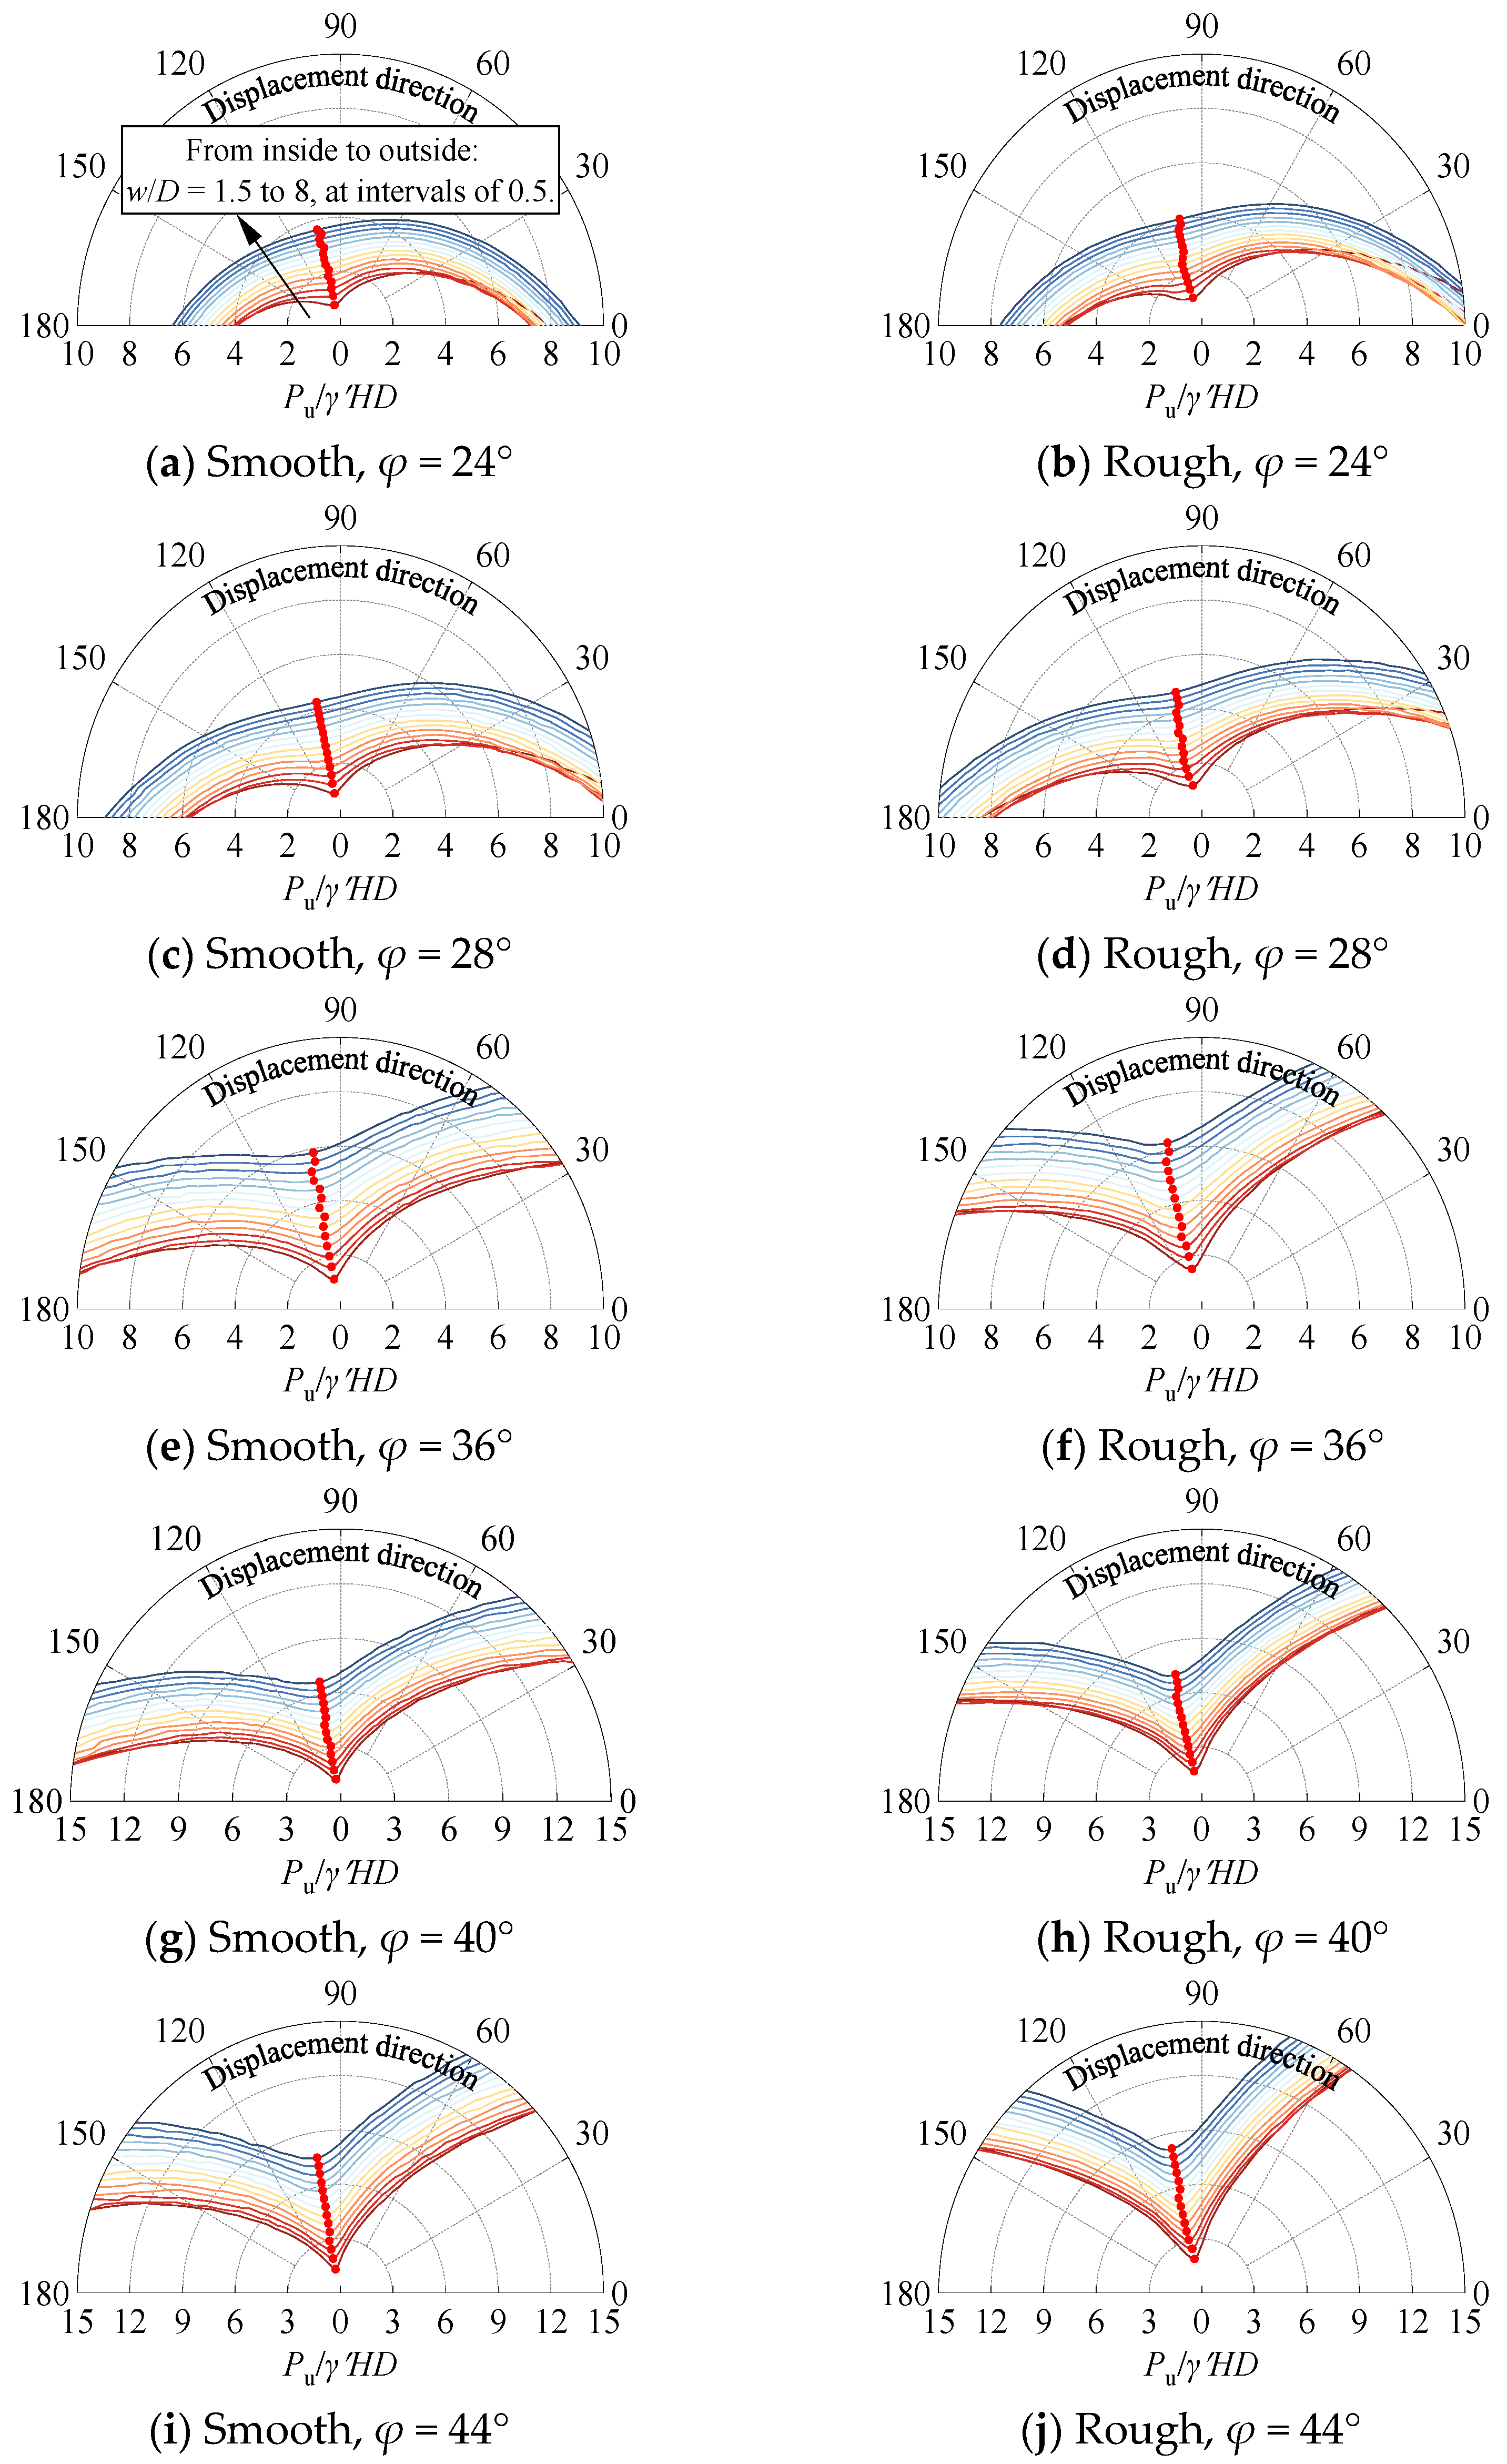
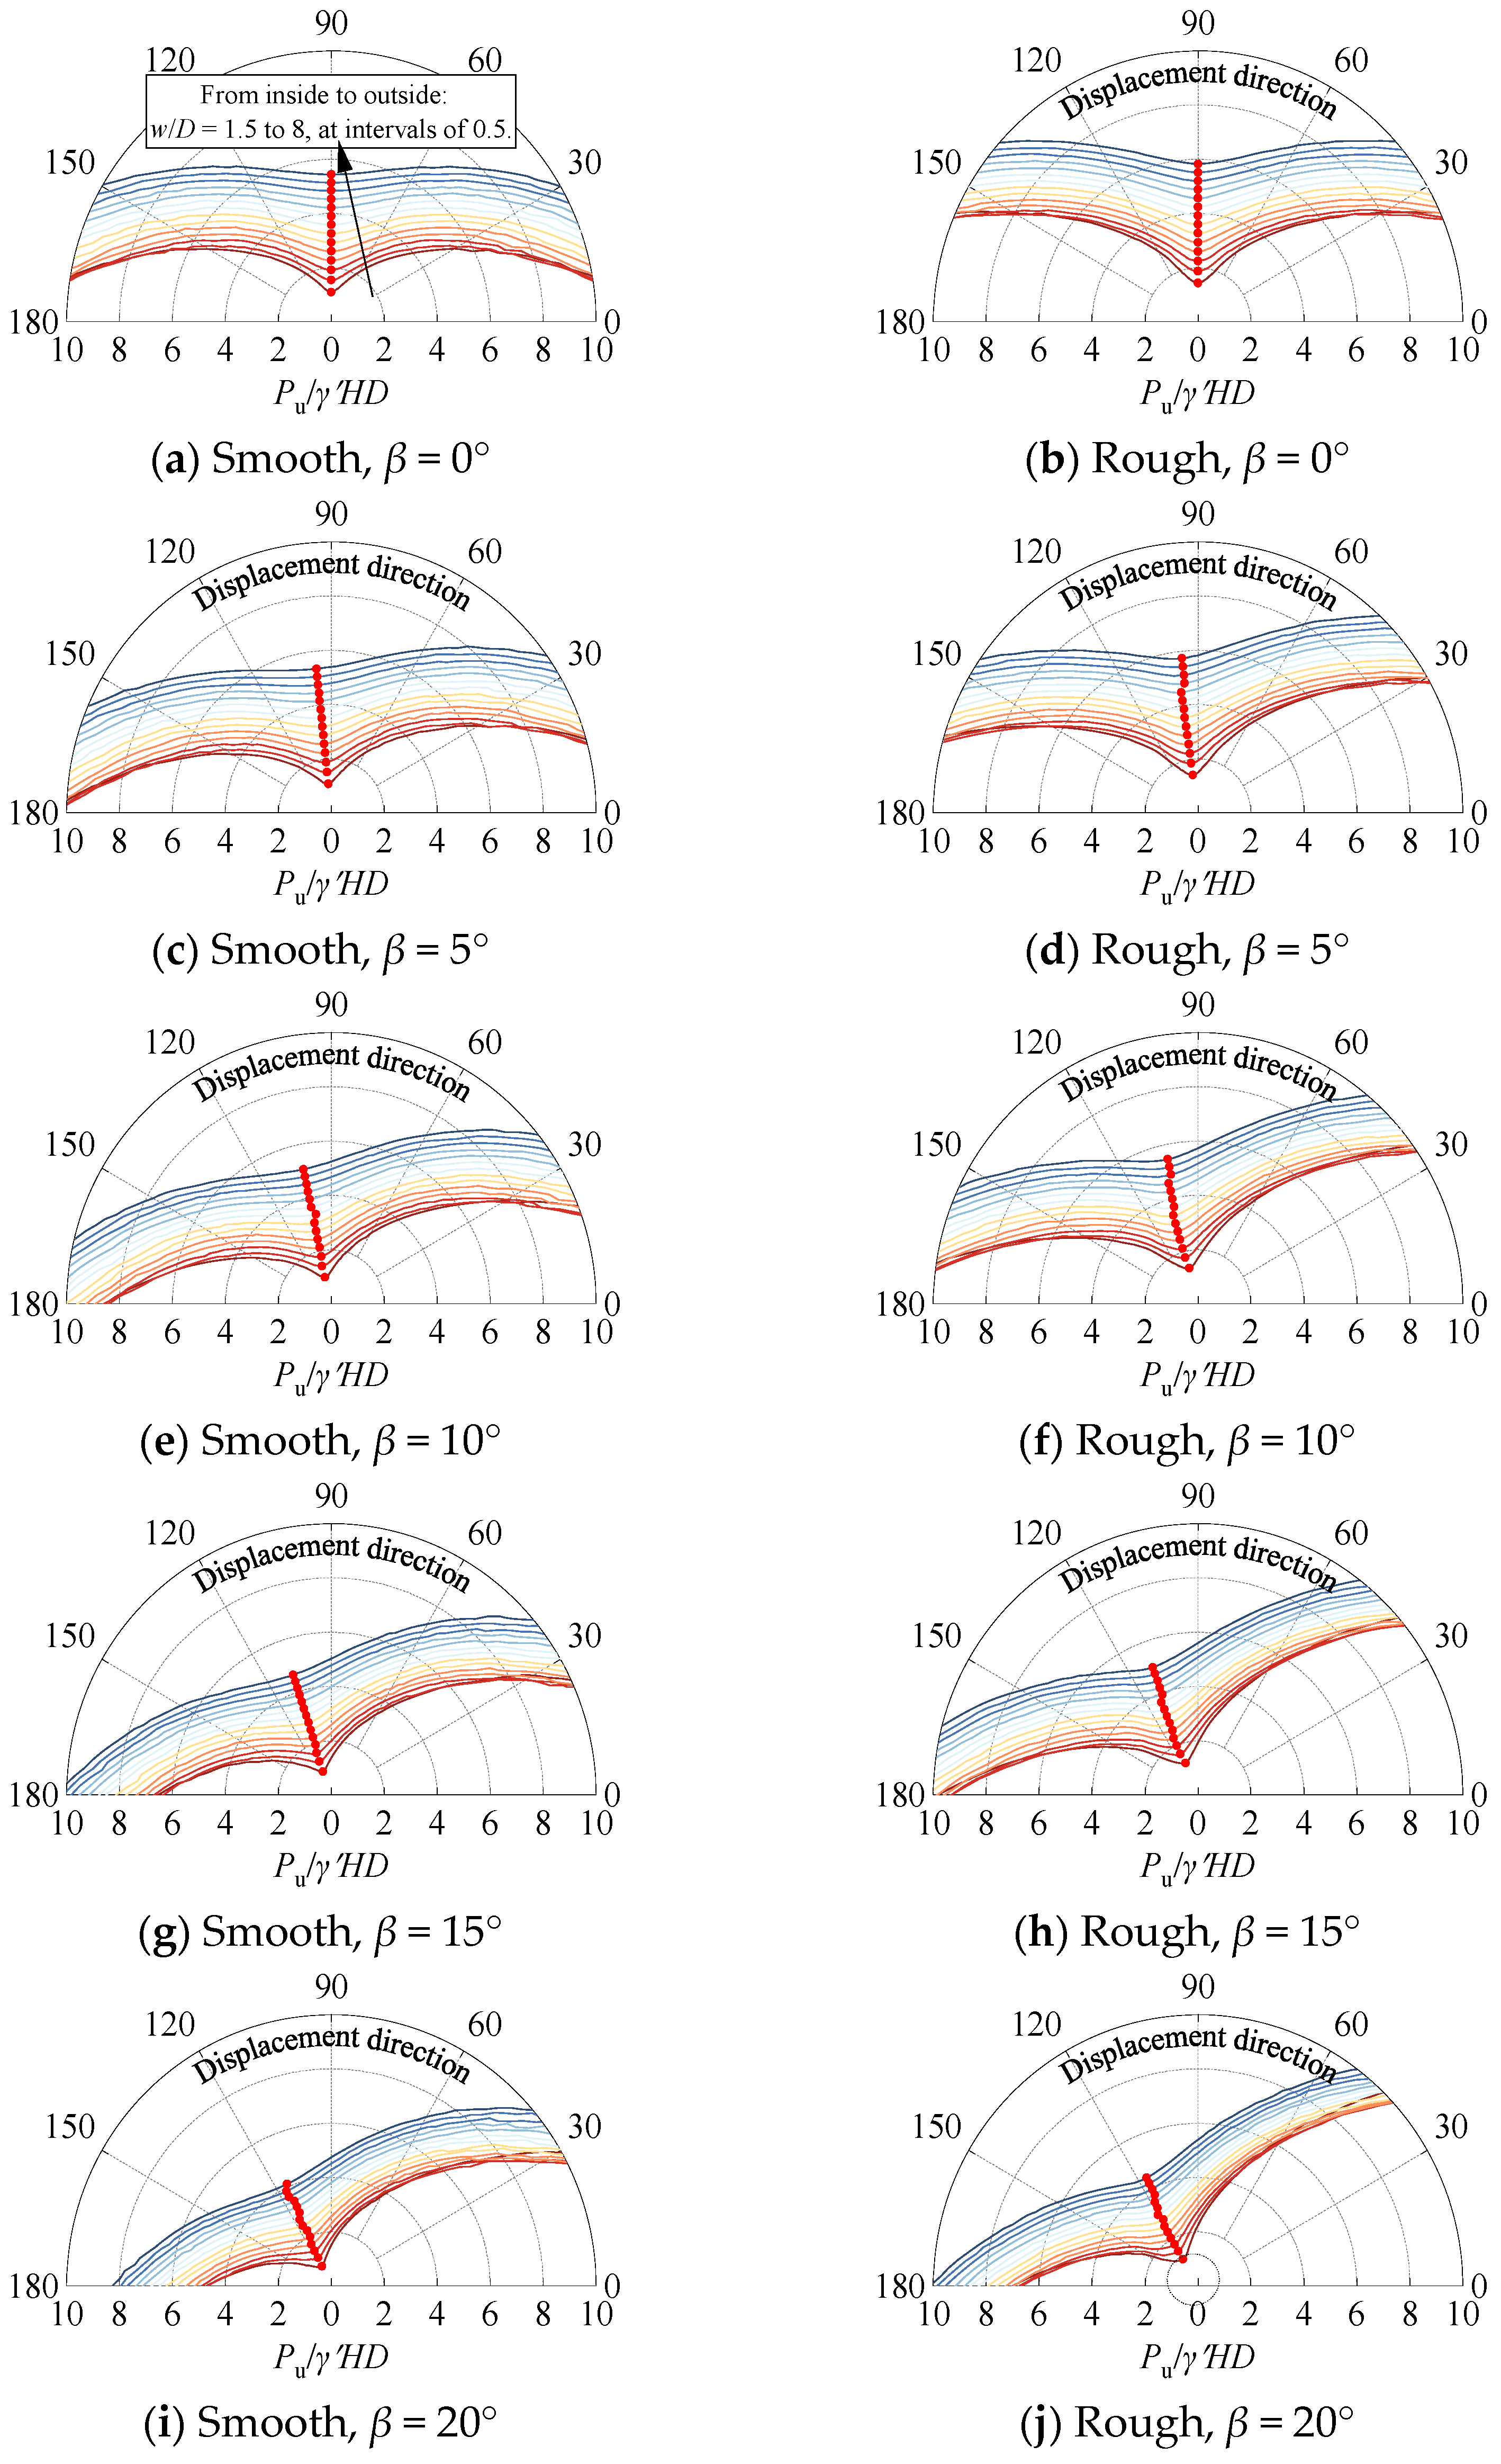
Figure 5 displays the yield envelopes for pipes buried at various depths under a seabed inclination of β = 10°. To ensure comparability, ultimate bearing capacity (Pu) is normalized as Pu/γHD, where H represents the vertical distance from the pipe center to the seabed [2,10]. Red dots mark the points closest to the polar coordinate origin, representing the minimum bearing capacity and indicating the most vulnerable plane. This convention is consistently applied to subsequent envelope figures without additional explanation.
Figure 5 reveals that Pu varies significantly with displacement direction. The lowest resistance occurs when the displacement direction is close to the outer normal planes (ONPs) of the seabed, while resistance increases sharply for displacement directions close to the inward normal of the seabed. Since this study focuses on minimum resistance and aims to illustrate variations near the MVP, bearing capacities of displacement direction pointing to the interior of the seabed are omitted here. For instance, in Figure 5e, with w/D = 3.0, the dimensionless resistance factor (Pu,b/γHD) at the MVP is 2.36, compared to 2.57 for uplift resistance (Pu,u/γHD) and 24.53 for horizontal rightward loading (Pu,l/γHD). These differences arise from variations in failure surface geometry and wedge size under different loading directions. Failure mechanisms under different loading directions are illustrated in Figure 6, with red arrows indicating displacement directions. As seen in Figure 6a,c,e, the failure wedge size increases as the displacement direction transitions from the MVP to vertical upward. Further rotation toward horizontal loading leads to a shift from wedge-type failure with linear sliding surfaces to mechanisms characterized by curved sliding bands. The mobilized area in horizontal loading is substantially larger than in outward-normal directions. These horizontal failure mechanisms are consistent with findings from Roy et al. [10] (numerical modeling), Katebi et al. [39], and Wu et al. [11] (physical modeling), thereby validating the simulation method applied in this study.
Figure 5 illustrates that the variation trend of ultimate bearing capacity is unaffected by pipe surface roughness. However, rough pipes consistently exhibit higher ultimate resistance compared to smooth pipes under all loading conditions. As shown in Figure 6, both smooth and rough pipes follow a wedge-type failure mechanism, but the initiation points of the sliding bands differ. For smooth pipes, the sliding surface initiates slightly above the pipe waist and causes obvious deformation in the soil beneath. In contrast, for rough pipes, the sliding surface starts slightly below the pipe waist, with minimal deformation observed in the underlying soil. These results are consistent with the physical modeling findings of Zhuang et al. [8], who established that the initiation position of the sliding band determines its length and the size of the failure wedge, thereby influencing the ultimate bearing capacity. It is notable that in Zhuang et al. [8], the sliding band for rough pipelines initiated at the pipe waist; this discrepancy may result from the assumption in this study that the dilatancy angle is ψ = ϕ for the seabed model.
Figure 5 indicates that increasing the seabed friction angle significantly enhances the ultimate bearing capacity in all directions and amplifies the difference between the capacities on the MVPs and in other directions. For example, under w/D = 3, when φ = 28° (Figure 5d), the MVP capacity (Pu,b/γHD) is 1.87, while the vertical uplift capacity (Pu,u/γHD) is 1.99. At φ = 44° (Figure 5j), Pu,b /γHD rises to 2.94, and Pu,u/γHD reaches 3.40. As shown in Figure 7, this trend may arise because an increase in the friction angle widens the angle between the two sliding bands, thereby enlarging the activated wedge and enhancing the ultimate uplift bearing capacity. For example, under the condition of w/D = 3.0 and β = 10°, when φ = 28°, the angle between the two shear bands is about 59.64°; when φ = 40°, the angle between the two shear bands is about 83.08°. It can also be seen that the angle between the two shear bands is slightly greater than 2φ, which is similar to the conclusion for a flat seabed.

3.2. MVPs Prediction Model

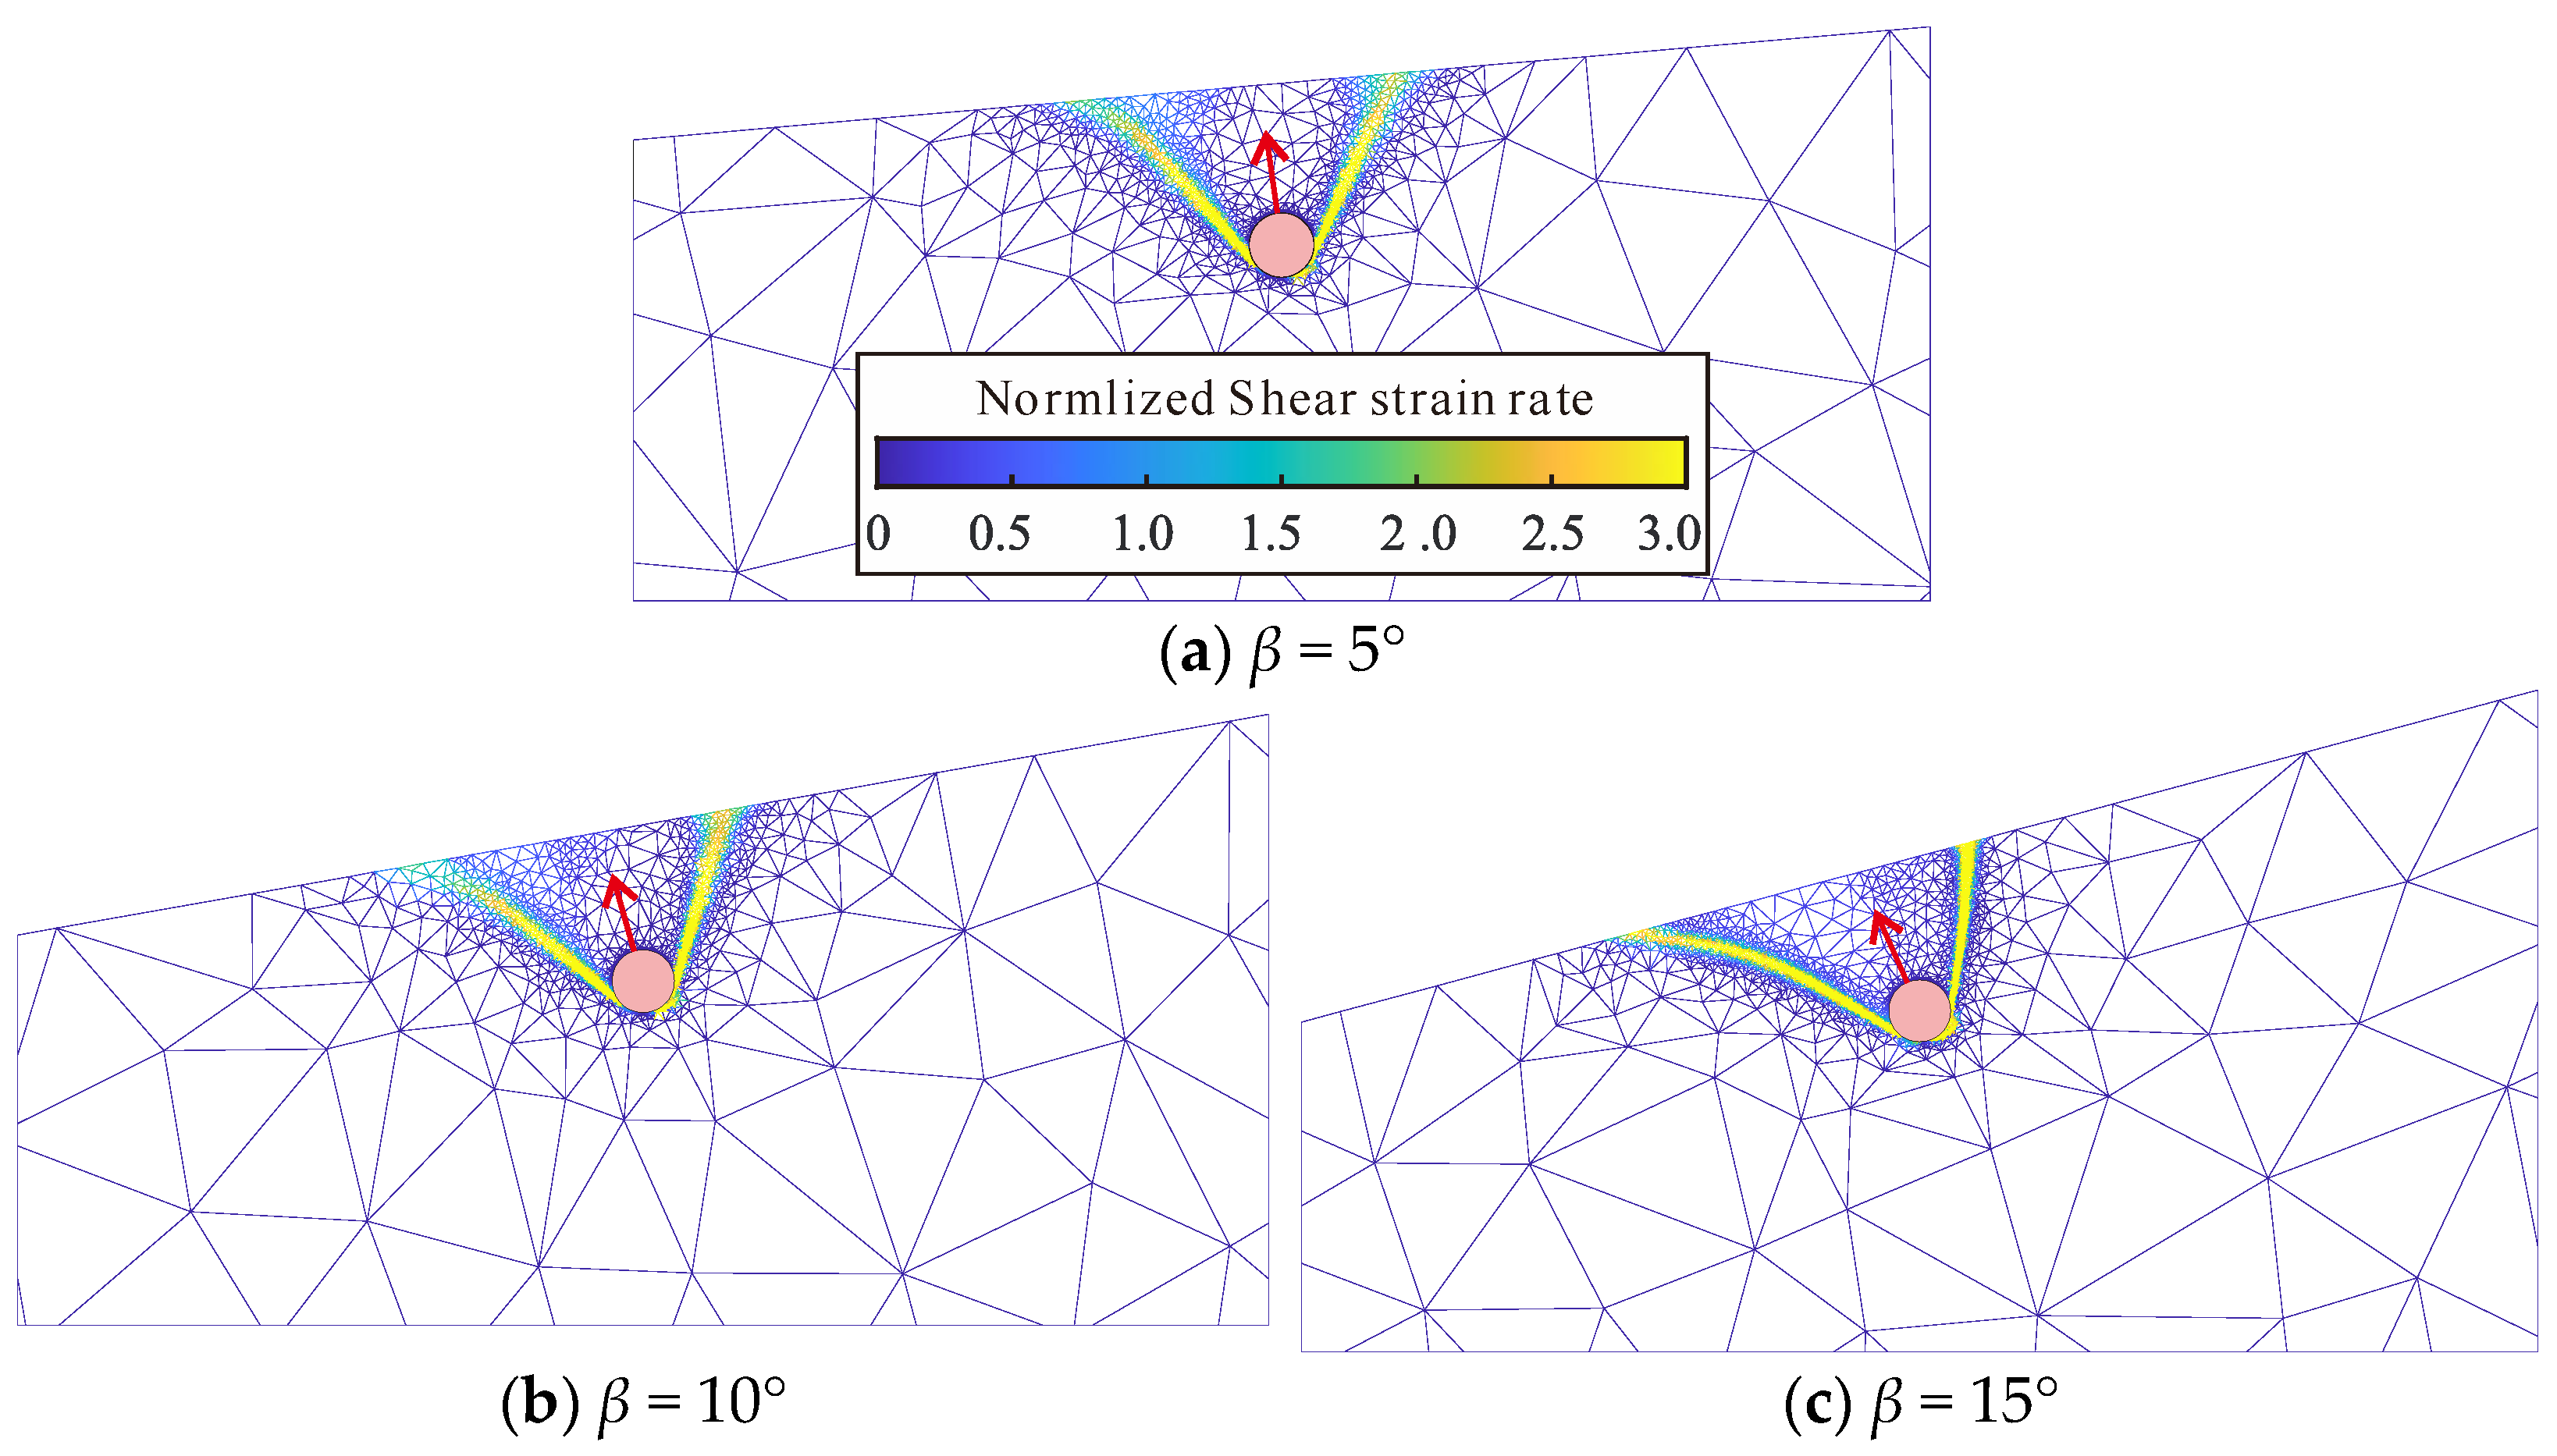
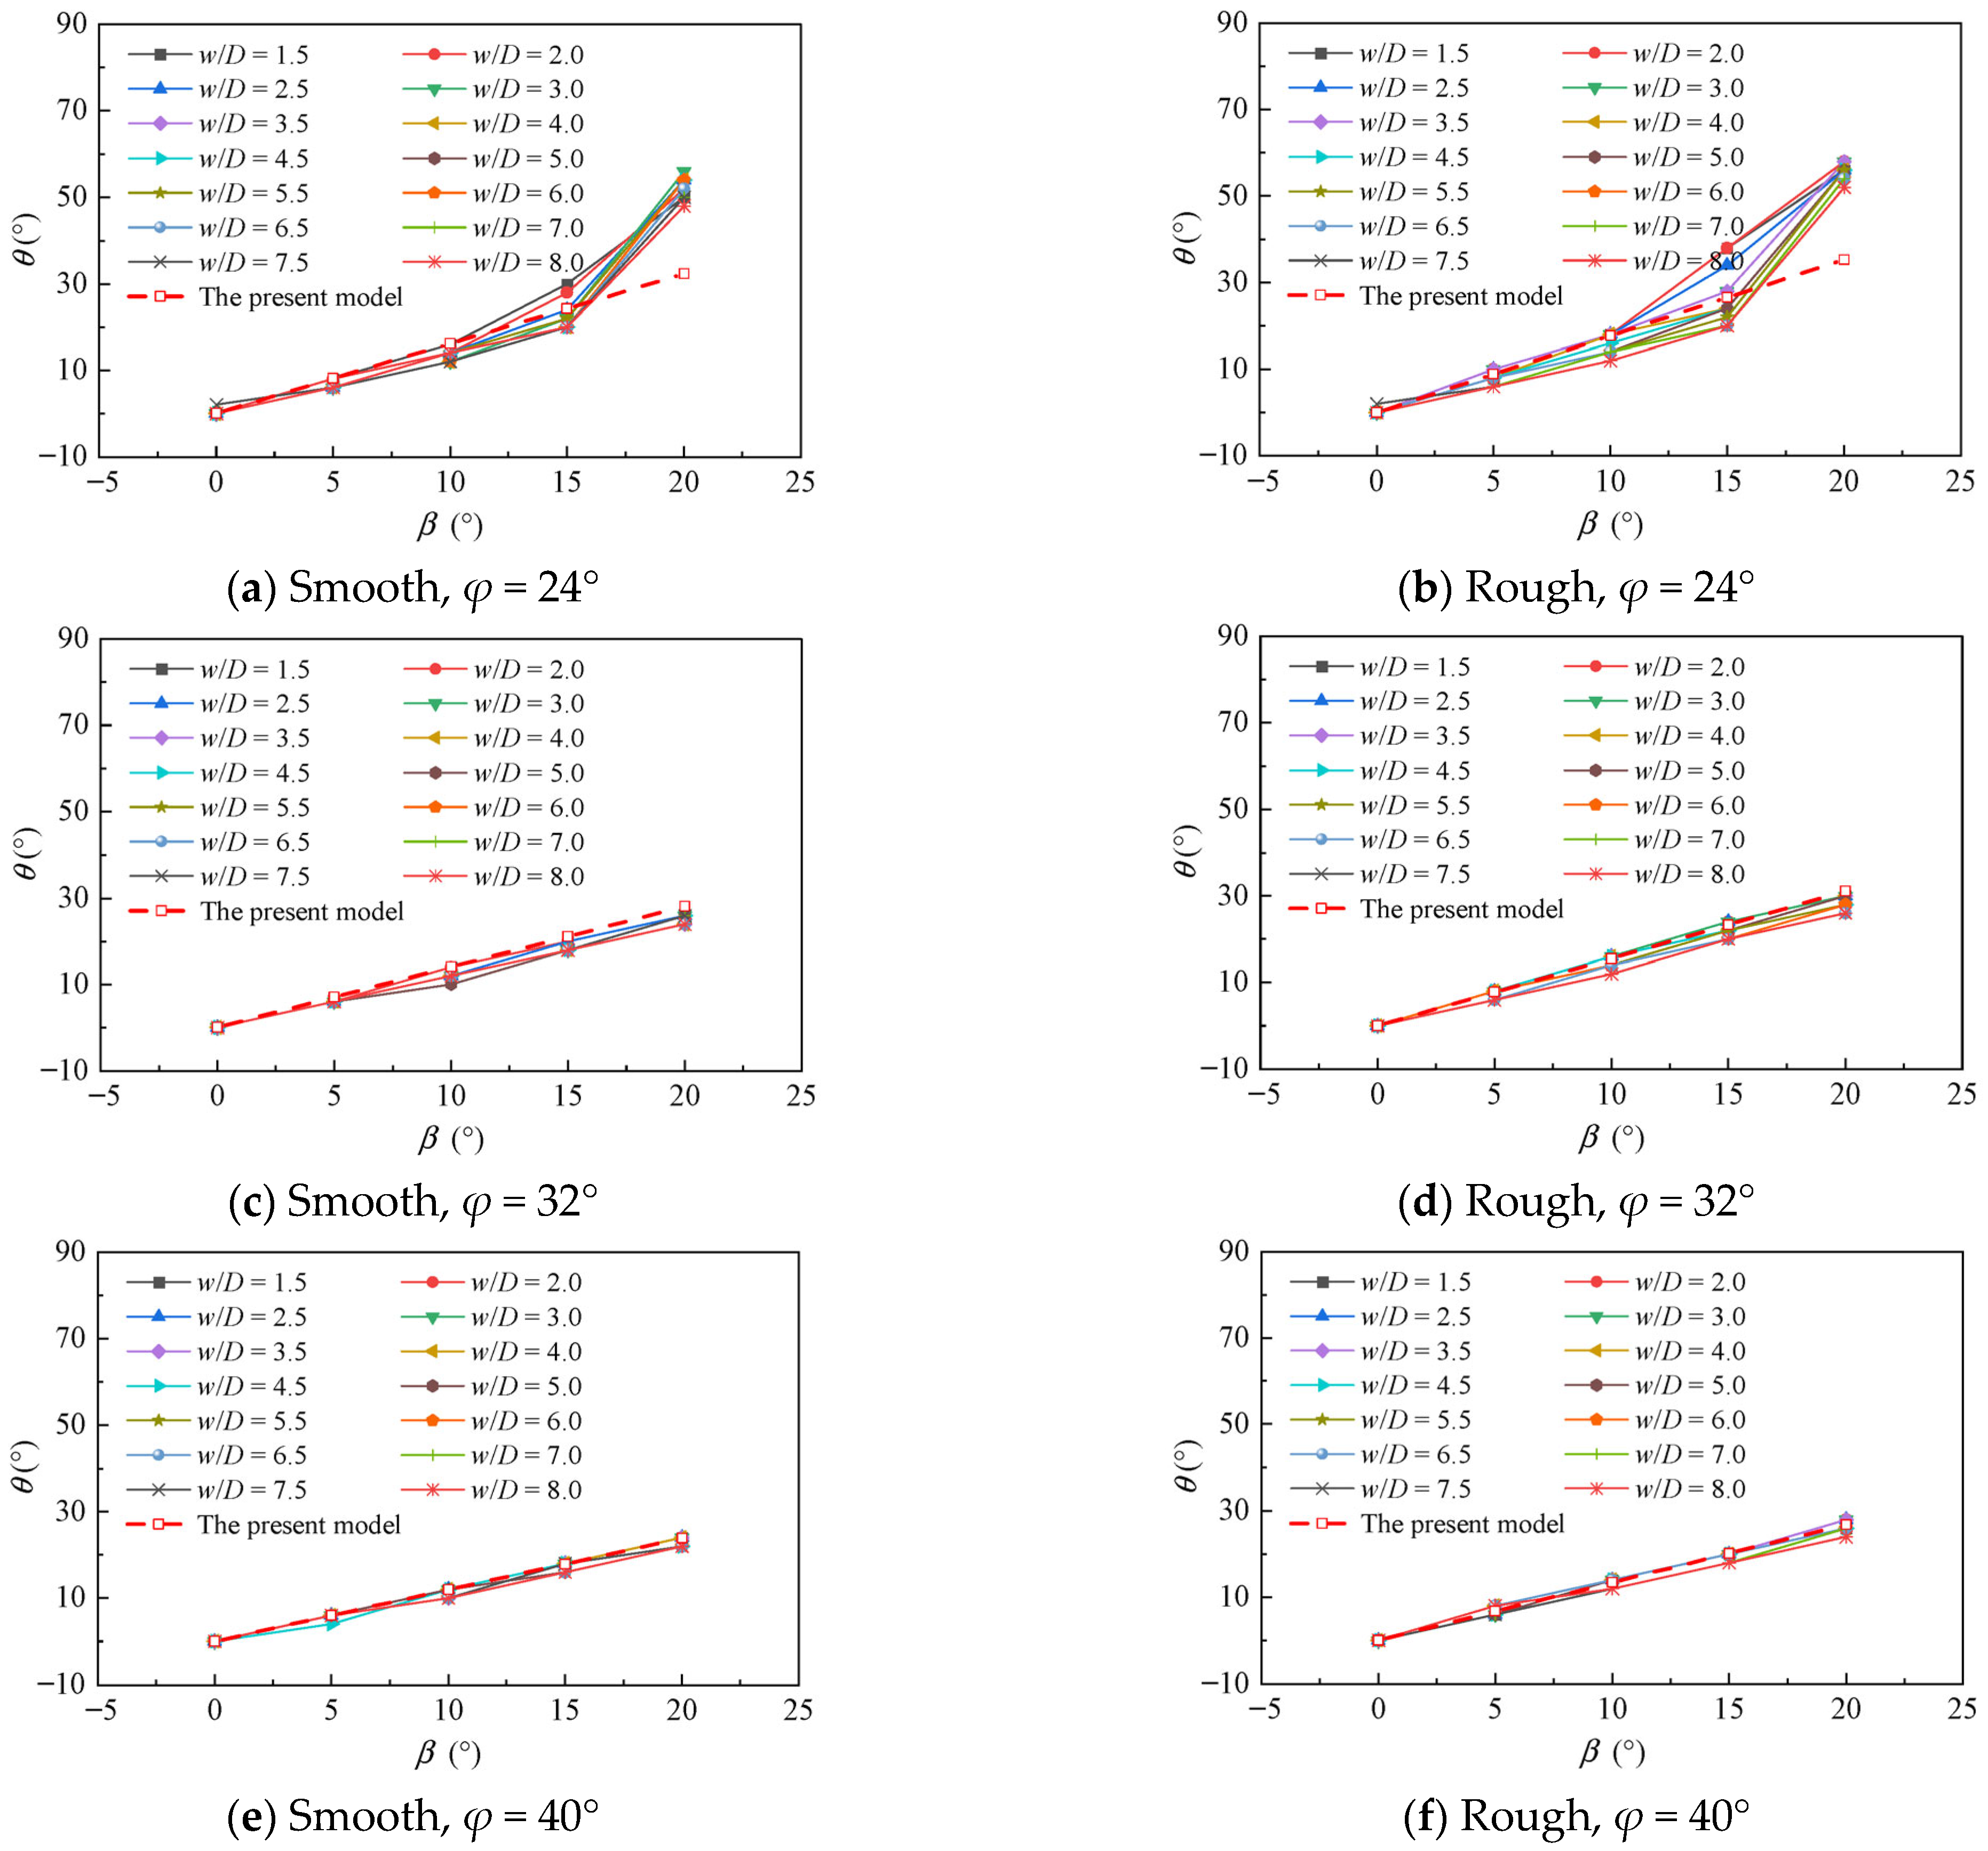
Figure 8 presents the yield envelopes of pipes under varying seabed inclinations, assuming a friction angle of φ = 32°. For flat seabeds, as shown in Figure 8b, the yield envelope exhibits symmetric distribution along the vertical axis, with the lowest ultimate bearing capacity observed in the uplift direction. For inclined seabeds (Figure 8d,f,h,j)), the yield envelope deflects, with the deflection angle closely aligning with the seabed inclination angle, β. The most vulnerable planes (MVPs) are generally near the outer normal planes of the seabed. Failure mechanisms along the MVP for w/D = 3 with a fully rough pipe are depicted in Figure 9. The activated failure wedge tilts according to the seabed inclination, while the downslope sliding band shifts toward the slope toe. A comparison between the left and right columns in Figure 8 indicates that rough and smooth pipes exhibit similar trends in yield envelope deflection and failure mechanisms. The variation in the angle, θ, defined as the angle between the MVP and the vertical direction, with seabed inclination is present in Figure 10. When β is smaller than φ, and the difference between β and φ is less than 10° (Figure 10c–f), and the MVPs are consistent across varying burial depths. A nearly linear relationship is observed between θ and β for different φ values, with θ slightly exceeding β. An increase in φ reduces the discrepancy slightly between θ and β. Furthermore, rough pipes exhibit larger θ values compared to smooth pipelines. In all cases, the failure mechanism remains a traditional wedge-type failure, as shown in Figure 11c,d.
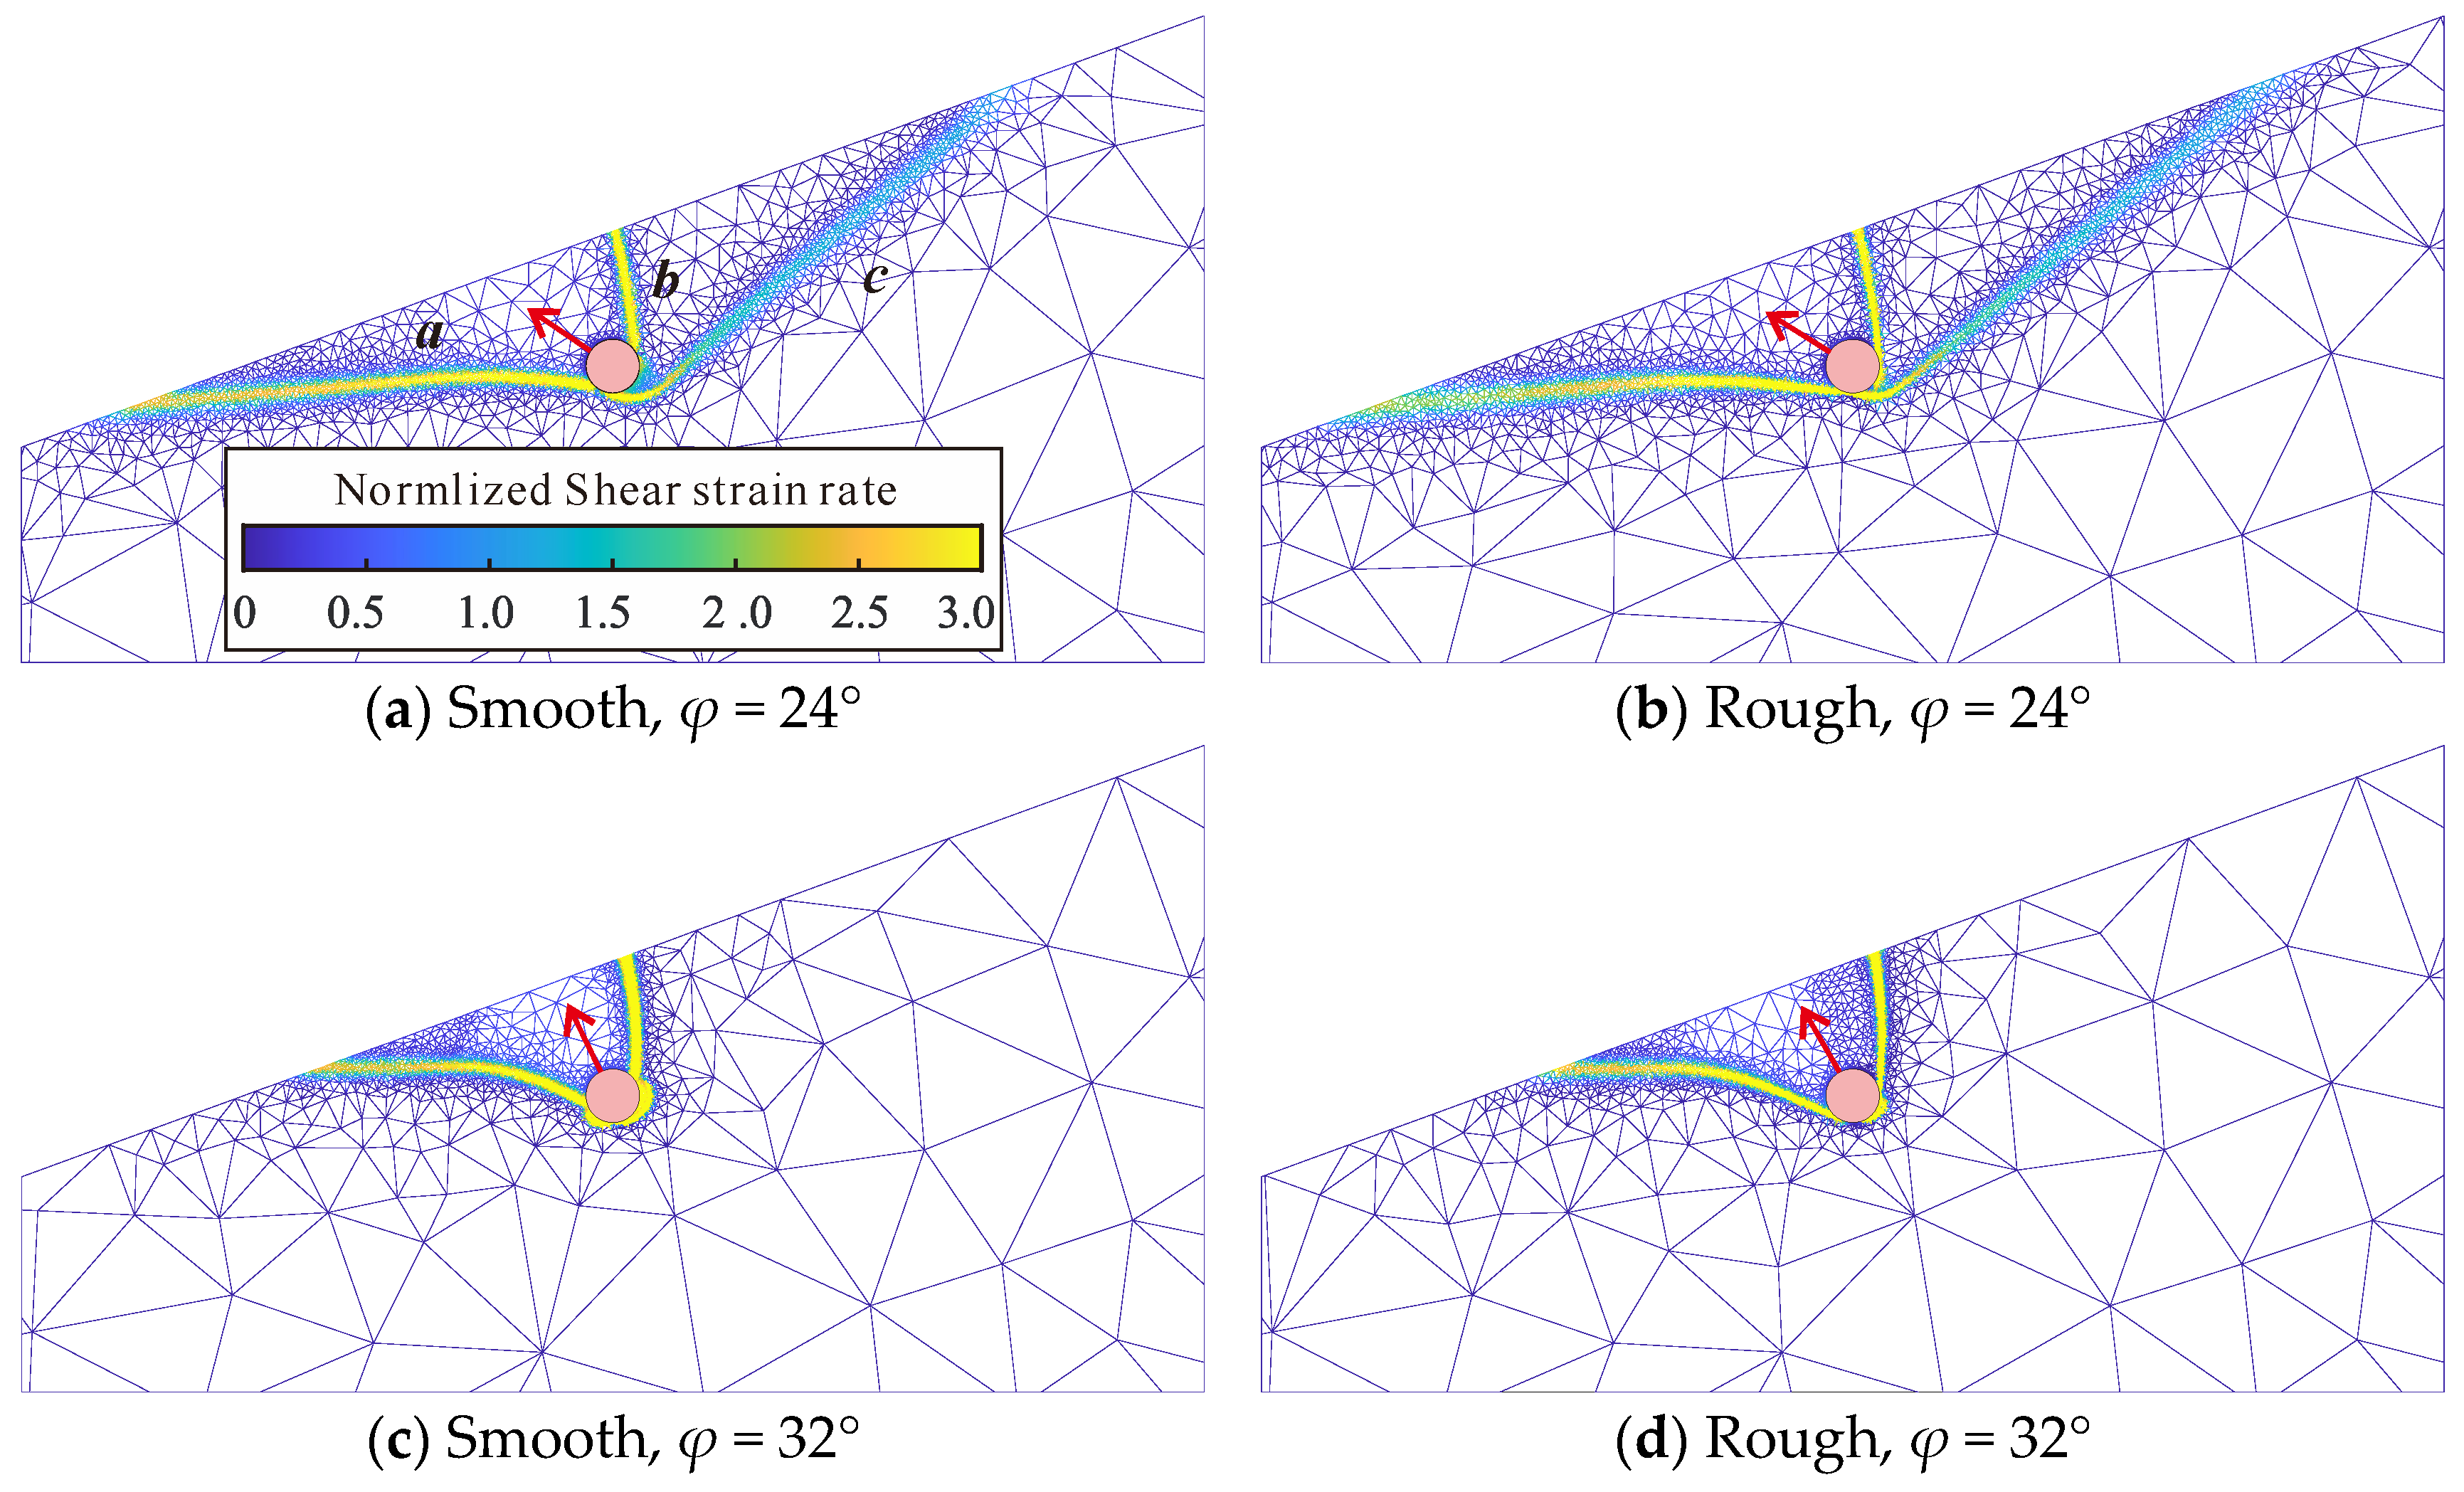
When β is slightly less than θ, with a difference of less than 10° (e.g., β = 20° and φ = 24°, as shown in Figure 10a,b), θ remains consistent with varying burial depths. However, θ becomes significantly larger than β, with shifting downslope (e.g., θ = 52° for w/D = 1.5; θ = 54° for w/D = 5.0). Figure 11 illustrates the failure mechanism for a seabed inclination of β = 20° (w/D = 3.0). As depicted in Figure 11a,b, the failure mechanism differs from the wedge-type failure and exhibits characteristics of a landslide, referred to here as “landslide-type failure”. This landslide-type failure is characterized by three approximately linear sliding bands: bands a and c form the overall landslide structure, while band b divides the sliding mass into two segments. It can also be seen from the figure that the scope of the shear band of landslide-type failure is much larger than that of wedge-type failure. When β decreases to 15°, θ shows significant variation with burial depth (e.g., θ = 28° for w/D = 1.5; θ = 20° for w/D = 5.0). This variation is likely due to the differences in failure mechanisms: shallowly buried pipes (w/D = 1.5) are prone to landslide-type failure, while deeply buried pipelines (w/D = 5.0) continue to exhibit wedge-type failure. From Figure 11c,d, it can be observed that as φ increases, the stability of the seabed improves, and the failure mode reverts to a wedge-type failure. From the above analysis, it can be concluded that the seabed failure mode is closely related to the overall stability of the seabed. When the overall stability of the seabed is relatively low, the lateral load exerted by the pipeline may trigger a landslide-like failure of the seabed.
Landslide-type failure not only reduces the ultimate resistance of pipelines (as discussed in the following section) but also can initiate cascading effects that may result in secondary disasters, such as landslides. This mechanism provides a plausible explanation for the recurrent catastrophic landslides observed on slopes containing buried submarine pipelines [40]. It also offers insight into how storms contribute to such events: storms lower the seabed strength, while lateral buckling of pipelines triggers landslide failure. To mitigate potential risks, it is imperative to avoid these scenarios in engineering practice.
The above findings indicate that θ in wedge-type failure is influenced by φ, β, and the roughness of the pipe surface. To predict θ, the following equation is proposed:
θ = (A × φ + B) × β
In this equation, A and B are model coefficients. Based on the results, A is determined to be −0.0265, while B is shown to depend on the pipe’s roughness, with a value of 2.254 for a smooth pipe, and 2.402 for a rough pipe. As illustrated in Figure 10, this model reliably represents the relationship between θ, φ, β, and the roughness of the pipe surface. For instance, in Figure 10e, where w/D = 2.5 and β = 10°, the simulation predicts θ = 12°, and the model provides a closely matching value of 11.94°. It should be emphasized that this model is valid and exclusively applicable to wedge-type failure and cannot be applied to landslide-type failures.

3.3. Breakout Resistances Along MVPs

Figure 12 illustrates the variation in ultimate bearing capacities (Pu,u and Pu,b) with pipe burial depth, normalized as Pu/γ’HD and w/D. The results indicate that both Pu,u and Pu,b increase steadily with embedment, without reaching a critical limit value. Previous studies have documented that in loose and medium–dense sandy seabeds, the ultimate bearing capacity stabilizes at a critical embedment, which exhibits a localized and flow-type failure mechanism [9,10,11]. These studies, however, report a wide range of critical depths. The absence of such behavior in this study may be attributed to only the friction angle, φ, of seabeds, omitting factors like sand density, dilatancy angle, etc. These limitations suggest that further investigation using elastoplastic analysis is necessary to incorporate these additional influences.
Figure 12 reveals that Pu,b is consistently lower than Pu,u under the same conditions. For instance, when β = 20° and w/D = 2.0, Pu,b is only 57% of Pu,u. Additionally, the responses of Pu,b and Pu,u to variations in seabed slope angle (β) differ significantly. Pu,b decreases notably with increasing β, and the reduction becomes more pronounced at deeper w/D. As shown in Figure 12d, when β increases from 0° to 20°, Pu,b decreases from 1.87 to 1.47 at w/D = 2.0, and from 5.19 to 3.96 at w/D = 7.0. In contrast, at shallow burial depths, the presence of β can increase Pu,u. For instance, as β increases from 0° to 20° in Figure 12d, Pu,u rises from 1.87 to 2.51 at w/D = 2.0. Additionally, an increase in φ amplifies the difference between Pu,b and Pu,u. These observations highlight that relying on Pu,u would result in a significant overestimation of the minimum ultimate bearing capacity.
The results presented in Figure 12 are also compared with the design code DNV (2017), which is widely recognized as the primary standard for offshore pipeline design. This standard assumes a flat seabed, with maximum vertical loads (MVPs) aligned vertically upward. To ensure safety, the standard employs the vertical slip failure assumption [1,41], and uplift resistance is expressed by the following equation:
Fuplift = γHD − πγD2/8 + H 2
where H is the vertical depth from the pipe center to the seabed, γ’ is the submerged unit weight of the soil, D represents the external diameter of pipes, and f denotes the uplift resistance factor. The low estimate factor, fLE, can be derived using Equation (3):
f LE = 0.1 ( φ 30 ° ) f LE = 0.1 + ( φ 30 ) / 30 ( 30 ° < φ 45 ° ) f LE = 0.6 ( φ > 45 ° )
where φ is the friction angle of the seabed and given in degrees. The best estimate (fBE) and high estimate (fHE) of the uplift resistance factor can be determined by adding 0.19 and 0.38, respectively, to the value obtained from Equation (3).
Figure 12 shows that the three estimate values by the DNV [19] exhibit a broad range, with all estimates overestimating the bearing capacity when β and MVPs are considered under shallow embedment. Pu,u notably overstates the ultimate resistance, exceeding Pu,b regardless of whether the seabed slope is considered. This phenomenon persists even in comparison with Pu,u, particularly for seabeds with φ below 40°. Furthermore, the best estimates exhibit a considerable overestimation of ultimate resistance when accounting for the seabed slope, with the extent of overestimation increasing as φ decreases. For instance, as shown in Figure 12c, at w/D = 4.0 and β = 20°, Pu,b is 2.22, while the DNV [19] best estimate is 2.66. Conversely, the low estimates underestimate the bearing capacity at deeper burial depths (w/D ≥ 5.0) but continue to overestimate it at shallower depths. As illustrated in Figure 12e, at w/D = 2.0 and β = 20°, Pu,b is 1.44, while the DNV [19] low estimate is 2.22, with Pu,b being only 65% of the low estimate. Although the associated flow rule used in this study might slightly overestimate uplift resistance, the estimates consistently exceed the calculated results, raising significant concerns about the safety of the DNV [19] design code.
The above discussion indicates that the design code thereby may pose potential safety risks. A reduction coefficient model (Pu,b/FBE) is proposed based on the best estimate of DNV (2017), given that the best estimate exhibits a trend with a burial depth that aligns relatively well with the calculated results. The reduction coefficients for different conditions are presented in Table 2 and Table 3. In practical design applications, the recommended values from the DNV [19] design code can be adjusted by applying these reduction coefficients.
The data presented in the tables clearly indicate that at low burial depths and high seabed inclinations, the DNV [19] design code significantly overestimates seabed bearing capacity. Moreover, the risk associated with the design code increases as burial depth decreases. For instance, as shown in Table 2, for φ = 24° and β = 10°, when w/D = 2.0, Pu,b is only 64% of the best estimate value. In contemporary engineering practice, pipeline burial depths are typically shallow due to the limitations of construction equipment. These findings further emphasize the necessity of addressing the shortcomings inherent in the DNV [19] design code.

4. Conclusions

FELA was utilized to evaluate the ultimate bearing capacity in different loading directions in inclined seabeds. This study focuses on the direction and failure mechanism of the minimum bearing capacity on sloping seabeds and analyzes the effects of factors such as inclination angle and pipeline embedment on uplift bearing capacity. The key findings are summarized as follows:
(1)
Failure mechanisms are significantly influenced by the direction of applied displacement load, resulting in considerable variations in ultimate bearing capacity. To ensure accurate calculations, the influence of loading direction must be explicitly accounted for when determining the minimum bearing capacity.
(2)
The seabed inclination was found to have a significant effect on the deflection of the most vulnerable plane (MVP). As the inclination approaches the seabed friction angle, the failure mechanism transitions to landslide-type failure, shifting the weakest plane to the slope toe and causing a considerable reduction in the ultimate bearing capacity. When the inclination is considerably smaller than the friction angle, the MVPs were observed to align closely with the outer normal planes of the seabed. A predictive model for the MVP under wedge-type failure mode was successfully developed in this study.
(3)
The inclined seabed angle (β) was observed to significantly reduce the minimal ultimate bearing capacity associated with the most vulnerable plane. For shallow burial depths, β increases the uplift bearing capacity, which does not accurately reflect the minimum bearing capacity. Consequently, relying on uplift resistance as the minimum ultimate bearing capacity poses significant safety risks.
(4)
The ultimate bearing capacity calculated by DNV [19] is frequently overestimated, even for low estimates, particularly in cases of shallow burial depth. To mitigate this discrepancy, a reduction factor model based on the best estimates from DNV [19] was proposed in this study to improve accuracy and safety.
The results from this numerical study regarding the bearing capacity of pipe embedded in sandy seabed were carefully examined through FELA, which inevitably incorporates limitations. Firstly, sandy seabed following the associated flow rule was adopted, which may cause overestimated bearing capacity, and the dilatancy effect of sandy seabed needs extensive study [2,3,28,34]. Secondly, large deformation of the pipe was not incorporated in this study, but related research can be found at Kong et al. [42] and Kong [43]. Thirdly, the pipe–soil system suffers not only high temperature and pressure but also wave loading, so it is necessary to simultaneously consider these two types of loads (e.g., Miyamoto et al. [44] and Su et al. [45]). Future research will aim to account for these combined loading effects and dilatancy effects to provide a more comprehensive assessment of pipeline performance.

Author Contributions

Conceptualization, F.C.; Methodology, J.Z. and F.C.; Software, F.C.; Validation, J.Z. and S.S.; Formal analysis, J.Z. and S.S.; Investigation, J.Z. and S.S.; Resources, F.C.; Writing—original draft, J.Z.; Writing—review & editing, J.Z. and F.C.; Visualization, J.Z. and S.S.; Supervision, F.C.; Project administration, J.Z. and F.C.; Funding acquisition, J.Z. All authors have read and agreed to the published version of the manuscript.

Funding

This study is funded by China Postdoctoral Science Foundation (Certificate Number 2024M760464) and the National Natural Science Foundation of China (Grant No. U23A20670).

Data Availability Statement

All data generated or used during the study are available from the corresponding author upon request.

Conflicts of Interest

The authors declare no conflict of interest.

Nomenclature

Amodel coefficient
Bmodel coefficient
Dpipe diameter, m
Fupliftuplift resistance
FBEbest estimate uplift resistance of DNV code
Fuplift resistance factor
fLElow estimate uplift resistance factor
fBEbest estimate uplift resistance factor
fHEhigh estimate uplift resistance factor
Hvertical distance from pipeline center to the seabed surface, m
Puultimate breakout resistance
Pu,bultimate breakout resistance
Pu,uultimate uplift resistance
Pu,lultimate lateral resistance
Wvertical distance from pipeline bottom to the seabed surface, m
Hhorizontal load
Vvertical load
Βinclined angle of seabed, in degrees
γ′submerged unit weight, kN/m3
θangle between the most vulnerable plane and the upright plane
Φfriction angle of seabed, in degrees
Ψdilation angle of sand, in degrees

References

  1. Trautmann, C.H.; O’Rourfce, T.D.; Kulhawy, F.H. Uplift Force-Displacement Response of Buried Pipe. J. Geotech. Eng. 1985, 111, 1061–1076. [Google Scholar] [CrossRef]
  2. White, D.J.; Barefoot, A.J.; Bolton, M.D. Centrifuge modelling of upheaval buckling in sand. Int. J. Phys. Model. Geotech. 2001, 1, 19–28. [Google Scholar] [CrossRef]
  3. White, D.J.; Cheuk, C.Y.; Bolton, M.D. The uplift resistance of pipes and plate anchors buried in sand. Géotechnique 2008, 58, 771–779. [Google Scholar] [CrossRef]
  4. Rowe, R.K.; Davis, E.H. The behaviour of anchor plates in sand. Géotechnique 1982, 32, 25–41. [Google Scholar] [CrossRef]
  5. Bolton, M.D. The strength and dilatancy of sands. Géotechnique 1986, 36, 65–78. [Google Scholar] [CrossRef]
  6. Drescher, A.; Detournay, E. Limit load in translational failure mechanisms for associative and non-associative materials. Géotechnique 1993, 43, 443–456. [Google Scholar] [CrossRef]
  7. Merifield, R.S.; Sloan, S.W. The ultimate pullout capacity of anchors in frictional soils. Can. Geotech. J. 2006, 43, 852–868. [Google Scholar] [CrossRef]
  8. Zhuang, P.-Z.; Yue, H.-Y.; Song, X.-G.; Yang, H.; Yu, H.-S. Uplift Behavior of Pipes and Strip Plate Anchors in Sand. J. Geotech. Geoenviron. Eng. 2021, 147, 04021126. [Google Scholar] [CrossRef]
  9. Ansari, Y.; Kouretzis, G.; Sloan, S.W. Development of a prototype for modelling soil–pipe interaction and its application for predicting uplift resistance to buried pipe movements in sand. Can. Geotech. J. 2018, 55, 1451–1474. [Google Scholar] [CrossRef]
  10. Roy, K.; Hawlader, B.; Kenny, S.; Moore, I. Finite element modeling of lateral pipeline–soil interactions in dense sand. Can. Geotech. J. 2016, 53, 490–504. [Google Scholar] [CrossRef]
  11. Wu, J.; Kouretzis, G.; Suwal, L.; Ansari, Y.; Sloan, S.W. Shallow and deep failure mechanisms during uplift and lateral dragging of buried pipes in sand. Can. Geotech. J. 2020, 57, 10. [Google Scholar] [CrossRef]
  12. Mukherjee, S.; Sivakumar Babu, G.L. The Behavior of Horizontal Anchor Foundations Embedded in Sand under Uplift and Lateral Loads. Int. J. Geomech. 2024, 24, 06024007. [Google Scholar] [CrossRef]
  13. Yang, H.; Wang, L.; Lei, Z.; Rui, S.; Liu, Z.; Guo, Z. Numerical study of lateral soil resistance to pipe movement in sandy slopes. Appl. Ocean Res. 2025, 155, 104419. [Google Scholar] [CrossRef]
  14. Coleman, J.M.; Bouma, A.H.; Prior, D.B.; Roberts, H.H. Nearsurface Geology of the Gulf of Mexico Continental Slope. In Proceedings of the Offshore Technology Conference, Houston, TX, USA, 1 May 1989. [Google Scholar] [CrossRef]
  15. Costello, M.J.; Cheung, A.; De Hauwere, N. Surface Area and the Seabed Area, Volume, Depth, Slope, and Topographic Variation for the World’s Seas, Oceans, and Countries. Environ. Sci. Technol. 2010, 44, 8821–8828. [Google Scholar] [CrossRef]
  16. Gao, F.-P.; Han, X.-T.; Cao, J.; Sha, Y.; Cui, J.-S. Submarine pipeline lateral instability on a sloping sandy seabed. Ocean Eng. 2012, 50, 44–52. [Google Scholar] [CrossRef]
  17. Kumar, J. Upper bound solution for pullout capacity of anchors on sandy slopes. Int. J. Numer. Anal. Methods Geomech. 1997, 21, 477–484. [Google Scholar] [CrossRef]
  18. Bazán-Zurita, E.; Williams, D.M.; Bledsoe, J.K.; Pugh, A.D.; Newman, F.B. AEP 765 kV transmission line: Uplift capacity of shallow foundations on sloping ground. In Electrical Transmission Line and Substation Structures: Structural Reliability in a Changing World; Amer Society of Civil Engineers: Reston, VA, USA, 2006; pp. 215–226. [Google Scholar]
  19. DNVGL-RP-F114; Pipe-Soil Interaction for Submarine Pipelines. DNV: Oslo, Norway, 2017.
  20. Martin, C.M.; White, D.J. Limit analysis of the undrained bearing capacity of offshore pipelines. Géotechnique 2012, 62, 847–863. [Google Scholar] [CrossRef]
  21. Chakraborty, D.; Kumar, J. Vertical Uplift Resistance of Pipes Buried in Sand. J. Pipeline Syst. Eng. Pract. 2014, 5, 04013009. [Google Scholar] [CrossRef]
  22. Kong, D.; Feng, L.; Zhu, B. Assessment model of pipe–soil interaction during large-amplitude lateral displacements for deep-water pipelines. Comput. Geotech. 2020, 117, 103220. [Google Scholar] [CrossRef]
  23. Krabbenhøft, K.; Lyamin, A.V.; Sloan, S.W. Formulation and solution of some plasticity problems as conic programs. Int. J. Solids Struct. 2007, 44, 1533–1549. [Google Scholar] [CrossRef]
  24. Makrodimopoulos, A.; Martin, C.M. Lower bound limit analysis of cohesive-frictional materials using second-order cone programming. Int. J. Numer. Methods Eng. 2006, 66, 604–634. [Google Scholar] [CrossRef]
  25. Makrodimopoulos, A.; Martin, C.M. Upper bound limit analysis using simplex strain elements and second-order cone programming. Int. J. Numer. Anal. Methods Geomech. 2007, 31, 835–865. [Google Scholar] [CrossRef]
  26. Chakraborty, D.; Kumar, J. Uplift Resistance of Interfering Pipelines Buried in Sand. J. Pipeline Syst. Eng. Pract. 2016, 7, 06015002. [Google Scholar] [CrossRef]
  27. Kouretzis, G.P.; Krabbenhøft, K.; Daichao, S.; Scott, W. Sloan. Soil-buried pipeline interaction for vertical downwards relative offset. Can. Geotech. J. 2014, 51, 1087–1094. [Google Scholar] [CrossRef]
  28. Tom, J.G.; White, D.J. Drained Bearing Capacity of Shallowly Embedded Pipelines. J. Geotech. Geoenviron. Eng. 2019, 145, 04019097. [Google Scholar] [CrossRef]
  29. Davis, E.H. Theories of Plasticity and Failure of Soil Masses. In Soil Mechanics: Selected Topics; Lee, I.K., Ed.; Elsevier: New York, NY, USA, 1968; pp. 341–354. [Google Scholar]
  30. Wang, B.; Yuan, M.; Yan, Y.; Yang, K.; Zhang, H.; Liang, Y. Optimal design of an oil pipeline with a large-slope section. Eng. Optim. 2019, 51, 1480–1494. [Google Scholar] [CrossRef]
  31. Zhang, W.; Askarinejad, A. Behaviour of buried pipes in unstable sandy slopes. Landslides 2019, 16, 283–293. [Google Scholar] [CrossRef]
  32. Houlsby, G.T.; Puzrin, A.M. The bearing capacity of a strip footing on clay under combined loading. Proc. R. Soc. Lond. Ser. A Math. Phys. Eng. Sci. 1999, 455, 893–916. [Google Scholar] [CrossRef]
  33. Merifield, R.; White, D.J.; Randolph, M.F. The ultimate undrained resistance of partially embedded pipelines. Géotechnique 2008, 58, 461–470. [Google Scholar] [CrossRef]
  34. Cheuk, C.Y.; White, D.J.; Bolton, M. D Uplift Mechanisms of Pipes Buried in Sand. J. Geotech. Geoenvironmental Eng. 2008, 134, 154–163. [Google Scholar] [CrossRef]
  35. Murray, E.J.; Geddes, J.D. Uplift of Anchor Plates in Sand. J. Geotech. Eng. 1987, 113, 202–215. [Google Scholar] [CrossRef]
  36. Kumar, J. Uplift response of buried pipes in sands using FEM. Indian Geotech. J. 2002, 32, 146–160. [Google Scholar]
  37. Dickin, E.A. Uplift Resistance of Buried Pipelines in Sand. Soils Found. 1994, 34, 41–48. [Google Scholar] [CrossRef]
  38. Krabbenhoft, K.; Karim, M.R.; Lyamin, A.V.; Sloan, S.W. Associated computational plasticity schemes for nonassociated frictional materials. Int. J. Numer. Methods Eng. 2012, 90, 1089–1117. [Google Scholar] [CrossRef]
  39. Katebi, M.; Wijewickreme, D.; Maghoul, P.; Roy, K. Lateral force–displacement response of buried pipes in slopes. Géotechnique 2023, 73, 375–387. [Google Scholar] [CrossRef]
  40. Cocchetti, G.; di Prisco, C.; Galli, A.; Nova, R. Soil–pipeline interaction along unstable slopes: A coupled three-dimensional approach. Part 1: Theoretical formulation. Can. Geotech. J. 2009, 46, 1289–1304. [Google Scholar] [CrossRef]
  41. Matyas, E.L.; Davis, J.B. Prediction of Vertical Earth Loads on Rigid Pipes. J. Geotech. Eng. 1983, 109, 190–201. [Google Scholar] [CrossRef]
  42. Kong, D.; Zhu, J.; Wu, L.; Zhu, B. Break-out resistance of offshore pipelines buried in inclined clayey seabed. Appl. Ocean Res. 2020, 94, 102007. [Google Scholar] [CrossRef]
  43. Kong, D. Quantifying Residual Resistance of Light Pipelines during Large-Amplitude Lateral Displacement Using Sequential Limit Analysis. J. Geotech. Geoenvironmental Eng. 2022, 148, 04022054. [Google Scholar] [CrossRef]
  44. Miyamoto, J.; Sassa, S.; Tsurugasaki, K.; Sumida, H. Wave-Induced Liquefaction and Floatation of a Pipeline in a Drum Centrifuge. J. Waterw. Port Coast. Ocean Eng. 2020, 146, 04019039. [Google Scholar] [CrossRef]
  45. Su, S.; Zhu, J.; Kong, D.; Li, Z.; Zhu, B.; Chen, Y. Modelling wave-seabed-pipe interaction through centrifuge experiment and a double-layered fluid model. Ocean Eng. 2025, 322, 120506. [Google Scholar] [CrossRef]
Figure 1. Configuration of the numerical model.
Jmse 13 01669 g001
Figure 2. Comparison of uplift bearing capacity against embedment.
Jmse 13 01669 g002
Figure 3. Breakout resistances corresponding to probing angles using different analysis methods.
Jmse 13 01669 g003
Figure 4. Failure mechanisms corresponding to different analysis methods. w/D = 3.0, φ = 32°, and β = 0°.
Jmse 13 01669 g004
Figure 5. Ultimate breakout resistances corresponding to probing angles under different friction angles. β = 10°.
Jmse 13 01669 g005
Figure 6. Failure mechanisms corresponding to different probing angles. w/D = 3.0, φ = 36°, and β = 10°.
Jmse 13 01669 g006
Figure 7. Failure mechanisms corresponding to Pu,b under different seabed friction angles. Rough pipe, w/D = 3.0 and β = 10°.
Jmse 13 01669 g007
Figure 8. Ultimate breakout resistances corresponding to probing angles under different seabed inclined angles. Rough pipe, φ = 32°.
Jmse 13 01669 g008
Figure 9. Failure mechanisms corresponding to Pu,b under different seabed inclined angles. Rough pipe, w/D = 3.0 and φ = 32°.
Jmse 13 01669 g009
Figure 10. Angles between the most vulnerable plane and the upright plane against seabed angle.
Jmse 13 01669 g010
Figure 11. Failure mechanisms corresponding to Pu,b under different seabed friction angles. β = 20°, and w/D = 3.0.
Jmse 13 01669 g011
Figure 12. Variation in Pu,u and Pu,b against embedment.
Jmse 13 01669 g012
Table 1. Summary of model parameters.
ParametersValues
Submerged unit weight (γ′)10 kN/m3
Friction angle (φ)24°~44°, interval of 4°
Inclined seabed angle (β)0°~20°, interval of 5°
Roughness of pipe–soil interfaceRough, smooth
Tension of pipe–soil interfaceNo tension
Pipe embedment depth (w)1.5~8.0 D, at interval of 0.5 D
Table 2. Breakout resistance ratio Pu,b/FBE for smooth pipe.
φ = 24°φ = 28°φ = 32°
w/Dβ = 0°β = 5°β = 10°β = 15°β = 20°β = 0°β = 5°β = 10°β = 15°β = 20°β = 0°β = 5°β = 10°β = 15°β = 20°
1.5 0.48 0.47 0.43 0.37 0.23 0.54 0.53 0.50 0.45 0.37 0.56 0.55 0.52 0.47 0.41
2.0 0.70 0.68 0.64 0.57 0.39 0.78 0.77 0.72 0.65 0.56 0.80 0.79 0.75 0.68 0.60
2.5 0.82 0.80 0.76 0.68 0.49 0.93 0.91 0.86 0.78 0.67 0.94 0.93 0.88 0.81 0.71
3.0 0.91 0.89 0.84 0.75 0.56 1.03 1.01 0.96 0.87 0.75 1.04 1.03 0.97 0.89 0.78
3.5 0.97 0.95 0.90 0.81 0.61 1.11 1.09 1.03 0.94 0.81 1.12 1.10 1.04 0.96 0.84
4.0 1.02 1.00 0.94 0.85 0.66 1.17 1.15 1.09 0.99 0.86 1.18 1.16 1.10 1.01 0.89
4.5 1.06 1.04 0.98 0.88 0.70 1.22 1.20 1.13 1.03 0.90 1.22 1.20 1.14 1.05 0.93
5.0 1.09 1.07 1.01 0.91 0.73 1.26 1.24 1.17 1.07 0.93 1.26 1.24 1.18 1.08 0.96
5.5 1.12 1.09 1.03 0.93 0.75 1.29 1.27 1.20 1.10 0.96 1.30 1.28 1.21 1.11 0.98
6.0 1.13 1.11 1.05 0.95 0.78 1.32 1.30 1.23 1.12 0.98 1.32 1.30 1.24 1.13 1.00
φ = 36°φ = 40°φ = 44°
w/Dβ = 0°β = 5°β = 10°β = 15°β = 20°β = 0°β = 5°β = 10°β = 15°β = 20°β = 0°β = 5°β = 10°β = 15°β = 20°
1.5 0.54 0.53 0.51 0.46 0.41 0.53 0.52 0.50 0.46 0.41 0.52 0.51 0.49 0.46 0.41
2.0 0.76 0.75 0.71 0.66 0.58 0.74 0.73 0.69 0.64 0.57 0.73 0.72 0.68 0.64 0.57
2.5 0.89 0.88 0.83 0.77 0.68 0.86 0.84 0.81 0.74 0.67 0.84 0.82 0.79 0.74 0.66
3.0 0.97 0.96 0.91 0.84 0.75 0.93 0.92 0.88 0.81 0.73 0.91 0.90 0.86 0.80 0.72
3.5 1.04 1.02 0.97 0.90 0.80 0.98 0.97 0.93 0.86 0.77 0.96 0.95 0.91 0.84 0.76
4.0 1.08 1.07 1.02 0.94 0.83 1.03 1.01 0.97 0.90 0.80 1.00 0.98 0.94 0.88 0.79
4.5 1.12 1.10 1.05 0.97 0.86 1.06 1.04 1.00 0.92 0.83 1.03 1.01 0.97 0.90 0.81
5.0 1.15 1.13 1.08 1.00 0.89 1.09 1.07 1.02 0.95 0.85 1.05 1.04 0.99 0.92 0.83
5.5 1.18 1.16 1.10 1.02 0.91 1.11 1.09 1.04 0.96 0.86 1.07 1.05 1.01 0.94 0.84
6.0 1.20 1.18 1.12 1.04 0.92 1.13 1.11 1.06 0.98 0.88 1.09 1.07 1.02 0.95 0.86
Table 3. Breakout resistance ratio Pu,b/FBE for rough pipe.
φ = 24°φ = 28°φ = 32°
w/Dβ = 0°β = 5°β = 10°β = 15°β = 20°β = 0°β = 5°β = 10°β = 15°β = 20°β = 0°β = 5°β = 10°β = 15°β = 20°
1.5 0.64 0.63 0.59 0.52 0.36 0.71 0.70 0.67 0.62 0.53 0.74 0.73 0.70 0.65 0.58
2.0 0.85 0.84 0.80 0.71 0.51 0.95 0.94 0.90 0.83 0.71 0.98 0.96 0.92 0.86 0.77
2.5 0.97 0.95 0.90 0.82 0.60 1.09 1.07 1.02 0.94 0.82 1.11 1.09 1.05 0.97 0.87
3.0 1.04 1.03 0.98 0.88 0.66 1.18 1.16 1.11 1.02 0.89 1.20 1.18 1.13 1.05 0.93
3.5 1.10 1.08 1.03 0.93 0.71 1.25 1.23 1.17 1.07 0.94 1.26 1.24 1.19 1.10 0.98
4.0 1.14 1.12 1.06 0.96 0.75 1.30 1.28 1.22 1.12 0.98 1.31 1.29 1.23 1.14 1.01
4.5 1.17 1.16 1.09 0.99 0.78 1.34 1.32 1.26 1.15 1.01 1.35 1.33 1.27 1.17 1.04
5.0 1.20 1.18 1.12 1.01 0.80 1.38 1.36 1.29 1.18 1.04 1.38 1.36 1.30 1.20 1.06
5.5 1.23 1.20 1.14 1.03 0.83 1.41 1.39 1.32 1.20 1.06 1.41 1.39 1.32 1.22 1.08
6.0 1.25 1.22 1.15 1.04 0.84 1.43 1.41 1.34 1.22 1.07 1.43 1.41 1.34 1.24 1.10
φ = 36°φ = 40°φ = 44°
w/Dβ = 0°β = 5°β = 10°β = 15°β = 20°β = 0°β = 5°β = 10°β = 15°β = 20°β = 0°β = 5°β = 10°β = 15°β = 20°
1.5 0.73 0.72 0.69 0.64 0.58 0.73 0.72 0.69 0.65 0.59 0.74 0.73 0.70 0.66 0.60
2.0 0.94 0.93 0.89 0.84 0.75 0.93 0.91 0.88 0.83 0.75 0.93 0.92 0.89 0.83 0.76
2.5 1.05 1.04 1.00 0.93 0.84 1.03 1.01 0.97 0.91 0.83 1.02 1.01 0.97 0.91 0.83
3.0 1.12 1.11 1.06 0.99 0.89 1.09 1.07 1.03 0.97 0.88 1.07 1.06 1.02 0.96 0.87
3.5 1.17 1.16 1.11 1.03 0.93 1.13 1.11 1.07 1.00 0.91 1.11 1.09 1.05 0.99 0.90
4.0 1.21 1.20 1.15 1.07 0.95 1.16 1.14 1.10 1.03 0.93 1.13 1.12 1.08 1.01 0.92
4.5 1.24 1.22 1.17 1.09 0.98 1.18 1.16 1.12 1.04 0.94 1.15 1.14 1.09 1.02 0.93
5.0 1.26 1.25 1.19 1.11 0.99 1.19 1.18 1.13 1.06 0.95 1.16 1.15 1.11 1.04 0.94
5.5 1.28 1.26 1.21 1.12 1.00 1.21 1.20 1.15 1.07 0.96 1.18 1.16 1.12 1.05 0.95
6.0 1.30 1.28 1.22 1.13 1.01 1.22 1.21 1.16 1.08 0.97 1.19 1.17 1.13 1.05 0.95
Disclaimer/Publisher’s Note: The statements, opinions and data contained in all publications are solely those of the individual author(s) and contributor(s) and not of MDPI and/or the editor(s). MDPI and/or the editor(s) disclaim responsibility for any injury to people or property resulting from any ideas, methods, instructions or products referred to in the content.