Article

Mobilization of PAHs by Wave-Induced Resuspension and Liquefaction in Silty Sediment

1
College of Ocean Science and Engineering, Shandong University of Science and Technology, Qingdao 266590, China
2
Laboratory for Marine Geology, Qingdao Marine Science and Technology Center, Qingdao 266237, China
3
Key Laboratory of Marine Sedimentology and Environmental Geology, First Institute of Oceanography, Ministry of Natural Resources, Qingdao 266061, China
*
Author to whom correspondence should be addressed.
J. Mar. Sci. Eng. 2025, 13(9), 1661; https://doi.org/10.3390/jmse13091661
Submission received: 4 August 2025 / Revised: 24 August 2025 / Accepted: 27 August 2025 / Published: 29 August 2025

Abstract

Silty seabed sediments in the subaqueous delta of the Yellow River are heavily contaminated with petroleum-derived polycyclic aromatic hydrocarbons (PAHs). Storm-induced sediment resuspension and liquefaction are key mechanisms responsible for the remobilization of PAHs into the overlying water column. In this study, laboratory-scale wave flume experiments were conducted to simulate PAH release under three hydrodynamic scenarios: (i) static diffusion (Stage I), (ii) low-intensity wave action (5 cm wave height, Stage II), and (iii) high-intensity wave action (12 cm wave height, Stage III). Results revealed a strong positive correlation between suspended particulate matter (SPM) and PAH concentrations in the aqueous phase during sediment disturbance. In particular, sediment liquefaction significantly enhanced PAH release, with concentrations up to five times higher than those under static conditions. Furthermore, liquefaction facilitated vertical migration of PAHs within sediments, resulting in reductions in PAH levels below the original background concentrations. The release dynamics varied notably among PAH species: low-molecular-weight (2–3 ring) PAHs, with lower hydrophobicity, were primarily detected in the aqueous phase, while medium- and high-molecular-weight PAHs remained predominantly associated with sediment particles. These findings underscore the critical role of hydrodynamic disturbances—especially sediment liquefaction—in influencing PAH mobility and offer important implications for pollution risk assessment and coastal management in storm-impacted deltaic environments.

1. Introduction

The combustion of spilled oil significantly reduces its volume on the water surface, thereby decreasing the concentration of toxic compounds such as polycyclic aromatic hydrocarbons (PAHs). As major constituents of petroleum hydrocarbons, PAHs are predominantly formed through incomplete combustion processes and are well-documented for their teratogenic, carcinogenic, and mutagenic effects [1,2]. In marine environments, PAHs exist in three principal forms: dissolved in water, adsorbed onto suspended particulate matter, and predominantly deposited in sediments [3]. The distribution of PAHs between the aqueous and particulate phases is governed by dynamic exchange processes, including deposition, resuspension, and molecular diffusion between porewater and overlying water.
Marine sediments function as both sinks and secondary sources of PAHs, playing a pivotal role in their environmental fate [4,5]. Physical disturbances such as tidal movements, wind-driven currents, and wave activity can resuspend bottom sediments, leading to the reintroduction of associated pollutants into the water column [6,7,8]. Previous studies have demonstrated that sediment resuspension significantly influences PAH migration across the sediment–water interface, with desorption from resuspended particles being a dominant release pathway [9,10]. This process is largely driven by wave-induced pressure gradients, which facilitate porewater flow from high- to low-pressure zones within sediments, promoting PAH transport into the overlying water [11]. In addition, salinity has been shown to enhance the accumulation of both dissolved and particle-bound PAHs in the water column during the early stages of sediment resuspension and deposition [12]. To isolate the effects of wave action, our experimental conditions maintained constant temperature and salinity.
The transport and transformation of PAHs at the sediment–water interface are influenced by a range of environmental parameters, including sediment characteristics (e.g., grain size, organic matter content, mineral composition), physicochemical conditions (e.g., temperature, pH, coexisting ions, colloids), and dynamic factors such as hydrodynamic forces and bioturbation [13,14]. Furthermore, the physicochemical properties of individual PAH compounds—namely, molecular weight, number of aromatic rings, and hydrophobicity—affect their mobility and partitioning behavior [14,15,16]. Wave-induced shear stress has been identified as a critical factor influencing both the magnitude and rate of PAH release. Elevated shear stress not only increases overall PAH mobilization but also enhances the release rate, particularly of low-molecular-weight PAHs (e.g., two- to three-ring structures), which are more susceptible to desorption under turbulent conditions [17,18].
The Yellow River subaqueous delta, situated within the semi-enclosed Bohai Sea, is subject to significant oil pollution resulting from anthropogenic activities such as offshore oil extraction, transportation, and accidental spills. The seabed sediments in this region are particularly susceptible to liquefaction, a process that mobilizes fine-grained subsurface sediments and facilitates their transport into the overlying water column. While the release of oil-derived pollutants during sediment resuspension has been extensively studied in freshwater environments—such as lakes, rivers, and estuaries—limited attention has been given to the behavior and migration of polycyclic aromatic hydrocarbons (PAHs) during wave-induced sediment liquefaction in marine settings.
This study aims to investigate the release and migration dynamics of PAHs from marine sediments under varying wave conditions, employing a controlled wave flume system capable of simulating sediment liquefaction. The findings are expected to provide a scientific basis for evaluating the potential environmental risks and quantifying the release of PAHs in the Yellow River subaqueous delta.

2. Materials and Methods

2.1. Experiment Material

The sediments were collected from the surface layer of the Diao Kou Pile tidal flat at the Yellow River Estuary as presented in Figure 1.
Sediment samples were collected manually using a box sampler and stored in nylon bags. The pretreatment involved crushing the samples, removal of impurities (e.g., grass and branches), air-drying at room temperature in a ventilated, shaded environment, and thorough homogenization by manual mixing. The homogenized sediment was then sieved through an 80-mesh sieve (180 µm) to remove coarse debris while retaining the fine fraction most relevant for PAH adsorption and binding. This approach is consistent with standard sediment preparation methods in PAH studies, such as U.S. EPA Methods 8260D [19] and 8275A [20], which recommend sieving to remove coarse debris before analysis, and USGS sediment protocols, which commonly use an 80-mesh screen to retain the fine, PAH-binding fraction. Although a very small portion of the finest particles may have been lost during sieving, the impact on total PAH concentrations is expected to be minimal. The primary components of the soil samples were silt, sand, and clay, with a clay content of 15%, organic matter content of 1.39%, and PAHs content of 13.81 mg/kg. Artificial seawater with a salinity of 35 was prepared by dissolving sea crystals in clean water, which was used as overlying water for the experiment.
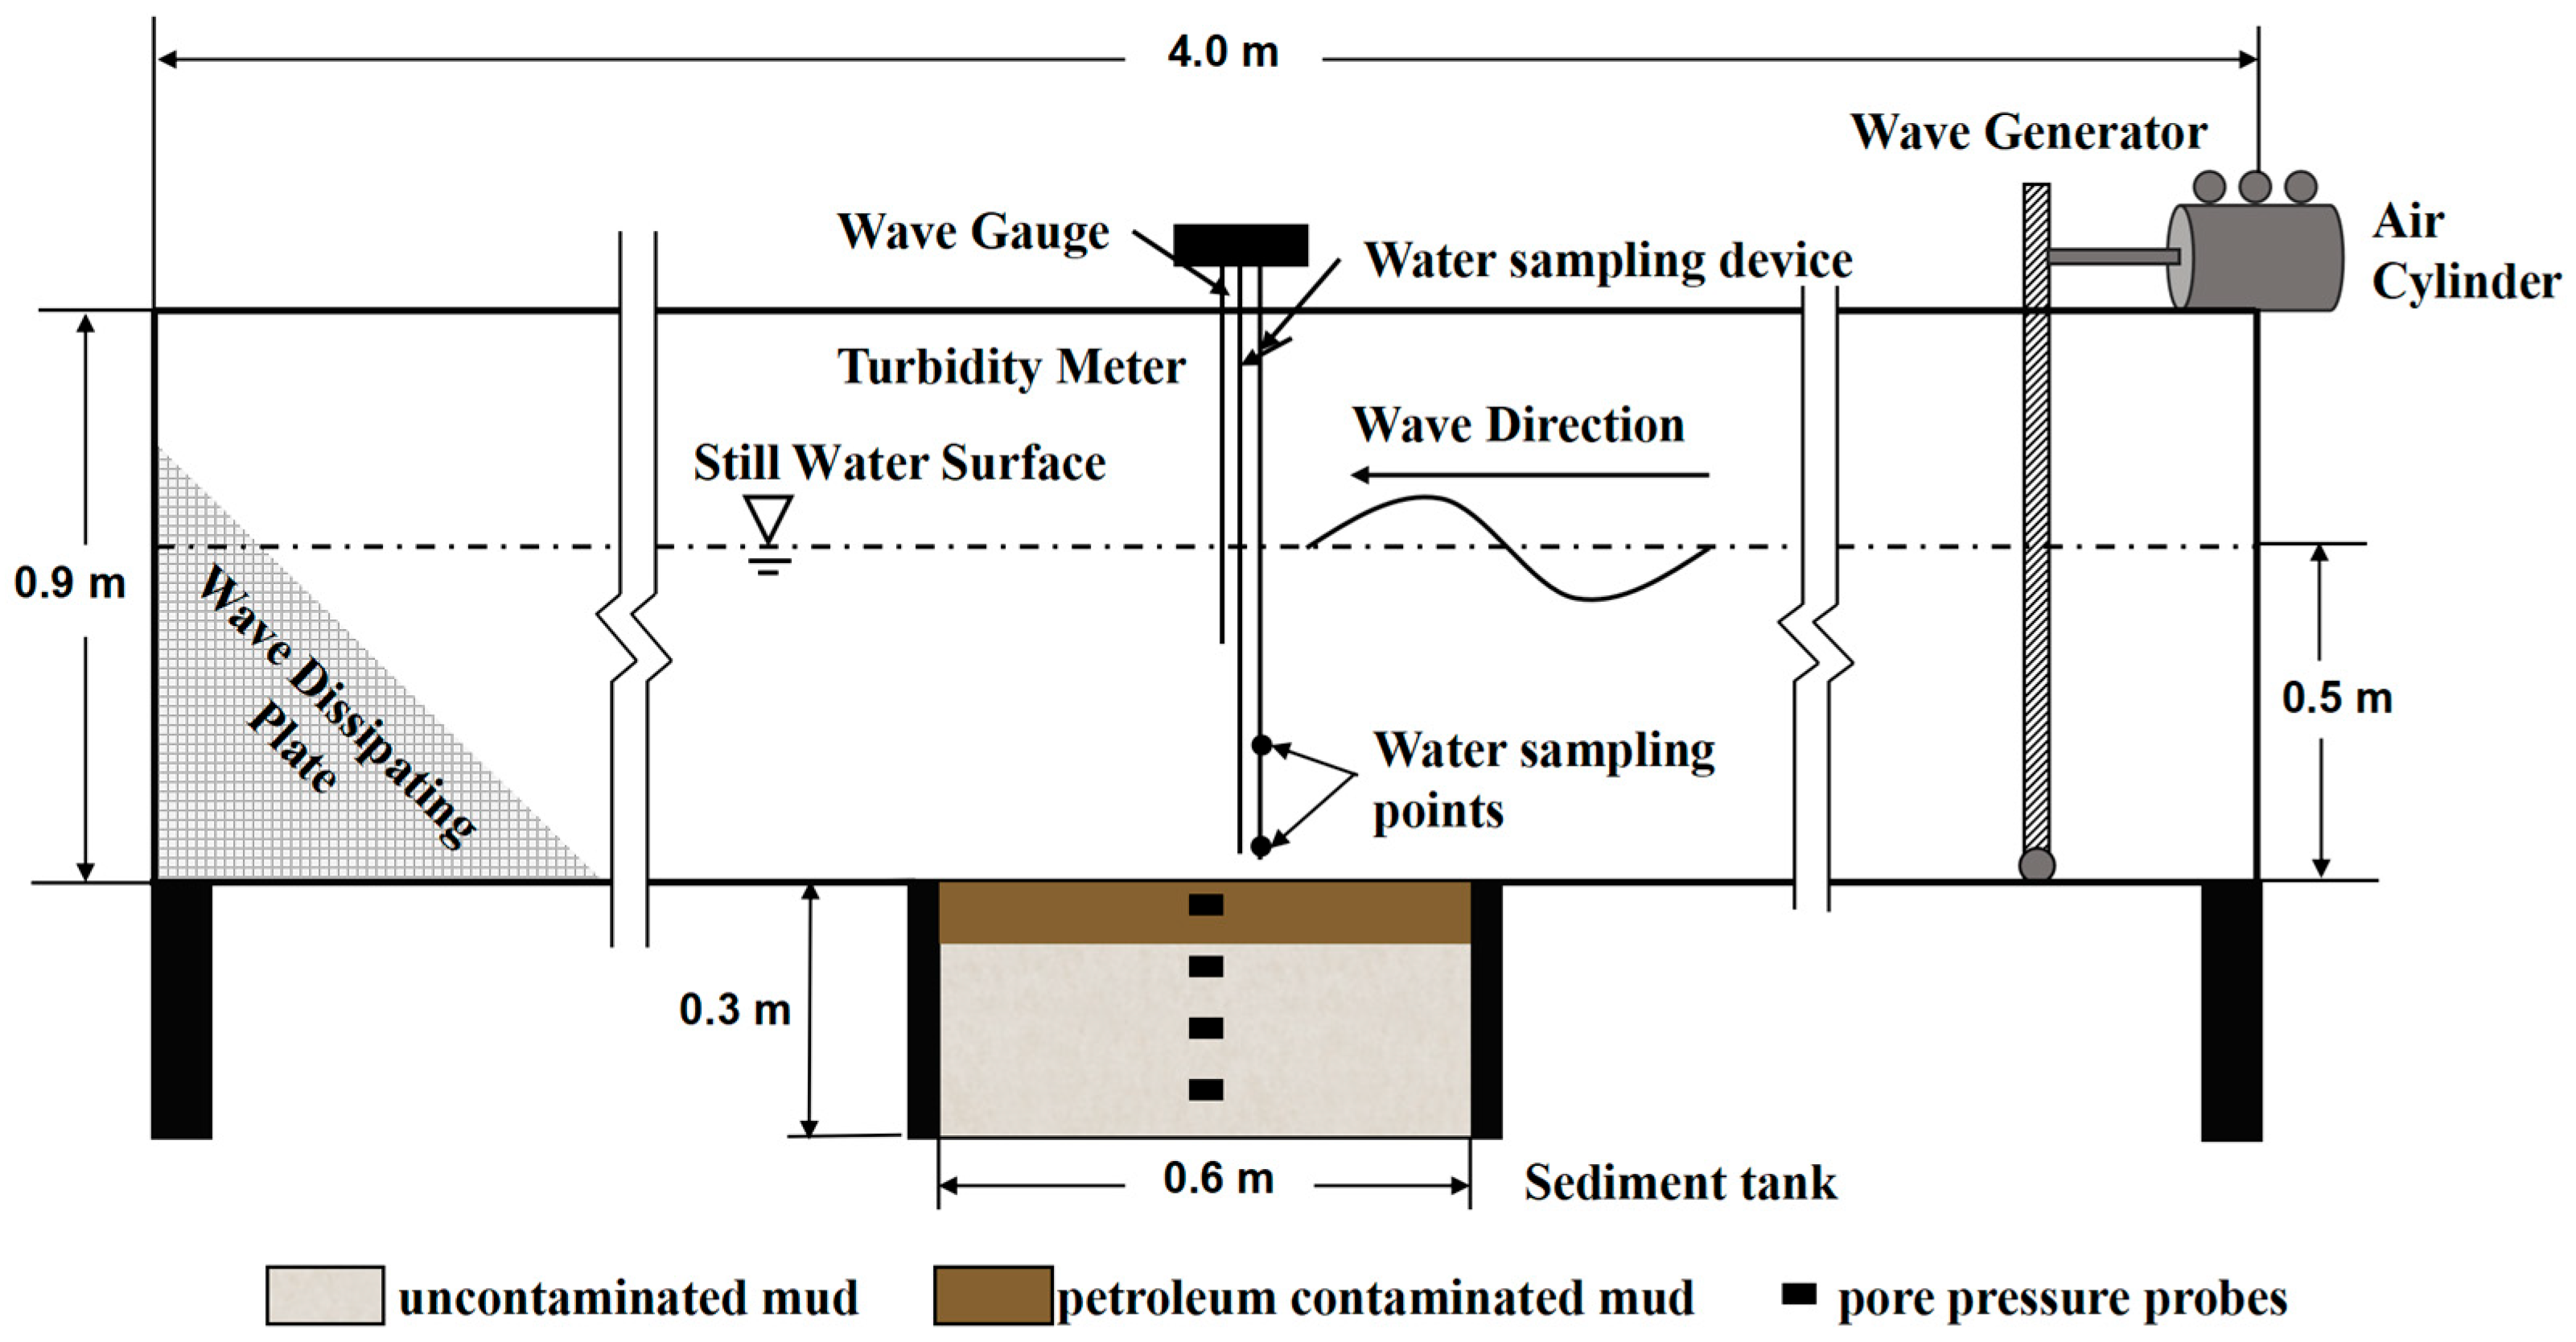
The wave flume (4 m × 0.4 m × 1.0 m) used in this study is shown in Figure 2. The sediment tank (0.6 m × 0.4 m × 0.3 m) was positioned at the center of the flume bottom. A wave generator is located on the right side of the flume, which reciprocally pushes the water to form waves. A wave-absorbing device is installed on the left side of the flume to reduce the interference caused by wave reflection. The capacitive wave gauge (RBR, Ottawa, ON, Canada) is installed in the middle of the flume to collect wave height and wave period during the experiment, and the entire system is automatically controlled by a computer.
The turbidity meter (JFE Advantech Co., Ltd., Nishinomiya, Hyogo, Japan), an infrared backscattering-type sensor with a measurement range of 0–1000 FTU, a resolution of 0.03 FTU, and a measurement uncertainty of ±2% was mounted on a custom bracket at the top of the flume. Its probe was positioned 5 cm above the sediment bed, aligned with the water sampling point, to monitor suspended sediment concentration dynamics. Calibration was performed using standard suspensions, prepared by mixing known soil masses with 1 L of water to achieve target concentrations. For each concentration, three repeated measurements were taken and averaged, yielding an excellent linear relationship between measured and theoretical values (R2 = 0.998).
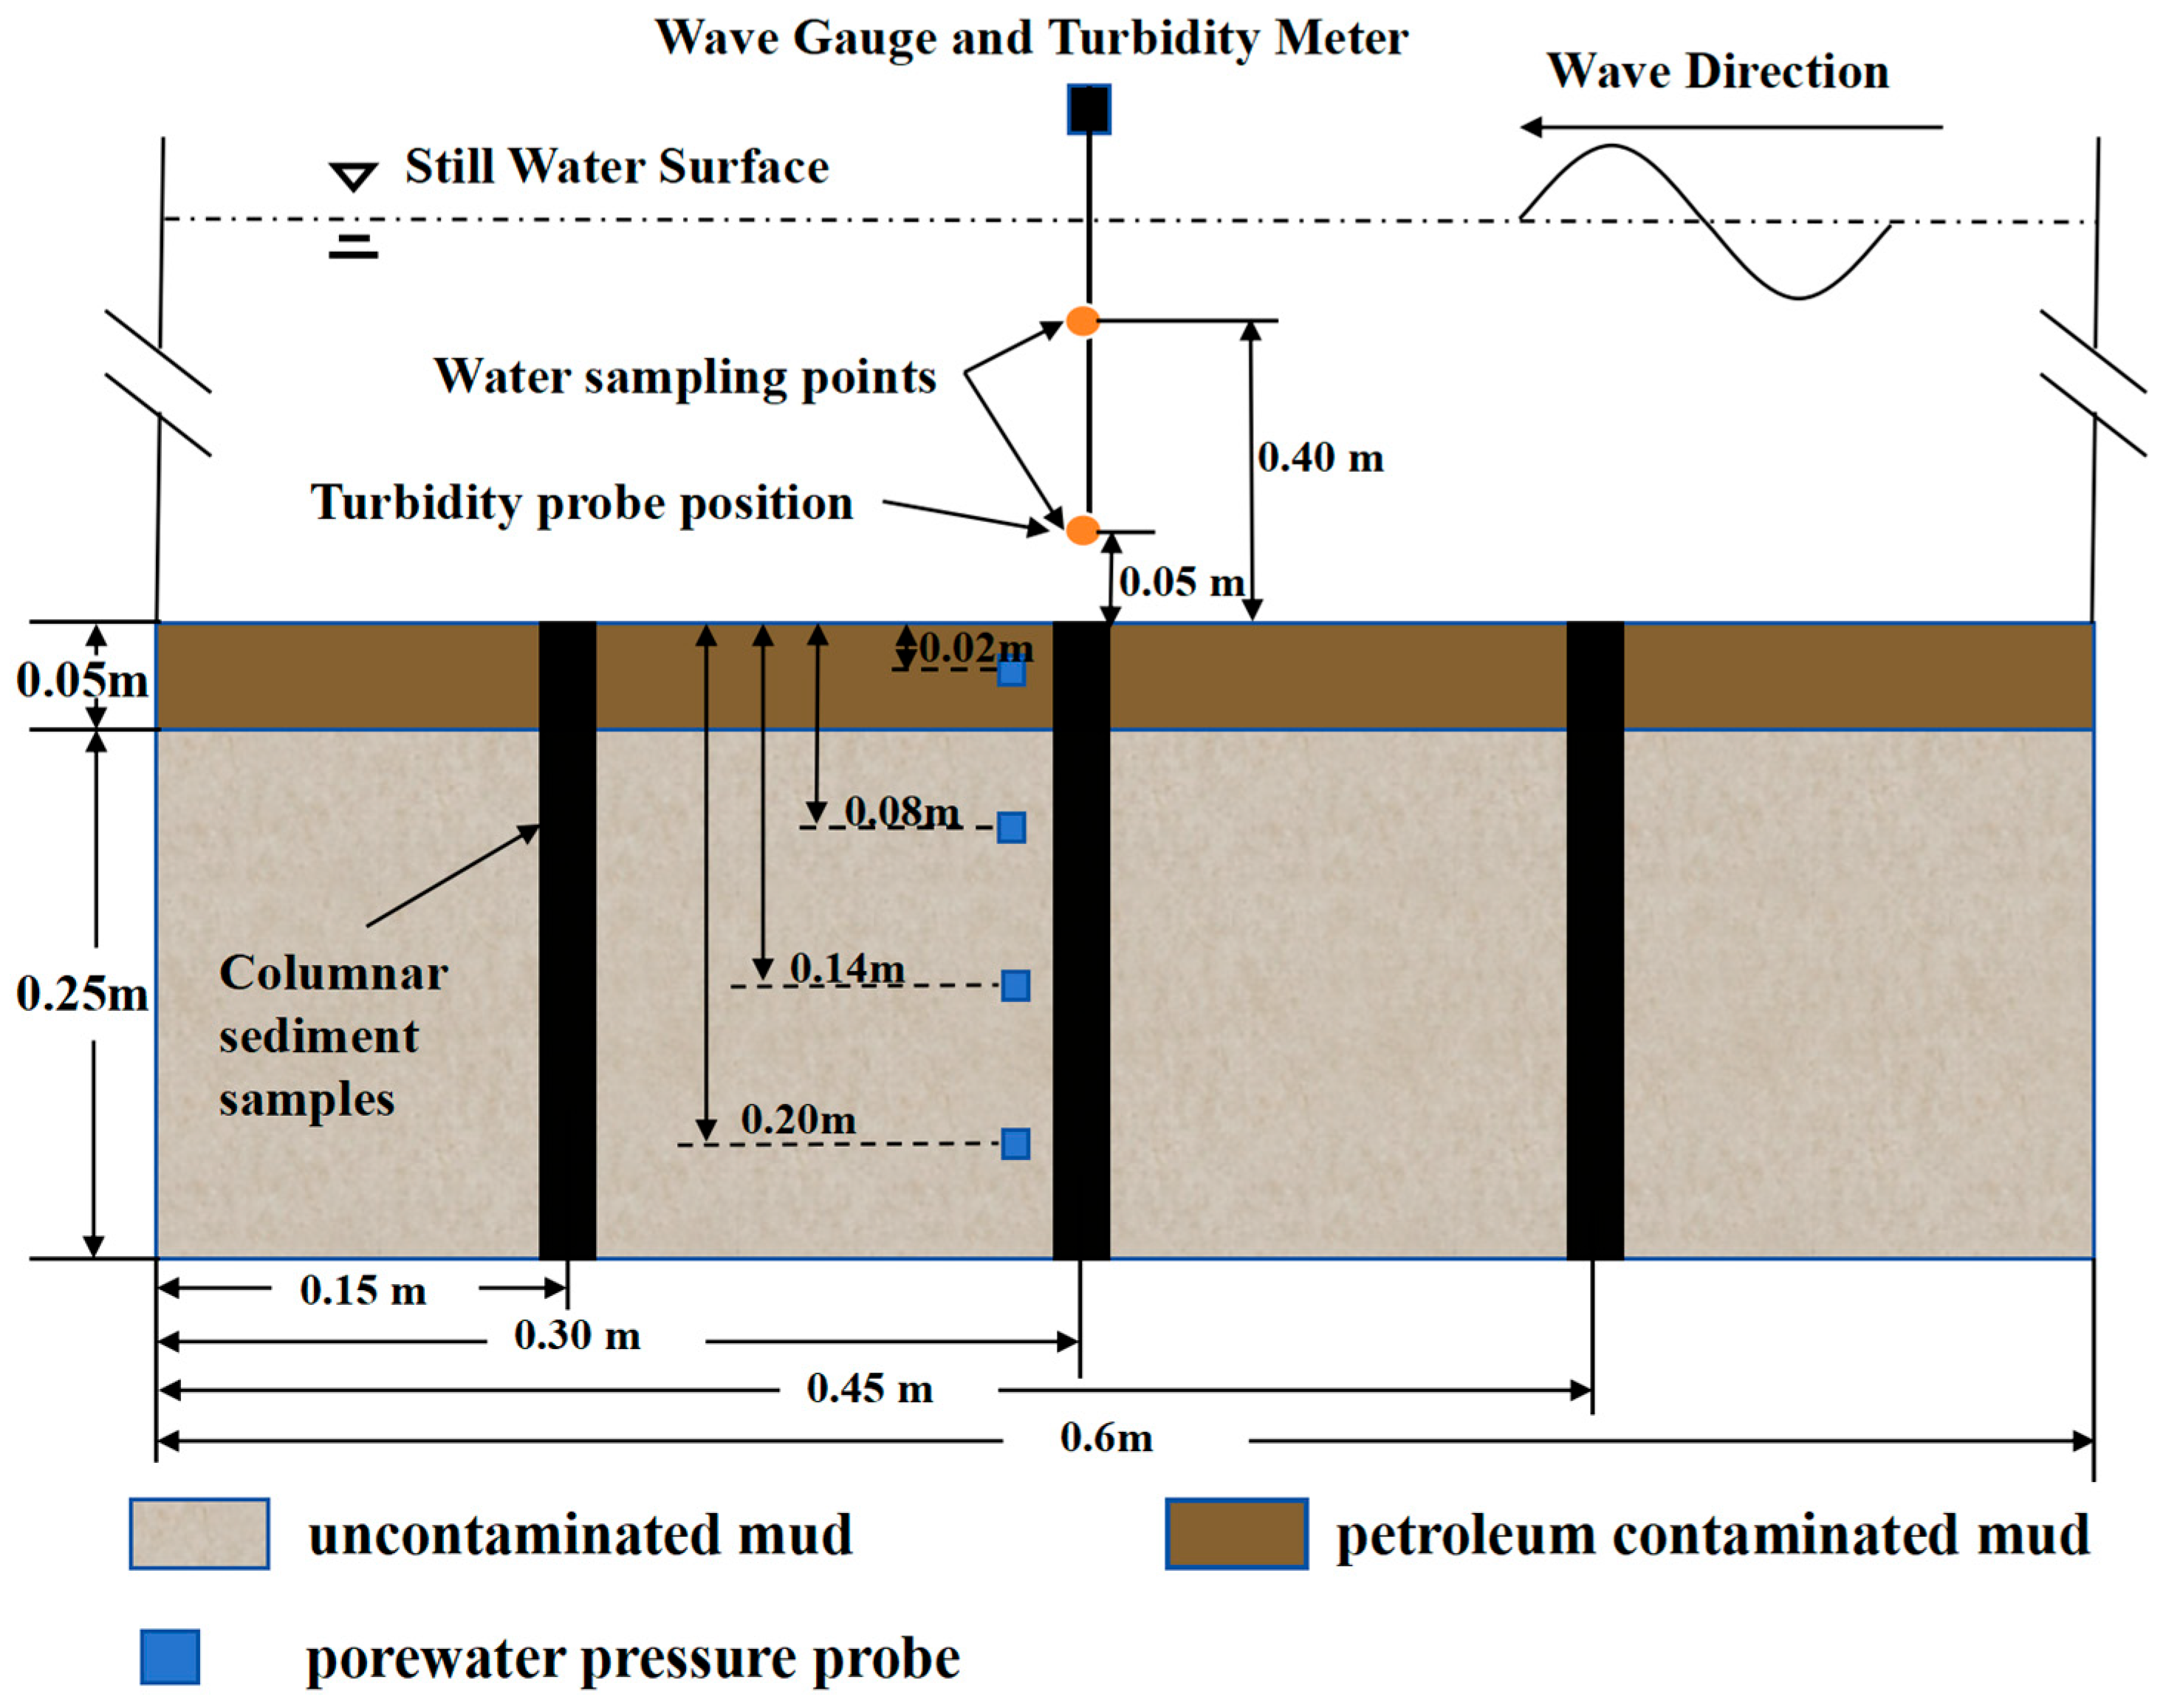
Porewater pressure was measured using a DEWE-43 Transient Data Acquisition System (DEWESoft d.o.o., Trbovlje, Slovenia), with CYY2 sensors (measuring range: 0–100 kPa; resolution: 0.005 kPa, measurement uncertainty: 0.2% FS) connected to the data logger to convert voltage signals into porewater pressure data, which were then transmitted to a computer. The sensor probes were embedded at depths of 2, 8, 14, and 20 cm within the sediment to monitor porewater pressure variations, as illustrated in Figure 3. The pore pressure sensor is immersed in clear water for 24 h before burial and continuously shakes sufficiently to ensure that the internal air is completely discharged. The porewater pressure probes were calibrated at depths of 0–50 cm in 10 cm intervals by comparing probe readings with theoretical hydrostatic pressures. The calibration showed excellent agreement, with R2 = 0.999.

2.2. Configuration of Flume Experiment

The oil-saturated solution was prepared by placing approximately half of the artificial seawater in a plastic bucket, followed by the dropwise addition of excess light crude oil onto the water surface. The mixture was thoroughly stirred and allowed to stand for 1–2 days to achieve saturation. The oil-saturated solution was then collected from the bottom of the bucket using a rubber hose, and the oil concentration was determined to be 15.25 mg/L by ultraviolet spectrophotometry.
Subsequently, 8.5 kg of the oil-saturated seawater was mixed with 30.0 kg of dry soil in a sealed vessel using a low-speed twin-screw mixer for 60 min to ensure uniform contaminant distribution while minimizing volatilization losses. The resulting slurry was sealed, stored in darkness at low temperature, and allowed to equilibrate for 1 day before being used for sediment preparation.
The clean soil slurry was prepared by mixing 100.0 kg dry soil with 30.0 kg artificial seawater, and has the same water content as the contaminated soil slurry. Transfer the prepared clean soil slurry to the bottom of the flume until the slurry height reaches 0.25 m, and evenly spread a 5 cm thick layer of oil-containing contaminated soil slurry on top of it (Figure 3), resulting in a total thickness of 0.30 m for the bottom bed sediment. After the bottom bed is paved, slowly add artificial seawater into the flume until the water depth reaches 0.50 m.

2.3. Flume Experiment Procedure

The flume experiment was divided into three stages: Static diffusion stage (Stage I), 5 cm wave height stage (Stage II), and 12 cm wave height stage (Stage III). The selection of wave heights in this study was based on previous experiments conducted in the same flume [21], which ensured the chosen wave parameters were able to meet the requirements of different experimental stages.
In Stage I, the overlying water was static, and the bottom sediments were in a state of static diffusion, lasting for 40 h. Stage II and III were wave action states, with each wave height lasting 120 and 150 min, respectively. During Stage I, two bottles of 500 mL water samples were taken at 0.30 m on the left side of the bed, 0.05 m and 0.20 m above the sediment (Figure 3) with a self-made water sample sampler at intervals of 8 h. One of the bottles was filtered to obtain the filtrate, which was acidified with sulfuric acid and stored at low temperature (4 °C) to determine the concentration of PAHs. In Stage II and III, water samples were taken at 10-min intervals for the first 60 min and 20-min intervals for the next 120 min after the wave height had stabilized. The sampling locations and methods were the same as in Stage I. The experimental wave parameters and experimental process are shown in Table 1.
At the end of each stage, sediment core samples of 11, 11.5, and 15 cm in length were collected using a self-made PVC tube sampler at distances of 15 cm, 30 cm, and 45 cm from the left edge of the sediment flume (Figure 3). The core samples were then sectioned to determine the PAHs content at different depths within the bed sediment.

2.4. Analytical Methods of the Samples

The method for determining PAHs content in water samples refers to National Ecological and Environmental Standards of the People’s Republic of China GBT 26411-2010 [22]. The water samples obtained from the sink were subjected to solid phase extraction on an SPE device (Supelco, Bellefonte, PA, USA) using an HLB solid phase extraction column (Waters Corporation, Milford, MA, USA). Before passing through the column, the sample was activated and equilibrated by 5 mL of n-hexane, dichloromethane, methanol, and ultrapure water, and the SPE column was eluted with 10 mL of a mixture of dichloromethane and n-hexane (v:v = 3:7) after extraction. The eluent was concentrated using a quantitative concentrator (LabTech, Inc., Sarasota, FL, USA), concentrated to about 2 mL, and the eluent was exchanged to n-hexane. Then, it continued to be concentrated and quantified to 0.9 mL. After adding 0.1 mL of decachlorobiphenyl as an internal standard, 7890A-5975C Gas Chromatography-Mass Spectrometry System (Agilent Technologies, Santa Clara, CA, USA) was used for analysis and testing.
The method for determining PAHs content in sediment samples refers to National Ecological and Environmental Standards of the People’s Republic of China HJ 805-2016 [23]. Sediment samples obtained from the soil tanks were lyophilized by a Freeze Dryer (Martin Christ Gefriertrocknungsanlagen GmbH, Osterode am Harz, Germany), 20 g of the sample were accurately weighed, and they were extracted using an Accelerated Solvent Extractor ASE 300 (Thermo Fisher Scientific, Sunnyvale, CA, USA). The extraction conditions were as follows: extraction solvent acetone and dichloromethane (v:v = 1:1), heating temperature of 100 °C, extraction pressure of 1500 psi (1 psi = 6.895 kPa), static cycle 3 times. The extract was collected, concentrated by quantitative concentrate, and the solvent was converted to n-hexane, and then purified by chromatography column. A 70 mL eluent of dichloromethane and n-hexane (v:v = 3:7) was prepared to elute and purify the PAHs components on the purification column. The eluate was concentrated to about 2 mL by a quantitative concentrator, then the solvent was converted to n-hexane and continued to be concentrated to 0.9 mL. Then, 0.1 mL of decachlorobiphenyl (PCB) was added as the internal standard, and analyzed and tested by GC/MS.
Polycyclic aromatic hydrocarbons (PAHs) in water and sediment samples were analyzed using gas chromatography–mass spectrometry (GC/MS). The instrument was equipped with a HP-5MS capillary column (30 m × 0.25 mm × 0.25 μm). Helium was used as the carrier gas at a constant flow rate of 1.0 mL/min. The injector temperature was maintained at 280 °C under splitless mode, with an injection volume of 1.0 μL. The oven temperature program was set as follows: initial temperature at 80 °C held for 2 min; ramped at 20 °C/min to 180 °C, held for 5 min; then ramped at 10 °C/min to 290 °C, and held for another 5 min. Mass spectrometric detection was performed using an electron ionization (EI) source at an ionization energy of 70 eV and an ion source temperature of 230 °C. The mass scanning range was m/z 45–500. Qualitative identification of PAHs was achieved through spectral library matching and retention time comparison under full-scan mode. Quantification was performed using the internal standard method.
The method quantification limits (LOQs) and detection limits (LODs) for individual PAHs in sediment and water are listed in Table 2.

2.5. Data Statistical Analysis

Statistical analyses were performed using SPSS 26.0 software. The normality of the parameters was examined using the Shapiro–Wilk test, which is more suitable for relatively small sample sizes. The Spearman rank correlation coefficient was employed to assess the monotonic associations between parameters. Unlike Pearson correlation, which assumes linearity and normality, Spearman correlation is designed to capture monotonic rather than strictly linear relationships, making it more robust for datasets with non-normal distributions or potential outliers.

2.6. Quality Control

All reagents were of HPLC grade, and all analytical procedures were conducted in accordance with the GB/T 26411-2010 for seawater Chinese [22] and national standards HJ 805-2016 for sediments [23]. Quality assurance was maintained through the analysis of blanks and duplicate samples after every 10 runs. Certified reference materials (No. GBW08737 for water and No. GBW07352 for sediments) were employed to verify method accuracy and ensure the reliability of analytical results. Calibration curves for PAHs analysis were established using a mixed standard solution of 16 PAHs (GBW08737) at six concentrations (10 μg/L, 25 μg/L, 50 μg/L, 100 μg/L, 250 μg/L, and 500 μg/L, prepared in n-hexane), with coefficients of determination (R2) consistently ≥0.995. Recoveries of 65.4–103.0% for aqueous samples and 73.0–98.5% for sediments were obtained, confirming acceptable analytical precision and accuracy. Consequently, the raw data were used directly for subsequent analysis.

3. Results

3.1. Characteristics of Porewater Pressure Changes in Sediments

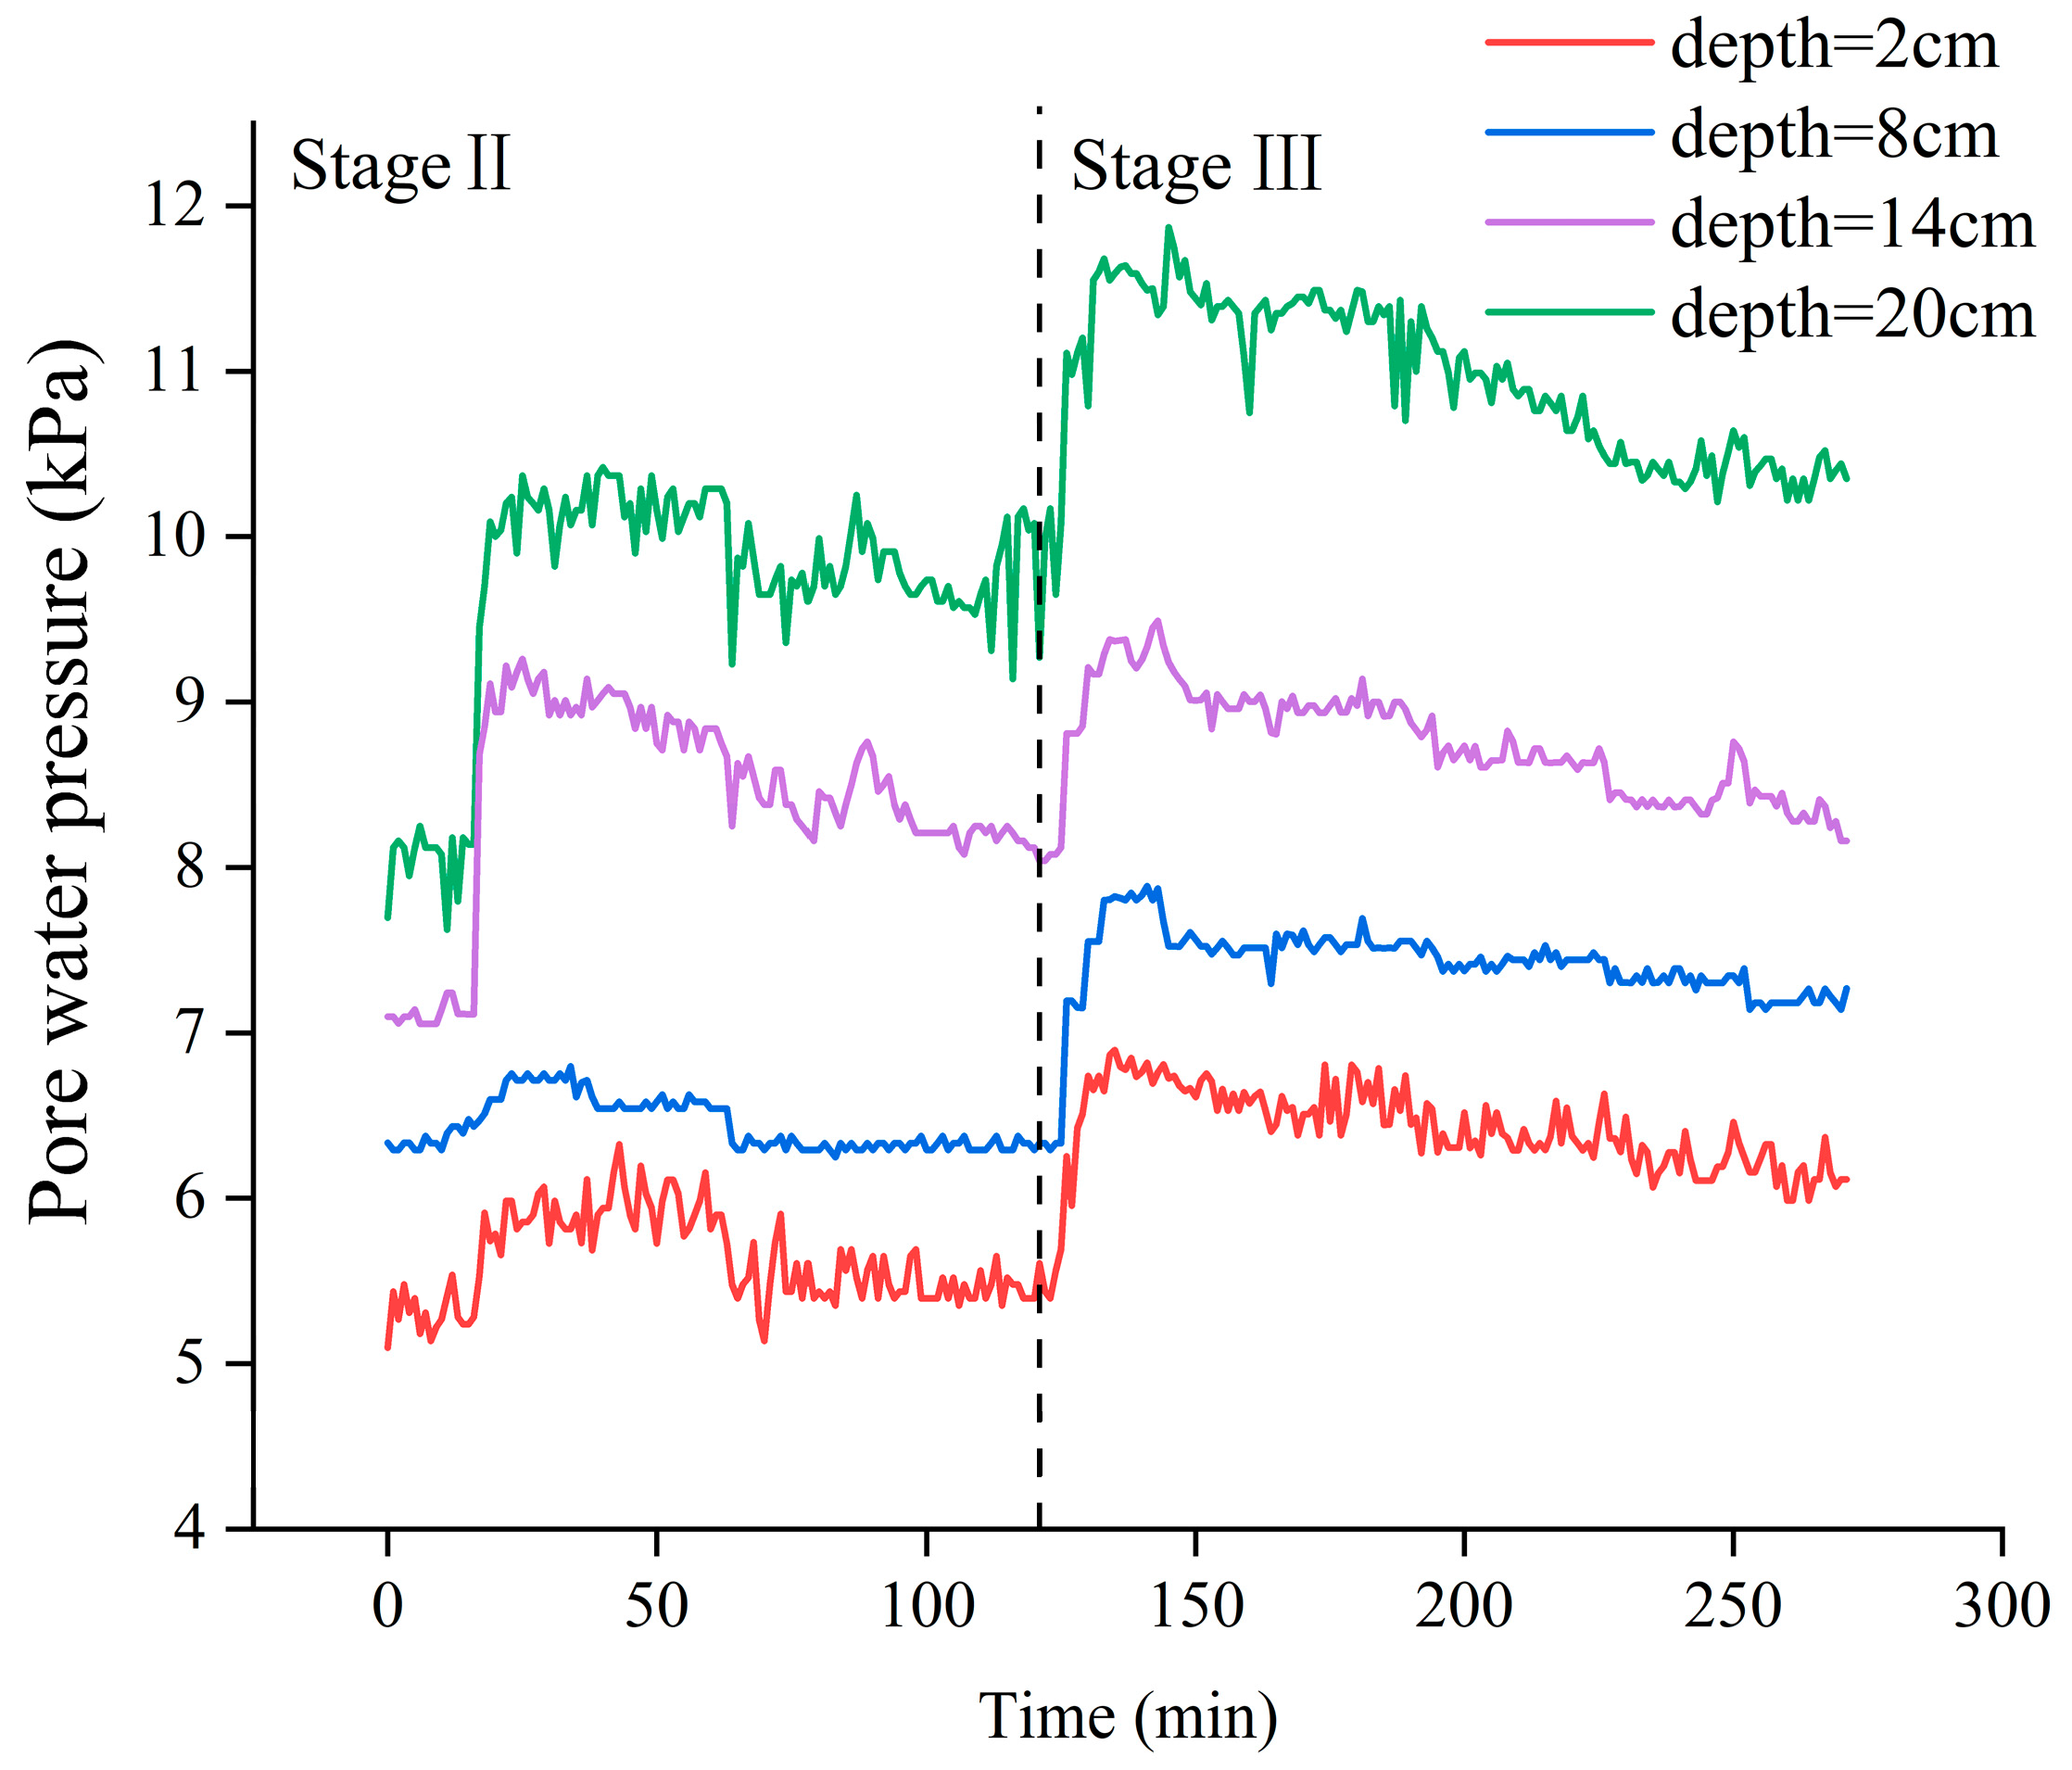
The temporal variation in porewater pressure within sediments under wave action is illustrated in Figure 4. When subjected to wave forcing with a height of 5 cm, the porewater pressure exhibited a trend of initial increase followed by gradual dissipation. This phenomenon can be attributed to the attenuation of wave-induced pressure gradients during wave propagation, particularly under small wave disturbances (wave height < 8 cm). In these conditions, the upward pressure gradient becomes notably weakened—especially in the region of wave breaking—resulting in a lower rate of pressure buildup compared to the dissipation rate [24]. Consequently, no significant accumulation of porewater pressure occurs within the sediment matrix [25]. During this stage, only a limited number of suspended particles were observed above the sediment surface through the transparent side wall of the wave flume, and no evidence of sediment liquefaction was detected.
In contrast, under the influence of a 12 cm wave height, the porewater pressure increased rapidly, reaching pronounced peaks that exceeded the dissipation capacity of the sediment. This pressure buildup coincided with sharp rises in suspended sediment concentration and visual observation of fluid-like oscillation of the upper sediment layer. The sediments oscillated synchronously with wave motion, indicating a transition into a fluidized state. Such reciprocating motion and arc-shaped oscillatory interfaces of fluidized soils have also been reported in earlier flume studies on silty and sandy beds, where sustained excess pore pressure growth and strong sediment suspension under wave forcing were recognized as key indicators of liquefaction onset [24,26,27,28]. Accordingly, in this study, the simultaneous occurrence of excess porewater pressure buildup and significant increases in suspended solids was adopted as the criterion for identifying the onset of sediment liquefaction. Visual observations also confirmed that liquefaction occurred, and the sediment entered a state of dynamic instability [29,30].

3.2. Variation Characteristics of Suspended Sediment Concentration and Median Particle Diameter of Suspended Particles in Overlying Water

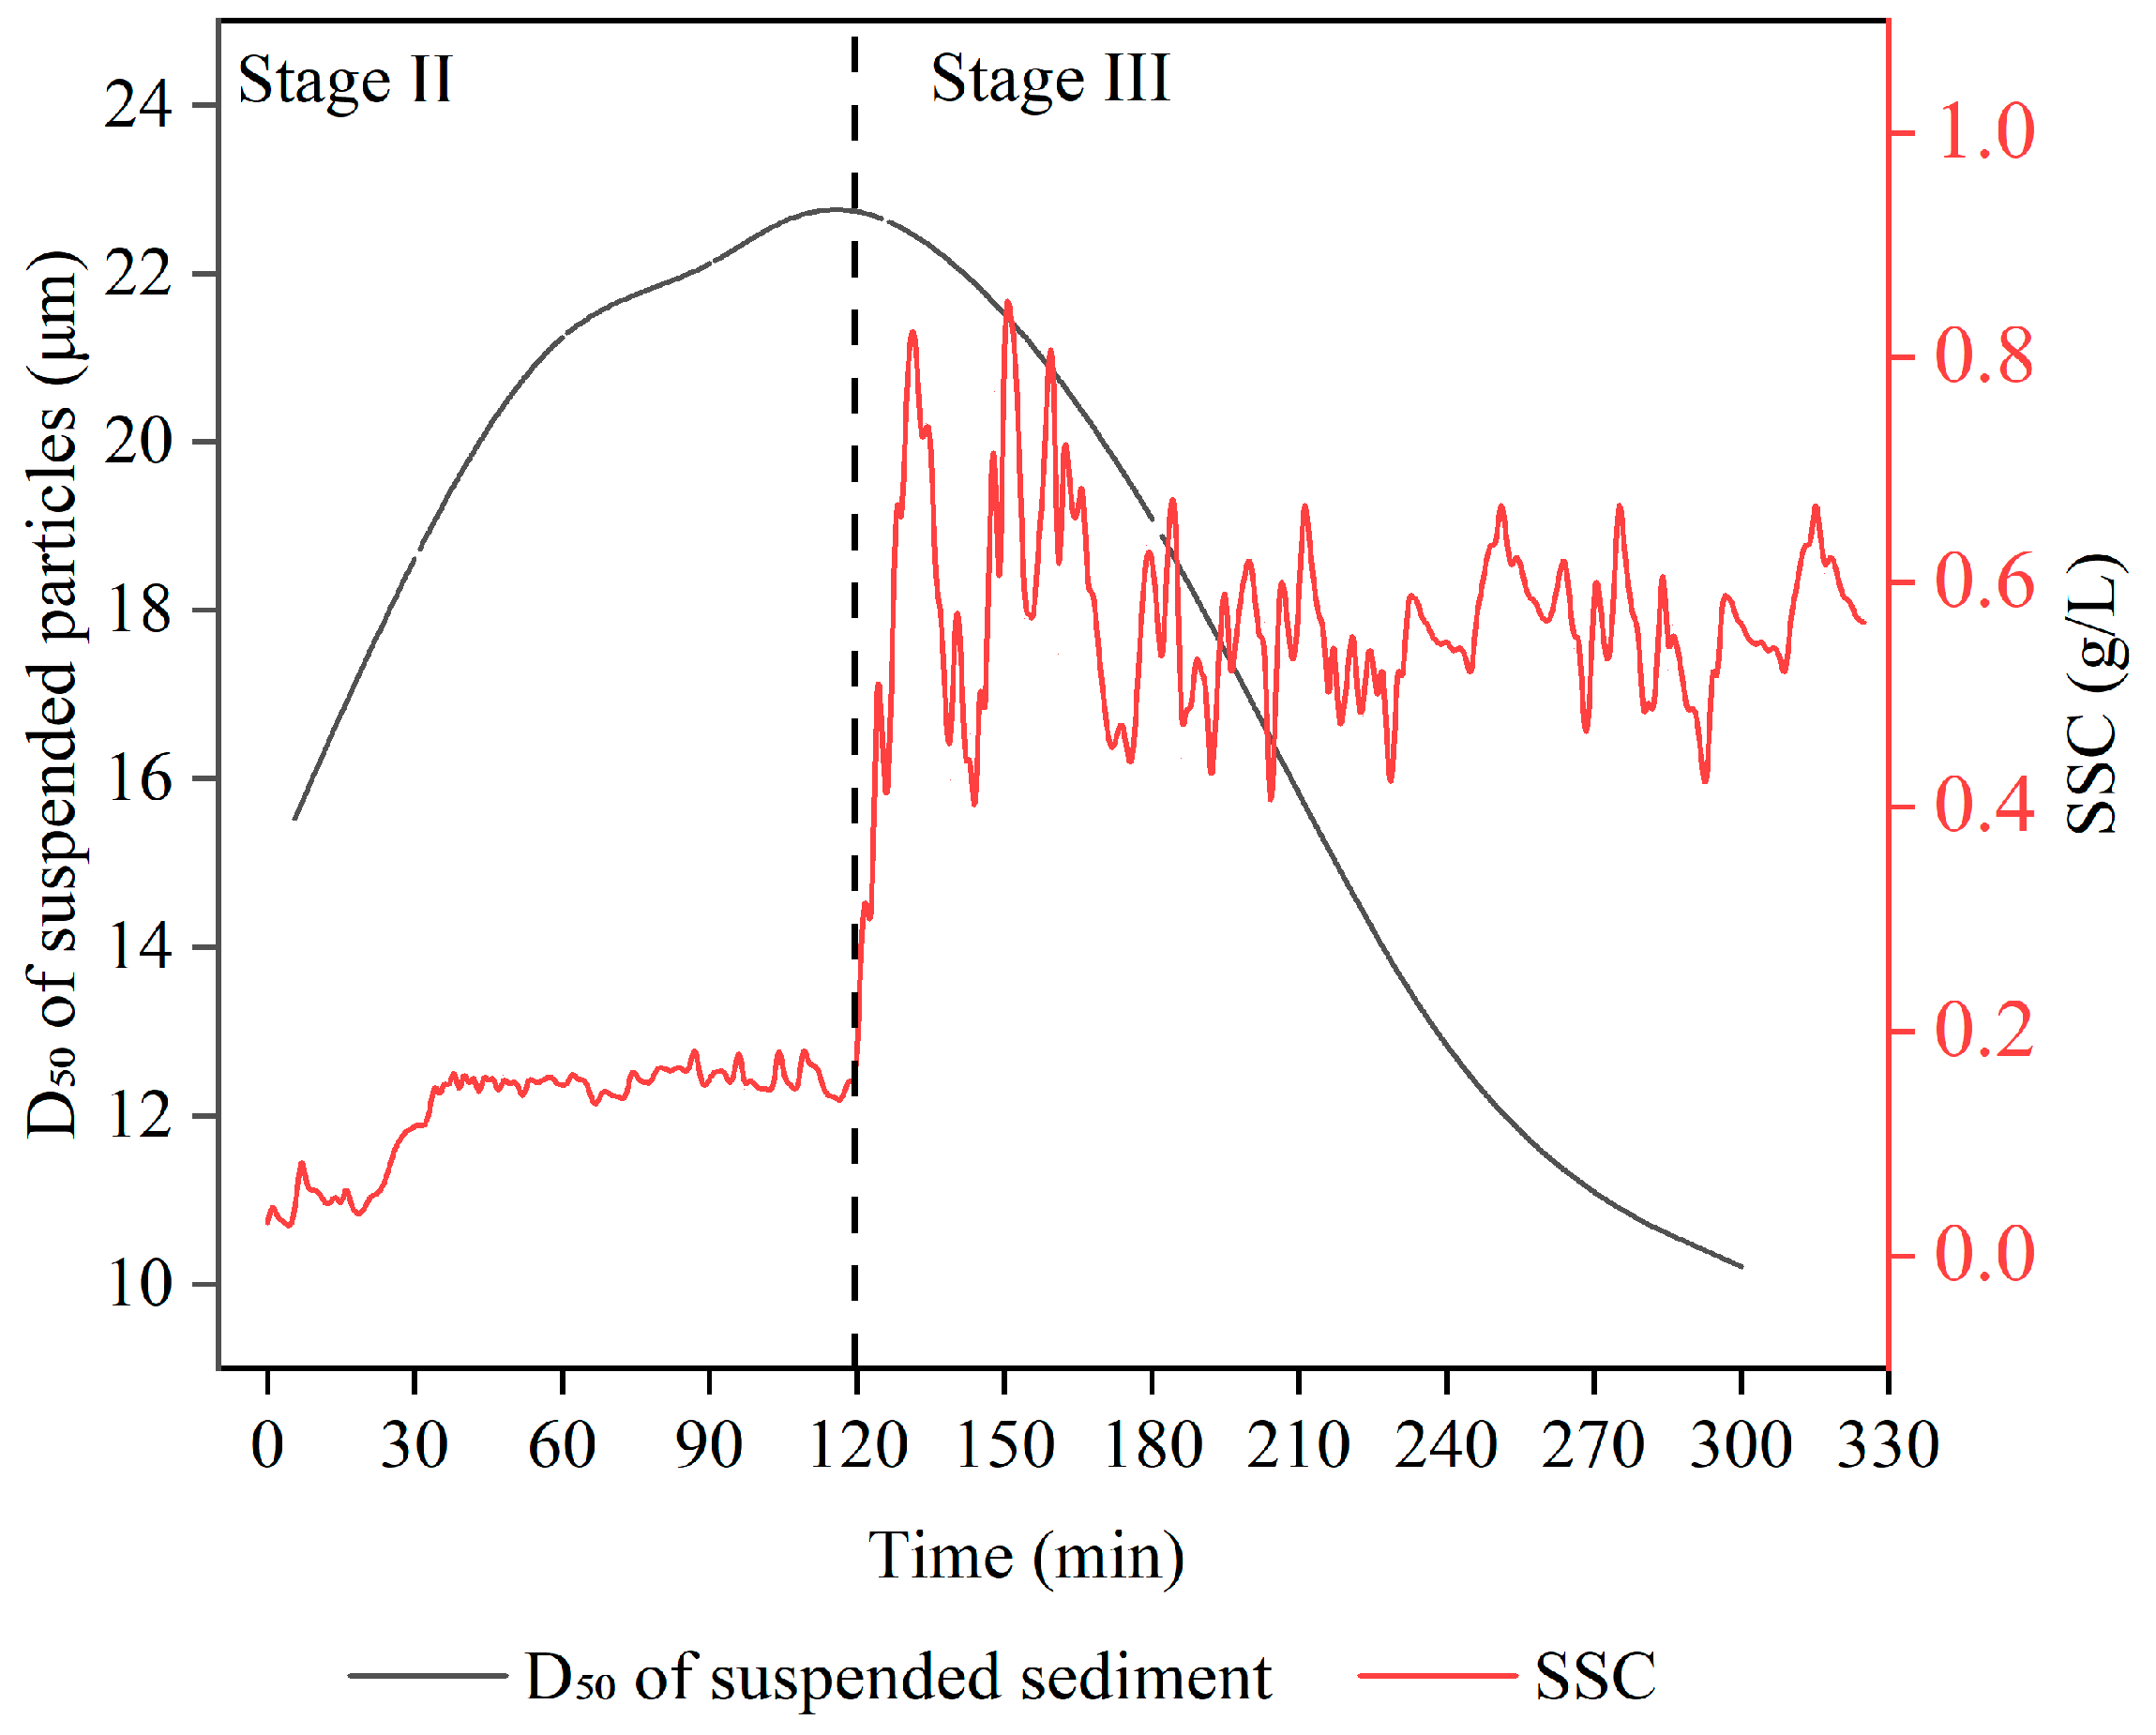
Figure 5 illustrates the temporal variation in suspended sediment concentration (SSC) and the median particle diameter (D50) of suspended sediment measured 5 cm above the sediment surface under continuous wave forcing. Experimental results in this study and field observations consistently demonstrate a strong positive correlation between wave height and suspended sediment concentration (SSC) in coastal environments. This relationship is particularly evident in the subaqueous Yellow River delta, where in situ measurements by Liu et al. (2022) [31] recorded SSC values exceeding 30 g/L during storm events with significant wave heights (Hs) of 2.73 m. The study documented the formation of wave-supported fluid mud (WSFM) layers with thicknesses > 60 cm under such conditions, confirming that hydrodynamic energy is a primary driver of sediment resuspension. These field observations are consistent with the results of controlled wave flume experiments presented in this study. Under wave conditions with a height of 5 cm, SSC values ranged from 0.027 to 0.193 g/L. In contrast, under a 12 cm wave regime, SSC increased significantly, ranging from 0.375 to 0.867 g/L. This represents that suspended sediment concentrations (SSCs) increase by a factor of 4 to 10 as wave heights rise from 5 cm to 12 cm. The mechanistic link between wave energy and sediment mobilization involves both direct shear stress at the sediment–water interface and indirect effects through wave-induced pore pressure accumulation that reduces sediment cohesion [26]. SSCs increased sharply in the initial stage of wave action at a height of 12 cm and reached a near-steady state within 30 to 40 min, reflecting an adjustment period driven by sediment resuspension and vertical redistribution. This behavior is attributed to the intensification of turbulence and bed shear stress induced by wave action, which facilitates the detachment and suspension of particles from the sediment.
The variation in the median particle diameter (D50) of suspended sediment in the overlying water following wave action is presented in Figure 5. Under wave forcing, the D50 of suspended particles increased continuously during Stage II, reaching its peak value at the end of this stage. In Stage III, the median particle diameter gradually decreased over time. Notably, approximately 220 min after the onset of Stage III, the D50 dropped below the initial value recorded at the beginning of Stage II. Overall, the median particle diameter of suspended sediments was larger during Stage II. This is primarily attributed to the dominance of coarser particles resuspended from the surface sediment layer under the influence of low wave energy. In contrast, Stage III was characterized by sediment liquefaction, during which finer particles, often associated with pollutants, were transported upward through seepage channels and dispersed into the overlying water [25]. Meanwhile, larger particles rapidly settled out due to the oscillatory motion of the water column.

3.3. Variation Characteristics of PAHs Concentration and Composition in Overlying Water

Figure 6 presents the temporal variation in dissolved polycyclic aromatic hydrocarbons (PAHs) concentrations in the overlying water during the wave flume experiment. In the static diffusion phase (Stage I), the concentration of dissolved PAHs at 5 cm above the sediment ranged from 337.390 to 882.510 ng/L, characterized by an initial rapid decrease followed by a gradual increase. At 40 cm above the sediment, concentrations ranged from 567.346 to 852.245 ng/L and exhibited a steady upward trend. Overall, dissolved PAH concentrations at 40 cm were consistently higher than those near the sediment–water interface.
In Stage II, the concentration of PAHs at 5 cm above the sediment exhibited a generally steady upward trend, increasing from 518.722 ng/L to 664.390 ng/L, with only minor fluctuations observed during the 60–90 min period. At 40 cm above the sediment, the PAH concentration remained nearly constant during the initial 30 min, followed by a rapid decline over the next 30 min, ultimately dropping below 400 ng/L.
In Stage III, the dissolved PAH concentration at 5 cm above the sediment showed pronounced temporal variation, characterized by multiple phases of increase and decrease. The overall concentration ranged from 835.966 to 1486.063 ng/L, indicating that intense wave action significantly influenced the release and migration of PAHs. In contrast, at 40 cm above the sediment, the concentration increased steadily during the first 60 min, followed by a slight decline and a subsequent rebound, reaching a peak of 892.626 ng/L. These results indicate that enhanced wave energy promotes the release and vertical redistribution of dissolved PAHs, particularly in near-bed waters.
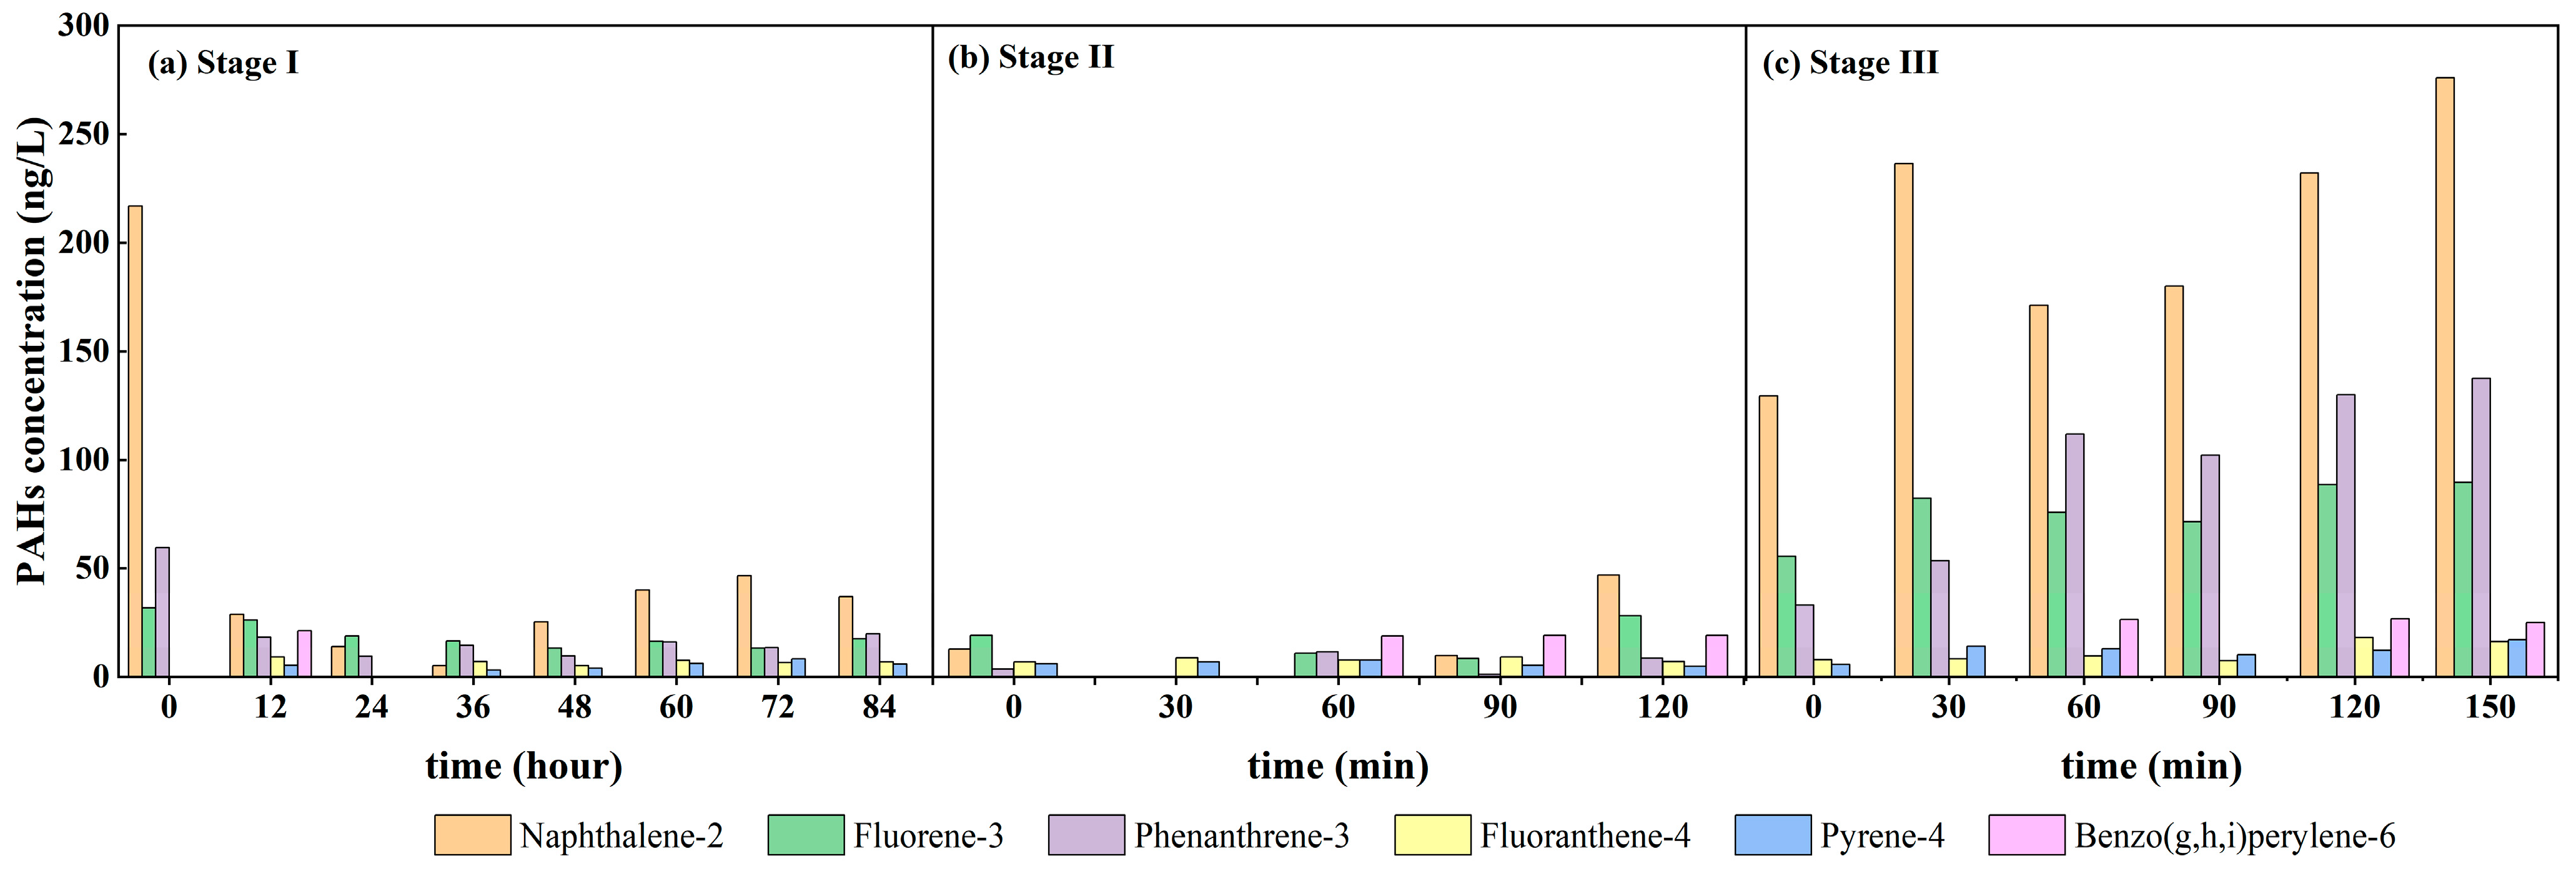
A total of six dissolved PAH congeners were detected in the overlying water. Figure 7 illustrates the variations in the concentrations of individual dissolved PAH congeners in the overlying water during the wave flume experiments. Among them, the majority were low-molecular-weight PAHs consisting of 2–3 rings. In contrast, among the 4–6 ring PAHs, only fluoranthene, pyrene, and benzo[g,h,i]perylene were detected at relatively high frequencies, while other congeners were either detected at extremely low concentrations or remained undetectable due to their low abundance and the limited sampling volume. Overall, the release of 2–3 ring PAH congeners was significantly higher than that of 4-ring congeners.
During Stage I (no wave action), the initial concentrations of PAH congeners in the overlying water were relatively high. As the experiment progressed, the concentration of naphthalene showed a continuous increasing trend, whereas the concentrations of fluorene, phenanthrene, fluoranthene, pyrene, and other 3–4 ring congeners remained largely unchanged (Figure 7a). In Stage II (5 cm wave action), the concentrations of 2–3 ring PAHs decreased compared to Stage I, while the concentrations of 3–6 ring congeners remained relatively stable (Figure 7b). In Stage III (12 cm wave action), the concentrations of 2–3 ring congeners increased significantly. Although 4–6 ring PAHs exhibited an upward trend in concentration, their increase remained lower than that observed for 2–3 ring congeners (Figure 7c).
Overall, the dissolved PAH profile indicates higher mobility and release activity among certain 2–3 ring compounds, such as naphthalene and fluorene, likely due to their greater water solubility and weaker sediment binding affinities. This is consistent with Sun et al. (2019) [32], who reported that 2–3 ring PAHs dominate vertical migration in porous media due to their higher aqueous solubility and lower Kow values.

3.4. Variation Characteristics of PAHs Concentration and Composition in Sediments

The vertical distribution of PAHs in the sediment following different experimental stages is illustrated in Figure 8.
After Stage I, a sediment core measuring 11 cm in length was collected. During this static diffusion stage, petroleum-derived PAHs in the surface sediment were observed to migrate both upward into the overlying water and downward into the deeper sediment layers. The maximum PAH concentration was detected at a depth of 5 cm, reaching 25.404 mg/kg, with an overall concentration range of 1.795–25.404 mg/kg. Below 5 cm, the PAH content gradually decreased with depth, indicating limited vertical migration in the absence of hydrodynamic forcing.
After Stage II with a wave height of 5 cm, a sediment core with a length of 11.5 cm was collected. Wave-induced disturbance facilitated deeper penetration of pollutants, with the highest PAH concentration (24.899 mg/kg) detected at a depth of 12 cm. The PAH content in this stage ranged from 6.400 to 24.899 mg/kg, suggesting enhanced vertical transport due to sediment resuspension and porewater advection.
A sediment core with a length of 15 cm was obtained at the end of Stage III. The PAH content in the sediment was substantially reduced, with values ranging from 1.314 to 2.128 mg/kg across all depths. The vertical profile showed minimal variation, suggesting that stronger wave action may have facilitated the desorption and release of PAHs from the sediment matrix into the overlying water column.
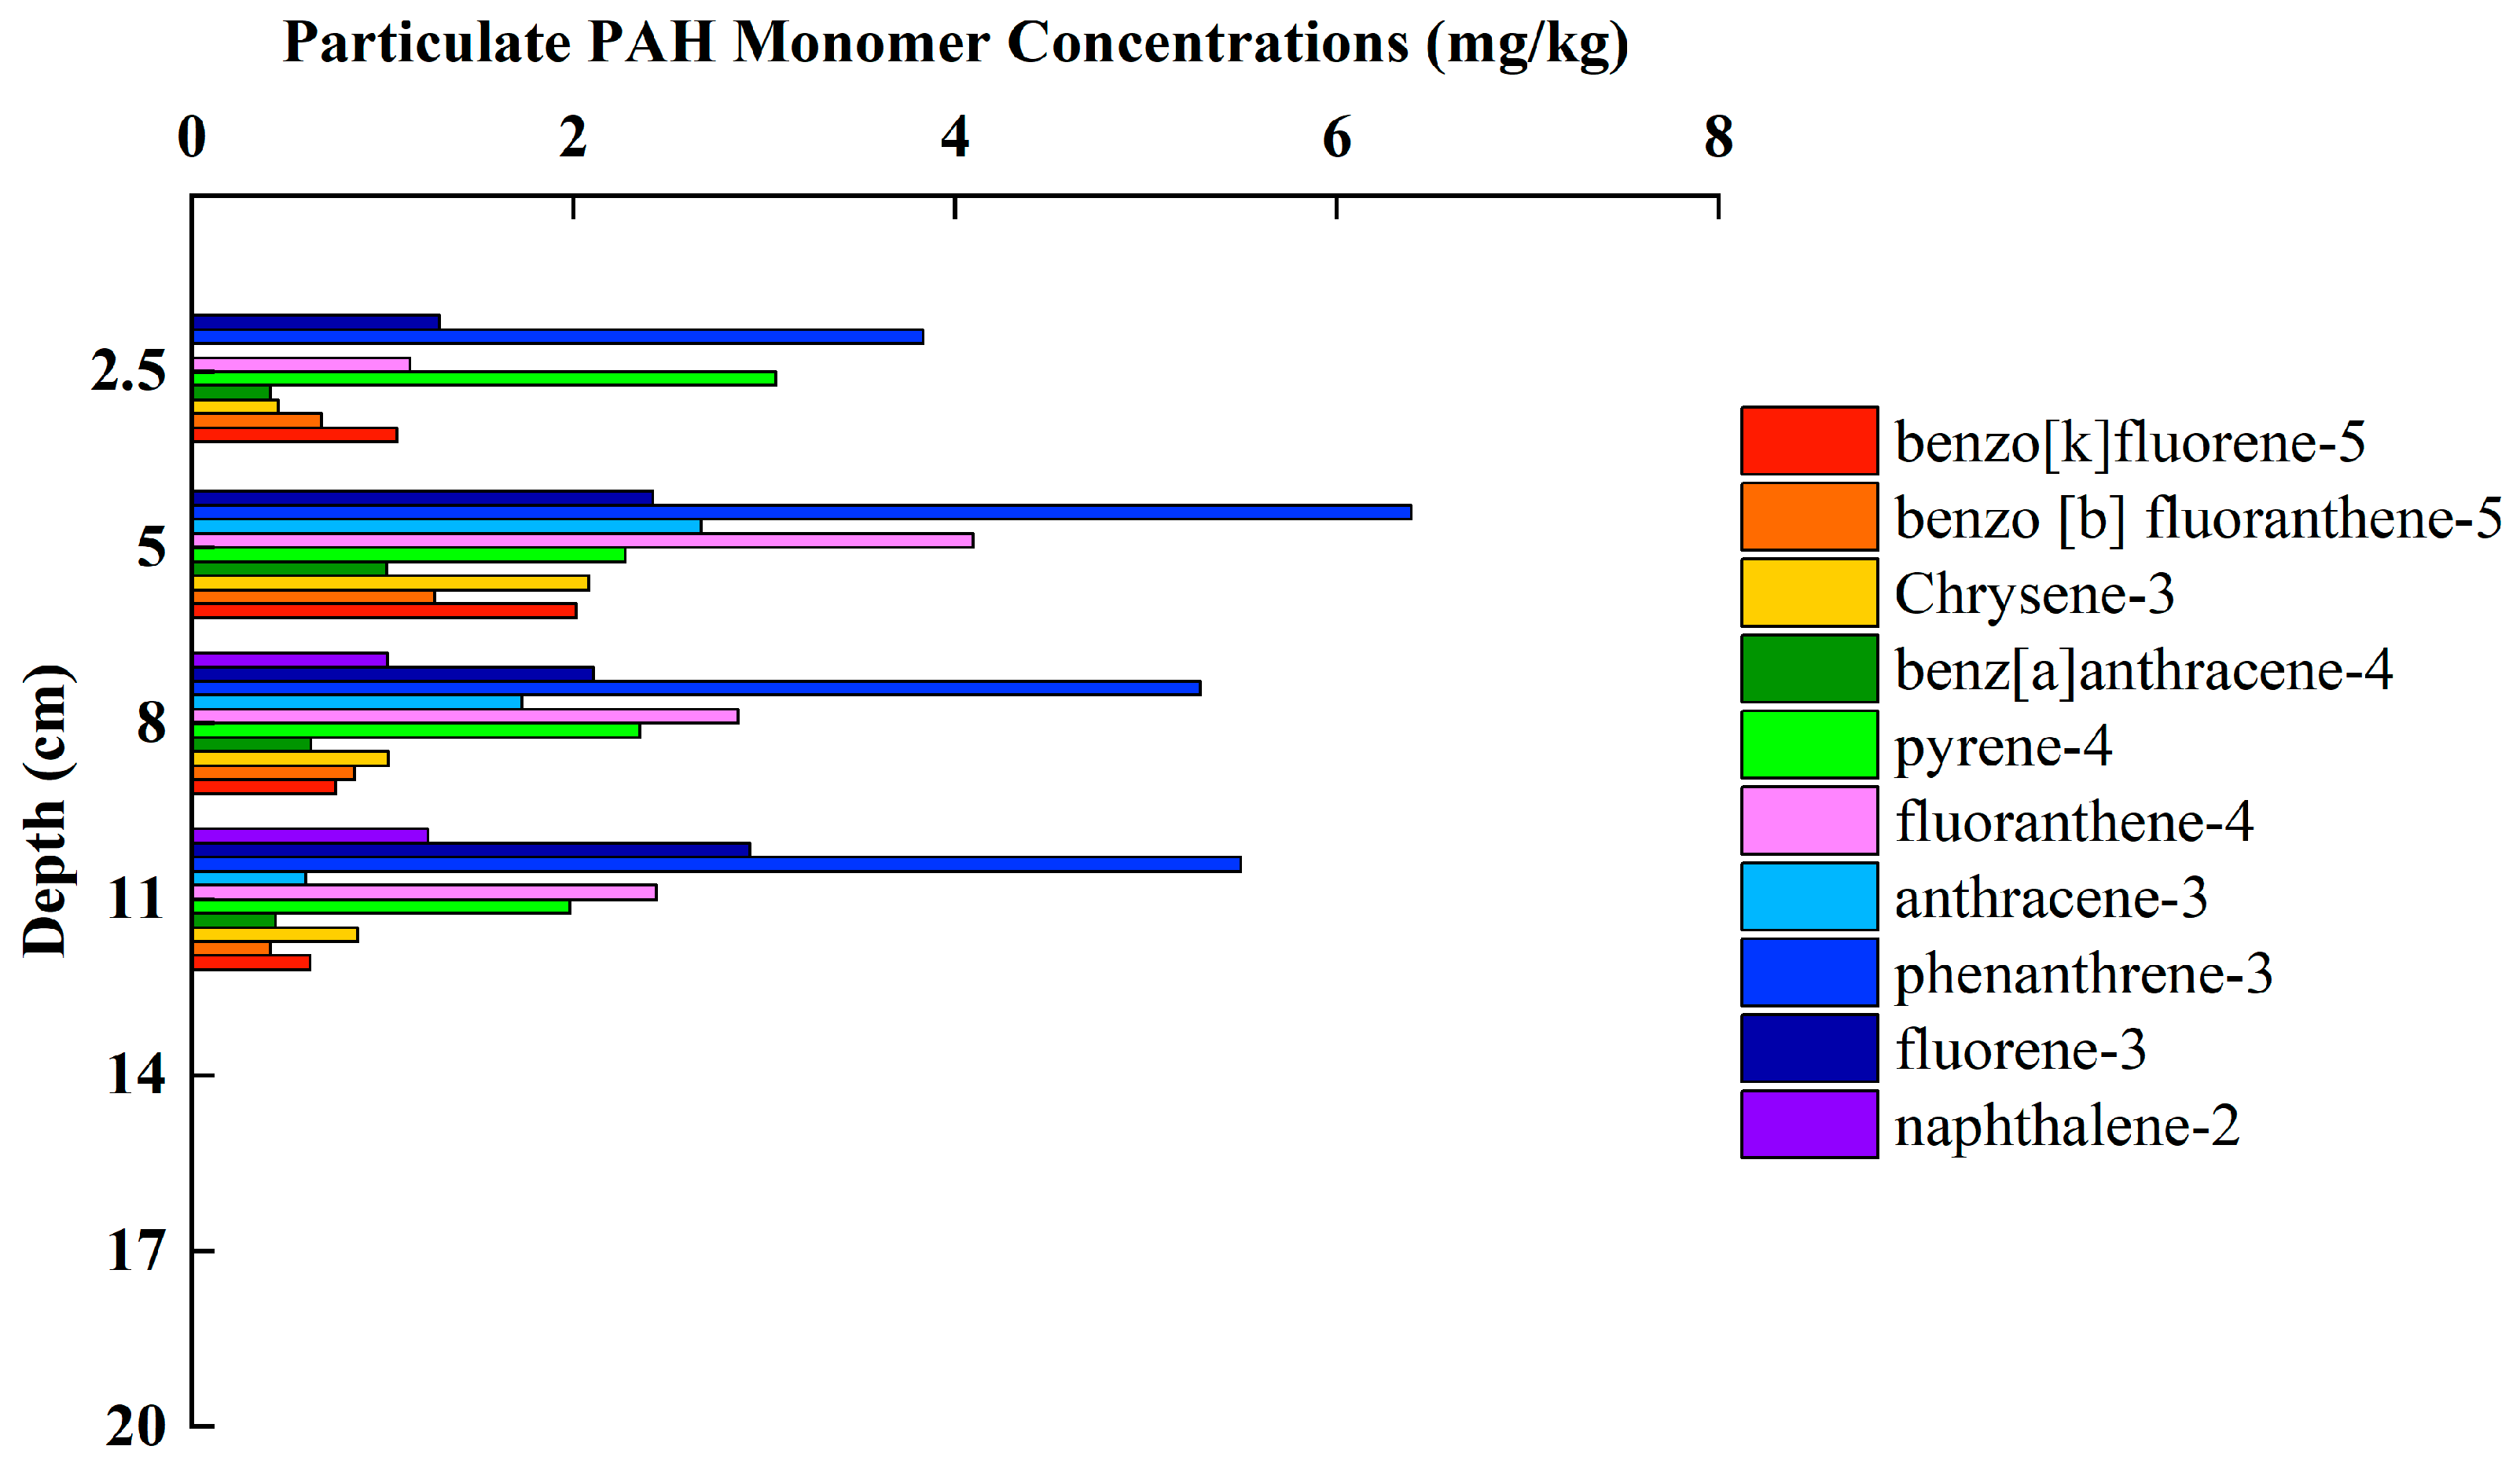
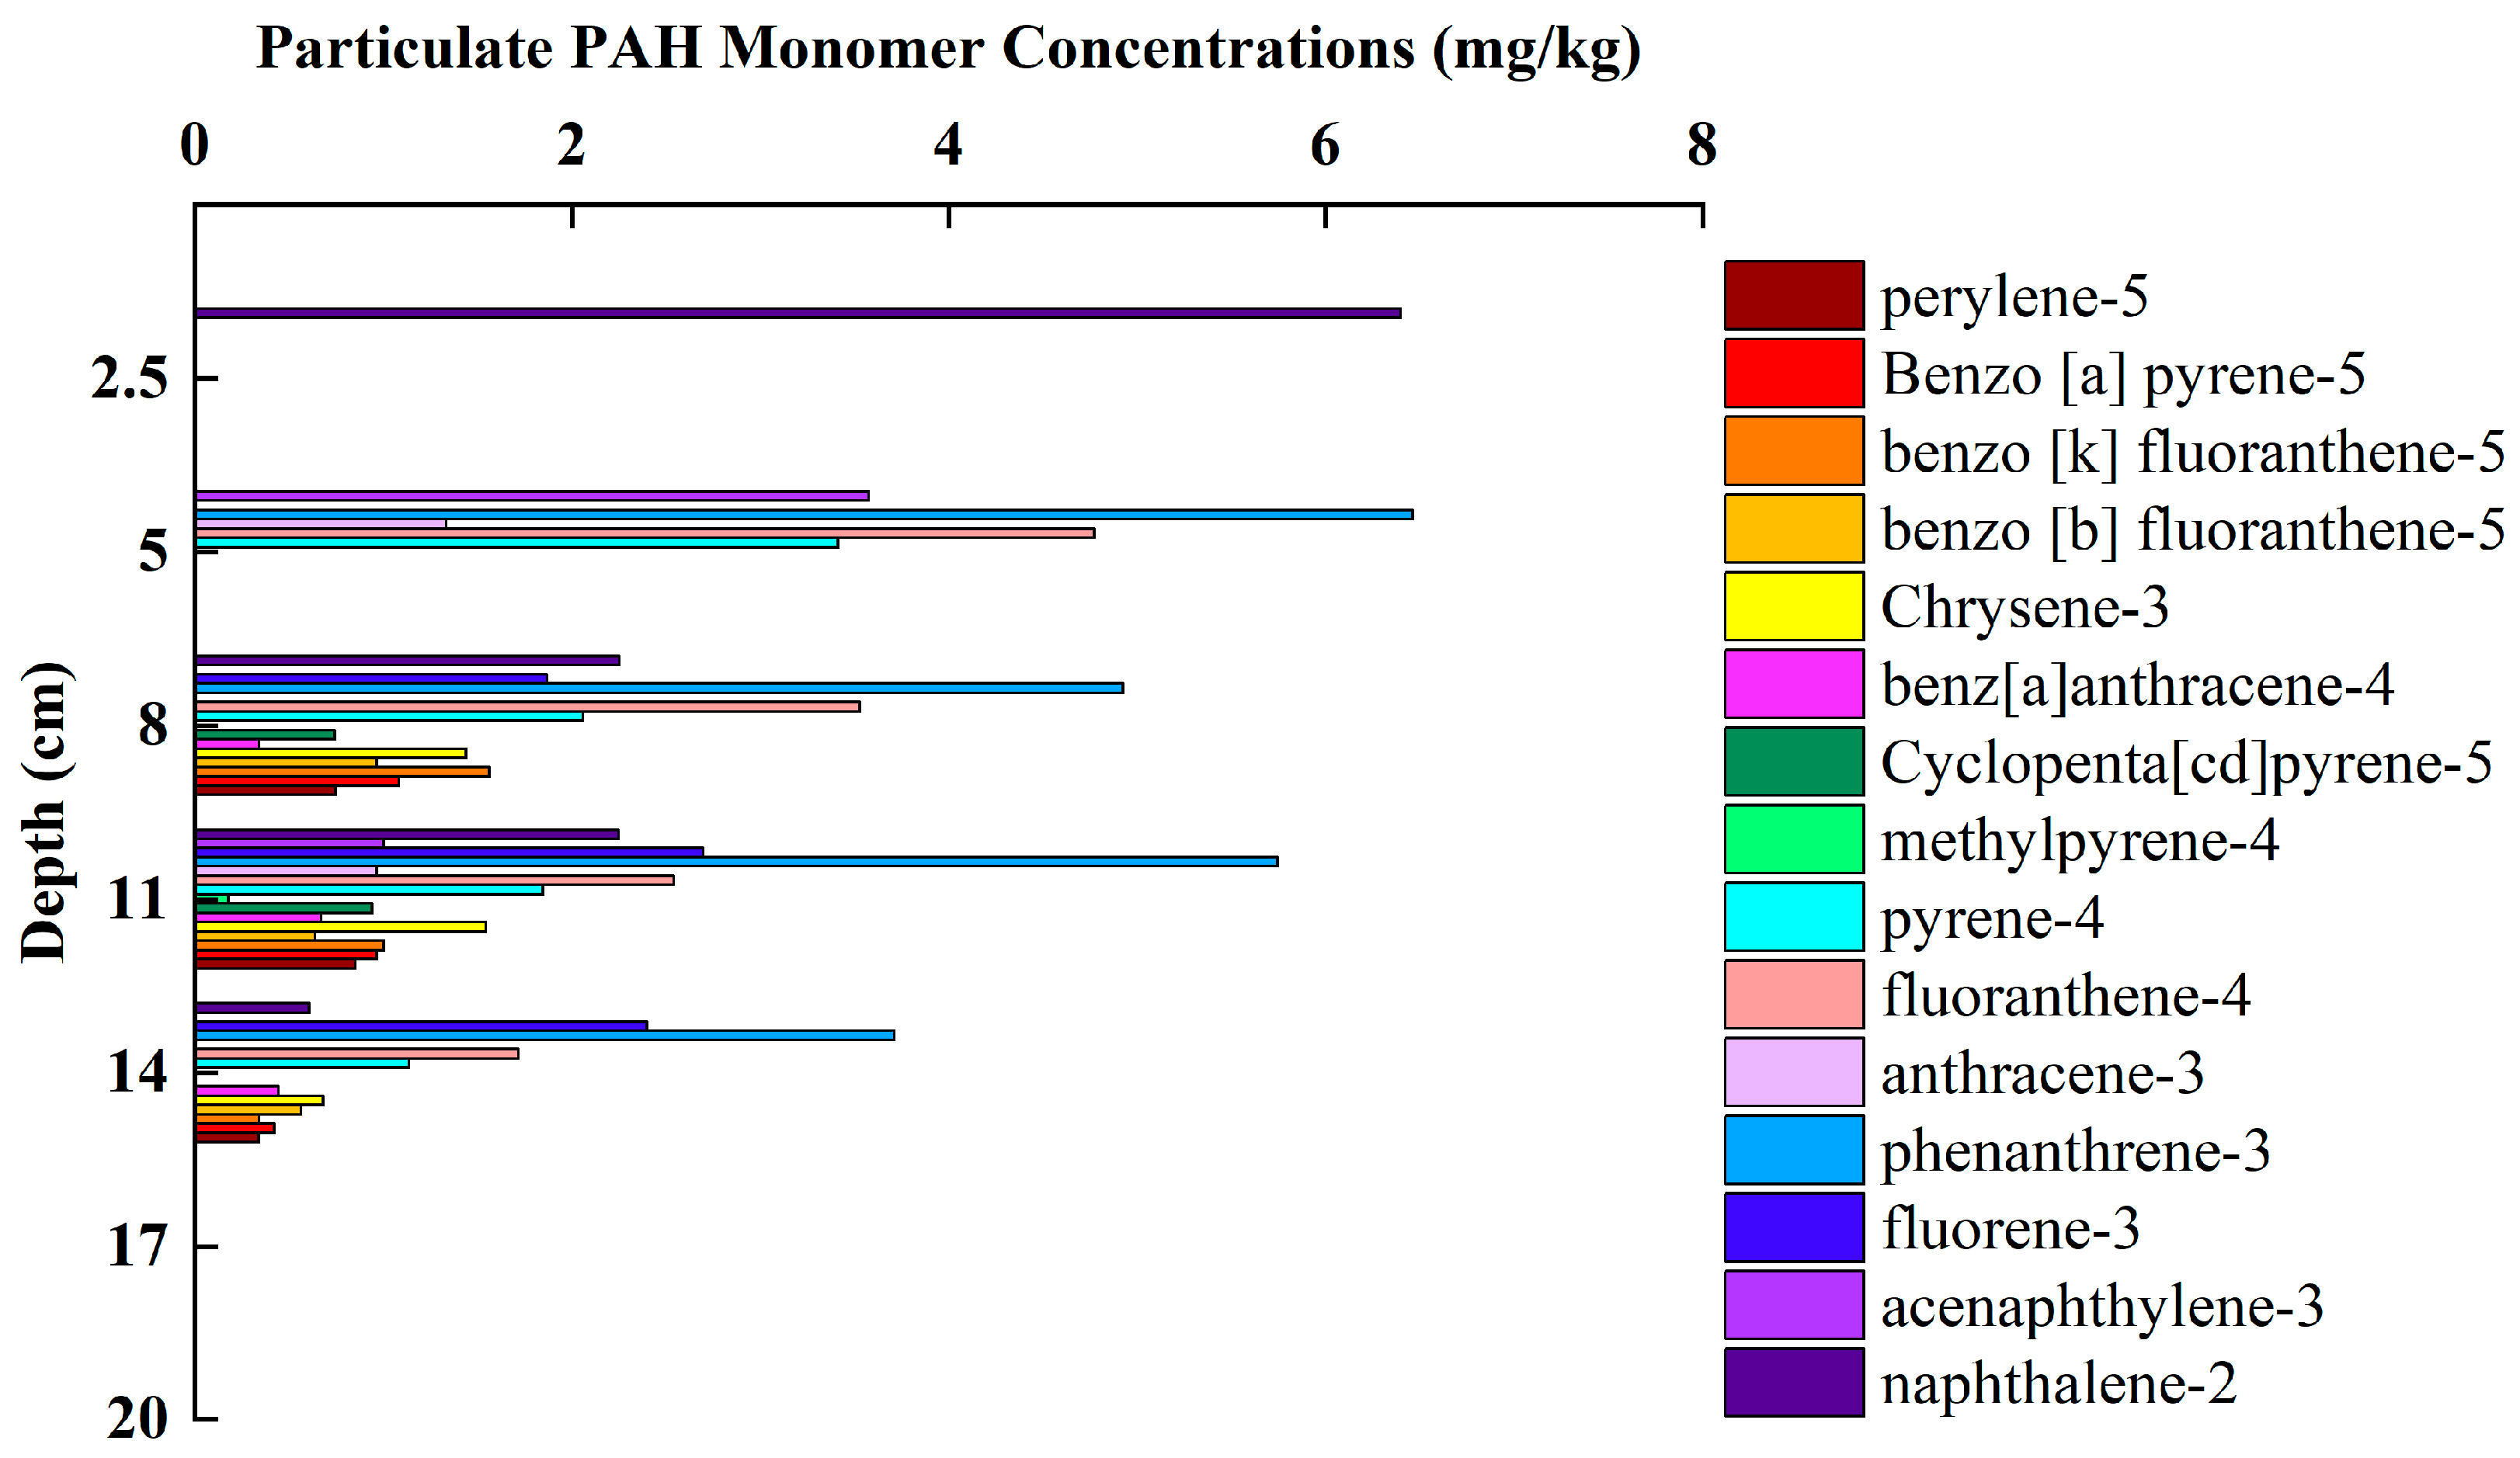
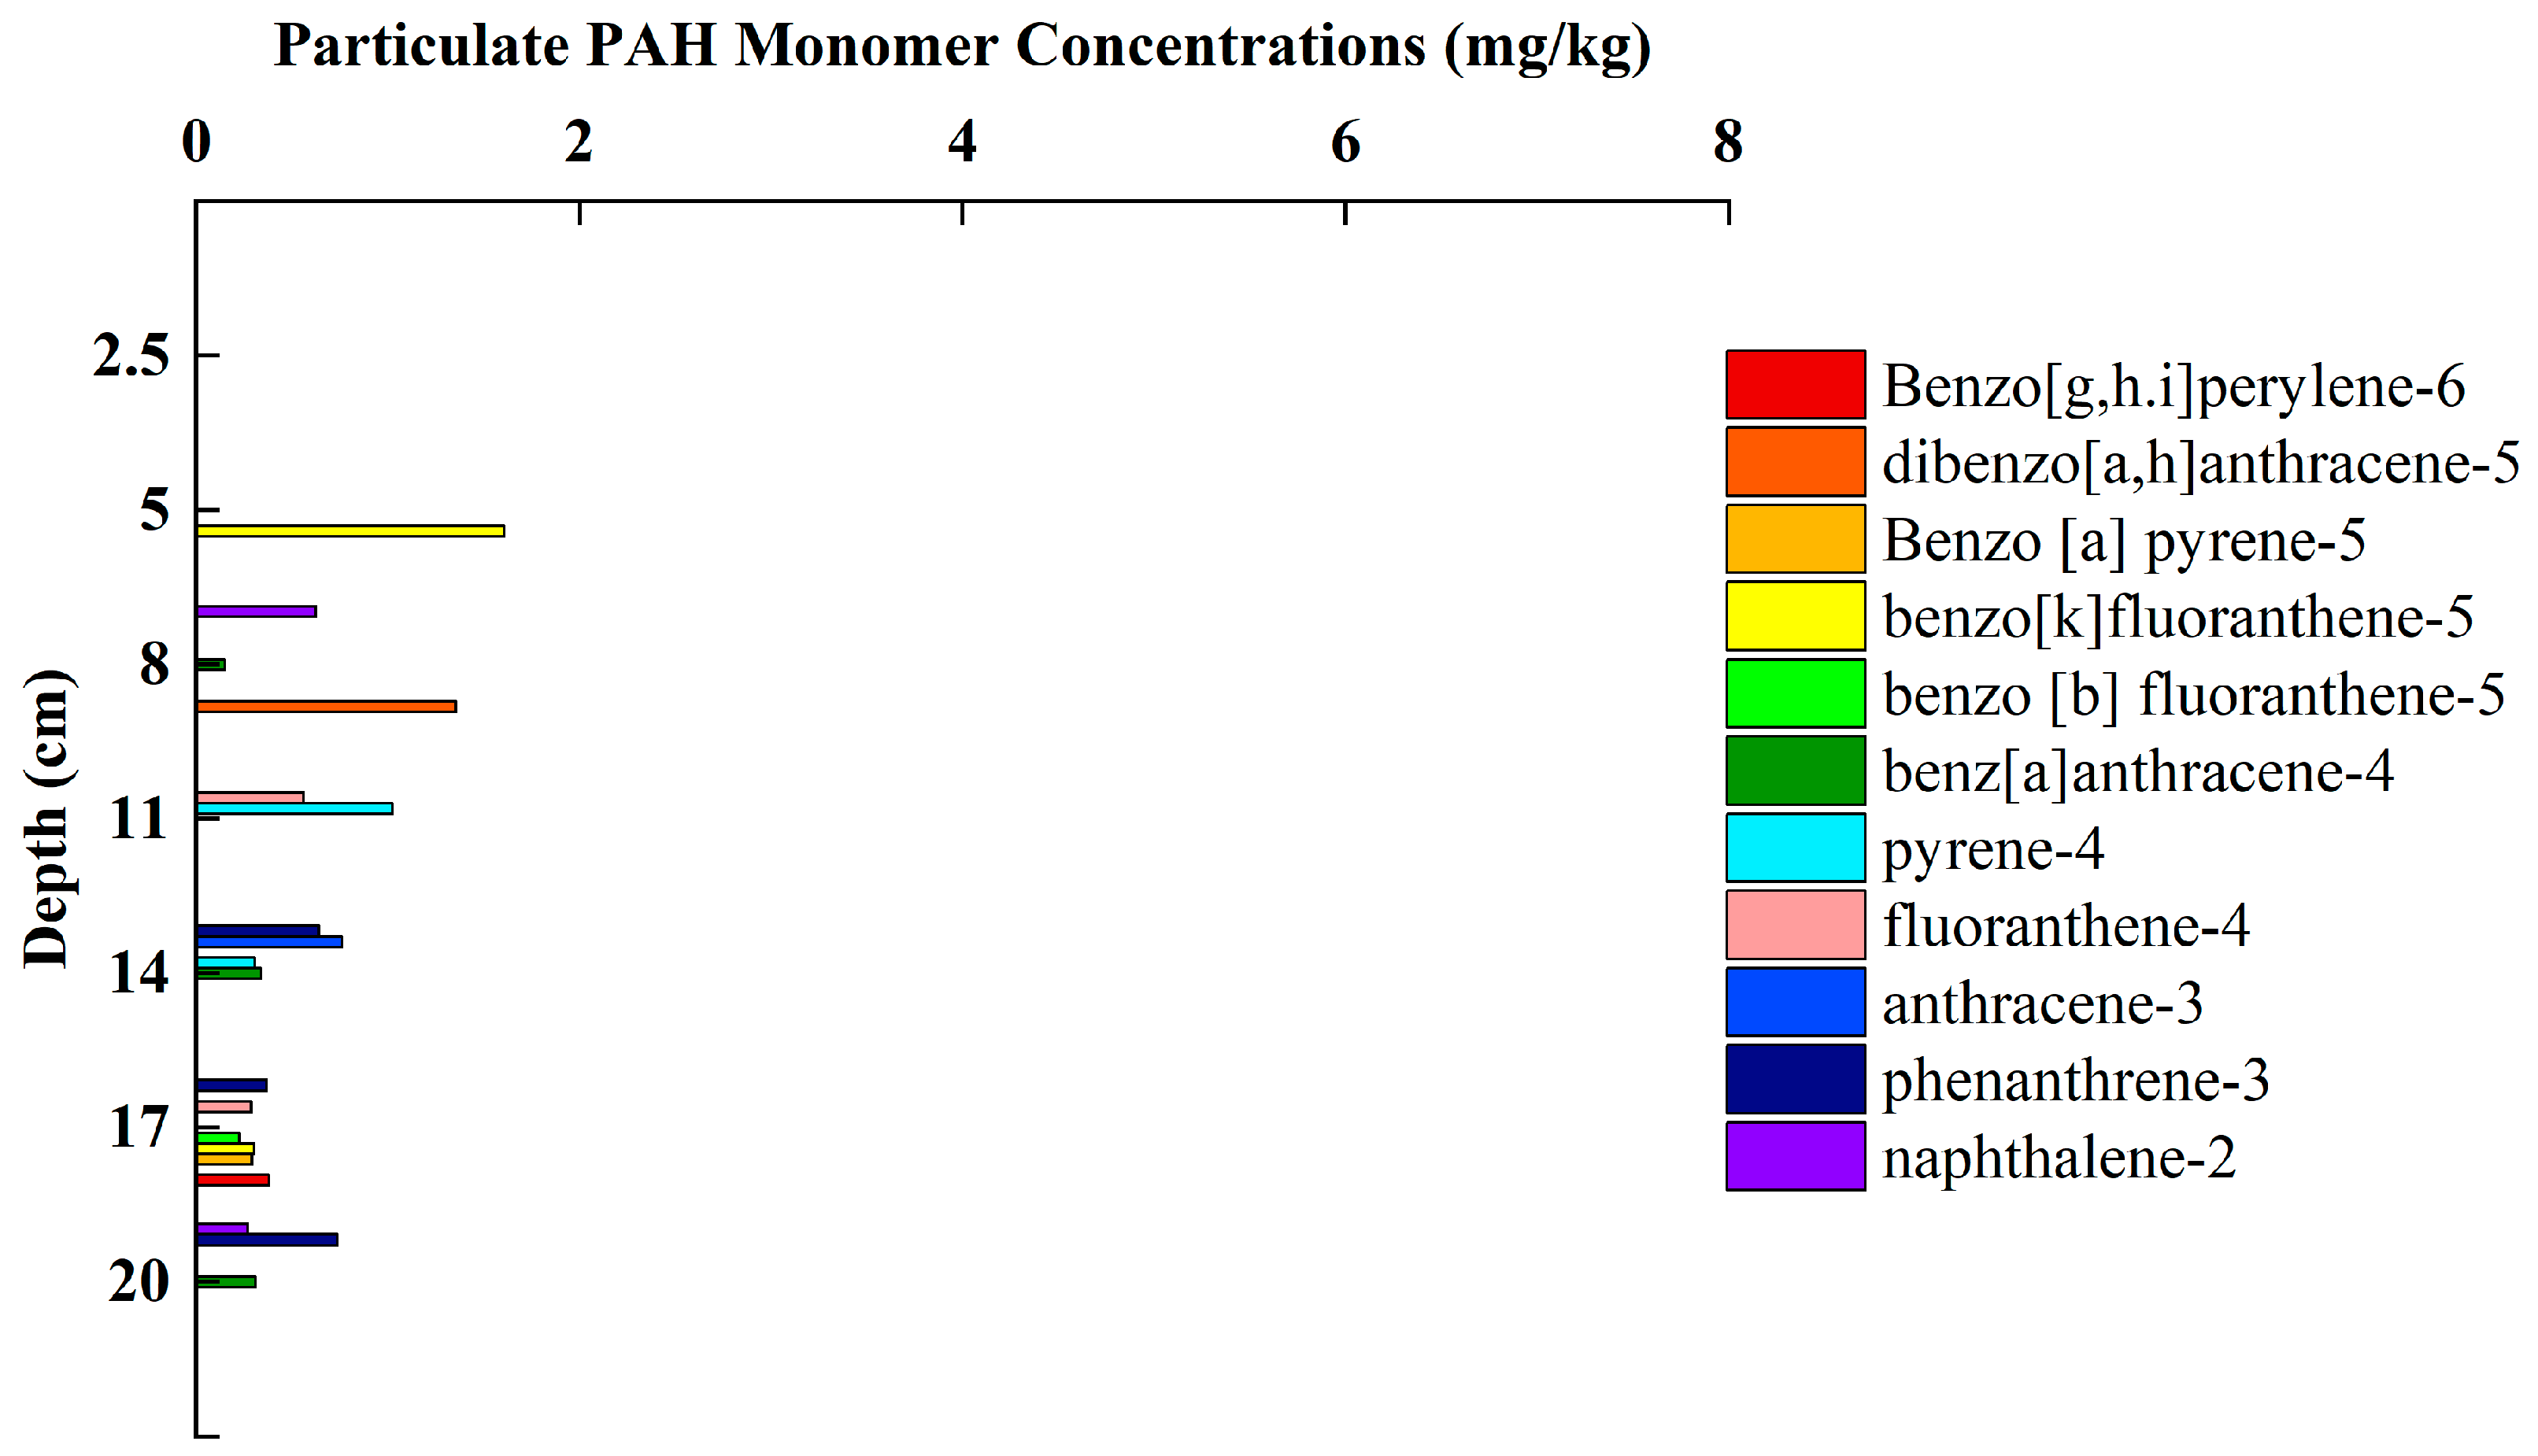
The variations in the concentrations of particulate-phase PAH congeners in the sediment during the experiments are shown in Figure 9, Figure 10 and Figure 11.
During Stage I, the concentrations of three- to four-ring PAHs exhibited marked fluctuations (Figure 9). Phenanthrene exhibited the highest concentration among all detected PAH congeners across all sediment depths, reaching up to 6.5 mg/kg. This was followed by pyrene, fluoranthene, and fluorene, all of which are classified as 3–4 ring PAHs and were consistently distributed across the sediment profile. In contrast, PAH congeners such as benzo[a]fluoranthene and benzo[b]fluoranthene, both 5-ring compounds, were detected at relatively low concentrations.
The proportional distribution of individual PAH congeners remained relatively stable across different depths. Notably, although there were variations in the concentrations of different congeners, nearly all were detected at multiple depths, indicating a widespread vertical presence. The only exception was anthracene, which was not detected at the 2.5 cm depth.
In Stage II, significant vertical migration toward deeper sediment layers was observed for two- to four-ring PAHs, such as naphthalene, phenanthrene, fluoranthene, and pyrene. Compared to Stage I, Stage II was characterized by a greater diversity of migrating PAH compounds and more pronounced changes in their concentrations (Figure 10).
In Stage III, due to sediment liquefaction and the subsequent release of PAHs from the sediment matrix, the concentrations of PAH congeners detected at various depths were generally low, all below 2 mg/kg (Figure 11).
The congeners that migrated to greater depths primarily included low-molecular-weight PAHs such as phenanthrene, naphthalene, and anthracene (2–3 rings), as well as the higher molecular weight compound benzo[a]anthracene. This deeper migration of benzo[a]anthracene may be attributed to its unique molecular structure, which potentially alters its adsorption and diffusion behavior in sediment compared to other five-ring PAHs. Its relatively easier desorption may have facilitated deeper transport within the bed sediment.

4. Discussion

4.1. Correlation Analysis Between Porewater Pressure and Suspended Sediment Concentration Variations

Under wave action with a height of 5 cm, the porewater pressure exhibited an initial increase followed by a gradual decline. During this stage, it was observed that the natural dissipation rate of pore pressure within the sediment matrix exceeded the rate of pressure buildup induced by the waves, resulting in no significant increase in overall pore pressure. Visual observations through the side glass wall of the flume revealed only a small amount of suspended particles present in the upper layer of the sediment bed.
When subjected to waves with a height of 12 cm, the porewater pressure underwent a pronounced dynamic change, rapidly reaching a peak value. This phenomenon was attributed to the accelerated increase in pore pressure driven by wave loading, which far outpaced the natural dissipation rate of pore pressure within the sediment. During this phase, the sediment exhibited fluid-like behavior, oscillating laterally under wave action, which is an intuitive manifestation of sediment liquefaction.
These results indicate that changes in wave conditions led to corresponding variations in porewater pressure and suspended sediment concentration. In Stage II, under 5 cm wave height, pore pressure remained relatively stable and suspended sediment concentration exhibited minor fluctuations. Upon increasing the wave height to 12 cm in Stage III, both the amplitude of pore pressure variation and suspended sediment concentration increased markedly, with the latter reaching values several times higher than those in Stage II.
To further analyze the relationship between porewater pressure variations and suspended sediment concentration changes, a correlation analysis was conducted between these two parameters during different stages. As indicated by the normality test results in Table 3, at the significance level of α = 0.05, all variables were found to deviate significantly from a normal distribution (indicated by p < 0.05), indicating clear non-normality.
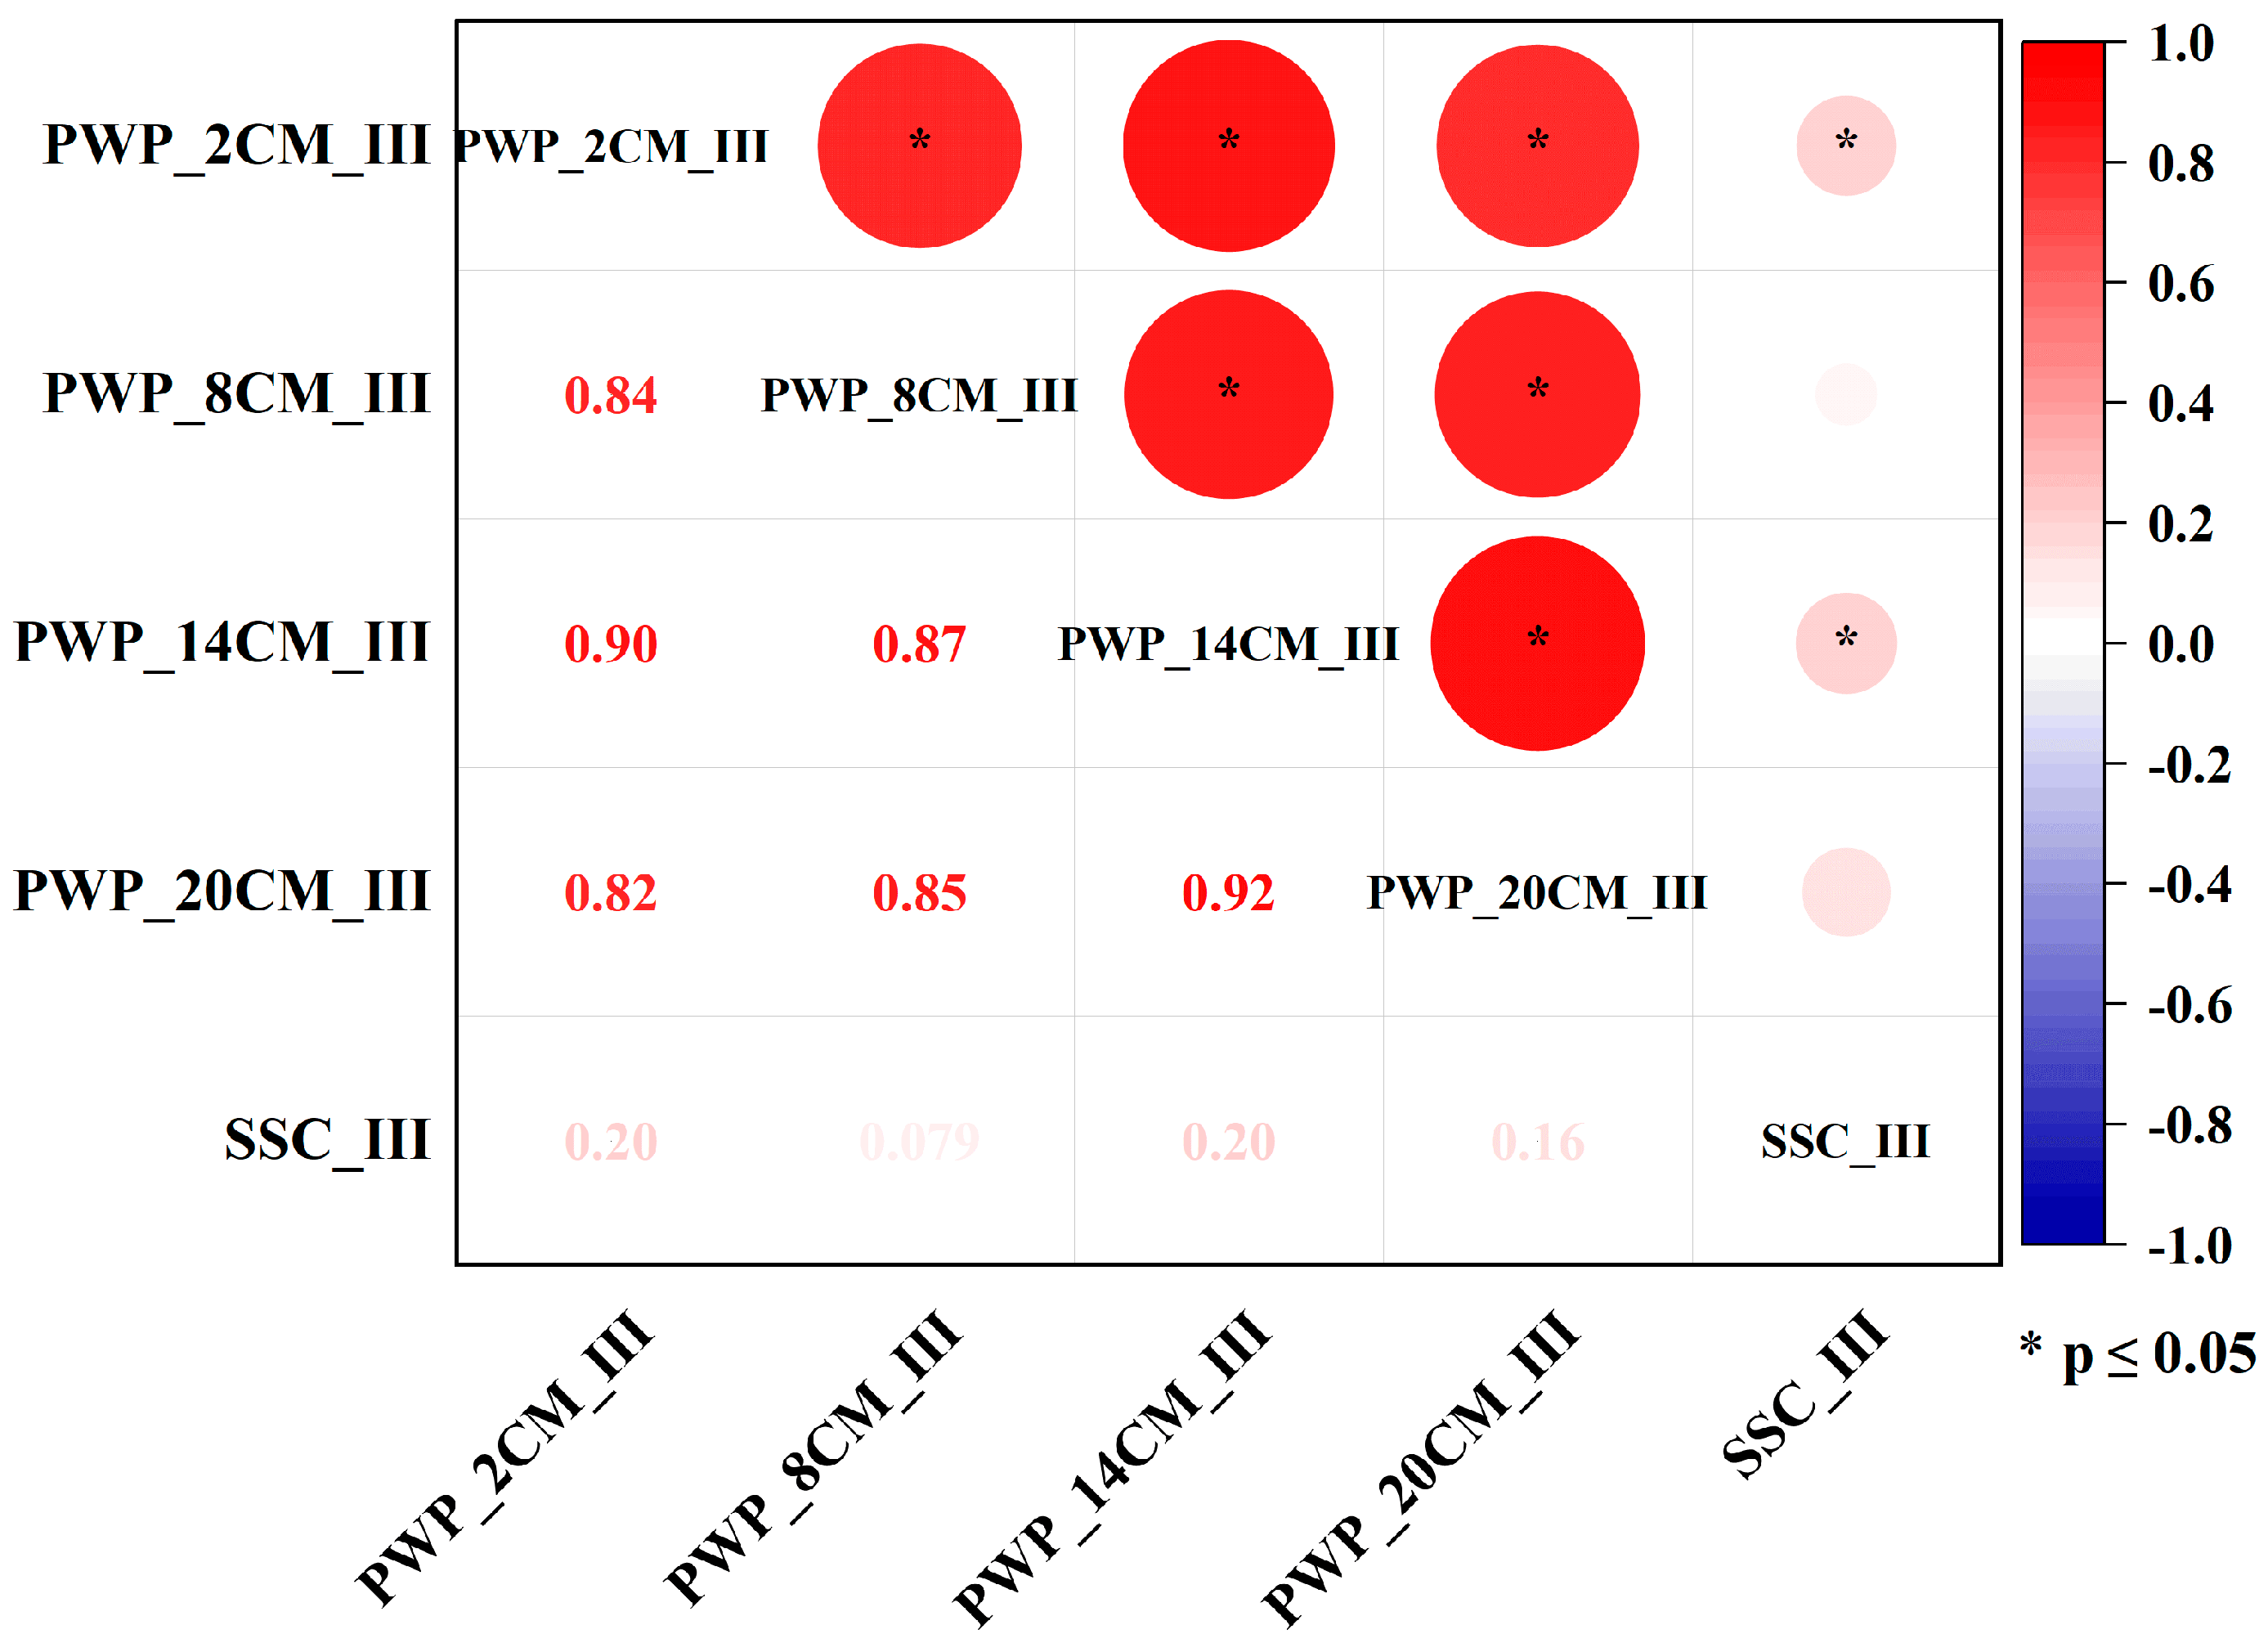
The results of the Spearman correlation analysis between porewater pressure and SSC during stages II and III are presented in Figure 12 and Figure 13. In the figures, Spearman’s rho values are represented by colored circles accompanied by numerical labels. The size of each circle is proportional to the absolute value of Spearman’s rho, with larger circles indicating stronger correlations.
The statistical results from the Spearman rank correlation analysis reveal a clear shift in the sediment dynamic regime between non-liquefied (Stage II) and liquefied (Stage III) conditions, providing important insights into the mechanisms of sediment resuspension under wave action.
In the absence of liquefaction (Stage II), the correlation structure between porewater pressure (PWP) and suspended sediment concentration (SSC) was complex and indicative of a stable seabed response. The strong, highly significant positive correlations among PWPs at all depths (ρ > 0.70, p < 0.01 for all pairs) confirm the effective transmission of wave-induced pressures through an intact sediment skeleton. Notably, a significant negative correlation was found between PWP_8CM_II and SSC_II (ρ = −0.28, p = 0.002). This finding supports the mechanism of wave-induced cyclic compaction [33], whereby wave loading rearranges sediment grains, increasing pore pressure while enhancing seabed stability and resistance to erosion, thereby suppressing sediment resuspension. The absence of any strong positive PWP-SSC correlations suggests that direct shear erosion by wave orbital velocities, rather than pressure-driven processes, was the main contributor to SSC during this stage.
In contrast, under liquefied conditions (Stage III), the correlation pattern shifted markedly, highlighting the role of liquefaction as a primary driver of sediment resuspension. While the strong inter-PWP correlations persisted (ρ > 0.81, p < 0.01), significant positive correlations emerged between SSC and PWPs at 2 cm and 14 cm depths (PWP_2CM_III: ρ = 0.20, p = 0.013; PWP_14CM_III: ρ = 0.20, p = 0.011). These results provide statistical evidence that the sharp rise in pore pressure, which indicates sediment liquefaction and loss of effective stress, triggered large-scale sediment entrainment [28]. The transformation of the seabed surface into a liquefied layer substantially reduced its critical shear stress, enabling resuspension by wave-induced turbulence and leading to the observed increase in SSC.
However, the relatively weak positive correlations and their absence at certain depths are equally informative. They indicate that while pore pressure buildup is a necessary trigger for liquefaction, it is not the sole determinant of SSC. The magnitude and persistence of suspension are strongly modulated by post-liquefaction processes, including the spatial patchiness of liquefaction, the thickness of the liquefied layer, and the advective transport and mixing induced by ambient currents and turbulence. This decoupling between the initiation of erosion and the sustenance of suspension explains the modest correlation coefficients and reflects the inherent complexity of sediment dynamics.

4.2. Correlation Analysis Between Porewater Pressure and Suspended Sediment Grain Size Variations

After wave loading, the median grain size of suspended sediments increased during the low-wave stage but decreased during the high-wave stage. In Stage III, the median grain size of suspended particles decreased rapidly over time, and overall, the median grain size in Stage II was larger than that in Stage III. This trend indicates that the enhanced wave intensity in Stage III increased the porewater pressure, eventually triggering soil liquefaction. Soil liquefaction is a process that occurs under dynamic loading, during which soil particles tend to rearrange into a denser configuration. This leads to a rapid rise in porewater pressure, a sharp reduction in effective stress, and ultimately a loss of shear strength. Under high wave heights, the shear action of waves on the sediment bed becomes stronger, promoting particle rearrangement and pore space reduction, which accelerates the buildup of porewater pressure. As inter-particle interactions and friction decrease, finer particles (e.g., clay and silt), due to their smaller size and lower settling velocity, are more easily entrained and transported by the flow. In contrast, coarser particles (e.g., sand) may settle due to gravity or accumulate around local flow structures, forming residual layers [26,30,31].
Therefore, the observation that the median grain size of suspended sediments in Stage II is generally larger than that in Stage III supports the conclusion that increased wave intensity leads to greater pore pressure fluctuations, and the progressive accumulation of pore pressure in Stage III results in sediment liquefaction.

4.3. Effects of Wave-Induced Disturbance on the Release of PAHs into the Overlying Water

The conceptual diagram of release processes of PAHs from sediment into seawater is illustrated in Figure 14.
In Stage I, during the initial period of the experiment, the concentration of dissolved polycyclic aromatic hydrocarbons (PAHs) in the overlying water was relatively high. Interestingly, PAH concentrations at 40 cm above the sediment surface were consistently higher than those at 5 cm. This pattern is attributed to the hydrodynamic disturbance generated during the water-filling process, which scoured the surface sediment and promoted the diffusion of PAHs into the overlying water. Furthermore, because PAHs are less dense than artificial seawater, they exhibited an upward migration tendency, contributing to elevated concentrations in the upper water column. Over a 24 h period, the concentration of dissolved PAHs gradually increased. This increase is primarily driven by two mechanisms: (1) a concentration gradient between the contaminated surface sediment and the overlying water, which facilitated molecular diffusion of PAHs; and (2) the consolidation of water-rich remolded sediments, which, through porewater discharge, mobilized PAHs from the sediment into the water column [4,34].
In Stage II, under wave forcing with a wave height of 5 cm, the concentration of suspended sediments exhibited a slight upward trend (Figure 5). Simultaneously, a distinct divergence in the distribution of polycyclic aromatic hydrocarbons (PAHs) was observed: the concentration of dissolved PAHs decreased in the upper water column but increased near the sediment–water interface. This phenomenon aligns with the findings of Li et al. (2016) [35], who demonstrated that sediment resuspension triggers phase redistribution of PAHs, with low-molecular-weight compounds preferentially partitioning into the dissolved phase. This phenomenon can be attributed to three primary mechanisms. First, the oscillatory pressure gradients generated by alternating wave crests and troughs induced advective porewater flow, facilitating the upward transport of PAHs from the sediment matrix [11,35]. Second, the elevated pore pressure triggered partial resuspension of surface sediments, promoting the release of low-molecular-weight PAHs. Due to their higher water solubility and stronger affinity for the dissolved phase, these compounds contributed to an increase in dissolved PAH concentrations [36,37,38,39]. Third, in the upper water column, the presence of fine suspended particles with high specific surface areas provided ample vacant adsorption sites. This facilitated the adsorption of dissolved PAHs onto particulates, thereby reducing their concentrations in the aqueous phase [40,41].
In Stage III, the wave height increased to 12 cm, inducing a progressive buildup of porewater pressure within the sediment bed. When the pressure surpassed the sediment’s effective stress threshold, liquefaction ensued, as visually confirmed by the transition of the sediment from a cohesive solid to a fluidized state. This phenomenon triggered a sharp increase in suspended sediment concentrations in the water column, accompanied by a pronounced surge in dissolved PAH levels, increasing approximately threefold compared to pre-liquefaction conditions. As summarized by Berríos-Rolón et al. (2025) [42], sediment liquefaction under extreme hydrodynamic conditions is a critical yet understudied pathway for PAH remobilization in deltaic environments. The liquefaction process significantly intensified sediment–water mixing, facilitating the rapid release of both dissolved and particle-bound PAHs [43]. Concurrently, fine sediment particles remaining preferentially suspended in the upper water column acted as efficient PAH carriers, leading to the enrichment of particulate-bound PAHs [44]. Due to sorption processes, this resulted in a relative decline in the dissolved PAH fraction in the upper layer [16].
To quantitatively evaluate the linkage between SSC and PAHs during these two stages, the normality of the datasets (n = 11) was assessed and results are presented in Table 4. Shapiro–Wilk tests indicated marginal normality for SSC (p = 0.091) but significant non-normality for PAHs (p = 0.029). Given the non-normality of PAHs, Spearman’s rank correlation was employed, revealing a significant positive relationship between SSC and PAHs across Stages II and III (ρ = 0.673, p = 0.023), as illustrated in Table 5. This statistical evidence corroborates the mechanistic interpretation that elevated SSC promotes PAH mobilization via adsorption and co-transport processes.
Together, these results demonstrate that both moderate resuspension and intense liquefaction can mobilize PAHs, but through distinct mechanisms. Stage II is characterized by phase redistribution governed by adsorption–desorption dynamics, whereas Stage III liquefaction enhances large-scale sediment–water exchange, resulting in a stronger coupling between SSC and PAHs. A similar relationship has been reported in resuspension experiments with sediments from Toulon Bay (northwestern Mediterranean Sea, France), where the remobilization of PAH-enriched sediments led to marked increases in dissolved PAH concentrations [44].
The differential release patterns of PAH congeners observed in Figure 7 can be directly attributed to their fundamental physicochemical properties, which govern their partitioning behavior between sediment and water phases. The significantly higher aqueous concentrations of 2–3 ring PAHs (e.g., naphthalene, fluorene, and phenanthrene) throughout all experimental stages are a direct consequence of their higher aqueous solubility and lower octanol–water partition coefficients (Kow). For instance, naphthalene (2-ring) has a solubility of 31.5 mg/L and log Kow of 3.37 [45], facilitating its rapid desorption and dissolution into the overlying water, even under static conditions (Stage I). This explains its continuous concentration increase during Stage I and its pronounced response to hydrodynamic disturbances in Stage III.
In contrast, the limited detection and lower concentrations of 4–6 ring PAHs (exemplified by fluoranthene, pyrene, and benzo[g,h,i]perylene) are fundamentally constrained by their low solubility and high hydrophobicity. Pyrene (4-ring) has a solubility of 0.13 mg/L and a log Kow of 4.88 [45], indicating a strong tendency to adsorb onto sedimentary organic matter. Their large molecular size and planar structure further enhance their affinity for sediment matrices, resulting in resistant sorption and limited mobility. This is also proved by findings of PAHs. Consequently, even under the energetic conditions of Stage III (12 cm wave action), the release of these high-molecular-weight PAHs was markedly suppressed compared to their low-molecular-weight counterparts.
The wave-induced release dynamics further highlight this physicochemical control. In Stage II (5 cm waves), the decrease in 2–3 ring PAHs may reflect dilution or mild aerobic degradation enhanced by mixing. The dramatic resurgence of low-molecular-weight PAHs in Stage III underscores their responsiveness to physical perturbation; their weak sorption allows them to be readily mobilized by shear stress and advective flow. The subdued response of high-molecular-weight PAHs, which exhibits only a slight concentration increase, reinforces their strong sequestration by sediments. Their release likely requires more intense energy inputs to overcome desorption kinetic limitations or to resuspend sediment particles to which they are tightly bound.

4.4. Migration and Diffusion Processes of PAHs in Sediments

Following each experimental stage, sediment cores were collected and analyzed for PAH concentrations at 2.5 cm depth intervals.
At the conclusion of Stage I, PAH concentrations exhibited a progressive increase from the sediment surface (0 cm), reaching a distinct peak at 5 cm depth (Figure 8). This vertical distribution pattern resulted from two concurrent transport processes: (1) gravity-driven downward migration of PAHs through porewater transport, and (2) upward diffusion along the concentration gradient between surface sediments (high concentration) and overlying water (low concentration). The primary diffusion zone occurred within the 0–5 cm layer, where continuous PAH release into the water column gradually depleted concentrations in surface sediments. Below this depth, diminishing concentration gradients progressively weakened the diffusion driving force, resulting in reduced PAH mobility.
After the cessation of wave forcing in Stage II, PAHs originally concentrated in the contaminated layer began to diffuse into the surrounding sediments. As observed by Li et al. (2016) [35] in successive suspension experiments, such diffusion is driven by porewater advection and particle rearrangement under hydrodynamic forcing. Intense mixing between sediment particles and porewater facilitated the downward migration and dispersion of PAHs, resulting in the concentration peak shifting to greater depths [44,46,47]. This was reflected in the experimental results, which showed a continuous increase in PAH concentrations within the 2.5–12 cm sediment depth range. This general pattern of vertical migration and partitioning is also consistent with broader reviews on PAH deposition and distribution in environmental matrices [48]. The review highlights that low-molecular-weight PAHs (2–3 rings) tend to exhibit higher mobility and diffuse more readily through sediment layers due to their greater aqueous solubility, whereas high-molecular-weight PAHs (4–6 rings) are more strongly adsorbed to organic matter and fine particles, limiting their vertical transport. These general observations align with our experimental findings, where 2–3 ring PAHs migrated deeper into the sediment under wave-induced disturbance, while 4–6 ring congeners remained more confined near the initial contaminated layer.
In Stage III, sediment liquefaction occurred, with a maximum liquefaction depth of 15 cm. During this phase, the overall PAH concentration in the sediment decreased and became more uniformly distributed, with the migration depth extending to 20 cm. This enhanced migration was primarily driven by the rapid accumulation of porewater pressure under high-intensity wave conditions, which disrupted the sediment structure and triggered liquefaction. The resulting vigorous mixing between the sediment and overlying water transformed the sediment into a fluidized state, promoting the release of PAHs into the water column and leading to an overall reduction in residual PAH concentrations in the sediment. Simultaneously, the expansion of seepage channels facilitated the further downward migration of deeply buried contaminants [49].

5. Conclusions

Through systematic wave flume experiments, this study elucidates the complex interplay between hydrodynamic forces and PAH mobilization in coastal sediments. Under static conditions (Stage I), PAH release was primarily driven by molecular diffusion along concentration gradients, with upward migration enhanced by density differences between PAHs and seawater, resulting in higher dissolved PAH concentrations in the upper water column. The sediment profile developed a distinct concentration peak at 5 cm depth, reflecting the balance between upward diffusion and downward porewater transport.
The introduction of moderate wave action (Stage II, 5 cm wave height) revealed nuanced transport dynamics. While wave-induced resuspension enhanced porewater advection, PAH release remained limited due to competing processes. Fine suspended particles with high specific surface areas effectively scavenged dissolved PAHs from the water column, as evidenced by the temporal variations in SSC and D50. Simultaneously, the development of a deeper concentration peak at 12 cm sediment depth indicated active downward migration through the sediment matrix.
High-intensity waves (12 cm wave height) triggered sediment liquefaction, leading to complete homogenization of PAH concentrations throughout the sediment column, a fivefold increase in near-bed dissolved PAHs, and contaminant migration extending to 20 cm depth, highlighting liquefaction’s capacity to fundamentally alter sediment–pollutant interactions.
A wave flume system was employed to enable synchronized monitoring of porewater pressure, suspended sediment concentration (SSC), and PAH release, with high-frequency multi-depth sampling providing detailed characterization of PAH mobilization dynamics. Liquefaction was found to significantly enhance the mobility of low-ring PAHs, and a strong positive correlation between SSC and PAH release, particularly during liquefaction events, identified fine-grained, organic-rich sediment deposits as critical zones for pollution release, emphasizing the need for storm-resilient pollution control strategies. Nevertheless, laboratory-scale flumes may not fully reproduce natural turbulence, and remolded sediments may differ from naturally aged deposits in adsorption–desorption behavior, potentially leading to overestimation of PAH release. Short-duration wave stages also do not capture the full temporal dynamics of storm events, particularly for slow-release high-ring PAHs. Building on these findings, future research should include multi-factor experiments incorporating bio-physical interactions, co-migration with other contaminants, and sediment aging effects, alongside field validation in the Yellow River Delta to test liquefaction thresholds and quantify PAH fluxes under storm conditions. These results further highlight the importance of targeted risk management strategies, such as depth-specific capping or sediment stabilization, to mitigate PAH release in liquefaction-prone areas.

Author Contributions

Conceptualization, F.L. and W.L.; methodology, F.L.; investigation, F.L.; data curation, F.L. and Q.S.; writing—original draft preparation, Q.S.; writing—review and editing, F.L.; visualization, F.L. and Q.S.; supervision, F.L.; project administration, F.L.; funding acquisition, F.L. and W.L. All authors have read and agreed to the published version of the manuscript.

Funding

This research was funded by the National Natural Science Foundation of China (No. 41807247).

Data Availability Statement

The raw data supporting the conclusions of this article will be made available by the authors on request.

Acknowledgments

The authors gratefully acknowledge the invaluable technical and financial support provided by the Observation and Research Station of Seawater Intrusion and Soil Salinization, Laizhou Bay, Ministry of Natural Resources (Qingdao, China). We also extend our sincere thanks to the Shandong Provincial Key Laboratory of Marine Environment and Geological Engineering (Qingdao, China) for their essential technical assistance throughout this research.

Conflicts of Interest

The authors declare no conflicts of interest.

References

  1. Ghandourah, M.A. An insightful overview of the distribution pattern of polycyclic aromatic hydrocarbon in the marine sediments of the Red Sea. Open Chem. J. 2022, 20, 777–784. [Google Scholar] [CrossRef]
  2. Abdel-Shafy, H.I.; Mansour, M.S.M. A review on polycyclic aromatic hydrocarbons: Source, environmental impact, effect on human health and remediation. Egypt. J. Pet. 2016, 25, 107–123. [Google Scholar] [CrossRef]
  3. Montuori, P.; De Rosa, E.; Di Duca, F.; De Simone, B.; Scippa, S.; Russo, I.; Sarnacchiaro, P.; Triassi, M. Polycyclic Aromatic Hydrocarbons (PAHs) in the Dissolved Phase, Particulate Matter, and Sediment of the Sele River, Southern Italy: A Focus on Distribution, Risk Assessment, and Sources. Toxics 2022, 10, 401. [Google Scholar] [CrossRef]
  4. Lu, Z.; Tian, W.; Chen, Z.; Chu, M.; Zhang, S.; Liu, B.; Zhao, J.; Zou, M.; Huo, B.; Xu, G. Release of PAHs from sediments to seawater under wave: Indoor microcosms and level IV fugacity models. J. Hazard. Mater. 2024, 474, 134799. [Google Scholar] [CrossRef]
  5. Maletić, S.P.; Beljin, J.M.; Rončević, S.D.; Grgić, M.G.; Dalmacija, B.D. State of the art and future challenges for polycyclic aromatic hydrocarbons in sediments: Sources, fate, bioavailability and remediation techniques. J. Hazard. Mater. 2019, 365, 467–482. [Google Scholar] [CrossRef]
  6. Dong, J.; Xia, X.; Wang, M.; Xie, H.; Wen, J.; Bao, Y. Effect of recurrent sediment resuspension-deposition events on bioavailability of polycyclic aromatic hydrocarbons in aquatic environments. J. Hydrol. 2016, 540, 934–946. [Google Scholar] [CrossRef]
  7. Li, Y.; Tang, C.; Wang, J.; Acharya, K.; Du, W.; Gao, X.; Luo, L.; Li, H.; Dai, S.; Mercy, J.; et al. Effect of wave-current interactions on sediment resuspension in large shallow Lake Taihu, China. Environ. Sci. Pollut. Res. 2017, 24, 4029–4039. [Google Scholar] [CrossRef]
  8. Ding, Y.; Sun, L.; Qin, B.; Wu, T.; Shen, X. Characteristics of sediment resuspension in Lake Taihu, China: A wave flume study. J. Hydrol. 2018, 561, 702–710. [Google Scholar] [CrossRef]
  9. Ma, Y.; Wang, P.; Hua, Z.; Dong, Y.; Yu, L.; Huang, S. Field study on endogenous perfluoroalkyl acid release and their spatiotemporal distribution processes induced by inland navigation. Sci. Total Environ. 2024, 916, 170394. [Google Scholar] [CrossRef] [PubMed]
  10. Wang, J.; Chai, J.; Xu, R.; Pang, Y. The effects of wind-wave disturbances on sediment resuspension and phosphate release in Lake Chao. Sci. Total Environ. 2024, 912, 169254. [Google Scholar] [CrossRef] [PubMed]
  11. Liu, X.; Liu, S.; Zhao, H.; Jeng, D.S.; Guo, L.; Zheng, T. Numerical investigation of solute migration and release from sediments driven by wave-induced accumulation of porewater pressure. Adv. Water Resour. 2023, 179, 104508. [Google Scholar] [CrossRef]
  12. Li, R.; Feng, C.; Wang, D.; Li, B.; Hu, L.; Shen, Z. Role of salinity in the multiphase redistribution of polycyclic aromatic hydrocarbons (PAHs) in sediment suspension. Environ. Earth Sci. 2016, 75, 116. [Google Scholar] [CrossRef]
  13. Yang, X.; Yu, L.; Chen, Z.; Xu, M. Bioavailability of Polycyclic Aromatic Hydrocarbons and their Potential Application in Eco-risk Assessment and Source Apportionment in Urban River Sediment. Sci. Rep. 2016, 6, 23134. [Google Scholar] [CrossRef]
  14. Duran, R.; Cravo-Laureau, C. Role of environmental factors and microorganisms in determining the fate of polycyclic aromatic hydrocarbons in the marine environment. FEMS Microbiol. Rev. 2016, 40, 814–830. [Google Scholar] [CrossRef] [PubMed]
  15. Hu, W.; Zhang, J.; Li, D.; Yuan, Y.; Tang, Y.; Hui, K.; Jiang, Y.; Tan, W. Study on factors influencing the transport and transformation of polycyclic aromatic hydrocarbons in soil-groundwater systems. Emerg. Contam. 2025, 11, 100472. [Google Scholar] [CrossRef]
  16. Vijayanand, M.; Ramakrishnan, A.; Subramanian, R.; Issac, P.K.; Nasr, M.; Khoo, K.S.; Rajagopal, R.; Greff, B.; Wan Azelee, N.I.; Jeon, B.-H.; et al. Polyaromatic hydrocarbons (PAHs) in the water environment: A review on toxicity, microbial biodegradation, systematic biological advancements, and environmental fate. Environ. Res. 2023, 227, 115716. [Google Scholar] [CrossRef]
  17. Wang, D.; Feng, C.; Huang, L.; Niu, J.; Shen, Z. Historical deposition behaviors of PAHs in the Yangtze River Estuary: Role of the sources and water currents. Chemosphere 2013, 90, 2020–2026. [Google Scholar] [CrossRef]
  18. Ma, J.; Ailijiang, N.; Mamat, A.; Wu, Y.; Luo, X.; Li, M. Fugacity-based multimedia transport modeling and risk assessment of PAHs in Urumqi. Sci. Rep. 2025, 15, 4063. [Google Scholar] [CrossRef]
  19. Method 8260D (SW-846); Volatile Organic Compounds by Gas Chromatography/Mass Spectrometry (GC/MS), Revision 3. U.S. EPA: Washington, DC, USA, 2006.
  20. Method 8275A (SW-846); Semivolatile Organic Compounds in Soil/Sludges and Solid Wastes Using Thermal Extraction/Gas Chromatography/Mass Spectrometry (TE/GC/MS). U.S. EPA: Washington, DC, USA, 1996.
  21. Lu, F.; Zhang, H.Q.; Jia, Y.G.; Liu, W.; Wang, H. Migration and Diffusion of Heavy Metal Cu from the Interior of Sediment during Wave-Induced Sediment Liquefaction Process. J. Mar. Sci. Eng. 2019, 7, 449. [Google Scholar] [CrossRef]
  22. GBT 26411-2010; Marine Water Quality—Determination of 16 Polycyclic Aromatic Hydrocarbons—Gas Chromatography-Mass Spectrometry. General Administration of Quality Supervision, Inspection and Quarantine of the People’s Republic of China, Standardization Administration of the People’s Republic of China: Beijing, China, 2011.
  23. HJ 805-2016; Water Quality—Determination of 16 Polycyclic Aromatic Hydrocarbons in Sediments—Gas Chromatography-Mass Spectrometry. Ministry of Environmental Protection of the People’s Republic of China: Beijing, China, 2016.
  24. Liu, X.; Jia, Y.; Zheng, J.; Wen, M.; Shan, H. An Experimental Investigation of Wave-induced Sediment Responses in a Natural Silty Seabed: New Insights into Seabed Stratification. Sedimentology 2016, 64, 508–529. [Google Scholar] [CrossRef]
  25. Tong, L.L.; Zhang, J.S.; Chen, N.; Lin, X.F.; He, R.; Sun, L. Internal solitary wave-induced soil responses and its effects on seabed instability in the South China Sea. Ocean Eng. 2024, 310, 118697. [Google Scholar] [CrossRef]
  26. Liu, X.; Jia, Y.; Zheng, J.; Hou, W.; Zhang, L.; Zhang, L.; Shan, H. Experimental evidence of wave-induced inhomogeneity in the strength of silty seabed sediments: Yellow River Delta, China. Ocean. Eng. 2013, 59, 120–128. [Google Scholar] [CrossRef]
  27. Tzang, S.; Ou, S. Laboratory flume studies on monochromatic wave-fine sandy bed interactions: Part 1. Soil fluidization. Coast. Eng. 2006, 53, 965–982. [Google Scholar] [CrossRef]
  28. Tzang, S.; Ou, S.; Hsu, T. Laboratory flume studies on monochromatic wave-fine sandy bed interactions Part 2. Sediment suspensions. Coast. Eng. 2009, 56, 230–243. [Google Scholar] [CrossRef]
  29. Niu, J.; Xu, J.; Dong, P.; Li, G. Porewater pressure responses in silty sediment bed under random wave action. Sci. Rep. 2019, 9, 11685. [Google Scholar] [CrossRef]
  30. Xu, X.B.; Xu, G.H.; Yang, J.J.; Xu, Z.Q.; Ren, Y.P. Field observation of the wave-induced pore pressure response in a silty soil seabed. Geo-Mar. Lett. 2021, 41, 13. [Google Scholar] [CrossRef]
  31. Liu, X.; Lu, Y.; Yu, H.; Ma, L.; Li, X.; Li, W.; Zhang, H.; Bian, C. In-Situ Observation of Storm-Induced Wave-Supported Fluid Mud Occurrence in the Subaqueous Yellow River Delta. J. Geophys. Res. Ocean. 2022, 127, e2021JC018190. [Google Scholar] [CrossRef]
  32. Sun, Y.; Zhang, S.; Lan, J.; Xie, Z.; Pu, J.; Yuan, D.; Yang, H.; Xing, B. Vertical migration from surface soils to groundwater and source appointment of polycyclic aromatic hydrocarbons in epikarst spring systems, southwest China. Chemosphere 2019, 230, 616–627. [Google Scholar] [CrossRef]
  33. Baas, J.H.; Manica, R.; Puhl, E.; de Oliveira Borges, A.L. Thresholds of intrabed flow and other interactions of turbidity currents with soft muddy substrates. Sedimentology 2016, 63, 2002–2036. [Google Scholar] [CrossRef]
  34. Dong, J.; Xu, J.; Li, G.; Li, A.; Zhang, S.; Niu, J.; Xu, X.; Wu, L. Experimental Study on Silty Seabed Liquefaction and Its Impact on Sediment Resuspension by Random Waves. J. Mar. Sci. Eng. 2022, 10, 437. [Google Scholar] [CrossRef]
  35. Li, R.; Feng, C.; Wang, D.; Li, B.; Shen, Z. Multiphase redistribution differences of polycyclic aromatic hydrocarbons (PAHs) between two successive sediment suspensions. Front. Environ. Sci. Eng. 2016, 10, 381–389. [Google Scholar] [CrossRef]
  36. Li, C.; Wang, Y.; Gao, F.; Yang, L. Spatiotemporal evolution of excess pore pressures in a silty seabed under progressive waves during residual liquefaction. Appl. Ocean Res. 2022, 129, 103401. [Google Scholar] [CrossRef]
  37. Wang, L.; Zhang, J.; Jeng, D.; Zhang, Q.; Chen, T. Experimental study on the dynamic response of a silty seabed under waves. Ocean. Eng. 2023, 269, 113554. [Google Scholar] [CrossRef]
  38. Yang, Z.; Feng, J.; Niu, J.; Shen, Z. Release of polycyclic aromatic hydrocarbons from Yangtze River sediment cores during periods of simulated resuspension. Environ. Pollut. 2008, 155, 366–374. [Google Scholar] [CrossRef]
  39. Lu, Z.; Tian, W.; Zhang, S.; Chu, M.; Zhao, J.; Jiang, J.; Zou, M.; Liu, B. A study combining a sediment-seawater microcosm with multimedia fugacity model to evaluate the effect of tidal cycles on polycyclic aromatic hydrocarbon release from sediments. Sci. Total Environ. 2023, 891, 164340. [Google Scholar] [CrossRef] [PubMed]
  40. Liu, K.; Wang, X.; Zhang, H.; Wei, Y.; Zhao, G.; Liu, X.; Cui, H.; Han, J. Sources, transport and fate of polycyclic aromatic hydrocarbons (PAHs) in a typical river-estuary system in the North China: From a new perspective of PAHs loading. Mar. Pollut. Bull. 2025, 117, 692. [Google Scholar] [CrossRef]
  41. Usanase, G.; Azema, N.; El Bitouri, Y.; Souche, J.-C.; Gonzalez, C. Contribution of settling measurements to the study of polycyclic aromatic hydrocarbons’ (PAHs) mobilisation during resuspension of PAHs-associated sediment. Environ. Sci. Pollut. Res. 2021, 28, 68349–68363. [Google Scholar] [CrossRef] [PubMed]
  42. Berríos-Rolón, P.J.; Cotto, M.C.; Márquez, F. Polycyclic Aromatic Hydrocarbons (PAHs) in Freshwater Systems: A Comprehensive Review of Sources, Distribution, and Ecotoxicological Impacts. Toxics 2025, 13, 321. [Google Scholar] [CrossRef]
  43. Yan, D.; Meng, L.; Li, H.; Song, T.; Sun, P.; Bao, M.; Li, X. Petroleum hydrocarbon release behavior study in oil-sediment aggregates: Turbulence intensity and chemical dispersion effect. RSC Adv. 2019, 9, 7922–7931. [Google Scholar] [CrossRef]
  44. Guigue, C.; Tedetti, M.; Dang, D.; Mullot, J.; Garnier, C.; Goutx, M. Remobilization of polycyclic aromatic hydrocarbons and organic matter in seawater during sediment resuspension experiments from a polluted coastal environment: Insights from Toulon Bay (France). Environ. Pollut. 2017, 229, 627–638. [Google Scholar] [CrossRef]
  45. Mackay, D.; Shiu, W.Y.; Ma, K.C.; Lee, S.C. Handbook of Physical-Chemical Properties and Environmental Fate for Organic Chemical; CRC Press: Boca Raton, FL, USA, 2006. [Google Scholar]
  46. Castillo-Ilabaca, C.; Gutiérrez, M.H.; Aranda, M.; Henríquez-Aedo, K.; Pereira, A.; Salamanca, M.; Galand, P.E.; Jessen, G.L.; Pantoja-Gutiérrez, S. PAH contamination in coastal surface sediments. Sci. Rep. 2024, 15, 12345. [Google Scholar] [CrossRef]
  47. Wang, L.; Yang, Z. Simulation of polycyclic aromatic hydrocarbon remobilization in typical active regions of river system under hydrodynamic conditions. J. Soils Sediments 2010, 10, 1380–1387. [Google Scholar] [CrossRef]
  48. Shubhankar, B.; Ambade, B. A Review on Deposition, Distribution of Polycyclic Aromatic Hydrocarbons in Different Environmental Matrix and Study Its Toxicity and Carcinogenic Effect. Asian J. Chem. 2016, 28, 2341–2345. [Google Scholar] [CrossRef]
  49. Minick, D.J.; Anderson, K.A. Diffusive flux of PAHs across sediment-water and water-air interfaces at urban Superfund sites. Environ. Toxicol. Chem. 2017, 36, 2281–2289. [Google Scholar] [CrossRef]
Figure 1. Sampling location at Diao Kou Pile tidal flat in the Yellow River Estuary.
Jmse 13 01661 g001
Figure 2. Diagram of wave flume device.
Jmse 13 01661 g002
Figure 3. Schematic diagram of the bottom sediment deposition.
Jmse 13 01661 g003
Figure 4. Variation in porewater pressure under different wave heights.
Jmse 13 01661 g004
Figure 5. Temporal variation in SSC and D50 of suspended sediment measured 5 cm above the sediment surface under different wave height conditions.
Jmse 13 01661 g005
Figure 6. Characteristics of the concentration of dissolved PAHs in the overlying water at 5 cm and 40 cm above the sediment at different experimental stages: (a) static diffusion stage (Stage I), (b) wave action at 5 cm wave height (Stage II), and (c) wave action at 12 cm wave height (Stage III) (Error bars denote the mean absolute deviation (MAD) calculated from parallel samples).
Jmse 13 01661 g006
Figure 7. Temporal variation in the concentrations of individual dissolved PAH monomers in the overlying water at different experimental stages: (a) static diffusion stage (Stage I), (b) wave action at 5 cm wave height (Stage II), and (c) wave action at 12 cm wave height (Stage III).
Jmse 13 01661 g007
Figure 8. Vertical distribution of PAHs content in sediments at the end of Stage I, II, and III (Error bars denote the mean absolute deviation (MAD) calculated from parallel samples).
Jmse 13 01661 g008
Figure 9. Particulate PAH monomer concentrations at the end of Stage I.
Jmse 13 01661 g009
Figure 10. Particulate PAH monomer concentrations at the end of Stage II.
Jmse 13 01661 g010
Figure 11. Particulate PAH monomer concentrations at the end of Stage III.
Jmse 13 01661 g011
Figure 12. Spearman correlation between porewater pressure and SSC during Stage II (Note: PWP in this figure denotes porewater pressure).
Jmse 13 01661 g012
Figure 13. Spearman correlation between porewater pressure and SSC during Stage III (Note: PWP in this figure denotes porewater pressure).
Jmse 13 01661 g013
Figure 14. Conceptual diagram of release processes of PAHs from sediment into seawater.
Jmse 13 01661 g014
Table 1. Wave parameters and sampling time.
Test StageWave ParametersDurationSampling Time
Wave Height (cm)Period (s)
Static diffusion (Stage I)--84 h12 h/session
5 cm wave height (Stage II)5.02.4120 min30 min/session
12 cm wave height (Stage III)12.01.2150 min30 min/session
Table 2. Method quantification limits (LOQs) and detection limits (LODs) for individual PAHs in sediment and water.
Individual PAHsSedimentWater
LOD (mg/kg, dw)LOQ (mg/kg, dw)LOD (ng/L)LOQ (ng/L)
Naphthalene0.09 0.36 20.00 80.00
Acenaphthylene0.09 0.36 3.00 12.00
Acenaphthene0.12 0.48 2.90 11.60
Fluorene0.08 0.32 6.30 25.20
Phenanthrene0.10 0.40 12.00 48.00
Anthracene0.12 0.48 2.20 8.80
Fluoranthene0.14 0.56 3.20 12.80
Pyrene0.13 0.52 3.20 12.80
Benzo[a]anthracene0.12 0.48 2.40 9.60
Chrysene0.14 0.56 4.40 17.60
Benzo[b]fluoranthene0.17 0.68 2.60 10.40
Benzo[k]fluoranthene0.11 0.44 4.10 16.40
Benzo[a]pyrene0.17 0.68 2.90 11.60
Indeno[1,2,3-cd]pyrene0.13 0.52 2.40 9.60
Dibenzo[a,h]anthracene0.13 0.52 3.10 12.40
Benzo[g,h,i]perylene0.12 0.48 4.10 16.40
Table 3. Normality test of porewater pressure and SSC in Stage II and Stage III.
Shapiro–Wilk
StatisticDegrees of FreedomSig. (p-Value)
PWP_2CM_II0.9611200.001
PWP_8CM_II0.8491200.000
PWP_14CM_II0.8611200.000
PWP_20CM_II0.7641200.000
SSC_II0.8051200.000
PWP_2CM_III0.9351520.000
PWP_8CM_III0.7771520.000
PWP_14CM_III0.9781520.016
PWP_20CM_III0.9441520.000
SSC_III0.9691520.002
Note: PWP_2CM_II denotes the porewater pressure at a depth of 2 cm during Stage II; SSC_II denotes the suspended sediment concentration during Stage II. Other variables are defined in the same manner.
Table 4. Normality test of SSC and PAHs concentration.
Shapiro–Wilk Tests of Normality
StatisticDegrees of FreedomSig. (p-Value)
SSC0.876110.091
PAHs0.837110.029
Table 5. Spearman correlation of SSC and PAHs concentration.
Spearman Correlations
SSCPAHs
SSCCorrelation Coefficient ρ1.0000.673 *
Sig. (2-tailed) 0.023
N1111
PAHsCorrelation Coefficient ρ0.673 *1.000
Sig. (2-tailed)0.023
N1111
* Correlation is significant at the 0.05 level (2-tailed).
Disclaimer/Publisher’s Note: The statements, opinions and data contained in all publications are solely those of the individual author(s) and contributor(s) and not of MDPI and/or the editor(s). MDPI and/or the editor(s) disclaim responsibility for any injury to people or property resulting from any ideas, methods, instructions or products referred to in the content.