Article

Numerical Study on High-Speed Icebreaking of a Hemispherically Capped Cylinder Based on the Smoothed Particle Hydrodynamics Method

1
China Ship Scientific Research Center, Wuxi 210084, China
2
Key Laboratory of Unsteady Aerodynamics and Flow Control, Ministry of Industry and Information Technology, Nanjing University of Aeronautics and Astronautics, Nanjing 210016, China
3
School of Physical and Mathematical Sciences, Nanjing Tech University, Nanjing 211816, China
*
Author to whom correspondence should be addressed.
J. Mar. Sci. Eng. 2025, 13(9), 1637; https://doi.org/10.3390/jmse13091637
Submission received: 10 July 2025 / Revised: 20 August 2025 / Accepted: 22 August 2025 / Published: 27 August 2025
(This article belongs to the Section Ocean Engineering)

Abstract

This work develops an Updated Lagrangian Smoothed Particle Hydrodynamics (ULSPH) framework to simulate high-speed icebreaking by a hemispherically capped cylinder (HCC). Using a self-programmed C++ code with Drucker–Prager damage criteria, this work systematically analyzes how impact velocity (100–200 m/s), ice thickness (10–40 cm), and impact angle (60–90°) govern structural loads and ice failure modes. The head of the HCC is always the stress concentration area, and the peak value of the impact force increases non-linearly with increasing the initial velocity from 100 m/s to 200 m/s. The increase in ice layer thickness from 10 cm to 40 cm raises the peak value of the impact force by 18.1%. The ice layer deformation shows three-stage characteristics: collision depression, penetration perforation, and through-spray. When the impact angle α is non-vertical, the strain of the ice layer is asymmetrically distributed, and the component of the peak impact force along the y direction increases significantly with the decrease in the impact angle, reaching 129.3 kN at α = 60°. Results reveal velocity-driven nonlinear force amplification, asymmetric strain distribution at oblique angles, and critical stress concentration at the HCC head, providing design insights for polar equipment.

1. Introduction

The vast polar resources and their unique landform features will enable polar regions to play a significant role in resource extraction and oceanic shipping. Consequently, this will inevitably trigger a new wave of polar research around the world [1]. The polar regions are covered year-round by ice sheets, with thicknesses ranging from several centimeters to meters [2]. The extensive ice sheets severely hinder the normal navigation of ships. Therefore, icebreaking and obstacle removal are the primary challenges in conducting polar research and exploiting polar natural resources.
As a common crystalline material in natural environments, the mechanical properties of ice are influenced by various factors such as environmental temperature, crystal structure, and salinity content [3], resulting in significant differences in mechanical performance among different types of ice. For example, the elastic modulus of sea ice [4] and freshwater ice may differ by several times due to these factors [5]. Additionally, ice exhibits different mechanical behaviors under various loading conditions. Therefore, accurately understanding the mechanical properties of ice is crucial for studying the load and deformation characteristics during ice–structure interactions. Relevant research around the world mainly focuses on experimental studies. Based on these experiments, researchers have proposed numerous numerical models of ice [6,7,8,9,10,11,12,13,14,15,16,17,18]. It has been found that theoretical models of ice primarily consider damage and failure caused by plastic failure. Currently, two widely used failure criteria under loading are the Drucker–Prager failure criterion [6] and the Tsai–Wu yield criterion [8]. The Drucker–Prager criterion is suitable for high-speed impacts on ice, while the Tsai–Wu criterion applies to lower loading rates.
For the problem of vertical icebreaking, many scholars have conducted a series of related experiments and numerical simulations through applying hemispherically capped cylinders (HCCs) as ice breaker [19,20,21,22,23,24,25,26,27,28,29,30,31,32]. Zhang et al. used a contact coupling method to study the collision process between a slender vessel with a length of 0.243 m, diameter 0.04 m, and maximum sailing speed 6 m/s at a 4.13 m launch depth, where the water surface is pierced vertically and collides with floating ice. In that collision study, the ice was modeled as a rigid body [19]. Zhao established ice models with different porosities based on experiments and performed numerical simulations of the low-speed icebreaking process of the underwater vessel moving upward in water without water presence. As the vessel continuously moves upward, the ice layer fractures and accumulates. Additionally, that research analyzed the effects of various conditions such as different ice thicknesses, loading speeds, and hull shapes on the ice failure modes and icebreaking loads [20]. Using a Coupled Eulerian–Lagrangian (CEL) method, Cui et al. performed numerical simulations of high-speed water entry icebreaking of slender bodies, analyzing stress development, failure phenomena of the ice layer, and the load characteristics of the slender body under conditions of no ice and various ice thicknesses [23]. Qian first studied existing constitutive models of ice and damage criteria. Subsequently, multiple vessel configurations were used to perform waterless numerical simulations of vessel icebreaking, with parametric studies on different ice thicknesses and buoyant speeds. In the simulations, various ice material models and damage criteria were employed to simulate the mechanical behavior during ice failure, and the impact loads and failure characteristics of different material models were compared. The study concluded that an isotropic elastoplastic model with Drucker–Prager damage criteria could better reflect the mechanical properties of ice in numerical simulations [24].
High-velocity impact problems involve significant deformation and destruction. Finite Element Method (FEM), commonly used to study collision issues, cannot be applied due to serious mesh distortion. The meshless methods currently under extensive research, which do not rely on mesh discretization, are suitable for solving large deformation problems such as icebreaking processes of vessels. Smoothed Particle Hydrodynamics (SPH) is a typical meshless algorithm that combines the advantages of Lagrangian methods. It is currently the most widely used, rapidly developing, and increasingly mature class of methods, and has been developed and widely applied in solid mechanics [33,34,35,36,37,38,39,40,41,42].
With the continuous development of SPH in the field of solid mechanics, many studies have used SPH methods to simulate ice damage and failure [43,44,45,46,47]. Anghileri et al. used Lagrangian, Arbitrary Lagrangian–Eulerian (ALE), and SPH methods to establish models of hail. The comparative studies found that, compared to the other two methods, SPH not only avoided mesh distortion issues caused by large impact deformations but also offered higher computational accuracy and shorter computation times, effectively capturing the mechanical behavior during ice impact [44]. Based on a viscoelastic ice constitutive model, Mokhtari et al. used Lagrangian-ALE, ALE-FEM, and FEM-SPH methods to simulate the icebreaking through cone-shaped objects. They found that the load obtained by FEM-SPH had the smallest error compared to experiments, owing to the higher deformation limits of particles of SPH compared to elements of FEM when handling large solid deformations [47]. To address large deformation problems in solids, Gray proposed an Updated Lagrangian Smoothed Particle Hydrodynamics (ULSPH) method, which uses the current configuration as the updated reference configuration instead of the initial configuration [39]. The ULSPH method was also employed to numerically simulate the dynamic brittle failure points of solids, enabling calculations of fractures from the external surface to the interior of solids. This method improves upon the discontinuity issues caused by damage and fracture during solid deformation and has been widely used in solid structural analysis, including the simulation of mechanical behaviors of metals, soils, rubber, ice, and other solid materials [48].
The research above indicates that, with continuous development and improvement, the SPH method has demonstrated good effectiveness and accuracy in large deformation of solids, solid impact, and solid damage and failure, and has been applied to icebreaking problems. However, the research on the longitudinal icebreaking of high-speed HCCs is still insufficient, and the impact loads and deformation of solids during high-speed collisions between HCCs and ice have not been comprehensively and thoroughly studied. Therefore, relevant numerical simulation research on high-speed icebreaking of HCCs needs to be improved and supplemented. This study mainly focuses on the development of a meshless particle algorithm based on the SPH method for the process of high-speed HCC icebreaking through an infinite ice sheet. First, an SPH algorithm suitable for high-speed impact penetration of HCCs is established, and a Visual Studio 2022 C++ program is independently developed in the Windows 10 environment with Visual Studio 2022. Then, numerical calculations are performed on typical cases using a self-developed program to verify its reliability and the correctness of related settings. The C++ code uses the native Windows API for CPU parallelization and was validated for scalability up to 48 cores. Based on this, detailed and in-depth numerical simulation parametric studies of the rigid HCC icebreaking process under various conditions are conducted.

2. Theory and Numerical Methods

2.1. Principles of the SPH Method

The SPH method is a Lagrangian particle method, wherein the computational domain is composed of a set of discrete particles [49]. Each particle is assigned physical properties such as mass, density, pressure, and velocity. Based on these particles, the time derivatives of various physical quantities can be obtained using the SPH kernel approximation algorithm, which allows the time integration of the physical process of the flow. The kernel approximation of a field function f(r) at a spatial position r, f ( r ) , can be expressed as:
f ( r ) = Ω f ( r ) W ( r r , h ) d V r
where W ( r r , h ) is the smoothing kernel function, h is the smoothing length, and V is the volume. Ω represents the support domain of the smoothing kernel function, which is a function of h. A good tradeoff between the computational accuracy and the kernel approximation cost can be realized using the Wendland kernel function, which is expressed as:
W ( r r , h ) = α D 1 q 2 4 ( 2 q + 1 ) ,   α D = 7 / 4 π h 2 2 D 21 / 16 π h 3 3 D
where D is the dimensions of the computational domain and q is the dimensionless variable, expressed as q = (rr*)/h. As the computational domain is composed of a set of discrete particles with physical properties, the continuous format of the kernel approximation, as expressed in Equation (1), should be transformed into a discrete one:
f ( r i ) = j = 1 N f ( r j ) W ( r i r j , h ) V j
where N is the total number of particles located in the support domain of particle i. Vj is the virtual volume of the neighboring particle j, which is the ratio of the mass mj to the density ρj.

2.2. Governing Equations of the SPH Method

2.2.1. Spatial Discretization of the Deformation Tensor

For solid deformation, it is first necessary to define the deformation tensor F:
F = 0 r = 0 u + I
where F is the deformation tensor, u = rr0 and r0 are the current position vector and the initial position vector of the material element, respectively, and I is the identity matrix. In the Lagrangian form, the governing equation of the solid can be expressed as:
ρ = J 1 ρ 0   ρ 0 u ¨ = 0 P T  
where ρ and ρ 0 represent the current density and initial density of the solid, J = det F , u ¨ is the acceleration, P is the first-order of stress tensor of Piola–Kirchhoff, the superscript T indicates the transpose matrix, and P can be expressed in terms of Kirchhoff stress τ as:
P = τ F T
To ensure consistency of the first-order, the gradient of kernel function is introduced to correct matrix of B , with the expression:
B i 0 = j V j 0 r j 0 r i 0 i 0 W i j 1
The update of the deformation tensor is based on its rate of change over time, with the corresponding discrete form of SPH being:
d F i d t = F ˙ i = 0 u . i = j V j 0 ( u j u i ) i 0 W i j B i 0
Introducing the Kelvin–Voigt damping model, the Kirchhoff stress τ is expressed as:
τ d = χ 2 d b d t
where the artificial viscosity factor is expressed as χ = ρ C h / 2 . Here, C is the artificial sound speed C = K / ρ and K is the bulk modulus. b is the deformation gradient tensor of the left Cauchy–Green, and its rate of deformation in discrete form is:
d b d t = d F d t F T + F d F d t T

2.2.2. Decomposition of Stress Tensor

Within the ULSPH framework, the stress tensor σ is decomposed into a spherical part p I and a deviatoric part S :
σ = p I + S
The pressure P can be expressed as a function of the strain tensor ε :
P = λ t r ( ε ) + 2 μ ε
where λ and μ are the first and second Lamé constants, respectively. Similarly, S can also be expressed as a function of the strain tensor ε :
S = 2 μ ε 1 3 t r ( ε ) I
Pressure can be expressed as a function of density ρ based on the state equation of gas:
P = c 0 ( ρ ρ 0 ) 2
where c0 is the artificial sound speed. The bulk modulus K can be expressed as:
K = λ + 2 3 μ
According to the generalized Hooke’s law, the variation of d S over time is expressed as a function of the strain rate:
D S D t = 2 μ ε . 1 3 t r ( ε . ) I + Ω S S Ω
where ε ˙ represents the tensor of the strain rate, expressed as ε ˙ = u + ( u ) T / 2 and Ω represents the rotation tensor, expressed as Ω = ( u ( u ) T ) / 2 .

2.2.3. Governing Equations for Solids Under ULSPH Form

Within the ULSPH framework, the governing equations for solids, including the mass conservation equation and the momentum conservation equation, are discretized according to the form provided by Khyaaer [50]. The mass conservation equation is expressed as:
D ρ i D t = ρ i j u ^ i j i w i j V j
The momentum conservation equation is expressed as:
D u i D t = j m j σ j + σ i ρ i ρ j i w i j + Π i AV
where σ is the Cauchy stress tensor, u ^ is the transport velocity of particles, and u ^ i j = u ^ j u ^ i with u ^ i = D r i / D t . Π i A V is the discrete form of the artificial viscosity tensor which will be elaborated in the next section. When calculating the Cauchy stress tensor and the deviatoric stress part, the velocity gradient needs to be approximated by integration:
u i = j u ^ i j i w i j V j

2.3. Numerical Processing Techniques

The traditional SPH method is often unstable, requiring the introduction of numerical processing techniques to stabilize the computation. This section mainly introduces several numerical stabilization techniques, including artificial viscosity, density dissipation, density initialization, and particle displacement techniques. Artificial viscosity needs to be introduced to improve the tensile instability in the SPH method when handling interface deformation [51]. The discrete form of the artificial viscosity tensor Π i A V is:
Π i AV = j m j Π i j AV i w i j
The formula for artificial viscosity Π i A V is:
Π i j AV = α AV h c i j ρ i j u i j r i j r i j 2 + ( 0.1 h ) 2 u i j r i j < 0   0 u i j r i j 0  
where ρ i j = ρ i + ρ j 2 , C i j = C i + C j 2 , u i j = u j u i , r i j = r j r i , α A V is an adjustable parameter, set to 1.0 in this work.
When solving solid deformation with the SPH method, particle stacking may occur, leading to numerical instability. Therefore, artificial stress is introduced to prevent particles in tensile stress states from clustering [51]. The expression for artificial stress Γ i is:
Γ i = j m j f i j A V R j + R i ρ i ρ j i w i j
where f i j AV is the artificial repulsive force. It is expressed as:
f i j A V = ε w i j w ( d 0 ) ω
where d 0 is the initial particle spacing. ε and β are adjustable parameters, which are set as 0.15 and 8, respectively. R i and R j represent the artificial stress tensors of particle i and particle j. A simple form is given by Monaghan:
R i α β = ε σ i α β ρ 2 ,   σ i α β > 0 0 ,   σ i α β > 0
where the superscript α, β indicate the Cartesian component [52].
In the ULSPH method, parameters carried by solid particles are calculated in the current configuration, and the reference configuration of the solid needs to be updated over time:
x y z n + 1 = x y z n + Δ t v x v y v z n + 1 / 2
where v x , v y , and v z are velocity components of the particle in x, y, and z directions, respectively. The Verlet time integration scheme is adopted in this work, updating the deformation tensor, particle density, and particle position once every half time step [53]. During the first half of the step:
F n + 1 2 = F n + 1 2 Δ t F ˙ n   ρ n + 1 2 = ρ 0 1 J   r n + 1 2 = r n + 1 2 Δ t u ˙ n
Then, the particle velocities are updated once per time step:
u ˙ n + 1 = u ˙ n + Δ t u ¨ n + 1
Substituting u ˙ n + 1 into Equation (8), the change rate of the tensor of the deformation gradient at the time step n + 1, F ˙ n + 1 , is calculated, followed by the calculation of the second half of the time step:
F n + 1 = F n + 1 2 + 1 2 Δ t F ˙ n + 1 ρ n + 1 = ρ 0 1 J r n + 1 = r n + 1 2 + 1 2 Δ t u ˙ n + 1
The deformation tensor, density, and particle position at the time step n + 1 are obtained finally. The time step Δ t must satisfy the Courant–Friedrichs–Lewy (CFL) condition [54], which is limited by the maximum rate of change over time of particle smooth length, velocity, and acceleration. The expression for Δ t is as follows:
Δ t = CFL min h C + | u ˙ | m a x , h | u ¨ | m a x
According to research reported by Wu et al. [55], the CFL number in this work is set to 0.6 to balance the accuracy and computational efficiency.

2.4. Material Model and Damage Criterion of Ice

2.4.1. Elastoplastic Constitutive Model

Elastic deformation of ice occurs in the initial stage of ice being impacted, followed by plastic deformation. Therefore, an elastoplastic constitutive model is selected in this work to describe the constitutive relationship of ice. For an ideal elastic body, the total strain energy w e of the deformed body consists of two parts, the volumetric strain energy w v and the shear strain energy w s :
w e = w v ( J ) + w s ( b ¯ )
The volumetric strain energy and the shear strain energy are given as w v ( J ) = K ( J 2 1 ) / 2 ln J / 2 and w s ( b ¯ ) = G ( t r ( b ¯ ) d ) / 2 , respectively. G is the modulus of shear, d is the spatial dimension, b is the tensor of deformation gradient expressed as b ¯ = b 1 d b . The Kirchhoff stress τ can be expressed as:
τ = w e F F T = K 2 ( J 2 1 ) I + G dev ( b ¯ )
where dev ( b ¯ ) = | b | 1 d b tr ( b ) I / d . The tensor of deformation gradient of an elastoplastic material, F , can be decomposed into an elastic part F e and a plastic part F p , which is expressed as F = F e F p .
The tensor of elastic deformation gradient of left Cauchy–Green, b e , is expressed as:
b e = F e F e T
The tensor of plastic strain gradient of right Cauchy b p is expressed as:
b p = F p T F p
Then, b p can be expressed in terms of b e as: b p = F T b e 1 F p . Thus, the tensor of plastic strain gradient is obtained.

2.4.2. Drucker–Prager Criterion

This work mainly focuses on the initial elastic–plastic response during impact, where the Drucker–Prager criterion captures the dominant failure modes [24]. Thus, the Drucker–Prager damage criterion is employed in this work for determining damage failure of ice under impact behavior. Figure 1 shows the cross-section of the Drucker–Prager yield surface.
The Drucker–Prager criterion in the plane is expressed as:
τ m = 3 sin φ 3 sin φ ( σ m + cot φ )
where τ m and σ m are the nominal shear stress and the nominal normal stress, respectively. In three-dimensional stress space, the criterion is expressed as:
f ( I 1 , J 2 ) = J 2 + α I 1 k = 0
where I 1 is the first invariant of stress. J 2 is the second invariant of the stress deviator. It is given as J 2 = [ ( σ 1 σ 2 ) 2 + ( σ 2 σ 3 ) 2 + ( σ 3 σ 1 ) 2 ] / 6 where σ 1 , σ 2 , and σ 3 represent the three principal stress components. The parameters α and k can be expressed in terms of cohesion c and friction angle φ , with the corresponding expressions as α = tan φ / 9 + 12 tan 2 φ and k = 3 c / 9 + 12 tan 2 φ , respectively. Then, Equation (35) can be rewritten as:
f I 1 , J 2 = J 2 + tan φ 9 + 12 tan 2 φ I 1 3 c 9 + 12 tan 2 φ = 0
Thus, the Drucker–Prager damage criterion can be expressed as a function of the friction angle φ , cohesion c , and hydrostatic pressure P 0 , with the corresponding expression as:
( σ 1 2 + σ 2 2 ) ( 1 + sin 2 φ ) σ 1 σ 2 + ( 1 + sin 2 φ ) P 0 ( σ 1 + σ 2 ) + P 0 2 = 0

3. Numerical Model Validation

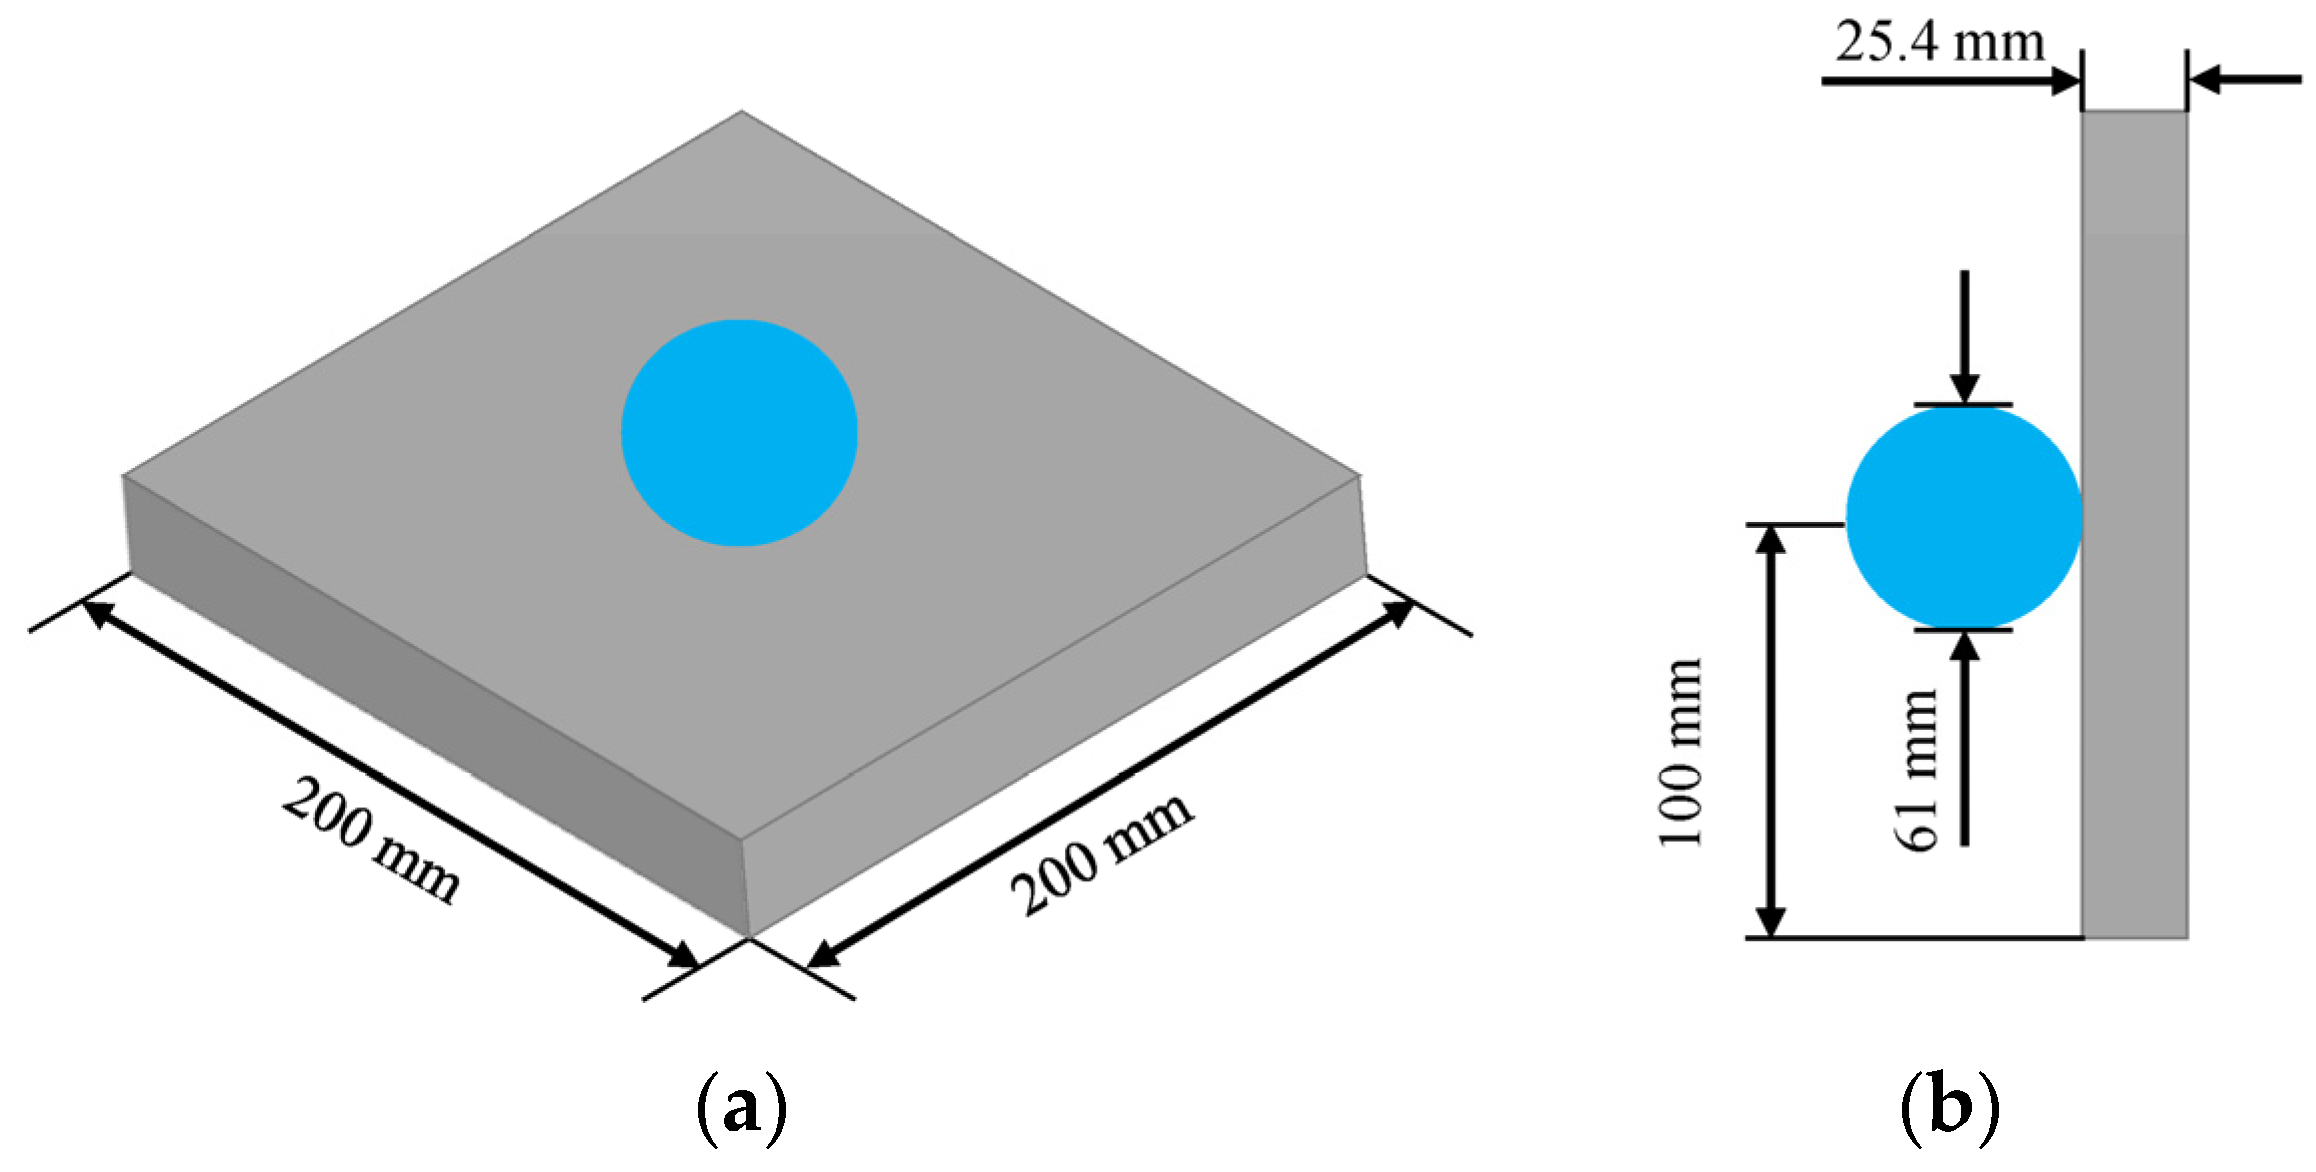
The mechanical behavior of ice under high-speed impact is very complex. To verify the effectiveness of the related algorithms and material models, this section conducts a numerical simulation of a spherical ice ball with diameter D t = 61   mm impacting a metal target plate at an initial velocity of v 0 , t = 81.2 m/s. The target plate has a thickness of h t = 25.4 cm and a side length of L t = 200 mm. The computational model and material parameters used in the validation tests are the same as that reported by Fan et al. [56]. The bottom surface of the target plate is fixed. Initially the ice ball and the target plate are in contact without gaps. Gravity acting on the ice ball is neglected. The sizes and positions of the ice ball and target plate are shown in Figure 2. The corresponding material models and parameters are listed in Table 1.
First, the particle independence is validated first. The initial particle resolutions of the target plate and the ice ball are respectively characterized by ratios ht/∆x and Dt/∆x, where ht, Dt, and ∆x are the thickness of the target plate, the diameter of the ice ball, and the initial particle spacing, respectively. Three schemes of the particle discretization are listed in Table 2. In addition, the calculation time is set to 0.3 ms.
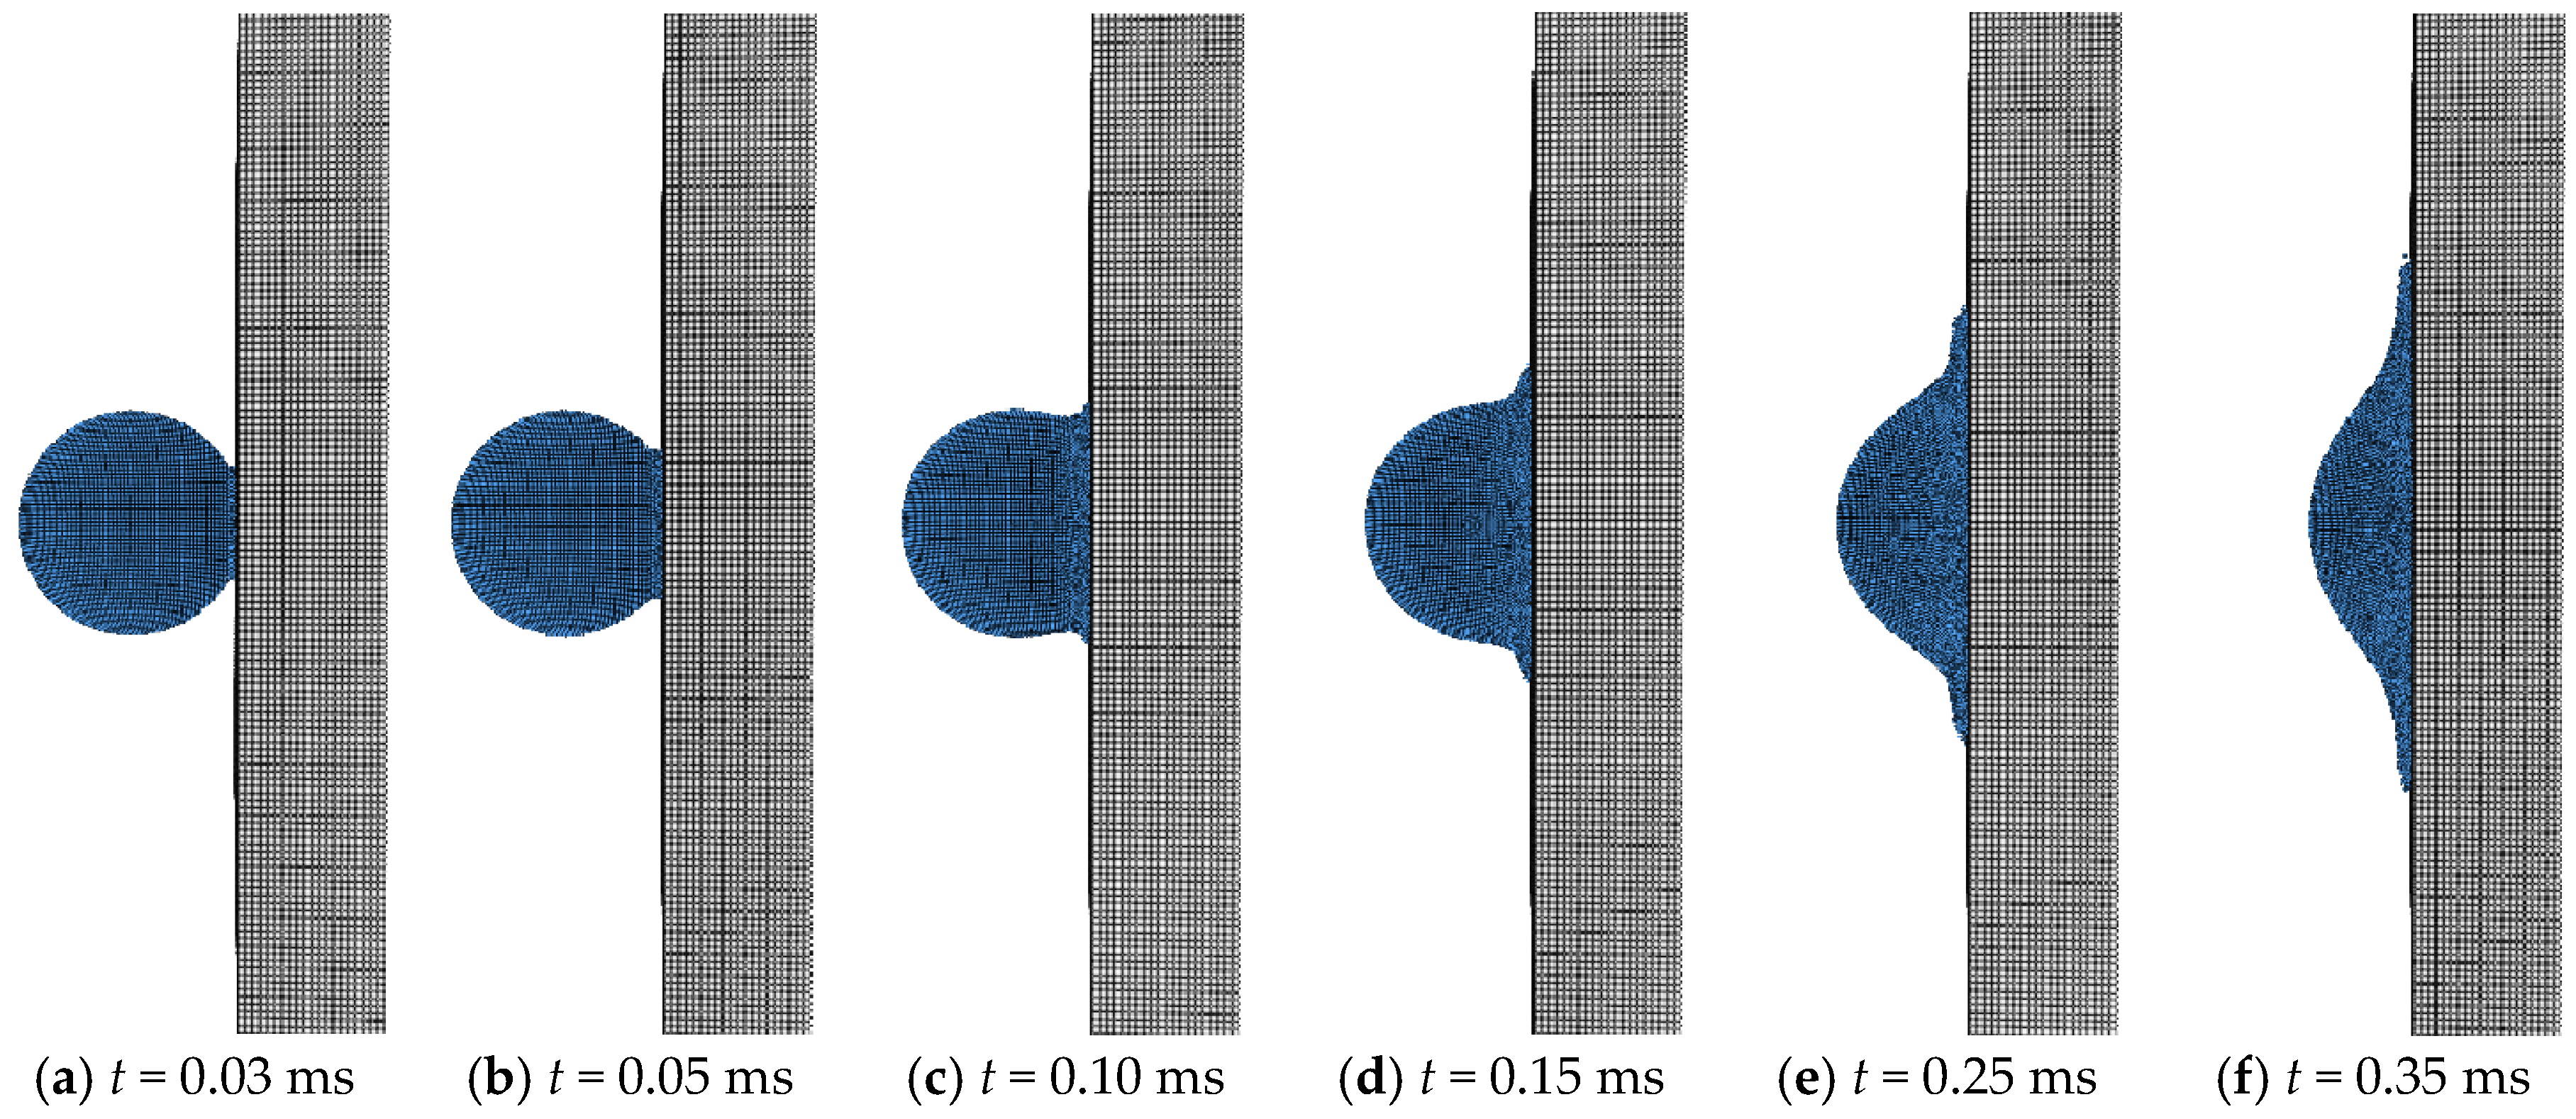
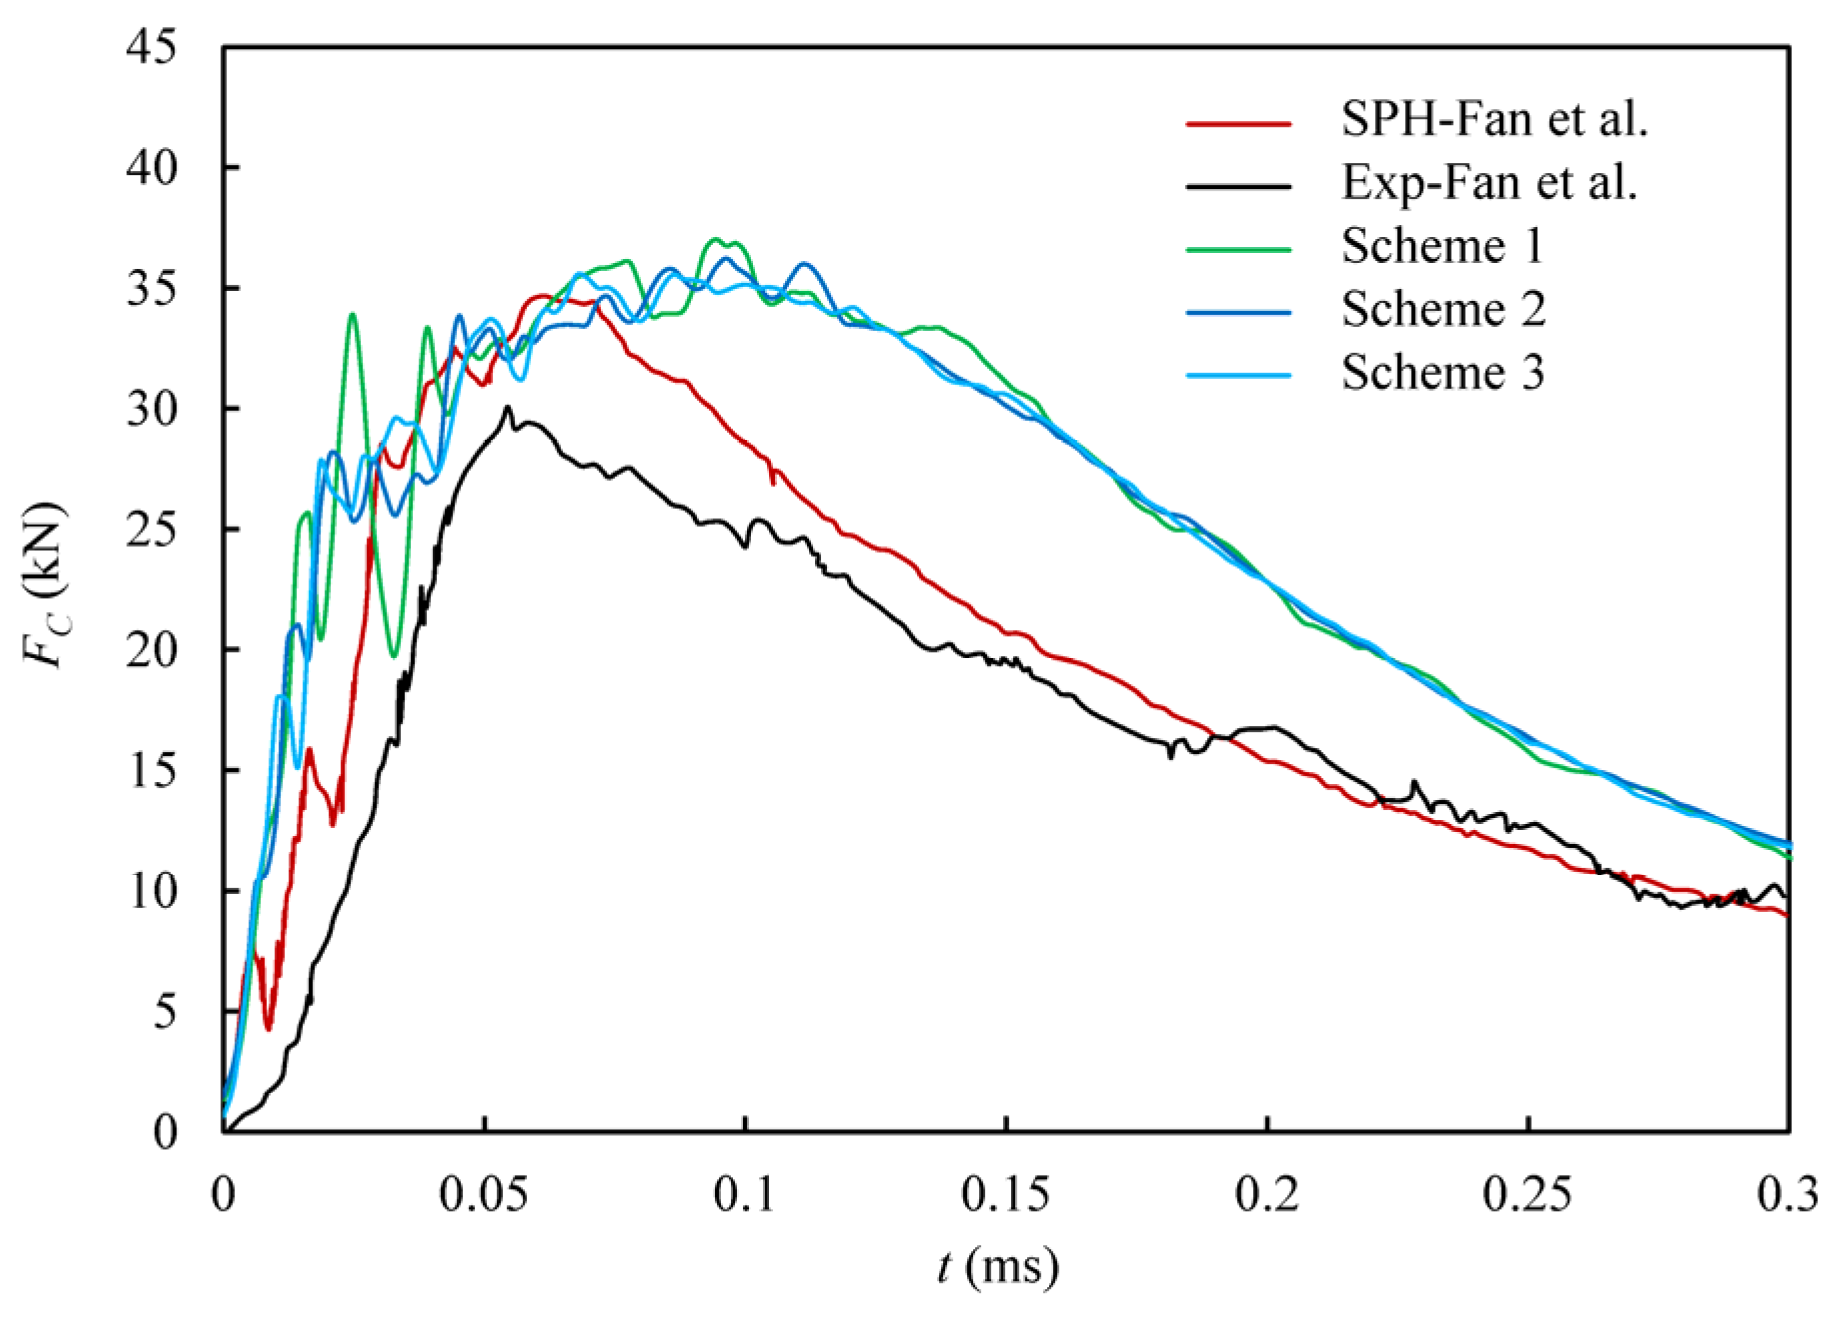
Figure 3 shows the deformation process of the ice ball when impacting on the metal plate. It can be seen that as time increases, the deformation of the ice ball intensifies, and the contact area between the ice ball and the target plate begins to be damaged. Then, the outer particles of the ice ball start to diffuse outward along the surface of the plate, and finally splashes are formed along the surface of the plate. The comparison of variations in the impact force over time obtained based on three discretization schemes and the ones achieved from the experimental and numerical studies reported by Fan et al. [56] are shown in Figure 4. All three curves show a similar trend of first increasing and then decreasing, consistent with the variation trends obtained from experiments and simulations. It thus verifies the particle independence of the calculation results. Furthermore, Table 2 compares the peak impact forces generated during the impact process. Maximum errors of only 6.3% for numerical comparison and only 16.7 for experimental comparison are observed, indicating that the impact force algorithm based on the material model used in this work has good accuracy, and thus the feasibility of the computational model has been validated.

4. Results and Discussion

4.1. Initial and Boundary Conditions

As shown in Figure 5a, an HCC with length L = 1800 mm and diameter D = 300 mm is adopted in this work as the impact body for water icebreaking. One end of the HCC has a semi-ellipsoidal head, with the semi-major axis is 200 mm, and the semi-axes (middle and short) are both 150 mm. The homogeneous HCC has a mass of 174.1 kg, with its center of mass located along the HCC’s axis at a position of 933.3 mm from the head. The moment of inertia about the center of mass is Ix = Iy = 21.4 kg/m2, Iz = 6.15 kg/m2. To focus on localized fracture mechanics, the infinite ice layer is simplified as a cylindrical ice block with diameter Di = 4800 mm. Fixed constraints are applied along the circumference of the ice cylinder. Initially, the top of the HCC is directly below the center of the ice layer and separated from the bottom surface of the ice cylinder by 2 cm. The HCC impacts the center of the ice layer with an initial velocity of v0. Since high-speed impact dynamics dominate the ice–structure interactions, the entire impact process reasonably neglects gravity effects on the HCC and ice. Figure 5b shows the schematic of the relative position of the HCC impacting the ice layer at the initial moment. The initial direction of the velocity of the HCC is consistent with the axis direction of the HCC under each calculation condition. The angle between the velocity vector of the HCC v and the horizontal plane is defined as the impact angle α (0° ≤ α ≤ 90°), and the angle between the axis of the HCC and the plane xoy is the attitude angle β. Additionally, the side where the angle between the axis of the HCC and the horizontal plane is greater than 90° at the initial moment is defined as the ice-facing side, and the side where it is less than 90° is the ice-back side.
The material models and parameters of the HCC are shown in Table 3 and those for the ice can be found in the settings in Table 1.

4.2. Effect of Initial Velocity

To analyze the effect of the impact velocity of the HCC on the icebreaking process, three different initial velocities v0, 100 m/s, 150 m/s, and 200 m/s, are applied in the numerical simulations. The initial impact angle α is set to 90° and the thickness of the ice layer is set to hi = 30 cm. When generating discretized particles for the ice layer, the thickness of the ice layer is used as the characterized length, with a particle resolution of hi/∆x = 15. When generating discretized particles for the HCC, the diameter D is used as the characterized length, with a particle resolution of D/∆x = 20.
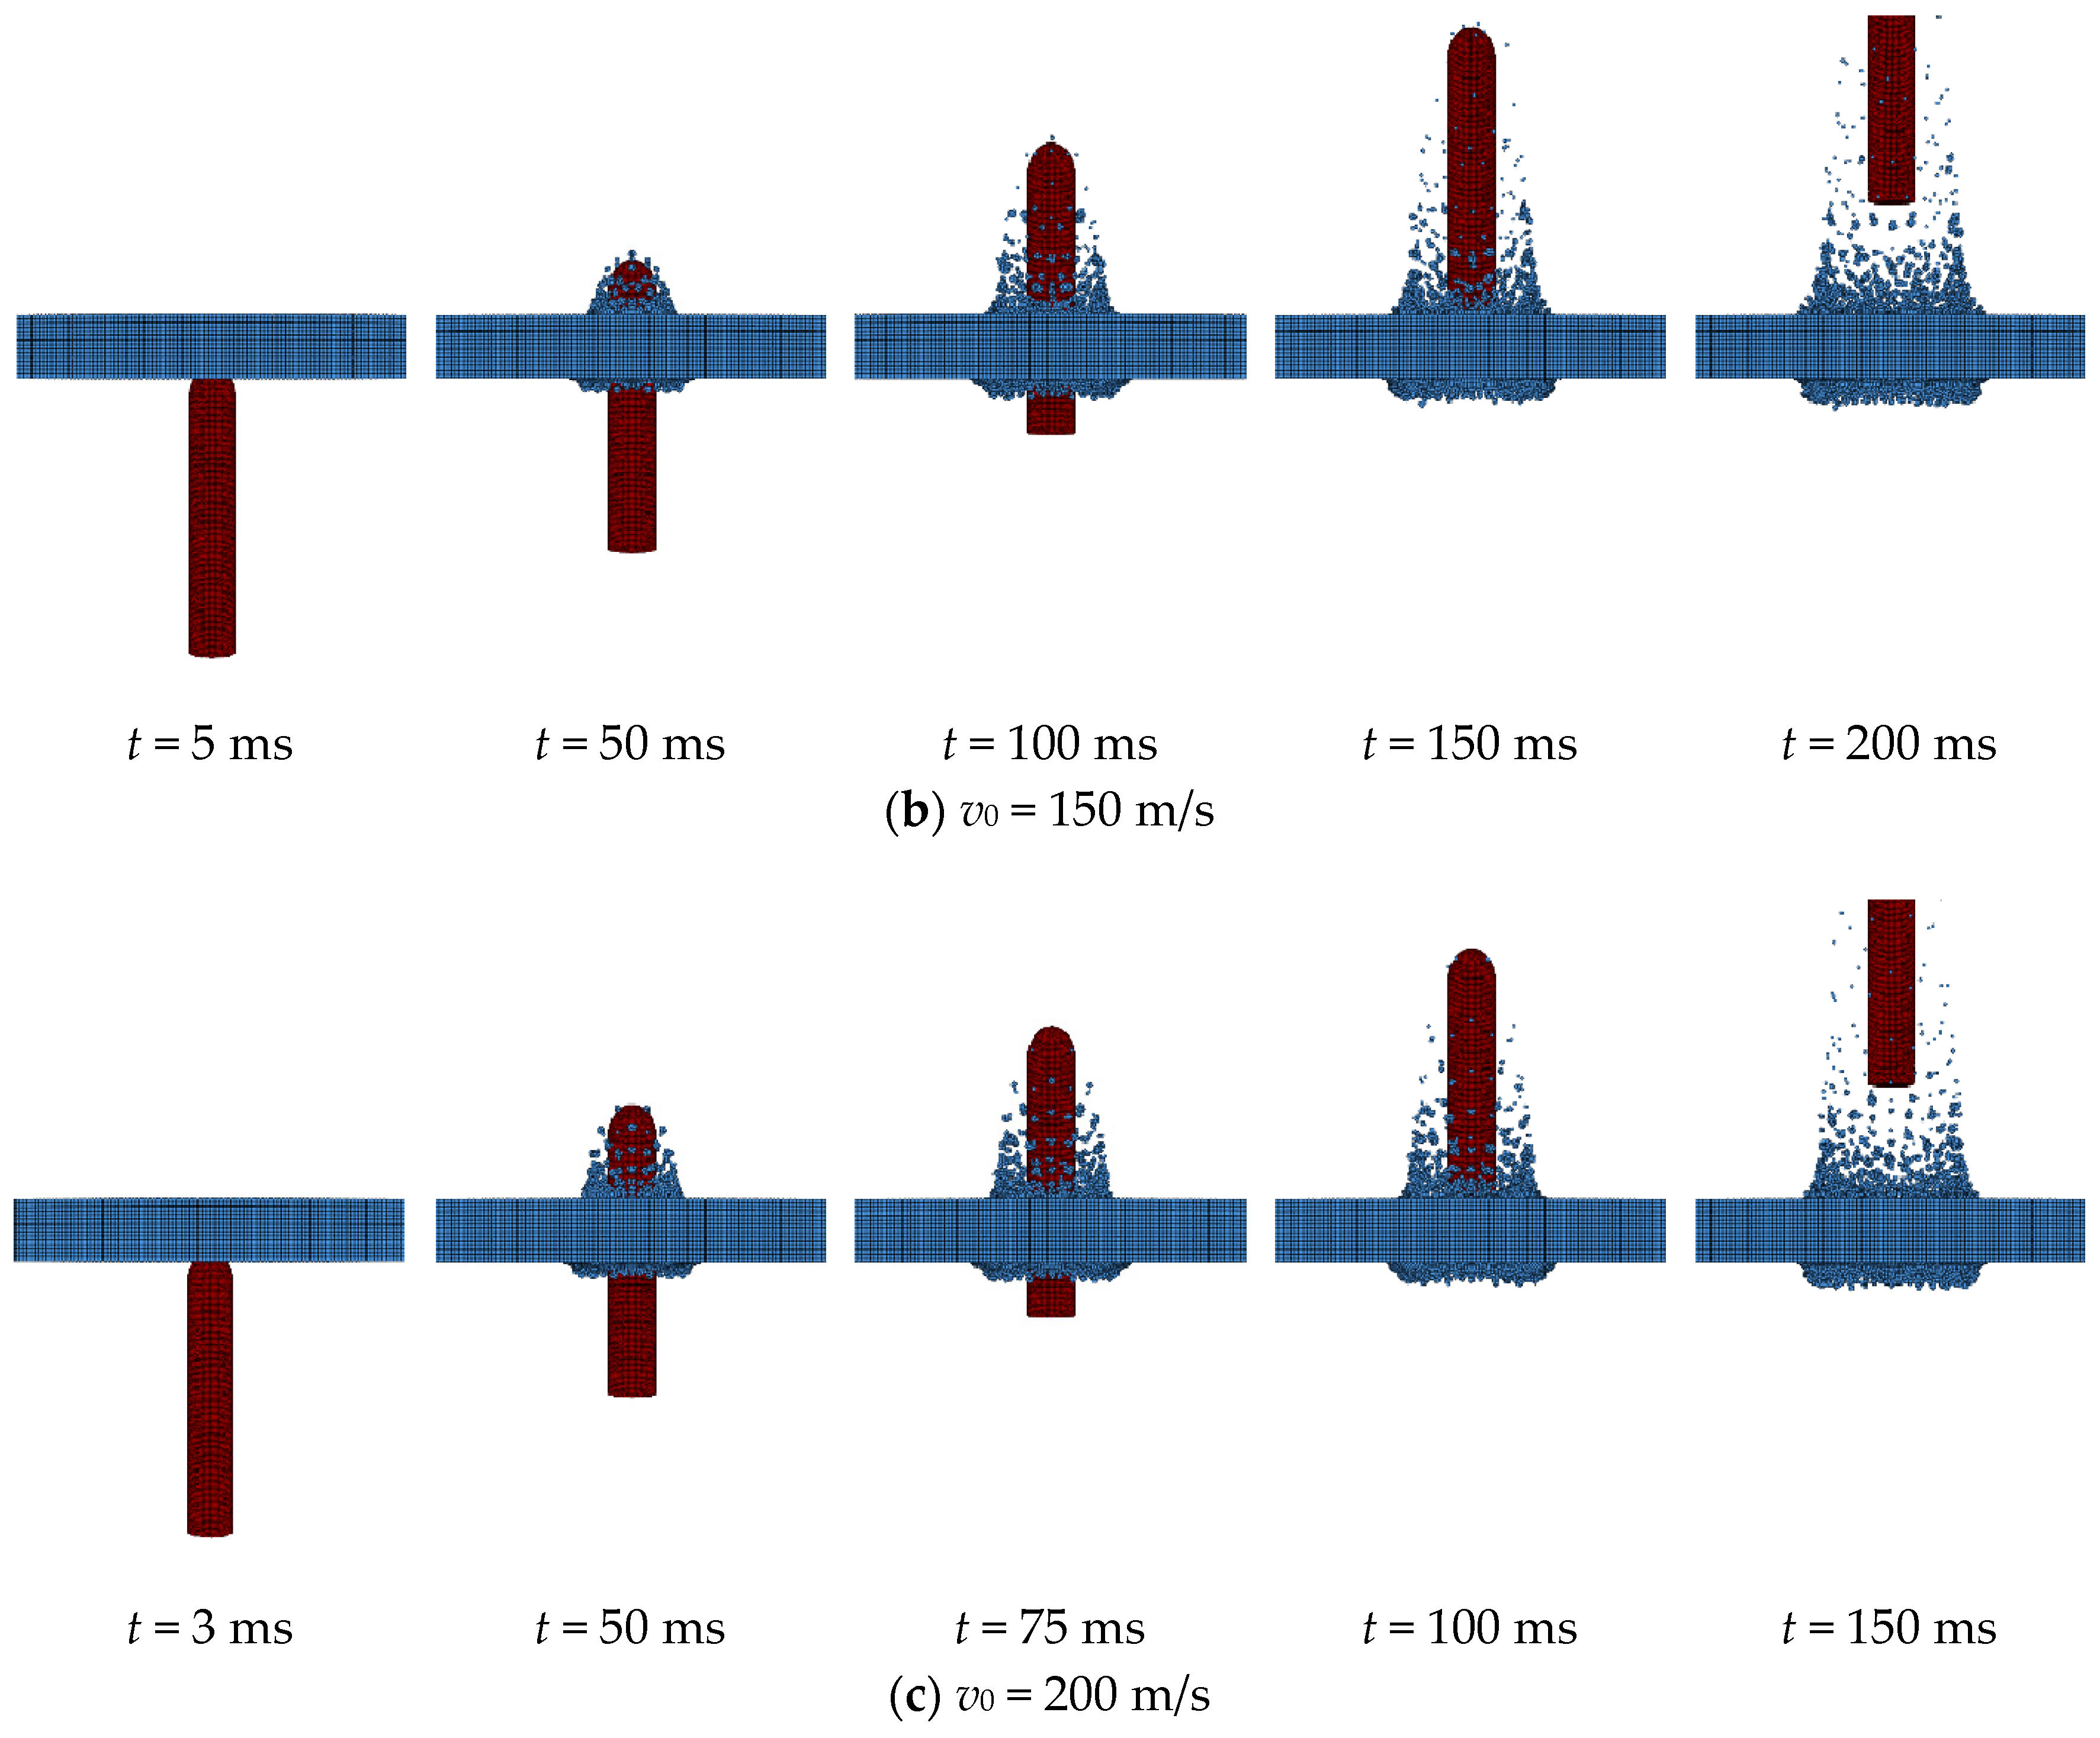
Figure 6 shows the process of the HCC impacting and breaking the ice under different initial velocities. It can be seen that the icebreaking processes under different initial velocities are essentially similar with each other. The deformation and failure of the ice layer can be divided into three main stages. The first stage is the collision of the front of the HCC with the ice layer. In this stage, the HCC impacts the ice and causes it to dent. The second stage is the penetration and perforation of the HCC. Under the impact, the ice layer further deforms, beginning to bulge on the upper surface and accumulate particles on the lower surface. As the displacement of the HCC increases, the deformation of the ice layer continues to grow and gaps appear between the ice and the HCC. Eventually, the HCC penetrates through the ice layer, forming a hole. The third stage is the HCC passing through the ice layer. After the HCC passes through the hole in the ice layer, ice particles are splashed around. The hole formed in the ice layer continues to enlarge until it stabilizes. It can be observed that the damage to the ice layer caused by the HCC after penetrating the ice is roughly the same under different initial velocities.
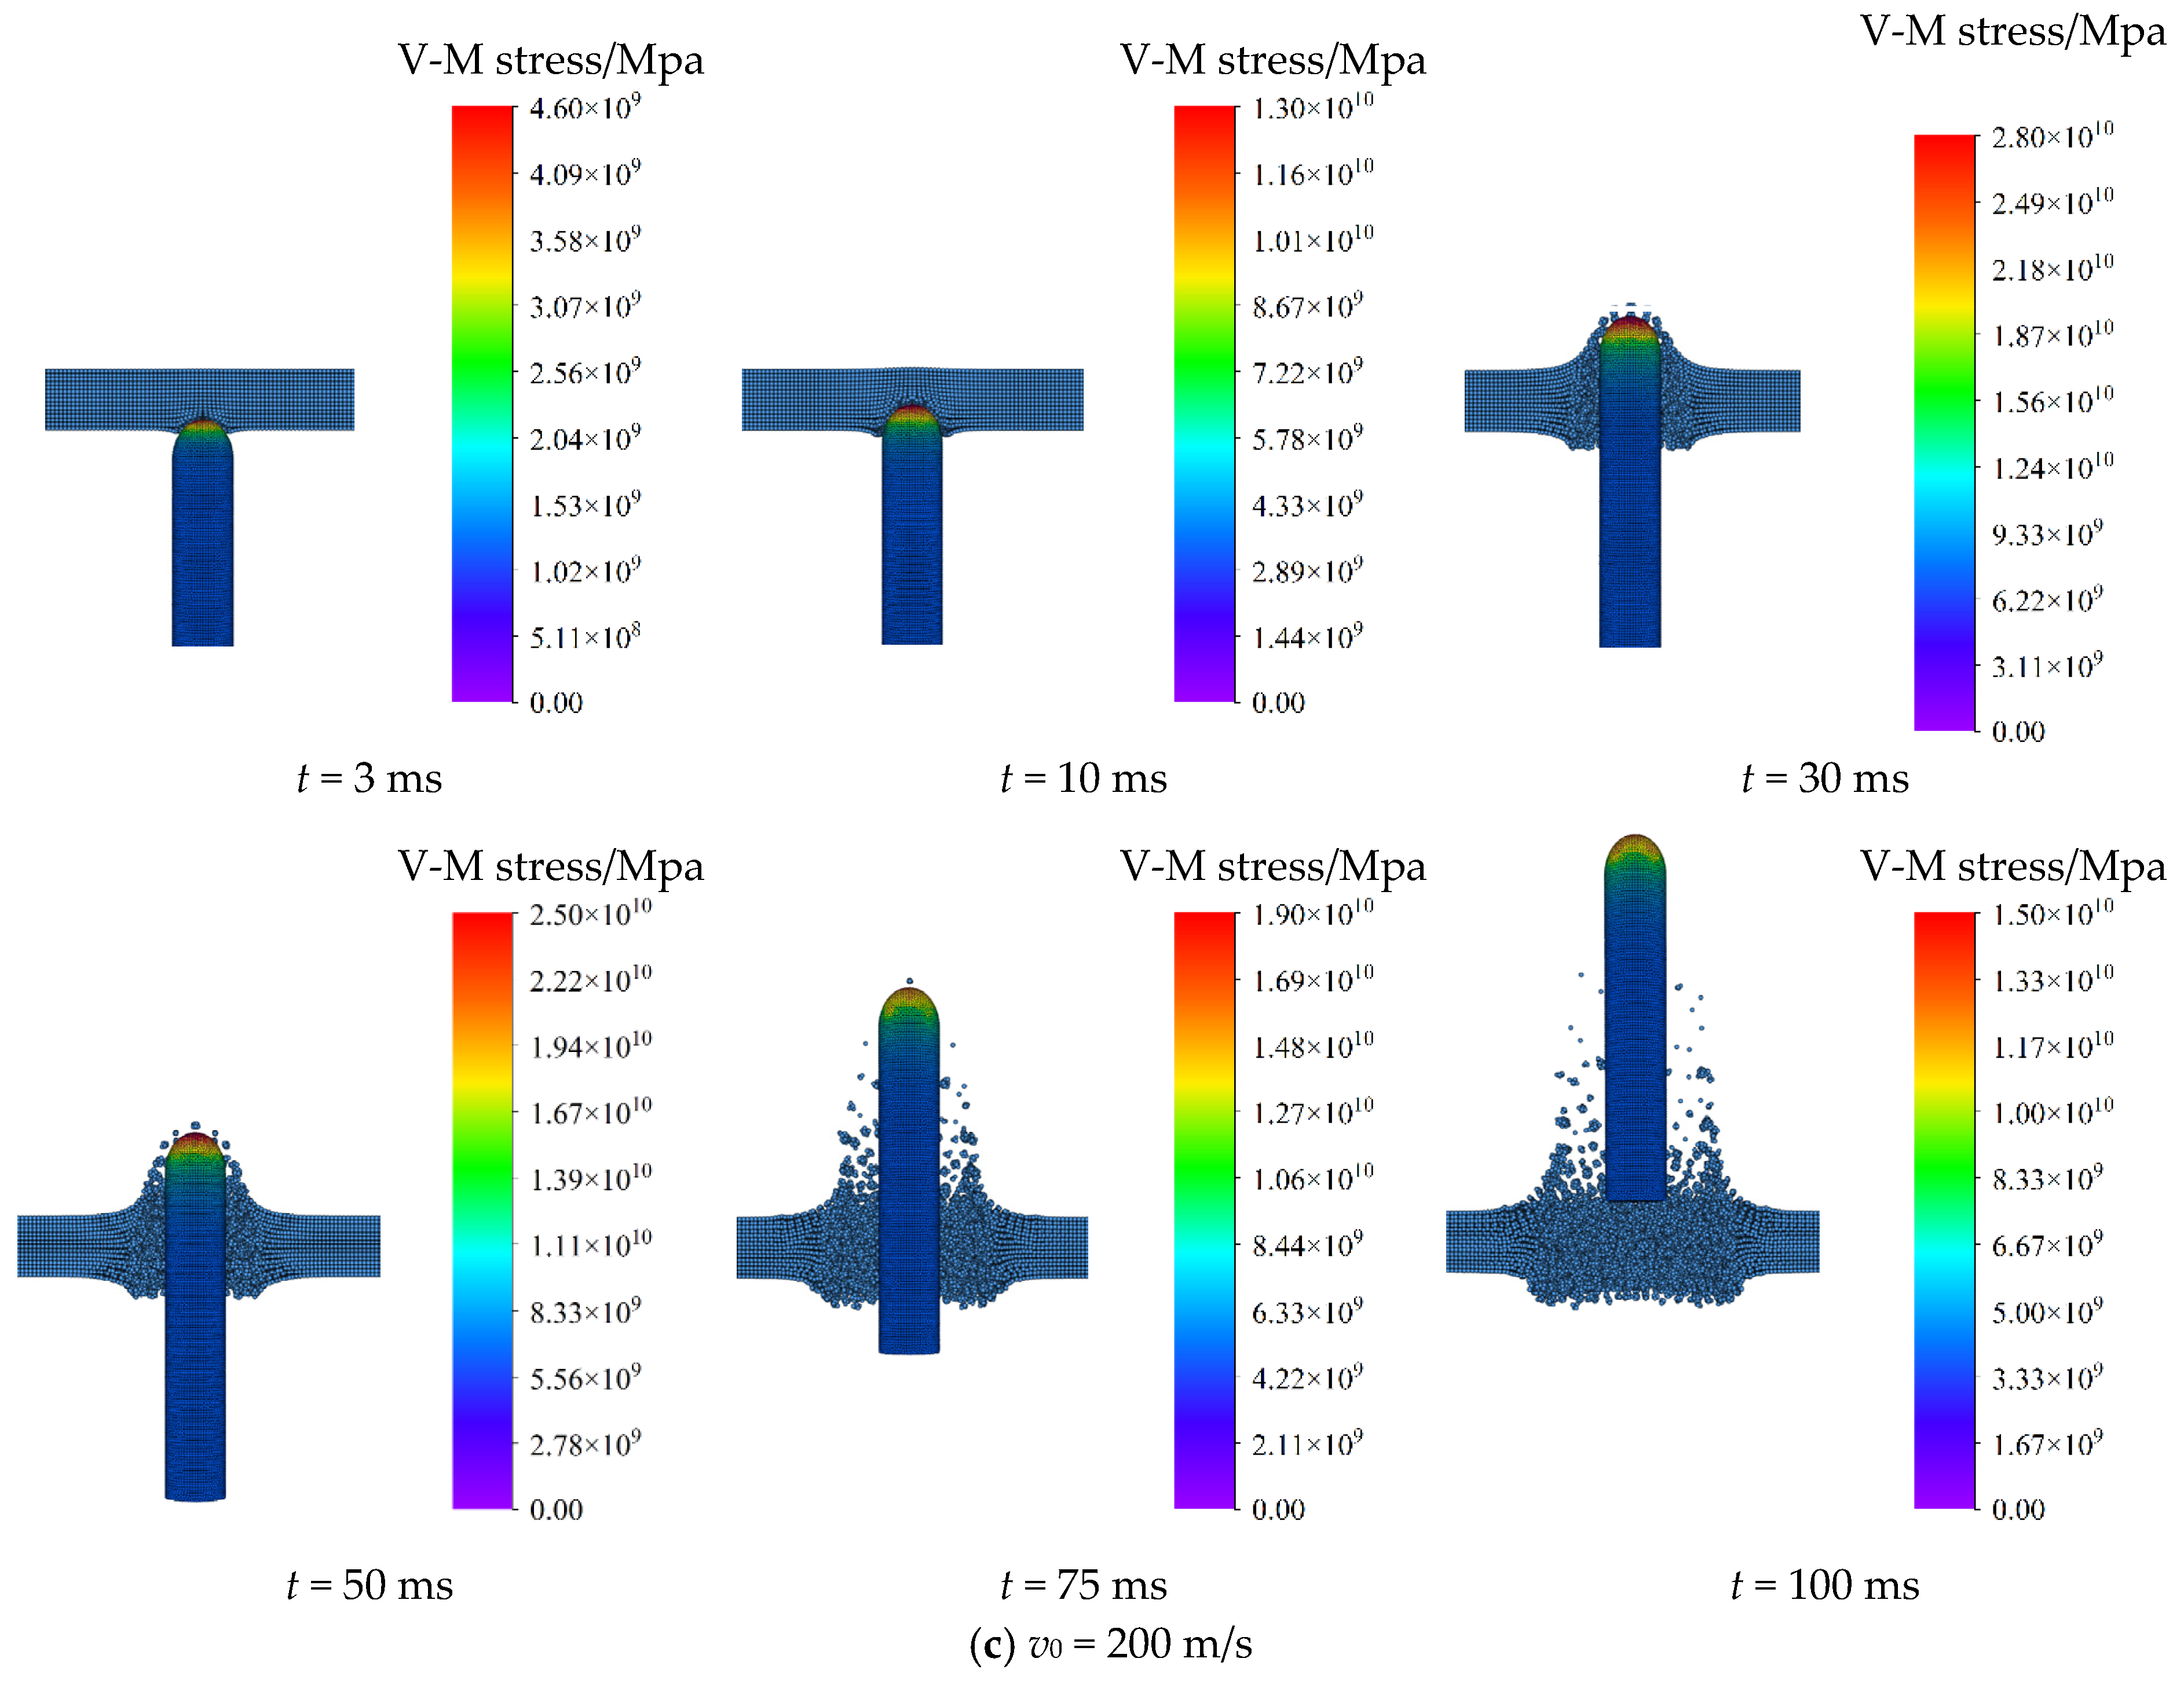
Figure 7 shows the von Mises stress distribution on the surface of the HCC during the penetration of the ice layer at different initial velocities. It can be seen that during the penetration process, there is a significant stress concentration at the head of the HCC. Moreover, as the contact area between the HCC’s head and the ice layer expands, the stress continuously increases to encompass the entire head of the HCC. When breaking through the upper surface of the ice layer, the stress reaches its peak, after which the stress on the HCC’s head begins to decrease. Overall, the interaction between the HCC and the ice layer is mainly characterized by a collision at the head, with relatively small stress and stress variations at other positions of the HCC. Additionally, during the icebreaking process, the peak stress of the HCC increases with increasing initial velocity.
Figure 8 shows the distribution of strain on the ice layer and HCC surface during the icebreaking process under different initial velocities. It can be observed that during the collision phase, there is a significant concentration of strain at the center of the ice layer. After entering the penetration phase, the strain on the contact area between the ice layer and the HCC is relatively large and propagates radially along the surface of the ice. During the perforation phase, the strain on the splashed ice particles caused by the impact of the HCC is considerable. In the icebreaking process, because the stiffness of the HCC is much greater than that of the ice and its head is mainly responsible for impacting the ice surface, only the head of the HCC experiences relatively small strain. Furthermore, the results also show that under different initial velocities, the strain distribution on the surface of the HCC and the ice layer is generally consistent.
Variations in the impact forces over time when the HCC impacts the ice layer at different initial velocities are shown in Figure 9. It can be seen that as the collision progresses, the impact force on the HCC surges to a peak and then decreases. Additionally, the peak impact force increases from 285.31 kN to 917.51 kN with increasing initial velocity from 100 m/s to 200 m/s, respectively. It reveals a power-law scaling of F c m a x v 0 1.82 with R2 = 0.998 for velocities from 100 m/s to 200 m/s. After entering the penetration phase, the impact force first increases and then decreases, experiencing some fluctuations. During the perforation phase, the impact force experienced by the HCC is relatively small and fluctuates within a narrow range. The fluctuations of the impact force during the penetration and perforation phases become more pronounced with increasing initial velocity.

4.3. Effect of Thickness of Ice Layer

To analyze the influence of the thickness of the ice layer on the icebreaking process of the HCC, this work conducts numerical simulations of the impact process with the HCC impacting ice layers of different thicknesses at an impact angle 90° and initial velocity v0 = 100 m/s. When generating ice particles, the inter-particle spacing is uniformly set to ∆x = 2 cm. When generating particles for the HCC, the diameter D is set as the characterized length, and the particle resolution is set to D/∆x = 20.
Figure 10 shows the icebreaking process of the HCC impacting ice layers with different thicknesses. It can be seen that for an ice layer with thickness of 10 cm, no significant particle accumulation occurs at the bottom of the ice during the penetration stage, and fewer splash particles are produced during the perforation stage. As the thickness of the ice layer increases, particle accumulation at the bottom of the ice layer becomes more pronounced during the penetration stage, and more ice particles splash during the perforation stage.
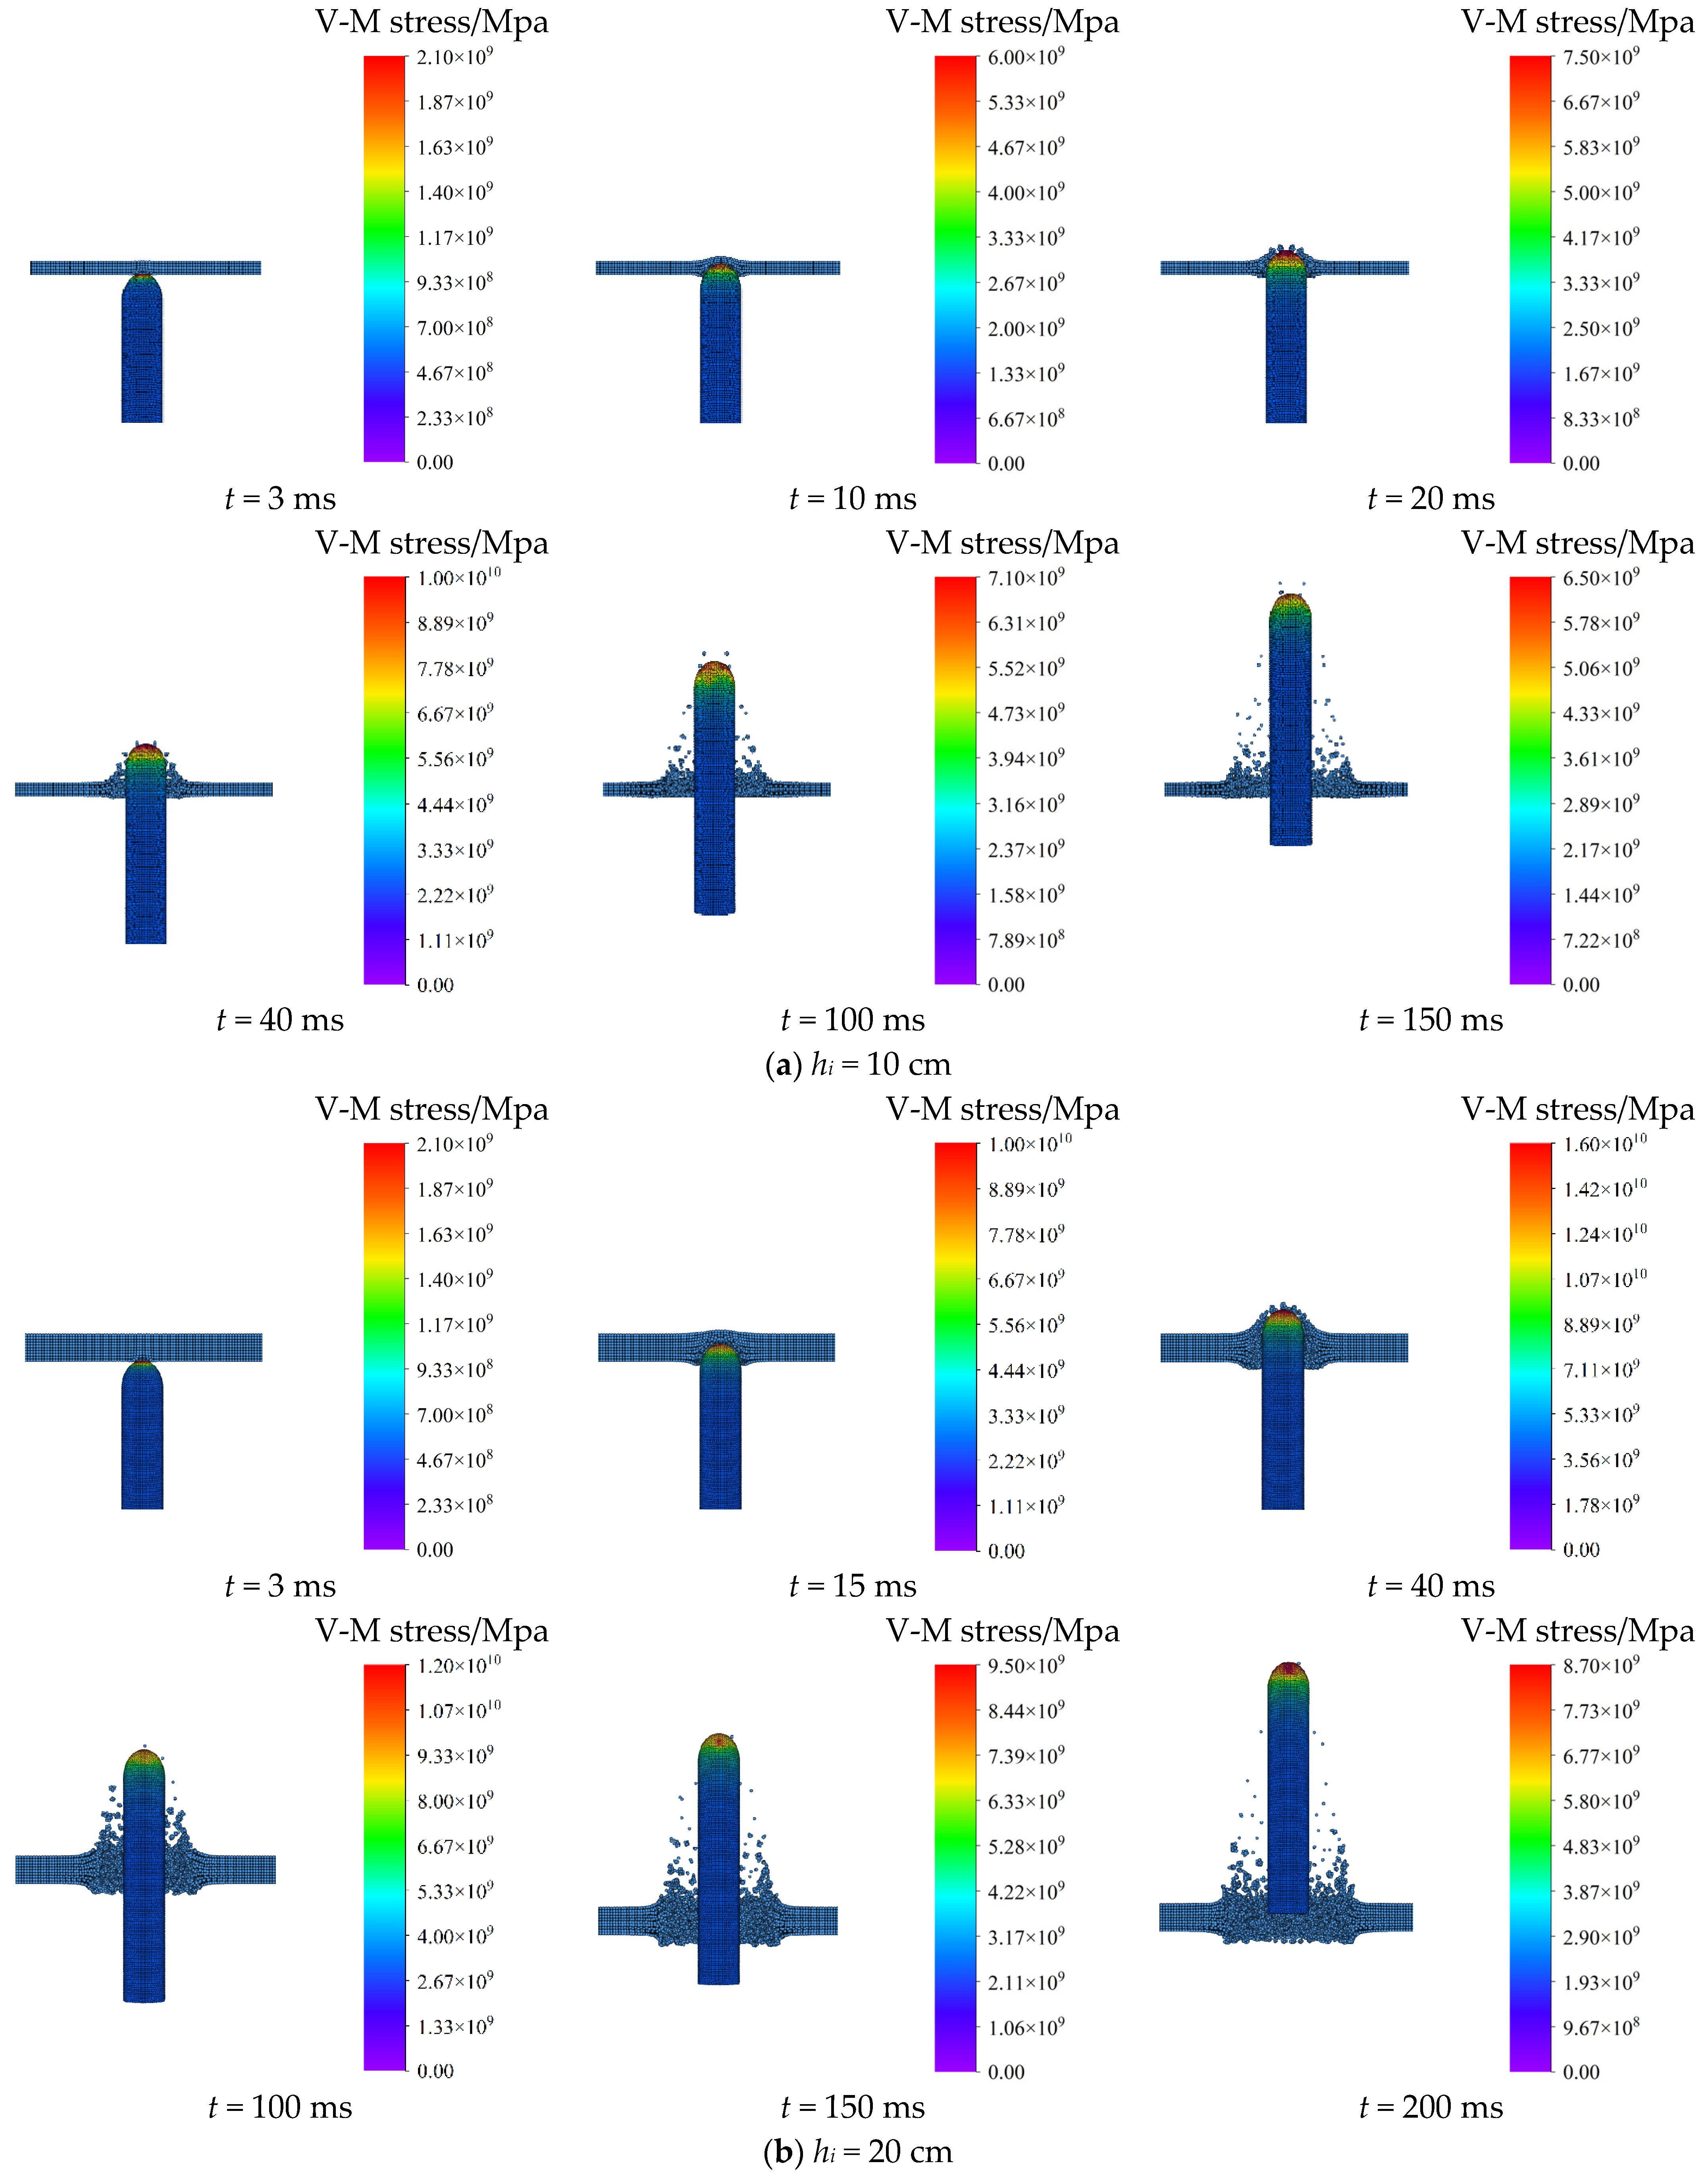
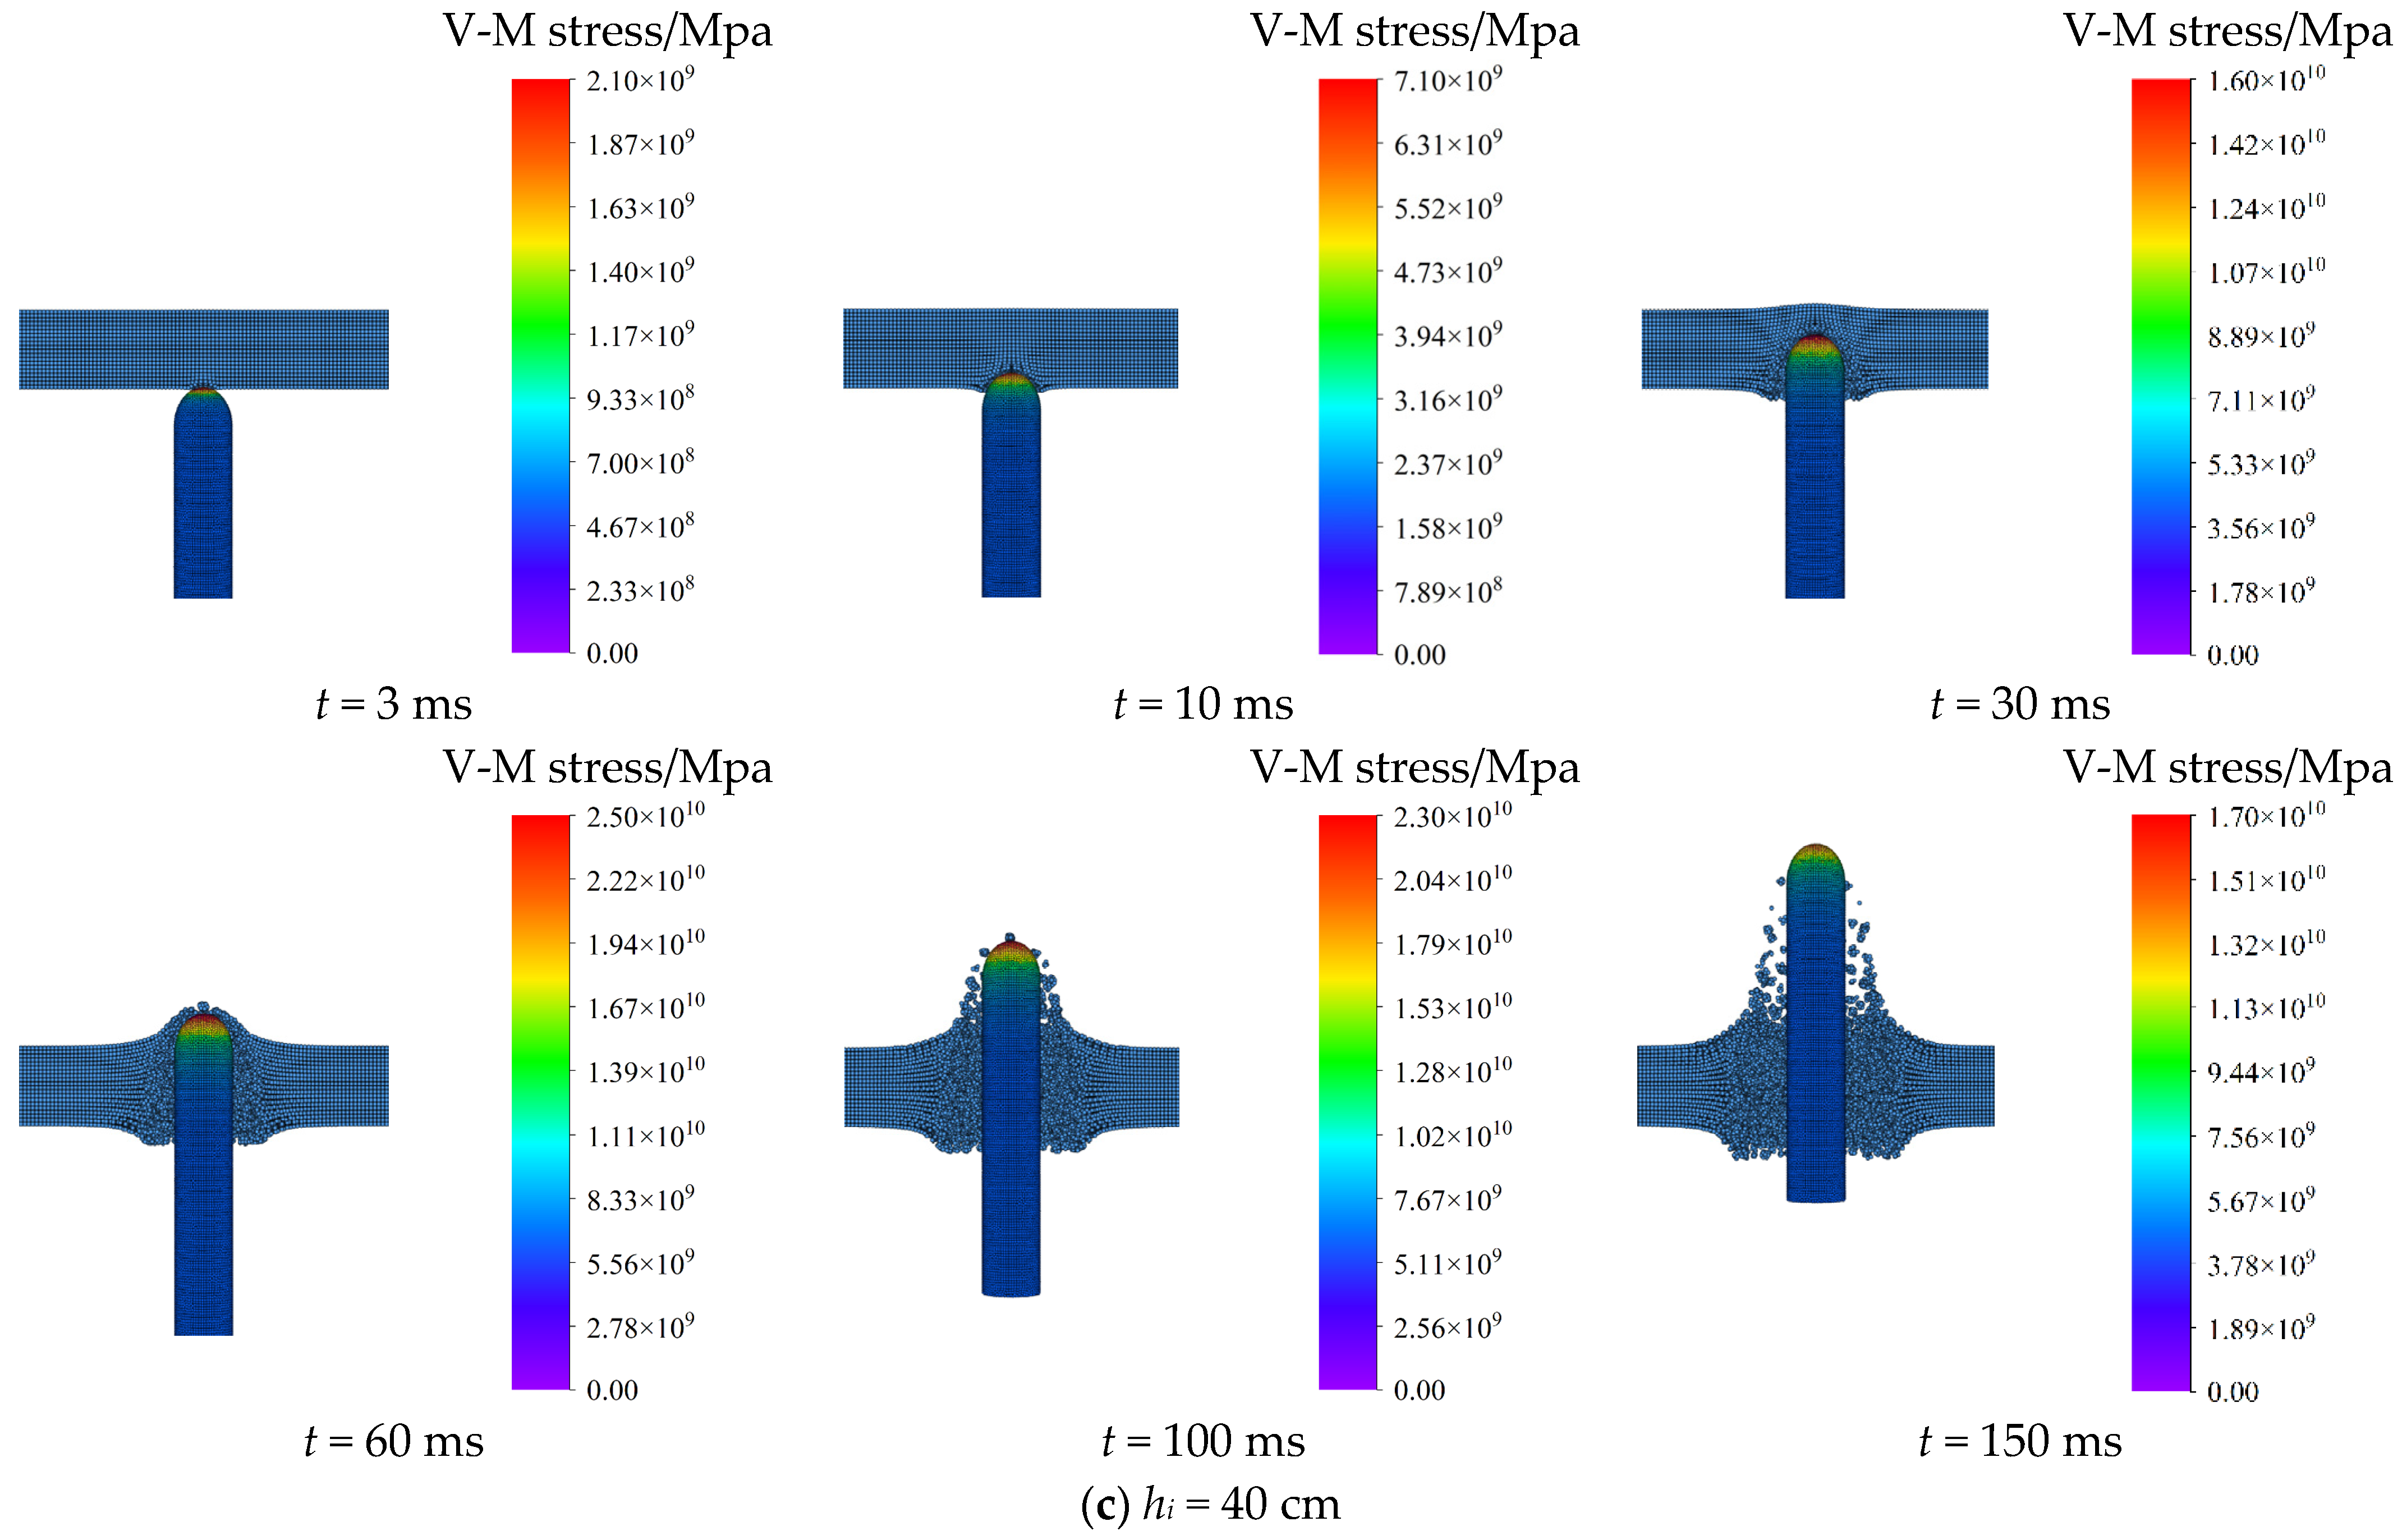
The von Mises stress distribution of the HCC during the icebreaking process at different thicknesses of ice layers is shown in Figure 11. It can be seen that the patterns of stress distribution and its variation trends at each stage are generally consistent with the results in the last section. The stress concentration mainly occurs at the front of the HCC. Overall, the peak stress generated during the icebreaking process increases with the ice layer thickness.
Figure 12 presents the distribution of the von Mises strain on the ice layer and HCC surface during the icebreaking process at different thicknesses of ice layers. It can be observed that for thinner ice layers, 10 cm and 20 cm, no significant radial propagation of strain occurs on the ice surface during the penetration stage. During the perforation stage, impact causes ice particle splashing. As the ice layer thickness increases to 40 cm, strains in the form of the radial ring band become more prominent during the penetration stage, and the amount of splash particles increases correspondingly.
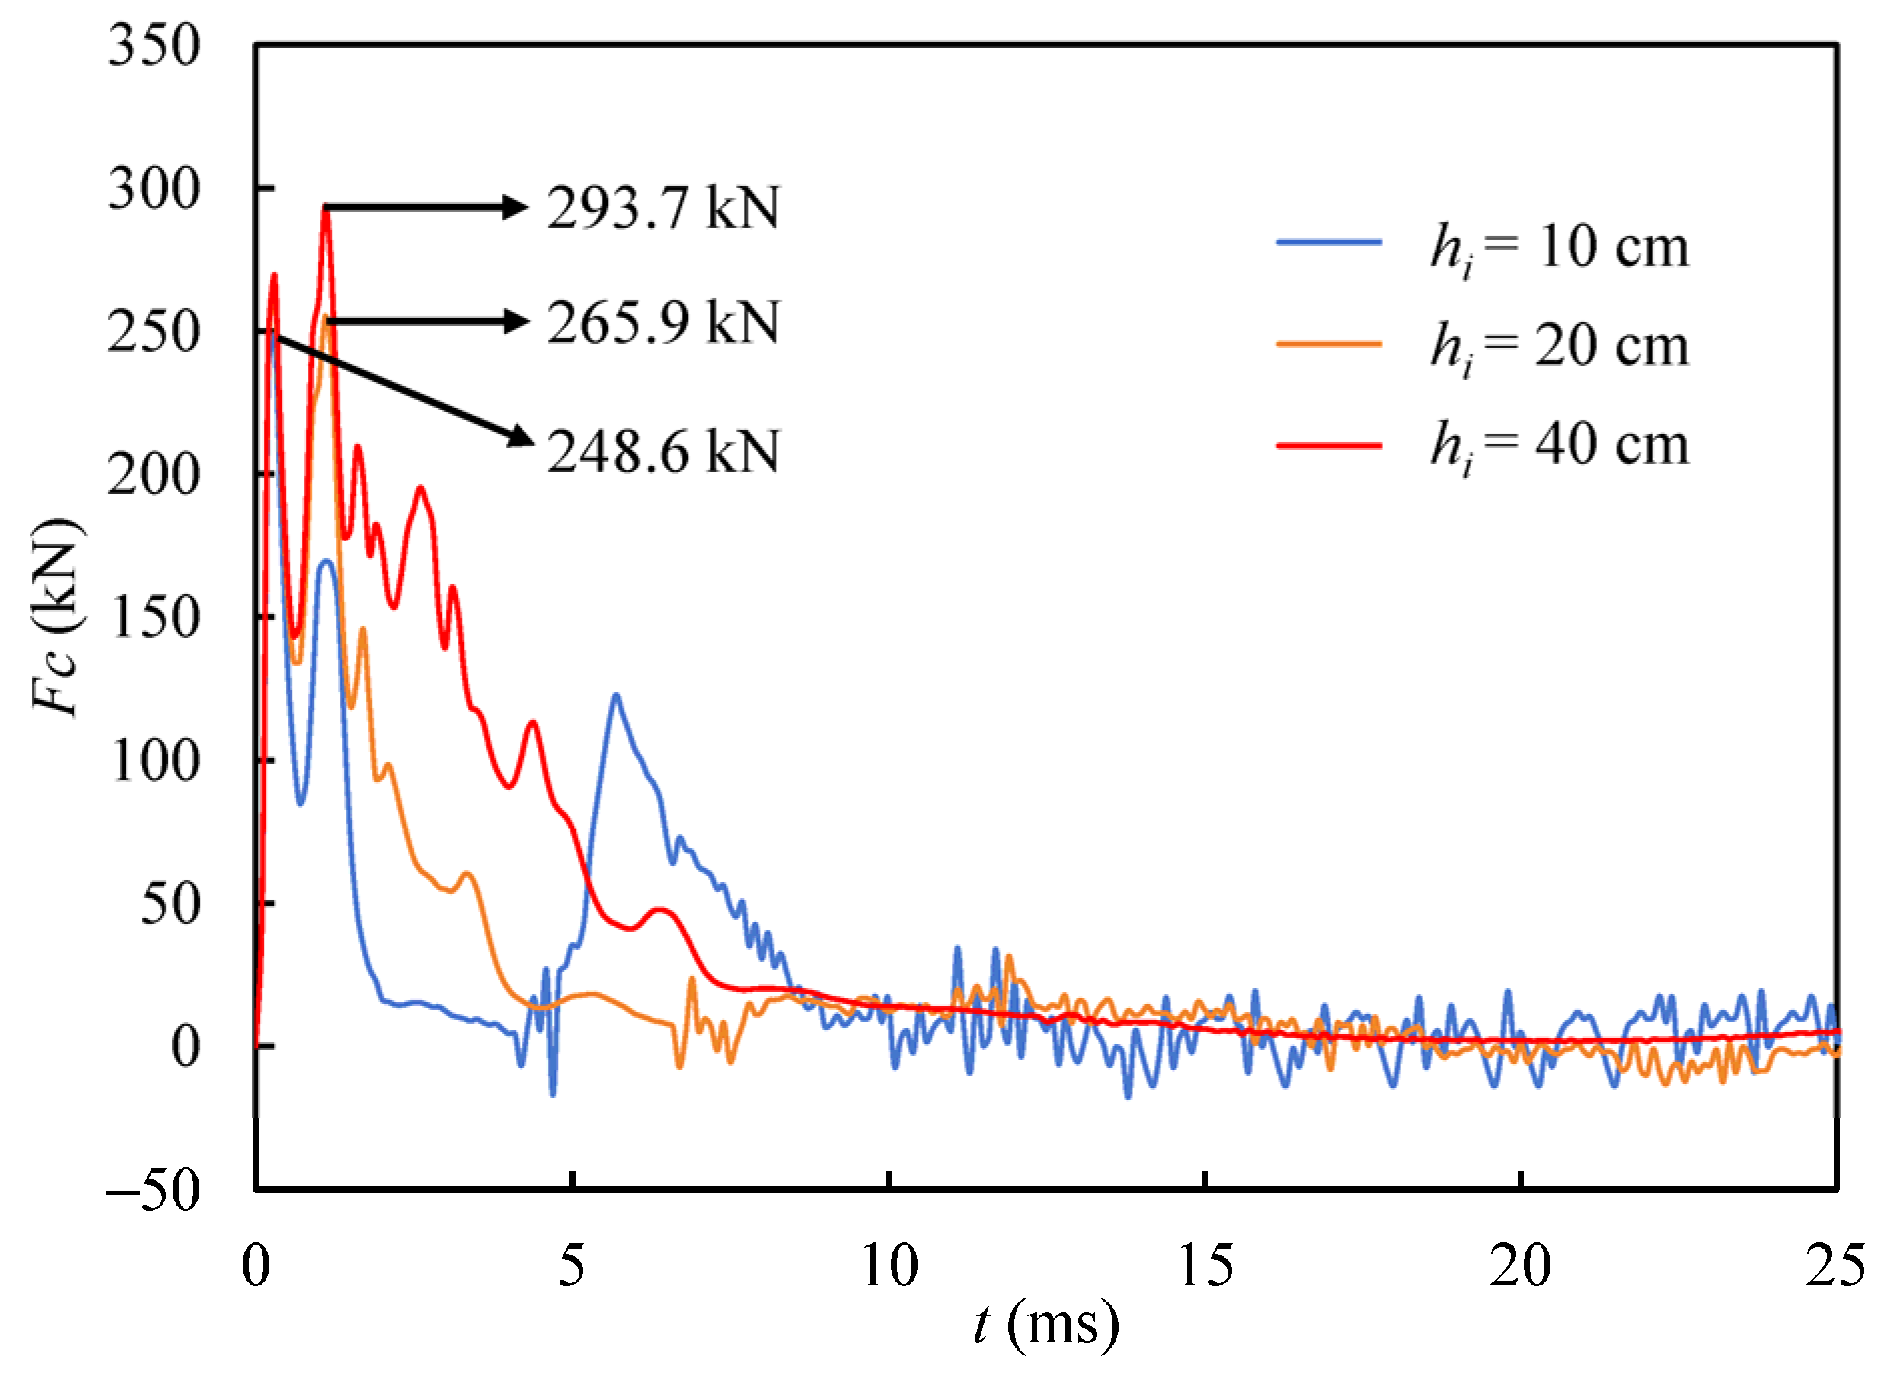
Figure 13 presents variations in impact forces of the HCC over time at different thicknesses of ice layers during the icebreaking process. It can be observed that as the thickness of the ice layer increases from 10 cm to 40 cm, the peak impact force grows from 248.6 kN to 293.7 kN, increased by 18.1%, and the duration of the decline after reaching the peak extends. It reveals a power-law scaling of F c m a x h i 0.67 for ice thickness from 10 cm to 40 cm. Meanwhile, with increasing ice thickness, the fluctuations in the impact forces gradually diminish.

4.4. Effect of Initial Impact Angle

This section analyzes the influence of the initial impact angle α on the icebreaking process of the HCC by setting different initial impact angles including 60°, 70°, 80°, and 90°. The simulation results for impact angles α = 90° were shown in Section 4.2, so they will not be repeated here. Thickness of ice layer and initial velocity are set to hi = 30 cm and v0 = 100 m/s, respectively. Similarly, when generating ice particles, the ice thickness is used as the characterized length, with a resolution set to hi/∆x = 15. When generating the HCC particles, the diameter D of the HCC is used as the characterized length, with a resolution set to D/∆x = 20.
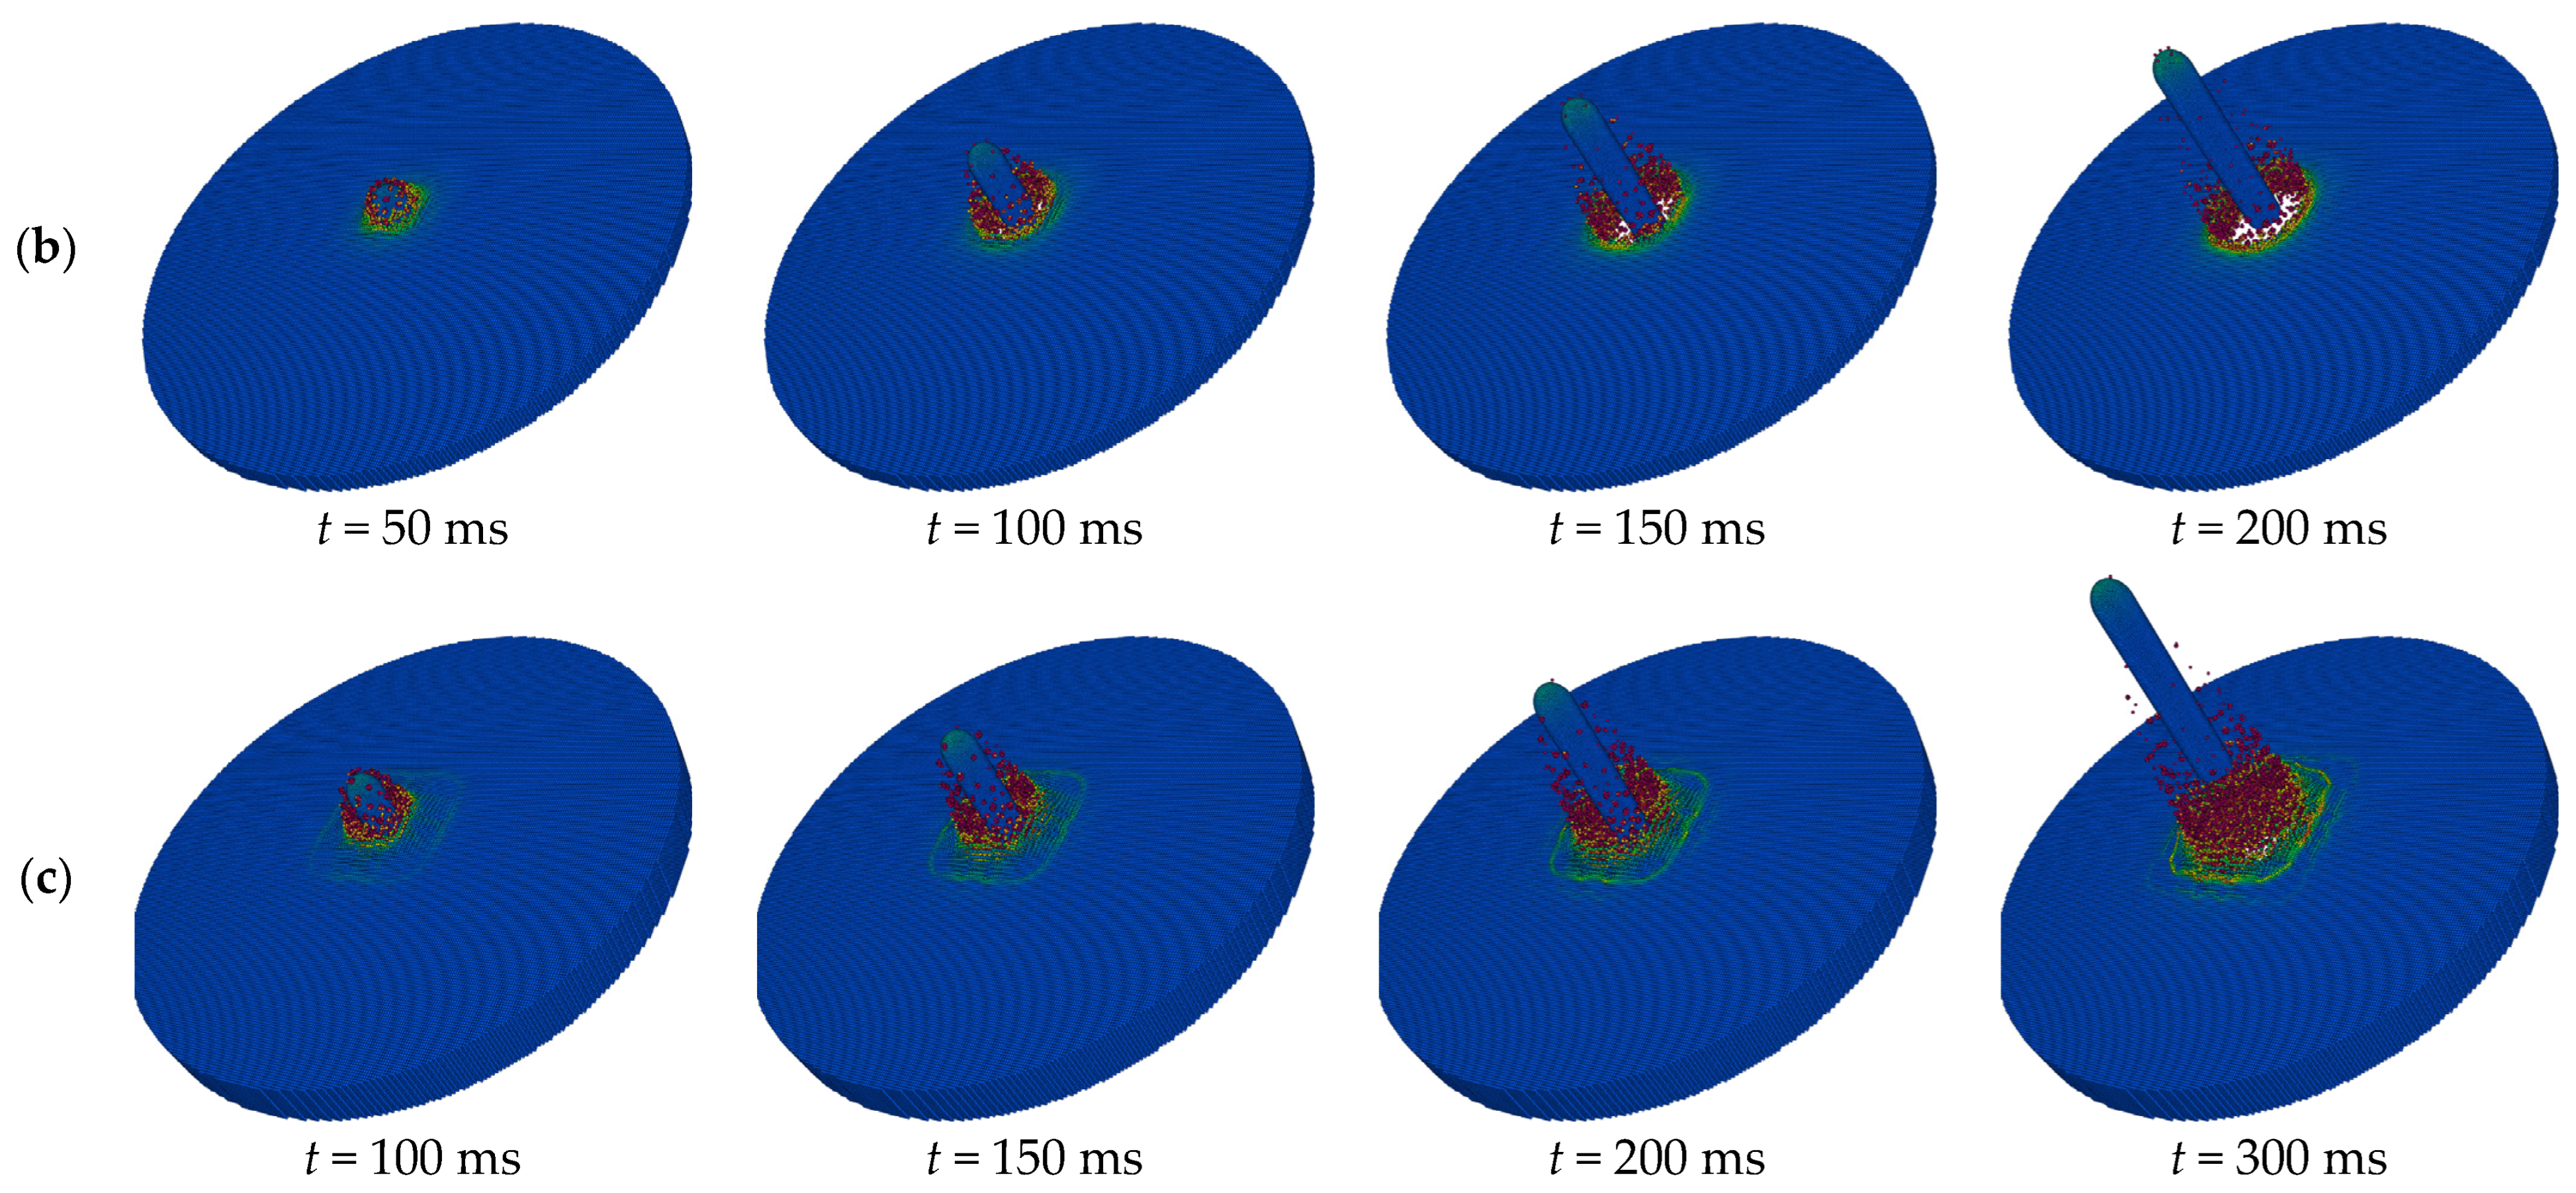
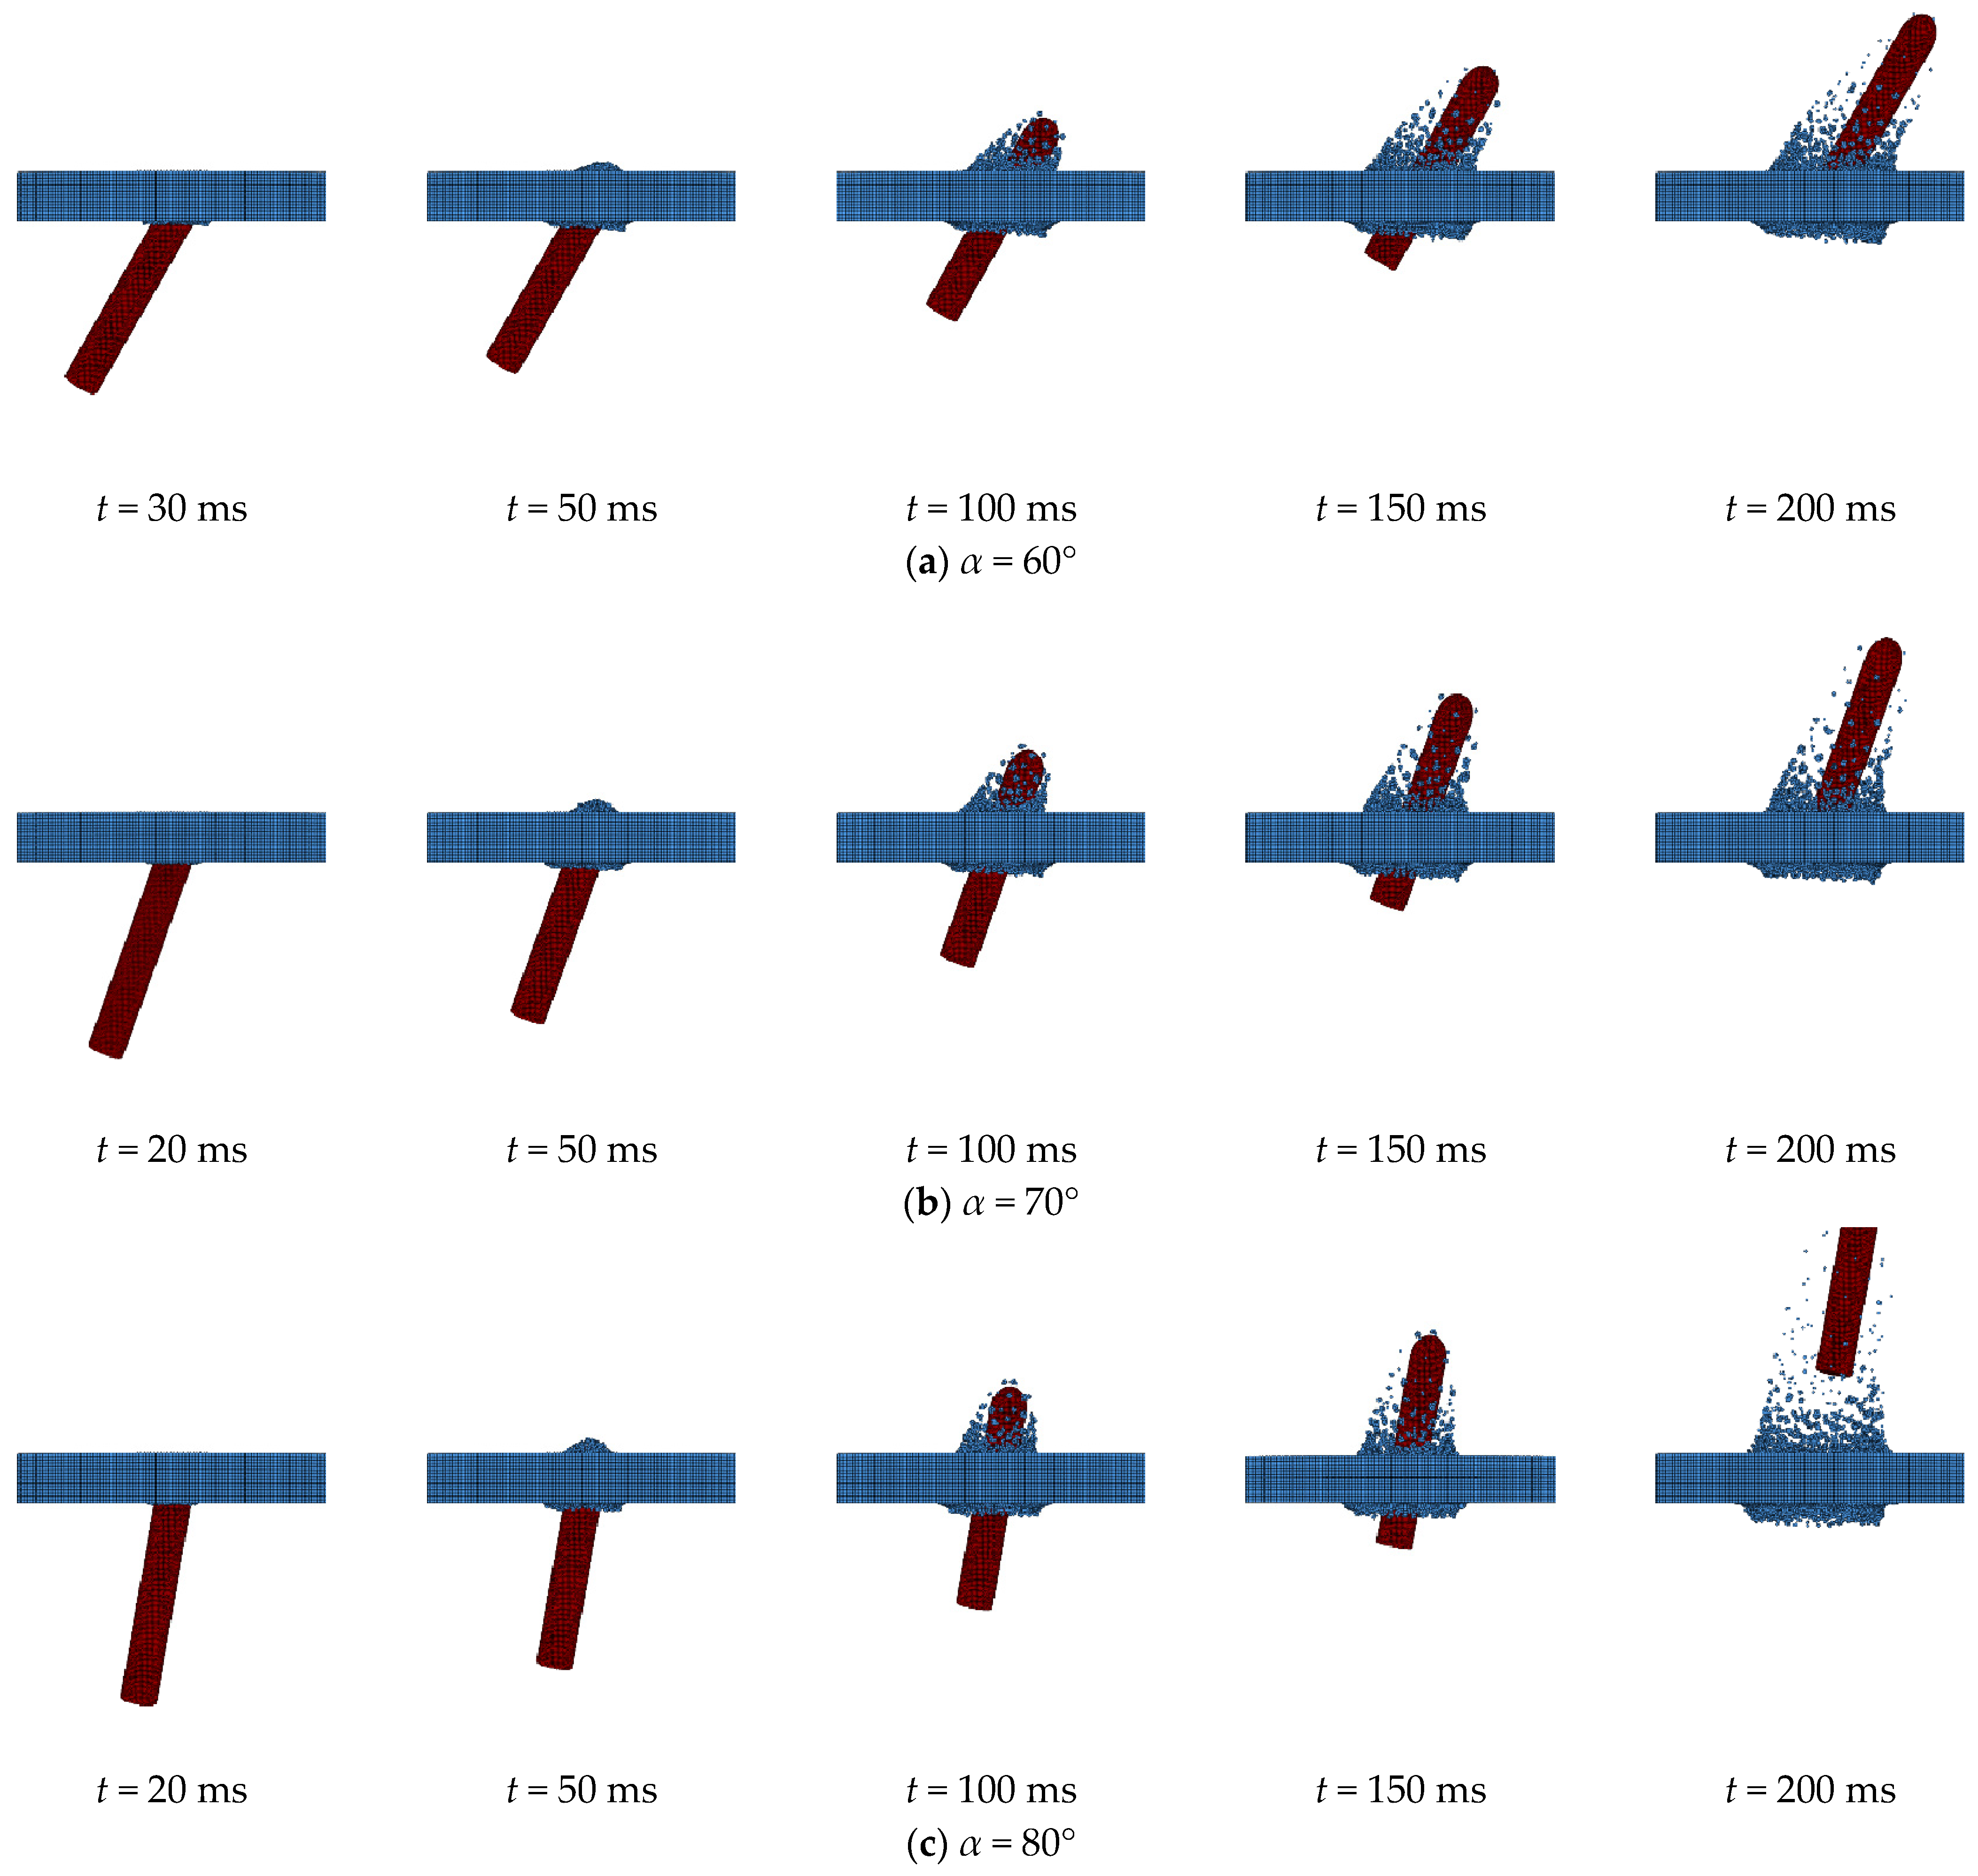
As shown in Figure 14, the icebreaking process of the HCC under different impact angles is basically the same, involving three stages, collision, penetration, and traversal. However, the icebreaking process under different impact angles exhibits distinct characteristics. As the impact angle decreases, the ice deformation gradually shows features of non-symmetric distribution, and more accumulations appear at the bottom of the ice layer on the ice-facing side during the penetration stage. In the subsequent traversal stage under different impact angles, the splashed ice particles formed by the impact are distributed along the axis of the HCC, and the destruction of the ice layer does not vary significantly.
The distribution of the von Mises stress on the surface of the HCC under different impact angles is shown in Figure 15. It can be seen that, under the initial impact angle α ≠ 90°, since the ice-back side of the HCC first contacts the ice layer, stress concentration occurs initially on the back side of the HCC’s head. As the HCC continues to penetrate the ice, the contact area at the head gradually develops from initial contact on the ice-back side to full contact between the head and the ice layer, and the stress subsequently diffuses to the entire head of the HCC. During the process of the HCC’s head piercing through the ice layer, stress concentrates on the ice-facing side for the case of α = 60° and on the ice-back side for the case of α = 80°, and is symmetrically distributed along the HCC’s axis at the head for the case of α = 70°.
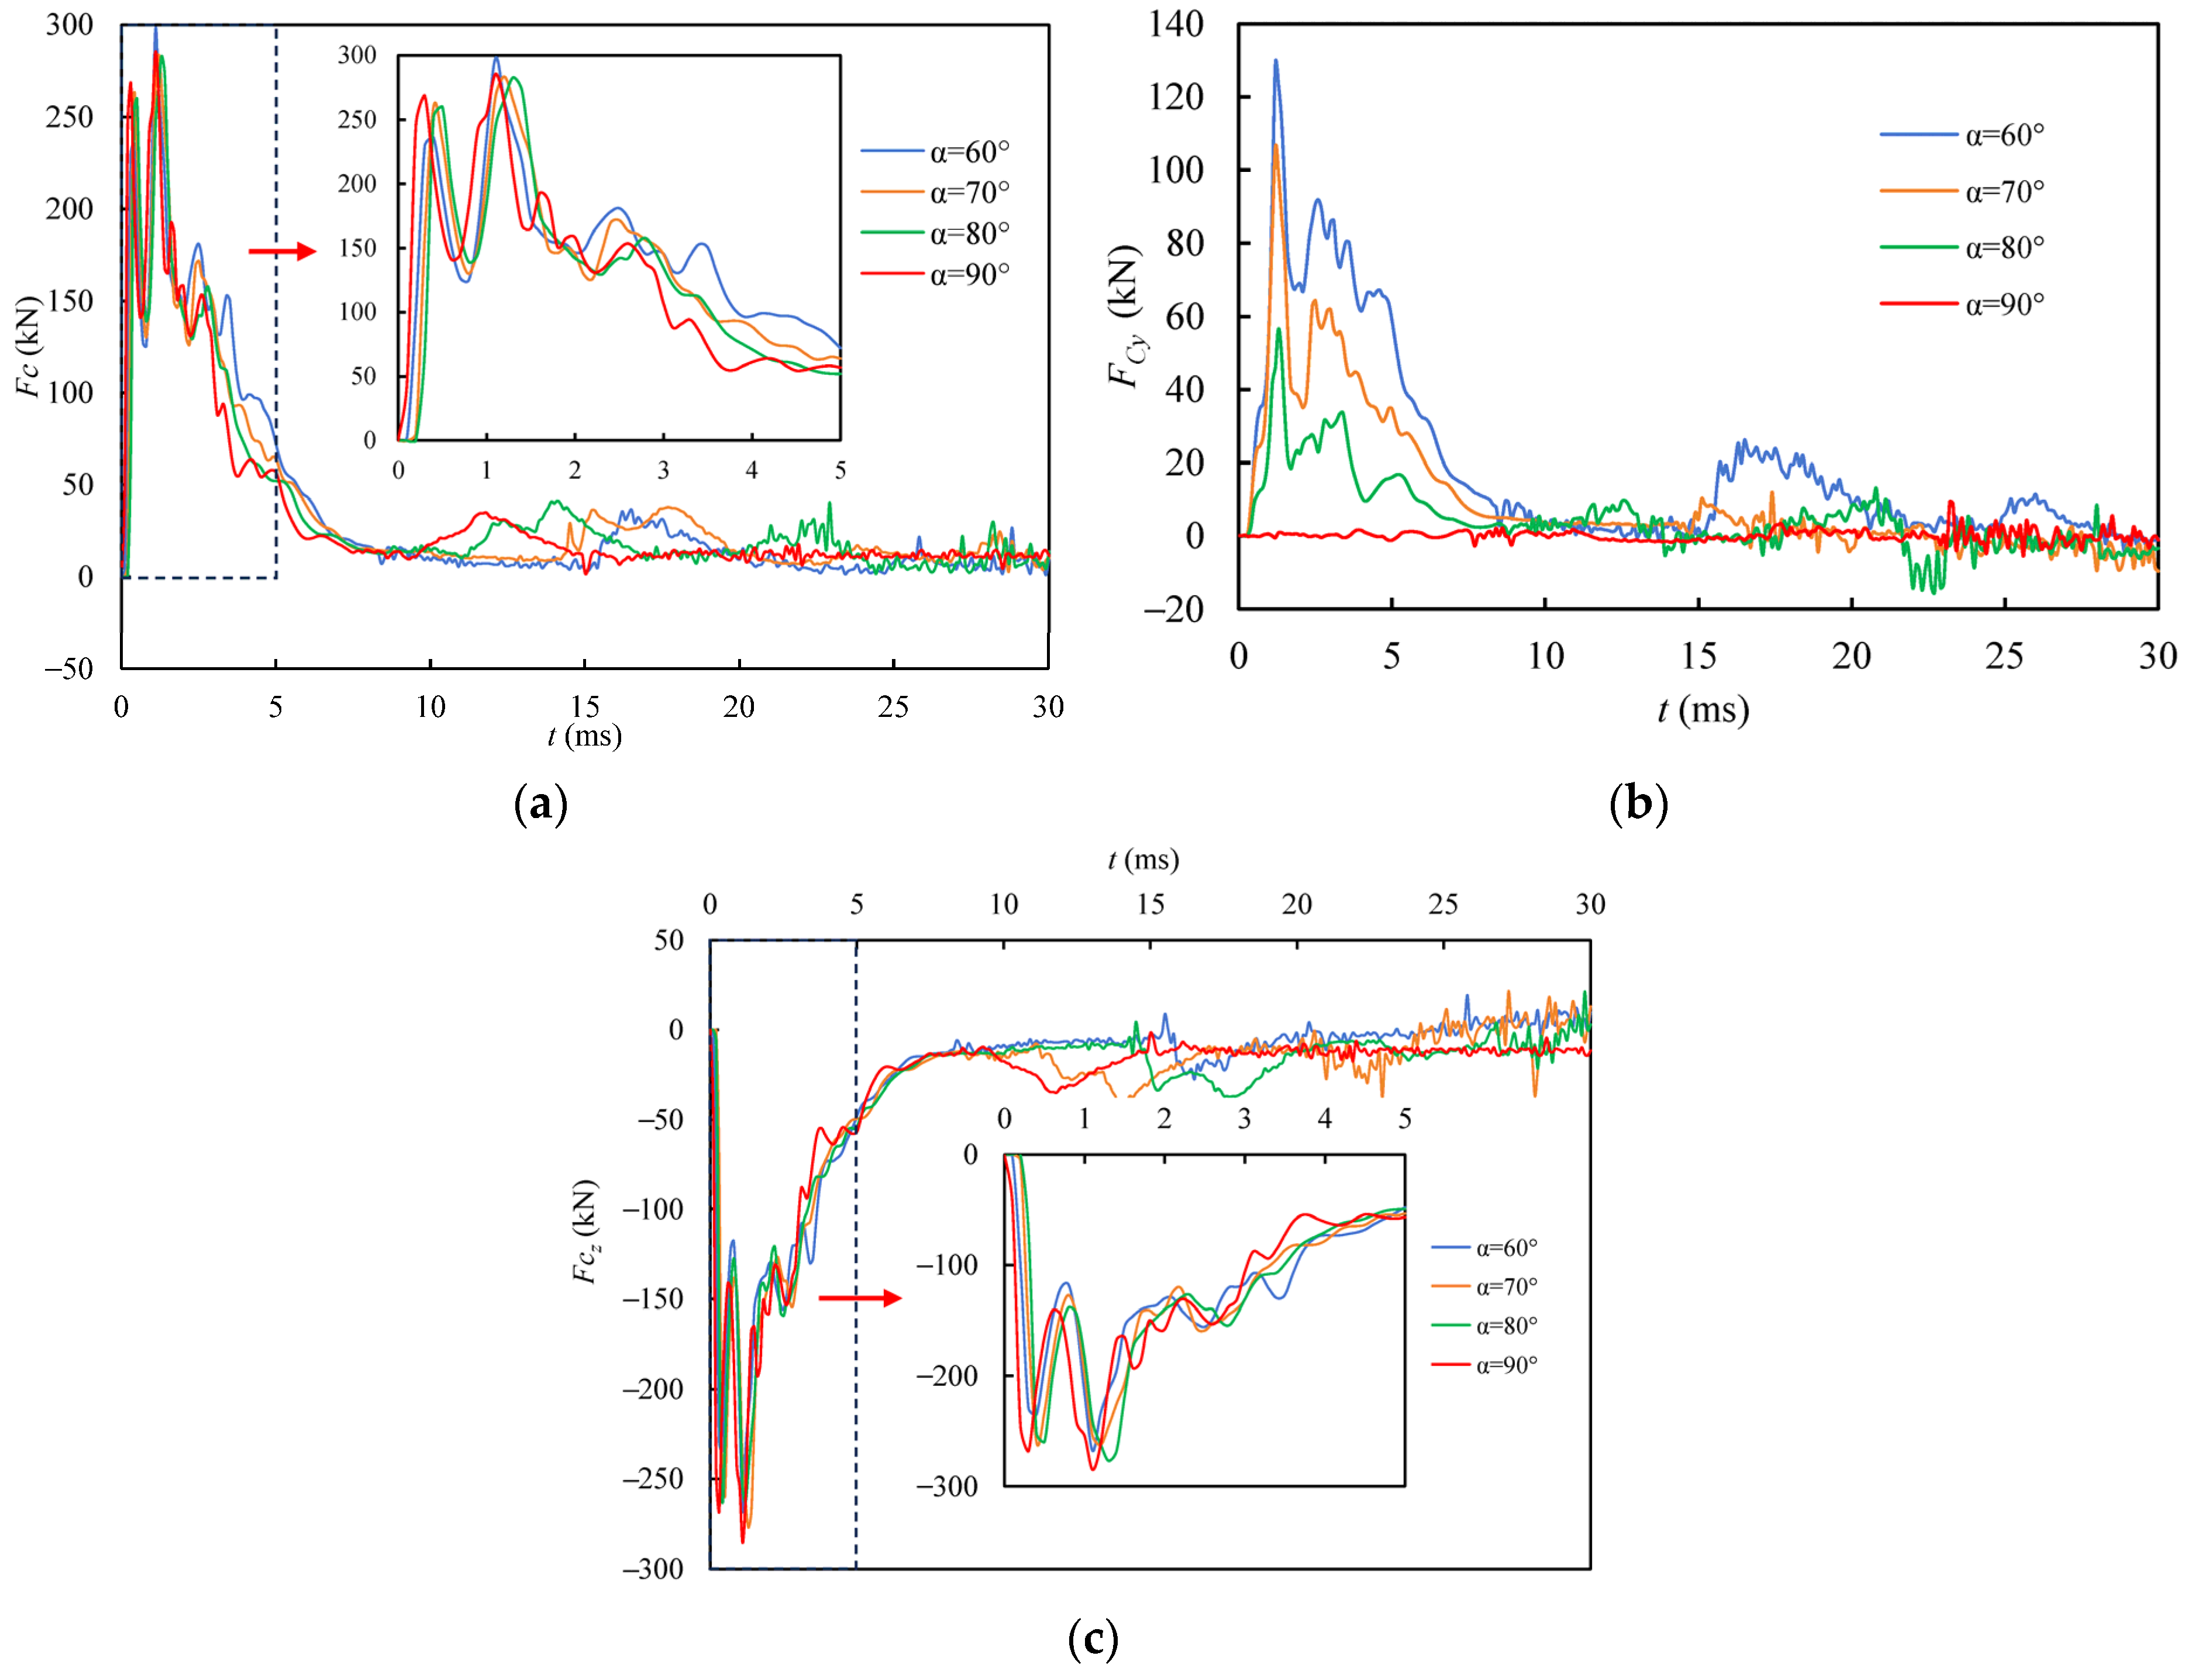
Figure 16 and Table 4, respectively, present the variation curves of impact forces over time and the corresponding peak impact forces at different impact angles. It can be observed that at different impact angles, the corresponding impact forces FC and the impact forces along the z direction FCz exhibit similar trends over time, and the differences in the peak impact forces are also minimal. However, the variation trends over time and the differences in peak impact forces of the impact force component along the y direction FCy are significantly distinct at different impact angles. As the initial impact angle decreases, the velocity component of the HCC in the y direction vy increases, and the component of the impact force in the y direction during ice impact also increases. It is also observed that when the initial impact angle is 60°, 70°, or 80°, the times at which FCz and FCy reach their peaks are essentially the same. When the initial impact angle is 90°, although the impact force fluctuates greatly during ice impact, the impact force component in the y direction is relatively small and oscillates near zero due to numerical noise. Therefore, it can be neglected compared to other initial impact angles throughout the icebreaking process.

5. Conclusions

Based on the ULSPH method, a large deformation algorithm for solid impact applicable to the high-speed water-exiting icebreaking problem of HCCs was constructed by a self-programmed C++ computational code. Combined with the Drucker–Prager damage criterion, the accurate simulation of the failure process of the ice layer was realized. This method overcomes the limitations of traditional grid-based methods in handling large deformation problems and provides a scientific basis for the structural design of polar HCCs. Based on the self-programmed algorithm, this study carried out parametric simulation for the high-speed icebreaking process of HCCs and obtained the following main conclusions.
(1)
Under the initial impact angle of 90° and ice thickness of 30 cm, as the impact velocity increases from 100 m/s to 200 m/s, the peak impact force experienced by the HCC increases from 285.31 kN to 917.51 kN, indicating a power-law scaling of F c m a x v 0 1.82 . The stress and strain generated by the HCC and the ice exhibit symmetrical distributions. The deformation and damage of the ice are generally consistent, and the ice strain mainly propagates radially.
(2)
Under the initial impact angle of 90° and initial velocity of 100 m/s, as the ice thickness increases from 10 cm to 40 cm, the peak impact force on the HCC increases from 248.6 kN to 293.7 kN, indicating a power-law scaling of F c m a x h i 0.67 . The corresponding deformation and damage caused by impact on the ice become more severe, and the radial propagation of ice strain becomes more pronounced.
(3)
When the thickness of the ice layer is 30 cm and the initial velocity is 100 m/s, as the initial impact angles decrease from 90° to 60°, the component of the impact force in the y direction becomes larger, while the impact force and the component of impact force in the z direction change little. Additionally, except for the impact angle 90°, the strains produced in the ice under other impact angles exhibit asymmetric distribution.
(4)
The high-speed icebreaking process of the HCC is primarily characterized by the collision between the HCC’s head and the ice layer. The head of the HCC experiences significant impact forces, resulting in obvious stress concentration. Therefore, protective design of the front structure is essential during structural design of the HCC.
These findings have significant practical value for improving the environmental adaptability and operational safety of polar equipment, and offer new ideas for resource development technologies in extreme environments. It is worth noting that results achieved at high initial impact velocities are limited by scarce experimental data for such extreme conditions. Future research can further couple multi-physics interactions, such as fluid–structure–thermal interactions, develop refined models suitable for complex ice conditions, such as non-uniform ice and floe groups, and validate the algorithms’ engineering applicability with experimental data, especially at extreme conditions like high initial impact velocity of 200 m/s. Furthermore, while the current ULSPH model has demonstrated good capability in simulating high-speed ice impact and fragmentation processes, future research will also be required to focus on developing coupled numerical frameworks, such as SPH-FEM and SPH-DEM coupling algorithms, to address more complex engineering scenarios.

Author Contributions

Conceptualization, X.C., Z.L., J.Z. (Jun Zhang) and J.Z. (Jie Zhao); methodology, J.Z. (Jun Zhang), Y.J. and J.Z. (Jie Zhao); software, X.C., Z.L., Y.J. and J.Z. (Jun Zhang); validation, X.C. and Z.L.; formal analysis, Y.J., J.Z. (Jie Zhao) and Z.L.; investigation, Y.J., X.C. and J.Z. (Jun Zhang); resources, J.Z. (Jun Zhang) and J.Z. (Jie Zhao); data curation, X.C., Y.J. and Z.L.; writing—original draft preparation, Y.J., X.C., Z.L., J.Z. (Jun Zhang) and J.Z. (Jie Zhao); writing—review and editing, X.C., Z.L., Y.J. and J.Z. (Jun Zhang); visualization, J.Z. (Jie Zhao) and Y.J.; supervision, X.C., Z.L. and J.Z. (Jun Zhang); project administration, J.Z. (Jun Zhang); funding acquisition, X.C. All authors have read and agreed to the published version of the manuscript.

Funding

This research received no external funding.

Data Availability Statement

The data presented in this study are available on request from the corresponding author.

Acknowledgments

The authors would like to thank members of the Key Laboratory of Unsteady Aerodynamics and Flow Control for fruitful discussions.

Conflicts of Interest

The authors declare no conflicts of interest.

Abbreviations

The following abbreviations are used in this manuscript:
ALEArbitrary Lagrangian–Eulerian
CELCoupled Eulerian–Lagrangian
CFLCourant–Friedrichs–Lewy
FEMFinite Element Method
HCCHemispherically capped cylinder
SPHSmoothed Particle Hydrodynamics
ULSPHUpdate Lagrange Smoothed Particle Hydrodynamics
V-Mvon Mises

References

  1. Zhang, J.J.; Guo, P.Q. The Direction and lmpact of Geopolitical Games in the Arctic Againstthe Background of the Russia-Ukraine Conflict. Russ. East Eur. Cent. Asian Stud. 2024, 6, 91–113+161–162. [Google Scholar]
  2. Jin, Y.Q.; Zhang, Y.; Chen, C.S.; Xu, D.Y. Comparison and Assessment of Data on Multi-Source Satellite Remote Sensing Arctic Sea Ice Thickness. Chin. J. Polar Res. 2023, 35, 238–250. [Google Scholar]
  3. Yu, T.Q.; Liu, K.; Liu, J.J.; Wang, Z.L. Constitutive Model of Ice Material in Ship-Ice Collision Considering Temperature Effect. J. Ship Mech. 2023, 27, 250–259. [Google Scholar]
  4. Timco, G.W.; Weeks, W.F. A Review of the Engineering Properties of Sea Ice. Cold Reg. Sci. Technol. 2010, 60, 107–129. [Google Scholar] [CrossRef]
  5. Thomas, D.N.; Dieckmann, G.S. Sea Ice: An Introduction to Its Physics, Chemistry, Biology and Geology; John Wiley and Sons: Hoboken, NJ, USA, 2003. [Google Scholar]
  6. Drucker, D.C.; Prager, W. Soil Mechanics and Plastic Analysis or Limit Design. Q. Appl. Math. 1952, 10, 157–165. [Google Scholar] [CrossRef]
  7. Carney, K.S.; Benson, D.J.; DuBois, P.; Lee, R. A Phenomenological High Strain Rate Model with Failure for Ice. Int. J. Solids Struct. 2006, 43, 7820–7839. [Google Scholar] [CrossRef]
  8. Tsai, S.W.; Wu, E.M. A General Theory of Strength for Anisotropic Materials. J. Compos. Mater. 1971, 5, 58–80. [Google Scholar] [CrossRef]
  9. Yu, B.; Low, Y.M. A Phenomenological Model for Simulating Ice Loads on Vertical Structures Incorporating Strain Rate-Dependent Stress-Strain Characteristics. Appl. Math. Model. 2022, 101, 132–156. [Google Scholar] [CrossRef]
  10. Zong, R. Finite Element Analysis of Ship-Ice Collision Using LS-Dyna. Ph.D. Thesis, Memorial University of Newfoundland, St. John’s, NL, Canada, 2012. [Google Scholar]
  11. Xu, Y.; Wu, J.; Li, P.; Kujala, P.; Hu, Z.; Chen, G. Investigation of the Fracture Mechanism of Level Ice with Extended Finite Element Method. Ocean Eng. 2022, 260, 112048. [Google Scholar] [CrossRef]
  12. Wang, G.; Ji, S.; Lv, H.; Yue, Q. Drucker–Prager Yield Criteria in Viscoelastic-Plastic Constitutive Model for the Study of Sea Ice Dynamics. J. Hydrodyn. 2006, 18, 714–722. [Google Scholar] [CrossRef]
  13. Shi, C.; Hu, Z.; Ringsberg, J.; Luo, Y. Validation of a Temperature-Gradient-Dependent Elastic-Plastic Material Model of Ice with Finite Element Simulations. Cold Reg. Sci. Technol. 2017, 133, 15–25. [Google Scholar] [CrossRef]
  14. Jeon, S.; Kim, Y. Numerical Simulation of Level Ice–Structure Interaction Using Damage-Based Erosion Model. Ocean Eng. 2021, 220, 108485. [Google Scholar] [CrossRef]
  15. Long, X.; Liu, S.; Ji, S. Discrete Element Modelling of Relationship Between Ice Breaking Length and Ice Load on Conical Structure. Ocean Eng. 2020, 201, 107152. [Google Scholar] [CrossRef]
  16. Marnix, V.D.B.; Raed, L.; Sveinung, L. An Implicit Time-Stepping Scheme and an Improved Contact Model for Ice-Structure Interaction Simulations. Cold Reg. Sci. Technol. 2018, 155, 193–213. [Google Scholar]
  17. Liu, M.; Wang, Q.; Lu, W. Peridynamic Simulation of Brittle-Ice Crushed by a Vertical Structure. Int. J. Nav. Archit. Ocean Eng. 2017, 9, 209–218. [Google Scholar] [CrossRef]
  18. Shi, H.T.; Yuan, G.Y.; Ni, B.Y.; Zhang, L.W. Quasi-Brittle Ice Breaking Mechanisms by High-Velocity Water Jet Impacts: An Investigation Based on PD-SPH Coupling Model and Experiments. J. Mech. Phys. Solids 2024, 191, 105783. [Google Scholar] [CrossRef]
  19. Zhang, S.; Lin, W.; Xu, H.; Sun, T. Dynamic Characteristics of an Underwater Ventilated Vehicle Exiting Water in an Environment with Scattered Ice Floes. J. Mar. Sci. Eng. 2023, 11, 2046. [Google Scholar] [CrossRef]
  20. Zhao, W.H. Simulation Research on Ice loading of Typical Floating Vertical Icebreaking. Master’s Thesis, China Ship Research and Development Academy, Wuxi, China, 2023. [Google Scholar]
  21. Yue, J.Z.; Wu, X.Q.; Huang, C.G. Multi-Field Coupling Effect and Similarity Law of Floatingice Break by Vehicle Launched Underwater. Chin. J. Theor. Appl. Mech. 2021, 53, 1930–1939. [Google Scholar]
  22. Zhang, G.Y.; You, C.; Wei, H.P.; Sun, T.; Yang, B. Experimental Study on the Effects of Brash Ice on the Water-Exit Dynamics of an Underwater Vehicle. Appl. Ocean Res. 2021, 117, 102948. [Google Scholar] [CrossRef]
  23. Cui, W.Z.; Kong, D.C.; Sun, T.Z.; Yan, G. Coupling Dynamic Characteristics of High-Speed Water-Entry Projectile and Ice Sheet. Ocean Eng. 2023, 275, 114090. [Google Scholar] [CrossRef]
  24. Qian, Y. Study on the Calculation Method for the Ice-Load of Vertical Ice-Breaking. Master’s Thesis, Harbin Engineering University, Harbin, China, 2020. [Google Scholar]
  25. You, C.; Sun, T.Z.; Zhang, G.Y.; Wei, Y.; Zong, Z. Numerical Study on Effect of Brash Ice on Water Exit Dynamics of Ventilated Cavitation Cylinder. Ocean Eng. 2022, 245, 110443. [Google Scholar] [CrossRef]
  26. Wang, H.; Luo, Y.H.; Chen, Z.H.; Huang, Z. Influences of Ice-Water Mixture on the Vertical Water-Entry of a Cylinder at a Low Velocity. Ocean Eng. 2022, 256, 111464. [Google Scholar] [CrossRef]
  27. Sun, T.Z.; Zhang, J.Y.; Wei, H.P.; Zhang, D.; Zhang, G. Experimental Investigation of the Influence of Floating Ices Constraint on the Cavity Dynamics of an Axisymmetric Body During the Water Exit Process. Ocean Eng. 2022, 244, 110383. [Google Scholar] [CrossRef]
  28. Wang, C.H.; Wang, J.A.; Wang, C.; Guo, C.; Zhu, G. Research on Vertical Movement of Cylindrical Structure Out of Water and Breaking Through Ice Layer Based on S-Ale Method. Chin. J. Theor. Appl. Mech. 2021, 53, 3110–3123. [Google Scholar]
  29. Khabakhpasheva, T.; Chen, Y.; Korobkin, A. Impact onto an Ice Floe. J. Adv. Res. Ocean Eng. 2018, 4, 146–162. [Google Scholar]
  30. Ghandehari, M.A.; Masoodi, A.R.; Hosseininia, E.S. Temperature-Dependency and Boundary Condition Impacts on the Multiscale Vibrational Behavior of Laminated Nested Dual Conical Shell Structure Semi-AUV Applications. Appl. Ocean Res. 2025, 154, 104425. [Google Scholar] [CrossRef]
  31. Ghandehari, M.A.; Masoodi, A.R.; Hosseininia, S.E.S. Multiscale Dynamic Behavior of Imperfect Hybrid Matrix/Fiber Nanocomposite Nested Conical Shells with Elastic Interlayer. Thin-Walled Struct. 2024, 205, 112494. [Google Scholar] [CrossRef]
  32. Masoodi, A.R.; Arabi, E. Geometrically Nonlinear Thermomechanical Analysis of Shell-Like Structures. J. Therm. Stress. 2018, 41, 37–53. [Google Scholar] [CrossRef]
  33. Lee, C.H.; Refachinho de Campos, P.R.; Gil, A.J.; Giacomini, M.; Bonet, J. An Entropy-Stable Updated Reference Lagrangian Smoothed Particle Hydrodynamics Algorithm for Thermo-Elasticity and Thermo-Visco-Plasticity. Comput. Part. Mech. 2023, 10, 1493–1531. [Google Scholar] [CrossRef]
  34. Wu, D.; Zhang, C.; Tang, X.; Hu, X. An Essentially Non-Hourglass Formulation for Total Lagrangian Smoothed Particle Hydrodynamics. Comput. Methods Appl. Mech. Eng. 2023, 407, 115915. [Google Scholar] [CrossRef]
  35. Dong, X.; Zhang, Q.; Liu, Y.; Liu, X. Improved Mesh-Free SPH Approach for Loose Top Coal Caving Modeling. Particuology 2024, 95, 1–27. [Google Scholar] [CrossRef]
  36. Wiragunarsa, M.; Zuhal, L.R.; Dirgantara, T.; Putra, I.S. SPH Method for Crack Growth Modelling Using Particle Deletion and Interaction Pair-based Framework. Procedia Struct. Integr. 2024, 52, 583–593. [Google Scholar] [CrossRef]
  37. Gingold, R.A.; Monaghan, J.J. Smoothed Particle Hydrodynamics: Theory and Application to Non-Spherical Stars. Mon. Not. R. Astron. Soc. 1977, 181, 375–389. [Google Scholar] [CrossRef]
  38. Libersky, L.D.; Randles, P.W.; Carney, T.C.; Dickinson, D.L. Recent Improvements in SPH Modeling of Hypervelocity Impact. Int. J. Impact Eng. 1997, 20, 525–532. [Google Scholar] [CrossRef]
  39. Gray, J.P.; Monaghan, J.J.; Swift, R.P. SPH Elastic Dynamics. Comput. Methods Appl. Mech. Eng. 2001, 190, 6641–6662. [Google Scholar] [CrossRef]
  40. Kupchella, R.; Stowe, D.; Weiss, M.; Pan, H.; Cogar, J. SPH Modeling Improvements for Hypervelocity Impacts. Procedia Eng. 2015, 103, 326–333. [Google Scholar] [CrossRef]
  41. Wang, L.; Xu, F.; Yang, Y. An Improved Total Lagrangian SPH Method for Modeling Solid Deformation and Damage. Eng. Anal. Bound. Elem. 2021, 133, 286–302. [Google Scholar] [CrossRef]
  42. Zhang, S.; Zhang, C.; Hu, X.; Lourenço, S.D. A Riemann-Based SPH Method for Modelling Large Deformation of Granular Materials. Comput. Geotech. 2024, 167, 106052. [Google Scholar] [CrossRef]
  43. Das, J.; Ehlers, S. Numerical Simulation of Crushing and Bending Failure of Ice Using SPH. International Conference on Offshore Mechanics and Arctic Engineering. Am. Soc. Mech. Eng. 2015, 56567, V008T07A019. [Google Scholar]
  44. Anghileri, M.; Castelletti, L.L.; Invernizzi, F.; Mascheroni, M. A Survey of Numerical Models for Hail Impact Analysis Using Explicit Finite Element Codes. Int. J. Impact Eng. 2005, 31, 929–944. [Google Scholar] [CrossRef]
  45. Zhang, N.; Zhang, X.; Ma, Q.; Hu, Z. A Numerical Study on Ice Failure Process and Ice-Ship Interactions by Smoothed Particle Hydrodynamics. Int. J. Nav. Archit. Ocean Eng. 2019, 11, 796–808. [Google Scholar] [CrossRef]
  46. Chen, Z.; He, Y.; Gu, Y.; Su, B.; Ren, Y.; Liu, Y. A Novel Method for Numerical Simulation of the Interaction Between Level Ice and Marine Structures. J. Mar. Sci. Technol. 2021, 26, 1170–1183. [Google Scholar] [CrossRef]
  47. Mokhtari, M.; Kim, E.; Amdahl, J. A Non-Linear Viscoelastic Material Model with Progressive Damage Based on Microstructural Evolution and Phase Transition in Polycrystalline Ice for Design Against Ice Impact. Int. J. Impact Eng. 2023, 176, 104563. [Google Scholar] [CrossRef]
  48. Zhou, S.; Chen, G.; Qian, L.; Ma, J. HLFEMP: A Coupled MPM-FEM Method Under a Hybrid Updated and Total Lagrangian Framework. Appl. Math. Model. 2024, 136, 115644. [Google Scholar] [CrossRef]
  49. Liu, G.R.; Liu, M.B. Smoothed Particle Hydrodynamics: A Meshfree Particle Method; World Scientific: Singapore, 2003. [Google Scholar]
  50. Khayyer, A.; Shimizu, Y.; Lee, C.H.; Gil, A.; Gotoh, H.; Bonet, J. An Improved Updated Lagrangian SPH Method for Structural Modelling. Comput. Part. Mech. 2024, 11, 1055–1086. [Google Scholar] [CrossRef]
  51. Monaghan, J.J. Smoothed Particle Hydrodynamics. Annu. Rev. Astron. Astrophys. 1992, 30, 543–574. [Google Scholar] [CrossRef]
  52. Monaghan, J.J. SPH Without a Tensile Instability. J. Comput. Phys. 2000, 159, 290–311. [Google Scholar] [CrossRef]
  53. Zhang, C.; Rezavand, M.; Hu, X. A Multi-Resolution SPH Method for Fluid-Structure Interactions. J. Comput. Phys. 2021, 429, 110028. [Google Scholar] [CrossRef]
  54. Adami, s.; Hu, X.Y.; Adams, N.A. A Generalized Wall Boundary Condition for Smoothed Particle Hydrodynamics. J. Comput. Phys. 2012, 231, 7057–7075. [Google Scholar] [CrossRef]
  55. Wu, D.; Tang, X.; Zhang, S.; Hu, X. Unified Non-Hourglass Formulation for Total Lagrangian SPH Solid Dynamics. Comput. Mech. 2024, 75, 1081–1113. [Google Scholar] [CrossRef]
  56. Fan, J.; Yuan, Q.H.; Jing, F.L.; Bai, G.; Shen, X. Macro-Phenomenological High-Strain-Rate Elastic Fracture Model for Ice-Impact Simulations. Chin. J. Aeronaut. 2023, 36, 146–160. [Google Scholar] [CrossRef]
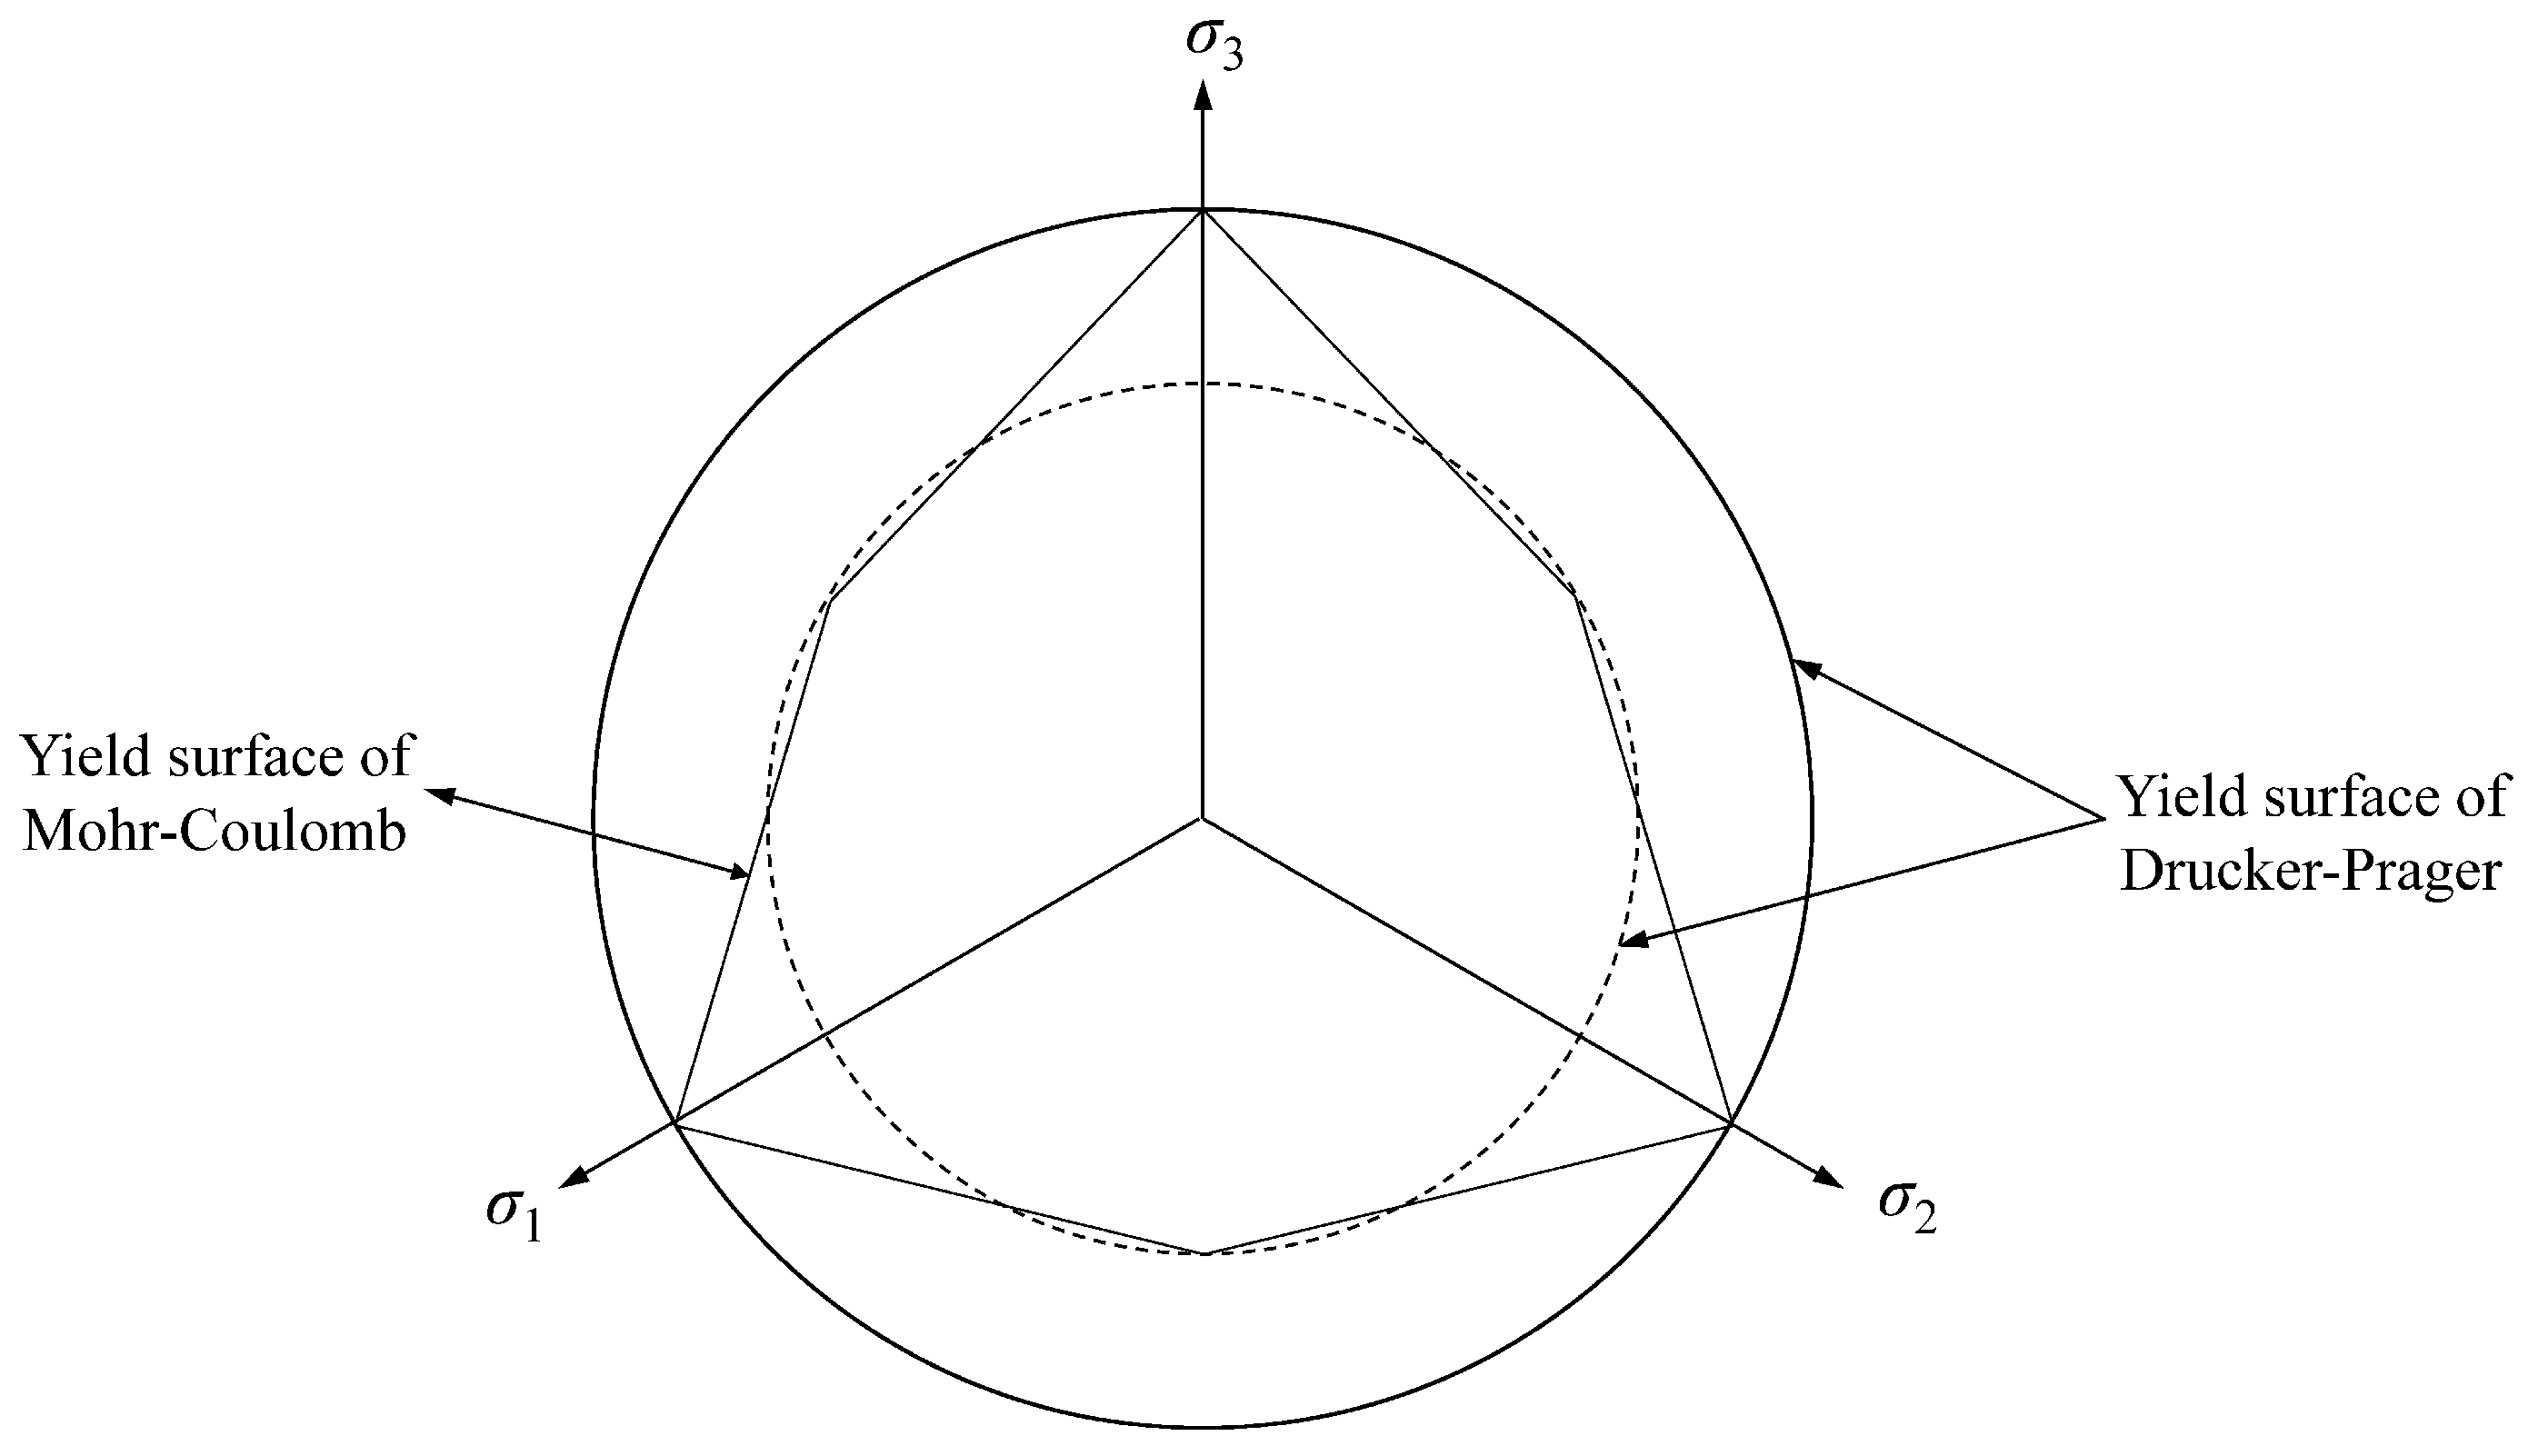
Figure 1. Schematic of the cross-section of the yield surface.
Jmse 13 01637 g001
Figure 2. Schematic diagram of the numerical model for an ice ball impacting on the center of the target plate. (a) Three-dimensional view, (b) front view.
Jmse 13 01637 g002
Figure 3. Deformation process of the ice ball impacting the center of the target plate.
Jmse 13 01637 g003
Figure 4. Comparison of the impact forces achieved in this work and those reported by Fan et al. (adapted from [56]).
Jmse 13 01637 g004
Figure 5. Schematic of the icebreaking by an HCC. (a) Dimensions of the three-dimensional calculation domain, (b) the relative position of the vessel impacting the ice sheet at the initial moment.
Jmse 13 01637 g005
Figure 6. Icebreaking deformation process of the HCC under different initial velocities. (a) v0 = 100 m/s, (b) v0 = 150 m/s, (c) v0 = 200 m/s.
Jmse 13 01637 g006aJmse 13 01637 g006b
Figure 7. Distribution of von Mises stress on the surface of the HCC under different initial velocities during the icebreaking process. (a) v0 = 100 m/s, (b) v0 = 150 m/s, (c) v0 = 200 m/s.
Jmse 13 01637 g007aJmse 13 01637 g007b
Figure 8. Distribution of von Mises strain on the ice layer and HCC surface at different initial velocities. (a) v0 = 100 m/s, (b) v0 = 150 m/s, (c) v0 = 200 m/s.
Jmse 13 01637 g008aJmse 13 01637 g008b
Figure 9. Variations in impact forces of the HCC at different initial velocities over time.
Jmse 13 01637 g009
Figure 10. Icebreaking deformation process of the HCC at different thicknesses of ice layers. (a) hi = 10 cm, (b) hi = 20 cm, (c) hi = 40 cm.
Jmse 13 01637 g010
Figure 11. Distribution of the von Mises stress of the HCC at different thicknesses of ice layers during the icebreaking process. (a) hi = 10 cm, (b) hi = 20 cm, (c) hi = 40 cm.
Jmse 13 01637 g011aJmse 13 01637 g011b
Figure 12. Distribution of von Mises strain on the ice layer and HCC surface at different thicknesses of ice layers. (a) hi = 10 cm, (b) hi = 20 cm, and (c) hi = 40 cm.
Jmse 13 01637 g012aJmse 13 01637 g012b
Figure 13. Variations in impact forces of the HCC over time at different thicknesses of ice layers.
Jmse 13 01637 g013
Figure 14. Icebreaking deformation process of the HCC under different initial impact angles. (a) α = 60°, (b) α = 70°, (c) α = 80°.
Jmse 13 01637 g014
Figure 15. Distribution of the von Mises stress of the HCC under different initial impact angles during the icebreaking process. (a) α = 60°, (b) α = 70°, (c) α = 80°.
Jmse 13 01637 g015aJmse 13 01637 g015b
Figure 16. Variations in impact forces of the HCC over time at different initial impact angles. (a) Impact force FC, (b) impact force in the y direction FCy, (c) impact force in the z direction FCz.
Jmse 13 01637 g016
Table 1. Material models and parameters for ice and the target plate.
ObjectItemValue/Description
IceDensity900 kg/m3
Elastic modulus9.38 GPa
Poisson’s ratio0.33
Friction angle36°
Cohesion0.58 MPa
Shear dilation angle12°
Material modelElastoplastic material model
Target plateDamage criterionDrucker–Prager criterion
Density2700 kg/m3
Elastic modulus0.67 GPa
Poisson’s ratio0.33
Material modelElastic continuum
Table 2. Three schemes of the particle discretization applied in the validation test and the corresponding maximum impact forces.
Scheme 1Scheme 2Scheme 3
ht/∆x121620
Dt/∆x456075
Particles of the target plate115,248260,400524,800
Particles of the ice ball44,388105,216205,304
Maximum impact force FCmax36.86 kN36.25 kN35.56 kN
Error between numerical results obtained from this work and Ref. [56]6.3%4.5%5.4%
Error between numerical and experimental results obtained from this work and Ref. [56], respectively16.7%14.8%15.3%
Table 3. Material models and parameters of the HCC.
ItemValue/Description
Density1500 kg/m3
Elastic modulus2.10 GPa
Poisson’s ratio0.33
Material modelElastic continuum
Table 4. Peak impact forces under different initial impact angles.
ItemFCmax (kN)FCymax (kN)FCzmax (kN)
60°297.8129.3−268.3
70°283.6106.3−262.9
80°282.956.5−277.2
90°285.3−5.4−285.3
Disclaimer/Publisher’s Note: The statements, opinions and data contained in all publications are solely those of the individual author(s) and contributor(s) and not of MDPI and/or the editor(s). MDPI and/or the editor(s) disclaim responsibility for any injury to people or property resulting from any ideas, methods, instructions or products referred to in the content.