Abstract
This work proposes a mid-fidelity load-mapping method for the structural analysis of semisubmersible floating offshore wind turbine substructures. Building on a hybrid linear potential flow and strip-theory dynamic analysis, the method maps hydrodynamic, current, hydrostatic, gravitational, inertial, mooring, and turbine loads onto a shell-based finite element (FE) model. The functionality of the proposed method is demonstrated through two case studies involving ultimate limit state analysis of a structurally reinforced OC4 DeepCwind semisubmersible platform. The analyses were conducted for two design load cases (DLCs) formulated to represent the metocean conditions at the Utsira Nord site, located off the coast of Norway. The accuracy of the mapped hydrostatic and potential flow loads is validated against dynamic simulation data, while a mesh convergence study is used to ensure reliable FE model performance. Results show that the highest von Mises stresses occur at unsupported heave-plate regions, internal stiffeners, and welded joints, with peak stresses safely below the steel’s yield strength. The more severe conditions of DLC 6.1 lead to a broader distribution of high-stress locations compared to DLC 1.6 but only a modest increase in peak stress.
1. Introduction
As conventional bottom-fixed wind turbines are (economically) limited to water depths of less than 60 m, almost 80% of global wind resources are rendered inaccessible [1]. For this reason, floating offshore wind turbines (FOWTs) are necessary for the future growth of offshore wind energy production. As FOWTs can operate in ultradeep waters (>) [2], they can be placed farther offshore, where there are stronger and more consistent winds [3], leading to increased energy yields and capacity factors [4]. However, this also means that they are subjected to harsher environmental conditions. Combined with the fact that such structures can move with six degrees of freedom, the structural design of these floaters and knowledge of local stresses at critical components become increasingly important.
Contradictorily, in the literature, most studies of FOWTs focus on the dynamics of the structure, modelling the floating substructure as a rigid body [5,6,7]. Moreover, due to the architecture of aero-hydro-servo-elastic simulation software, such as OpenFAST [8], where a flexible tower is attached to a rigid substructure, the loads at the tower base can easily be extracted. As a result, most of the studies that do consider the structural integrity of FOWT substructures focus on the (fatigue) loads at the tower base [6,7,9,10,11], noting that this is the most critical (fatigue) location [12]. However, as most substructures are made of multiple members connected with welded joints, which act as stress raisers, the stresses in all members should be considered in structural analyses.
This can be done by considering beam-based finite element (FE) models, either using the loads generated from a rigid-body time-domain simulation as input for the FE model [13,14] or by developing a fully coupled aero-hydro-servo-elastic model with an elastic substructure [15,16,17]. The latter has been added to wind turbine simulation tools such as OpenFAST [18], Orcaflex [19], HAWC2 [20], and QBlade [21]. However, as these implementations need to evaluate the loads at the beam nodes, only strip-theory loads can be considered. To consider potential flow loads, multi-body analyses can be used to map the resulting concentrated loads of a hydrodynamic analysis to the beam-based structural model [5]. The main disadvantage of this type of method is that semisubmersible FOWTs, such as the OC4 DeepCwind designed by the National Renewable Energy Laboratory (NREL) [22] and the VolturnUS-S developed by the University of Maine [23], consist of members with thickness-to-length ratios for which the Euler–Bernoulli and (generally) Timoshenko-Ehrenfest beam theories are not applicable.Furthermore, beam models cannot capture the stress concentrations caused by welded joints.
Thus, for more detailed structural analyses, shell or solid-element FE models are necessary. In the work of Park and Choung [24], the structural integrity of an semisubmersible FOWT substructure was evaluated using a shell-element FE model for a worst-case combination of loads in a single time frame. In their method, a direct strength analysis is performed, considering both static and dynamic load contributions. The static loads consist of the self-weight of the FOWT and the hydrostatic pressure, while the inertial loads, modelled as long-term acceleration components, and nacelle thrust contribute tow the dynamic loads. Hydrodynamic loads, nacelle thrust, hydrostatic pressures, and the weight of the structure were explicitly modelled in the ultimate limit state (ULS) analysis of a semisubmersible FOWT performed by Gallardo et al. [25]. In this work, the maximum hydrodynamic pressure for a given metocean condition was calculated based on DNV guidelines [26,27]. Note that both methods consider the structural response of a single critical/worst-case set of loads and not the results from time-domain simulations.
Time-dependent hydrodynamic loads under the form of Morison’s strip theory equation [28] were considered in the work of Diogo [29] for the DeepCwind semisubmersible-type FOWT; their work was continued by Vieira et al. [30] and by Ha et al. [31] for a spar-buoy FOWT. Vieira et al. [30] used their shell-element solution to drive solid-element submodels of the welded zones, without explicitly modelling the welds, and Ha et al. [31] used their time-domain results to evaluate the local stresses at the fairleads. However, by solely considering Morison’s equation, their methods are limited to severe wave conditions, i.e., for ULS analyses.
For less severe wave conditions, methods using linear potential flow theory should be adopted. In the work of Lee et al. [32] and Gao et al. [33], hydrodynamic pressure fields linked to wave-excitation and radiation loads were applied to shell-element FE models of the OC4 DeepCwind and VolturnUS-S platforms, respectively. Lee et al. used these dynamic pressure fields, alongside loads at the tower base and mooring lines acting as boundary conditions, to calculate fatigue damage deterministically using a wave scatter diagram and the average annual wind speed. Note that no hydrostatic loads were considered in their work. Gao et al. used rigid-body hydrodynamic analyses to recalculate the time-domain pressure fields and applied these, as well as time-varying inertia, gravity, tower base, hydrostatic, and mooring fairlead loads, to the FE model. While no validation was presented in the work of Lee et al., Gao et al. validated their proposed method by comparing the resulting stresses at selected points with an existing frequency-domain method. However, wind loads were not included in this validation. For higher fidelity models, this type of method can be integrated in two-way coupling schemes, as performed by Wiegard et al. [34], Rodríguez-López et al. [35], and Lee et al. [36]. While the effect of elasticity on the dynamics was considered in these studies, this is inherently not possible for the stresses, as a rigid substructure means that the displacements and, by extension, the stresses are, per definition, equal to zero. Note that as these methods consider linear potential flow to model the hydrodynamic loads, their use is limited to fatigue limit state (FLS) analyses.
A hybrid model using second-order potential flow and the drag term of the Morison equation was developed by Yoon and Choung [37]. In their method, a fully coupled, self-developed plug-in for the Abaqus FE solver [38] is used to perform hydro-elastic dynamic simulations and to investigate the structural loads on a semisubmersible-type FOWT. In this work, the hydrodynamic potential flow loads were calculated at a reference point and linked to the FE model using a method based on the distribution of couplings. While this produced good results for the dynamic simulations, questions can be asked with respect to whether the used coupling elements are able to accurately distribute the hydrodynamic loads over the floating platform. The challenge of applying second-order potential flow loads as distributed pressures was highlighted by Lee et al. [36]. They noted that the use of quadratic transfer functions significantly increases the numerical complexity for the implementation of these loads, rendering existing approaches developed for linear potential flow unsuitable.
This study introduces a novel mid-fidelity load-mapping method for time-domain structural analysis of FOWT substructures using a shell-based FE model. Compared to existing approaches using beam models or static load cases, this method captures the full dynamic loading of the structure, including potential flow, viscous drag, current, hydrostatics, inertia, wind loads, and mooring effects, and maps them directly onto the shell mesh for a quasi-static FE analysis. Furthermore, by considering hybrid linear potential flow and strip theory hydrodynamic loads, the method can be used for both calm seas, where the potential flow loads are dominant, and for more severe sea states, where the impact of viscous effects becomes more pronounced, enabling both FLS and ULS analyses and bridging the gap between existing load-mapping models and higher fidelity hydro-elastic and higher-order models. Using a stiffened version of the OC4 DeepCwind, the method is validated and demonstrated for a ULS analysis of two design load cases (DLCs) based on metocean data of the Utsira Nord region in the Norwegian part of the North Sea. Note that while the method is presented for semisubmersible-type FOWTs, it is applicable to any FOWT substructure.
2. OC4 DeepCwind Semisubmersible Platform
As the OC4 DeepCwind, developed by NREL [22] and shown in Figure 1a, is widely used in the scientific literature as a reference substructure for the analysis of FOWTs, it is selected as a case study for the development of the load-mapping method. However, as this substructure model was developed to be used as a rigid body for dynamic simulations, its structural integrity was not taken into account during its design. As a result, it consists of ballasted, hollow cylinders, meaning it cannot survive even static loading conditions, as shown in the work of Diogo [29]. Thus, before the structure can be used for structural analyses, it must be stiffened.

Figure 1.
Cross-section of (a) the reference and (b) the updated OC4 DeepCwind substructure.
Inspired by the work of Vieira et al. [30], the OC4 DeepCwind was redesigned without changing the outer dimensions and draft, assuming a yield strength of for the steel body. This was done by changing wall thicknesses, adding stiffeners, and redistributing the ballast, as illustrated in Figure 1b. However, by changing the mass distribution, the inertial parameters of the substructure were altered, as shown in Table 1 and Table 2. As the total mass was kept approximately constant, no differences were found in the natural frequencies in the translational degrees of freedom (DoFs). Larger differences can be seen for the location of the centre of gravity (CoG) and the rotational inertias, as both are influenced by the altered mass distribution. The natural frequency in yaw did not change, as this DoF is most impacted by the mooring system’s stiffness and the vertical displacement of the CoG does not have an influence on this natural frequency. While neither the reference or updated natural frequencies fulfil the limits set by Li et al. [39] to avoid resonance, no such phenomena were detected in the performed time-domain simulations.

Table 1.
Inertial properties of the reference [22] and the updated OC4 DeepCwind substructure as proposed in this work.

Table 2.
Natural frequencies of the reference and updated OC4 DeepCwind FOWT.
3. Load-Mapping Method
Building upon previous work [40], this study presents a method for mapping concentrated loads from a rigid-body dynamic analysis to a shell-element FE model, as illustrated in Figure 2. The FE model presented in this work was developed in Abaqus 2024 [38].
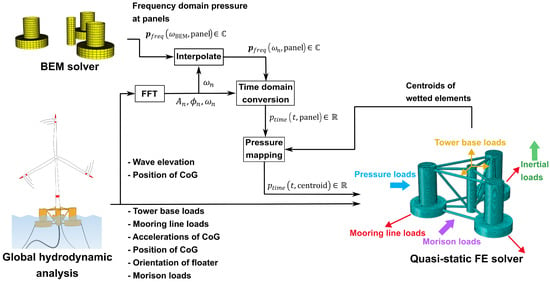
Figure 2.
Schematic showing the load-mapping method. Adapted from [40].
The input for the model is a global hydrodynamic analysis, which, for this work, was performed using an in-house adapted version of the open-source OpenFAST v3.5.3 software [8]. From this analysis, the following data with a temporal resolution of was extracted for further use:
- The forces and moments at the base of the wind turbine tower, i.e., the tower base loads;
- The forces at the mooring fairleads, i.e., the mooring line loads;
- The position, orientation, and rigid-body acceleration of the CoG of the floating platform in all six DoFs;
- The sea elevation at the origin of the domain;
- Morison drag loads of the (partially) submerged members.
While the tower base loads and the Morison drag loads are defined in a local, non-inertial coordinate system attached to the CoG of the substructure, the rest of them are reported in the global, inertial coordinate system , as defined in Figure 3. However, as the finite element (FE) analysis is performed in the local coordinate system, all loads should be considered in this local coordinate system. To achieve the best agreement between the OpenFAST simulations and the mapped results, a coordinate transformation between the two reference systems was performed with the same ortho-normalised small-angle rotation matrix that is internally used in OpenFAST, as defined by Jonkman [41].
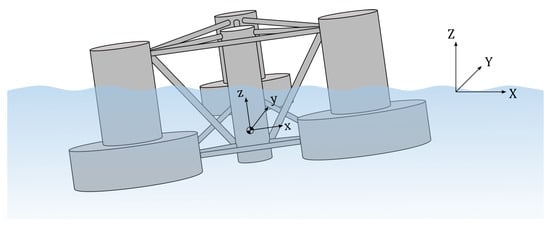
Figure 3.
Illustration of the coordinate systems used for the load-mapping method.
A summary of all relevant loads, as well as the OpenFAST inputs and their coordinate systems, is shown in Table 3. The tower base loads and the mooring line loads (after being transformed to the local coordinate system) can directly be applied to the FE model using a distributing coupling. However, for the hydrodynamic, hydrostatic, gravity, and inertia loads, further processing of the input data is required, as explained in the following sections.

Table 3.
Summary of loads applied in the FE model.
3.1. Hydrodynamic Loads
3.1.1. Boundary Element Method Model
As potential flow theory was used for the calculation of hydrodynamic loads, a boundary element method (BEM) model was used to calculate the frequency-domain Froude–Krylov, diffraction, and radiation loads. This is done in Capytaine v2.2 [42], an open-source BEM solver for linear potential flow, with the Froude–Krylov and diffraction loads lumped together as wave-excitation loads. Note that due to their slender shape, the braces were not considered in the potential flow analysis but are separately modelled using the Morison equation [43,44,45], as will be shown in Section 3.1.3. First, a mesh sensitivity study was performed on the BEM mesh, starting from a quadrilateral mesh with an average mesh size of , decreasing it in such a way that the number of elements increased by approximately for each finer mesh. This was done for frequencies between 0 and with a step size of and the full directional wave range () with a discretisation of , as prescribed in the OpenFAST documentation [8]. However, as the structure is symmetric, only the wave directions between and need to be analysed for the sensitivity study. It is assumed that mesh convergence is reached if the weighted mean absolute percentage error of mesh i, denoted as , is smaller than . This error is defined in Equations (1) and (2), with representing the absolute percentage error, P representing the variable of interest, i representing the current mesh, representing the next finer mesh, and representing the angular frequency. Note that a weighted mean is used to lessen the influence of large relative differences found for near-zero values.
For the sake of brevity, the results of the mesh sensitivity study are only shown for a wave direction of for the wave excitation force (Figure 4), response amplitude operators (RAOs) (Figure 5), added mass (Figure 6), and radiation damping (Figure 7), for surge, heave, and pitch, as these components are dominant for this loading direction. The limit was achieved for all considered wave directions for a mesh size of , which is consistent with the work of Wang et al. [45].

Figure 4.
BEM mesh sensitivity study for the wave excitation loads. Note the different scales between the plots.

Figure 5.
BEM mesh sensitivity study for the RAOs. Note the different scales between the plots.

Figure 6.
BEM mesh sensitivity study for the added mass matrix (A). Note the different scales between the plots.

Figure 7.
BEM mesh sensitivity study for the radiation damping matrix (B). Note the different scales between the plots.
Using the converged mesh, a full potential flow analysis was performed for all considered frequencies () and wave directions (), as defined according to the above-mentionedOpenFAST recommendations. The frequency-domain pressures of each panel were then stored in a database as for the wave-excitation pressures and as for the radiation pressures.
3.1.2. Pressure Mapping
Starting from the potential flow database and the hydrodynamic analysis, the wave elevation is necessary to calculate the time-domain wave-excitation pressures and the position of the CoG for the radiation pressures, as illustrated in Figure 2 and shown in more detail in the flowcharts in Figure 8.
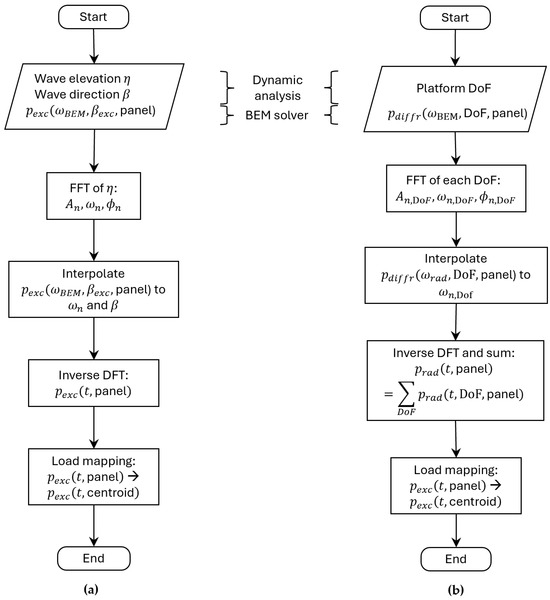
Figure 8.
Flowcharts for calculating the time domain (a) wave-excitation and (b) radiation loads.
To transform the frequency-domain pressures into the time domain, the following steps were followed for the wave-excitation loads:
- 1.
- It is assumed that the wave elevation () can be described as a finite Fourier series, i.e.,with representing N the number of frequencies and and representing the amplitude and phase angle corresponding to the angular frequency (), respectively. A Fast Fourier Transform (FFT) is used to extract the amplitudes (), angular frequencies (), and phase angles () from the wave elevation ().
- 2.
- As the angular frequencies from the FFT and the wave direction () in the-time domain simulation do not necessarily match with the frequencies and wave directions used in the BEM solver, is interpolated to .
- 3.
- The time-domain wave-excitation pressures () are determined as follows:
Finally, the time-domain pressures were mapped from the panels of the BEM mesh to the elements belonging to the mean wetted surface of the FE mesh using a nearest-neighbour interpolation. Note that to guarantee the accuracy of this interpolation, the FE mesh must be considerably finer than the BEM mesh.
The calculation of the radiation pressures was performed similarly, with the main difference being that the time-domain pressure was calculated using the zero-mean movement of all six DoFs. Next, the contributions of all DoFs were summed to obtain the final time-domain pressure field (). By summing up the contributions of the wave-excitation and radiation pressures and assigning them to the FE model, a time-dependent distributed hydrodynamic pressure field was created.
3.1.3. Morison Loads
Using strip theory, the Morison loads are incorporated in two ways. The relative drag term of the Morison equation (Equation (5)) [22] is included for all submerged members of the substructure to incorporate the effect of viscous drag on the dynamics of the platform. For the slender members that are excluded from the BEM analysis, the relative fluid inertia and added mass contributions (Equations (6) and (7)) [22] are additionally implemented.
where is the density of the sea water; and are the drag and added mass coefficient as defined in [22], respectively; A is the projected surface perpendicular to the relative flow velocity; and V is the volume of the strip. and are the flow velocity and acceleration in the local coordinate system, respectively, and and are the velocity and acceleration of the Morison strip in the local coordinate system, respectively.
OpenFAST only allows for the extraction of loads at up to 9 locations for up to 9 different members, for a total of 81 possible local-member output locations [8], while the OC4 DeepCwind substructure has 16 submerged members. For this reason, the source code of OpenFAST v3.5.3 was modified in such a way that loads could be extracted at up to 9 locations for all 16 submerged members.
Inspired by the work of Vieira et al. [30], the sizes of the strips were chosen differently for the different members, as shown in Figure 9. For the main column (MC), upper columns (UCs), and cross braces (CBs) nine loads were extracted, with the distance between the points exponentially increasing for increasing depth. This was done to more accurately capture the distributed loads with the limited number of OpenFAST outputs because the flow velocity and, thus, the fluid acceleration and the Morison loads, decay exponentially with water depth. However, as the base columns (BCs) are short compared to the other members, only six loads were extracted, spaced equidistantly over the height of the members. Similarly, for the horizontal submerged members, i.e., the lower delta (DL) and the lower Y (not shown in the figure), nine loads were extracted, equidistantly spaced over the length of the members. Finally, the axial drag due to the heave disks was extracted at the bottoms of the BCs.

Figure 9.
Extraction locations for the Morison drag loads on the OC4 DeepCwind and an illustration of the fluid velocity as function of the water depth.
To distribute these concentrated loads over the FE model, the extracted Morison forces of each member were uniformly assigned to the corresponding strip in the FE model, and the axial drag forces were assigned as a uniformly distributed pressure load at the bottom of the BCs. Note that the current loads are wholly represented by the viscous drag loads in the OpenFAST model [8].
3.2. Hydrostatic Loads
The hydrostatic loads of the sea water and the ballast are considered in the model, as shown in Figure 10. The hydrostatic pressure of the sea water is considered up to the instantaneous mean water plane using Equation (8), with representing the density of the seawater, representing the gravity constant, Z representing the Z coordinate of the submerged element in the global reference system, and representing the Heaviside function to ensure that the elements above the water line have a zero contribution.
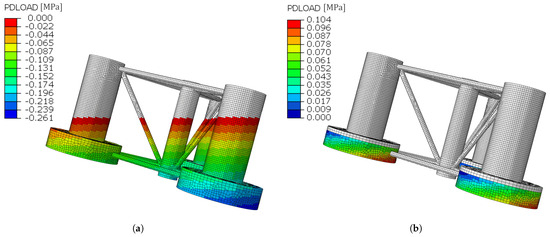
Figure 10.
Modelling of the hydrostatic pressure of (a) the external wetted surface and (b) the ballast water shown under a roll of .
For the ballast water, Equation (9) is used. Note that, here, no Heaviside function is necessary, as it is assumed that the ballast is compartmentalized and is not allowed to move or slosh [22].
3.3. Gravity and Inertia Loads
A gravity load only has to be explicitly added to the light weight of the floater (i.e., the steel weight) in the FE model, as the gravity load of the ballast water is already accounted for by the hydrostatic loads of the ballast water. As with the hydrostatic loads, the gravity loads are applied such that they are oriented in the negative Z direction in the global coordinate system .
For the inertial loads, again, a distinction is made between the light weight of the floater and the ballast. The inertial loads of the light weight can directly be added to the FE model by considering translational and rotational accelerations of the CoG in the local coordinate system . While the rotational accelerations of the platform () are directly extracted from the OpenFAST files, the translational accelerations are calculated using Equations (10) and (11), with representing the translational acceleration of the light weight in the local coordinate system; R representing the rotation matrix between the two coordinate systems, dependent on the orientation (); representing the acceleration of the platform reference point in the global coordinate system; representing the rotational accelerations of the floater in the global coordinate system; representing the vector between the reference point of the global coordinate system and the CoG in the local coordinate system; and representing the angular velocities in the global coordinate system.
The inertia of the ballast water is calculated at the CoG of each ballast tank and is applied to the FE using distributing couplings. The inertial force acting on ballast tank i with mass and acceleration , similarly calculated as in Equation (10), is calculated using Equation (12). Likewise, the moment of ballast tank i is calculated in Equation (13) using the moment of inertia () and the angular acceleration ().
4. Finite Element Model
4.1. Boundary Conditions
Due to differences in modelling methods between the OpenFAST model and the loads mapped on the FE model and due to numerical errors, force equilibrium cannot be guaranteed in the FE model. Multiple types of boundary conditions have been considered in the literature. Gao et al. [33] put their boundary conditions at the central nodes at the bottom of the heave plates. This was motivated by the notion that the resulting stress concentration due to the boundary condition was far away from their region of interest and, thus, had no influence on it. Park and Choung [24], Vieira et al. [30], and Lee et al. [32] considered the mooring lines as a boundary condition, modelling them as linear springs. Vieira et al. [30] noted that this method produced fictitious stresses where the springs were connected to the structure, so in a second approach the boundary condition was put at the tower base, using rigid body displacements from OpenFAST simulations as input. Finally, Lee et al. [36] used the inertia relief method, which introduces an acceleration field such that the resultant loads are exactly zero, to avoid the need for physical constraints.
All four types have inherent limitations. By putting the boundary conditions at the bottom of the heave plates, the deformation of these heavily loaded regions is constrained and significantly altered. By considering linear springs, the non-linear behaviour of the mooring lines is neglected, and rigid body motion is introduced to the system, having an impact on the stresses in the whole structure due to inertial loads. By constraining the tower base, the stresses at this critical location are influenced by the boundary condition. By using inertia relief, the force imbalance is distributed over the whole structure, which can hide potential errors in the approach.
The impact of three different boundary conditions is compared for a static load case considering the tower base, mooring line, hydrostatic, and gravity loads. The first boundary condition is located at the tower base, the second is a variation of the method of Gao et al. [33] with the less heavily loaded tops of the upper columns constrained, and the third is implemented using the inertia relief method. The von Mises stress fields of the constrained tower base and constrained top of the upper columns are compared relative to the stress field using the inertial relief method in Figure 11a,b, respectively. When constraining the tower base, the largest percentage differences are seen in the main column and the connecting braces, with a maximum difference of . When constraining the upper columns, the percentage differences go up to but are more concentrated around the boundary conditions. For both cases, it is noted that the stresses converge to the values obtained with inertia relief when far away from the constrained regions. From this, it is concluded that the inertia relief method is able to be used as a boundary condition without having a significant effect on the stress field.
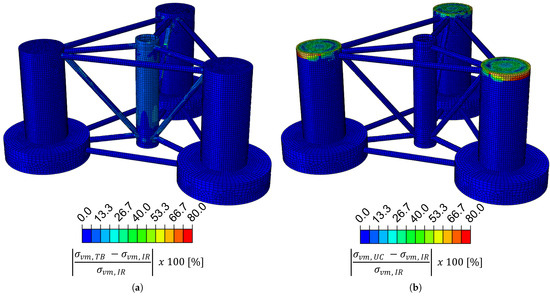
Figure 11.
Comparison of the von Mises stress fields under (a) the tower-base boundary condition () and (b) the upper-column boundary condition () relative to the inertia relief method ().
4.2. Mesh Convergence Study
A linear, quad-dominated shell mesh is constructed for the FE model. Similar to the BEM mesh convergence study, it is assumed that mesh convergence is achieved when the absolute percentage error of the strain energy in the model is less than 3% under static loading conditions. This error is defined in Equation (14), with representing the absolute percentage error, U representing the strain energy, i representing the current mesh, and representing the next finer mesh. Convergence is reached for a global element size of , as shown in Figure 12. The converged mesh is illustrated in Figure 2.
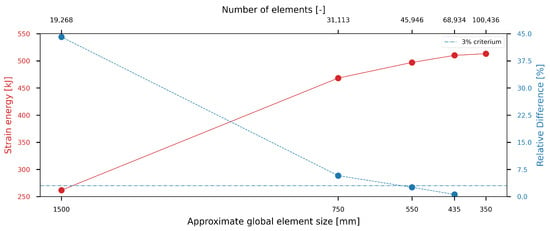
Figure 12.
Strain energy and its relative difference as a function of the mesh size.
5. Validation of Load Components
To quantify the validity of the proposed method, the distributed pressure loads on the FE model will be compared to their concentrated counterparts in the OpenFAST model, i.e., the hydrostatics of the sea water and the potential flow contribution of the hydrodynamic loads, using the converged FE mesh from the previous section.
5.1. Hydrostatic Model
The external hydrostatic loads are compared by performing a decay test in the heave and pitch directions with a starting amplitude of and 5°, respectively. This comparison is performed in the local frame of reference, and the mapped pressure loads are evaluated using the reaction forces from the FE model. The restoring force in the local z direction and the restoring moment in the local y direction, as shown in Figure 13, are considered for the heave and pitch decay tests, respectively, as these are the dominant restoring loads in these DoFs.
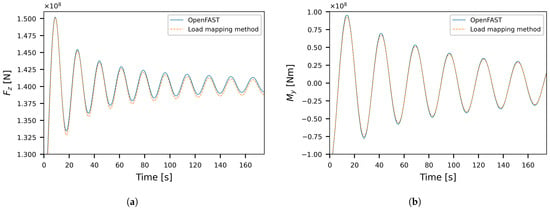
Figure 13.
Restoring hydrostatic load in (a) heave and (b) pitch for a heave and pitch decay test, respectively.
For the heave decay test, an approximately constant offset can be seen between the data from the OpenFAST simulation and the data from the FE simulation. This difference is caused by the non-roundness of the heave plates in the FE model due to the finite mesh size. Note that this difference can be made smaller by considering a finer mesh, but this does not significantly alter stress fields, as proven by the mesh sensitivity study. For the pitch decay test, the restoring moment is much less influenced by the roundness of the heave plates and more so by the projected area of the model on the plane. Hence, no significant difference is found between the results of the FE model and the OpenFAST simulation.
5.2. Potential Flow Model
To validate the potential flow modelling, a time-domain simulation is performed in OpenFAST, and the contributions of the wave-excitation loads and radiation loads are considered separately. Again, the mapped pressure results will be evaluated by considering the reaction forces that are a result of the dynamic pressure fields.
For the wave-excitation loads, there is no visible difference between the (integrated) results from the load-mapping method and the concentrated loads directly obtained from the OpenFAST simulation, as shown in Figure 14. However, when the difference between the two signals is considered over the full span of the simulation, it is found that, while the error is negligible at the centre of the considered time frame, there are large discrepancies at the edges, as illustrated for in Figure 15. The reason for this difference is that the data from the BEM model is limited to between 0 and , as explained in Section 3.1.1, while the maximum frequency in the Fourier transform of the wave elevation easily goes above this. As there is no BEM data for these higher frequencies, their influence is ignored in the model, leading to these edge effects when performing the inverse Fourier transform. These large differences can be eliminated from the simulation by cutting away the first and last 50 s from the mapped solution.
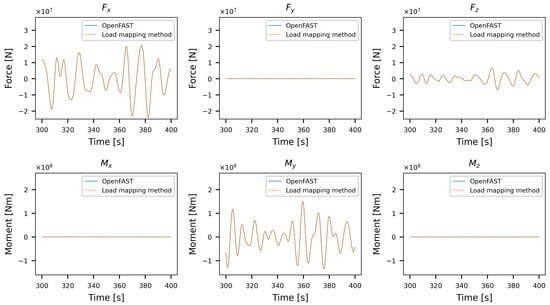
Figure 14.
Comparison of the wave-excitation loads from OpenFAST and the load-mapping method.

Figure 15.
Example of the difference between the mapped and OpenFAST results as illustrated for the heave component of the wave-excitation loads.
For the radiation loads, the difference between the mapped and extracted loads is larger than for the wave-excitation loads, as shown in Figure 16. More specifically, there appears to be a mismatch for the higher frequencies, where shows a high frequency component on the mapped load, which is not present in the OpenFAST load. On the other hand, in , this high-frequency term appears to be missing from the mapped result. This difference is attributed to the fact that the radiation loads in OpenFAST are calculated using the Cummins equation [46], i.e., including a memory effect, while they are approximated in the mapped loads using a simple inverse Fourier transform. The difference between the two methods can be made smaller by increasing the simulation time, thereby increasing the spectral resolution of the FFT. However, the fact that the inverse Fourier transform needs to be determined for every time step and for each wetted element, using all frequencies below , this significantly increases the computational effort needed for the time-domain analysis. As the difference between the two methods is small, the presented results are found to be satisfactory for this work.
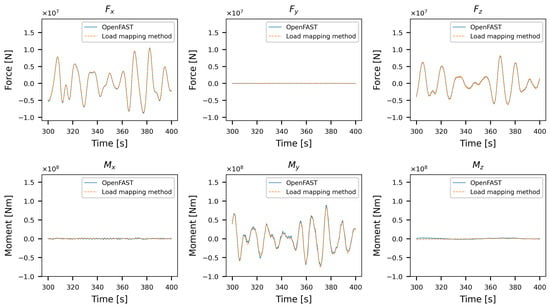
Figure 16.
Comparison of the radiation loads from OpenFAST and the load-mapping method.
6. Ultimate Limit State Analysis
Two DLCs were selected for the ULS analysis at the Utsira Nord location on the coast of Norway. Based on the data of Cheynet et al. [47], the IEA Wind Task 49 report [48], and the definitions of the IEC 61400-3-1 standard [49], representative metocean conditions were selected, which are visualised in Table 4. Note that it is assumed that, considering the depth of the platform, the current velocity varies linearly with the water depth and that the wind, waves, and current are aligned to obtain the most conservative results for the ULS analysis.

Table 4.
Metocean conditions for Utsira Nord for DLC 1.6 and DLC 6.1. The wind speed is evaluated at hub height, and the waves are modelled using the Pierson–Moskowitz spectrum.
As the main goal of this work is to present and evaluate the feasibility of the developed method, a one-hour simulation is analysed for each DLC instead of the six one-hour simulations that are required by the IEC 61400 standard for a detailed ULS analysis. For this purpose, a 4300 s time domain simulation is performed, of which the first 600 s are discarded to eliminate transient effects. To improve computational efficiency, the remaining 3700 s are divided into six segments of 700 s each, with a 50 s overlap between consecutive segments, as illustrated in Figure 17. This segmentation reduces the computational cost associated with the inverse Fourier transform, as the spectral resolution is proportional to the number of time steps. Furthermore, it allows for the parallel execution of the FE simulations. To minimise the previously discussed edge effects of the inverse Fourier transform, the first and last 50 s of each segment are excluded from the FE simulations, resulting in 3600 continuous seconds (or one hour) of usable data.
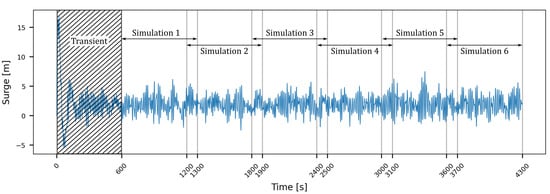
Figure 17.
Subdivision of the one-hour time-domain data into six 700 s simulations, including a 50 s buffer at the beginning and end, using the surge signal of DLC 1.6 as an illustration.
7. Results and Discussion
For the ULS analysis, the magnitude and the location of the von Mises stress are investigated for both DLCs. Figure 18 and Figure 19 show the results for DLC 1.6 and 6.1, respectively. Each figure displays a 200 s window centred on the moment of maximum stress, along with the FE model’s stress distribution at that instant. For both DLCs, the maximum stress remains well below the yield strength of the material, with safety factors of 2.4 and 2.1 for DLC 1.6 and DLC 6.1, respectively. Furthermore, the maximum stress is consistently found at the joint between the lower delta braces and the heave plates, showing the geometrical stress-raising properties of these joints. When comparing the magnitude of the stresses in Figure 18a and Figure 19b, it is observed that the evolutions of the maximum stress in DLC 1.6 and DLC 6.1 show, respectively, low-amplitude and high-amplitude behaviour.However, both show sudden peaks centred around a similar average value. The presence of the peaks illustrates the need for sufficiently long simulations to ensure that the full stochastic range of extreme events is captured.

Figure 18.
(a) Time history of the maximum von Mises stress during DLC 1.6 for a 200 s window centred on the maximum von Mises stress and (b) the stress distribution on the FE model at the moment of the maximum von Mises stress.
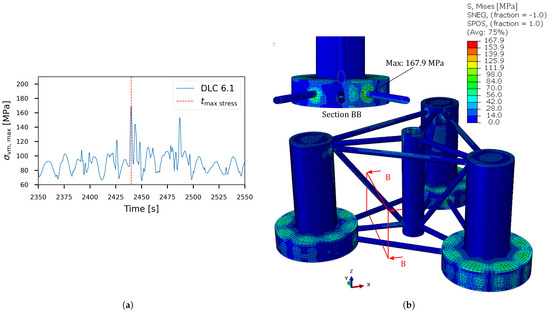
Figure 19.
(a) Time history of the maximum von Mises stress during DLC 6.1 for a 200 s window centred on the maximum von Mises stress and (b) the stress distribution on the FE model at the moment of the maximum von Mises stress.
Next, the location of the maximum von Mises stress in each time frame is shown by the red dots in Figure 20. For both DLCs, three regions with maximum stresses are identified. The first region is located at the top of the heave plates, the second region at the internal stiffeners of the heave plates, and the third region at the welded joints. The maximum stresses in the first and second regions are caused by the lack of supporting ballast water. For the first region, an air gap is present between the ballast water and the top of the heave plate. Furthermore, the large diameter of the heave plate and the radially increasing stiffener spacing result in large, unstiffened plate sections. This means that the full water column and dynamic water pressures must be resisted by the local bending action of the steel plate, leading to high stresses at its centre. In the second region, the stiffeners are able to redistribute the pressure loads, leading to high local stresses. The third region is caused by the stress-raising properties of the meshed geometry, where abrupt changes in the angle between the elements at the welded joints lead to stress concentrations. When comparing the distribution of the maximum stresses for the two DLCs, it is observed that the number of high-stress locations increases at the welds in DLC 6.1. This is caused by the differing nature of the DLCs. The high turbine thrust in DLC 1.6 stabilises the structure, while the more severe sea state, combined with an idle turbine, leads to more dynamic floater motions activating the stress-raising properties of these joints.
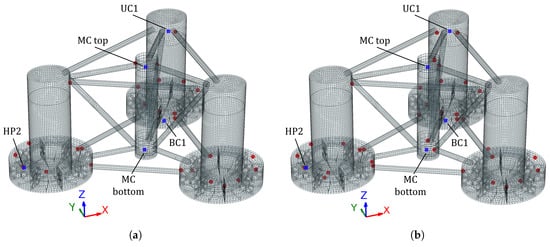
Figure 20.
Locations of the highest von Mises stresses for all time steps of (a) DLC 1.6 and (b) DLC 6.1 shown by the red dots. The blue squares refer to the stress signals in Figure 21.
Subsequently, the time signals of the von Mises stress are analysed for one element of each welded region and of a heave plate, as defined by the blue squares in Figure 20 and shown in Figure 21. This is done for the same 200 s window centred on the largest von Mises stress of the respective DLC, as previously shown. The results are compared to the stresses of a static load case without wind and waves. For all except one of the chosen elements and for both DLCs, the static load case gives a good indication of the mean value and order of magnitude of the von Mises stresses. Only for element BC1 are stresses found with a relatively low base value but showing sudden peaks that are significantly higher than in the static load case. This is explained by the fact that this element is located near one of the cross braces, which acts as a geometrical stress concentration and, thus, can significantly amplify the stress under the right conditions. Together, these stress signals show that a static load case can give a good first indication of the stress field of an FOWT substructure and can, thus, be used for preliminary design. However, care should be taken when designing and modelling the welded joints. Due to the previously mentioned stress concentrations, additional, more detailed analyses are necessary to verify their structural integrity.
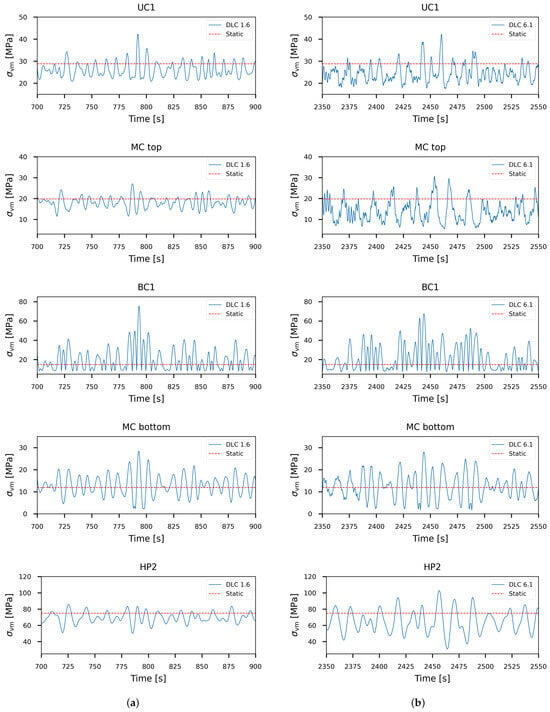
Figure 21.
von Mises stress signals of (a) DLC 1.6 and (b) DLC 6.1 compared with stresses of a static load case for the elements indicated with blue squares in Figure 20. Note the different scales between the rows and that both DLCs are shown for a 200 s window centred on the moment of the maximum von Mises stress.
Furthermore, when comparing the magnitude of the stresses for each DLC, it is noted that the peak stresses at the tower base (MC top) are lower or equal to the other chosen elements and that the stresses at the top of the heave plate (HP2) are dominant due to the previously mentioned lack of backing due to ballast. When comparing the stress of the elements above the waterline (UC1 and MC top) and below the waterline (BC1, MC bottom, and HP2), a difference in the dynamic characteristics is observed. For the elements above the waterline, the stresses have a more jagged appearance, and in DLC 6.1, a high-frequency contribution is visible. This difference is explained by the turbulence in the considered wind fields, affecting the loads at the tower base. On the other hand, the submerged elements show a much smoother stress signal, reminiscent of the hydrodynamic loads shown in Figure 14 and Figure 16. The long distance and high stiffness connections between these dry and submerged elements ensure that the turbulent loads are mostly carried by the elements close to the point of application. The one exception is seen for DLC 6.1 around the 2360 s mark, where the sudden high-frequency and high-amplitude loads from the tower base, visible in MC top, are felt by the MC bottom element. Note that the stresses at the tower base are not observed to be dominant, contrary to the commonly held assumption. This means that the stresses of the full substructure must be analysed in structural analyses.
Finally, the results of both DLCs are compared. When considering the UC1 and MC top elements, the impacts of the turbine thrust and turbulence content of the wind fields are clearly visible. In DLC 1.6, the average stress of these elements is lower than in DLC 6.1, but DLC 6.1 shows a high-frequency contribution and significantly higher stress amplitude. These differences are explained by the fact that DLC 1.6 considers rated wind conditions and, thus, maximum turbine thrust, leading to a high average stress but a high damping of the turbulence. On the other hand, DLC 6.1 considers extreme metocean conditions with a return period of 50 years and an idling turbine. The lack of aerodynamic damping combined with large platform motions in extreme metocean conditions leads to these high-frequency, jagged signals. For submerged BC1 and MC bottom elements, the impact of the different loading conditions is less clear but still present. While element BC1 shows more frequent and consistently higher peak stresses in DLC 6.1, the maximum stress is still found in DLC 1.6. This is probably the consequence of a critical combination of loads, again showing the importance of sufficiently long simulations. On MC bottom, both stress signals are centred around the stress of the static load case. This is explained by the fact that these elements are predominantly loaded due to the hydrostatic and hydrodynamic pressures. Note also that for both DLCs, similar stress amplitudes are observed. This can be related to the exponential decay of the wave energy as a function of the water column, making the impact of the chosen sea state less pronounced. For element HP2, the difference is clearly visible, with significantly higher amplitudes in DLC 6.1. This is, again, the result of the strong aerodynamic damping and less severe sea state in DLC 1.6 compared to the large heave motions due to the low aerodynamic damping and extreme sea state in DLC 6.1. Note that based on the previously made observations, the importance of both DLCs becomes apparent. DLC 1.6 is valuable to analyse the impact of large but more damped tower base loads, while DLC 6.1 is essential to consider the impact of large dynamic motions—in particular, on the heave plates.
8. Conclusions
This study introduces a practical and versatile time-domain load-mapping method for the structural analysis of FOWT substructures. By combining linear potential flow and Morison-type loads, the approach bridges the gap between existing load-mapping methods and higher fidelity, higher order models. Importantly, the method is able to translate site-specific metocean data, consisting of (turbulent) wind fields, wave spectra, and depth-varying sea currents, to stresses and strains in a shell-element FE model of an FOWT substructure.
Validation against OpenFAST results confirms the accuracy of the mapped hydrostatic and hydrodynamic pressures. The method’s application to a stiffened version of the OC4 DeepCwind platform demonstrates its ability to resolve the full-body stress distribution, highlighting critical areas such as unsupported heave plates, internal stiffeners, and welded joints. This underlines the importance of accurate load application and the design of structural reinforcements, particularly in regions that cannot be represented by beam models.
The proposed method is characterised by a high level of adaptability, enabling the assessment of both ULS and FLS for a wide range of steel-based floater geometries and site-specific environmental conditions, making it a valuable contribution to the structural design and assessment of FOWT platforms. In particular, the method is most advantageous at the conceptual to early detailed design stages. At this point, it is necessary to evaluate multiple late-stage design variants under realistic site-specific metocean conditions, but higher-order, hydro-elastic and/or computational fluid dynamic analyses are still too computationally expensive. Under these circumstances, it provides sufficient fidelity to identify global stress distributions, critical structural regions, and necessary reinforcements while keeping the model setup and run times manageable.
However, the method has some inherent limitations. First, it is restricted to substructures that can be modelled using shell elements and is, therefore, not applicable to concrete-based designs. Second, the use of linear potential flow means that higher order effects cannot be captured in the model. Finally, as with any time-domain approach, the method entails significant computational cost and runtime.
Future work will extend the approach by incorporating solid element submodels to resolve weld-level stresses and performing FLS analyses under site-specific loading.
Author Contributions
Conceptualization, V.R., K.H., M.C.O. and W.D.W.; data curation, V.R. and K.H.; formal analysis, V.R., K.H., M.C.O. and W.D.W.; funding acquisition, W.D.W.; investigation, V.R., K.H., M.C.O. and W.D.W.; methodology, V.R., K.H., M.C.O. and W.D.W.; project administration, W.D.W.; resources, W.D.W.; software, V.R. and K.H.; supervision, K.H., M.C.O. and W.D.W.; validation, V.R., K.H., M.C.O. and W.D.W.; visualisation, V.R.; writing—original draft preparation, V.R.; writing—review and editing, K.H., M.C.O. and W.D.W. All authors have read and agreed to the published version of the manuscript.
Funding
This work is financially supported by the FPS Economy (FOD Economie) under call 2022 of the Energy Transition Fund of the Belgian Federal Government through the BEL-Float project.
Data Availability Statement
The original contributions presented in this study are included in the article. Further inquiries can be directed to the corresponding authors.
Acknowledgments
The authors would like to thank Ajie Brama Krishna Pribadi (Ghent University, Faculty of Engineering and Architecture, Department of Civil Engineering) for his help in customising OpenFAST v3.5.3 to support the specific requirements of this work.
Conflicts of Interest
The authors declare no conflicts of interest. The funders had no role in the design of the study; in the collection, analyses, or interpretation of data; in the writing of the manuscript; or in the decision to publish the results.
References
- Aegir Insights. Floating Offshore Wind—A Global Opportunity; Technical Report; Global Wind Energy Council: Copenhagen, Denmark, 2022. [Google Scholar]
- Cooperman, A.; Hall, M.; Housner, S.; Hein, C.; Duffy, P.; Hernando, D.M.; Carmo, L.; Moreno, F.; Musial, W. Investigation of the Challenges of Offshore Wind in Ultradeep Water; Technical Report; National Renewable Energy Laboratory: Golden, CO, USA, 2024. [Google Scholar] [CrossRef]
- Messmer, T.; Ran, X.; Benifla, V.; Lutz, M.; Adam, F.; Bachynski-Polić, E.E.; Hölling, M. Overview of the potential of floating wind in Europe based on met-ocean data derived from the ERA5-dataset. J. Phys. Conf. Ser. 2023, 2626, 012021. [Google Scholar] [CrossRef]
- Hong, S.; McMorland, J.; Zhang, H.; Collu, M.; Halse, K.H. Floating Offshore Wind Farm Installation, Challenges and Opportunities: A Comprehensive Survey. Ocean Eng. 2024, 304, 117793. [Google Scholar] [CrossRef]
- Wang, S.; Moan, T.; Gao, Z. Methodology for global structural load effect analysis of the semi-submersible hull of floating wind turbines under still water, wind, and wave loads. Mar. Struct. 2023, 91, 103463. [Google Scholar] [CrossRef]
- Madsen, F.J.; Pegalajar-Jurado, A.; Bredmose, H. Performance Study of the QuLAF Pre-Design Model for a 10 MW Floating Wind Turbine. Wind Energy Sci. 2019, 4, 527–547. [Google Scholar] [CrossRef]
- Luan, C.; Moan, T. On short-term fatigue analysis for wind turbine tower of two semi-submersible wind turbines including effect of startup and shutdown processes. J. Offshore Mech. Arct. Eng. 2021, 143, 012003. [Google Scholar] [CrossRef]
- National Renewable Energy Laboratory (NREL). OpenFAST Documentation v3.5.3. 2024. Available online: https://openfast.readthedocs.io/en/dev/index.html (accessed on 6 June 2025).
- Yamaguchi, A.; Danupon, S.; Ishihara, T. Numerical Prediction of Tower Loading of Floating Offshore Wind Turbine Considering Effects of Wind and Wave. Energies 2022, 15, 2313. [Google Scholar] [CrossRef]
- Kvittem, M.I.; Moan, T. Time domain analysis procedures for fatigue assessment of a semi-submersible wind turbine. Mar. Struct. 2015, 40, 38–59. [Google Scholar] [CrossRef]
- Zhang, M.; Zhou, Z.; Xu, K.; Shi, Y.; Wu, Y.; Du, J. Investigation on Dynamic Responses’ Characteristics and Fatigue Damage Assessment for Floating Offshore Wind Turbine Structures. Sustainability 2022, 14, 12444. [Google Scholar] [CrossRef]
- Zhu, F.; Yeter, B.; Brennan, F.; Collu, M. Time-Domain Fatigue Reliability Analysis for Floating Offshore Wind Turbine Substructures Using Coupled Nonlinear Aero-Hydro-Servo-Elastic Simulations. Eng. Struct. 2024, 318, 118759. [Google Scholar] [CrossRef]
- Roddier, D.; Cermelli, C.; Aubault, A.; Weinstein, A. WindFloat: A floating foundation for offshore wind turbines. J. Renew. Sustain. Energy 2010, 2, 033104. [Google Scholar] [CrossRef]
- Luan, C.; Gao, Z.; Moan, T. Development and verification of a time-domain approach for determining forces and moments in structural components of floaters with an application to floating wind turbines. Mar. Struct. 2017, 51, 87–109. [Google Scholar] [CrossRef]
- Liu, Y.; Ishihara, T. Numerical Study on Sectional Loads and Structural Optimization of an Elastic Semi-Submersible Floating Platform. Energies 2020, 14, 182. [Google Scholar] [CrossRef]
- Adilah, A.; Tomoya, I.; Iijima, K.; Inoue, T. Spectral Approach for Fatigue Damage Evaluation of Floating Offshore Wind Turbine under Combined Wind and Wave Loads by Considering the Coupling Effect. In Proceedings of the Thirtieth (2020) International Ocean and Polar Engineering Conference, Shanghai, China, 11–16 October 2020; pp. 355–364. [Google Scholar]
- Li, H.; Gao, Z.; Bachynski-Polić, E.E.; Zhao, Y.; Fiskvik, S. Effect of floater flexibility on global dynamic responses of a 15-MW semi-submersible floating wind turbine. Ocean Eng. 2023, 286, 115584. [Google Scholar] [CrossRef]
- Jonkman, J.; Branlard, E.; Hall, M.; Hayman, G.; Platt, A.; Robertson, A. Implementation of Substructure Flexibility and Member-Level Load Capabilities for Floating Offshore Wind Turbines in OpenFAST; Technical Report; National Renewable Energy Laboratory: Golden, CO, USA, 2020. [Google Scholar]
- Thomsen, J.B.; Bergua, R.; Jonkman, J.; Robertson, A.; Mendoza, N.; Brown, C.; Galinos, C.; Stiesdal, H. Modeling the tetraspar floating offshore wind turbine foundation as a flexible structure in orcaflex and openfast. Energies 2021, 14, 7866. [Google Scholar] [CrossRef]
- Borg, M.; Bredmose, H.; Hansen, A.M. Elastic deformations of floaters for offshore wind turbines: Dynamic modelling and sectional load calculations. In Proceedings of the International Conference on Offshore Mechanics and Arctic Engineering—OMAE, Trondheim, Norway, 25–30 June 2017; Volume 10. [Google Scholar] [CrossRef]
- Saverin, J.; Perez-becker, S.; Luna, R.D.B.; Marten, D.; christoph Gilloteaux, J.; Kurnia, R. FLOATECH Deliverable 1.2. Higher Order Hydroelastic Module; Technical Report; Technical University of Berlin: Berlin, Germany, 2021. [Google Scholar]
- Robertson, A.; Jonkman, J.; Masciola, M.; Song, H.; Goupee, A.; Coulling, A.; Luan, C. Definition of the Semisubmersible Floating System for Phase II of OC4; Technical Report NREL/TP-5000-60601, 1155123; National Renewable Energy Laboratory: Golden, CO, USA, 2014. [Google Scholar] [CrossRef]
- Allen, C.; Viscelli, A.; Dagher, H.; Goupee, A.; Gaertner, E.; Abbas, N.; Hall, M.; Barter, G. Definition of the UMaine VolturnUS-S Reference Platform Developed for the IEA Wind 15-Megawatt Offshore Reference Wind Turbine; Technical Report; National Renewable Energy Laboratory: Golden, CO, USA, 2020. [Google Scholar]
- Park, S.; Choung, J. Structural Design of the Substructure of a 10 MW Floating Offshore Wind Turbine System Using Dominant Load Parameters. J. Mar. Sci. Eng. 2023, 11, 1048. [Google Scholar] [CrossRef]
- Gallardo, Y.; Tampier, G.; Palma, V.; Cifuentes, C.; Ahumada, J.M.; Troncoso, C.; Mendoza, M.Y. An Early-Stage Structural Design of a Semi-Submersible Platform for Floating Offshore Wind Turbines in Chilean Waters. J. Mar. Sci. Eng. 2024, 12, 1951. [Google Scholar] [CrossRef]
- DNV-RP-C205; Environmental Conditions and Environmental Loads. Det Norske Veritas: Høvik, Norway, 2017.
- DNV-ST-0119; Floating Wind Turbine Structures. Det Norske Veritas: Høvik, Norway, 2018.
- Morison, J.; Johnson, J.; Schaaf, S. The force exerted by surface waves on piles. J. Pet. Technol. 1950, 2, 149–154. [Google Scholar] [CrossRef]
- Diogo, R.D. Analysis of the Structural Integrity of a Floating Semisubmersible Foundation for Offshore Wind. Master’s Thesis, Instituto Superior Técnico, Universidade de Lisboa, Lisbon, Portugal, 2017. [Google Scholar]
- Vieira, M.; Reis, L.; Vasconcelos, D.; Dias, D. Structural Evaluation of the DeepCWind Offshore Wind Foundation. Frat. Integrità Strutt. 2020, 14, 24–44. [Google Scholar] [CrossRef]
- Ha, K.; Kim, J.B.; Yu, Y.; Seo, H.S. Structural Modeling and Failure Assessment of Spar-Type Substructure for 5 MW Floating Offshore Wind Turbine under Extreme Conditions in the East Sea. Energies 2021, 14, 6571. [Google Scholar] [CrossRef]
- Lee, D.C.; kwon Na, S.; Kim, S.; wan Kim, C. Deterministic Fatigue Damage Evaluation of Semi-submersible Platform for Wind Turbines Using Hydrodynamic-Structure Interaction Analysis. Int. J. Precis. Eng. Manuf.—Green Technol. 2022, 9, 1317–1328. [Google Scholar] [CrossRef]
- Gao, Z.; Merino, D.; Han, K.J.; Li, H.; Fiskvik, S. Time-domain floater stress analysis for a floating wind turbine. J. Ocean. Eng. Sci. 2023, 8, 435–445. [Google Scholar] [CrossRef]
- Wiegard, B.; König, M.; Lund, J.; Radtke, L.; Netzband, S.; Abdel-Maksoud, M.; Düster, A. Fluid-structure interaction and stress analysis of a floating wind turbine. Mar. Struct. 2021, 78, 102970. [Google Scholar] [CrossRef]
- Rodríguez-López, E.; Moreno-Narrillos, C.; Rueda-Guglieri, F.; Yanez-Gonzalez, A. Time domain hydrodynamics at panel level: An application to the structural analysis of Telwind. J. Phys. Conf. Ser. 2022, 2257, 012009. [Google Scholar] [CrossRef]
- Lee, M.J.; Zheng, M.; Lee, S.J.; Zhang, Y.; Hwang, J.H.; Duan, M. A Novel Two-Way Coupled Algorithm of Time-Domain Hydro-Elastic Analysis for Free-End Offshore Floating Structures Using Inertia Relief Method. Ocean Eng. 2025, 328, 121032. [Google Scholar] [CrossRef]
- Yoon, D.H.; Choung, J. Fully-Coupled Load-Stress Analysis of a Floating Offshore Wind Turbine for a Parked Design Load Case Using HydroQus. Ocean Eng. 2025, 328, 121004. [Google Scholar] [CrossRef]
- Dassault Systèmes. Abaqus 2024; Dassault Systèmes Simulia Corp.: Providence, RI, USA, 2024; Available online: https://www.3ds.com/products-services/simulia/products/abaqus/ (accessed on 15 July 2025).
- Li, W.; Wang, S.; Moan, T.; Gao, Z.; Gao, S. Global Design Methodology for Semi-Submersible Hulls of Floating Wind Turbines. Renew. Energy 2024, 225, 120291. [Google Scholar] [CrossRef]
- Rappe, V.; Hectors, K.; De Waele, W. Fatigue analysis of floating offshore wind turbines. In Proceedings of the 20th EAWE PhD Seminar, Visby, Sweden, 24–26 September 2024; pp. 354–357. [Google Scholar]
- Jonkman, J.M. Dynamics Modeling and Loads Analysis of an Offshore Floating Wind Turbine; Technical Report; National Renewable Energy Laboratory: Golden, CO, USA, 2007. [Google Scholar] [CrossRef]
- Ancellin, M. Capytaine Documentation v2.2.1. 2022. Available online: https://capytaine.github.io/stable/ (accessed on 6 June 2025).
- Li, Q.; Gao, Z.; Moan, T. Modified Environmental Contour Method to Determine the Long-Term Extreme Responses of a Semi-Submersible Wind Turbine. Ocean Eng. 2017, 142, 563–576. [Google Scholar] [CrossRef]
- Lee, C.F.; Cheng, Z.; Ong, M.C.; Wang, K. Extreme Response Analysis of a Floating Vertical Axis Wind Turbine Based on Modified Environmental Contour Method. Ocean Eng. 2023, 270, 113459. [Google Scholar] [CrossRef]
- Wang, B.; Gao, X.; Li, Y.; Liu, L.; Li, H. Dynamic Response Analysis of a Semi-Submersible Floating Wind Turbine Based on Different Coupling Methods. Ocean Eng. 2024, 297, 116948. [Google Scholar] [CrossRef]
- Cummins, W. The impulse response function and ship motions. Schiffstechnik 9 1962, 101–109. [Google Scholar]
- Cheynet, E.; Li, L.; Jiang, Z. Metocean conditions at two Norwegian sites for development of offshore wind farms. Renew. Energy 2024, 224, 120184. [Google Scholar] [CrossRef]
- Creane, S.; Santos, P.; Kölle, K.; Airoldi, D.; Bakhoday-Paskyabi, M.; Biglu, M.; Brown, W.; Cheynet, E.; Ecenarro Diaz-Tejeiro, L.; Frøyd, L.; et al. IEA Wind TCP Task 49: Reference Site Conditions for Floating Wind Arrays; Technical Report; IEA Wind TCP: Copenhagen, Denmark, 2024. [Google Scholar] [CrossRef]
- IEC 61400-3-1:2021; Wind Energy Generation Systems—Part 3-1: Design Requirements for Floating Offshore Wind Turbines. International Electrotechnical Commission: Geneva, Switzerland, 2021.
Disclaimer/Publisher’s Note: The statements, opinions and data contained in all publications are solely those of the individual author(s) and contributor(s) and not of MDPI and/or the editor(s). MDPI and/or the editor(s) disclaim responsibility for any injury to people or property resulting from any ideas, methods, instructions or products referred to in the content. |
© 2025 by the authors. Licensee MDPI, Basel, Switzerland. This article is an open access article distributed under the terms and conditions of the Creative Commons Attribution (CC BY) license (https://creativecommons.org/licenses/by/4.0/).