Article

Trans-Dimensional Geoacoustic Inversion in Shallow Water Using a Range-Dependent Layered Geoacoustic Model

1
State Key Laboratory of Acoustics and Marine Information, Institute of Acoustics, Chinese Academy of Sciences, Beijing 100190, China
2
College of Physical Sciences, University of Chinese Academy of Sciences, Beijing 100049, China
*
Author to whom correspondence should be addressed.
J. Mar. Sci. Eng. 2025, 13(8), 1563; https://doi.org/10.3390/jmse13081563
Submission received: 23 July 2025 / Revised: 10 August 2025 / Accepted: 11 August 2025 / Published: 14 August 2025
(This article belongs to the Section Physical Oceanography)

Abstract

Generally, most inversion approaches model the seabed as a stack of range-independent homogeneous layers with unknown geoacoustic parameters and layer numbers. In our previous study, we established a layered geoacoustic seabed model based on sub-bottom profiler data to characterize low-frequency (100–500 Hz) airgun signal propagation at short ranges (0–20 km). However, when applying the same model to simulate high-frequency (500–1000 Hz) explosive sound signal propagation, it failed to adequately reproduce the observed significant transmission loss phenomenon. Through systematic analysis of transmission loss (including water column sound speed profiles, seabed topography, and sediment properties), this study proposes a range-dependent layered geoacoustic model using the Range-dependent Acoustic Model–Parabolic Equation (RAM-PE). Stepwise inversion implementation has successfully explained the observed experimental phenomena. To generalize the proposed model, this study further introduces a trans-dimensional inversion framework that automatically resolves sediment property interfaces along propagation paths. The method effectively combines prior information with trans-dimensional inversion techniques, providing improved characterization of range-dependent seabed environments.

1. Introduction

In shallow-water environments constrained by boundaries, acoustic waves undergo multiple interactions with both the seafloor and the sea surface during propagation. As the dominant lower boundary of underwater sound fields, the geoacoustic properties of the seafloor critically influence acoustic propagation. Accurate acquisition of seafloor parameters, including sound speed, density, and attenuation, through geoacoustic inversion significantly enhances sonar detection and underwater communication performance [1,2,3]. Based on different acoustic characteristic parameters, various inversion methods have been developed ([4] and references therein), including matched-field inversion [5,6], seabed reflection coefficient inversion [7], normal mode arrival structure inversion [8,9], transmission loss inversion [10,11], pulse arrival time structure inversion [12,13,14], acoustic field frequency-range interference structure inversion [15], etc.
Traditionally, most inversion approaches have modeled the seabed as a stack of range-independent homogeneous layers with unknown geoacoustic parameters and an unspecified number of layers. Recent advancements in broadband inversion techniques have prioritized pre-experiment reflection surveys to obtain the layering structure, with subsequent inversion estimating layer-specific acoustic parameters [16,17].
In our previous study [18], we conducted a sea experiment in the northern South China Sea in August 2022, where sub-bottom profiler (SBP) data were first acquired to determine the seabed layering structure. Using low-frequency airgun signals (100–500 Hz) within a 20 km range, we established a range-independent layered geoacoustic model through stepwise joint inversion, assuming laterally homogeneous seabed properties. The inverted seabed parameters yielded transmission loss (TL) predictions that agreed well with experimental measurements. However, when extending the analysis to explosive signals (100–1000 Hz) over a 50 km range, this model failed to explain the significant TL attenuation observed at high frequencies (500–1000 Hz), particularly beyond 20 km. This significant attenuation cannot be explained by the current seabed model, nor can it be attributed to factors such as the sound speed profile of the water column or seabed roughness [19,20]. This significant attenuation observed in certain areas has also been documented in other continental slope regions. In studying the acoustic propagation phenomena on the continental slope of the South China Sea, Liu et al. [21] classified the seabed into distinct azimuthal regions using historical sediment property data, demonstrating that the range- and azimuth-dependent variations in seabed characteristics were the primary factors responsible for the observed TL fluctuations (reaching up to 35 dB) during the experiment. Ballard [22] compared four types of seabed structures: a more realistic layered structure with sediment divergence caused by seabed scouring, an actual topography with a homogeneous seabed, and other configurations, concluding that seabed structure-induced sediment variations primarily affect acoustic attenuation. Li [23] developed a range-dependent seabed model with horizontal variation in seabed acoustic properties for the anomalous acoustic propagation phenomena observed in the experiment. To address the limitations of conventional models (which assume realistic topography but multi-layered homogeneous sediment), and considering that high-frequency far-field data are primarily influenced by the seabed’s surface layer [24,25], this study introduces horizontal variations in the geoacoustic parameters of the surface sand layer. This modified approach effectively explains the high-frequency propagation phenomena observed.
To generalize the universality of the range-dependent layered geoacoustic model, enabling it to automatically delineate the horizontal interfaces of unknown sediment parameter variations during inversion, this study introduces trans-dimensional (Trans-D) Bayesian inversion. Trans-D methods are widely employed in geoacoustic inversion, primarily to address overfitting or underfitting caused by fixed-model assumptions when the seabed layering is unknown, thereby achieving an adaptive layering structure of seabed layers [26]. In 1995, Green et al. developed the reversible-jump Markov chain Monte Carlo (rjMCMC) sampling method based on the Metropolis–Hastings (MH) algorithm. This approach allows the Markov chain to transition between models of varying dimensions while maintaining detailed balance, treating the model dimension itself as an unknown variable and enabling automated model selection [27]. Dettmer et al. later applied rjMCMC sampling to geoacoustic inversion, adopting a partitioned model to derive depth-dependent sediment parameters with optimal layering. In this paper, we extend the rjMCMC method to horizontally propagating acoustic fields, facilitating the automatic identification of horizontal interfaces for sediment parameter variations along the propagation path.
The structure of this paper is as follows. In Section 2, the experimental data and the seabed geoacoustic model employed are introduced, and the attenuation phenomena observed at high frequencies in the experiment are analyzed and explained. Section 3 describes the method for Trans-D inversion of geoacoustic parameters on a horizontal range. Section 4, following the verification of the method’s correctness with simulated data, presents the processing results of the experimental data and discusses the inversion results of the three models. Section 5 concludes this paper.

2. Experimental Data and Phenomenological Analysis

2.1. Experiment Description

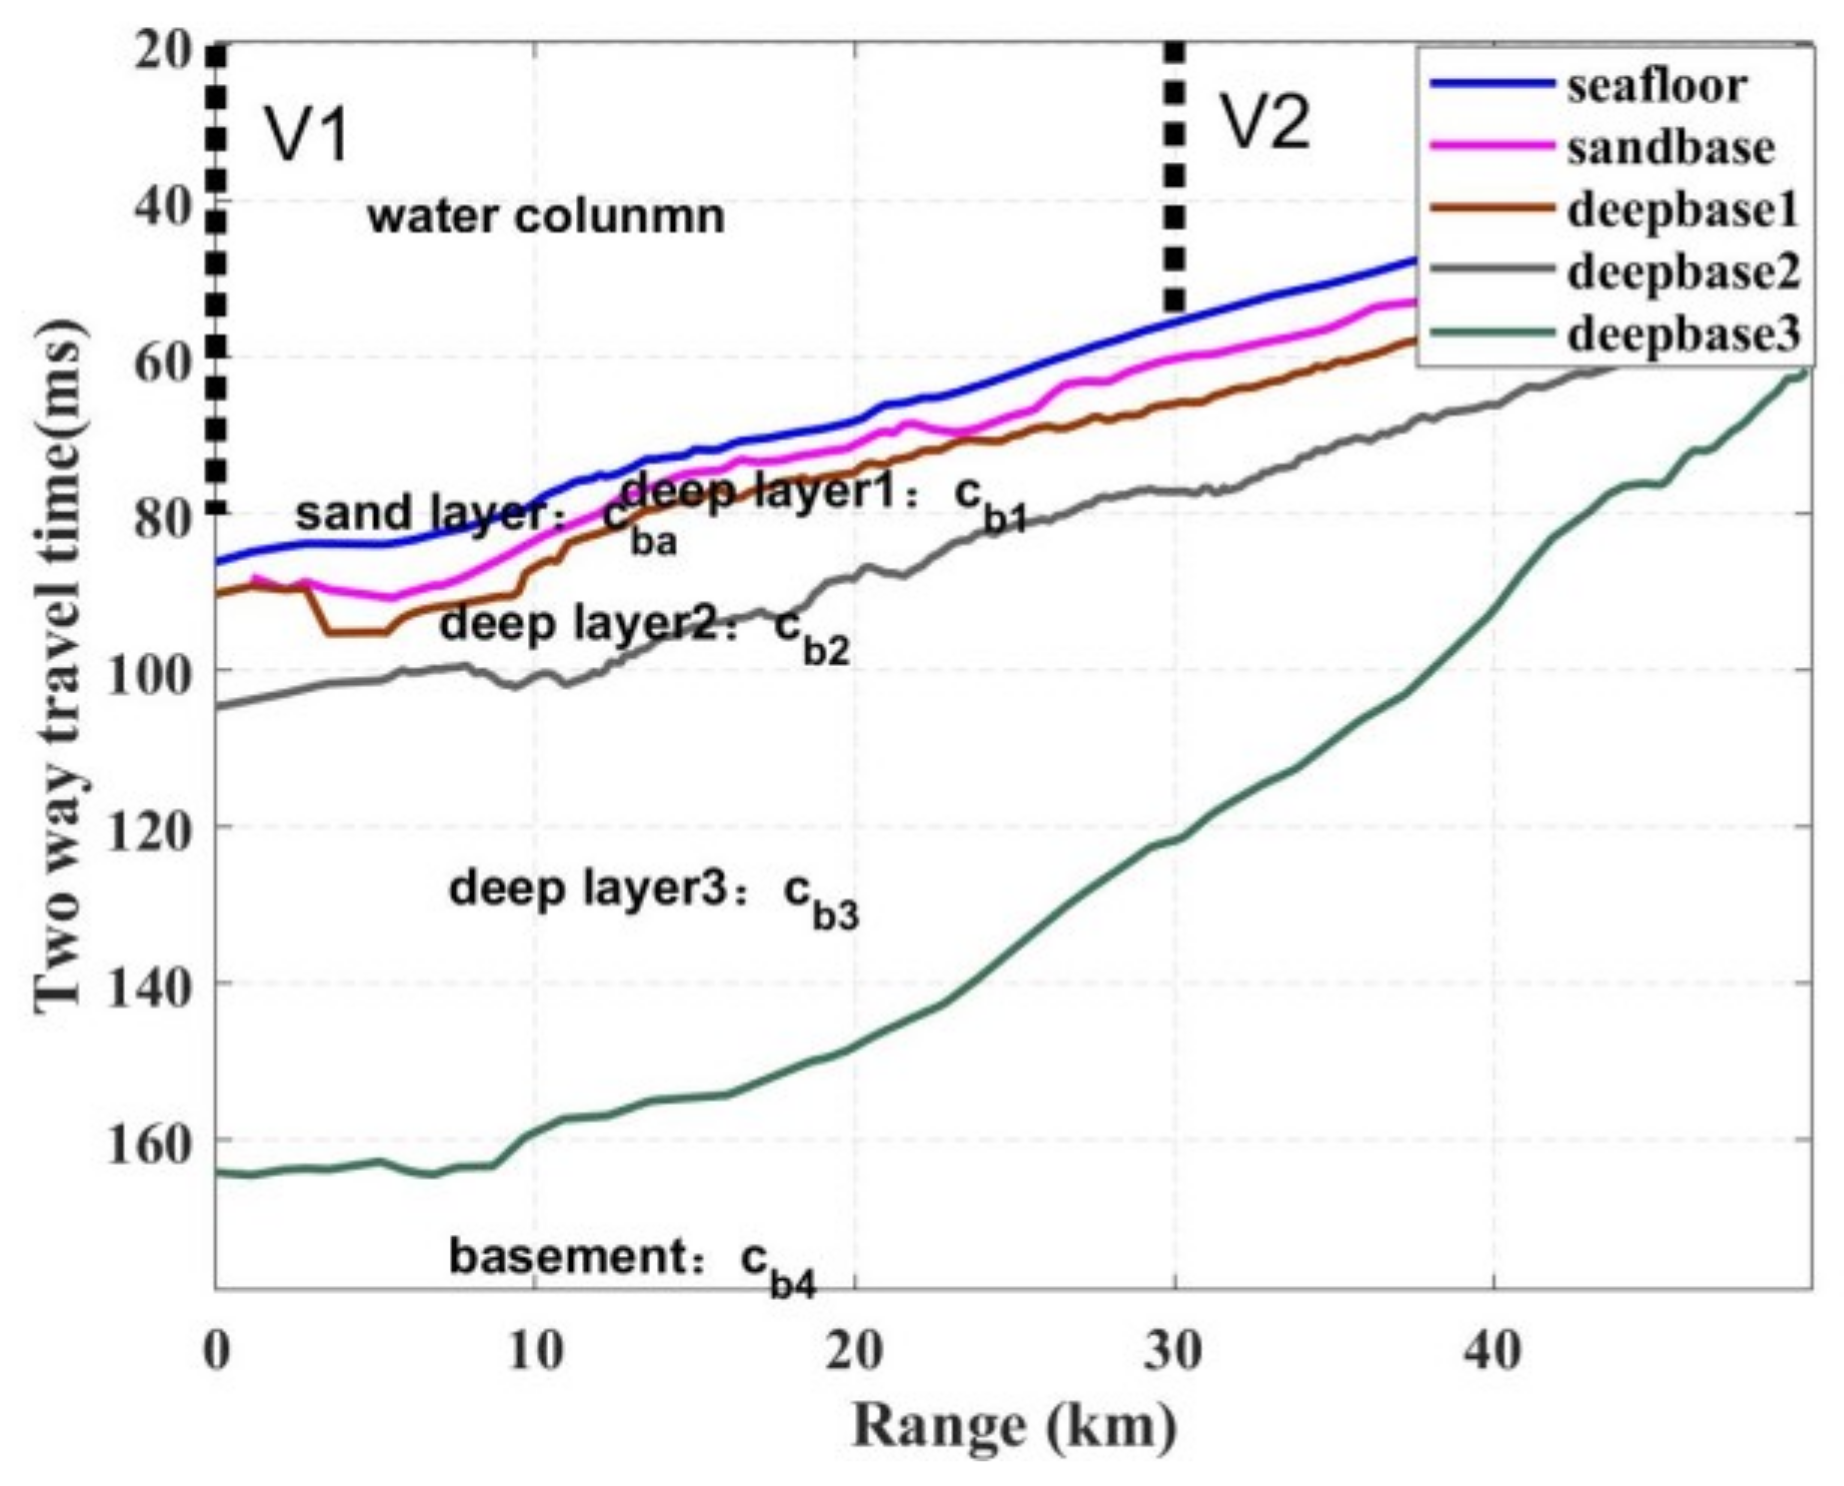
The experiment was conducted in the northern continental shelf area of the South China Sea. As shown in Figure 1, the measurement system consisted of two vertical receiving arrays (V1 and V2) deployed with a separation of 30 km, each covering depths from 20 to 80 m. The research vessel departed from V1 and traveled 50 km along the survey line. During the traverse, two types of sound sources were employed: 7 m depth airgun signals (fired at 400 m intervals) and 7 m depth explosive charges (deployed at 1 km intervals).
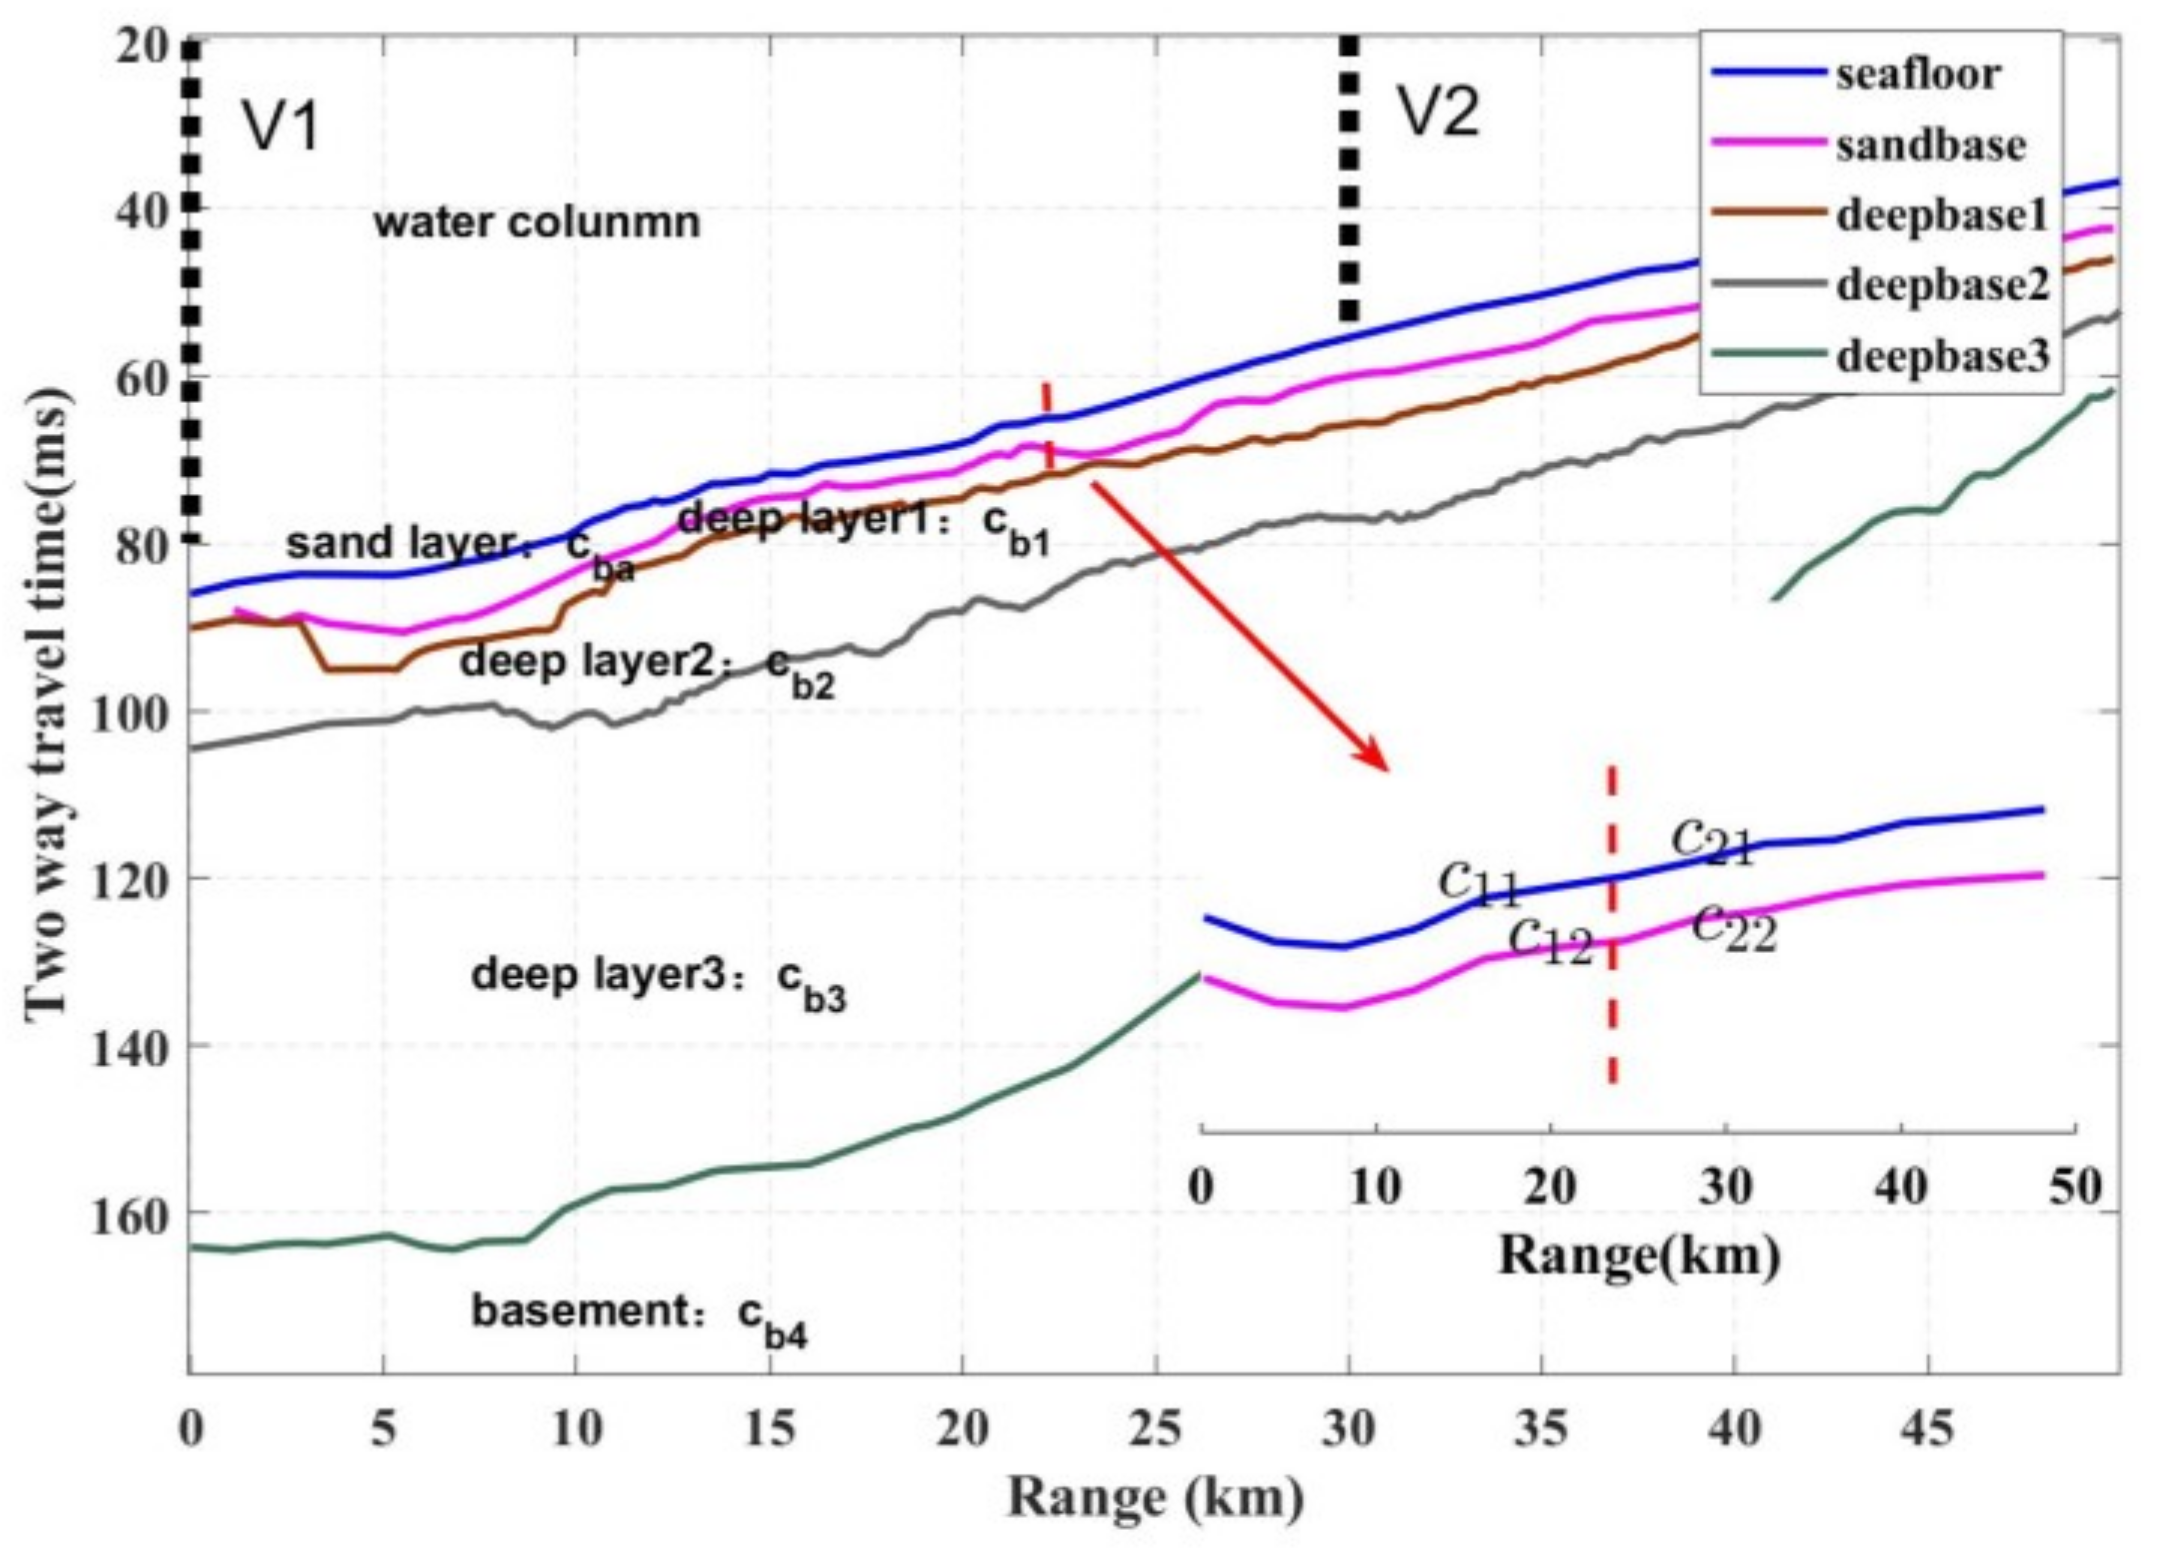
During this experiment, an SBP was employed to survey the seabed, revealing the stratified structure shown in Figure 2, and the obtained sound wave propagation times for each layer were used to convert sediment layer thickness into a function of seabed sound speed:
h m = t m + 1 t m 2 c b m ,
where t m + 1 t m is the round-trip travel time difference for the two boundaries of layer m and c b m is the sound speed of layer m . Thus c b a is the sound speed of the sand layer, c b 1 c b 3 represent the sound speed of deep layer 1 to deep layer 3, respectively, and c b 4 indicates the basement sound speed.
Given that seabed density exhibits significantly lower sensitivity to acoustic propagation compared to sound speed, the density can be derived from seabed sound speed using Hamilton’s empirical formula [28]:
c b m = 2330.4 1257 ρ m + 487.7 ρ m 2 .
In response to the horizontal variations in the seabed, as shown in Figure 2, the horizontally varying sound field model is analyzed. In this context, the RAM-PE model [29,30] based on the Parabolic Equation theory will be adopted, which takes into account the realistic ocean environment, including water column, seabed topography, and range-dependent sediment parameters [31]. To mitigate significant range-dependent fluctuations in single-frequency sound pressure measurements, we obtained smoothed TL values by (1) transforming the measured acoustic pressure signals to frequency spectra via fast Fourier transform and then (2) performing energy averaging within 1/3-octave bands while accounting for the calibrated source level, as expressed in the following TL calculation formula:
T L ( f 0 , r , z ) = S L ( f 0 ) 10 log 10 1 N f = f 0 Δ f / 2 f 0 + Δ f / 2 p ( f , r , z ) 2 p r e f 2 ,
where S L is the source level, p is the frequency spectrum of the receiver, and p r e f is the reference sound pressure (typically 1 μ Pa ).

2.2. High-Frequency Acoustic Propagation

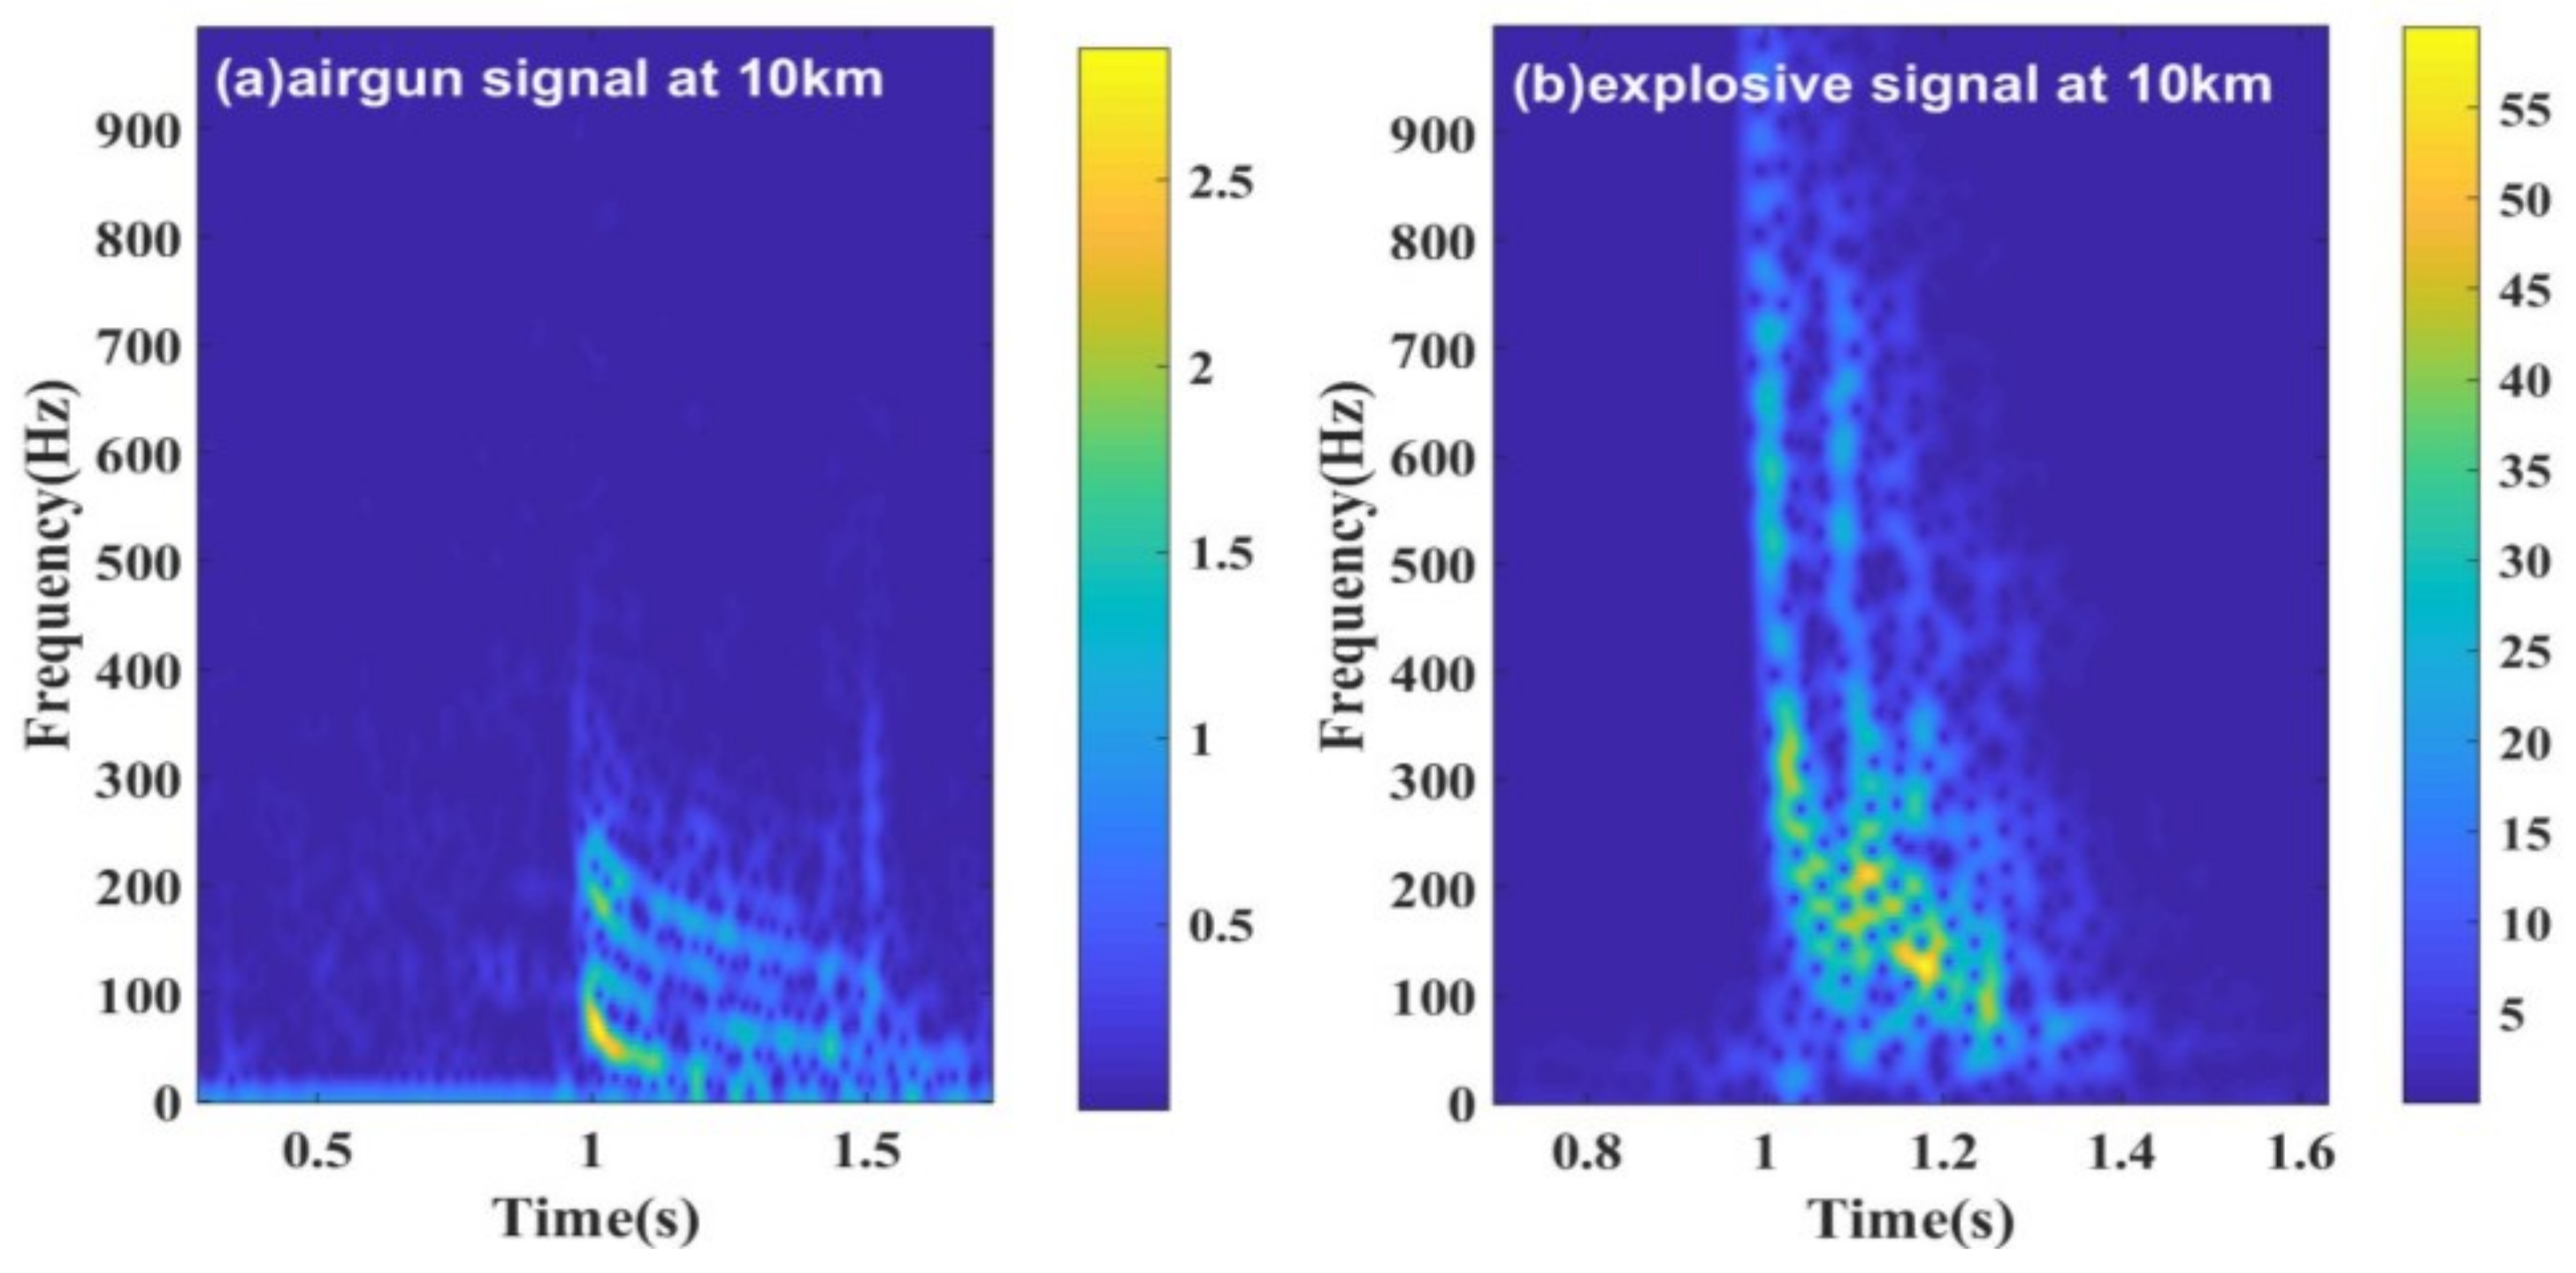
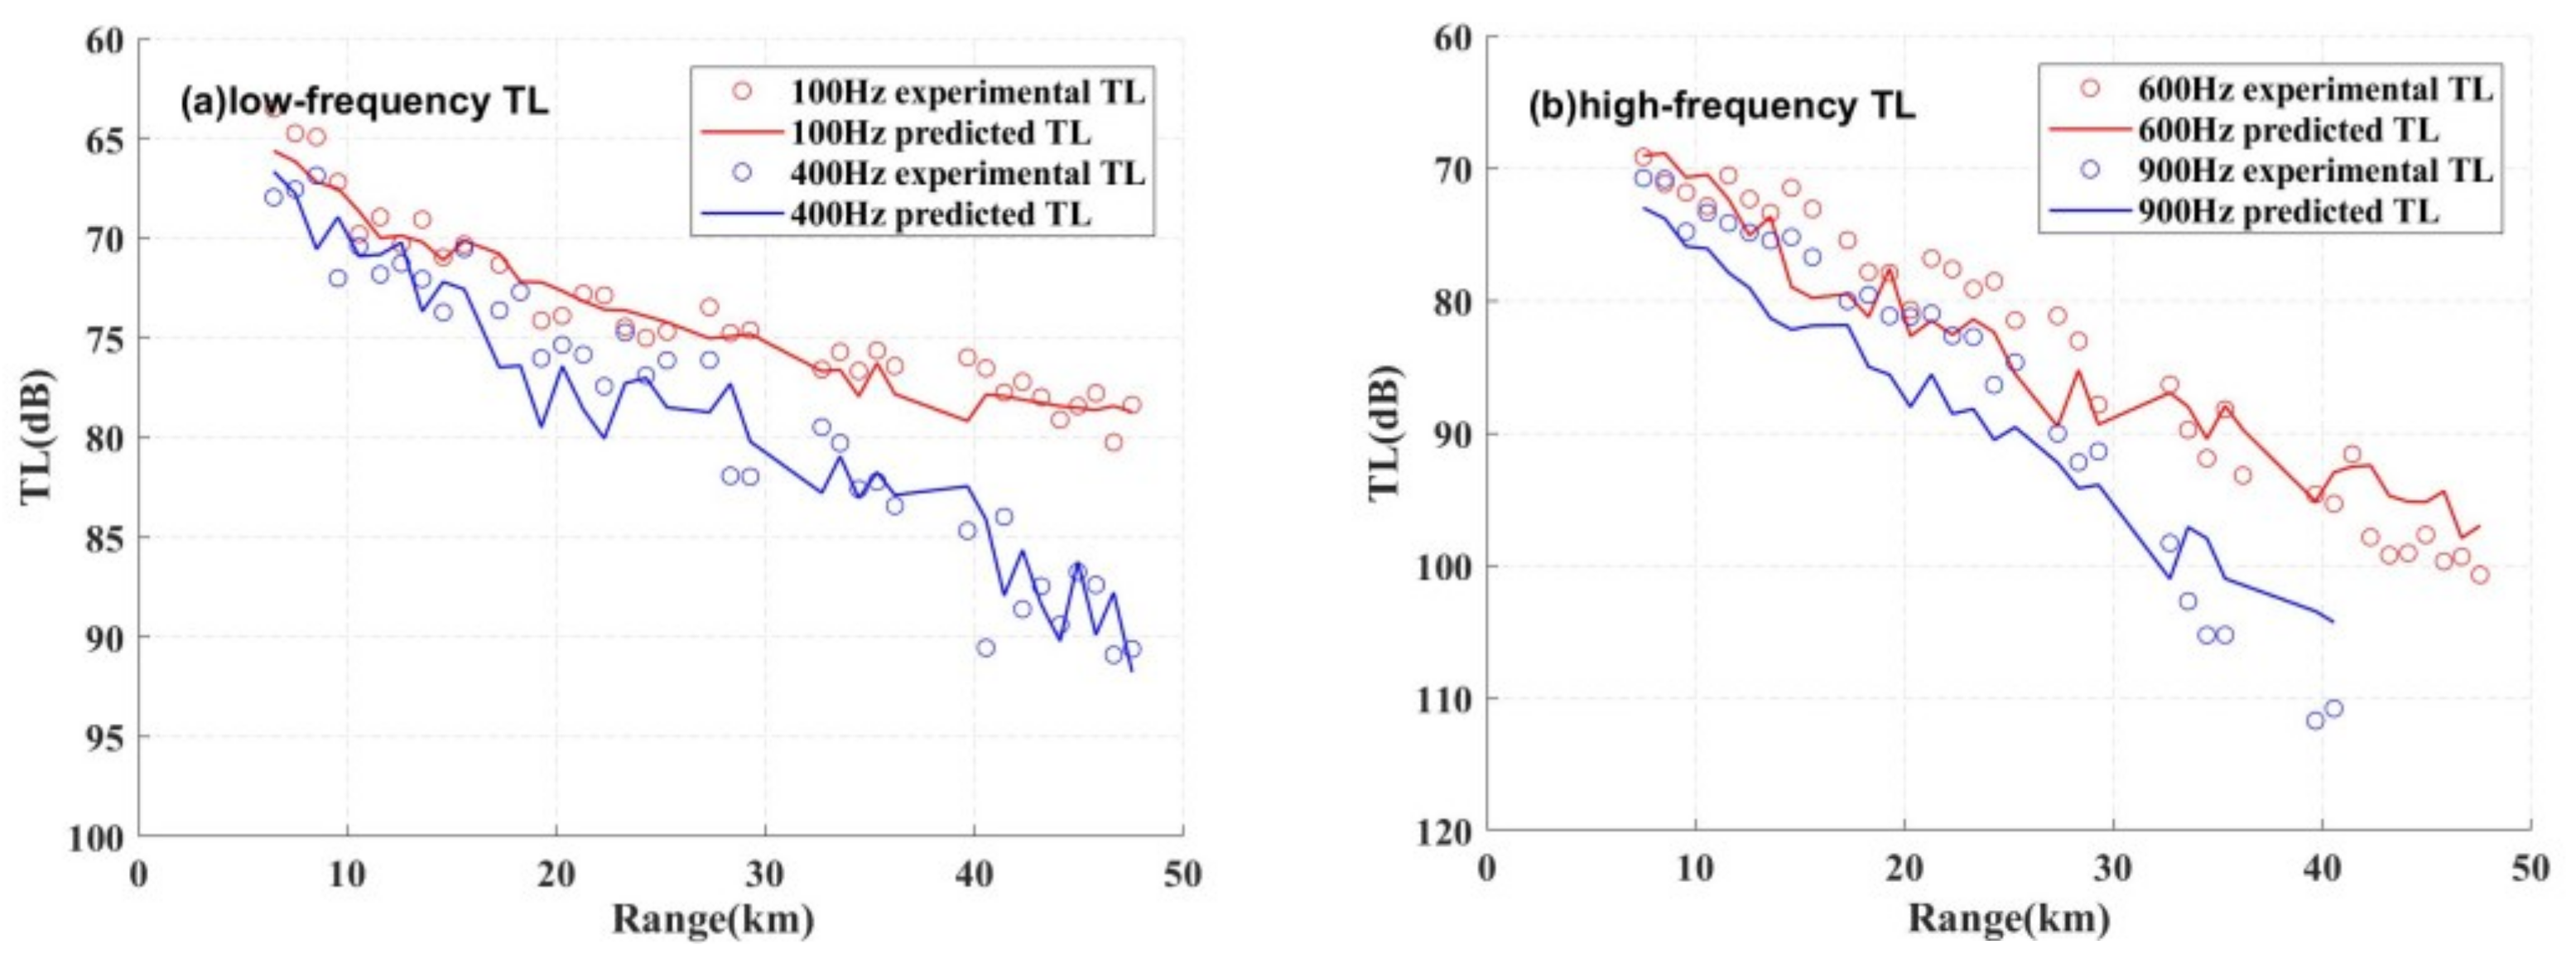
Figure 3 shows the time–frequency diagrams of the received signals that are 10 km away from V2, and it can be found that the airgun signal energy is concentrated within 500 Hz and the explosion signal energy is concentrated within 1000 Hz. Previously [18], we investigated the airgun signals received by V2 within the 0–20 km range (corresponding to 30–50 km in Figure 2) at 100–500 Hz frequencies. Through a stepwise joint inversion approach for multiple physical parameters, we treated each seabed sediment layer as horizontally invariant and obtained seabed acoustic parameters, including layer thickness, sound speed, and density. Here, c b 4 was assumed to be 1800 m/s, while the inverted mean values of c ba , c b 13 , c b 2 , and c b 3 were 1576 m/s, 1666 m/s, 1572 m/s, and 1620 m/s, respectively. The densities were calculated using Hamilton’s empirical formula. Subsequently, we expanded the study scope to cover the entire 50 km survey line and examined acoustic propagation for explosive signals at 100–1000 Hz frequencies. Using the previously inverted sound speed and assuming uniform attenuation coefficients across all layers, we derived an attenuation coefficient of α = 0.25 f 2.2   dB / m . A comparison between the inverted and experimental TL, as shown in Figure 4, reveals good agreement at low frequencies (100–400 Hz), with mean fitting errors below 3 dB across the 50 km range, but significantly degraded accuracy at high frequencies (500–1000 Hz). Specifically, the consistency deteriorates notably at 900 Hz, where the mean error exceeds 4 dB and peaks at 8.2 dB at 40 km, while the 600–1000 Hz band exhibits an average error of 4.1 ± 1.0 dB, with errors increasing both with frequency and propagation range.
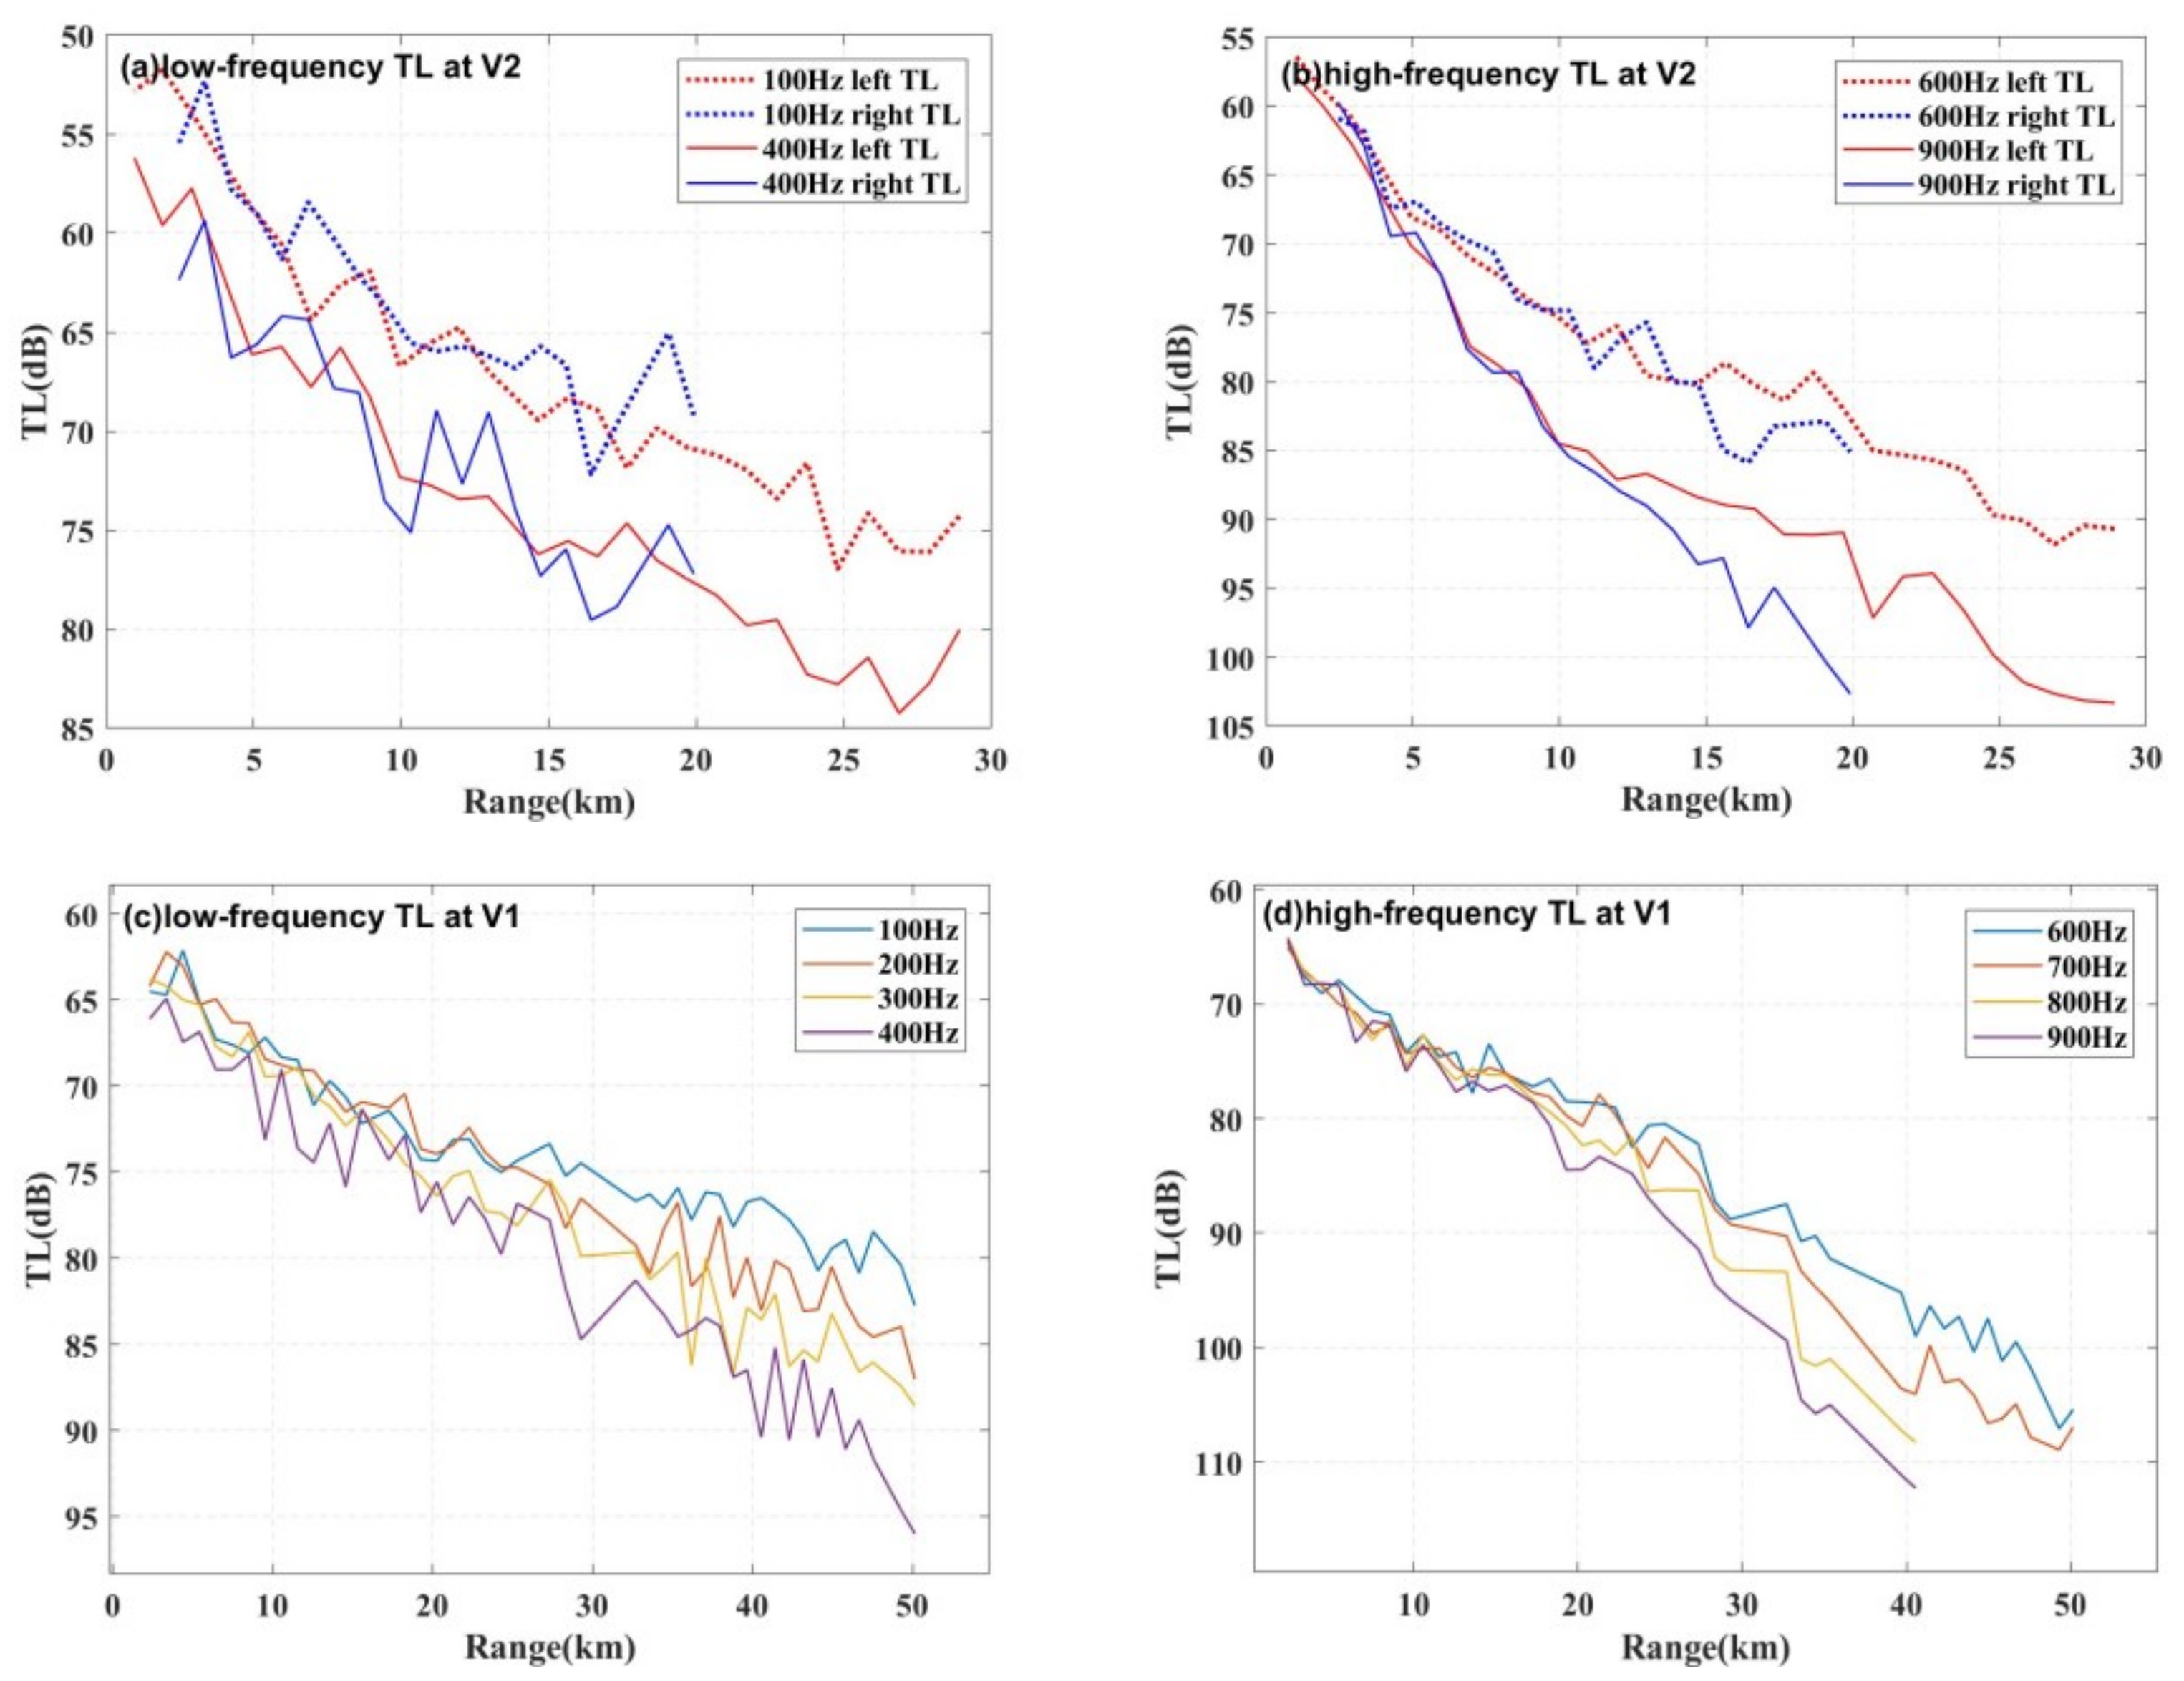
To investigate the cause of the high-frequency fitting discrepancy, we analyzed the experimental TL curves and observed abnormal attenuation at high frequencies. Figure 5 presents the TL curves received by V2, with the x-axis denoting the range from V2. Specifically, Figure 5a displays the TL at low frequencies (100 Hz and 400 Hz) at 29 m depth, while Figure 5b shows the results at high frequencies (600 Hz and 900 Hz) at the same depth. The red and blue curves correspond to TL within the 30 km leftward range and 20 km rightward range from V2, respectively. Comparison between Figure 5a,b reveals that at low frequencies, both curves exhibit nearly identical trends; at mid-to-high frequencies beyond 8 km, the left-side TL becomes significantly lower than the right-side. For instance, at 20 km range, the 900 Hz right-side TL is 10 dB higher than the left-side. Furthermore, analysis of the complete 50 km range data received by V1 (with the x-axis representing the range from V1), shown in Figure 5c,d demonstrates that low-frequency TL remains stable throughout the 50 km range; at high frequencies beyond approximately 22 km, significant additional attenuation occurs. Taking the case of 900 Hz as an example, the attenuation for the first 22 km is about 20 dB, while from 22 km to 40 km, it is about 30 dB, which is 10 dB greater than the propagation loss for the first 22 km.

2.3. Analysis of High-Frequency Acoustic Propagation

To investigate the high-frequency acoustic propagation phenomenon described in Section 2.2, an analysis is conducted. It is known that in the shallow-water waveguide, the water column’s sound speed profile and the seabed’s acoustic properties are two important factors that influence acoustic propagation characteristics [23]. We systematically examine three contributing aspects: the sound speed profile of the water column, seabed topography, and seabed geoacoustic parameters.
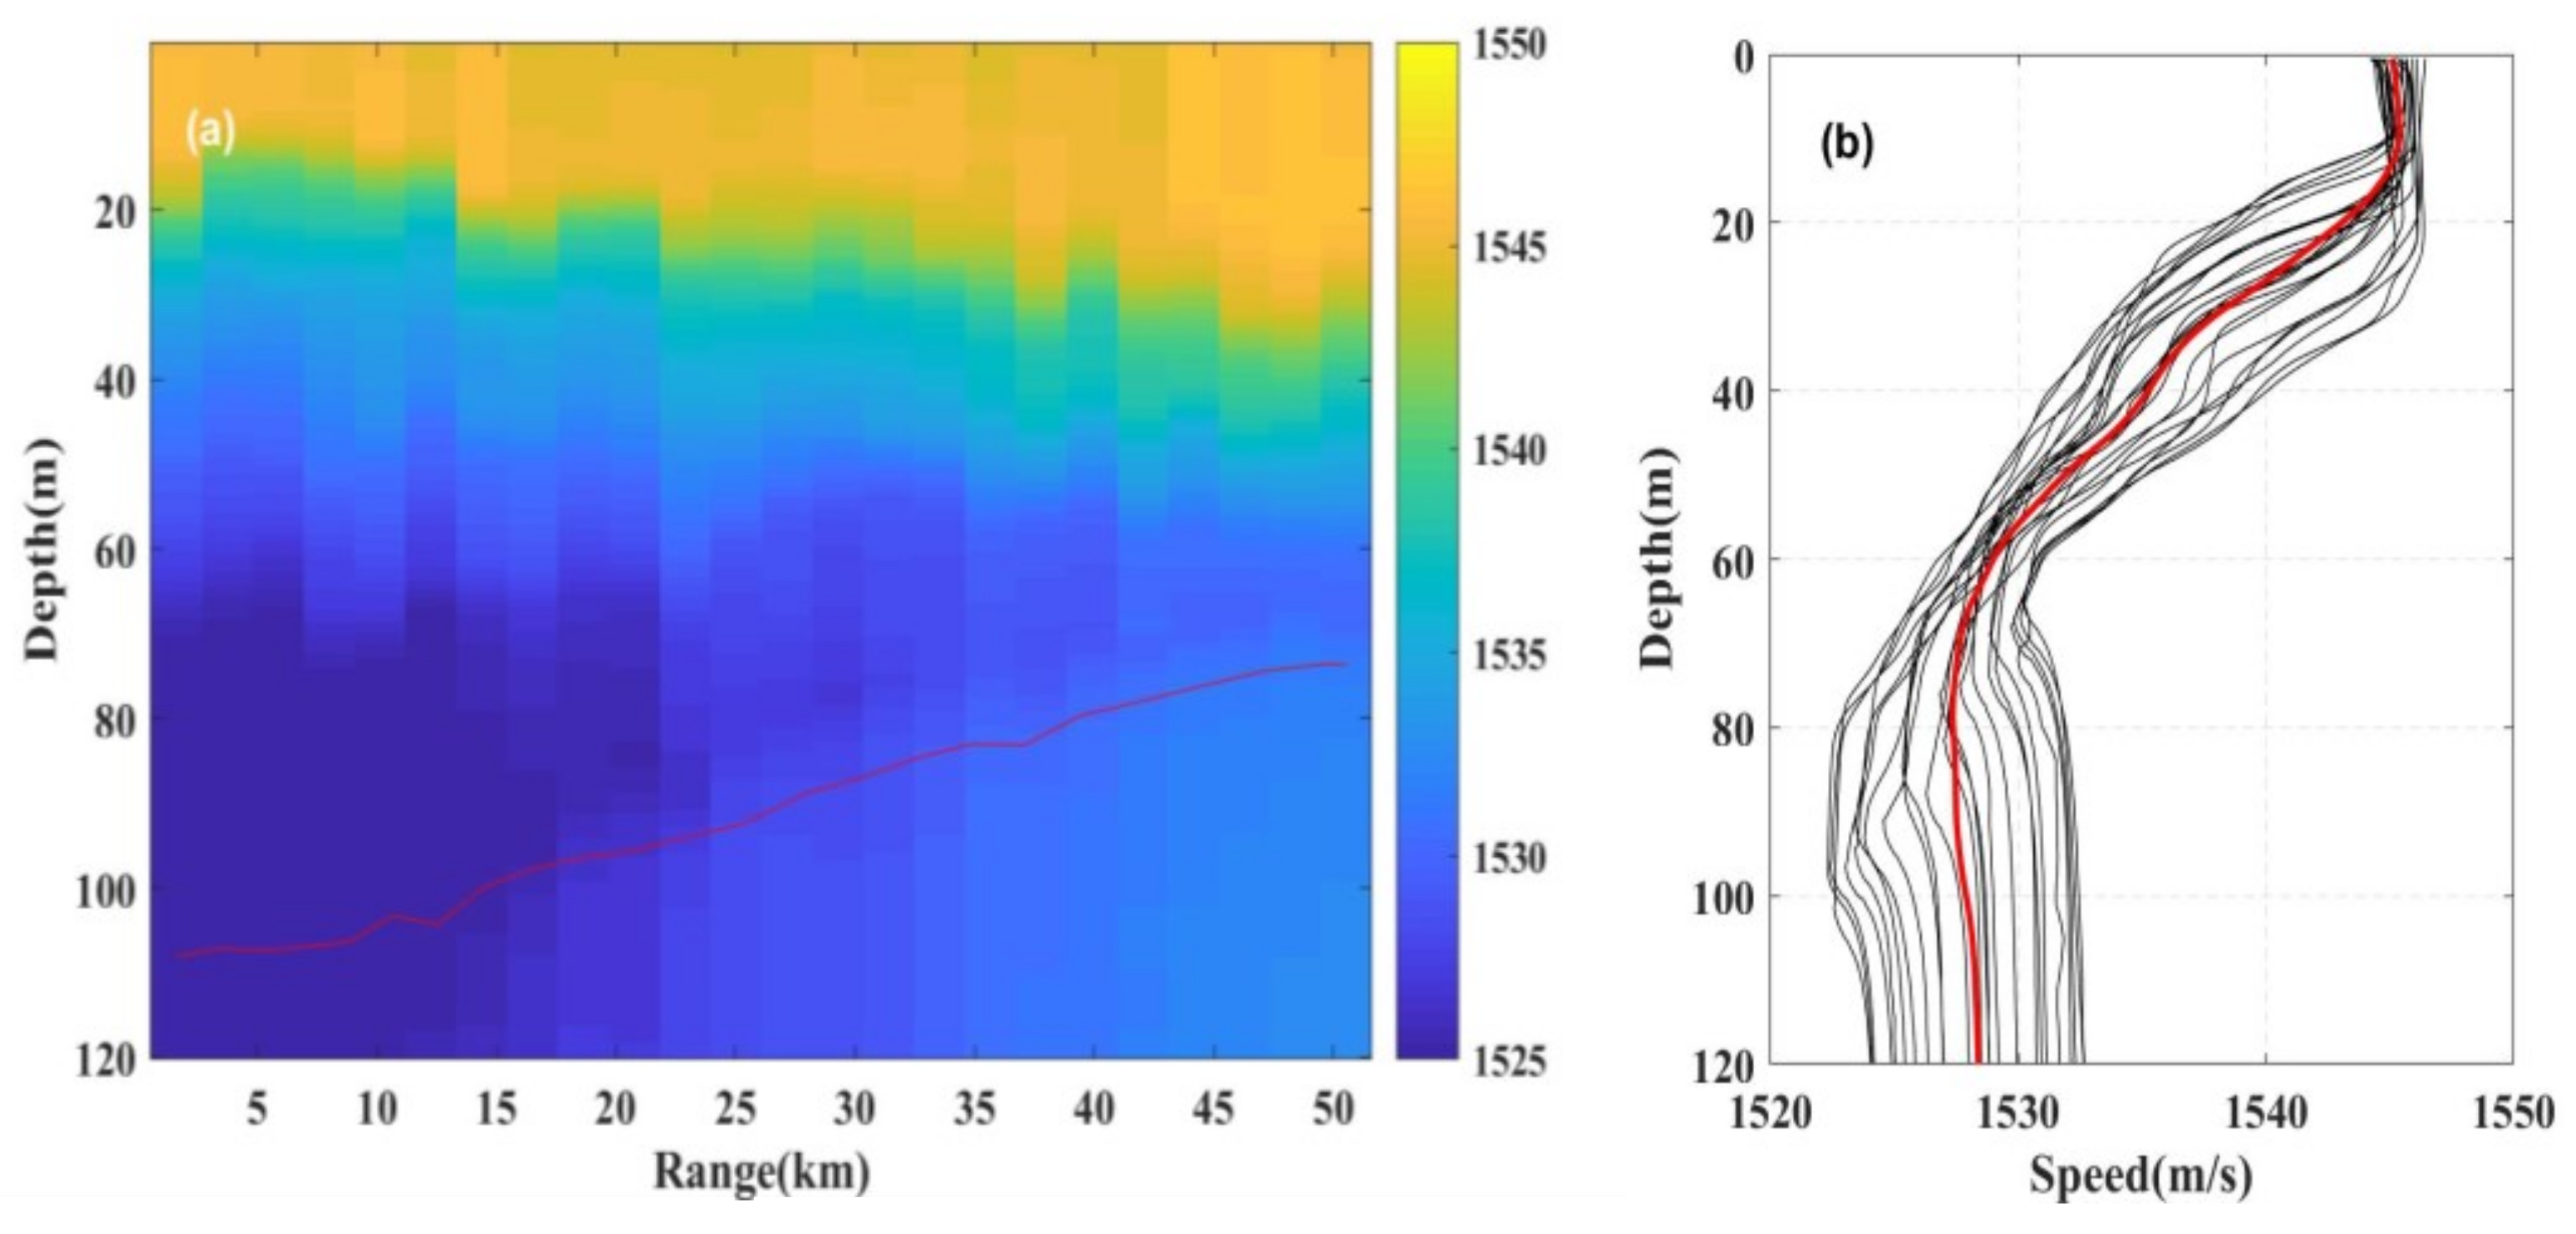
To obtain the water column sound speed profiles, we processed the expendable bathythermograph (XBT) and conductivity–temperature–depth (CTD) data collected during the experiment following standardized procedures. Figure 6a displays the resulting range-dependent sound speed distributions, with the red solid line indicating seabed depth. The averaged sound speed profile (red line in Figure 6b) was subsequently employed for further analysis. We computed the TL for both sound speed profiles while holding other parameters constant. Figure 7 reveals that the TL curves from both profiles are nearly identical, yet both exhibit significant deviations from the experimentally measured TL. This systematic discrepancy conclusively indicates that sound speed variations cannot explain the observed phenomena.
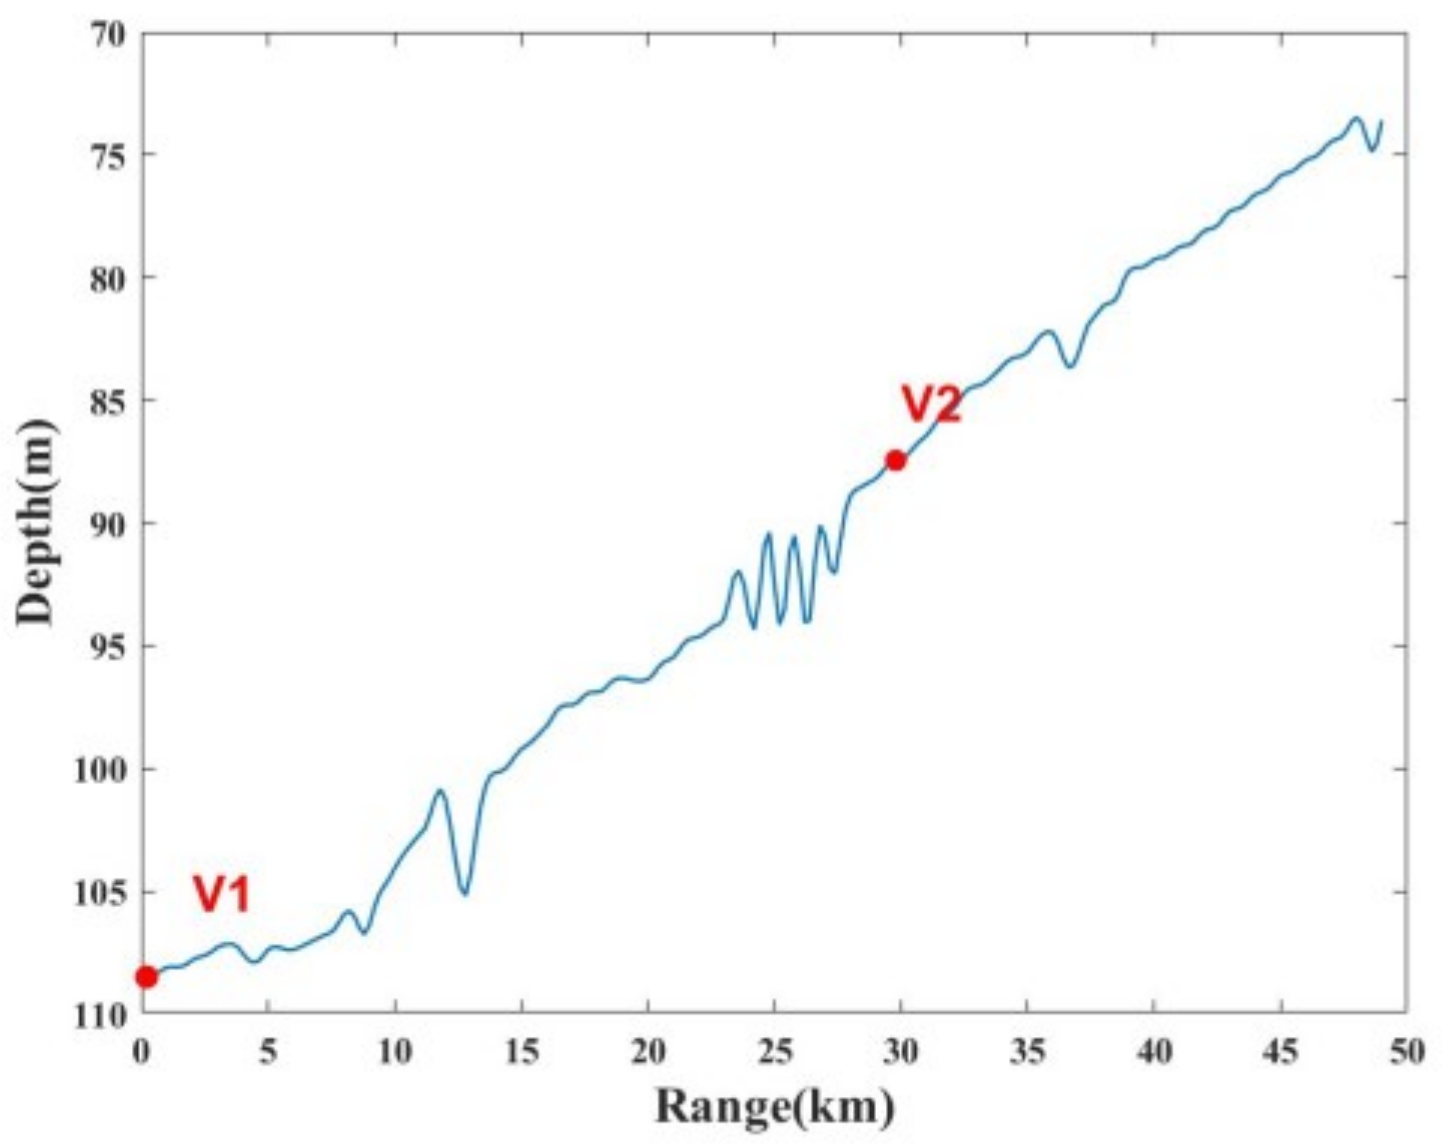
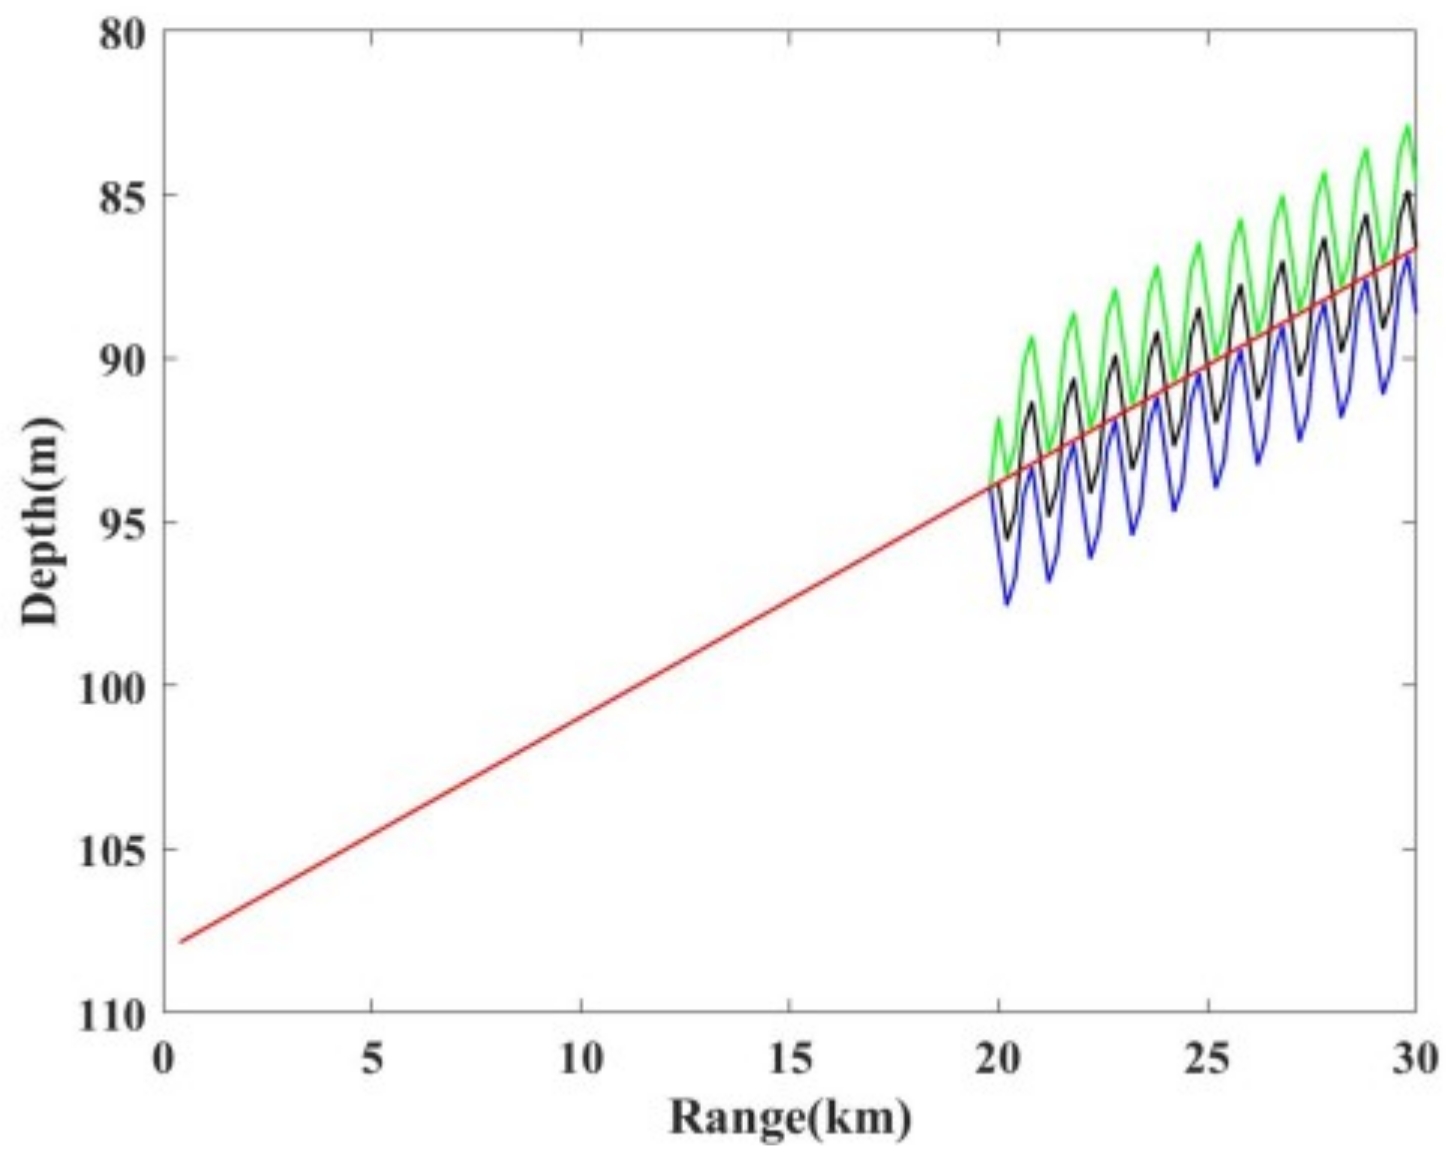
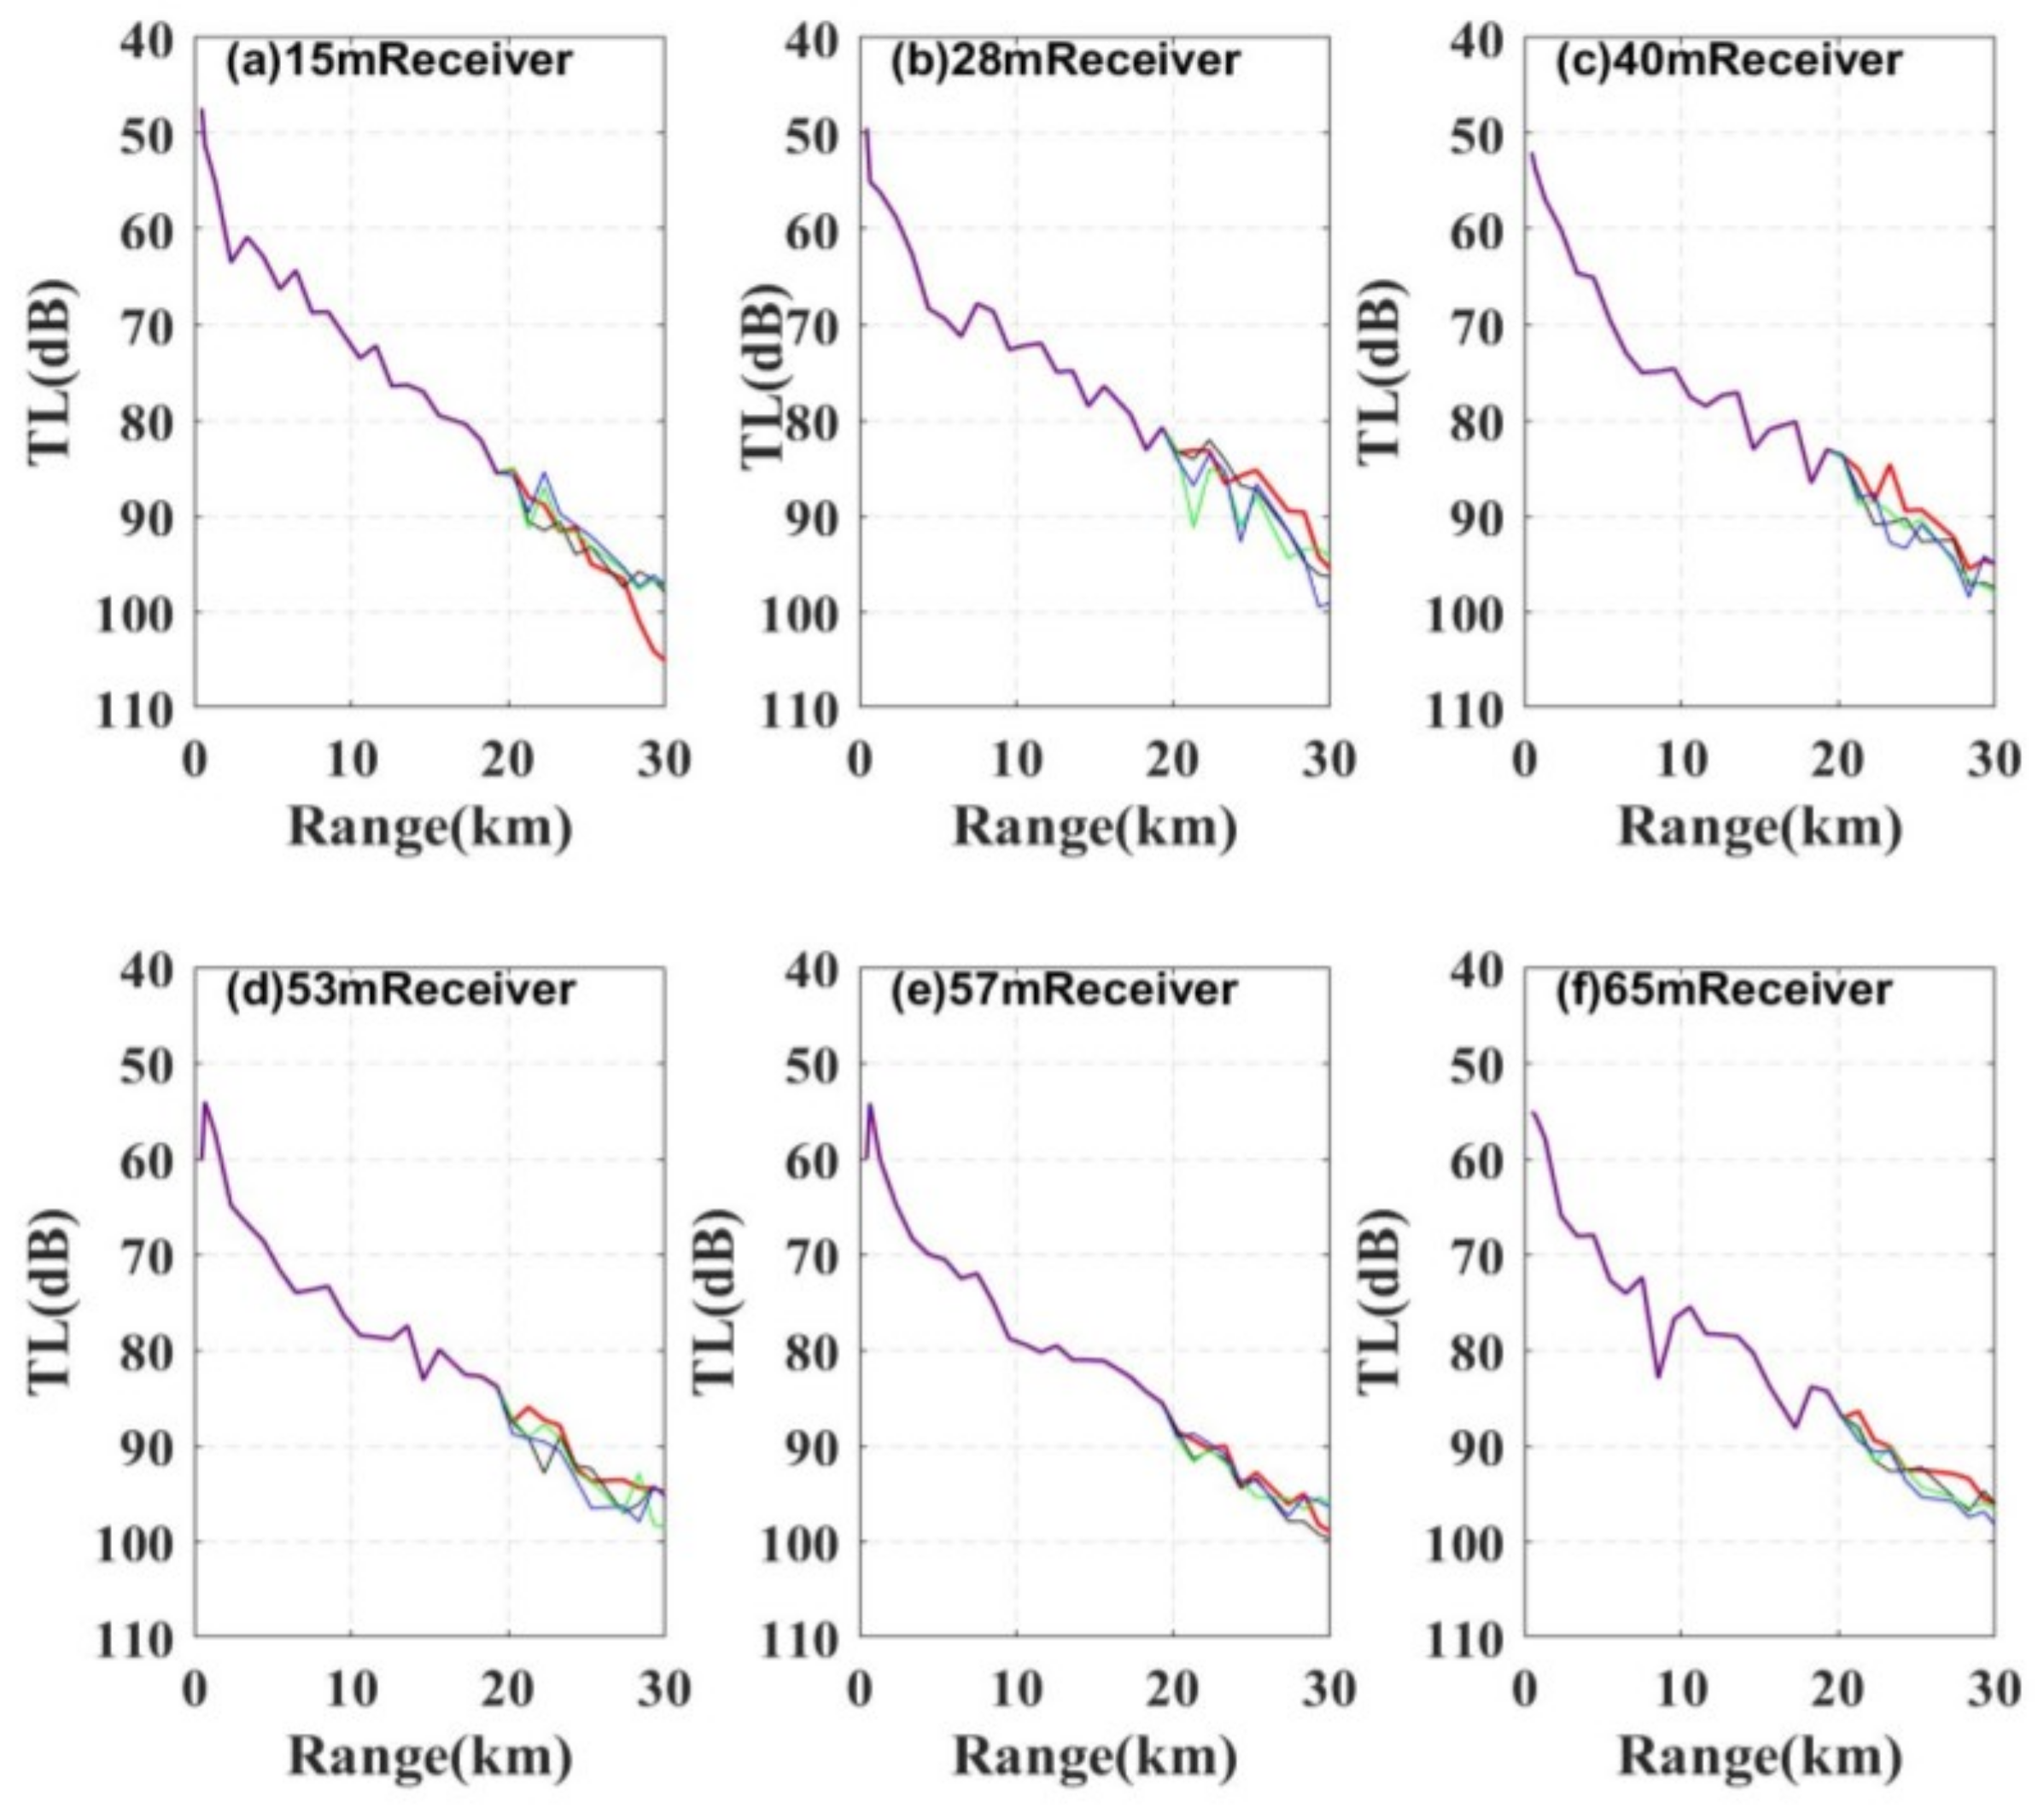
The seafloor topography significantly influences underwater acoustic propagation [32]. Multibeam sonar measurements acquired during the experiment delineated the seabed morphology presented in Figure 8, exhibiting distinct undulations with a 1 km spatial period (inter-peak distance) and a 4 m relief amplitude (peak-to-trough height) between 20 and 30 km. To assess whether seabed slope and roughness could account for the excess attenuation, we preserved the inverted values of sediment sound speed, density, and attenuation coefficients while simulating four topographic scenarios (Figure 9) with identical spatial periods and relief amplitudes: a flat seabed (red line) and three undulating seabed configurations (blue, green, and black lines). TL calculations between V1 and V2 for each scenario (color-matched in Figure 10) show that seabed undulations induced only minor TL variations (<5 dB). The TL curves for both arrays remain nearly identical at corresponding depths, demonstrating that seafloor topography cannot be the primary cause of the observed propagation.
When investigating whether the high-frequency additional attenuation was caused by variations in seabed sediment properties, we analyzed the data received at V1, as shown in Figure 5. We observed that additional attenuation appeared beyond approximately 20 km in the high-frequency band. Based on the theory that high-frequency far-field data are primarily influenced by the seabed’s surface layer [24,25], we simplified the inversion dimensionality by fixing the sound speed and attenuation coefficients of the deeper sediment layers to reduce inversion dimensionality. This sand layer is equivalently modeled, as shown in Figure 11, according to the TL attenuation regions observed experimentally. For the sand layer’s sound speed modeling, we incorporated both depth gradients and range-dependent variations ( c 11 , c 12 , c 21 , and c 22 ) using a stepwise inversion method: first we inverted c 11 c 12 for 0–22 km; with these results as known inputs, we inverted c 21 c 22 for 22–50 km. The sound speed search range is constrained to 1500–1650 m/s with 5 m/s increments, yielding final values of 1610 m/s, 1545 m/s, 1525 m/s, and 1605 m/s, respectively. As demonstrated in Figure 12, the inverted TL shows excellent agreement with experimental measurements, strongly suggesting that range-dependent variations in sediment geoacoustic parameters are the likely cause of the observed additional high-frequency TL. This finding underscores the necessity of incorporating range-dependent seabed layering structures in geoacoustic modeling, especially for broadband (100–1000 Hz) acoustic propagation where conventional range-independent assumptions fail to capture the observed phenomena.

3. Inverse Theory and Algorithms

In Section 2.3, through comprehensive analysis of three factors—the water column sound speed profile, seabed topography, and sediment properties—we explained the observed high-frequency attenuation phenomenon. This is achieved by implementing range-dependent segmentation of the surface layer (as shown in Figure 11) within the layered seabed model presented in Figure 2. To automate the inversion process for range-dependent seabed properties (eliminating the need for manual regional segmentation and stepwise inversion), we employ Trans-D Bayesian inversion. This approach enables the model to autonomously determine optimal parameter variations along the propagation range.

3.1. Likelihood Function

The measurement data d considered in this paper consists of a set of TL values, with M denoting the number of receivers. The calculations are performed using 1/3-octave bands with a center frequency f i ( i = 1 I ), and the number of valid positional data points per frequency f i for a single receiver is N i . Assuming the data errors are unbiased, Gaussian-distributed, and independent across frequencies, the likelihood function can be written as follows [27]:
L ( m ) = f i F 1 ( 2 π ) N i M / 2 C d i 1 / 2 exp [ r i ( m ) T C d i 1 r i ( m ) / 2 ] ,
Here, r i ( m ) = d i d i ( m ) and C d i represent the data residual and data error covariance matrix, respectively, for the i-th center frequency. The vector d i ( m ) denotes the predicted data computed from the model parameters m . If e represents the experimental data and c the copy field data, then r i ( m ) can be rewritten as follows:
r i ( m ) = x = 1 N i y = 1 M TL e xy TL c xy ( m ) .
We further assume that the data at different locations are mutually independent. Let σ i denote the error standard deviation for all positions at the i-th frequency. Under these conditions, the likelihood function for the channel parameters can be defined as follows:
L ( m ) = f i F 1 ( 2 π σ i 2 ( m ) ) N i M / 2 exp ( r i ( m ) 2 / ( 2 σ i 2 ( m ) ) ) .
A maximum-likelihood estimate for σ can be derived by setting L ( m ) / σ = 0 , leading to [33,34]
σ i ( m ) = 1 N i M r i ( m ) 2 1 / 2 .
Substituting this into (6) yields
L ( m ) = fi F exp ( N i M / 2 ) ( 2 π ) N i M / 2 r i ( m ) N i M .
where r i ( m ) represents the summation of errors across all positions at center frequency f i . By taking its average, we obtain the error per individual position, which serves as our misfit function for evaluating the inversion results:
φ ( m ) = 1 I i I 1 N i M r i ( m ) 2 1 / 2 .

3.2. Trans-D Bayesian Inversion

In general, the posterior probability density (PPD) of parameters is obtained through the prior distribution p ( m , θ ) , conditional probability density p ( d m , θ ) , and normalization constant p ( d , θ ) , following the standard Bayesian formulation [35]:
p ( m d , θ ) = p ( m , θ ) p ( d m , θ ) p ( d , θ ) .
When the observed data d are known, the conditional probability density p ( d m , θ ) can be treated as a likelihood function dependent on the model m and its parametrization θ . In this case, the Bayesian formulation simplifies to
p ( m d , θ ) L ( m , θ ) p ( m , θ ) .
In contrast to traditional Bayesian inversion applied to fixed-dimensional problems, Trans-D Bayesian inversion treats the number of parameters itself as a random variable to be inverted. This approach allows the parameter dimension to vary during the sampling process. Let K denote the set of model parameter vectors indexed by k , with m k representing the corresponding model. The Bayesian formulation in (10) then becomes [27]
p ( k , m k d ) = p ( k ) p ( m k k ) p ( d k , m k ) p ( d ) .
The Markov chain Monte Carlo (MCMC) method can be applied to sample the Trans-D PPD in (12), providing marginal probability densities and other statistical measures to quantify parameter uncertainty. The sampling algorithm must transition between models with varying parameter dimensions while satisfying reversibility (detailed balance). Adaptive inversion methods like rjMCMC can help resolve local heterogeneity in complex media. The rjMCMC algorithm achieves this by accepting a new state p ( k , m k ) given the current state p ( k , m k ) , with the acceptance probability determined by the Metropolis–Hastings–Green (MH) criterion [26]:
A ( k , m k k , m k ) = min 1 , Q ( k , m k k , m k ) Q ( k , m k k , m k ) p ( k ) p ( m k k ) p ( k ) p ( m k k ) L ( k , m ) L ( k , m k ) J .
where Q ( k , m k k , m k ) represents the proposal probability density for generating a new state ( k , m k ) given the current state ( k , m k ) and J denotes the determinant of the Jacobian matrix used for coordinate transformation between parameter subspaces. The acceptance probability can be considered as composed of the proposal distribution ratio, prior ratio, likelihood ratio, and Jacobian determinant. For the birth–death mechanism implementing Trans-D sampling, J = 1 [36]. This mechanism involves three distinct operations: a birth step, death step, and perturbation step. During sampling, one operation is randomly selected, with the constraint that the interface number (dimensionality) can only change by one at a time. To maintain the detailed balance condition of the Markov chain, the probabilities of executing birth and death steps must be equal.
Set the maximum range as r x max . When there are k interfaces, the corresponding interface positions are r x 1 r x k . Each interface is associated with distinct geoacoustic parameters g u , u = 1 , , G (e.g., sound speed and density), where the priors for k and g u are bounded uniform distributions. The perturbation step applies Gaussian perturbations to the current model parameters (sound speed and interface positions) while maintaining a fixed dimension k . Since the priors are uniform and the proposal probability density is symmetric, the acceptance criterion for this step depends solely on the likelihood ratio [27],
A ( k , m k k , m k ) = min 1 , L ( k , m ) L ( k , m k ) .
Let Δ g i denote the prior range for each geophysical parameter and Q g ( g | g ) represent the proposal distribution for the geophysical parameter g of a newly added or removed layer. The acceptance criteria for the birth and death steps can then be derived as follows [36]:
A birth ( k , m k | k , m k ) = min 1 , 1 Q g ( g | g ) 1 u = 1 G Δ g u L ( k , m k ) L ( k , m k ) ,
A death ( k , m k | k , m k ) = min 1 , Q g ( g | g ) u = 1 G Δ g u L ( k , m k ) L ( k , m k ) .

4. Numerical Simulations and Discussion

To validate the algorithm’s effectiveness, this study utilizes the measured sound speed profile (shown in Figure 6) and previously inverted parameters of subsurface layers (including sound speed, density, and seabed absorption coefficients) as prior information, with V1 serving as the receiver. In the simulation setup, the sound speed of the surface layer and density are designed to vary twice with increasing range, creating three sediment interfaces within the surface layer. Following a sensitivity analysis and verifying the approach through simulation inversion using the method described in Section 3, the algorithm is then applied to process the experimental data.

4.1. Sensitivity Analysis

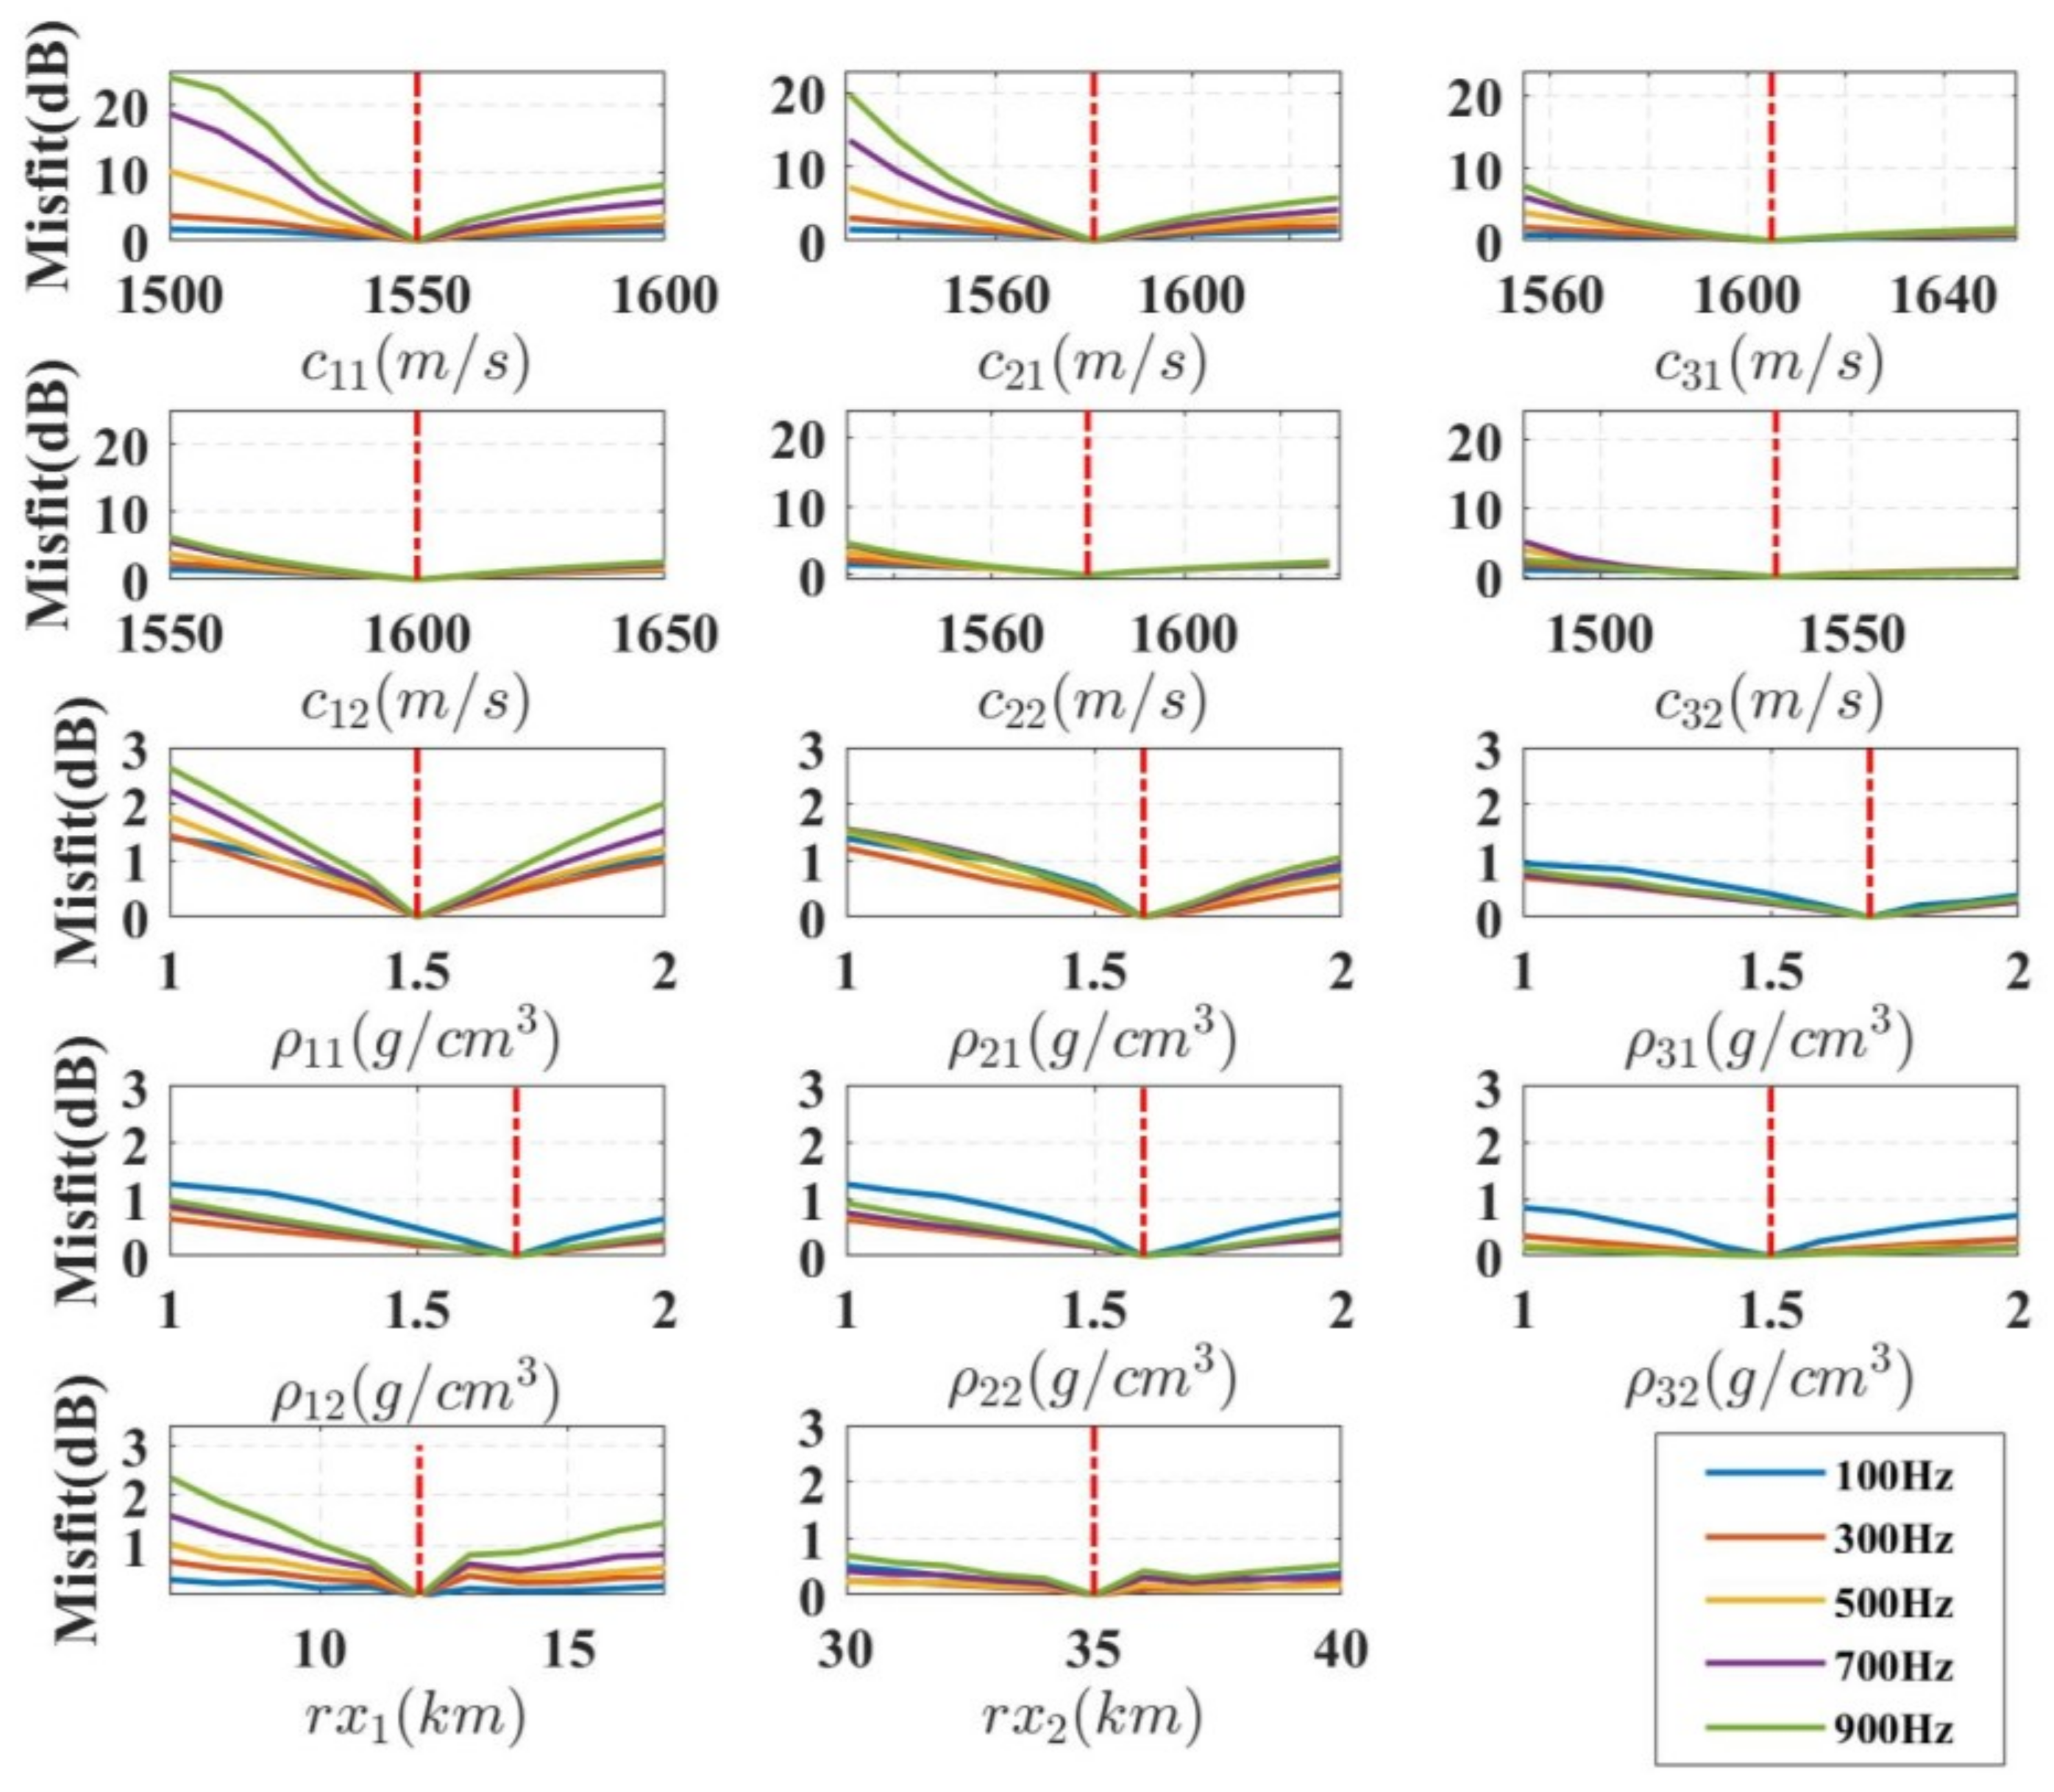
To evaluate the sensitivity of different parameters during the inversion process, we conducted a sensitivity analysis by varying one parameter while keeping others fixed at their true values. The misfit function was calculated for different parameter values, where a larger variation in the misfit function indicated higher parameter sensitivity. We computed sensitivity curves for each parameter across multiple frequencies (100 Hz, 300 Hz, 500 Hz, 700 Hz, and 900 Hz). The model contains k interfaces (which separate k + 1 distinct sediment zones), where r x j represents the interface positions and ( c j 1 c j 2 and ρ j 1 ρ j 2 ) denote the upper/lower gradient sound speed and densities for the j-th surface sediment layer. In our simulation setup with k = 2 , the positions r x 1 and r x 2 represent where surface sound speed changes occur.
As shown in Figure 13, the parameter sensitivity demonstrates three key characteristics: near-range parameters exhibit greater sensitivity than far-range parameters; upper-layer sound speed shows higher sensitivity than lower-layer sound speed, and sound speed sensitivity significantly outweighs both interface position and density sensitivity. Consequently, in our inversion scheme density is not independently inverted but rather derived from sound speed using the Hamilton empirical formula that characterizes their relationship; interface positions remain as inversion parameters to ensure proper propagation loss calculation for range-dependent seabed models.

4.2. Synthetic Data Inversion

The comprehensive simulation inversion was conducted across five center frequencies (100 Hz, 300 Hz, 500 Hz, 700 Hz, and 900 Hz). The Trans-D inversion employed bounded uniform distributions as priors for all parameters to be inverted, with their true values and distributions detailed in Table 1.
For initialization, the geoacoustic parameters are derived from the range-independent seabed model shown in Figure 2 (without interfaces), where the sound speed within the layers are set to c 11 = 1560 m/s and c 12 = 1595 m/s, respectively. Layer thickness and density are calculated using Equations (1) and (2). The parameters to be inverted include the interface positions and the sound speed gradients of surface layers within each bounded region, with a total parameter count of 3 k + 2 (where k = 2 in this case). To reduce inversion complexity and prevent interface ambiguity or excessive layering, the following constraints are imposed during iterations: minimum interface spacing is r x j r x j + 1 5   km ; minimum sound speed contrast is c j 1 c ( j + 1 ) 1 + c j 2 c ( j + 1 ) 2 50   m / s . The true values are configured to comply with these constraints.
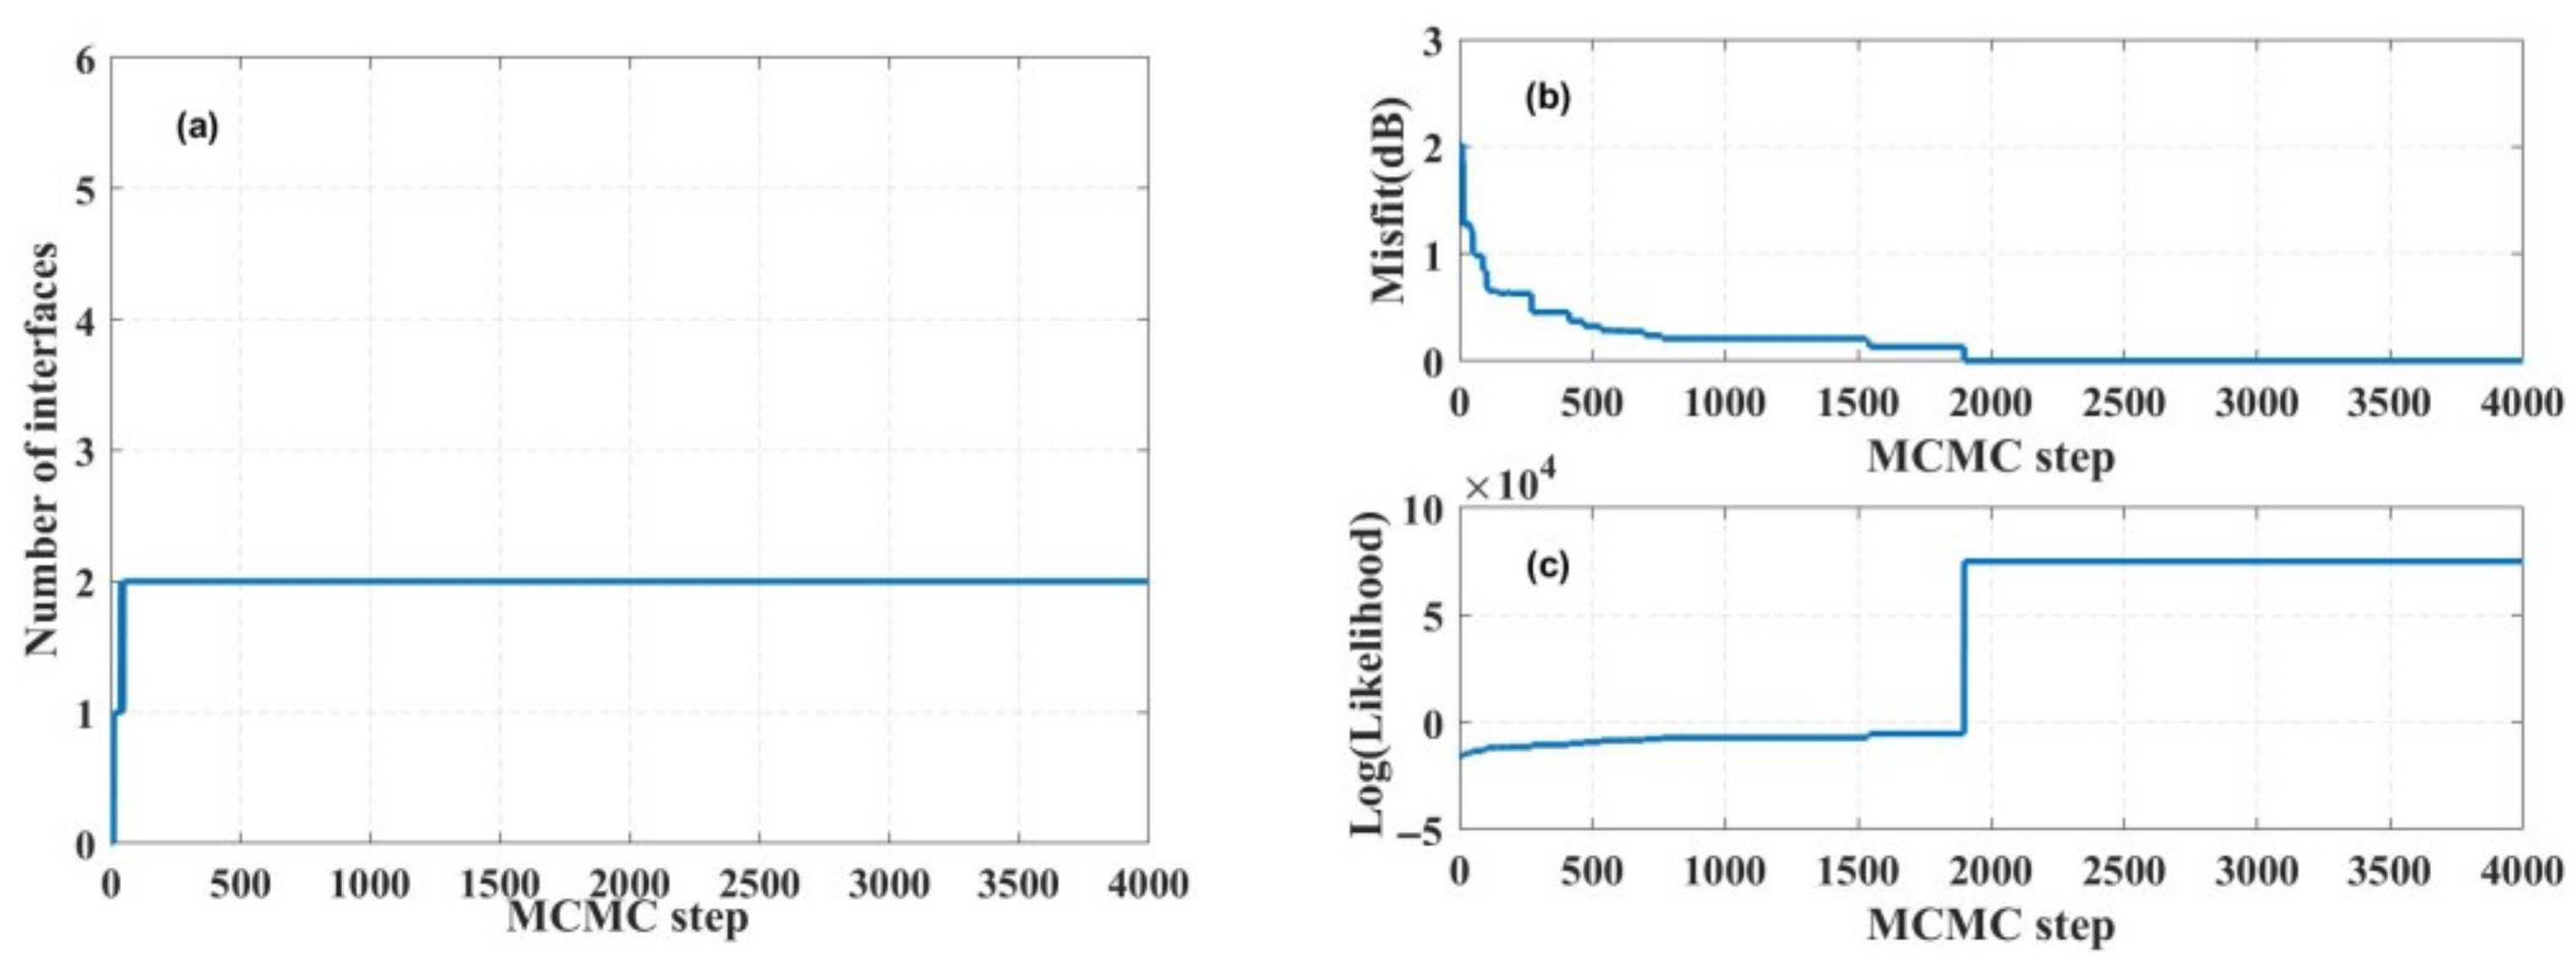
As shown in Figure 14, the number of inverted interfaces gradually converges with increasing iterations, ultimately reaching the true preset value of two interfaces after 49 iterations. It also demonstrates the evolution of both the misfit function and the log-likelihood function during this process. Larger misfits occur when the number of interfaces is incorrect, but these values progressively decrease with iterations until convergence is achieved after 1899 iterations, matching the predetermined inversion truth.
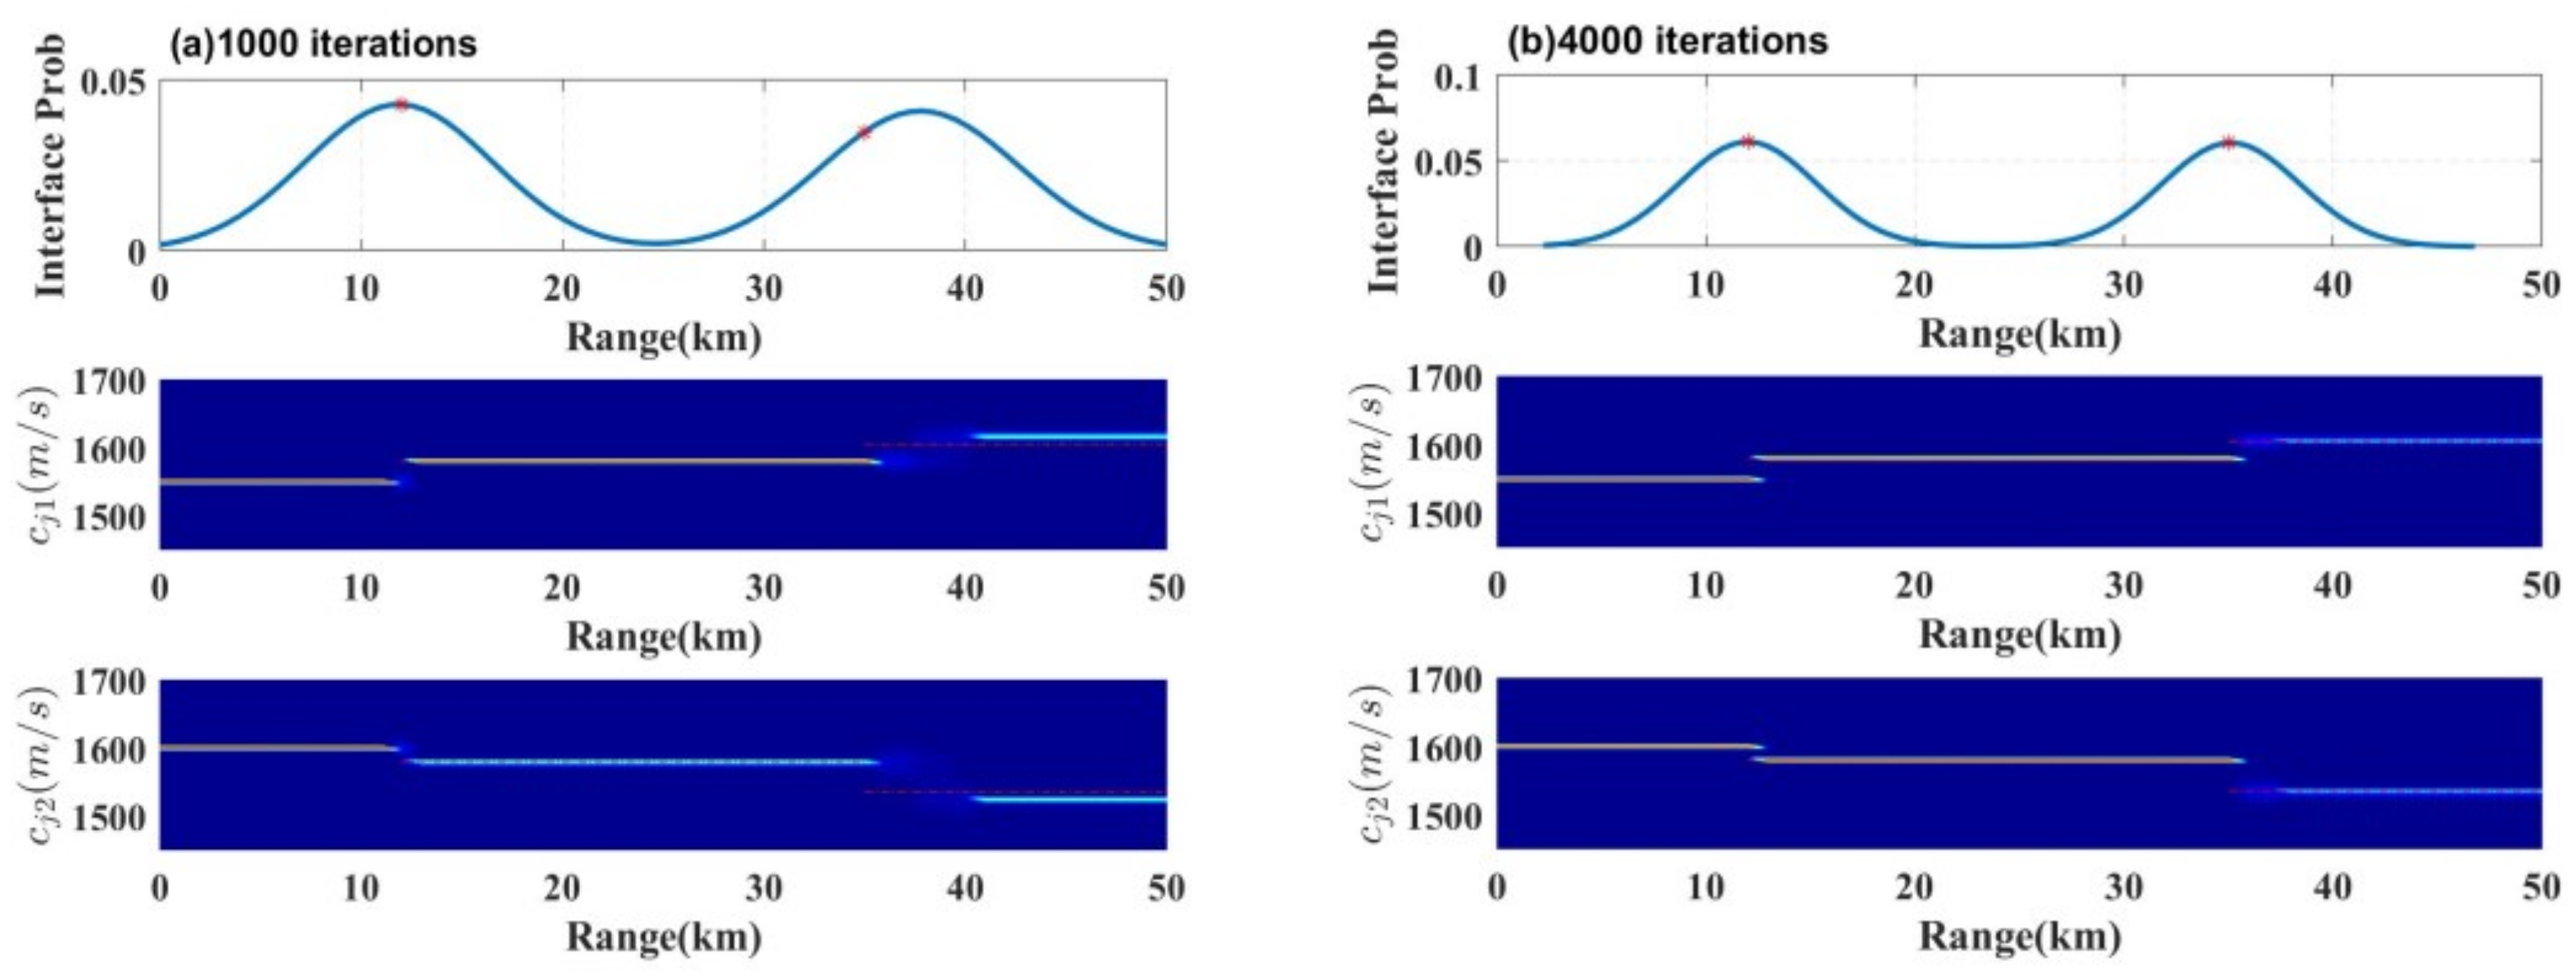
To validate the parameter sensitivity discussed earlier, Figure 15 presents inversion results after 1000 and 4000 iterations. For visualization purposes, the marginal probability distributions are individually normalized at each range, with warmer color tones representing higher-probability regions (blue = 0 probability). The preset true values are indicated by red dashed lines and star symbols.
Comparative analysis reveals the following:
  • Near-range interfaces and surface layer sound speed gradients converge faster to their true values than others.
  • Far-range seabed parameters, particularly interface positions, require more iterations to approach the truth.
  • This confirms greater inversion accuracy for near-field sound speed parameters and interfaces, while far-field counterparts exhibit inherent uncertainty.

4.3. Experimental Data Inversion

The inversion was performed across ten center frequencies (100 Hz, 200 Hz, 300 Hz, …, 1000 Hz). The Trans-D inversion employed bounded uniform distributions as priors for all parameters to be inverted, with their distributions detailed in Table 1. For initialization, the geoacoustic parameters are derived from the range-independent seabed model shown in Figure 2 (without interfaces), where the sound speed within the layers is set to c 11 = 1576 m/s and c 12 = 1576 m/s, respectively. The parameters to be inverted include the interface positions and the sound speed gradients of surface layers within each bounded region, with a total parameter count of 3 k + 2 . To reduce inversion complexity and prevent interface ambiguity or excessive layering, the following constraints are imposed during iterations: minimum interface spacing is r x j r x j + 1 5   km ; minimum sound speed contrast is c j 1 c ( j + 1 ) 1 + c j 2 c ( j + 1 ) 2 50   m / s .
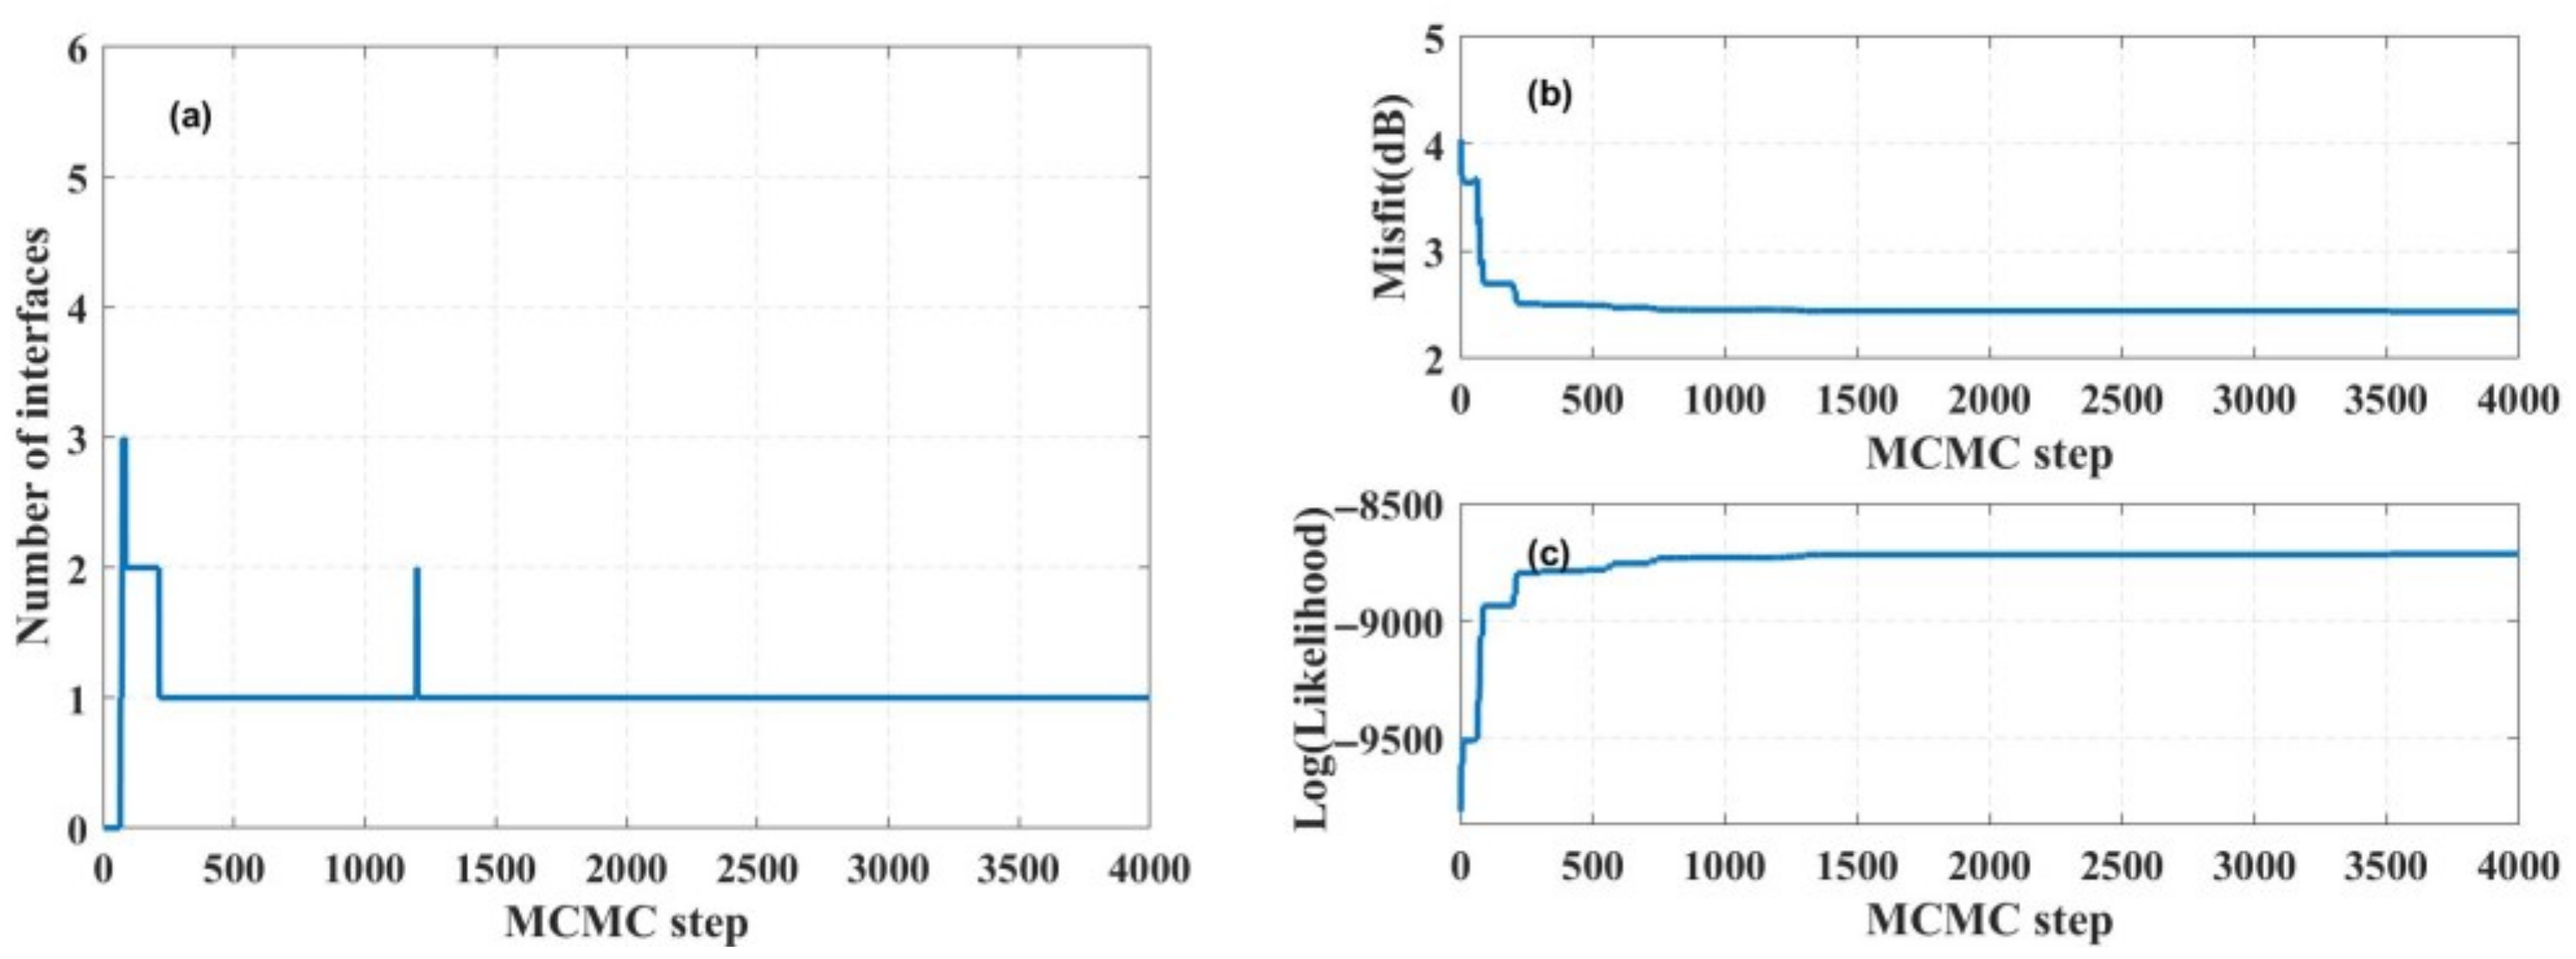
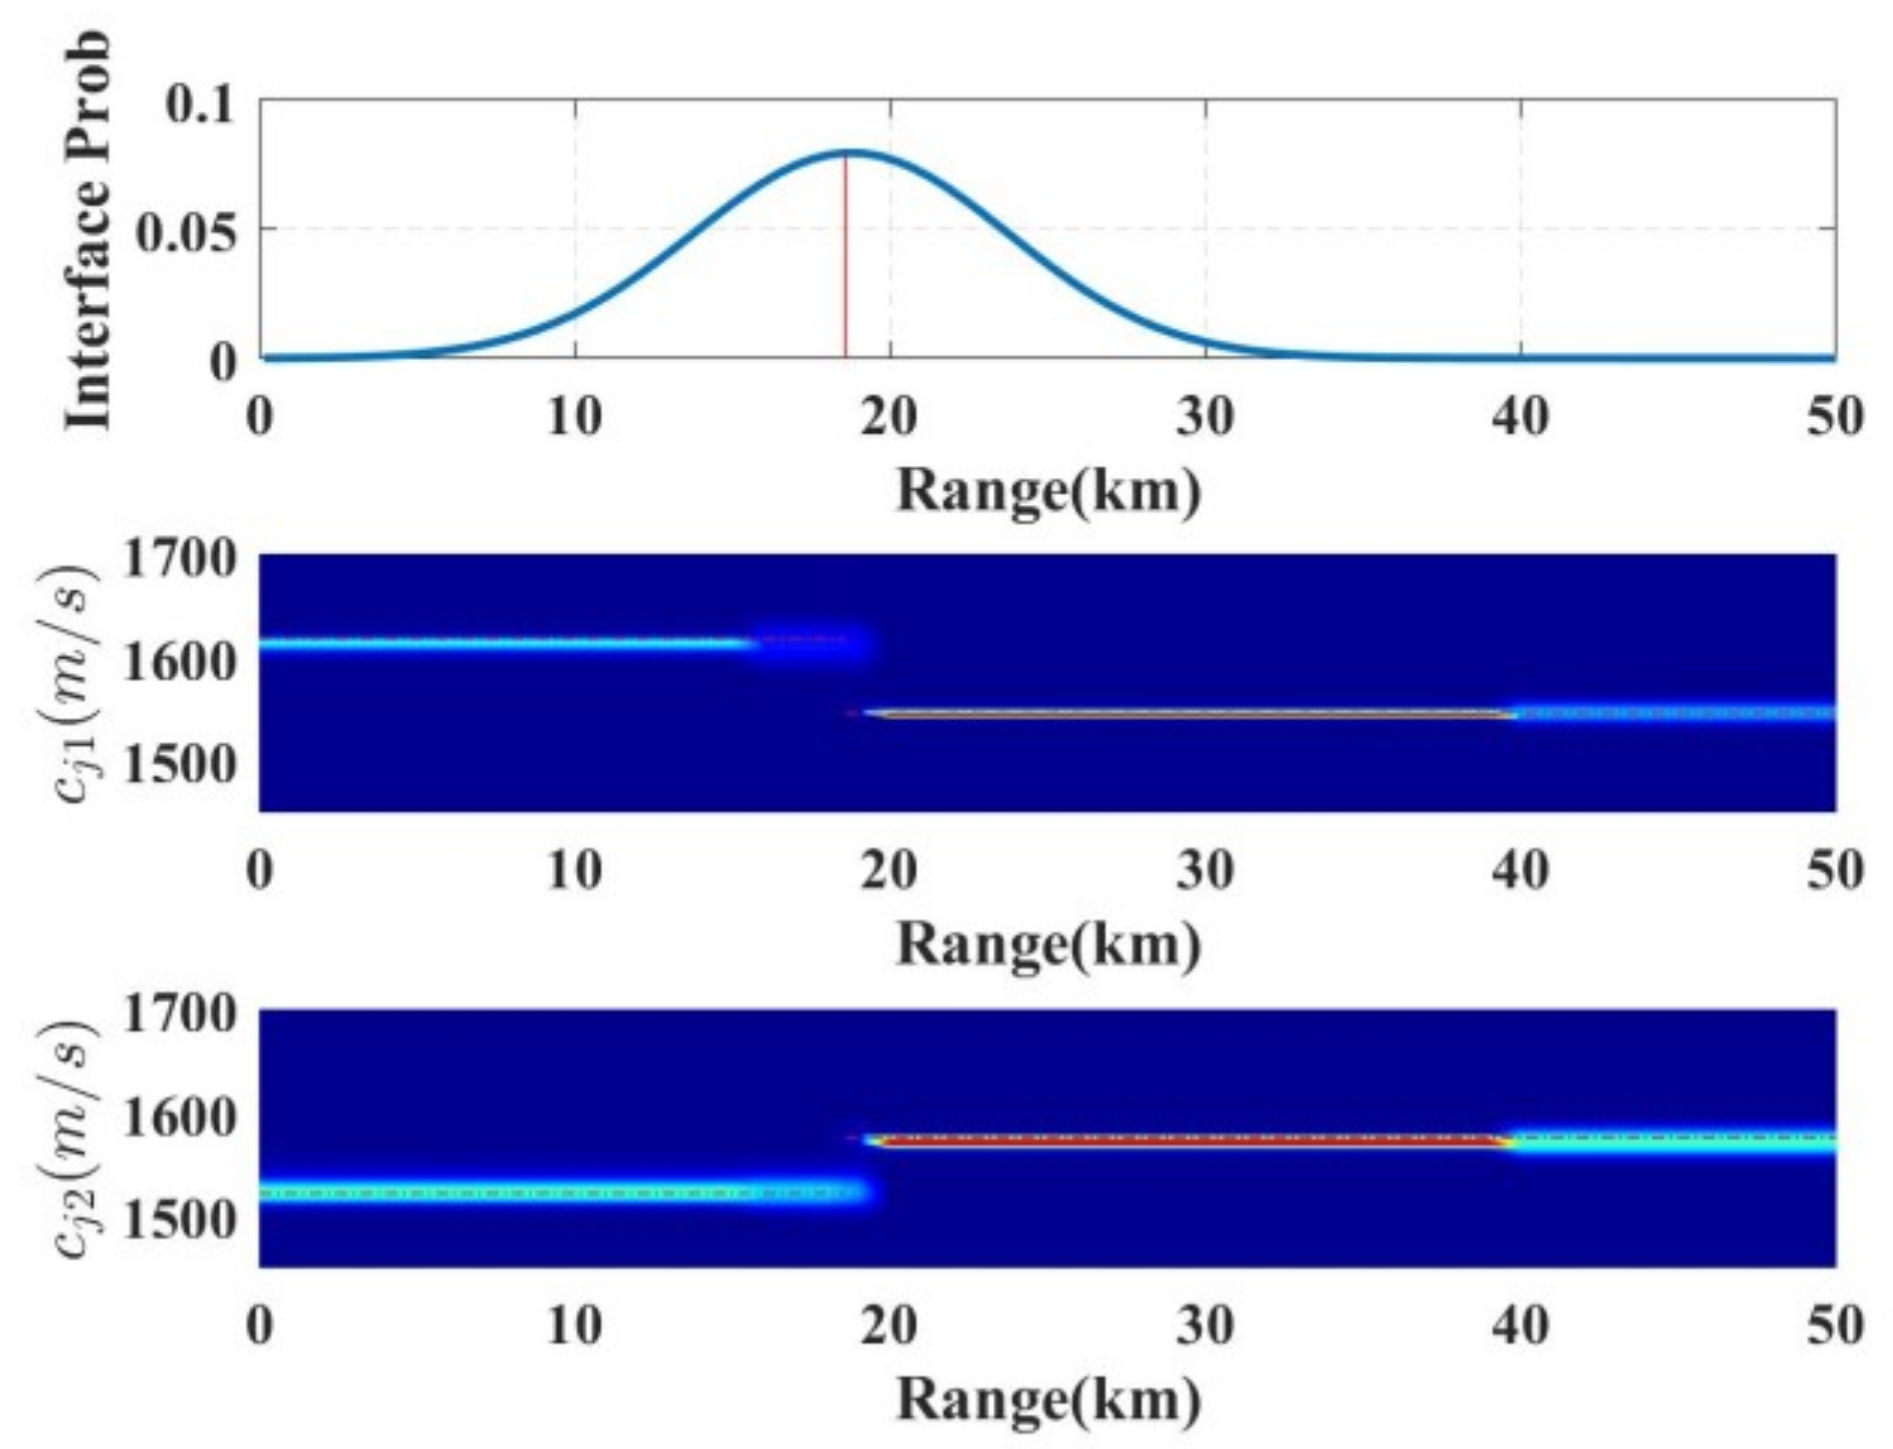
As shown in Figure 16, the interface count ultimately converges to 1 (indicating a single interface). The convergence behavior of both the misfit function φ ( m ) and log-likelihood log L ( m ) with iterations is observed, reaching a final misfit value of 2.43 dB. Referring to the evolution of interface numbers, φ ( m ) , and log L ( m ) with sampling counts in Figure 16, the first 500 burn-in iterations are excluded, and the posterior analysis is performed on the remaining 3500 samples. Figure 17 presents the marginal posterior probability distribution of the inversion results. The marginal probability distribution is normalized separately at each range for display, with warmer color tones representing higher-probability regions (blue = 0 probability). From the topmost figure, it can be seen that there is a clear interface r x 1 at 18.6 km (marked with a red solid line). The middle and bottom figures represent the surface sound speed gradient c j 1 c j 2 at the corresponding positions. The red dashed line represents the best fit position. For ranges less than r x 1 , it is a negative-gradient sound speed distribution of 1618–1522 m/s, and for ranges greater than r x 1 , it is a positive-gradient sound speed distribution of 1546–1576 m/s; c 11 c 21 + c 12 c 22 = 126   m / s 50   m / s demonstrates the rationality of the results. The reason for the increased uncertainty after 40 km compared to before 40 km is that the sound propagation under the experimental data of 800–1000 Hz fails after 40 km, and this part is removed in the inversion.
The final fitting results of TL are shown in Figure 18, where TL1 represents the stepwise inversion results for surface layering (as in Figure 12) and TL2 denotes the rjMCMC inversion results. Both methods demonstrate good agreement with experimental measurements.
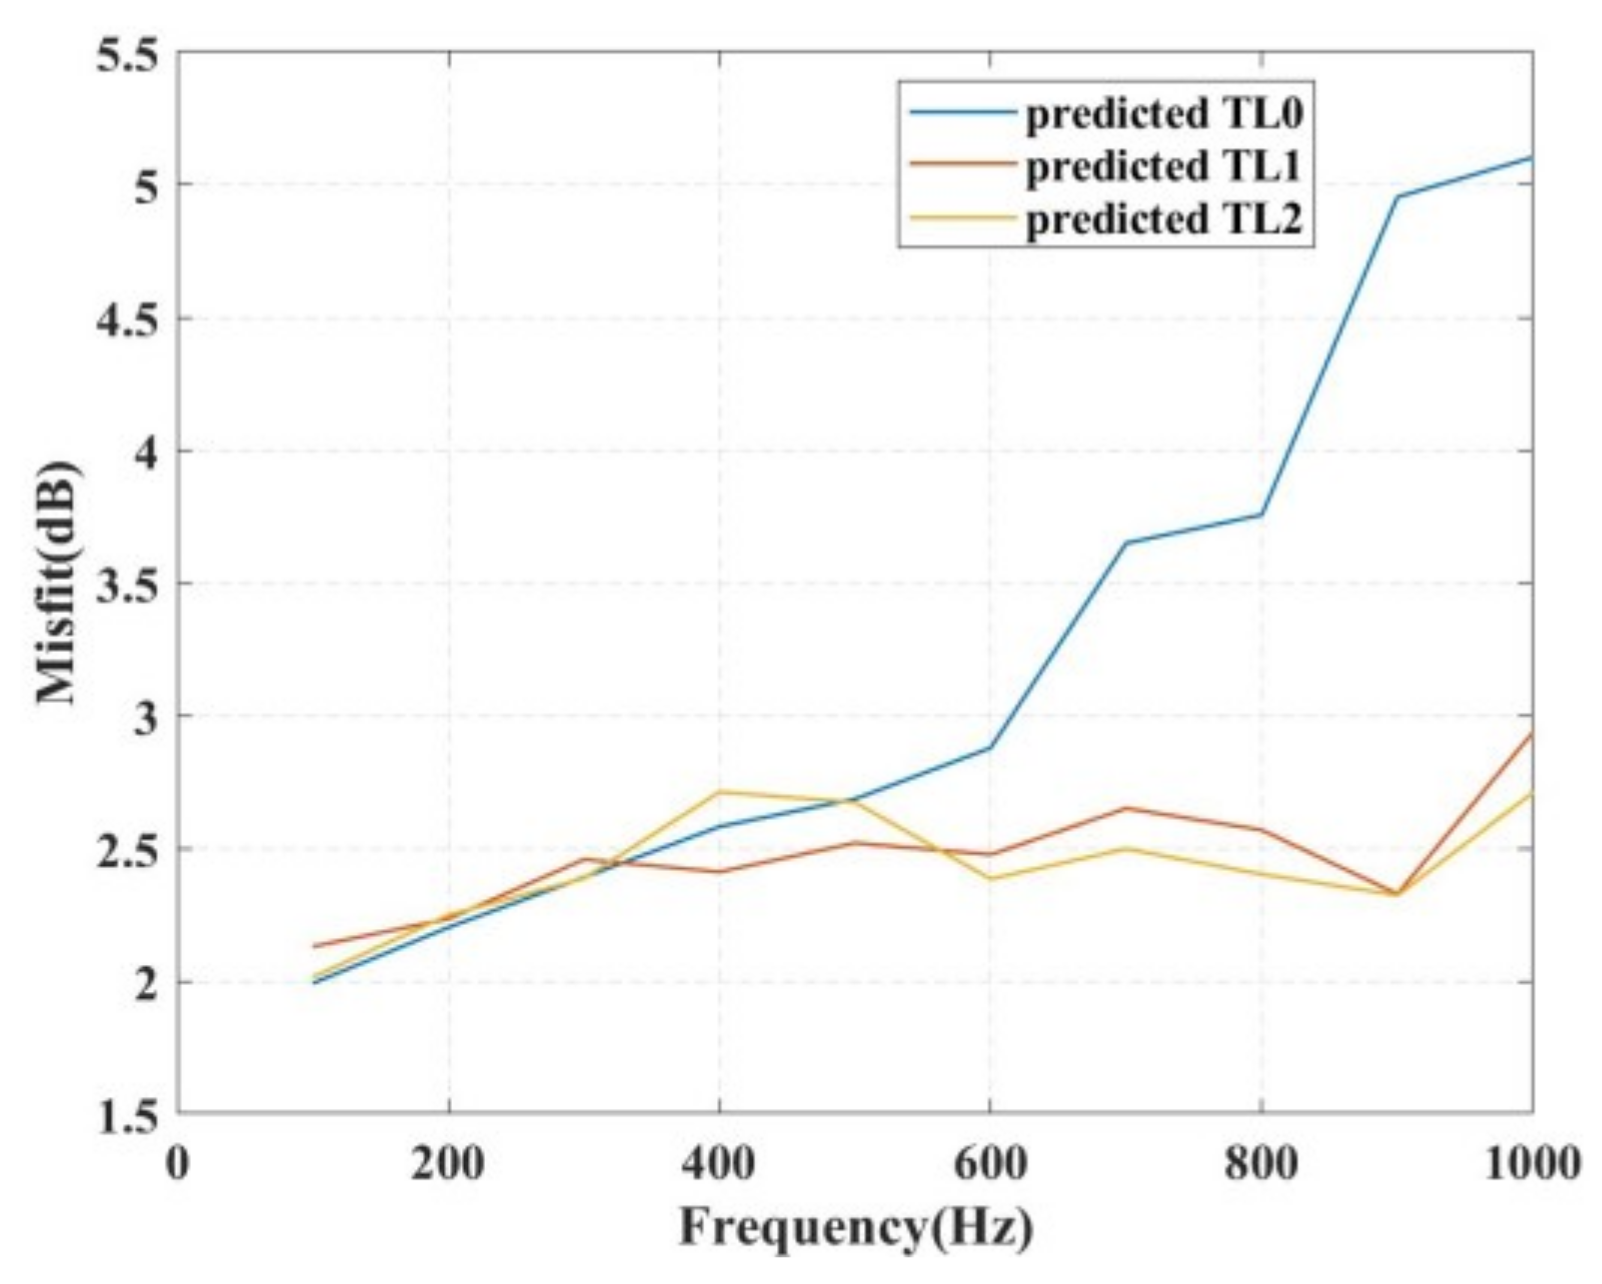
Table 2 compares TL1 and TL2 with TL0 (the inversion result from the range-independent seabed model). The average misfits for TL1 and TL2 are significantly smaller than that of TL0. Figure 19 displays the frequency-dependent misfits under these three models, clearly demonstrating that the range-dependent seabed sediment model can effectively reduce misfits above 500 Hz. The improvement becomes more pronounced at higher frequencies, reaching up to 2 dB (~40%) at 900–1000 Hz.
Regarding the transition interface positions in the latter two range-dependent sediment models, the rjMCMC inversion identifies an interface at 18.6 km, differing from our manually designated 22 km interface, which is determined based on the abrupt change position in experimental TL data received by V1 in Figure 5. Further examination of Figure 5d reveals that lower frequencies (600 Hz and 700 Hz) exhibit transitions near 22 km, while higher frequencies (800 Hz and 900 Hz) show changes around 18 km, suggesting a transition zone near 20 km. Although the two range-dependent models differ slightly in their sound speed profiles, both indicate a sediment transition near 20 km, where the surface sediment properties shift from a negative-gradient to a positive-gradient distribution. This transition leads to significant TL fading at high frequencies.
According to historical sediment data investigations [37], as shown in Figure 20, a sediment transition occurs at approximately 17 km (near the 1/3 point of the 50 km survey line close to station V1), where the sediment type changes from sand–silt–clay mixtures to predominantly silty sand. Sediment core samples from the two regions (designated as Area 1 near V1 and Area 2 farther from V1) show distinct sound speed profiles, as listed in Table 3. The measurements reveal a negative sound speed gradient in Area 1 and a positive gradient in Area 2, which is consistent with the inversion results and validates the methodology.

5. Conclusions

This study presents a novel geoacoustic inversion method integrating layered structure with range-dependent variations, based on the experimental data collected in the South China Sea during 2022 (using airgun signals: 100–500 Hz and explosive signals: 100–1000 Hz). The proposed approach significantly enhances the accuracy of broadband acoustic propagation modeling. Key findings are summarized as follows:
  • Layered Model Advantages and Extensibility.
    The TWTT-constrained layered seabed model reduces inversion parameter dimensionality through layered structure constraints. Using airgun signals (100–500 Hz) within a 20 km range, stable geoacoustic parameters (including sound speed and layer thickness) were inverted. While effective for low frequencies, the model could not explain the pronounced TL in 500–1000 Hz explosive signals. These findings indicate that while the layered model significantly enhances broadband inversion stability, its frequency applicability could be expanded through refinements such as incorporating horizontal variations. This improved approach can enable more accurate characterization of high-frequency acoustic propagation patterns.
  • Range-Dependent Enhancement.
    By incorporating horizontal sediment variations, we develop a range-dependent layered model that explains the observed significant high-frequency TL. A stepwise inversion strategy is implemented to effectively reduce high-frequency inversion uncertainty: (1) fixing the acoustic parameters of deeper layers, (2) manually segmenting the surface layer into two distinct zones, and (3) conducting sequential sound speed inversion for each zone.
  • Generalized Inversion via rjMCMC.
    The rjMCMC method automatically identifies sediment interfaces along the range, dynamically optimizing layered structures. This approach not only agrees with stepwise inversion but also provides a universal tool for complex seabed modeling, particularly in areas with pronounced lateral variations. Comparative tests demonstrate that the misfit of the range-dependent layered geoacoustic model in the frequency band of 500–1000 Hz is significantly lower than that of the traditional homogeneous layered geoacoustic model, which further expands the applicable frequency range of broadband geoacoustic inversion.
Our three-phase methodology—(1) dimensionality reduction through layered modeling, (2) high-frequency adaptation via range-dependent parameterization, and (3) automated inversion via rjMCMC—delivers an enhanced solution for shallow-water broadband geoacoustic modeling. The modular framework (layered, range-dependent, and Trans-D) not only overcomes current limitations in high-frequency TL prediction and bandwidth constraints but also establishes a foundation for multi-source data fusion and detection–communication integration, demonstrating potential for future applications.

Author Contributions

Conceptualization, J.K. and Z.P.; validation, J.K. and Q.W.; formal analysis, J.K.; investigation, Z.P.; resources, L.H.; writing—original draft preparation, J.K.; writing—review and editing, Z.P. and W.L. All authors have read and agreed to the published version of the manuscript.

Funding

This research was supported by the National Key Research and Development of China (Grant No. 2021YFF0501200).

Institutional Review Board Statement

Not applicable.

Informed Consent Statement

Not applicable.

Data Availability Statement

The original contributions presented in this study are included in the article. Further inquiries can be directed to the corresponding author.

Conflicts of Interest

The authors declare no conflicts of interest.

References

  1. Zhang, R.H. Water Acoustics Physics, Signal Processing and Marine Environment Close Integration is the Trend of Hydroacoustic Technology Development. Acta Acust. 2006, 25, 326–327. [Google Scholar]
  2. Li, F.H.; Sun, M.; Zhang, R.H. Geo-acoustic inversion for a vector sensor array. J. Harbin Eng. Univ. 2010, 31, 895–902. [Google Scholar]
  3. Dall’Osto, D.R.; Dahl, P.H. Geoacoustic inversion based on particle velocity. J. Acoust. Soc. Am. 2016, 139, 2125. [Google Scholar] [CrossRef]
  4. Chapman, N.R.; Shang, E.C. Review of Geoacoustic Inversion in Underwater Acoustics. J. Theor. Comput. Acoust. 2021, 29, 2130004. [Google Scholar] [CrossRef]
  5. Taroudakis, M.I.; Markaki, M.G. Bottom Geoacoustic Inversion by “Broadband” Matched-Field Processing. J. Comput. Acoust. 1998, 6, 167–183. [Google Scholar] [CrossRef]
  6. Yang, K.D. A Study on Matched Field Processing of Underwater Acoustic Signals. Ph.D. Thesis, Northwestern Polytechnical University, Xi’an, China, June 2003. [Google Scholar]
  7. Yang, J.; Jackson, D.R.; Tang, D. Mid-frequency geoacoustic inversion using bottom loss data from the Shallow Water 2006 experiment. J. Acoust. Soc. Am. 2012, 131, 1711–1721. [Google Scholar] [CrossRef]
  8. Zhou, J.X. Normal mode measurements and remote sensing of sea-bottom sound velocity and attenuation in shallow water. J. Acoust. Soc. Am. 1985, 78, 1003–1009. [Google Scholar] [CrossRef]
  9. Godin, O.A.; Katsnelson, B.; Tan, T.W.; Malykhin, A. Time warping and acoustic characterization of the seafloor in horizontally inhomogeneous ocean. J. Acoust. Soc. Am. 2019, 145, 1770. [Google Scholar] [CrossRef]
  10. Ecknold, S.P.; Masui, K.W.; Hines, P.C. Transmission loss measurements and geoacoustic sensitivity modeling at 1.2 kHz. J. Acoust. Soc. Am. 2008, 124, EL110–EL115. [Google Scholar] [CrossRef]
  11. Li, F.H.; Zhang, R.H. Bottom sound speed and attenuation inverted by using pulsed waveform and transmission loss. Acta Acust. 2000, 25, 297–302. [Google Scholar]
  12. Jiang, Y.-M.; Chapman, N.R.; Gerstoft, P. Short range travel time geoacoustic inversion with vertical line array. J. Acoust. Soc. Am. 2008, 124, EL135–EL140. [Google Scholar] [CrossRef]
  13. Jiang, Y.-M.; Chapman, N.R. Measurement of low-frequency sound attenuation in marine sediment. IEEE J. Oceanic Eng. 2010, 35, 70–78. [Google Scholar] [CrossRef]
  14. Michalopoulou, Z. Stochastic sediment property inversion in Shallow Water 06. J. Acoust. Soc. Am. 2017, 142, EL495–EL499. [Google Scholar] [CrossRef]
  15. Weng, J.B.; Li, F.H.; Guo, Y.G. Geoacoustic inversion based on near-field frequency-range interference pattern in deep water. Acta Acust. 2015, 40, 208–215. [Google Scholar]
  16. Bonnel, J.; Lin, Y.T.; Eleftherakis, D.; Goff, J.A.; Dosso, S.; Chapman, R.; Miller, J.H.; Potty, G.R. Geoacoustic inversion on the New England Mud Patch using warping and dispersion curves of high-order modes. J. Acoust. Soc. Am. 2018, 143, EL405–EL411. [Google Scholar] [CrossRef]
  17. Rajan, S.D.; Wan, L.; Badiey, M.; Wilson, P.S. Seabed Characterization Experiment: Analysis of Broadband Data. IEEE J. Ocean. Eng. 2022, 47, 531–540. [Google Scholar] [CrossRef]
  18. Kang, J.; Peng, Z.H.; He, L.; Li, S.H.; Yu, X.T. Low frequency inversion method based on multi-layer horizontal variation shallow seafloor model. Acta Phys. Sin. 2024, 73, 054301. [Google Scholar] [CrossRef]
  19. Zhou, J.X.; Zhang, X.Z.; Rogers, P.H. Resonant interaction of sound wave with internal solitons in the coastal zone. J. Acoust. Soc. Am. 1991, 90, 2042–2054. [Google Scholar] [CrossRef]
  20. Li, F.; Zhang, R.; Li, Z.; Peng, Z. Anomalous sound propagation due to bottom roughness. In Theoretical and Computational Acoustics 2001; World Scientific Publishing: Singapore, 2002; pp. 123–130. [Google Scholar]
  21. Liu, J.; Peng, Z.; Li, Z.; Luo, W.; Yang, X. Measurement and modeling of sound propagation over continental slope in the South China Sea. J. Acoust. Soc. Am. 2020, 147, EL209–EL214. [Google Scholar] [CrossRef]
  22. Ballard, M.S.; Lin, Y.T.; Lynch, J.F. Horizontal refraction of propagating sound due to seafloor scours over a range-dependent layered bottom on the New Jersey shelf. J. Acoust. Soc. Am. 2012, 131, 2587–2598. [Google Scholar] [CrossRef]
  23. Li, Z.; Zhang, R.; Peng, Z.; Li, X. Anomalous sound propagation due to the horizontal variation of seabed acoustic properties. Sci. China Phys. Mech. 2004, 47, 571–580. [Google Scholar] [CrossRef]
  24. Lu, L.; Ma, L.; Chen, Y. Effects of seabed model on low frequency sound propagation in shallow water. Tech. Acoust. 2007, 26, 787–793. [Google Scholar]
  25. Abbot, P.; Celuzza, S.; Dyer, I.; Gomes, B.; Fulford, J.; Lynch, J. Effects of East China Sea Shallow-Water Environment on Acoustic Propagation. IEEE J. Ocean. Eng. 2003, 28, 192–211. [Google Scholar] [CrossRef]
  26. Green, P.J. Reversible jump Markov chain Monte Carlo computation and Bayesian model determination. Biometrika 1995, 82, 711–732. [Google Scholar] [CrossRef]
  27. Dettmer, J.; Dosso, S.E.; Holland, C.W. Trans-dimensional geoacoustic inversion. J. Acoust. Soc. Am. 2010, 128, 3393–3405. [Google Scholar] [CrossRef] [PubMed]
  28. Hamilton, E.L.; Bachman, R.T. Sound velocity and related properties of marine sediments. J. Acoust. Soc. Am. 1982, 72, 1891–1904. [Google Scholar] [CrossRef]
  29. Collins, M.D. A split-step Pade solution for the parabolic equation method. J. Acoust. Soc. Am. 1993, 93, 1736–1742. [Google Scholar] [CrossRef]
  30. Collins, M.D. User’s Guide for RAM; Naval Research Laboratory: Washington, DC, USA, 1999. [Google Scholar]
  31. Jensen, F.B.; Kuperman, W.A.; Porter, M.B.; Schmidt, H. Computational Ocean Acoustics, 2nd ed.; Springer: New York, NY, USA, 2011; pp. 458–463. [Google Scholar]
  32. Liu, D.; Li, Z.L.; Liu, R.Y. Sound propagation in shallow water with periodic rough bottom. Acta Phys. Sin. 2021, 70, 034302. [Google Scholar] [CrossRef]
  33. Mecklenbräuker, C.F.; Gerstoft, P. Objective functions for ocean acoustic inversion derived by likelihood methods. J. Comput. Acoust. 2000, 8, 259–270. [Google Scholar] [CrossRef]
  34. Dosso, S.E.; Wilmut, M.J. Data uncertainty estimation in matched-field geoacoustic inversion. IEEE J. Ocean. Eng. 2006, 31, 470–479. [Google Scholar] [CrossRef]
  35. Bayes, M.; Price, M. An essay towards solving a problem in the doctrine of chance. Philos. Trans. 2003, 53, 370–418. [Google Scholar] [CrossRef]
  36. Dosso, S.E.; Dettmer, J.; Steininger, G.; Holland, C.W. Efficient trans-dimensional Bayesian inversion for geoacoustic profile estimation. Inverse Probl. 2014, 30, 114018. [Google Scholar] [CrossRef]
  37. Guangzhou Marine Geological Survey. Geological and Geophysical Atlas of the South China Sea; China Nautical Publications Press: Beijing, China, 2015. [Google Scholar]
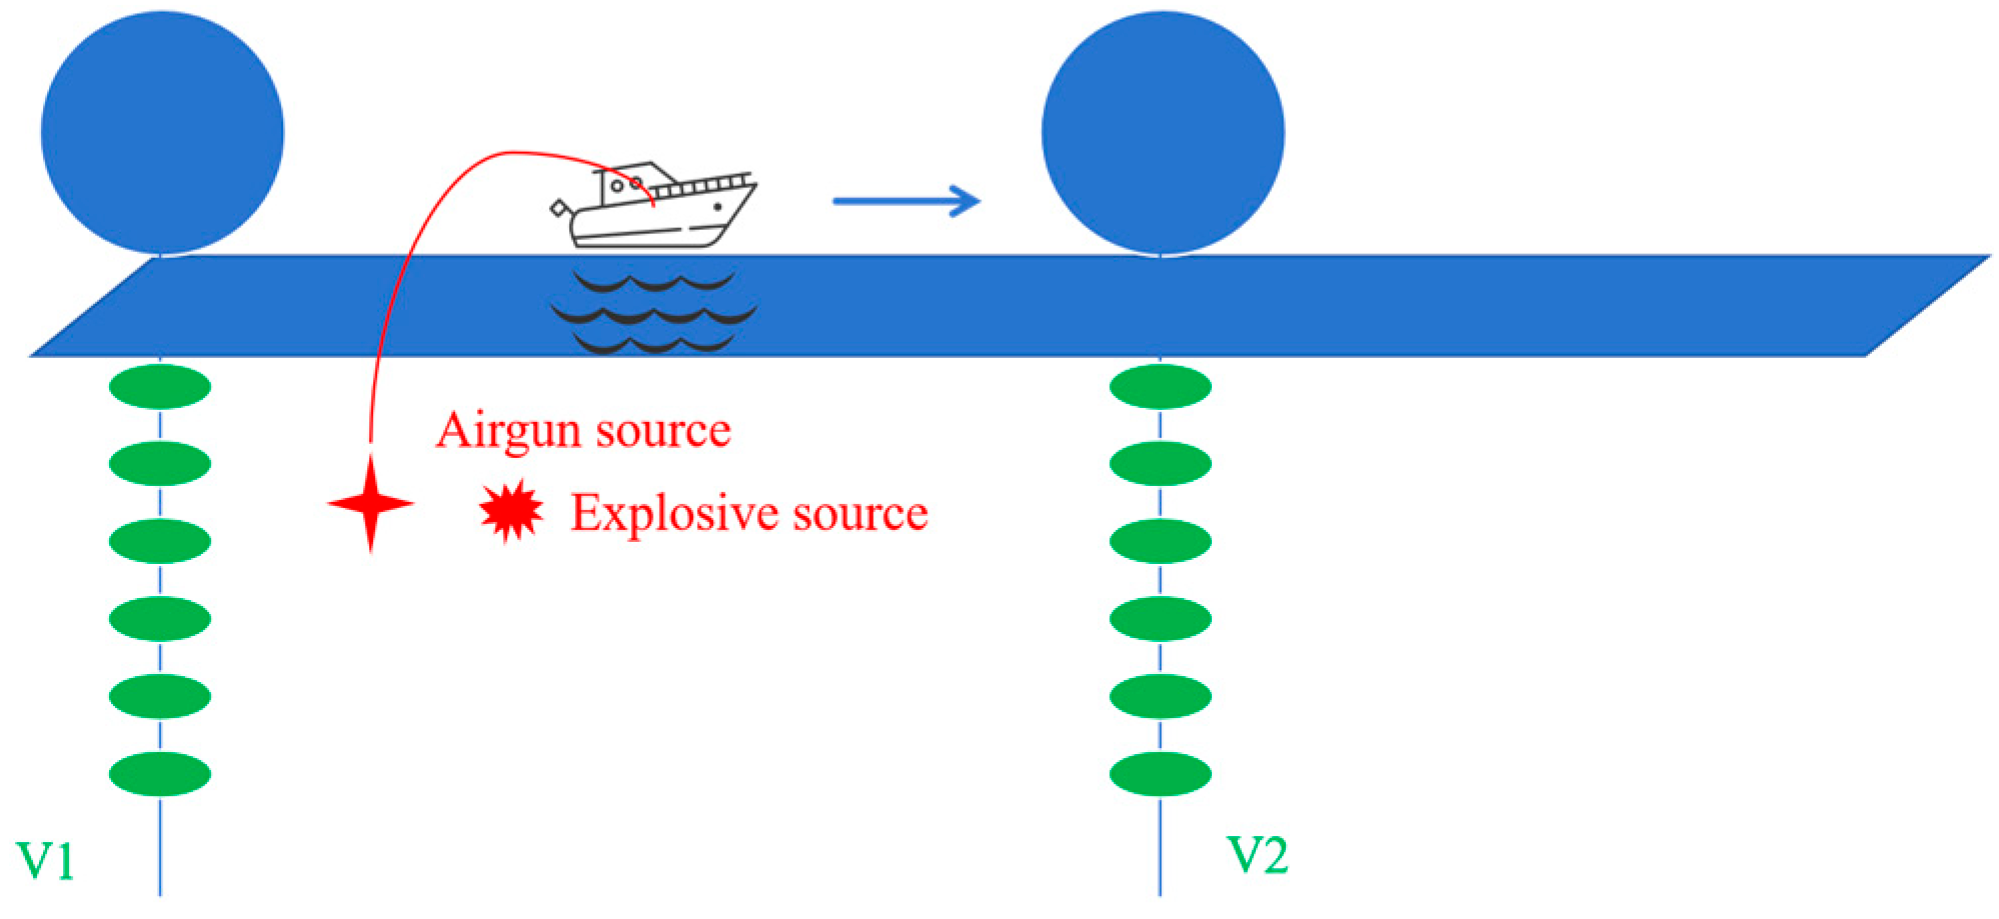
Figure 1. The configuration of the experiment.
Jmse 13 01563 g001
Figure 2. Seabed layering along the considered track, given in TWTT (ms). Two vertical linear arrays are, respectively, at range r = 0 km and r = 30 km.
Jmse 13 01563 g002
Figure 3. Time–frequency diagrams of the received signals at 10 km. (a) Airgun signal at 10 km; (b) explosive signal at 10 km. Color bars indicate energy (dB).
Jmse 13 01563 g003
Figure 4. Comparison of TL at different frequencies. The experimental TL is denoted by circles and the predicted TL by the line. The source depth is 7 m and the receiver depth is 52 m. (a) Low-frequency TL (100 Hz/400 Hz); (b) high-frequency TL (600 Hz/900 Hz).
Jmse 13 01563 g004
Figure 5. The TL of signals received by V1 and V2. (a) V2: 100 Hz and 400 Hz; (b) V2: 600 Hz and 900 Hz; (c) V1: 100–400 Hz; (d) V1: 600–900 Hz.
Jmse 13 01563 g005
Figure 6. Range-dependent sound speed profile and average sound speed profile. (a) Range-dependent sound speed distributions, with the red solid line indicating seabed depth; (b) sound speed, with the red line indicating averaged sound speed profile.
Jmse 13 01563 g006
Figure 7. TL with range-dependent and range-independent water sound speed profile.
Jmse 13 01563 g007
Figure 8. Measured seabed topography.
Jmse 13 01563 g008
Figure 9. Different seabed topographies.
Jmse 13 01563 g009
Figure 10. TL across different seabed topographies. (af) represent the TL results at different receiving depths.
Jmse 13 01563 g010
Figure 11. Seabed layering along the considered track, given in TWTT (ms). The red arrow indicates range-dependent variation in surface sediment geoacoustic parameters.
Jmse 13 01563 g011
Figure 12. Comparison of TL at different frequencies and received depths at V1. The experimental TL is denoted by red circles and the predicted TL by the blue line. (af) represent the TL results at different receiving depths and different frequencies.
Jmse 13 01563 g012
Figure 13. Parameter sensitivity at different frequencies.
Jmse 13 01563 g013
Figure 14. Simulated sampling history and distribution. (a) The number of interfaces; (b) misfit; (c) log (likelihood) values.
Jmse 13 01563 g014
Figure 15. Marginal probability density of inversion results under different sampling counts. The preset true values are indicated by red dashed lines and star symbols. (a) A thousand MCMC sampling iterations; (b) four thousand MCMC sampling iterations.
Jmse 13 01563 g015
Figure 16. Experimental sampling history and distribution. (a) The number of interfaces; (b) misfit; (c) log (likelihood) values.
Jmse 13 01563 g016
Figure 17. Marginal probability density of inversion results. Clear interface marked with a red solid line.
Jmse 13 01563 g017
Figure 18. Comparison of TL at different frequencies and received depths at V1. The experimental TL is denoted by red circles, the predicted TL1 by the blue line, and the predicted TL2 by the black line. (af) represent the TL results at different receiving depths and different frequencies.
Jmse 13 01563 g018
Figure 19. Comparison of misfit for three seabed models at different frequencies.
Jmse 13 01563 g019
Figure 20. Historical sediment distribution map along the survey line.
Jmse 13 01563 g020
Table 1. The true values of inversion parameters used in the simulation and their search bounds for inversion.
ParameterUnitSearch BoundsTrue Values
Number of interfaces k -[0; 6]2
The   upper   gradient   sound   speed   c j 1 m/s[1500; 1700][1550, 1580, 1605]
The   lower   gradient   sound   speed   c j 2 m/s[1500; 1700][1600, 1580, 1535]
Interface   position   r x j km[5; 45][12, 35]
Table 2. The inversion results of the three seabed models.
Seabed Models c 11 c 12 (m/s) c 21 c 22 (m/s) r x (km) φ (dB)
modeling range-independent sediment properties (TL0)1576none3.22
modeling range-dependent sediment properties via manual interface delineation (TL1)1610
1535
1535
1605
22.02.47
modeling range-dependent sediment properties via rjMCMC (TL2)1618
1522
1546
1576
18.62.43
Table 3. Sample results.
Area 1Area 2
DepthSound SpeedDepthSound Speed
D   (cm) c   (m/s) D   (cm) c (m/s)
0–4015710–401542.93
40–80159040–801558.55
80–120155080–1201528.57
120–1601535120–1501539.44
160–2001541150–1901564.67
190–2301517.44
230–2701588.24
230–3001564.69
300–3301565.55
330–3601616.20
360–4001568.53
Disclaimer/Publisher’s Note: The statements, opinions and data contained in all publications are solely those of the individual author(s) and contributor(s) and not of MDPI and/or the editor(s). MDPI and/or the editor(s) disclaim responsibility for any injury to people or property resulting from any ideas, methods, instructions or products referred to in the content.