Article

Arctic Wave Climate Including Marginal Ice Zone and Future Climate Scenario

1
Fisheries and Oceans Canada, Bedford Institute of Oceanography, Dartmouth, NS B2Y 4A2, Canada
2
Department Physics and Atmospheric Science, Dalhousie University, Halifax, NS B3H 4R2, Canada
3
The School of Mathematical and Physical Sciences, University of Newcastle, Callaghan 2308, Australia
*
Author to whom correspondence should be addressed.
J. Mar. Sci. Eng. 2025, 13(8), 1562; https://doi.org/10.3390/jmse13081562
Submission received: 21 May 2025 / Revised: 24 June 2025 / Accepted: 30 June 2025 / Published: 14 August 2025

Abstract

This study examines the variation and trends in wave parameters across the Arctic, including the marginal ice zone (MIZ), by comparing historical data (1980–2009) with projections for a future climate scenario (2070–2099) as outlined by the IPCC. Utilizing the WAVEWATCH III (WW3) numerical wave prediction model, we simulate the wave climate for these periods, incorporating advanced parameterizations to account for wave-ice interactions within the MIZ. Our analysis focuses on the extreme values of significant wave heights (Hs), mean wave periods (T0), and dominant mean wave direction (MWD), calculated for both winter and summer seasons. To assess changes in wave climate under future climate scenarios, we first use a similarity matrix, applying the kappa variable and cell-by-cell numerical comparison methods to assess model congruence across different conditions. We also follow a standard approach, by assessing the extreme wave conditions for 20 and 100-year return periods using standard stochastic models, including Gumbel, exponential, and Weibull distributions.

1. Introduction

The study of the Arctic climate and associated extremes has gained unprecedented importance due to climate change, diminishing sea ice, and an increase in societal activities such as marine transportation, potential fisheries, resource development, recreational use, eco-tourism, and the expansion of coastal infrastructure. The vulnerability of low-lying coastal areas, like those in the southern Beaufort Sea and Mackenzie Delta, to strong Arctic cyclones—exemplified by the Millennium Storm in 1999 [1]—underscores the necessity of understanding Arctic wave climate dynamics. Sea ice thickness, varying from about one meter for first-year ice to several meters for multi-year ice, and its extensive coverage during winter, significantly influences the Arctic weather, climate, and wave regimes.
Arctic wave climate and climate change are topics that are the focus of several recent studies. For example, the future wave climate in the Arctic has been simulated [2] by using WW3 wave model, driven by a regional climate HIRHAM, following an earlier IPCC climate scenario, SRES-A1B, suggesting that significant wave heights and their extremes may increase over different inner Arctic regions due to changes in sea ice and winds, during the 21st century, and that slight reductions in wave heights occur for the Atlantic Arctic sector and the Barents Sea. The complexity of the Arctic wave climate response to climate changes is further elucidated by a previous study [3], using surface winds and sea ice concentrations from five CMIP5 (Coupled Model Intercomparison Project Phase 5) climate models following the RCP8.5 climate scenario, for historical (1975–2005) and future (2081–2010) periods. These studies have suggested that annual maximum significant wave heights are projected to increase by as much as 6 m offshore and as much as two or three times, compared to corresponding historical values (1979–2005) along some of the coastlines, driven by changes in autumn storms.
However, there are ongoing research gaps. One is the inadequate representation of the marginal ice zone (MIZ), particularly wave-ice interactions. For example, wave attenuation rates in MIZ sea ice vary widely among models, due to unresolved physics (e.g., ice flexure, wave scattering from ice floes, local wind-wave generation among floes of the MIZ). In this paper we apply only 4 possible formulations of wave-ice interactions. They are also the topics of our earlier studies [4,5,6,7]. But they are relatively simple formulations of a complex problem, that of modeling surface waves in the MIZ.
In terms of model validation, another gap is data scarcity and observational limitations. There are spatial and temporal data gaps. Satellite altimetry misses latitudes > 82° N, and nearshore areas (<20 km from coast). The SWOT satellite is limited to areas below 78° N. Thus, high-latitude Arctic areas represent data void areas, for wave-height validation. In situ measurements (e.g., buoys) are very sparce. There are also gaps in the sampling of extreme events such as polar lows, which are becoming increasingly frequent in the Arctic [8]. For wave climate studies, extreme-value analysis is limited by a lack of systematic observations.
Additional gaps are related to model deficiencies in regional or seasonal dynamics. Spatial resolution cannot resolve nearshore bathymetry (which is often poorly understood in the Arctic) or features like landfast ice, leading to errors in simulations of waves and ocean currents. There are seasonal biases because autumn/winter projections tend to underrepresent polar cyclones, and their associated wind fields. Natural variability, such as interannual oscillations like North Atlantic Oscillation (NAO), El Niño—Southern Oscillation (ENSO), etc., Pacific Decadal Oscillation (PDO), etc., complicate climate trends, but climate models cannot identify and separate these forced changes from noise.
This paper evaluates four wave-ice scattering models formulated within the WW3 operational wave model, using wind and ice conditions from regional climate projections, as detailed by [4,6,7]. Thus, we estimate future climate change impacts on the Arctic Ocean and MIZ, following selected IPCC climate scenarios.
Addressing the challenge of comparing wave maps generated by these models, we move beyond subjective visual comparisons to employ two advanced techniques for objective map comparison and spatial relationship quantification. These methods are crucial for understanding the spatial intricacies of wave climate data from numerical simulations, following pervious methodologies [9,10].
This research not only provides projections of possible changes in the Arctic wave climate regime under future climate scenarios—with implications for shoreline morphology, aquatic ecosystems, and marine activities—but also innovates by application of explicit wave-ice interaction models. Through a dual approach, we first use a similarity matrix, applying the kappa variable and cell-by-cell numerical comparison methods to assess model congruence across different conditions. Secondly, we adopt the more traditional approach to evaluate the wave climate in terms of mean wave direction (MWD), significant wave height (Hs), mean wave period (T0), and extreme values for 20 and 100-year return periods.

2. Methodology

2.1. Study Area

We focus on a sub-domain of the Arctic Ocean, delineated by dotted black lines in Figure 1. This sub-domain is defined by coupled ice-ocean model (CIOM) simulations by [11]. CIOM is following the Princeton Ocean Model (POM, [12]) and a multicategory ice model [13]. Previous studies [11,14,15] show successful CIOM simulations of Arctic Ocean climate, including sea surface height, etc., and pertinent to this paper, sea ice. Whereas part of this area is permanently covered by multi-year ice, there are also large regions where seasonal sea ice occurs, often near coastal regions. The effects of climate warming are increasing losses of multi-year ice, and larger marginal ice zones (MIZs), particularly in the summers and also in spring and fall seasons. Additional effects are changes in marine storms, and the winds that generate and drive the surface waves. For surface waves, most of this area can be considered deep water.

2.2. Models and Data

2.2.1. Winds

Recent decades have witnessed profound transformations in the Arctic, with projections indicating the possibility of ice-free summers by the 2050s, according to IPCC climate warming scenarios. These environmental shifts are likely to influence extreme cyclonic events, wind patterns, and air–sea interactions significantly. However, it is important to note that [11] coarse resolution of General Circulation Models (GCMs) often lead to an underestimation of the frequency and intensity of these relatively small-scale systems. Consequently, this underestimation results in inaccuracies in the projections for marine winds, the poleward transport of energy into the Arctic, and associated surface heat fluxes and radiation.
In response to these challenges, our study utilizes a high-resolution configuration of the Polar version of the Weather Research and Forecasting model 3.6 (Polar WRF3.6) in its regional climate mode. This model is driven by the lower-resolution global climate model, HadGEM2-ES, adhering to the IPCC Fifth Assessment Report (AR5) climate scenarios RCP8.5 and RCP4.5 for the period 1970–2099, with a spatial resolution of 25 km × 25 km. This follows our recent studies on the winter Beaufort High and the impacts of climate change and on Arctic winter cyclones, following selected warming climate scenarios of AR5 [16,17]. For the contemporary climate period (1980–2009), validation is achieved through comparison with ERA5 reanalysis data. The Polar WRF model demonstrates a marked improvement in simulating the frequency and intensity of cyclones and their associated wind fields when compared with projections from HadGEM2-ES [17].
It should be noted that although climate scenarios from AR5 have similarities with corresponding scenarios of AR6, the latter are now the state-of-the-art models for future climate projections and should be used in ongoing studies. In particular, whereas the RCPs in AR5 focus solely on radiative forcing levels (e.g., RCP8.5 assumes 8.5 W/m2 by 2100) without prescribed socioeconomic drivers, the SSPs in AR6 integrate socioeconomic drivers (e.g., population growth, GDP, technology changes) with assumed mitigation efforts, thereby obtaining RCP-like forcing levels. Thus, SSP5-8.5 combines high fossil-fuel usage with assumed 8.5 W/m2 radiative forcing by 2100. Another difference is that the SSPs use the newer climate models of CMIP6, with improved representations of aerosols, carbon cycles, and feedback mechanisms, thereby leading to different regional projections. In terms of implications for wave heights and high-resolution downscaling, a previous study [18] suggests that SSP5-8.5 models can project up to 30% more frequent extreme storms (>8 m) due to higher winds and longer ice-free seasons, compared to related RCP-based projections.
Under the RCP8.5 scenario, projections for the late 21st century (2080–2099) indicate a weakening of the atmospheric surface circulation associated with the Beaufort High during winter (December–February), coinciding with an increase in cyclonic activity over the west-central Arctic. Conversely, during summer (June–August), the Beaufort High is projected to strengthen, leading to elevated sea-level pressure over the polar continents. Notably, while the overall frequency of summer Arctic cyclones does not significantly change, their intensities are projected to diminish in the Polar WRF simulations, representing a notable improvement over the future climate projections of the coarser-resolution HadGEM2-ES model.
In scenarios RCP4.5 and RCP2.6, these atmospheric circulation trends are consistent but exhibit less pronounced changes. The underlying mechanisms driving these responses are the subject of two manuscripts, one of which has appeared [19] and another is currently under preparation. This paper focuses on an extreme climate condition, employing wind data from the RCP8.5 scenario to drive the WW3 model, containing four distinct sub-models to simulate MIZ wave-ice interactions.

2.2.2. Waves

Wave simulations in this study are conducted using the WaveWatch III (WW3) model, an open-source third-generation wave model renowned for its comprehensive capabilities in global, regional, basin-scale, shelf-scale, and coastal applications. The WW3 model’s physics and characteristics are thoroughly documented by the [20], highlighting its adaptability across various scales through appropriate numerical and physical parameterizations. This research utilizes version 5.16 of the model. Recent advancements in parameterizations for Marginal Ice Zone (MIZ) wave-ice interactions have been detailed [4,5], and concisely summarized in the following section.
Our implementation of WW3 spans the entire Arctic region north of 56° N, configured on a curvilinear grid that ensures equidistant spacing at a 12 km resolution. The model employs a directional resolution of 10° across 29 frequency bins, which are logarithmically spaced from 0.04118 Hz to 0.5939 Hz, with a global time step of 600 s. Parameterizations for input wind energy and dissipation, specifically the ST4 source term formulation, follow the established guidelines [20,21,22] building on previous foundational work [23]. This paper’s climate simulations cover a 30-year historical period from 1980 to 2009 and a future scenario from 2070 to 2099 under the RCP 8.5 scenario, previously described [24].
For seasonal scale analysis, the study calculates the percentage occurrence (Occ) of specific wave parameters within each grid cell for each season, across both historical and future climates. The occurrence is defined as:
O c c   ( % ) = m n × 100
where ( m ) represents the count of waves within a specified range (e.g., significant wave heights between 2 and 3 m) for a given season, and ( n ) is the total count of waves recorded in the dataset for that season. This approach applies uniformly across all seasons and both climate periods. With 30-year simulations and 6-hourly model outputs, n equals 10,950 for each season, ensuring a comprehensive temporal analysis of wave activity under varying climate conditions.

2.2.3. Wave-Ice Interaction Models

This study focuses on the Arctic wave climate, emphasizing the parameters relevant to wave and sea ice floe interactions within the Marginal Ice Zone (MIZ). The MIZ is notable for its fragmented ice edge, consisting of ice floes that can bend and move, characterized by great diversity in shape, size, thickness and ice properties. We employ four relatively simple models to analyze wave-ice interactions in the MIZ, following the mathematical descriptions by [4]. These models are selected for their methodological compatibility, each incorporating consistent MIZ parameters like floe size, thickness, and concentration.
The first model, IC0, adopts a basic approach by linearly scaling wave heights from open water conditions, where ice concentrations are about 10% or lower, to dense pack ice regions, where concentrations exceed 90%. The BIO model, drawing on the seminal works of [5,25], and [26] from the Bedford Institute of Oceanography, treats ice floes as rigid bodies. The IC2 model combines [27]’s framework with the IS2 scattering algorithm by [23], using for shear and viscosity that are default values from the WW3 model. The fourth model, Meylan14, offers a simplified approach to modeling wave-ice interactions based on wave period, which was later refined [28].
A fifth model, MBS, advances the modeling by incorporating a comprehensive scattering kernel for wave-ice interactions, allowing for the flexibility of ice floes. This approach, developed from previous research [4,26,29,30], conserves energy and captures all directional scattering. While the MBS and BIO models bear similarities, the MBS model assumes flexible ice floes with minimal submergence, in contrast to the BIO model’s rigid, partially submerged floes. The performance of these models, including their validation, is confirmed extensively through hypothetical test simulations [6] and real-world data from the Sea State experiment [7].

2.2.4. Sea Ice

Sea ice plays a crucial role in the study of the Arctic’s wave climate, climate change, and the modeling of wave-ice interactions within the MIZ. It influences the Arctic environment by reducing surface winds and scattering and attenuating waves. For the WW3 simulations, sea ice data spanning from 1970 to 2099 is constructed by a well-tested coupled ice-ocean model detailed by [11], with a spatial resolution of 0.29° by 0.25°. This model, which builds on the Princeton Ocean Model [12] and incorporates a detailed multi-category ice model [13,31], has proven effective in analyzing the effects of climate change on the Beaufort Sea and Arctic Ocean, including variations in sea surface height and freshwater content [14]. Comparisons with global HadleyGEM-ES2 data, as conducted by [11], affirm the reliability of these projections.
To demonstrate the anticipated expansion of the Marginal Ice Zone (MIZ) by the century’s end, we present seasonal wave climate maps for the summer (mid-July to mid-October) and winter (mid-January to mid-April) periods, comparing current conditions with those projected under the future climate scenarios. We employed the four wave-ice interaction models to simulate the MIZ and conducted monthly analyses to more clearly illustrate the effects of climate change on the MIZ, though these results are omitted here to maintain brevity. Additionally, we apply two comparison methods to highlight potential similarities, as detailed in subsequent sections.

2.2.5. Kappa Statistic

The kappa statistic is widely utilized to evaluate the agreement between two models or to gauge the congruence between observed and modelled outcomes. Its application spans various disciplines, including geography, medicine, and computer science, as evidenced by numerous studies [5,32,33,34]. The method employs a direct comparison of maps on a cell-by-cell basis, evaluating whether corresponding cells match. This approach generates a comparison map that visualizes the spatial agreement, without requiring any predefined parameters. Despite its simplicity, the resulting “fraction correct” metric, derived from the proportion of matching cells to the total, can be misleading. It may inaccurately suggest higher similarity for maps with fewer or unevenly distributed categories.
An illustrative example contrasts models predicting duck nesting sites and mosquito presence in a park. A model inaccurately predicting a single nest location in a hundred may still score a misleadingly high “fraction correct” of 0.98 due to the majority of cells being correctly identified as “non-nest.” Conversely, a more accurate model for mosquito presence, predicting 80% of locations correctly, might only achieve a 0.8 score due to the balanced distribution of categories. This discrepancy highlights the kappa statistic’s advantage in offering a more nuanced measure of agreement by adjusting the “fraction correct” to account for expected accuracy based on category distribution.
The kappa statistic encapsulates two dimensions of similarity: quantity and location. “quantity” represents the distribution of each category across the map, while “location” pertains to the spatial arrangement of these categories. To dissect the kappa statistic further, it is divided to Kappa Histo (K_Histo) and also Kappa Location (K_Loc), with the overall kappa being the product of these two components. K_Histo reflects the proportional representation of categories, whereas K_Loc focuses on their spatial distribution. These calculations are grounded in the Contingency Table, which outlines the cross-distribution of map categories, allowing for detailed analysis of both overall and category-specific agreement, using ‘Cell-by-Cell Comparison Methods’.
The algorithm employed for cell-by-cell numerical comparison in this study calculates the absolute difference between values. Specifically, it utilizes the formula |b − a|, where “b” represents the wave parameter’s value on one map, and “a” denotes the equivalent value on another map.

2.2.6. Extreme Value Analysis of Wave Climate Time Series (EVA)

The evaluation of vulnerability risks in coastal regions primarily hinges on the extreme value analysis of time series data, including variables such as wave heights, over n-year return periods. The range for n varies from 2 to 10,000 years, tailored to specific applications [35]. Despite the introduction of numerous statistical approaches for assessing peak extreme values, this study focuses on three primary methods: Weibull, Exponential, and Gumbel, which are the most prevalent in the fields of oceanography and coastal engineering. Additionally, this research employs the Chi-squared and Kolmogorov–Smirnov tests to assess the suitability of statistical techniques and to gauge the goodness-of-fit for various distribution and evaluation method pairings. Furthermore, Monte Carlo simulations are utilized to determine the uncertainty associated with quantile estimates [36].

2.2.7. Climate Change and Variability in Extreme Value Analysis

Understanding wave regimes in specific geographical areas is crucial for a wide range of engineering and research applications, including marine and naval architecture, coastal hazard evaluations, and associated biological research. Additionally, some studies presuppose that wave regimes might remain unchanged in future climate warming scenarios [37]. While such assumptions may be valid for marine structures and installations with short operational lifespans or temporary purposes, it is imperative that structures intended for long-term use also consider possible climate change projections in their design and construction. Recent research indicates that wave regimes across the globe are likely to be significantly impacted by climate change [24,38,39,40,41,42,43]. This paper presents calculations of extreme values for both significant wave height (Hs) and also peak period (T0) for both 20- and 100-year return periods, under current and projected future climate conditions.

3. Results

3.1. Spatial-Temporal Similarities Between Models for Wave—Ice Interactions

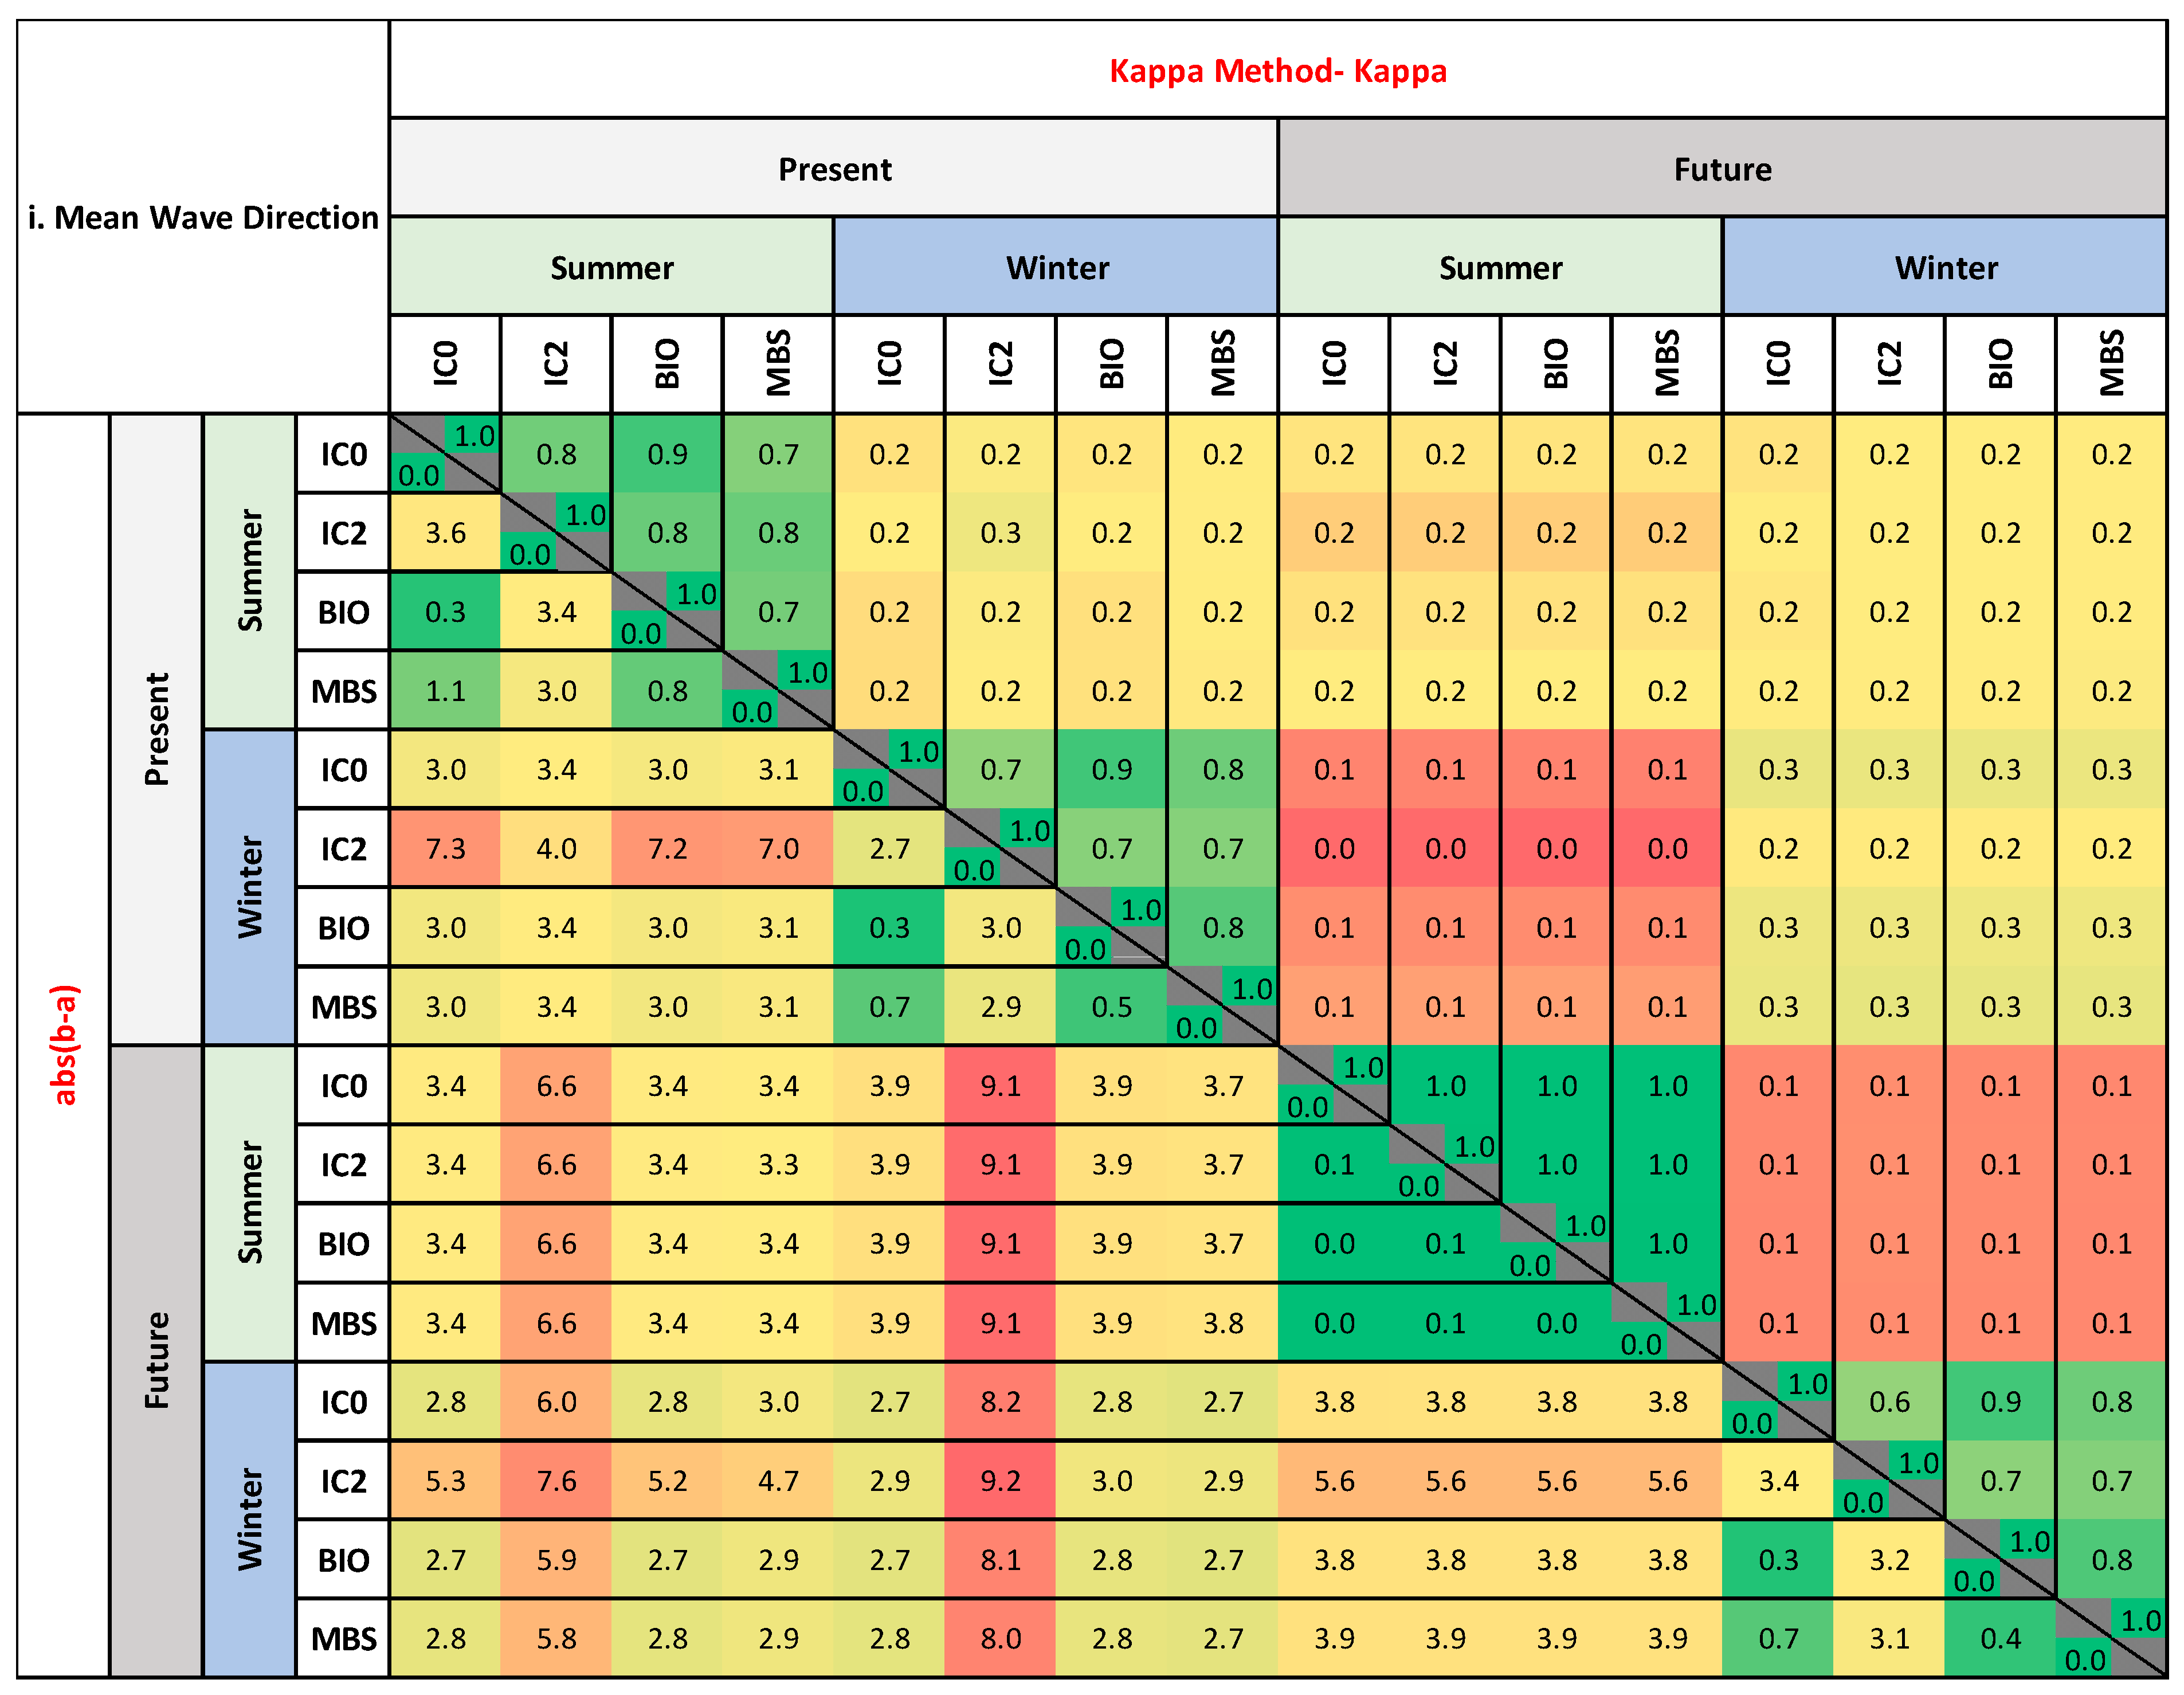
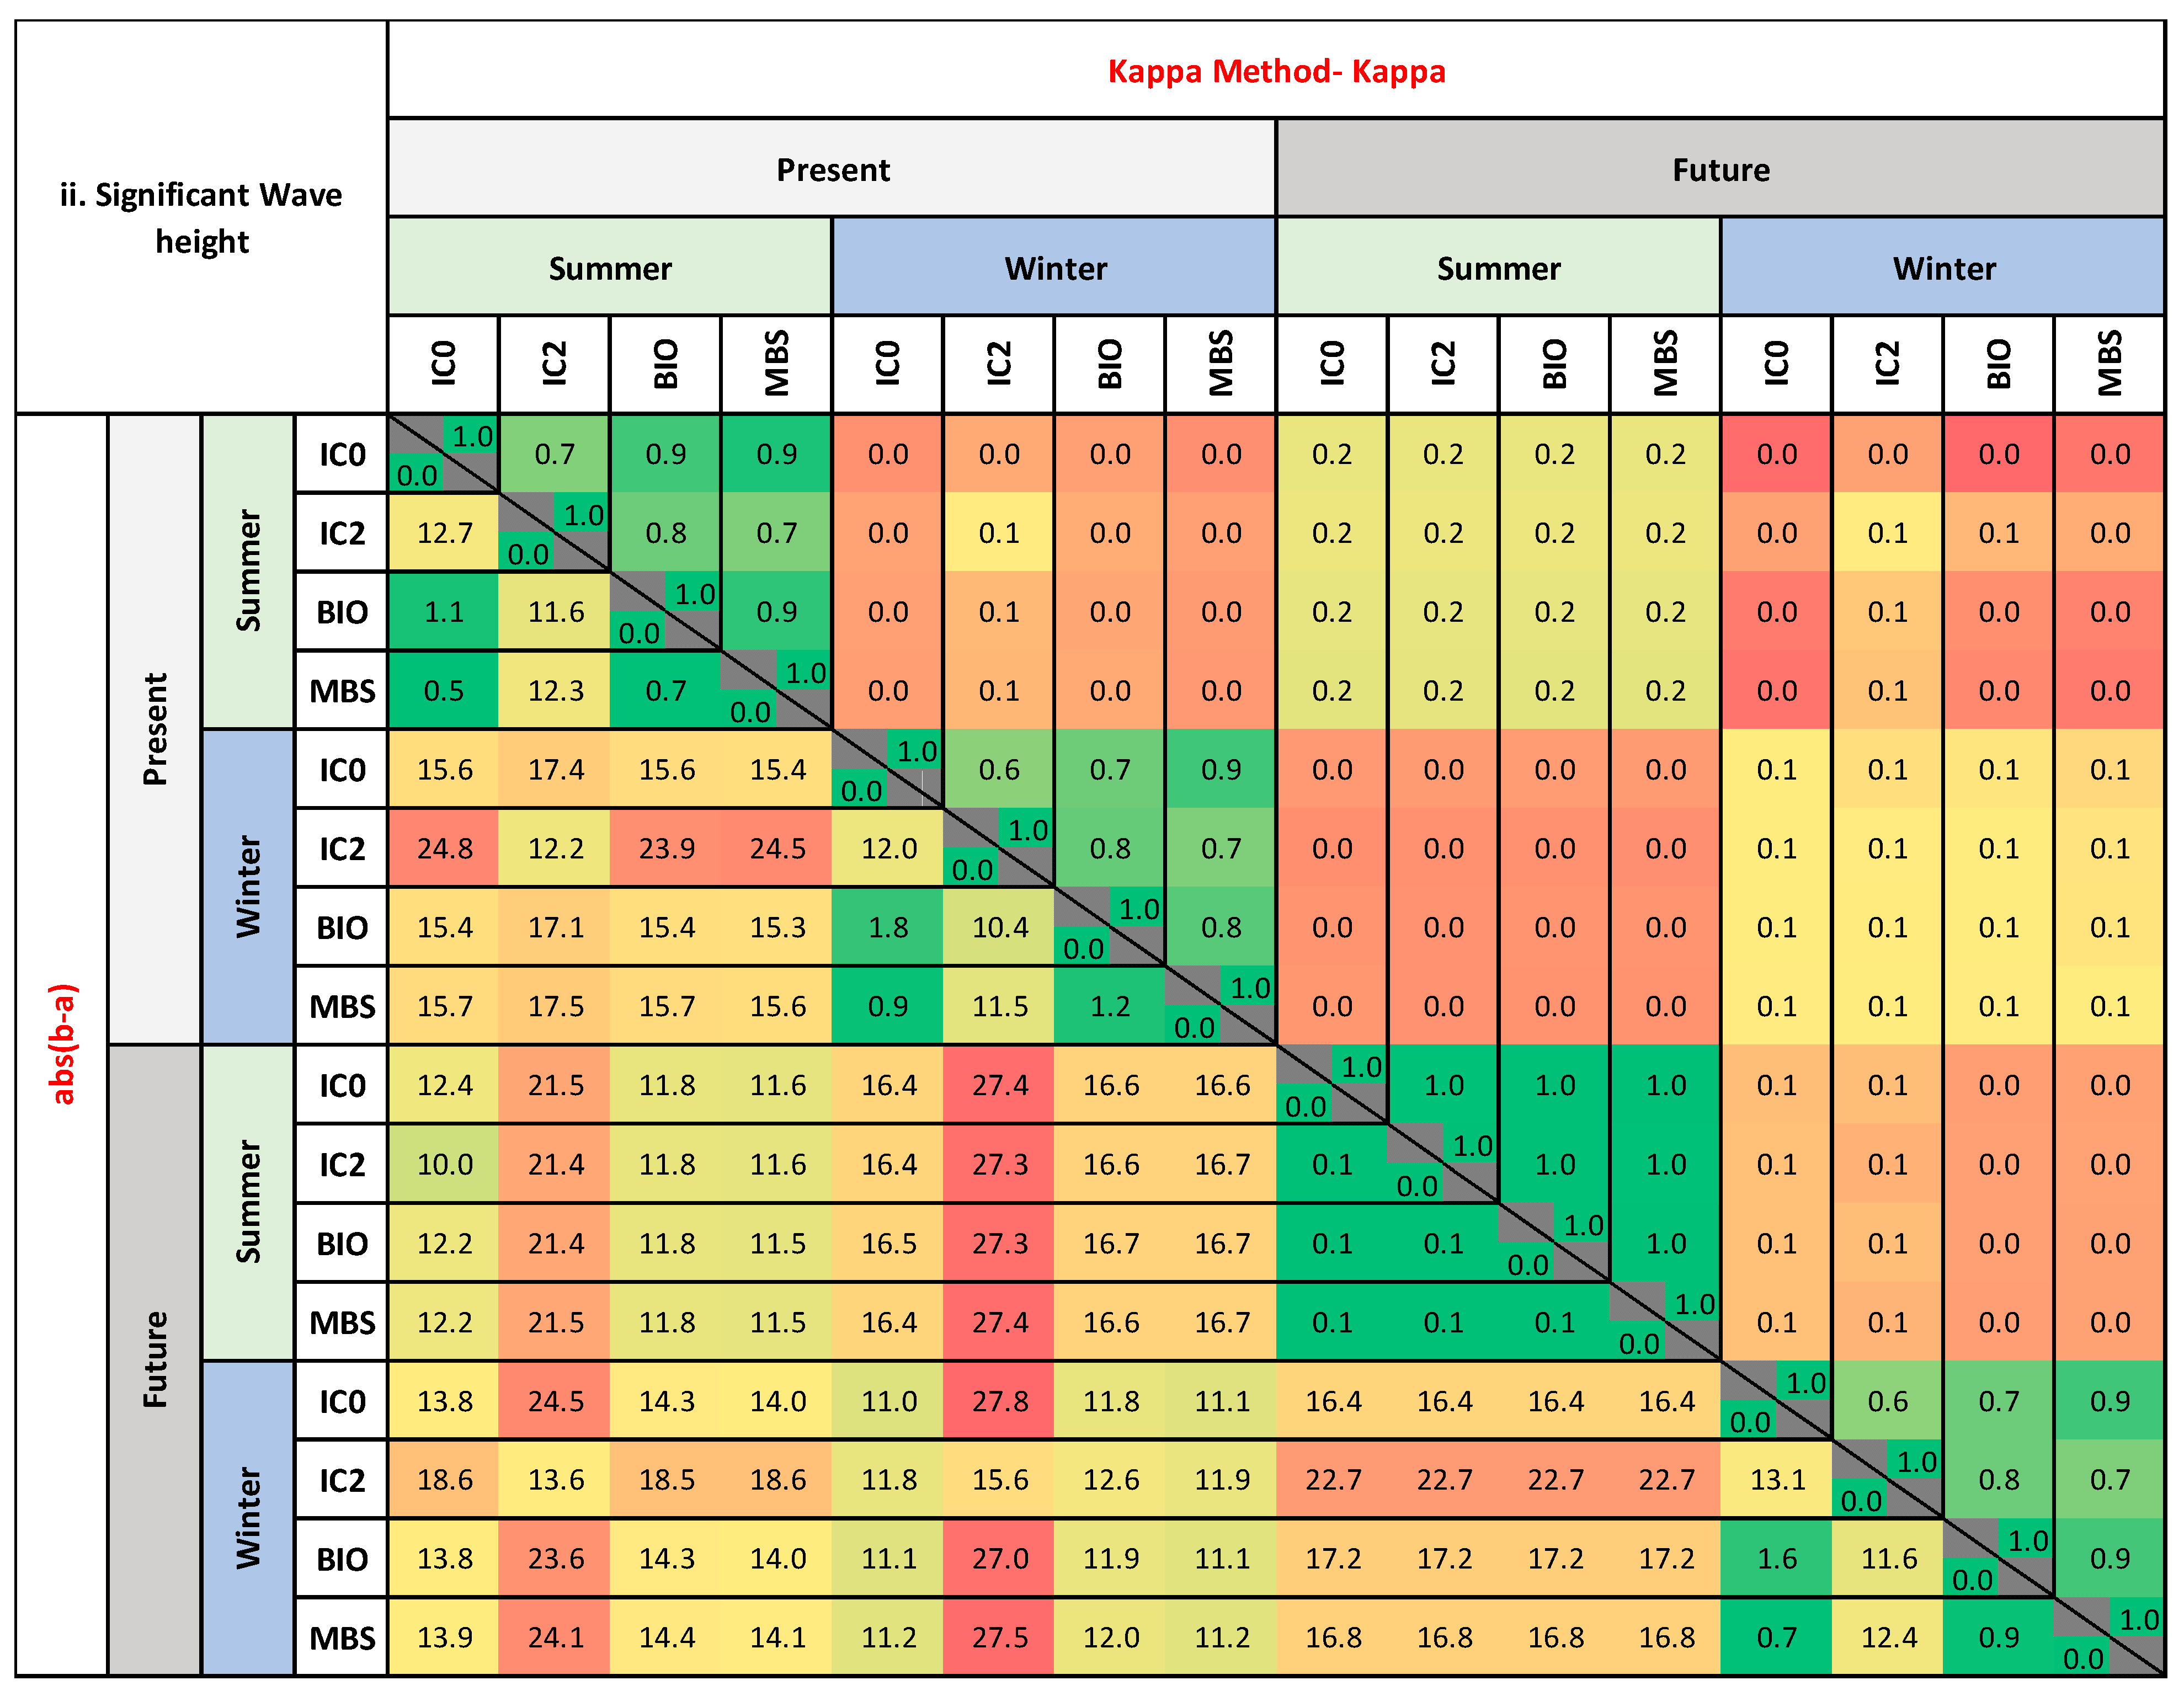
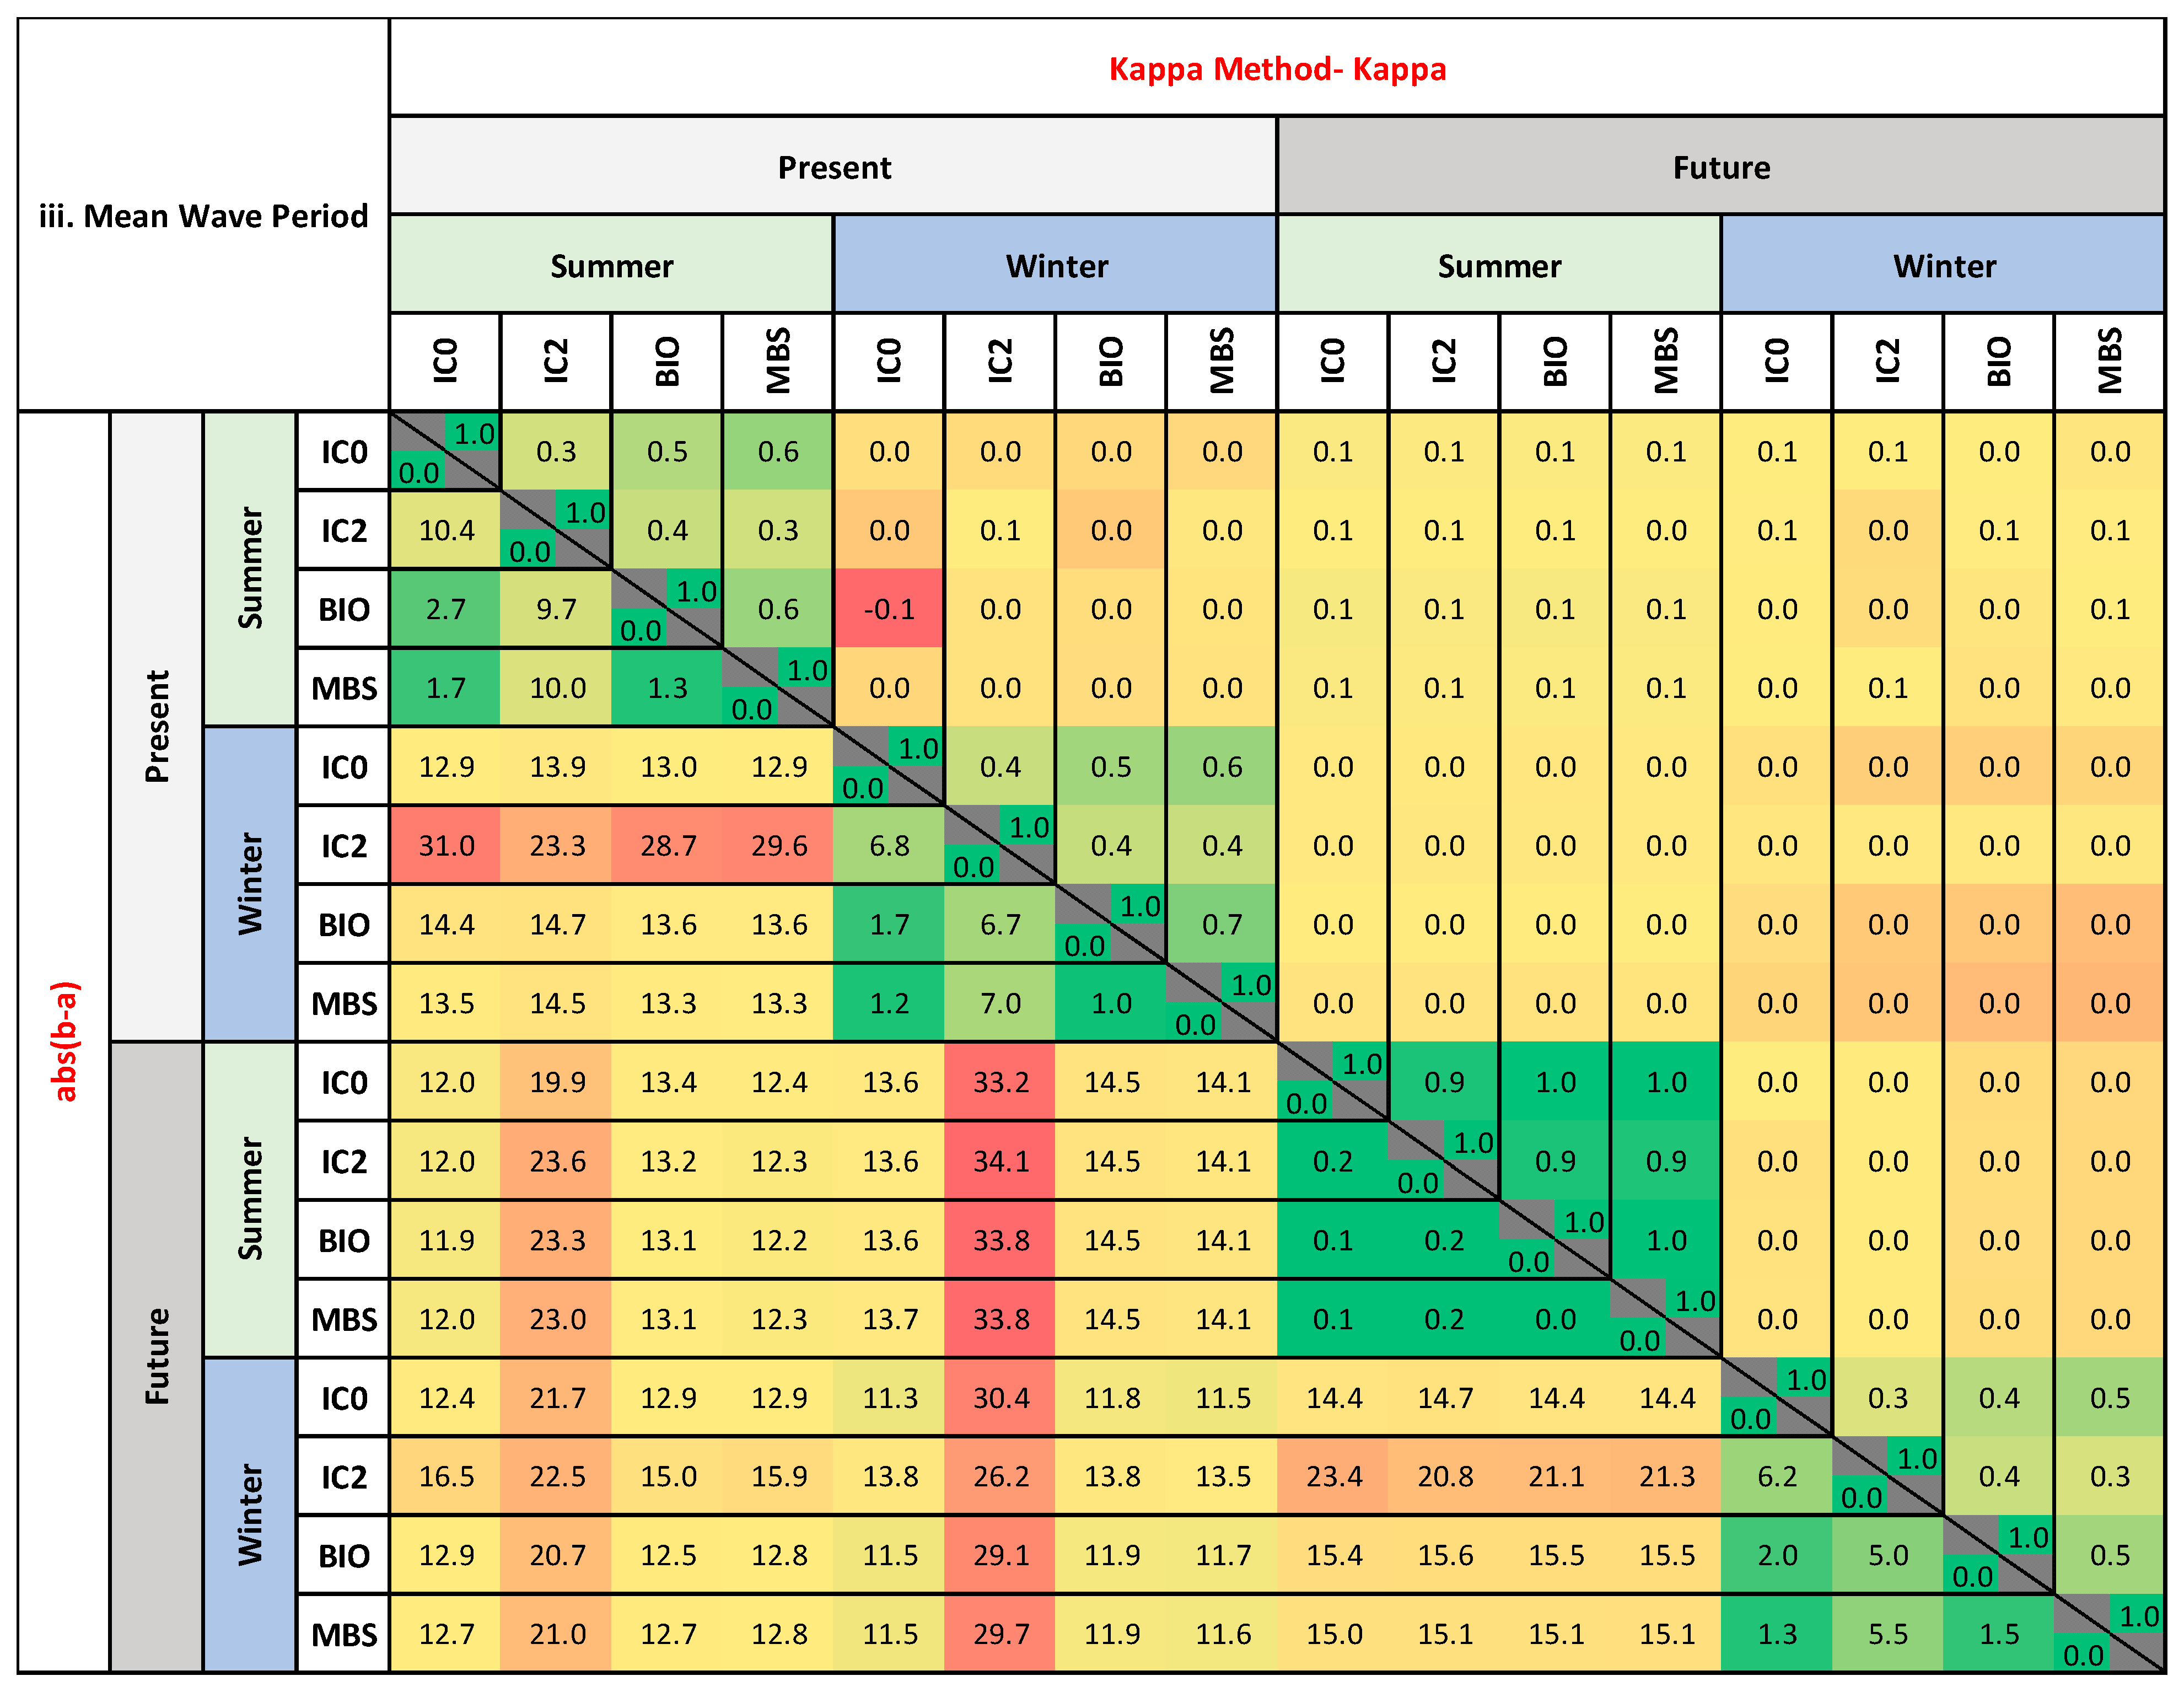
Spatial-temporal similarity matrices are used to illustrate the correlation among different MIZ models for wave-ice interactions across present and future climates for both winter and summer seasons. Each cell within these matrices represents a similarity index between two distinct parameters, as depicted in Figure 2. These parameters are mean wave direction (MWD), significant wave height (Hs), and also mean wave period (T0), considered under current and future climates, including a climate change scenario (RCP 8.5, as per IPCC 2013 guidelines). For instance, the kappa similarity index for comparing mean wave direction between summer in the present climate (IC0) and winter in a future climate (IC2) is shown as 0.2 in Figure 2, panel (i). The matrices are divided into upper and lower triangular sections, which illustrate similarity coefficients derived using kappa and absolute difference methods, respectively.
The arrangement of these figures facilitates a comprehensive assessment of the relationships between wave-ice interaction models and enables comparison of their similarity changes across seasons and climatic conditions. Specifically, Figure 2 panel (i) displays the similarity indices for mean wave direction across different seasonal and climatic comparisons. Panels (ii) and (iii) of Figure 2 detail the similarity assessments for significant wave height and also mean wave period, respectively, across these dimensions. In this presentation, similarity indices closer to one in the kappa method indicate higher similarity [44], while indices approaching zero in the absolute difference method denote greater similarity. For mean wave direction, as shown in Figure 2i, the kappa index and the absolute difference (abs|b − a|) range from 0.0 to 1.0, and 0.0 to 9.2, respectively, highlighting that models under similar conditions (same climate and season) exhibit higher similarity rates, indicated by green areas, while red areas show lower similarity rates, such as when comparing winter in the present with summer in the future. The analysis for significant wave height in Figure 2ii shows kappa index and absolute difference values ranging from 0.0 to 1.0, and 0.0 to 27.8, respectively, with a similar interpretation. For mean wave period, presented in Figure 2iii, the ranges are from −0.1 to 1.0 for the kappa index and 0.0 to 34.1 for the absolute difference, with interpretations consistent with the preceding figures.

3.2. Wave Regime Assessment

In this section, we analyze and contrast the dominant wave conditions during the summer and winter periods, using two sets of 30-year simulations that reflect current and projected future climate scenarios. These comparisons are based on wave parameters such as Mean Wave Direction (MWD), Significant Wave Height (Hs), and also Peak Period (T0), measured in degrees, meters, and seconds, respectively. These parameters are evaluated across a spatial wave model domain, outlined in Figure 1, with a grid resolution of 12 km. For each grid cell, we calculate the percentage occurrence from Equation (1). This analysis is crucial for accurately estimating maximum values and assessing the wave regime at specific locations. Consequently, wave parameters are grouped into different spatial areas according to their variation ranges. However, we only present the wave regime results for the MBS wave-ice interaction model. This is because the outcomes across all wave-ice interaction models (IC0, IC2, BIO, and MBS) are broadly consistent, as indicated by similarity matrices. An outlier to this consistency is the IC2 model’s results concerning absolute differences, which is expected due to its unique performance in standard test cases as documented previously [6].

3.2.1. Mean Wave Direction Analysis

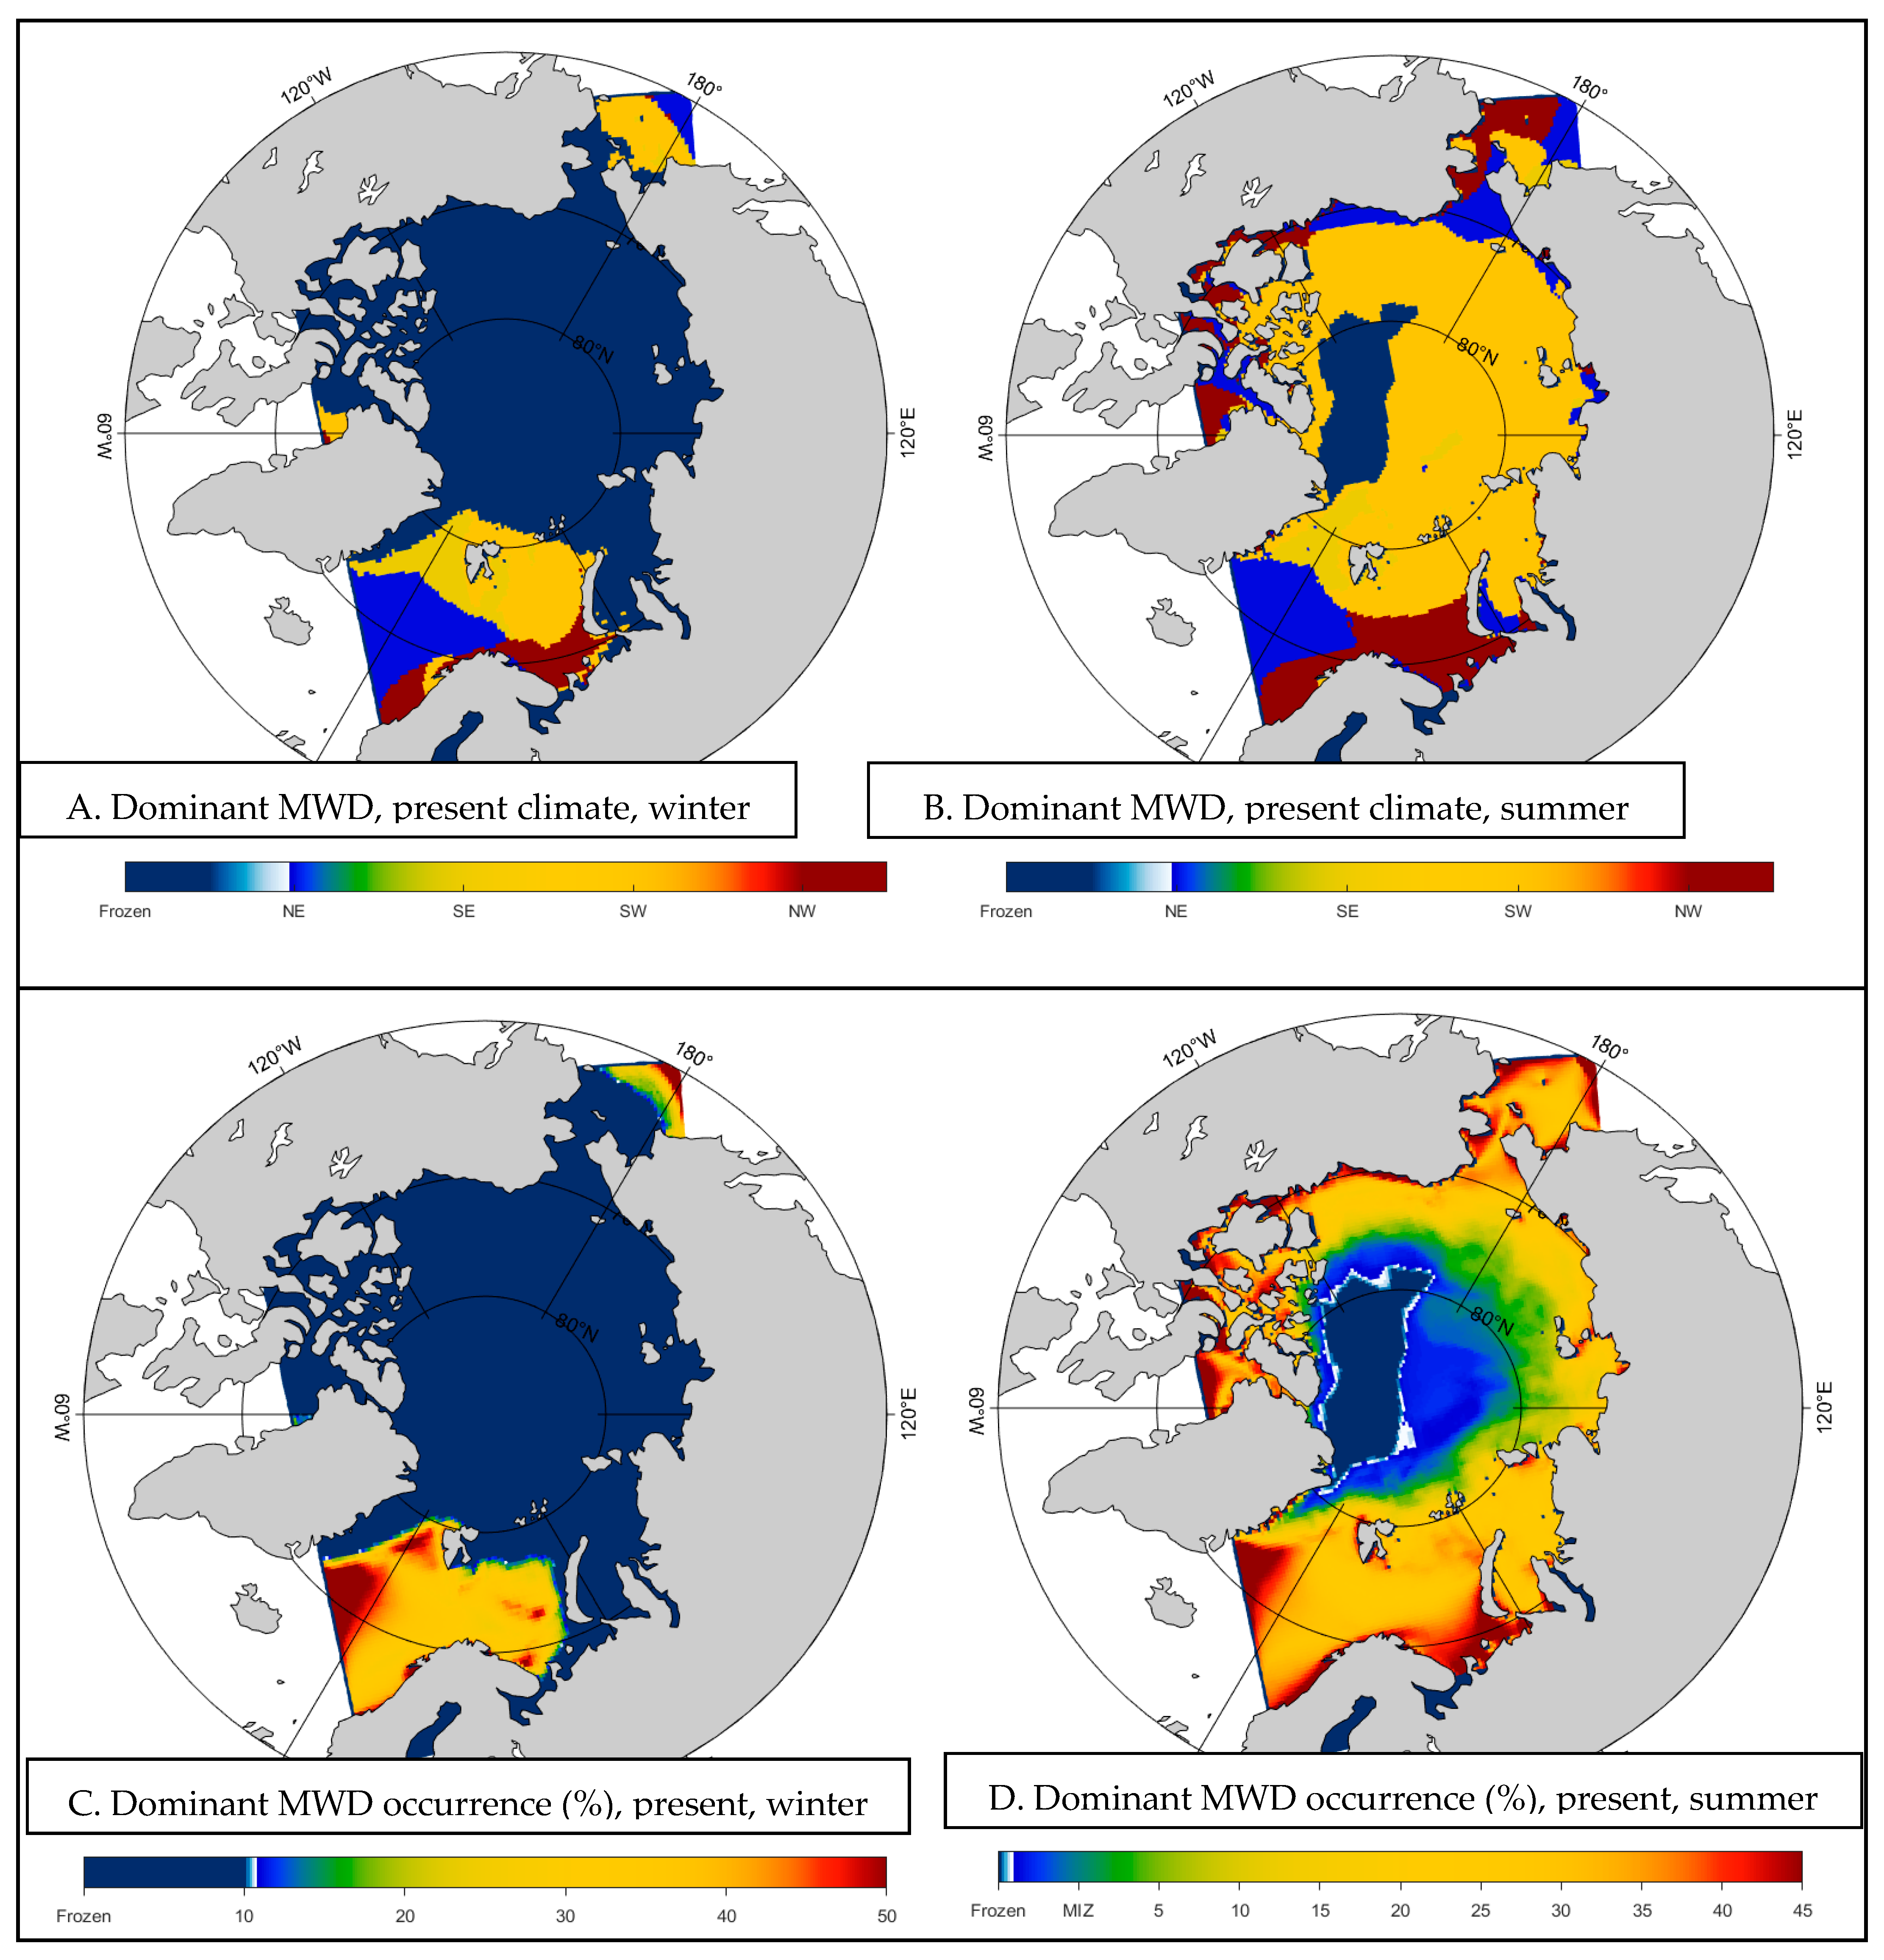
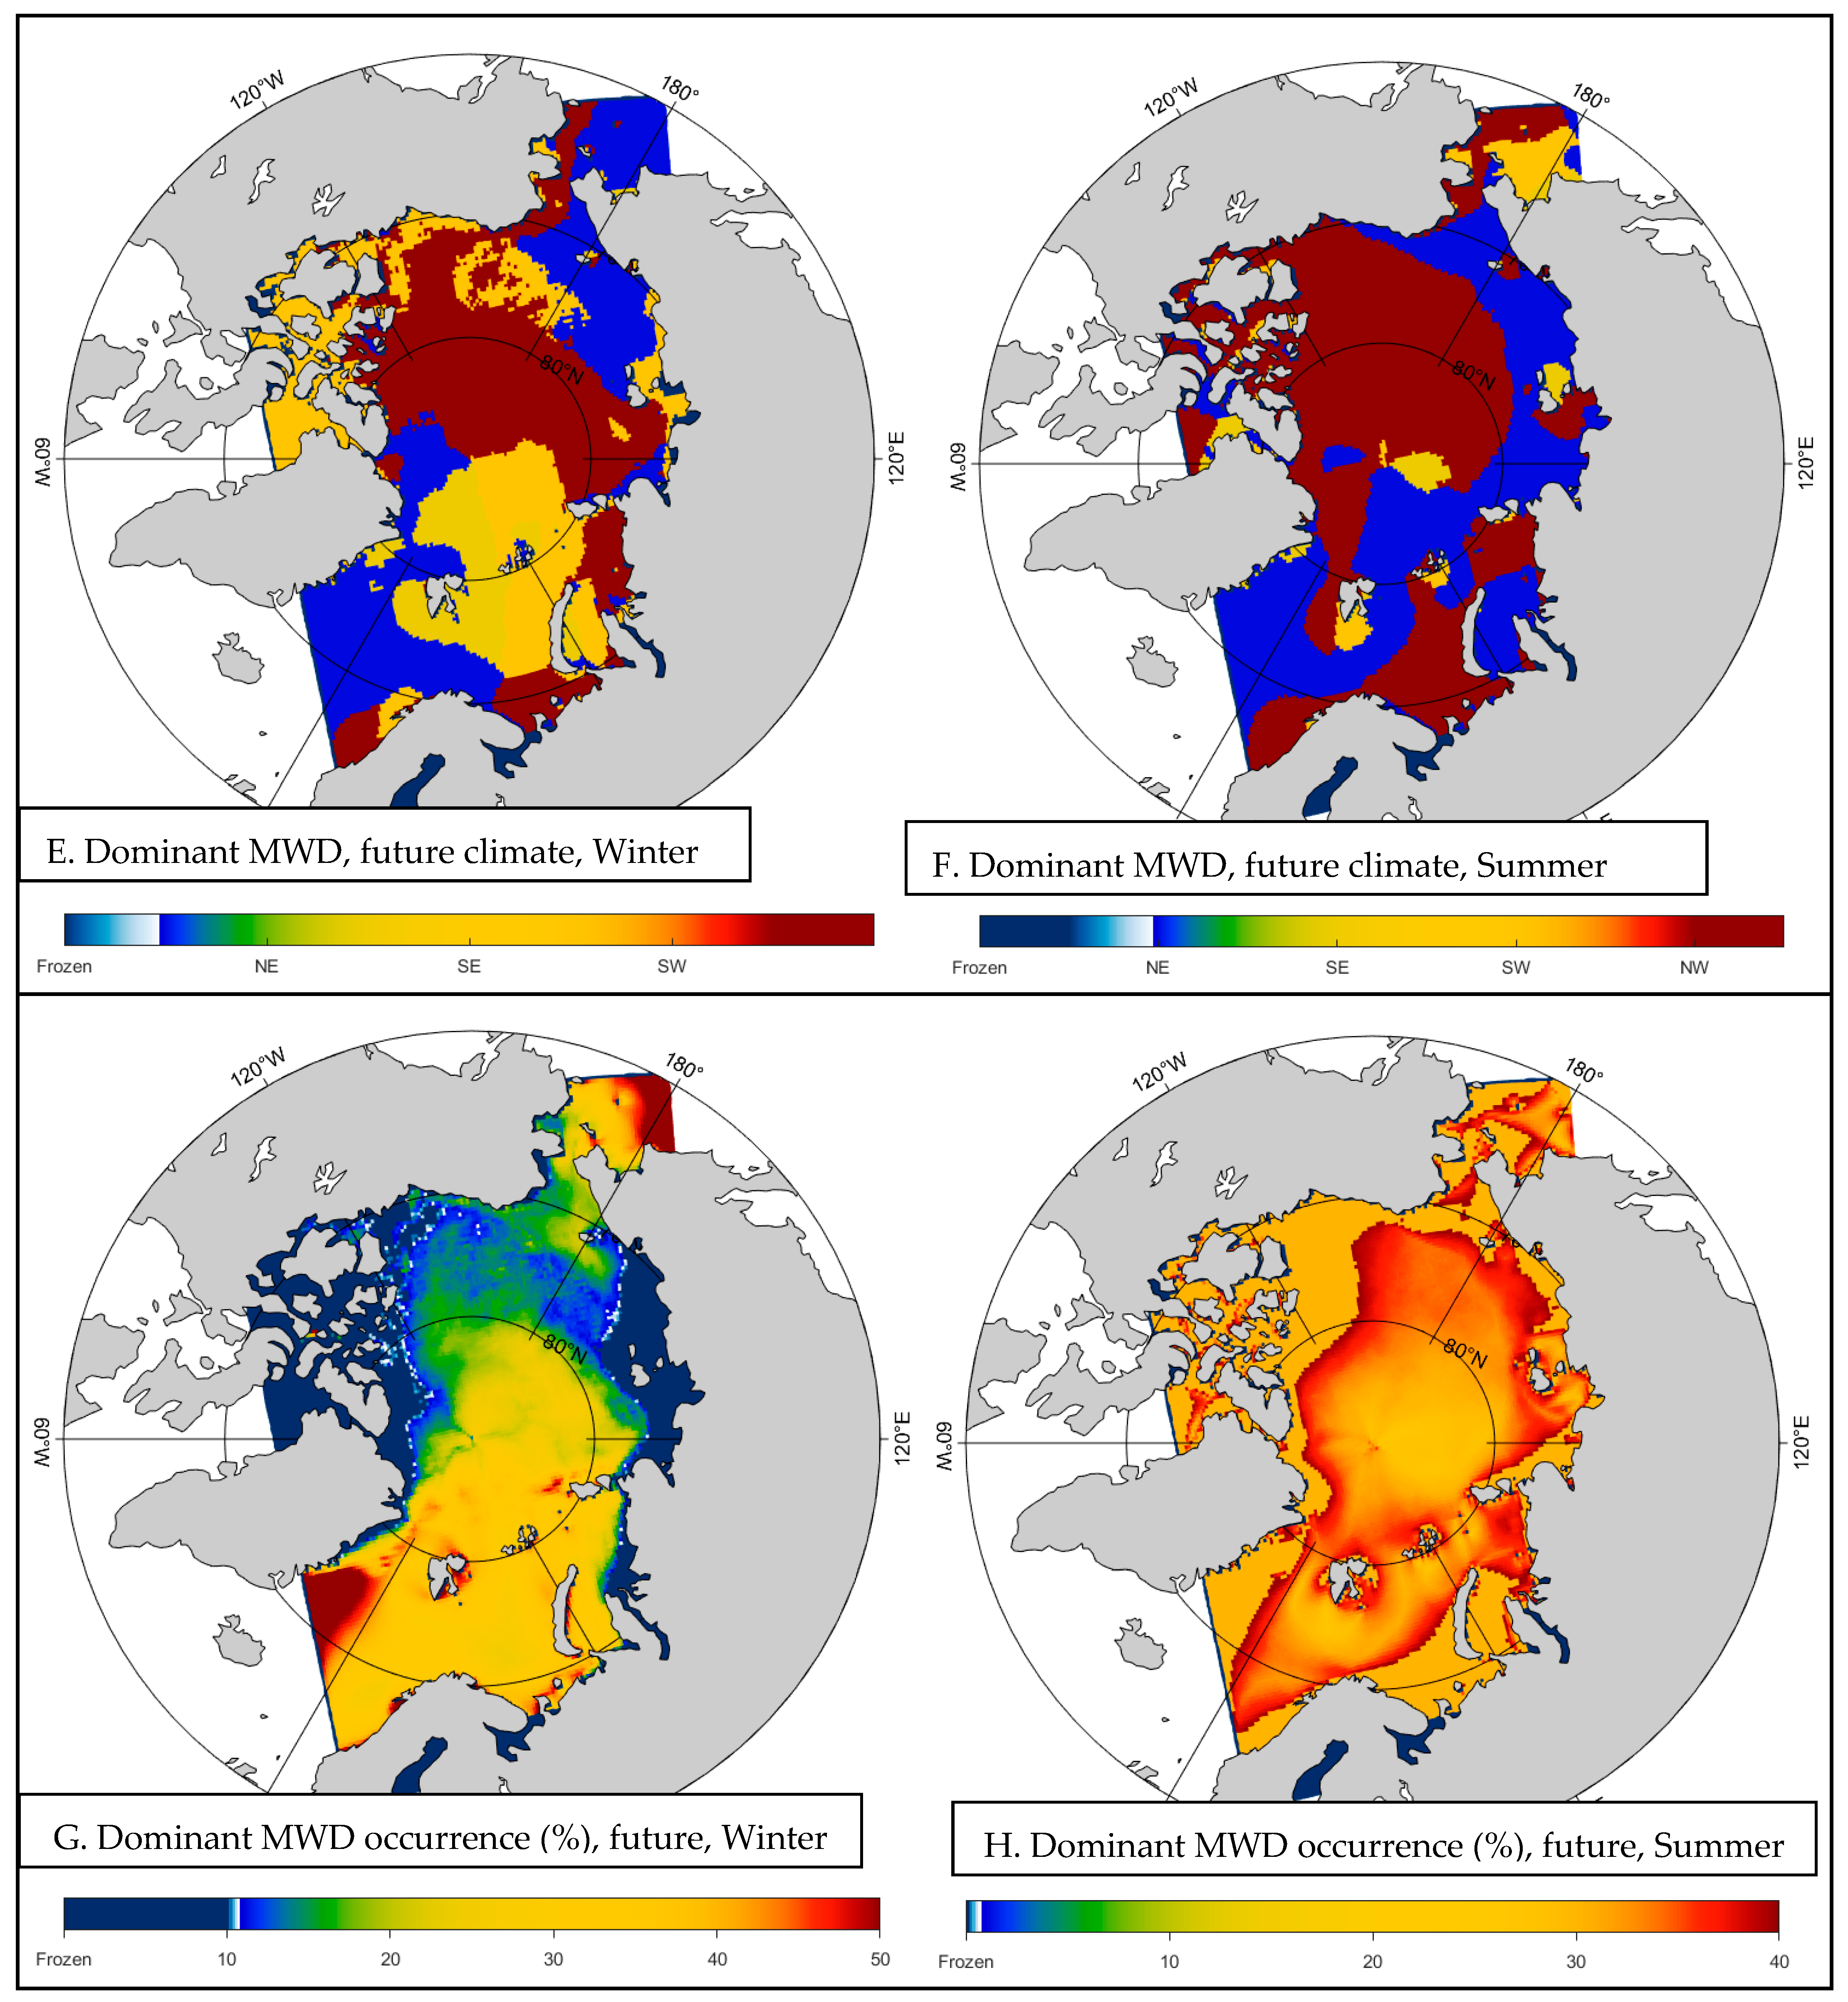
To assess the prevailing wave directions across different seasons (winter and summer) and climatic conditions (current and future), we analyze the frequency of wave directions within each spatial grid cell. This involves categorizing average wave directions into four quadrants, each covering 90 degrees. Figure 3 depicts the predominant average wave directions and their respective occurrence percentages across the study area.
  • Winter Season
Figure 3, specifically panels A and C, highlights the dominant average wave directions for the current winter climate, along with their occurrence percentages. The findings indicate that during current winters, the majority of the Arctic waters are frozen, as expected. In the unfrozen areas, notably to the north of the Greenland Sea, 30% to 50% of waves originate from the northeast (N-E) direction (0–90°), depicted in blue. The Fram Strait predominantly experiences southeast (S-E) direction waves (90–180°), represented in green, with occurrences ranging from 20% to 40%. Southwest (S-W) direction waves (180–270°), shown in yellow, mainly come from the north of the Barents Sea, with occurrences between 15% and 35%. Meanwhile, a large portion of the southern Barents Sea, primarily coastal areas, receives waves from the northwest (N-W) direction (270–360°), colored in red, with occurrences ranging from 20% to 50%.
The impacts of climate change for the Arctic wave climate are significantly noticeable compared to other global ocean areas. Thus, for the future climate scenario, substantial shifts in wave patterns are clearly discernible in Figure 3, panels E and F. The majority of waves are projected to come from the N-E direction (0–90°), in blue, with occurrences varying from 5% to 40%, especially in Fram Strait, certain regions of the basin-scale Arctic Ocean, and the southern parts of the Barents Sea, East Siberian Sea, and Chukchi Sea. A few small areas in the Arctic Ocean and north of the Barents Sea might also see waves in the east-southeast (E-S) direction (90–180°), in green, with occurrences between 30% and 40%. Waves heading in the southwest (S-W) direction (180–270°) are expected to be predominantly observed in the eastern Barents Sea, parts of the basin-scale Arctic Ocean, and the Kara Sea, depicted in reddish hues, with occurrences between 30% and 40%. Additionally, significant parts of the Arctic Ocean, along with smaller areas of the Kara Sea, Laptev Sea, Beaufort Sea, Canadian Arctic, and Baffin Bay, will see waves from the west-northwest (W-N) direction (270–360°), in red, with occurrences ranging from 10% to 20%.
2.
Summer Season
Figure 3 also illustrates the results for the dominant average wave directions for the current summer climate. Despite the summer season, the central part of the Arctic Ocean remains frozen. Most waves are seen coming from the northeast (N-E) direction (0–90°), in blue, with occurrences varying between 20% and 50%, affecting areas like the Greenland Sea, Kara Sea, coastal regions of the Laptev Sea, East Siberian Sea, Chukchi Sea, and Beaufort Sea. In parts of the Arctic Ocean, Kara Sea, Laptev Sea, East Siberian Sea, Chukchi Sea, and Beaufort Sea, 10% to 35% of waves originate from the east-southeast (E-S) direction (90–180°), shown in greenish hues, and 10% to 20% of the waves in the southwest (S-W) direction (180–270°) primarily affect the central Arctic Ocean and the northern Barents Sea, depicted in yellow. Around 40% to 50% of the waves in the southern Barents Sea, Canadian Arctic Archipelago, and Baffin Bay come from the west-northwest (W-N) direction (270–360°), colored in red.
For the future climate, significant alterations in wave patterns are evident as illustrated in Figure 3. Waves in the northeast (N-E) direction (0–90°) will span from the Greenland Sea to the central study area, including the Kara Sea, Laptev Sea, East Siberian Sea, Chukchi Sea, with occurrences ranging from 30% to 50%. Waves in the east-southeast (E-S) direction (90–180°) will appear in small, scattered areas, with expected changes in occurrences between 30% and 35%. Southwest (S-W) direction waves (180–270°) will affect small, scattered areas with occurrences between 30% and 40%, whereas waves in the west-northwest (W-N) direction (270–360°) are anticipated to expand to central parts of the domain, Canadian Arctic Archipelago, Baffin Bay, Beaufort Sea, certain areas of the Kara Sea, and Barents Sea, with their occurrences expected to range from 30% to 50%.

3.2.2. Significant Wave Height Analysis

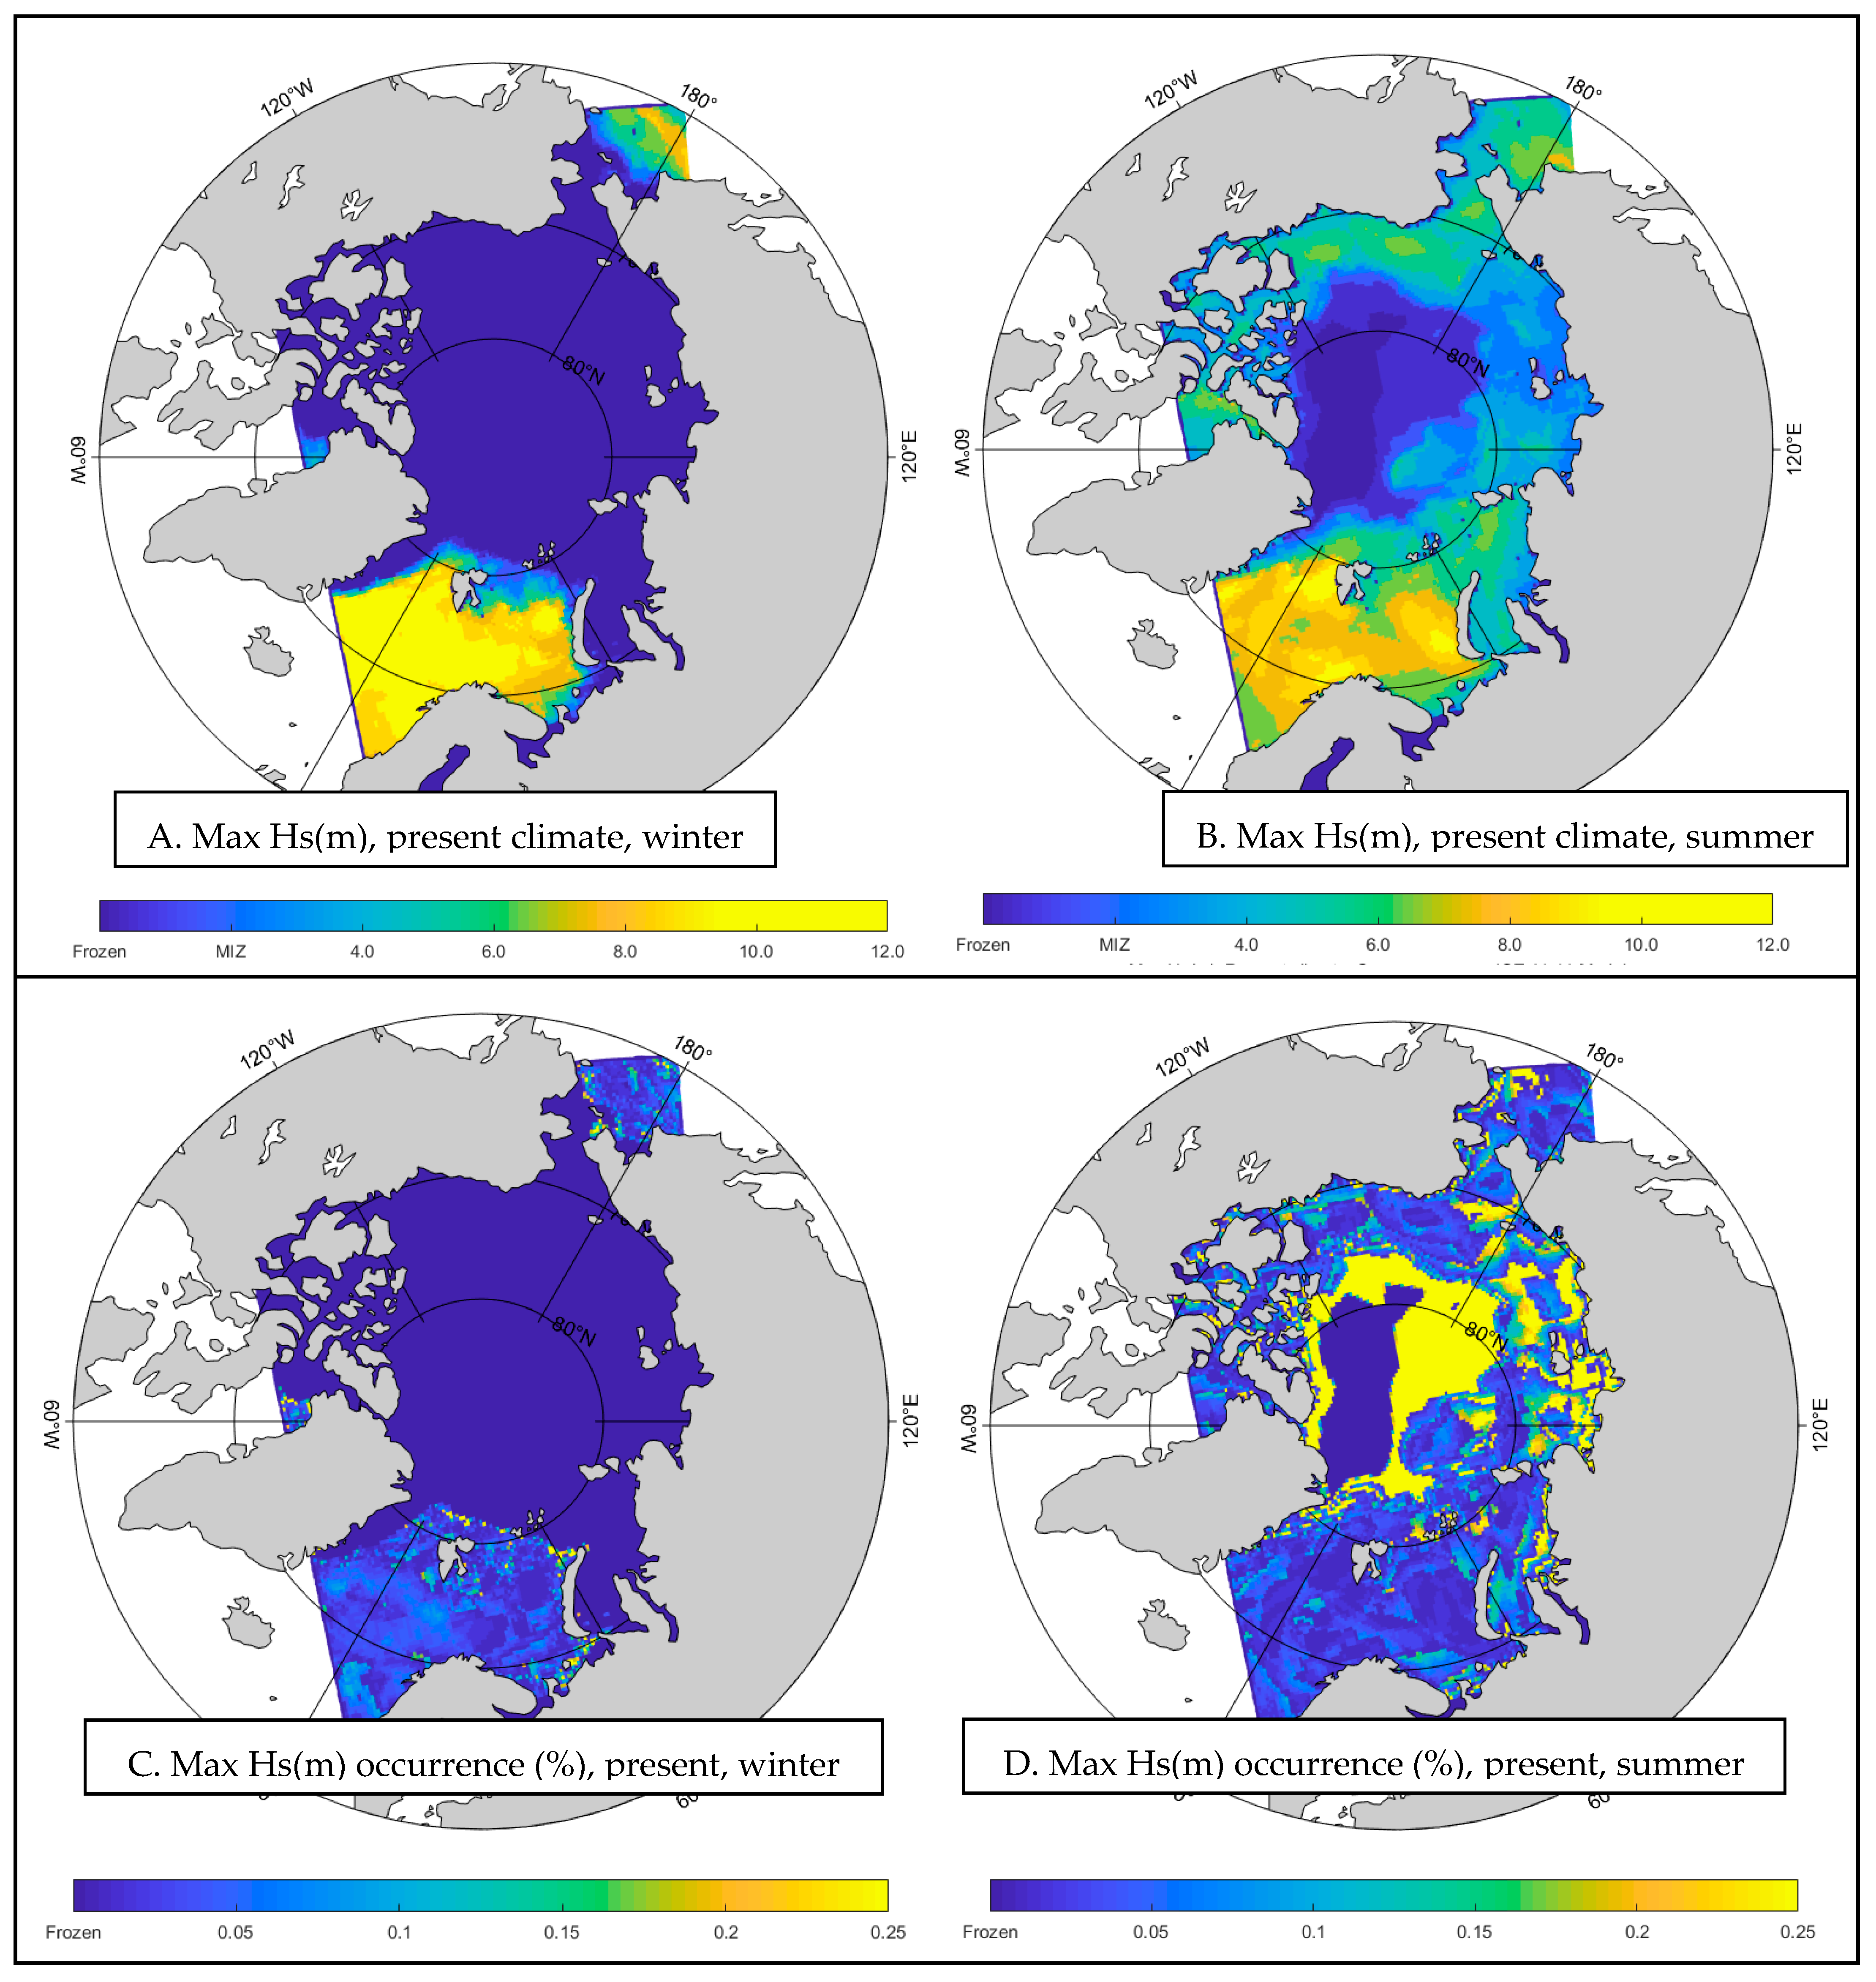
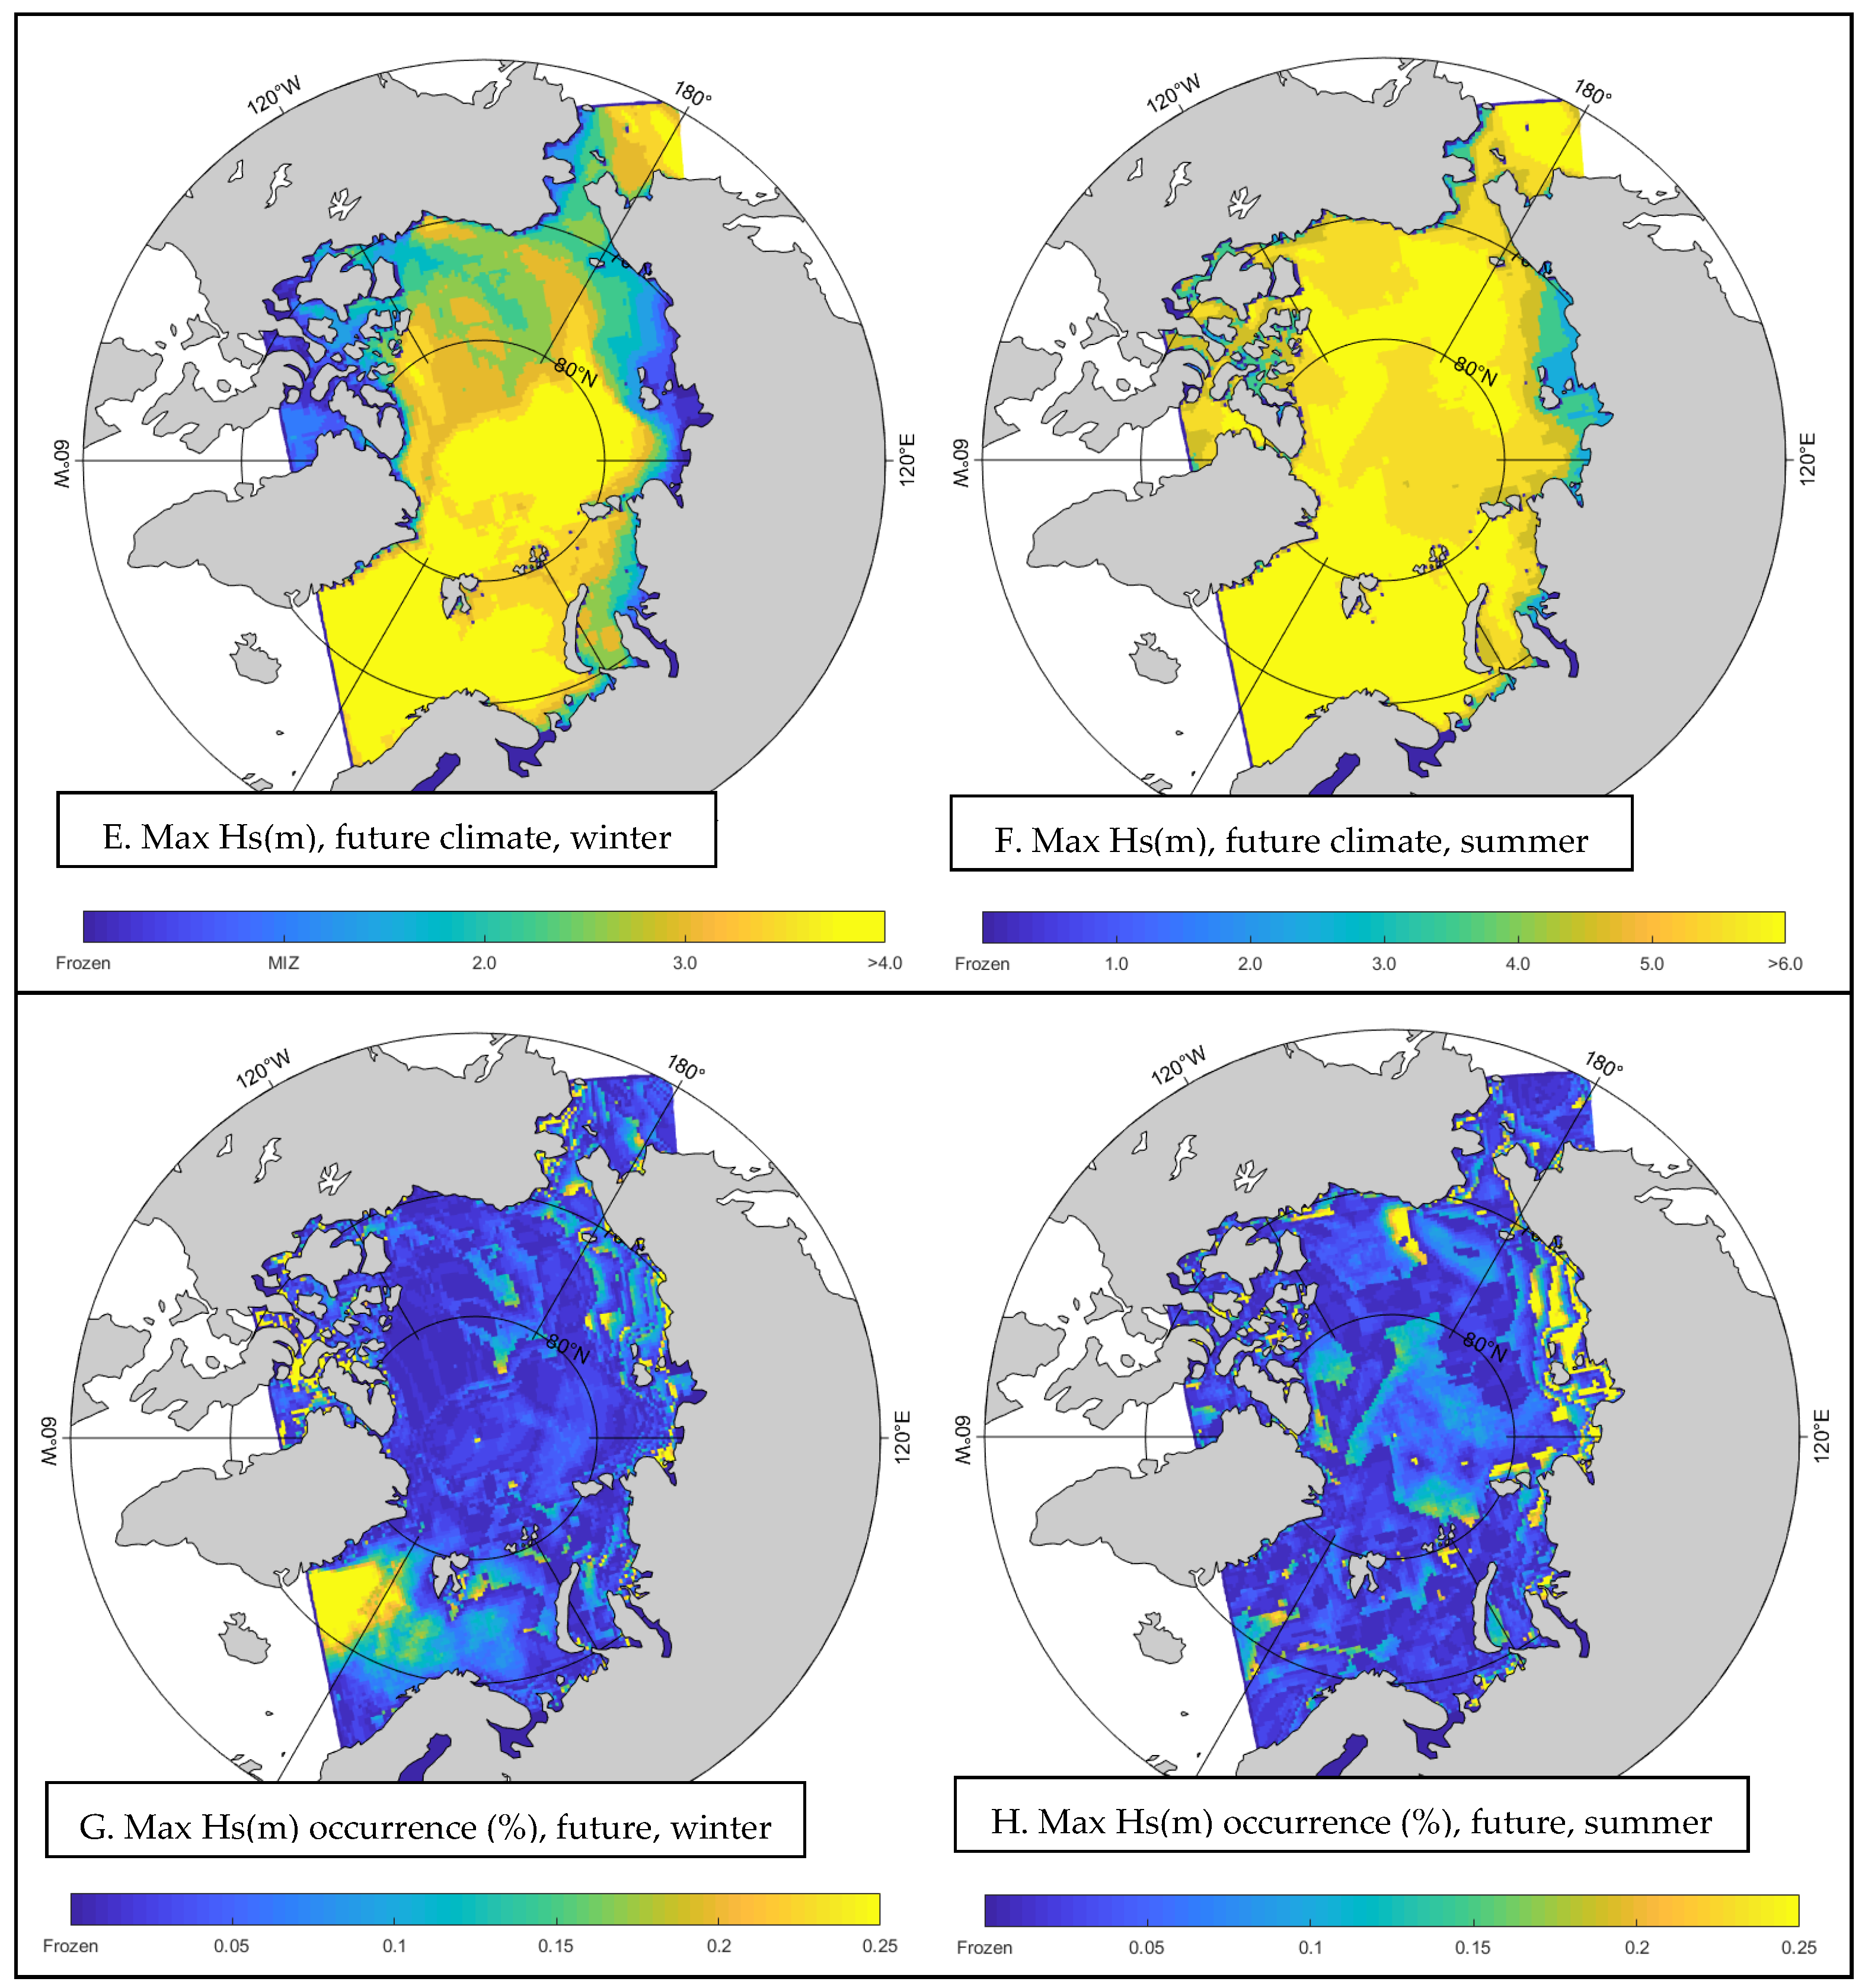
To assess the range of significant wave heights (Hs) and their corresponding frequencies (%) during winter and summer across present and future climates, we evaluated the dominant patterns of maximum Hs within each computational grid. This analysis, depicted in Figure 4, involved categorizing Hs occurrences into 11 sub-ranges (Hs: <1, 1–2, 2–3, 3–4, 4–5, 5–6, 6–7, 7–8, 8–9, 9–10, and >10 m), and identifying the peak values within these intervals throughout the simulation periods. Subsequently, we calculated the frequency of these peak occurrences in each grid element.
For illustration, consider a grid element in the northern Greenland Sea where during the current winter season, the maximum Hs exceeded 9 m with a frequency of 0.1%—a small, yet expected figure. This method differs subtly but significantly from traditional approaches, which typically identify the single highest Hs value and its occurrence percentage. Our approach, by focusing on the range within which the maximum Hs falls, provides a more nuanced understanding of the climate conditions, enhancing insights into the frequency and distribution of extreme wave events and helping to delineate different climatic regimes within the study area. For instance, in a specific location over a 30-year period, a maximum Hs of 5.9 m might occur with a frequency of 0.004%; however, by considering the entire 5–6 m range, we find a higher occurrence frequency of 0.13%.
The maps produced in this study adopt this methodology, providing detailed analyses of maximum Hs values and their frequencies for both current and future climates, across winter and summer seasons.
  • Winter Season
The analysis reveals that, during the present winter, most areas except for the Greenland Sea, Fram Strait, and Barents Sea are frozen, with the latter regions experiencing significant wave heights of up to 12 m and frequencies ranging up to 0.15%. Future projections indicate an increase in maximum Hs values (exceeding 4 m) spreading from the Greenland Sea towards the central study area, affecting previously frozen zones with frequencies up to 0.25%. Coastal regions are projected to have lower Hs values.
2.
Winter Season
Current summer conditions show maximum Hs values up to 6 m for the Greenland Sea, Fram Strait, Barents Sea, and scattered areas across other seas, with central and coastal areas generally experiencing lower maximum Hs (below 12 m) and frequencies under 1%. Future summer scenarios suggest an increase in areas with maximum Hs values exceeding 6 m, particularly away from the coast, with a noticeable rise in occurrence frequencies, especially in the central regions of the study area, up to 0.15%.

3.2.3. Mean Wave Period Analysis

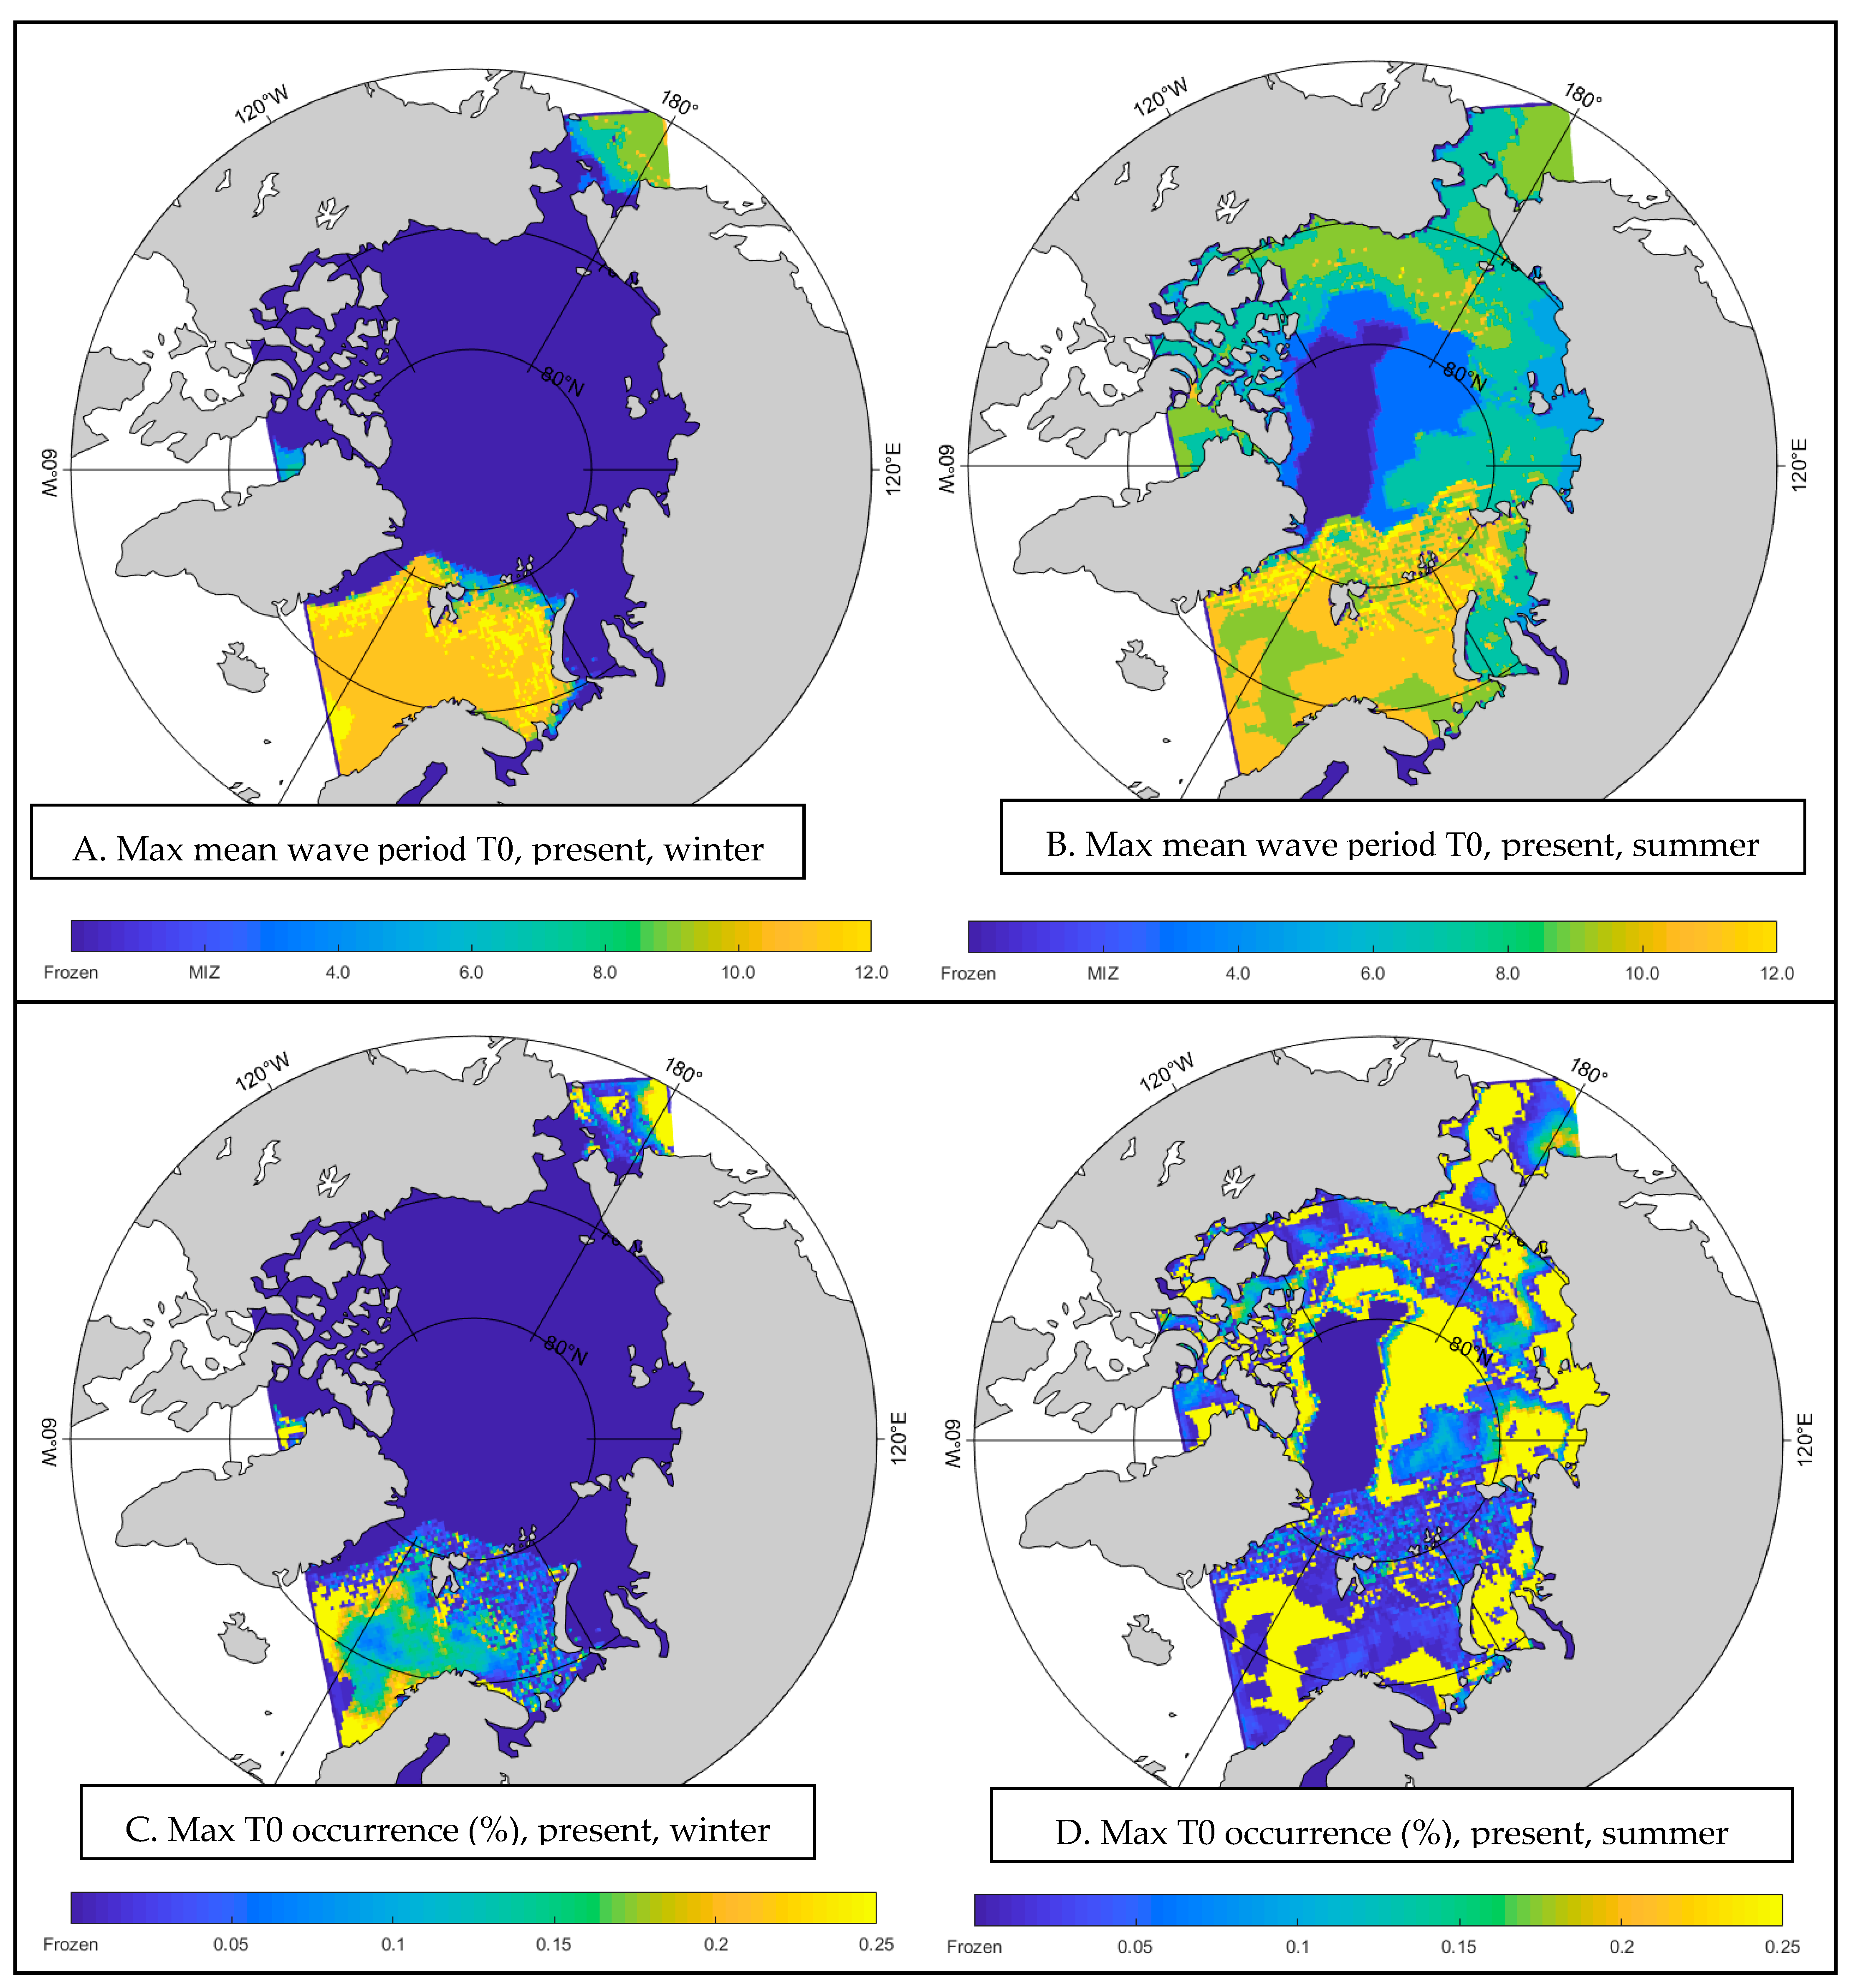
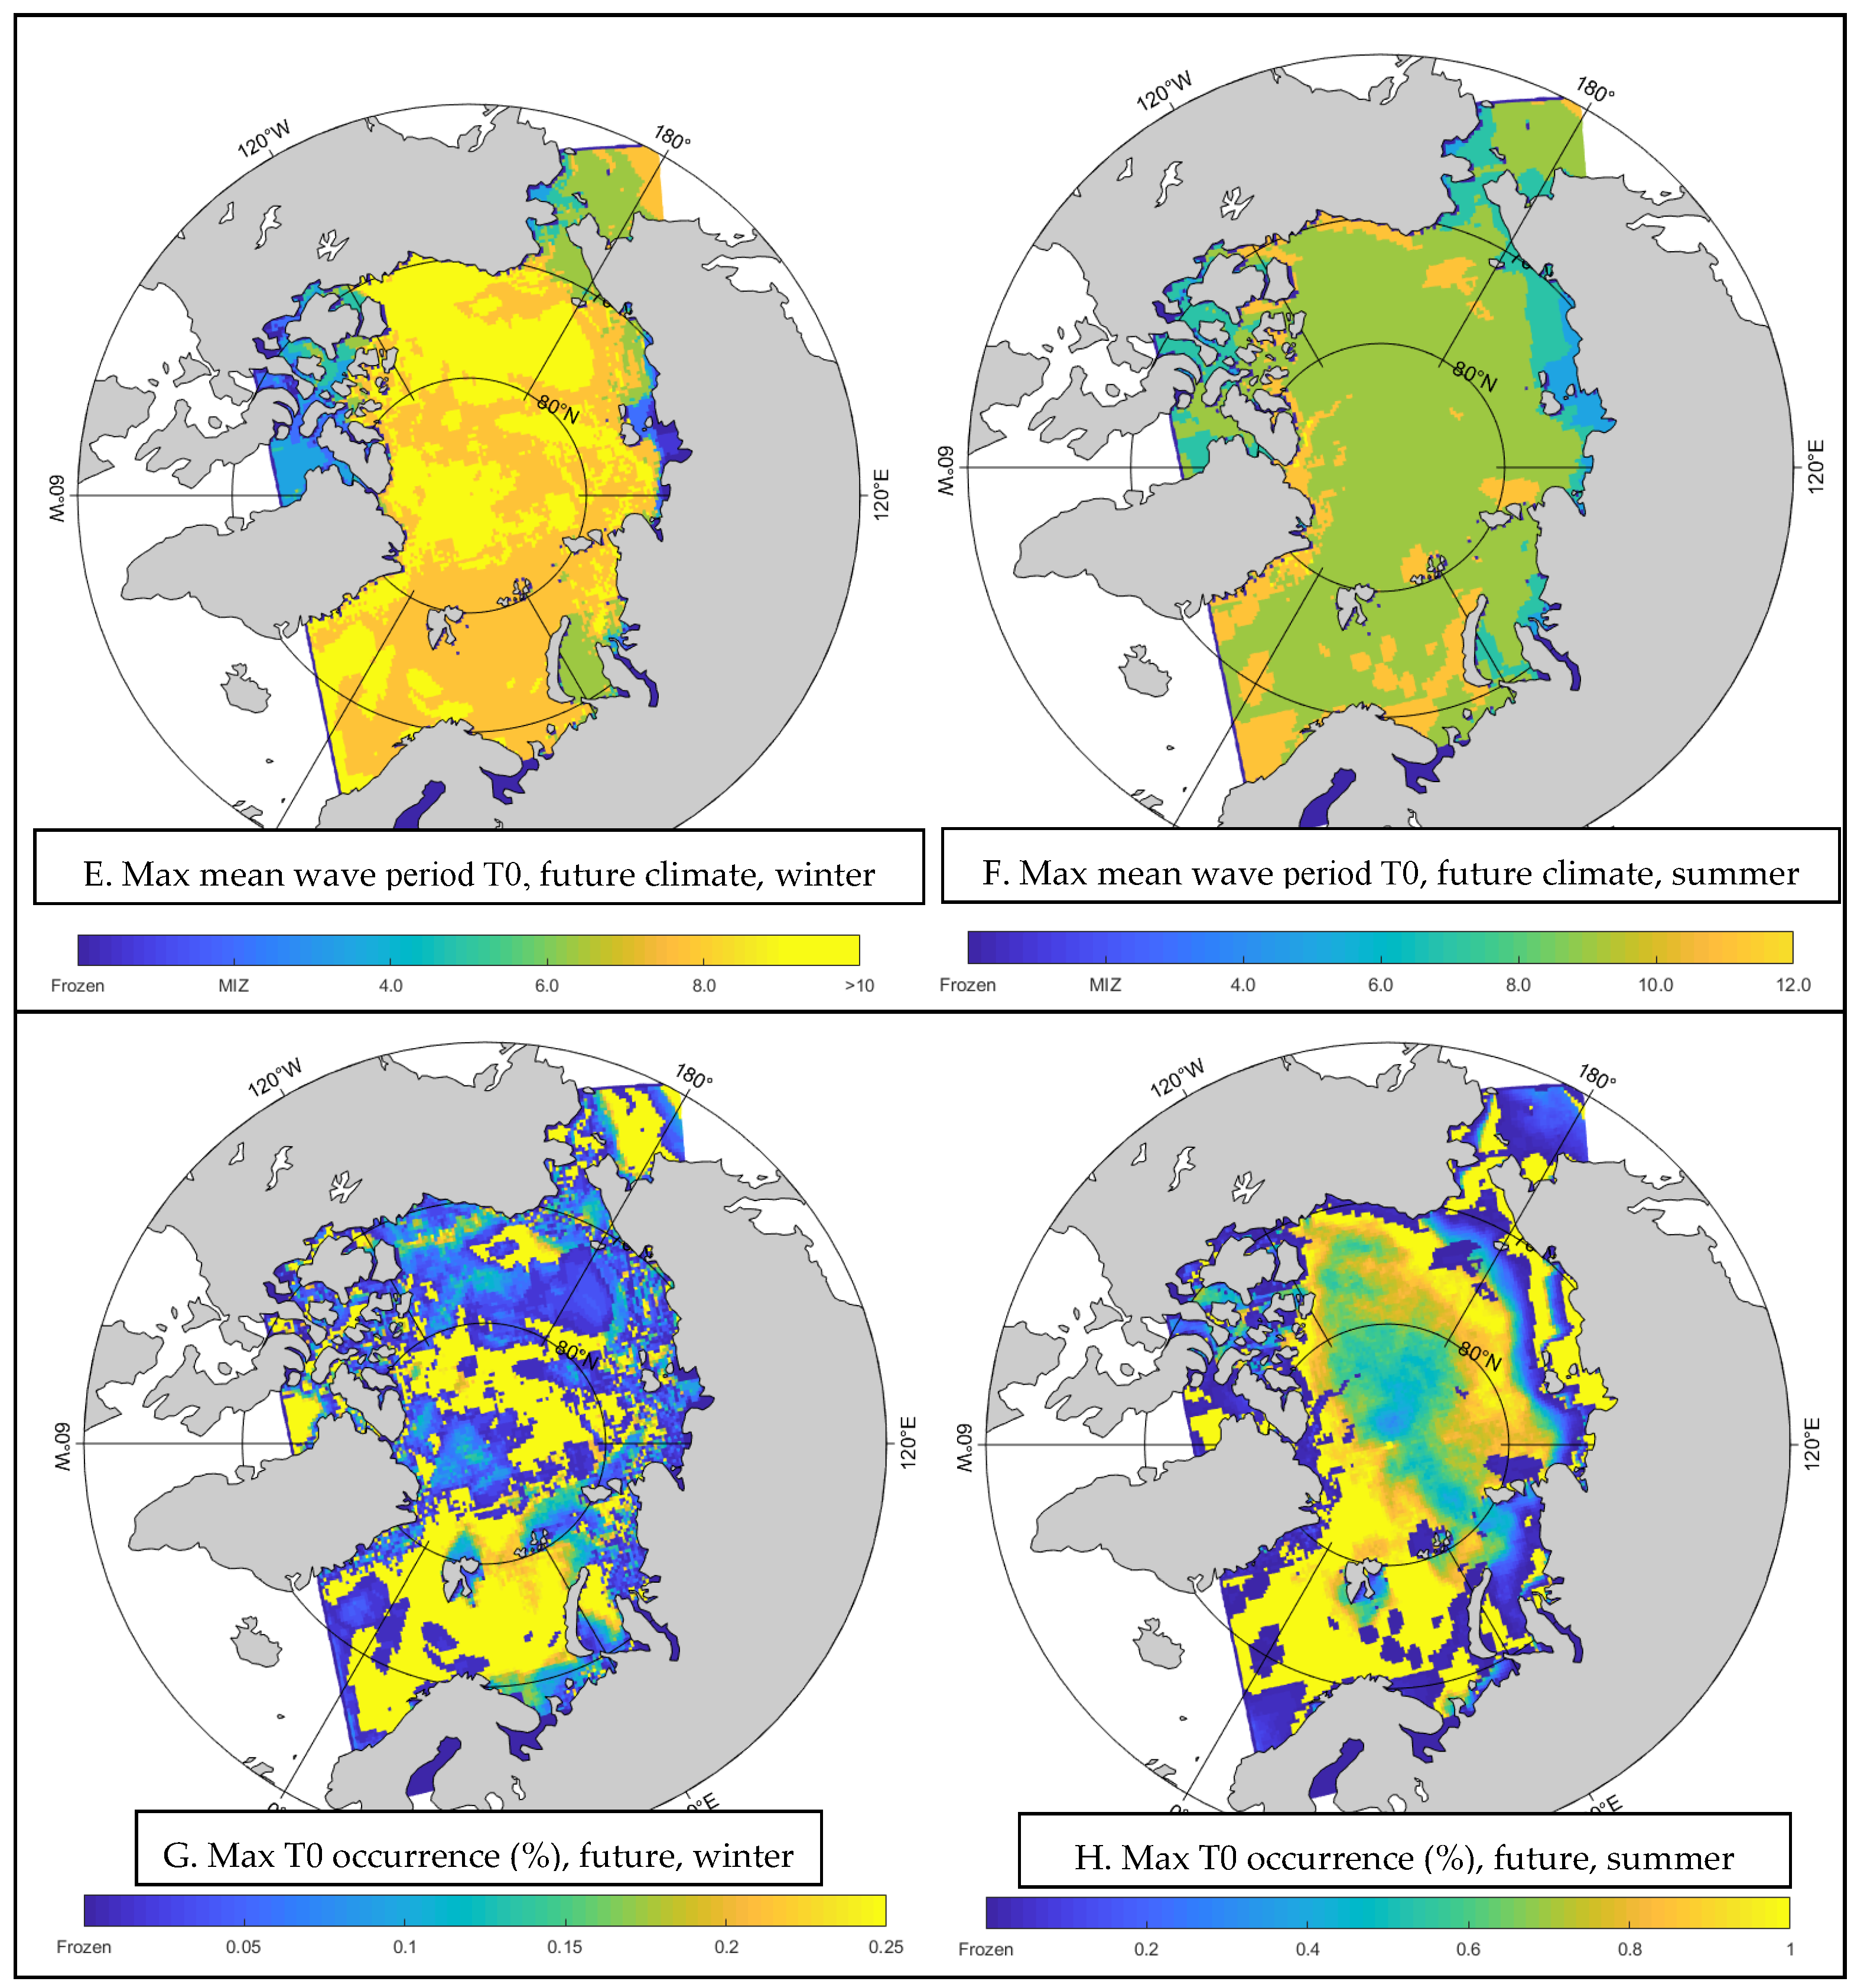
This section presents the analysis of the mean wave period (T0) and its occurrence (%) for both winter and summer seasons under current and future climate scenarios. Calculations include values for each spatial grid element within the model, as shown in Figure 5. For each grid element, T0 occurrences across various ranges (<2, 2–4, 4–6, 6–8, 8–10, 10–12, and >12 s) are determined. The study extracts the maximum T0 ranges for the modeling period and calculates the corresponding occurrence percentages for each element. For instance, an element in the Greenland Sea during the current winter season exhibited a maximum T0 range of 10–12 s, with an occurrence rate of 0.5%. The approach for deriving T0 maps is analogous to that used for significant wave height (Hs) maps. The results include maximum T0 values and their occurrence percentages for both present and future climates across winter and summer seasons.
  • Winter Season
Figure 5 indicates that, during the winter season, maximum T0 ranges in areas such as the Greenland Sea, Fram Strait, and Barents Sea span 8–12 s, with occurrence percentages ranging from 0 to 0.5%. Other regions experience frozen conditions during this time. Future climate projections in Figure 5 reveal a noticeable upward trend in most areas, extending from the central part of the study domain to adjacent coastal regions. The figure also illustrates the future winter season’s maximum wave period occurrences, showing an anticipated change in the entire study area’s occurrence percentages from 0% to 1% due to climate change.
2.
Summer Season
For the current summer climate, Figure 5 highlights the maximum T0 values, indicating that certain isolated areas in the Barents and Greenland Seas have wave periods exceeding 12 s. Conversely, the majority of regions, excluding shorelines, report maximum T0s between 8 and 10 s. Near coastal zones, maxT0 values tend to decrease, falling within the 4–6 s range. The occurrence rates for these periods vary from 0% to 5%. A similar assessment for the future summer scenario (depicted in Figure 5F,H) shows a slight increase in maximum T0 values, with periods over 9 s identifiable across most of the study area. Nevertheless, the occurrence percentage ranges from 0% to 1.5%, with coastal areas nearly at 0%.

3.3. Extreme Value Analysis (EVA) in Hydrodynamic Ocean Modeling

Extreme Value Analysis (EVA) plays a critical role in hydrodynamic modeling of the ocean, particularly in assessing coastal erosion, inundation risks in coastal regions, and other related concerns [3]. This study focuses on estimating the maximum wave parameters, specifically significant wave height (Hs) and peak period (T0). Our comprehensive analysis encompasses all points within the study domain, incorporating 6-hourly time series data for both the current climate (1980–2009) and a future climate scenario (2070–2099), across winter and summer seasons. We perform extremal analysis on Hs and T0 time series at centroid points for both present and future climates during winter and summer, considering 20-year and 100-year return periods.
  • Extremal Analysis for Significant Wave Heights
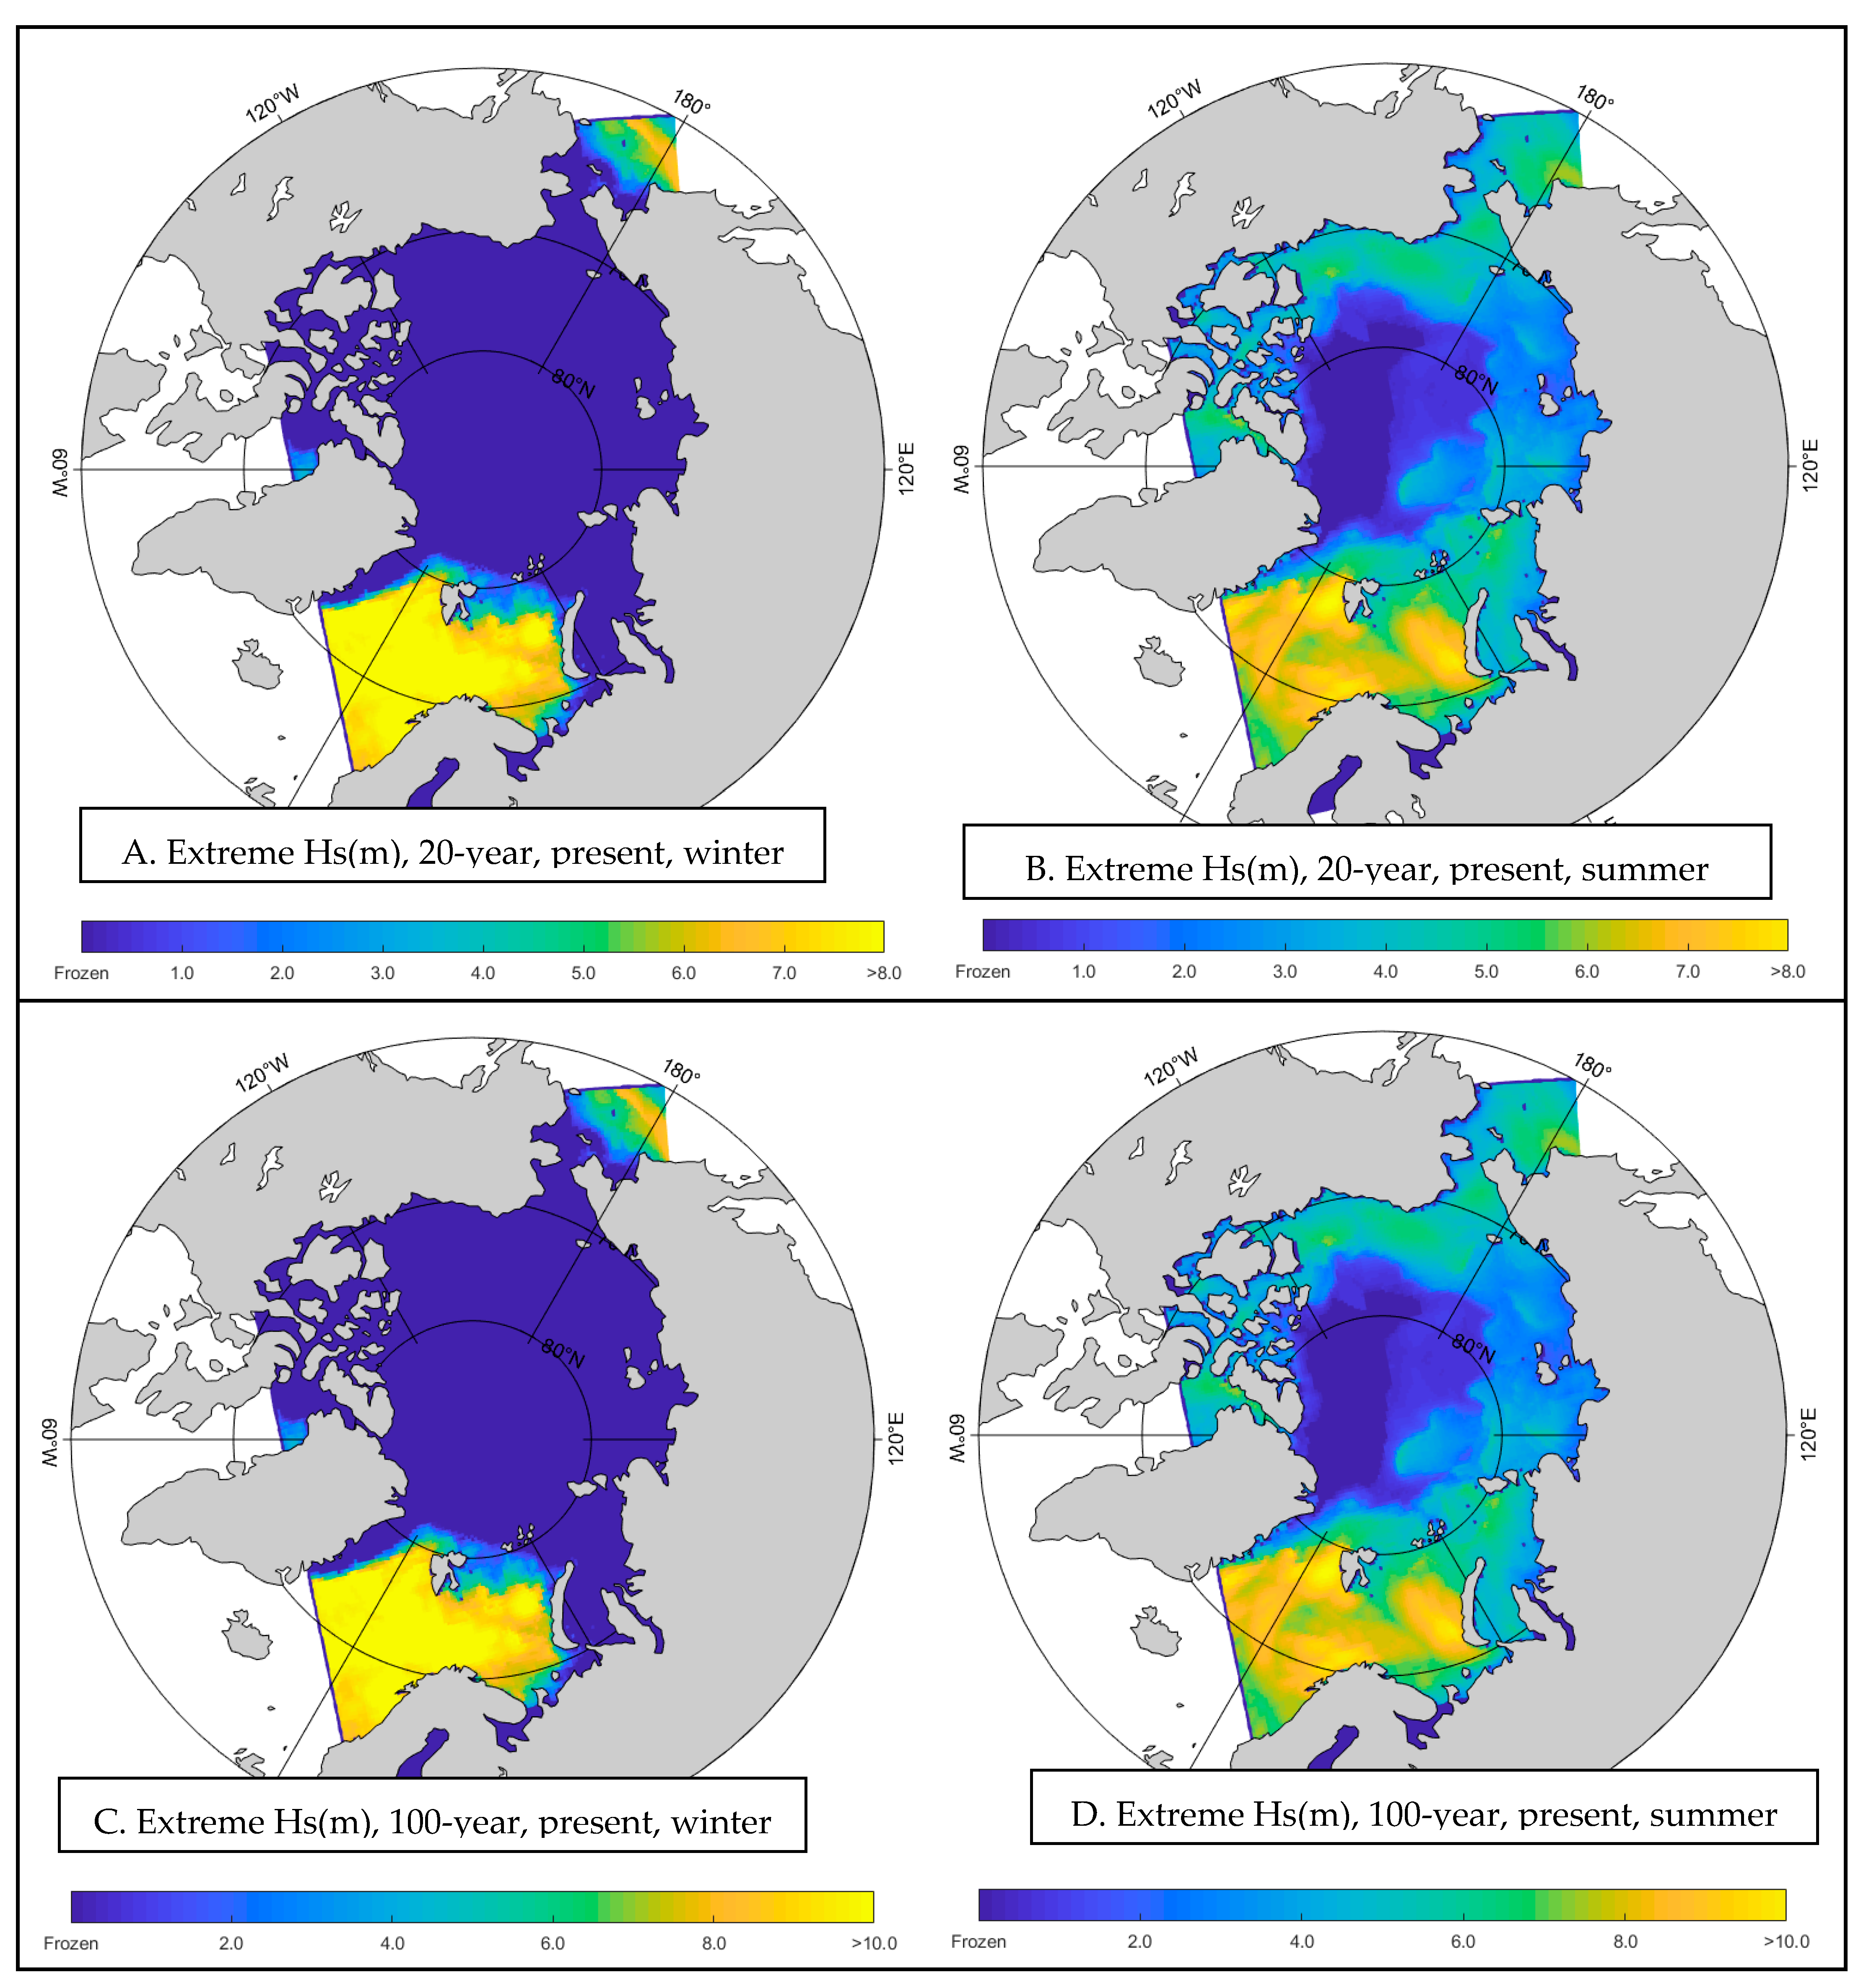
For the present climate’s winter season, extreme Hs values, based on a 20-year return period, range from 0 m to 11 m in the Barents Sea, Fram Strait, and Greenland Sea, as illustrated in Figure 6. Extreme wave heights tend to be higher in areas distant from coastal zones and in the central Arctic Ocean.
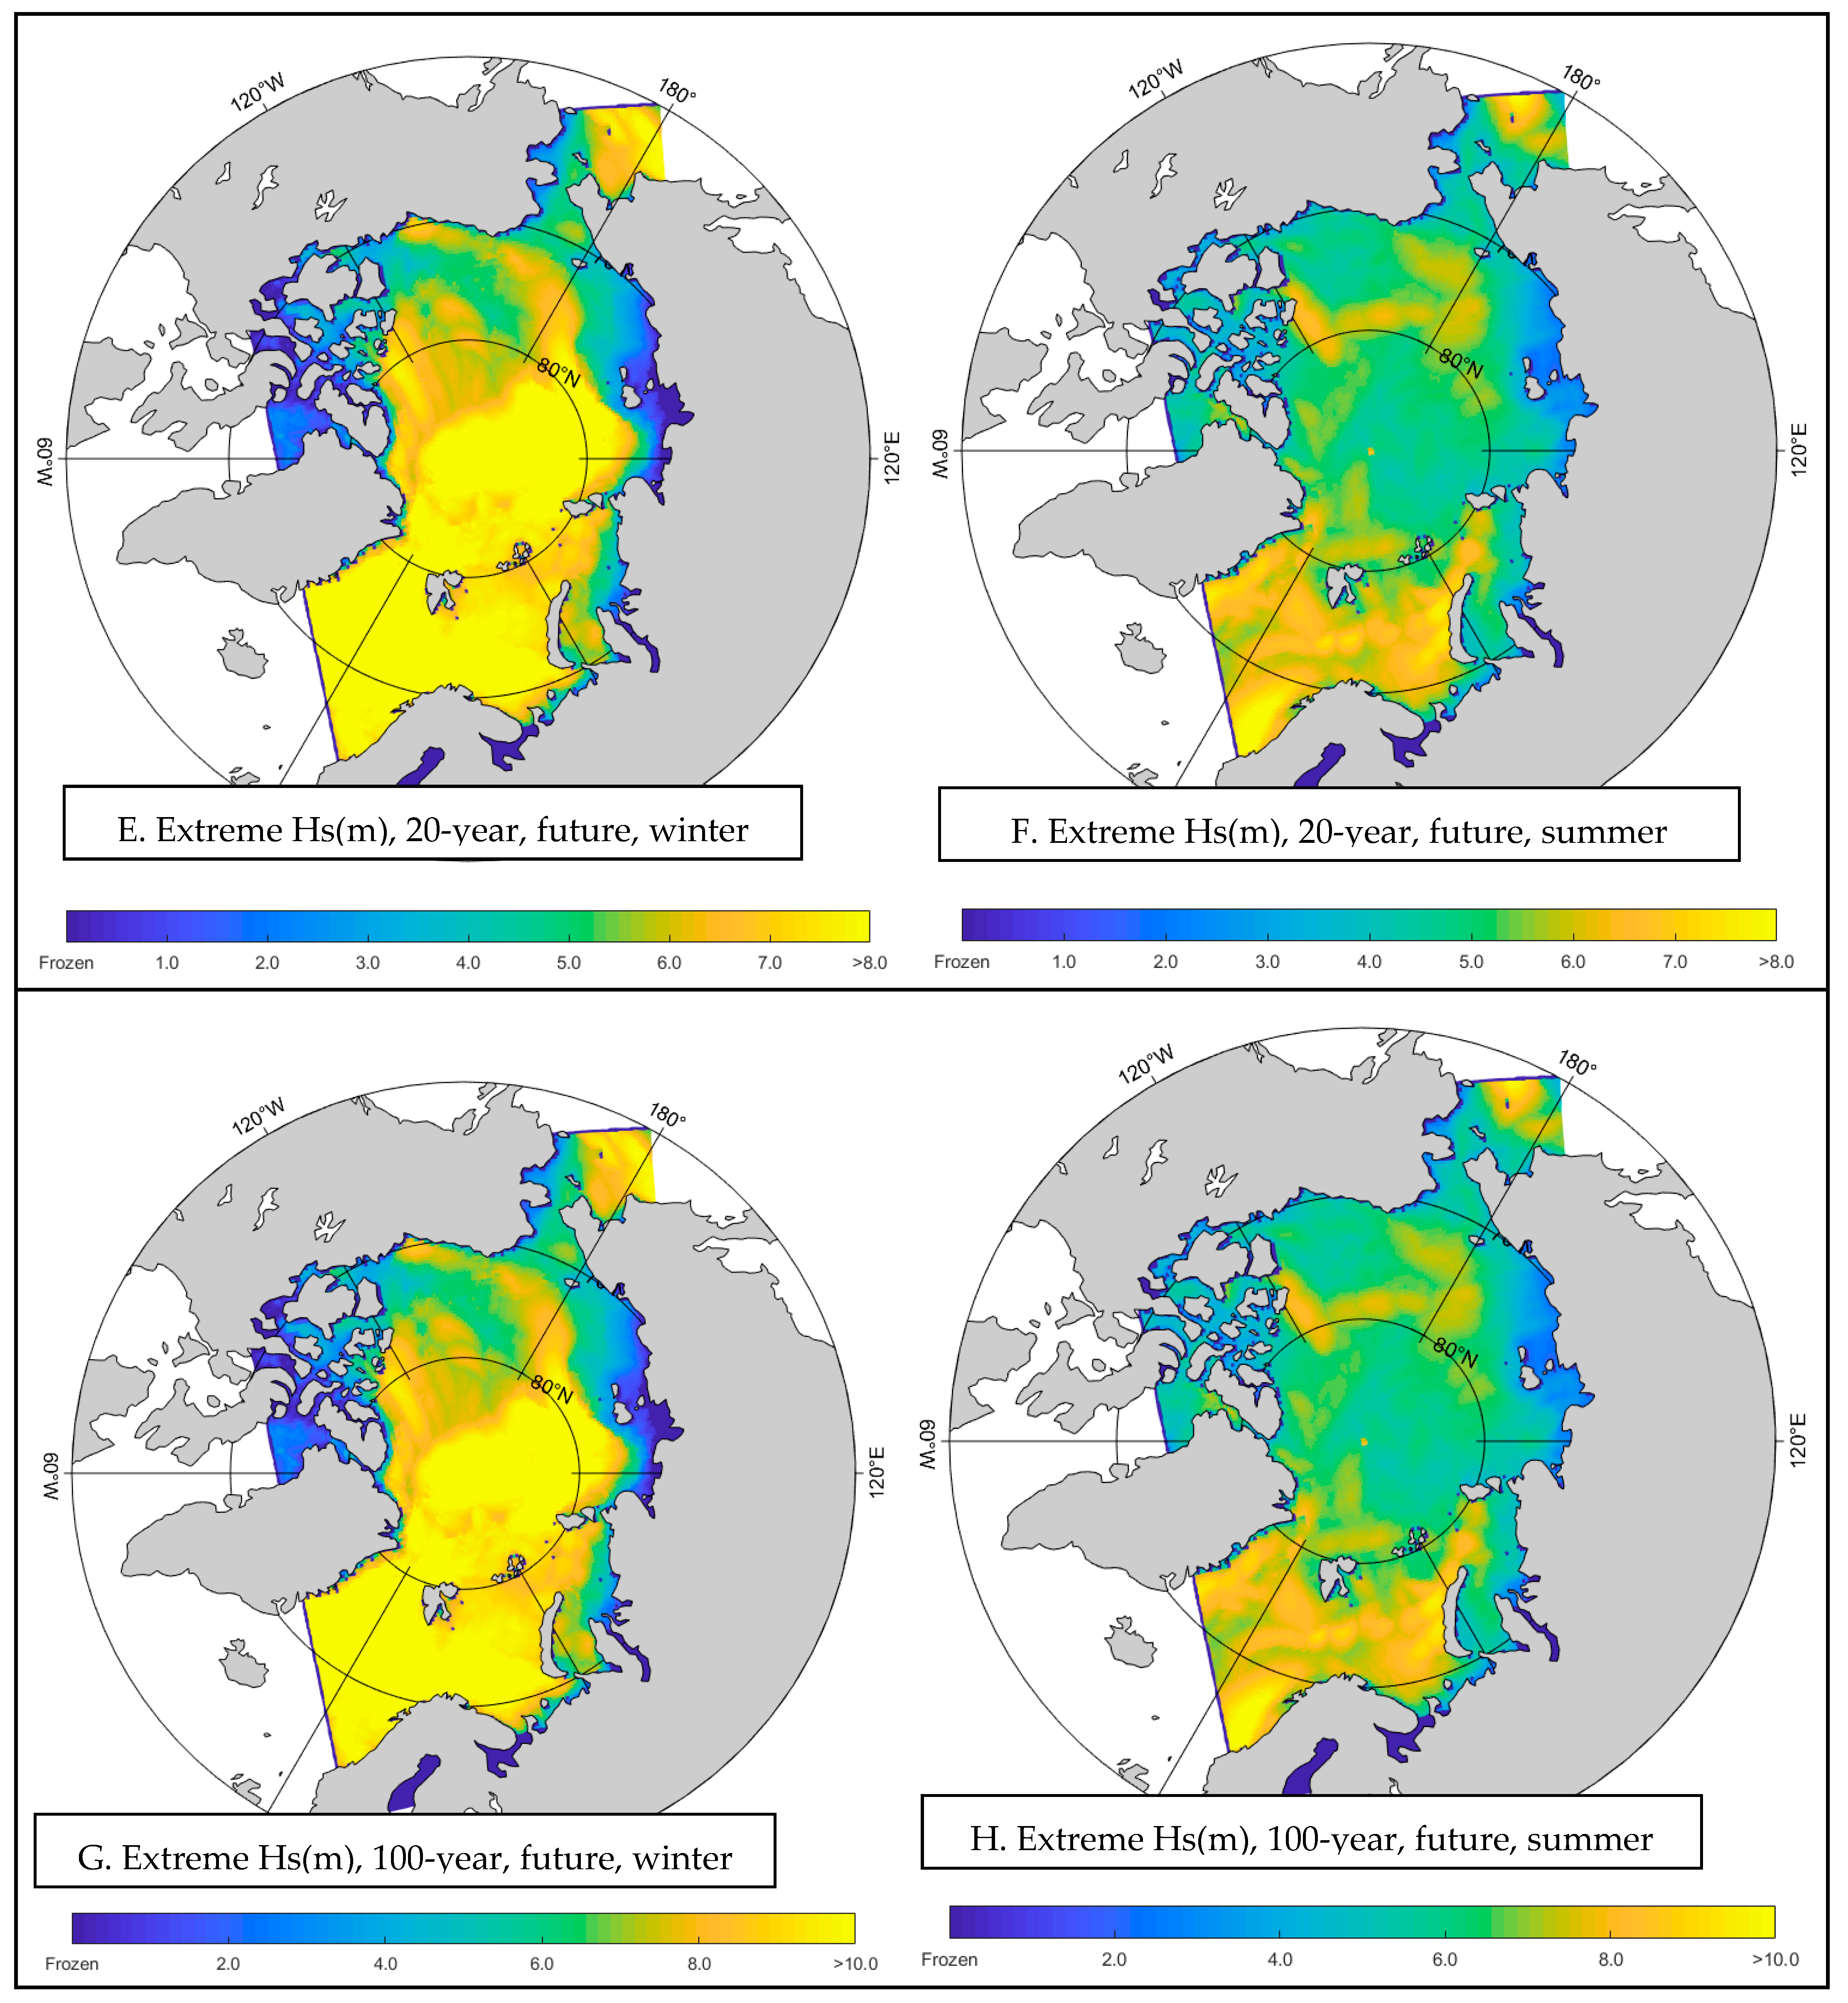
Under a future scenario with diminished ice cover, nearly all regions are projected to witness increased Hs values. The future winter climate scenario indicates that, while coastal areas may see similar extreme Hs values to the present climate, significant differences emerge, particularly in the central Arctic Ocean, Barents Sea, Fram Strait, and Laptev Sea, where the highest Hs values are anticipated.
Despite similar extreme wave heights observed in both the present winter and summer climates, the reduction in frozen water expanses leads to elevated extreme Hs values in many areas, with changes ranging from 0 to 6 m. Nonetheless, the Barents Sea, Fram Strait, and Greenland Sea are expected to experience comparable wave heights across seasons, as depicted in Figure 6.
For the 100-year return period, Figure 6 also presents the extreme Hs values and their variations for both the current and future climate scenarios during winter and summer. The patterns and changes in Hs extreme values for the 100-year return period align closely with those observed for the 20-year period. Notably, the extreme Hs values for the 100-year period are generally higher than those for the 20-year period, although certain areas, like the Arctic Ocean during the present winter, show no significant change due to stable sea ice conditions.
2.
Extreme Wave Period Values Under Different Conditions
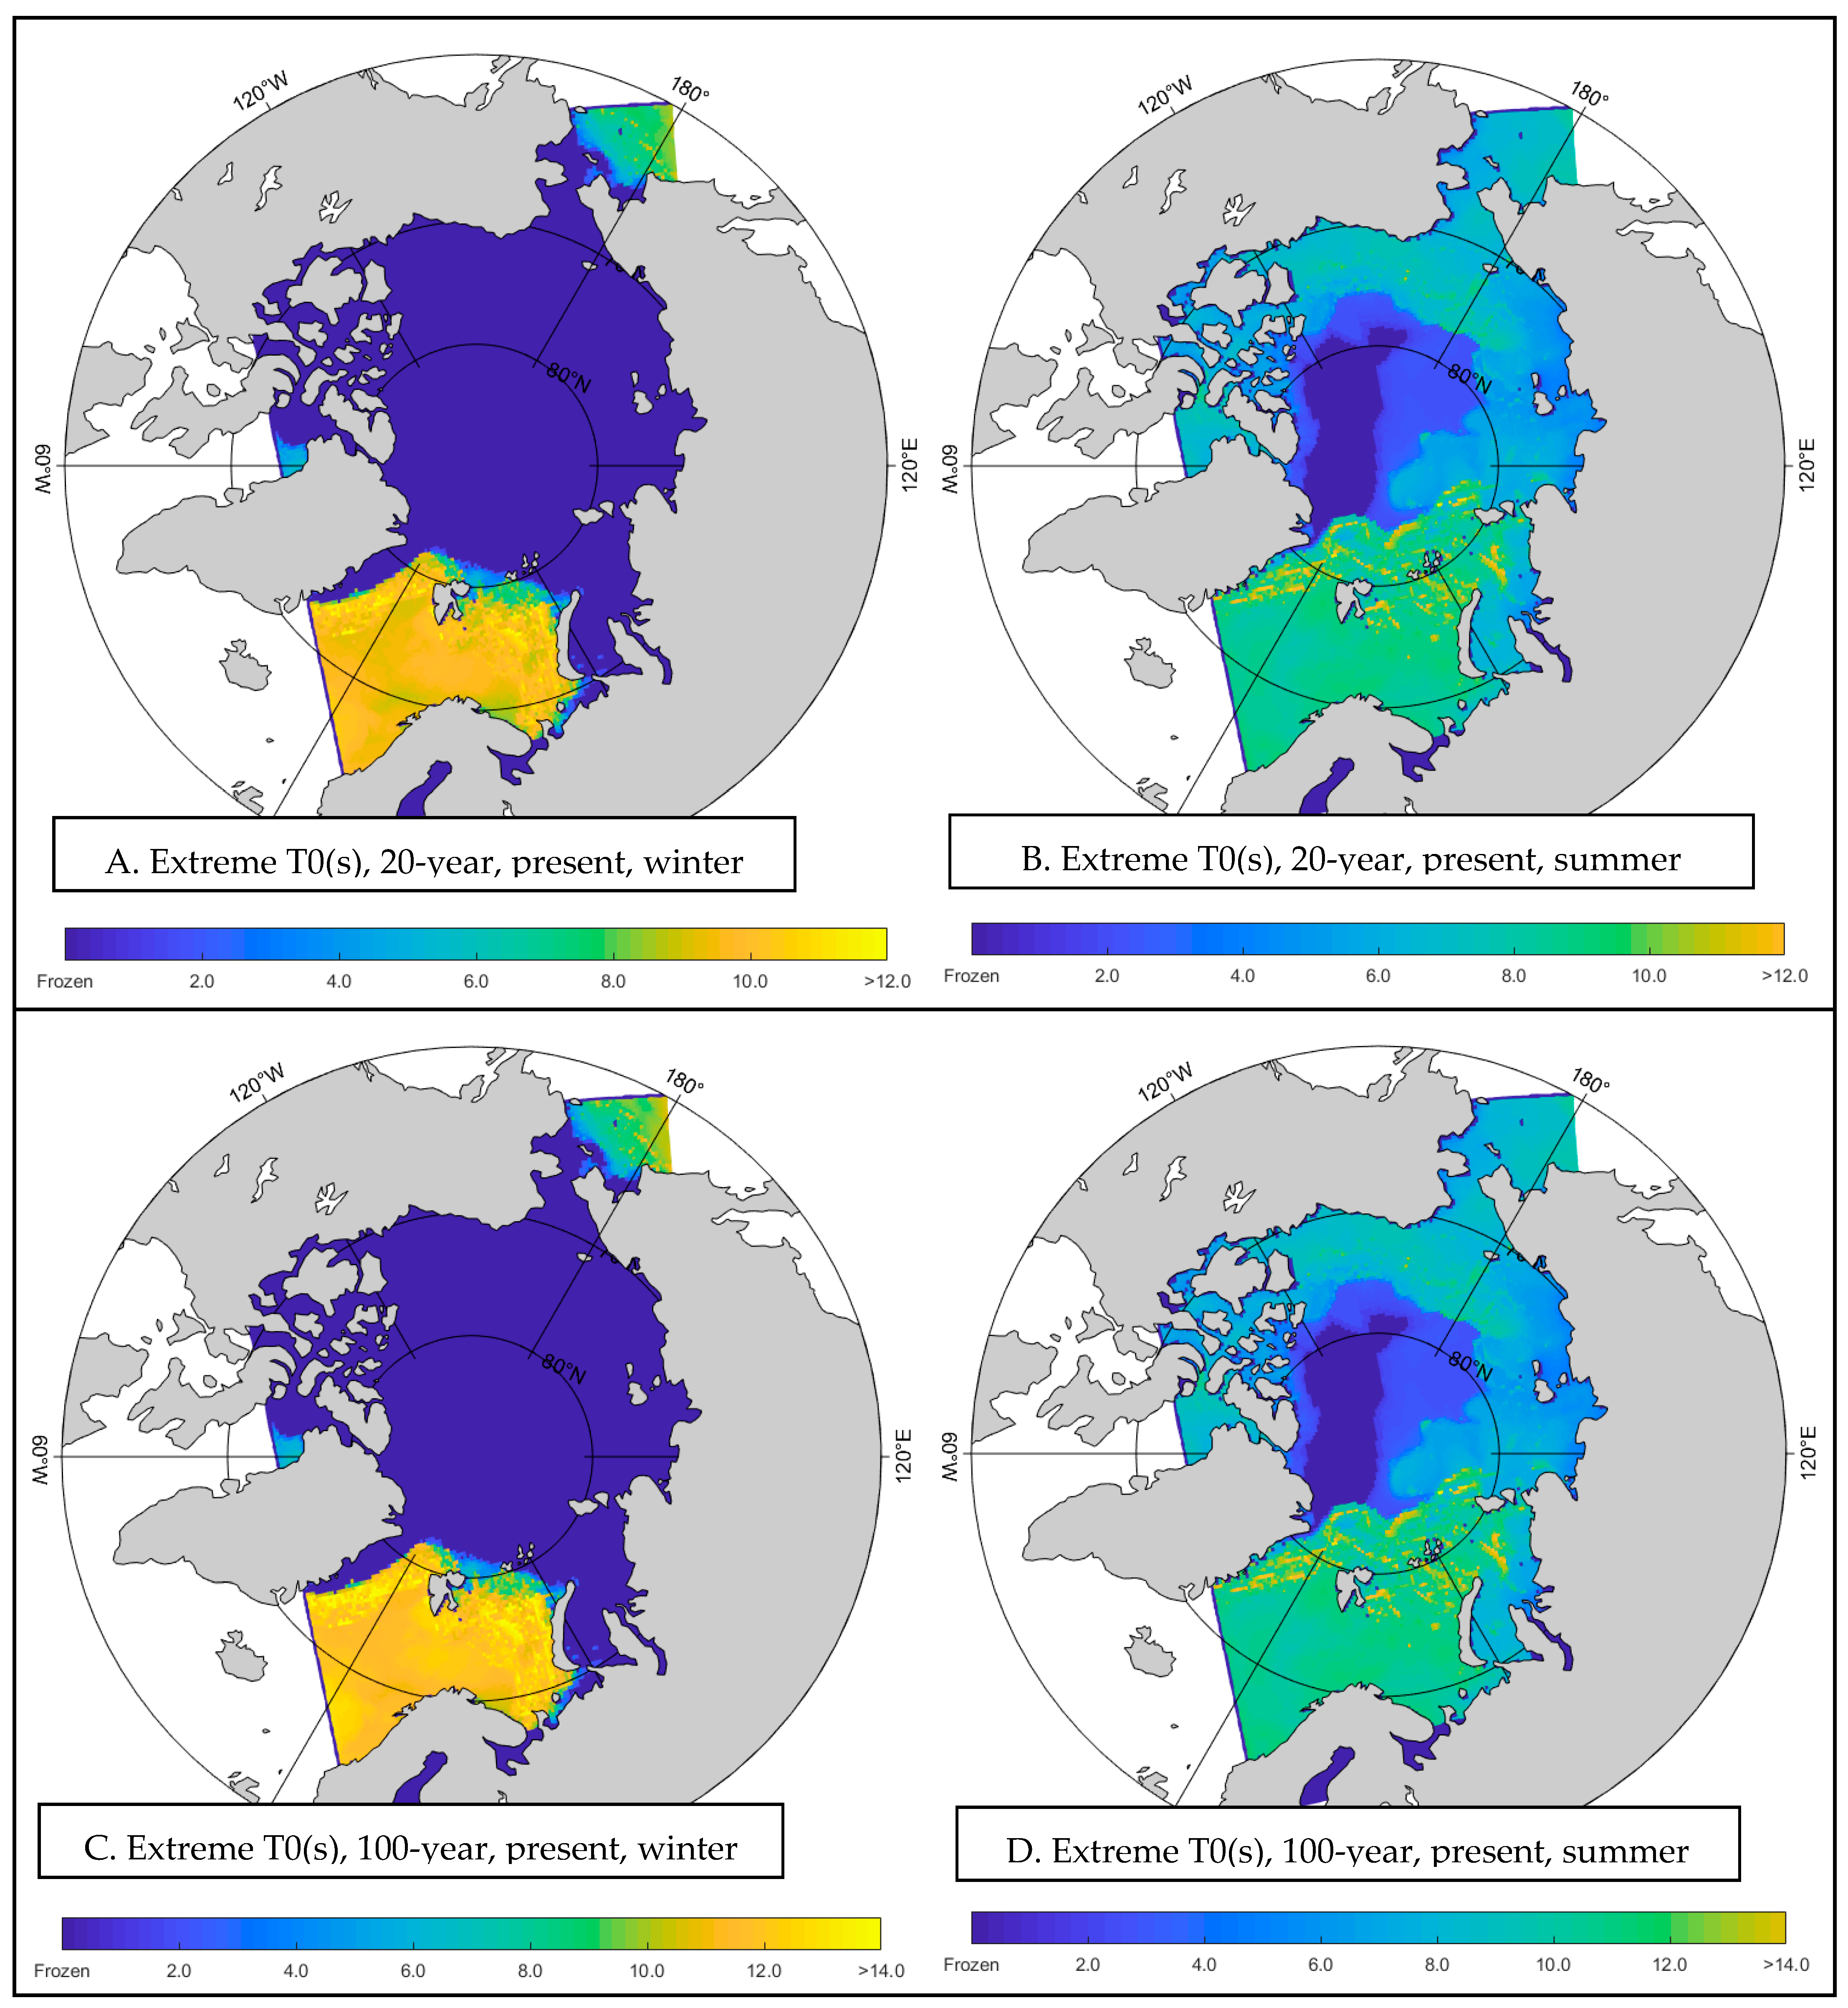
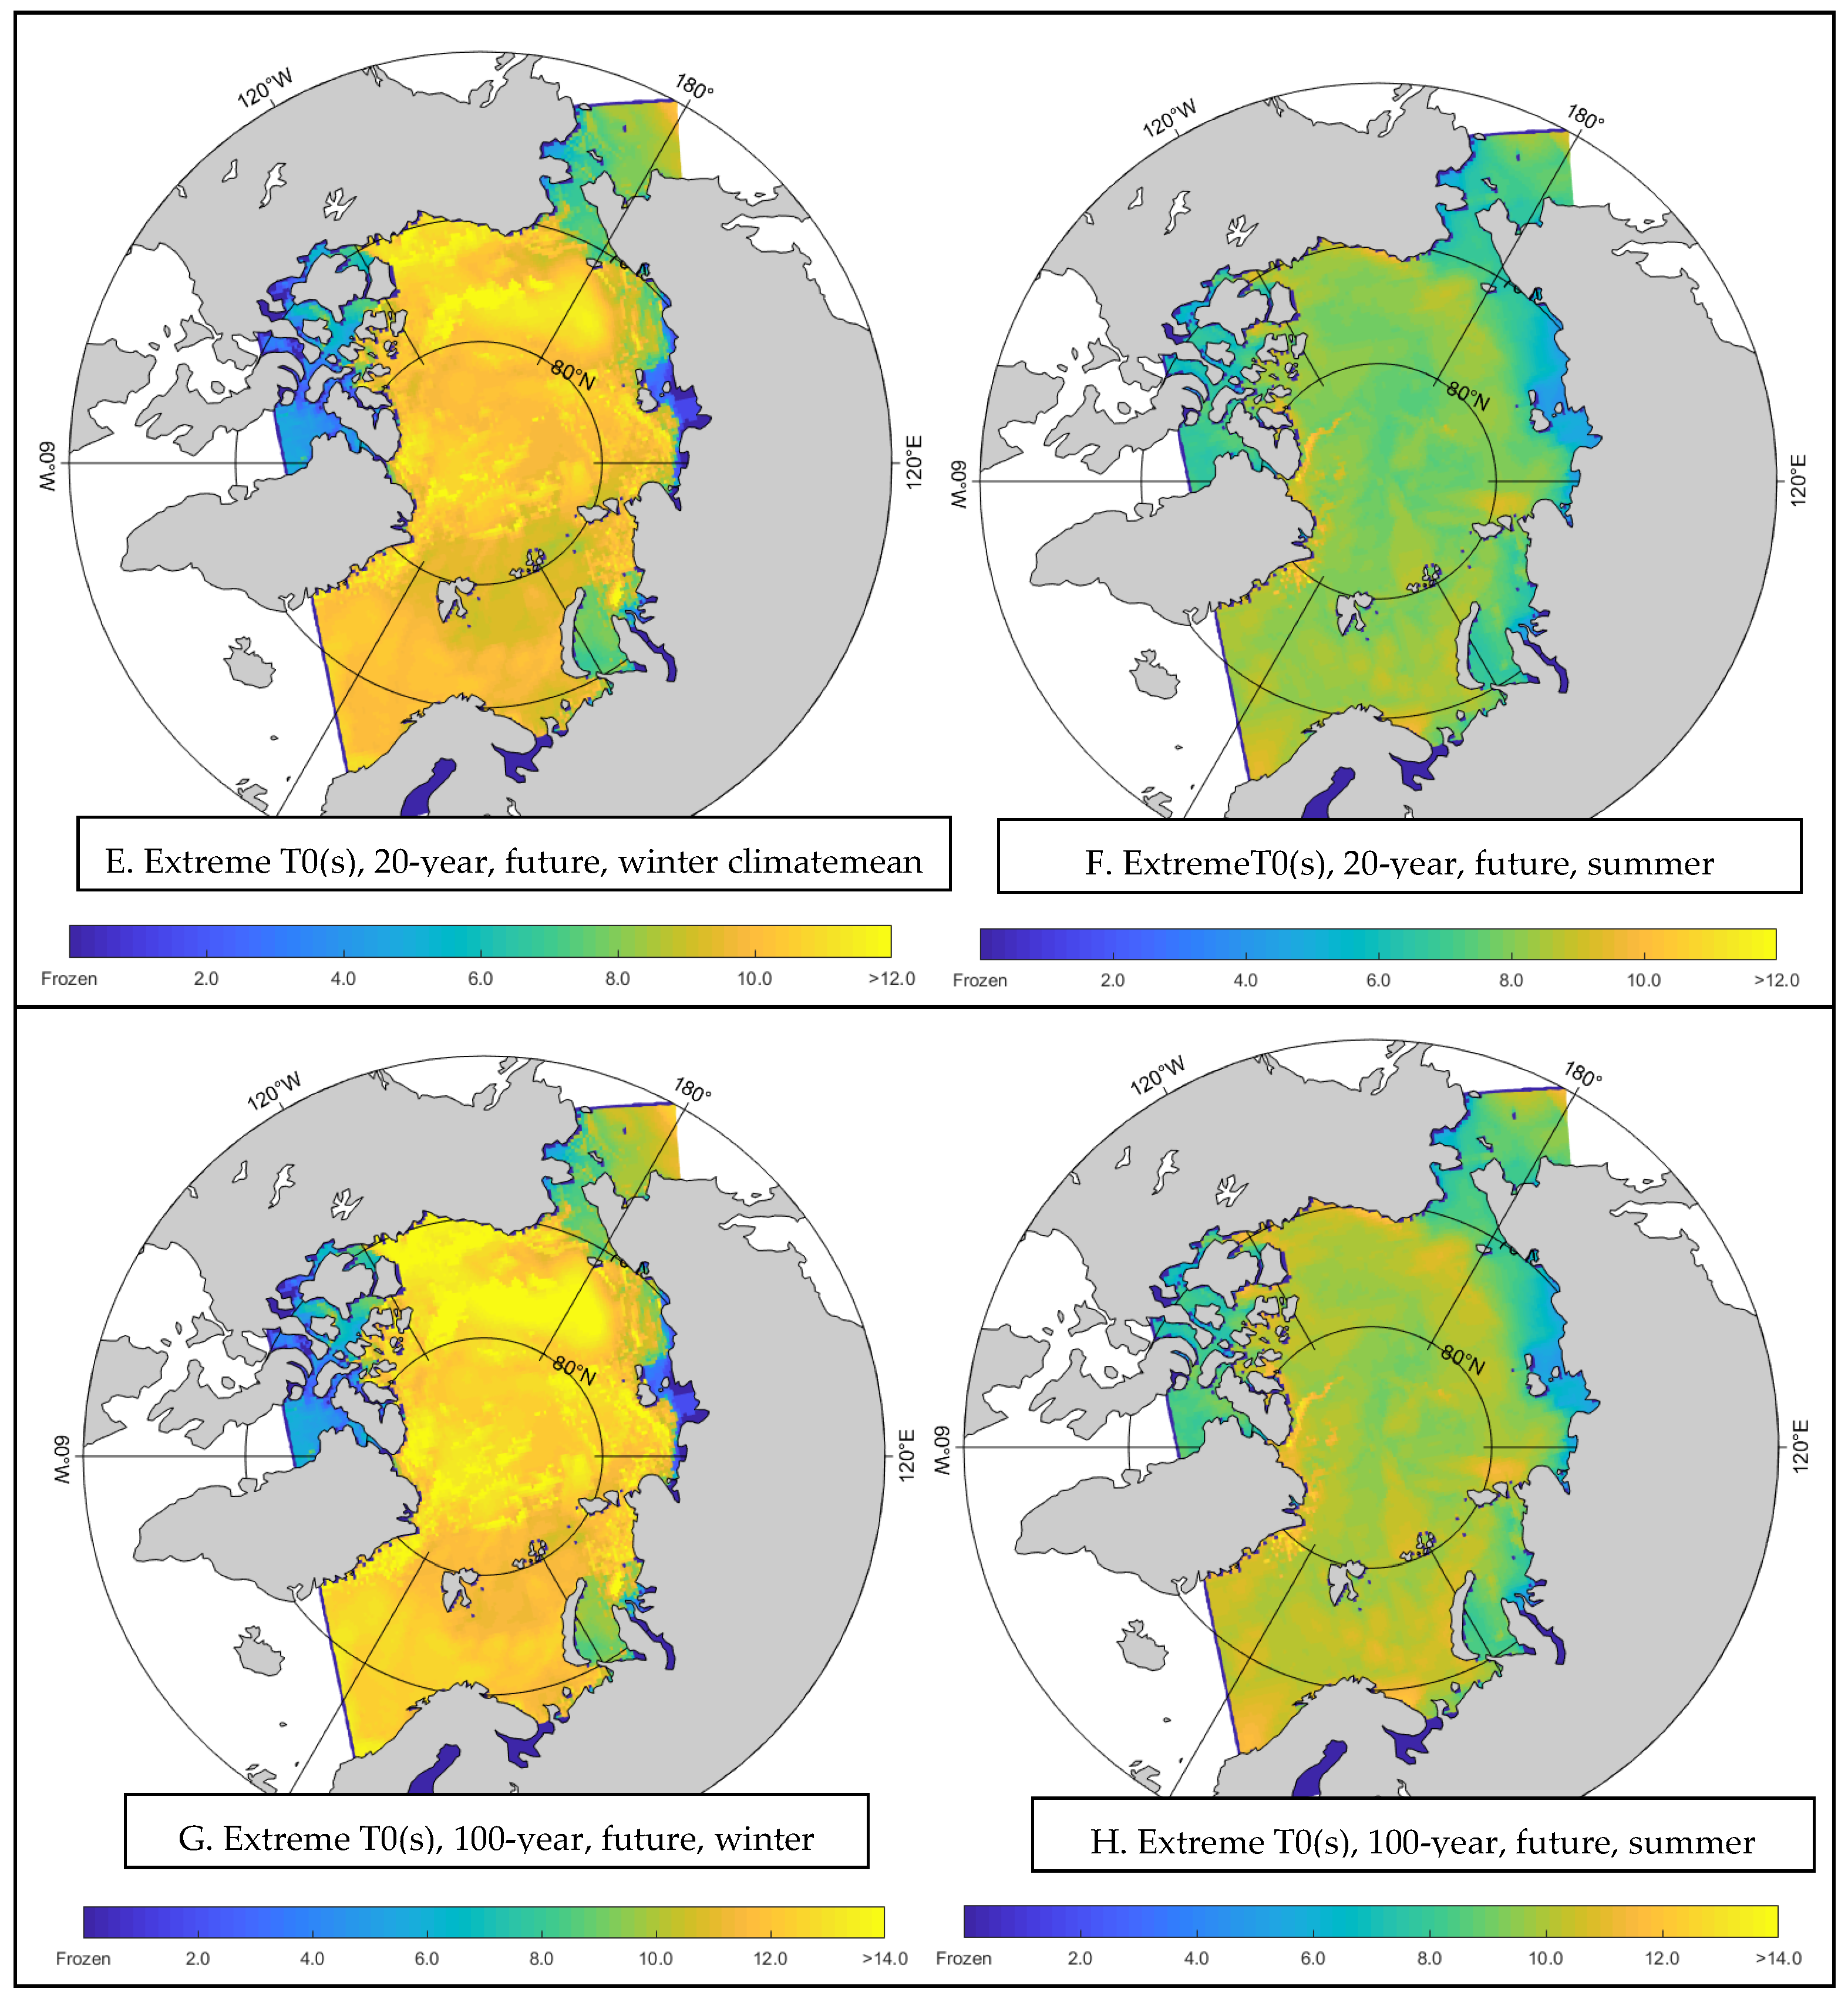
The analysis of extreme mean wave periods (T0), considering a 20-year return period for current winter conditions is depicted in Figure 7. Notably, the Greenland Sea, Barents Sea, and Fram Strait exhibit higher extreme T0 values, ranging between 10 and 14 s. Conversely, other regions remain unaffected by winter conditions and are classified as frozen seas. In contrast, future winter projections, also illustrated in Figure 7, projected significant changes. Here, extreme mean T0 values are more uniformly distributed across the study area, ranging from 10 to 15 s, with coastal areas experiencing lower values (0 to 8 s). Furthermore, a marked increase in extreme T0 values is anticipated in future scenarios.
During the present summer period, parts of the Arctic Ocean remain frozen, with the Greenland Sea, Fram Strait, and Barents Sea experiencing higher extreme T0 values of 10–12 s. Other areas show reduced values, between 6 and 10 s. Most nearshore and coastal regions within the study domain are expected to encounter extreme T0 values ranging from 3.0 to 7.0 s, as indicated in Figure 7. Extreme T0 values tend to increase in coastal areas farther from the shore and in open ocean regions. Future summer projections reveal a departure from current patterns in the Arctic Ocean and its adjacent seas, including the Kara Sea, East Siberian Sea, Laptev Sea, Beaufort Sea, and also Chukchi Sea which are projected to experience higher extreme T0 values. While an increasing trend is noted in these areas, others may remain stable or witness reduced values. The future scenario suggests an extreme T0 value of 12 s.
For both present and also future climate scenarios, during winter and summer, extreme T0 values and their variations for a 100-year return period are summarized in Figure 7. These trends and anticipated changes align with those projected for the 20-year return period. It is noteworthy that estimates for extreme T0 values for the 100-year return period are higher than those for the 20-year period, mirroring patterns observed with significant wave height (Hs) projections.

4. Concluding Discussion

This study aimed to conduct a thorough assessment of wave regimes and their extreme values under current and future climate scenarios during winter and summer in the Arctic. To this end, wave parameters like the significant wave height (Hs), zero crossing period (T0), and also mean wave direction (MWD) for two distinct 30-year intervals were analyzed; the current climate is depicted by the period 1980–2009, while the future climate is projected for 2070–2099. These datasets were generated using the WW3 wave model, adhering to the IPCC climate scenario RCP8.5.
The analysis covered wave characteristics across the study area, identifying zones with varying ranges of Hs, T0, and MWD. This enabled a detailed understanding of wave regimes for both winter and summer seasons under current and projected climate conditions. Statistical methods were employed to evaluate extreme wave parameters throughout the area. Time series data for Hs, T0, and MWD were compiled for four scenarios: present and future climates, each during winter and summer. We show that extreme values for 20-year and also 100-year return periods were calculated using Exponential, Gumbel, and also Weibull distribution functions.
As anticipated, wave regimes for winter and summer seasons, along with present and future climates, exhibited significant differences primarily due to changes in sea ice conditions. The projection for the future climate scenario suggests substantial sea ice reduction and increased open water in regions of the Arctic Ocean, including the Kara Sea, Laptev Sea, E. Siberian Sea, Beaufort Sea, Chukchi Sea, Canadian Arctic Archipelago, and Baffin Bay. Generally, lower Hs values are associated with shorter T0 values, and vice versa, although establishing a consistent correlation between these variables and MWD proved challenging across the study area.
Changes in sea ice cover, and sea ice compositions, MIZ, etc., in warmer climate change scenarios, whether determined from AR5 or AR6 climate models, lead to changes in the geographical areas of open water. These modify the air–sea fluxes as well as associated sea surface temperatures, storm intensities their spatial structures, trajectories and storm tracks. Therefore, the associated wind fields are modulated. The winds directly determine the surface waves, and modulations in the winds thereby exhibit changes in directions, speeds and maximums, as displayed in this study.
Our findings align with prior research [2,3]. These studies indicate that climate change is probably going to increase extreme wave heights and periods in many parts of the study area, while some regions may see no change or even a decrease. These trends underscore the primary impact of climate change: the reduction in sea ice, and the resulting modulations in wave climate estimates.
In this paper, we examine the variation and trends in Arctic wave parameters, explicitly including the MIZ, comparing historical (1980–2009) with projected future IPCC scenario (2070–2099) periods. There is novelty in the methodology and the results. Firstly, we explicitly use relatively new formulations for MIZ wave-ice interactions [4,6,7], and we show the extent of their impacts on the results. Secondly, to compare wave maps generated by these models, and to go beyond subjective visual comparisons, we use advanced techniques for objective map comparison and spatial relationship quantification, following previous studies [9,10]. Thus, we first use a similarity matrix, applying the kappa variable and cell-by-cell numerical comparison methods to assess model congruence across different conditions. Then, secondly, we also adopt the more traditional approach to evaluate the wave climate in terms of mean wave direction (MWD), significant wave height (Hs), mean wave period (T0), and extreme values for 20 and also 100-year return periods.
Future research will consider a number of topics that were not covered here. For example, the present study did not investigate storm tracking and climate change, which is considered in the recent study of winter Arctic cyclones [19], and for spring cyclones [45]. The former found that while no significant changes in the minimum central pressures or in the total number of Winter Arctic cyclones are suggested, there are suggested significant changes in the spatial patterns, with increases in their frequencies and their vorticities, over the western Arctic. With the movement poleward of the polar frontal zone and also increased low-level tropospheric baroclinicity, it is expected that more cyclones may form within the Arctic basin and migrate to the western-central Arctic, with associated changes in cyclones over the Atlantic Arctic. Changes in cyclone track density and intensity correspond to modulations in winds and wind-generated waves, becoming more pronounced with increased radiative forcing.
An additional topic for future research concerns the possible effects of currents on the wave climate. The coupling of waves and currents is a topic that is beyond the scope of the present paper. Major Arctic current systems, such as the Beaufort Gyre and the Transpolar Drift, are influenced by wind forcing, sea-ice melting and freshwater inputs. As sea ice declines, the Beaufort Gyre may become faster and more turbulent, largely because reduced ice allows more direct wind forcing, which can intensify wind-driven circulation, feeding back to alter wind patterns [46]. Changes in ocean currents can alter ice distributions, as well as sea surface temperatures, which also feeds back on atmospheric pressure patterns and wind patterns [47].
Additionally, large-scale wind shifts imply wind-driven changes. These have been suggested [48] to give up to about 30% of sea ice melting and Arctic warming during 1979–2020, and over 50% during 2000–2012, which is the fastest warming Arctic decade, so far in the satellite record. During specific years with anomalous wind patterns (like 2020) these wind-induced changes are said to account for up to 40–90% of observed ice changes from June to October from 2000 to 2012, compared to contributions from anthropogenic forcing that are about 30–40% of observed changes, throughout the year.
Finally, large-scale climate patterns (like Arctic Oscillation—AO) can modulate climate. AO is an important climate mode of atmospheric variability in the Arctic. Its positive and negative phases can shift the location and intensity of storms and their wind fields and patterns. AO phases are influenced by oceanic and atmospheric processes, which are also modulated by climate change. El Niño—Southern Oscillation (ENSO) primarily affects tropical and mid-latitude regions, and although its teleconnections can reach the Arctic, the effects are generally weaker than those of AO or local ocean-atmospheric interactions. However, in terms of climate change projections and IPCC projections, indices like AO and ENSO are not predictable, whether for AR5 or AR6 climate models.

Author Contributions

Conceptualization, W.P. and H.G.; methodology, software, validation, formal analysis, investigation, all authors; data curation, H.G., B.T., M.C., M.Z., Z.L. and M.H.M.; writing—original draft preparation, H.G.; writing—review and editing, W.P. and H.G.; visualization, H.G.; supervision, project administration, funding acquisition, W.P. All authors have read and agreed to the published version of the manuscript.

Funding

We were supported by Canada’s Competitive Science Research Fund (CSRF) Program, Ocean Frontier Institute and Marine Environmental Observation, Prediction and Response Network in this study.

Institutional Review Board Statement

Not applicable.

Informed Consent Statement

Not applicable.

Data Availability Statement

Data are available on request from the corresponding author, until the process of data transfer to the Government of Canada Open Data Platform (cited above) is complete.

Acknowledgments

We thank colleagues at the Department of Fisheries and Oceans Canada for providing comments and encouragement during the preparation of this study.

Conflicts of Interest

The authors declare no conflict of interest.

References

  1. Zhang, Y.; Beer, M.; Quek, S.T. Long-term performance assessment and design of offshore structures. Comput. Struct. 2015, 154, 101–115. [Google Scholar] [CrossRef]
  2. Khon, V.C.; Mokhov, I.I.; Pogarskiy, F.A.; Babanin, A.; Dethloff, K.; Rinke, A.; Matthes, H. Wave heights in the 21st century Arctic Ocean simulated with a regional climate model. Geophys. Res. Lett. 2014, 41, 2956–2961. [Google Scholar] [CrossRef]
  3. Casas-Prat, M.; Wang, X.L. Projections of extreme ocean waves in the Arctic and potential implications for coastal inundation and erosion. J. Geophys. Res. Ocean. 2020, 125, e2019JC015745. [Google Scholar] [CrossRef]
  4. Meylan, M.H.; Perrie, W.; Toulany, B.; Hu, Y.; Casey, M.P. On the Three-dimensional Scattering of Waves by Flexible Marginal Ice Floes. J. Geophys. Res. 2020, 125, e2019JC015868. [Google Scholar] [CrossRef]
  5. Perrie, W.; Hu, Y. Air-ice-ocean momentum exchange. Part 1: Energy transfer between waves and ice floes. J. Phys. Oceanogr. 1996, 26, 1705–1720. [Google Scholar] [CrossRef]
  6. Perrie, W.; Meylan, M.; Toulany, B.; Casey, M. Modelling Wave-Ice Interactions in Three-Dimensions in the Marginal Ice Zone. Philos. Trans. R. Soc. A 2022, 380, 20210263. [Google Scholar] [CrossRef]
  7. Perrie, W.; Meylan, M.; Toulany, B.; Casey, M.; Hu, Y. Modelling Wave-Ice Interactions in Three-Dimensions in the Marginal Ice Zone of the Beaufort Sea. In Proceedings of the 105th Annual AMS Meeting 2025, New Orleans, LA, USA, 12–16 January 2025; Volume 105, p. 450201. [Google Scholar]
  8. Moreno-Ibáñez, M. Polar low research: Recent developments and promising courses of research. Front. Earth Sci. 2024, 12, 1368179. [Google Scholar] [CrossRef]
  9. Goda, Y. Random Seas and Design of Maritime Structures; World Scientific: Singapore, 2010. [Google Scholar]
  10. Jonathan, P.; Ewans, K. Statistical modelling of extreme ocean environments for marine design: A review. Ocean. Eng. 2013, 62, 91–109. [Google Scholar] [CrossRef]
  11. Long, Z.; Perrie, W. Changes in Ocean Temperatures in the Barents Sea in the Twenty-First Century. J. Clim. 2017, 30, 5901–5921. [Google Scholar] [CrossRef]
  12. Blumberg, A.F.; Mellor, G.L. A description of a three dimensional coastal ocean circulation model. In Three-Dimensional Coastal Ocean Models; Heaps, N.S., Ed.; American Geophysical Union: Slidell, LA, USA, 1987; pp. 1–16. [Google Scholar]
  13. Hibler, W.D., III. Adynamic thermodynamic sea ice model. J. Phys. Ocean. 1979, 9, 815–864. [Google Scholar] [CrossRef]
  14. Long, Z.; Perrie, W. Impacts of climate change on fresh water content and sea surface height in the Beaufort Sea. Ocean. Model. 2013, 71, 127–139. [Google Scholar] [CrossRef]
  15. Long, Z.; Perrie, W. Scenario changes of Atlantic water in the Arctic Ocean. J. Clim. 2015, 28, 5523–5548. [Google Scholar] [CrossRef]
  16. Zhang, M.; Perrie, W.; Long, Z. Dynamical Downscaling of the Arctic Climate with a Focus on Polar Cyclone Climatology. Atmos.-Ocean. 2017, 57, 41–60. [Google Scholar] [CrossRef]
  17. Zhang, M.; Perrie, W.; Long, Z. Future changes in the winter Beaufort High under warming climate scenarios. Geophys. Res. Lett. 2024, 51, e2024GL110317. [Google Scholar] [CrossRef]
  18. Meucci, A.; Young, I.R.; Hemer, M.; Trenham, C.; Watterson, I.G. 140 Years of Global Ocean Wind-Wave Climate Derived from CMIP6 ACCESS-CM2 and EC-Earth3 GCMs: Global Trends, Regional Changes, and Future Projections. J. Clim. 2023, 36, 1605–1631. [Google Scholar] [CrossRef]
  19. Zhang, M.; Perrie, W.; Long, Z. Impacts of climate change on Arctic winter cyclones. JGR–Atmos. 2025, 129, e2024JD041503. [Google Scholar] [CrossRef]
  20. WW3DG–The WAVEWATCH III® Development Group. User Manual and System Documentation of WAVEWATCH III® Version 5.16 (Tech. Note No. 329); NOAA/NWS/NCEP/MMAB: College Park, MD, USA, 2016; p. +Appendices.
  21. Ardhuin, F.; Pogers, E.; Babanin, A.V.; Filipot, J.-F.; Magne, R.; Roland, A.; van der Westhuysen, A.; Queffeulou, P.; Lefevre, J.-M.; Aouf, L.; et al. Semi-empirical dissipation source functions for wind-wave models: Part I, definition, calibration and validation. J. Phys. Oceanogr. 2010, 40, 1917–1941. [Google Scholar] [CrossRef]
  22. Rascle, N.; Ardhuin, F. A global wave parameter database for geophysical applications. Part 2: Model validation with improved source term parameterization. Ocean Model. 2013, 70, 174–188. [Google Scholar] [CrossRef]
  23. Ardhuin, F.; Collard, F.; Chapron, B.; Girard-Ardhuin, F.; Guitton, G.; Mouche, A.; Stopa, J.E. Estimates of ocean wave heights and attenuation in sea ice using the SAR wave mode on Sentinel-1A. Geophys. Res. Lett. 2015, 42, 2317–2325. [Google Scholar] [CrossRef]
  24. Wada, A.; Kunii, M. The role of ocean-atmosphere interaction in Typhoon Sinlaku (2008) using a regional coupled data assimilation system. J. Geophys. Res. Ocean. 2017, 122, 3675–3695. [Google Scholar] [CrossRef]
  25. Masson, D.; LeBlond, P.H. Spectral evolution of wind-generated surface gravity waves in a dispersed ice field. J. Fluid Mech. 1989, 202, 111–136. [Google Scholar] [CrossRef]
  26. Meylan, M.H.; Masson, D. A linear Boltzmann equation to model wave scattering in the marginal ice zone. Ocean Model 2006, 11, A17–A27. [Google Scholar] [CrossRef]
  27. Liu, A.K.; Mollo-Christensen, E. Wave propagation in a solid ice pack. J. Phys. Ocean. 1988, 18, 1702–1712. [Google Scholar] [CrossRef]
  28. Rogers, W.E.; Meylan, M.H.; Kohout, A.L. Estimates of spectral wave attenuation in Antarctic sea ice, using model/data inversion. Cold Reg. Sci. Technol. 2021, 182, 103198. [Google Scholar] [CrossRef]
  29. Meylan, M.H.; Bennetts, L. Three-dimensional time-domain scattering of waves in the marginal ice zone. Phil. Trans. R. Soc. A 2018, 376, 20170334. [Google Scholar] [CrossRef]
  30. Meylan, M.H.; Squire, V.A.; Fox, C. Towards realism in modeling ocean wave behavior in marginal ice zones. J. Geo-Phys. Res. 1997, 102, 22981–22991. [Google Scholar] [CrossRef]
  31. Hibler, W.D., III. Modeling a variable thickness sea ice cover. Mon. Weather Rev. 1980, 108, 1943–1973. [Google Scholar] [CrossRef]
  32. Monserud, R.A.; Leemans, R. Comparing global vegetation maps with the Kappa statistic. Ecol. Model. 1992, 62, 275–293. [Google Scholar] [CrossRef]
  33. Pérez, J.; Díaz, J.; Garcia-Martin, J.; Tabuenca, B. Systematic literature reviews in software engineering—Enhancement of the study selection process using Cohen’s Kappa statistic. J. Syst. Softw. 2020, 168, 110657. [Google Scholar] [CrossRef]
  34. Yang, Z.; Zhou, M. Kappa statistic for clustered physician–patients polytomous data. Comput. Stat. Data Anal. 2015, 87, 3–17. [Google Scholar] [CrossRef]
  35. Bulteau, T.; Lecacheux, S.; Lerma, A.N.; Paris, F. Spatial extreme value analysis of significant wave heights along the French coast. In Proceedings of the International Short Conference on Advances in Extreme Value Analysis and Application to Natural Hazards: EVAN2013, Siegen, Germany, 18 September 2013; p. hal-00857627. [Google Scholar]
  36. Dey, D.K.; Yan, J. Extreme Value Modeling and Risk Analysis: Methods and Applications; Chapman Hall Press: London, UK, 2020; 540p, ISBN 9780367737399. [Google Scholar]
  37. Menéndez, M.; Méndez, F.J.; Losada, I.J.; Graham, N.E. Variability of extreme wave heights in the northeast Pacific Ocean based on buoy measurements. Geophys. Res. Lett. 2008, 35, L22607. [Google Scholar] [CrossRef]
  38. Challenor, P.G.; Wimmer, W.; Ashton, I. Climate Change and Extreme Wave Heights in the North Atlantic; Special Publication; European Space Agency: Paris, France, 2005; Volume 572, pp. 1253–1257. [Google Scholar]
  39. Chini, N.; Stansby, P.; Leake, J.; Wolf, J.; Roberts-Jones, J.; Lowe, J. The impact of sea level rise and climate change on inshore wave climate: A case study for East Anglia (UK). Coast. Eng. 2010, 57, 973–984. [Google Scholar] [CrossRef]
  40. Mori, N.; Yasuda, T.; Mase, H.; Tom, T.; Oku, Y. Projection of extreme wave climate change under global warming. Hydrol. Res. Lett. 2010, 4, 15–19. [Google Scholar] [CrossRef]
  41. Young, I.R.; Vinoth, J.; Zieger, S.; Babanin, A.V. Investigation of trends in extreme value wave height and wind speed. J. Geophys. Res. 2012, 117, C00J06. [Google Scholar] [CrossRef]
  42. Young, I.R.; Zieger, S.; Babanin, A.V. Global trends in wind speed and wave height. Science 2011, 332, 451–455. [Google Scholar] [CrossRef]
  43. Wang, X.L.; Swail, V.R.; Zwiers, F.W.; Zhang, X.; Feng, Y. Detection of external influence on trends of atmospheric storminess and ocean wave heights. Clim. Dyn. 2008, 32, 189–203. [Google Scholar] [CrossRef]
  44. Vesanto, J.; Alhoniemi, E. Clustering of the self-organizing map. IEEE Trans. Neural Netw. 2000, 11, 586–600. [Google Scholar] [CrossRef]
  45. Parker, C.L.; Mooney, P.A.; Webster, M.A.; Boisvert, L.N. The influence of recent and future climate change on spring Arctic cyclones. Nat. Commun. 2022, 13, 6514. [Google Scholar] [CrossRef] [PubMed]
  46. Timmermans, M.; Marshall, J. Understanding Arctic Ocean circulation: A review of ocean dynamics in a changing climate. J. Geophys. Res. 2020, 125, e2018JC014378. [Google Scholar] [CrossRef]
  47. Mioduszewski, J.; Vavrus, S.; Wang, M. Mioduszewski Vavrus Diminishing Arctic sea ice promotes stronger surface winds. J. Clim. 2018, 31, 8101–8119. [Google Scholar] [CrossRef]
  48. Ding, Q.; Schweiger, A.; Baxter, L. Nudging observed winds in the Arctic to quantify associated sea ice loss from 1979 to 2020. J. Clim. 2022, 35, 6797–6813. [Google Scholar] [CrossRef]
Figure 1. Overview of the Arctic Ocean, illustrating its bathymetry and surrounding seas. The specific area of focus for this research is outlined with dotted black lines.
Jmse 13 01562 g001
Figure 2. Similarity matrices for various ice models: This figure presents comparative matrices of similarity indices for different ice models across present and future climates, as well as winter and summer seasons. It includes comparisons for (i) mean wave direction, (ii) significant wave heights, and (iii) mean wave period. Models under similar conditions (same climate and season) exhibit higher similarity rates, indicated by green areas, while red areas show lower similarity rates, such as when comparing winter in the present with summer in the future.
Jmse 13 01562 g002aJmse 13 01562 g002bJmse 13 01562 g002c
Figure 3. Predominant Mean Wave Directions (MWD) in the study area as simulated by the MBS model for winter and summer under current climate conditions, Illustrating the Principal MWD and their occurrences (%).
Jmse 13 01562 g003aJmse 13 01562 g003b
Figure 4. Comparative analysis of maximum mean significant wave height (Hs) and associated occurrence frequencies (%) across winter and also summer seasons in the current climate scenario utilizing the MBS model.
Jmse 13 01562 g004aJmse 13 01562 g004b
Figure 5. Comparison of the maximum mean wave period (T0) and associated occurrence frequencies (%) for winter and summer seasons in the current climate, utilizing the MBS model.
Jmse 13 01562 g005aJmse 13 01562 g005b
Figure 6. Maximum significant wave heights for current climate conditions, represented for 20-year and also 100-year return periods during winter and summer seasons, derived from the MBS model.
Jmse 13 01562 g006aJmse 13 01562 g006b
Figure 7. Extreme T0 Values in the Present Climate for 20-Year and 100-Year Return Periods During Winter and Summer Seasons, Analyzed Using the MBS Model.
Jmse 13 01562 g007aJmse 13 01562 g007b
Disclaimer/Publisher’s Note: The statements, opinions and data contained in all publications are solely those of the individual author(s) and contributor(s) and not of MDPI and/or the editor(s). MDPI and/or the editor(s) disclaim responsibility for any injury to people or property resulting from any ideas, methods, instructions or products referred to in the content.