1. Introduction
Maritime terminals function as critical nodes in the global supply chain infrastructure, serving as essential interfaces between maritime and land-based transportation networks. Currently, maritime terminals need to optimize operational efficiency while maintaining service quality due to the expected increase in maritime traffic [
1].
Container yards are a key component of mid-size and small maritime terminals, often divided into separate sections for full (FCDs) and empty container depots (ECDs). Optimizing operations in both sections is critical for terminal efficiency, yet ECDs pose unique challenges due to their specific workflows and high space demands [
2]. These challenges are further exacerbated by the growing constraints and competition in port environments [
3,
4]. While the yard layout directly influences terminal performance [
5], the design and evaluation of ECDs remain understudied in the literature [
6].
Traditional container yard layout design and evaluation predominantly employ mathematical modeling, simulation, and analytical methods, with a strong focus on operational metrics such as efficiency, throughput capacity, cost, equipment utilization, and energy consumption [
5,
6,
7,
8,
9]. Although safety considerations are often acknowledged in broader terminal design principles, existing quantitative evaluation models systematically exclude safety as a measurable performance criterion. This omission is critical: while studies analyze many factors, they fail to account for the inherent trade-offs between efficiency and safety, particularly in high-risk areas such as congested intersections or overlapping equipment pathways, and in non-automated terminals where the use of equipment such as Top Lifters and Reach Stackers to accommodate containers is considered.
This systematic exclusion of safety metrics from quantitative evaluations represents a significant methodological limitation, as it precludes a comprehensive assessment of how layout configurations simultaneously affect both operational performance and workplace safety outcomes.
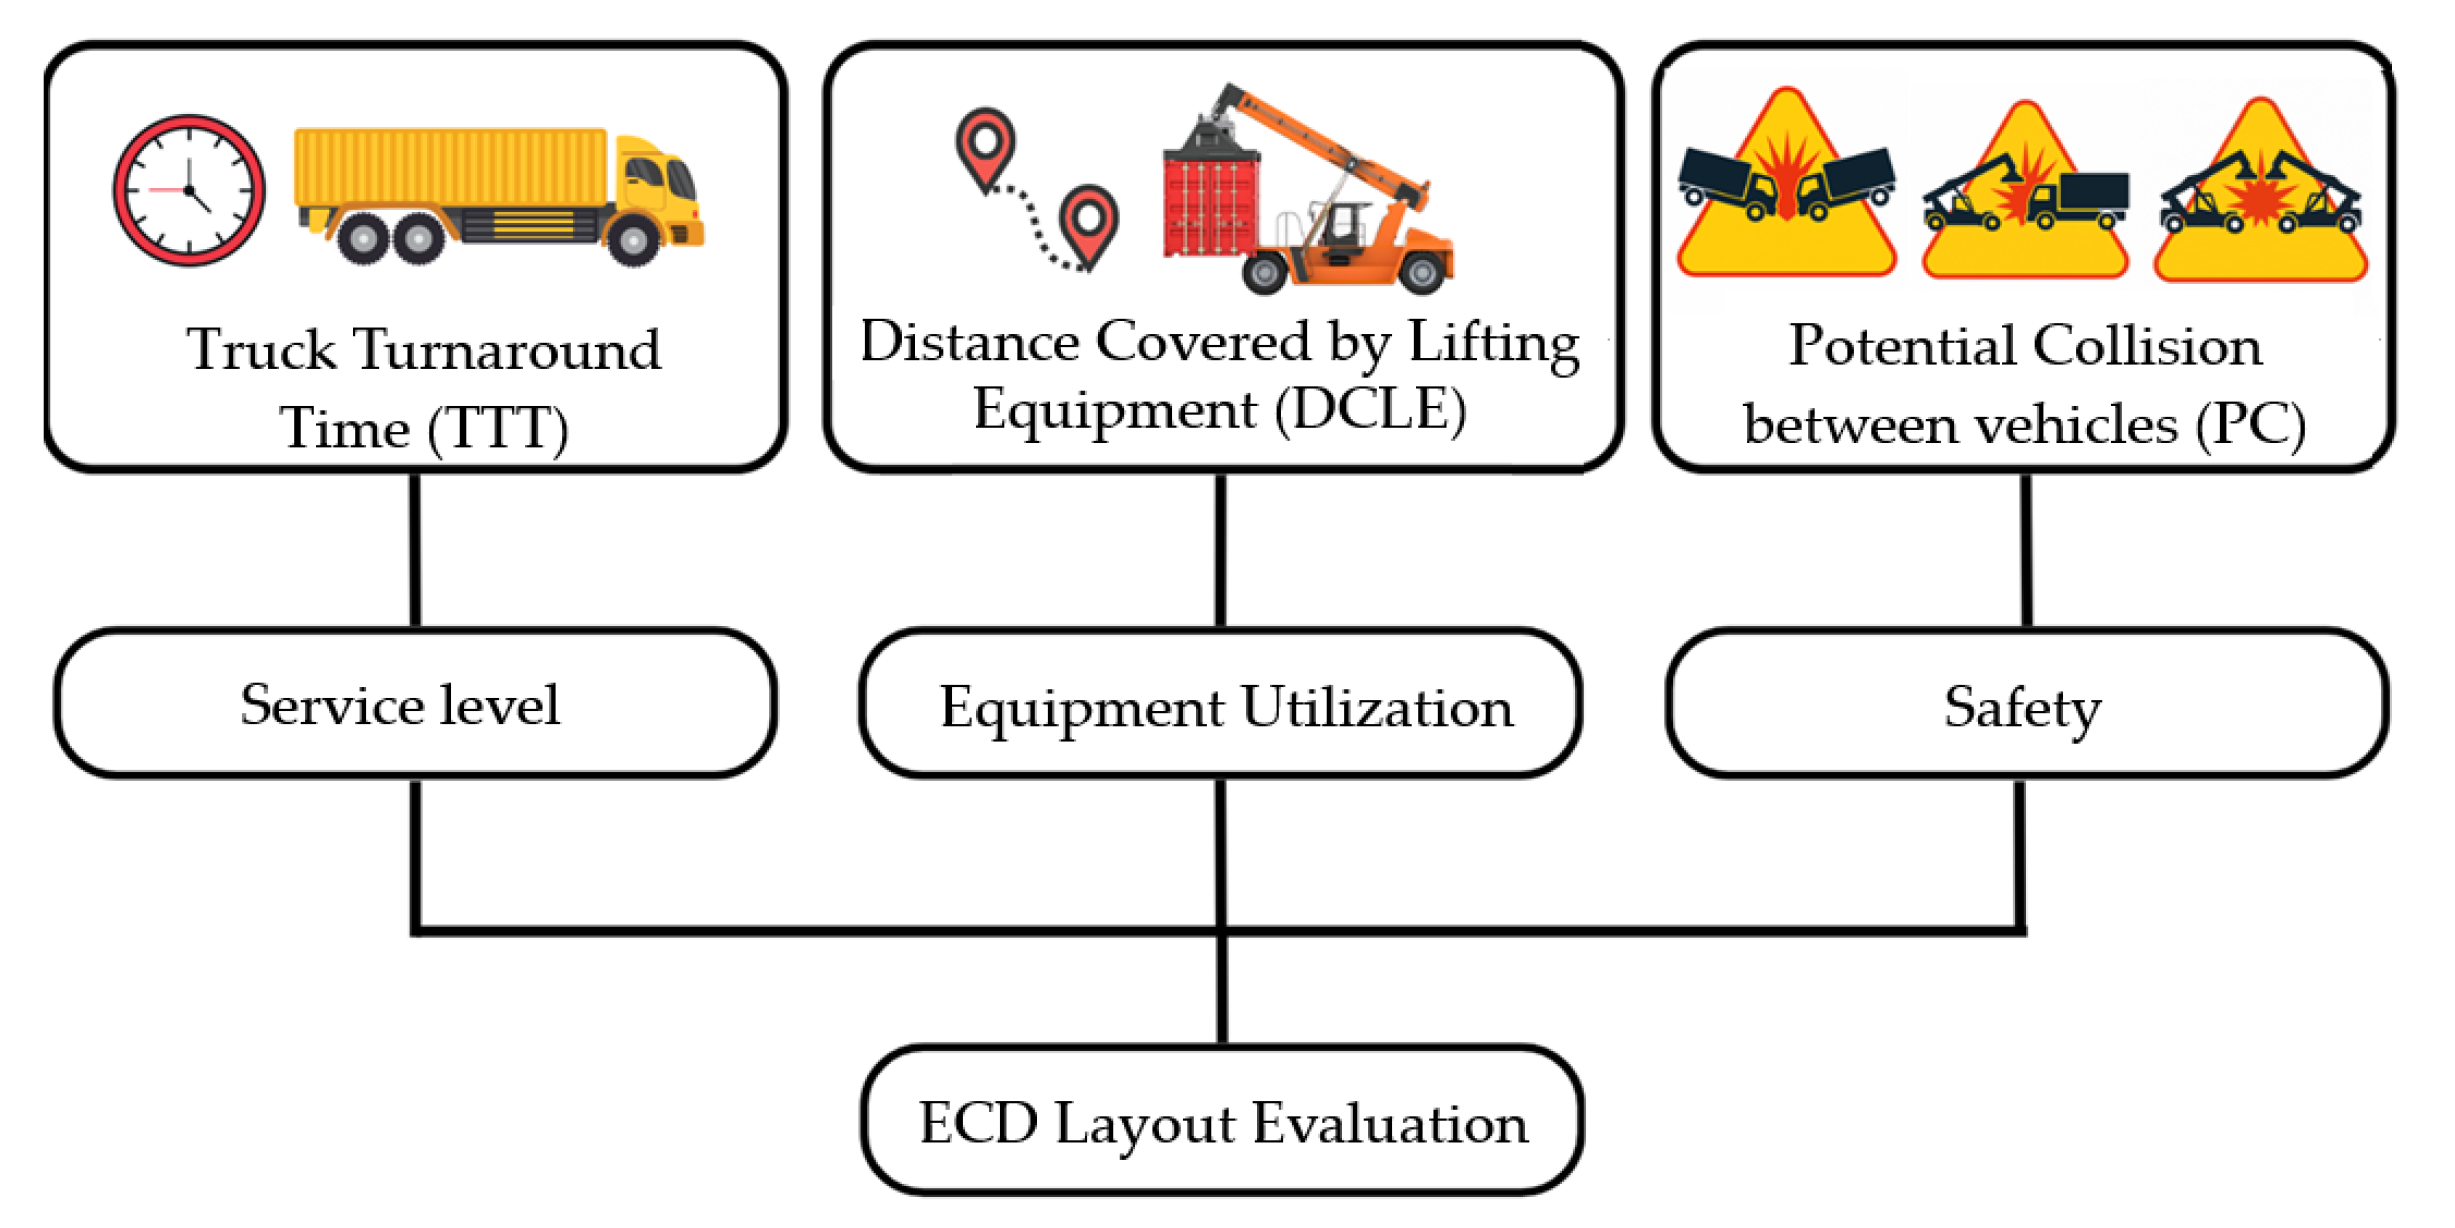
This study develops an integrated evaluation framework employing discrete event simulation (DES) to assess empty container yard layouts across three critical dimensions: truck service level, resource utilization, and safety parameters. Unlike conventional approaches that evaluate these dimensions separately, our framework combines them within a unified analytical structure, enabling explicit quantification of their interdependencies. The framework’s novelty lies in the three metrics system shown in
Figure 1:
Truck Turnaround Time (TTT): Measures throughput efficiency via the average duration trucks spend in the depot.
Distance Covered by lifting equipment (DCLE): Quantifies equipment utilization through total travel distance per lifting equipment.
Number of Potential Collisions (NPCs): Introduces a novel safety metric by counting simultaneous vehicle presence at high-risk intersections.
To validate the proposed framework, we conducted a case study at a non-automated multipurpose terminal in Chile handling substantial empty container volumes. The terminal exemplifies real-world complexities: (1) specialized workflows, (2) bottlenecks in specific zones, (3) equipment coordination inefficiencies, and (4) high-risk intersections with documented incidents.
The case study goes beyond theoretical validation by demonstrating how the framework identifies and quantifies spatial-risk relationships. Specifically, it investigates whether truck arrival frequency significantly affects collision risks at dangerous intersections, examines how operational conditions influence potential collisions, determines whether extended truck turnaround times increase collision probability, and evaluates whether lifting equipment travel distances amplify collision risk through increased operational interference. Additionally, this study assesses whether traditional efficiency indicators (TTT and DCLE) can serve as safety predictors for potential collisions at critical intersections. Through scenario analysis, this research provides managerial insights to optimize layout configurations that balance operational efficiency with safety performance in space-constrained maritime environments.
This paper is structured as follows:
Section 2 presents the background in design and evaluation of yard layouts;
Section 3 presents the methods;
Section 4 details the case study;
Section 5 explains the simulation model development;
Section 6 shows the main results and some managerial insights, and
Section 7 presents the main conclusions.
2. Literature Review
This literature review is specifically limited to articles that address layout design and evaluation in maritime terminals using simulation, analytical methods, and optimization approaches. Other articles associated with maritime terminals that do not address these specific issues are not considered in the review scope.
Researchers have conducted extensive research on container terminal layout optimization, focusing on yard configurations, equipment efficiency, and throughput maximization. The research mainly focuses on Automated Container Terminals (ACTs) [
10,
11]. Carlo et al. [
12] differentiated between overall terminal layouts (which optimize the general arrangement of yards and gates) and block-level designs (which focus on stacking patterns and crane deployment within storage blocks). However, most studies concentrate on general yard management in maritime terminals [
5], few have examined ECD-specific layouts [
13], leaving a gap in research on ECDs. A general focus on truck services and equipment utilization is present in the literature; however, safety considerations are absent. This section summarizes key studies on container terminal layout design and evaluation, categorizing them by methodology, performance metrics, layout type (overall/block), terminal type, and equipment used.
As summarized in
Table 1, most studies use a simulation-based approach to analyze container terminal performance, typically through operational indicators such as equipment utilization and truck turnaround times, which are closely linked to the overall container throughput [
14,
15,
16]. In Carboni et al. [
17], the environmental impact of operations is also considered through an emission-based indicator, while Sriphrabu & Chammanlor [
18] include employee utilization as part of their performance metrics.
A smaller set of studies use optimization or analytical models [
7,
19,
20,
21] to deal with container storage allocation and resource planning problems. Despite the methodological diversity, most studies focus on full-container terminals and assume the use of gantry-based systems, including yard and quay cranes. While some papers consider a detailed modeling of vehicle movements and queueing [
21], they often omit operational variability caused by traffic conflicts at intersections or interactions between vehicle flows and non-automated equipment. A notable exception is the hybrid traffic simulation framework proposed by Li et al. [
22], which uses traffic-flow modeling and discrete event simulation to evaluate port planning and congestion at intersections. The model features dynamic layout configurations and a vertex coloring algorithm for handling intersection conflicts and offers a more realistic representation of traffic conditions within the port. However, this study is performed in the context of multipurpose terminals and does not address the specific characteristics of container handling systems (the reason why it is not considered in
Table 1). Its relevance lies in demonstrating the feasibility and value of incorporating detailed traffic interactions, an aspect generally overlooked in the container terminal literature.
Another pattern observed in the reviewed studies is their emphasis on productivity-oriented performance indicators, mainly related to equipment and vehicle operations. Performance indicators such as crane utilization, container handling rate, and travel distances are the most common evaluation criteria (e.g., [
13,
16]). Although some studies include indicators related to vehicle flow efficiency (e.g., truck turnaround time), none of them consider safety-related performance, despite the operational complexity and congestion risks in terminal yards. Moreover, only a few papers analyze layouts involving mobile lifting cranes or explore the specific operational constraints of empty container depots (ECDs), with the exception of Karakaya et al. [
13], whose focus remains on aggregated yard performance.
Our work addresses these limitations by incorporating safety performance as a formal evaluation criterion alongside traditional productivity indicators. It also distinguishes from most studies by focusing on ECD operations, which involve different flow patterns and equipment behavior compared to full-container terminals. Unlike previous studies that rely exclusively on gantry-based systems, this study models operations involving mobile lifting cranes. This work addresses these limitations by incorporating safety performance as a formal evaluation criterion alongside traditional productivity metrics. It further distinguishes itself by focusing on ECD operations, which involve different flow patterns and equipment behavior compared to full-container terminals. Unlike previous studies that rely exclusively on gantry-based systems, this study models operations involving mobile lifting equipment (Top Lifters and Reach Stackers), a more typical ECD configuration in multipurpose settings. All these elements contribute to a more comprehensive assessment of terminal layout alternatives and their impact on both operational efficiency and safety outcomes.
Table 1.
Summary of literature review on layout design and evaluation in maritime terminals.
Table 1.
Summary of literature review on layout design and evaluation in maritime terminals.
| Reference | Modeling Approach | Case Study | Container Type | Equipment | Indicators |
|---|
| Simulation | Analytical Methods | Optimization | Full | Empty | Gantry-Based Systems | Mobile Lifting | Vehicle | Equipment | Security |
|---|
| Abu Aisha et al. (2020) [23] | | | ✓ | ✓ | ✓ | ✓ | ✓ | | ✓ | ✓ | |
| Carboni et al. (2024) [17] | ✓ | | | ✓ | ✓ | | ✓ | ✓ | ✓ | ✓ | |
| Colak et al. (2018) [24] | ✓ | | | ✓ | ✓ | | ✓ | | | ✓ | |
| Karakaya et al. (2022) [13] | | ✓ | | ✓ | | ✓ | | ✓ | | ✓ | |
| Kemme (2012) [25] | ✓ | | | | ✓ | | ✓ | | | ✓ | |
| Kim et al. (2008) [26] | | ✓ | | | ✓ | | ✓ | | ✓ | ✓ | |
| Kuznetsov et al. (2018) [14] | ✓ | | | | ✓ | ✓ | | | ✓ | ✓ | |
| Lee et al. (2018) [6] | | ✓ | ✓ | | ✓ | | ✓ | | ✓ | ✓ | |
| Liu et al. (2004) [27] | ✓ | | | ✓ | ✓ | | ✓ | | ✓ | ✓ | |
| Lee & Kim (2010a) [28] | ✓ | ✓ | | | ✓ | | ✓ | | | ✓ | |
| Lee & Kim (2010b) [29] | | ✓ | | | ✓ | | ✓ | | | ✓ | |
| Lee & Kim (2013) [30] | | ✓ | | | ✓ | | | | ✓ | ✓ | |
| Petering (2009) [31] | ✓ | | | | ✓ | | ✓ | | | ✓ | |
| Petering & Murty (2009) [32] | ✓ | | | | ✓ | | ✓ | | | ✓ | |
| Roy & Koster (2020) [33] | ✓ | ✓ | | | ✓ | | ✓ | | ✓ | ✓ | |
| Sriphrabu & Chammanlor (2020) [18] | ✓ | | | ✓ | ✓ | ✓ | | ✓ | ✓ | | |
| Srisurin et al. (2022) [15] | ✓ | | | ✓ | ✓ | ✓ | ✓ | ✓ | ✓ | ✓ | |
| Sun et al. (2012) [16] | ✓ | | | ✓ | ✓ | ✓ | ✓ | | ✓ | ✓ | |
| Taner et al. (2014) [34] | ✓ | | | | ✓ | | ✓ | | | ✓ | |
| Wiese et al. (2010) [20] | | | ✓ | | ✓ | | ✓ | | ✓ | ✓ | |
| Wiese et al. (2011) [19] | | ✓ | | | ✓ | ✓ | ✓ | | ✓ | ✓ | |
| Wiese et al. (2013) [7] | | ✓ | | | ✓ | | | ✓ | | ✓ | |
| Zhou et al. (2016) [21] | ✓ | | ✓ | ✓ | ✓ | | ✓ | | ✓ | ✓ | |
| This work | ✓ | | | ✓ | | ✓ | | ✓ | ✓ | ✓ | ✓ |
3. Methods
This project employs a comprehensive methodology to analyze and enhance ECD operations adapted from the framework proposed by Law & Kelton [
35]. The approach centers on simulation-based analysis while integrating iterative feedback loops between phases. The main steps are process documentation; operational flows definition; data gathering and analysis; simulation model development; experimental design; and results analysis.
This section describes the steps of Law and Kelton’s framework to analyze the interplay between truck arrival frequencies and operational conditions with truck turnaround times, distances covered by lifting equipment, and the number of potential collisions in ECD settings.
3.1. The Case Study: Process Documentation, Operational Flows Definition, and Data Gathering
Over two months, data was collected through regular terminal visits, including direct observation, interviews with depot supervisors and first-line operators, and systematic field notes on operational processes. Documentation and analysis covered all primary procedures associated with container services, lifting equipment utilization, and truck management. The thorough documentation allowed us to extract detailed process descriptions, capacity specifications, and operational decision logics.
Building upon this foundational data collection, detailed insights were captured into how trucks and containers moved through the depot, from entrance until departure, revealing variations in workflow logic. Iterative adjustments were made by revisiting the process documentation phase to clarify ambiguities and refine flow definitions. Finally, flowcharts were developed to improve visual comprehension of these complex processes.
Complementing the observational approach, additional data was gathered through field visits, internal datasets, and direct observation samples. The terminal provided access to the Terminal Operating System (TOS) and databases containing historical operational information, which facilitated timing process durations and measuring vehicle driving speeds.
Following data collection, we perform an exploratory data analysis (EDA) to uncover key operational patterns and establish baseline performance metrics that would inform subsequent analysis phases. Kolmogorov–Smirnov (KS) tests were employed to evaluate the appropriateness of the statistical distributions modeling inter-arrival and process times.
A case study description that contains the documentation process, operational flows definition, and data gathering is presented in
Section 4.
3.2. Simulation Model Development and Experimental Design
The simulation model development involved creating a simulation model to replicate the depot’s layout, workflows, and constraints using Simio version 15 [
36]. The process began by analyzing the depot’s physical structure, including storage blocks, processing areas, street networks, and collision-prone intersections. Work shift definitions were incorporated to account for varying operational schedules that influence lifting equipment availability and workflow efficiency.
Additionally, qualitative validation was conducted by yard operations and quality improvement teams through comparison of simulation outcomes with real-world performance trends. Identified discrepancies prompted iterative revisits to previous development phases, minimizing gaps between real and simulated systems while enhancing overall model robustness.
To evaluate depot operational performance, three key performance indicators were established based on critical operational challenges identified during field study. These metrics enabled a comprehensive performance assessment and supported data-driven decision-making processes. The performance indicators are defined as follows:
Truck Turnaround Time (TTT): Average time spent by trucks in the depot, categorized by type k. The truck types are defined in
Section 4.2. Consider that
is the set of trucks of type k. Additionally,
and
are the arrival and departure time of truck
. The TTT is as follows:
Distance covered by lifting equipment (DCLE): Total distance covered by each lifting equipment j during operations. Consider
is an equipment move, where
is the set of movements performed by equipment j. Also,
is the distance traveled in the move
. The DCLE is as follows:
Number of potential collisions (PCs): A counter of potential collisions in high-risk intersections S throughout the simulation period T. A potential collision event occurs when the number of vehicles or lifting equipment
is greater or equal to two, and then simultaneously occupy the same intersection space
during time period
, creating a safety hazard. This metric quantifies the frequency of such occurrences in a specific intersection s during the entire
operational periods using a binary indicator function I that captures when the collision condition is met. The PCs is defined as follows:
Potential collisions (PCs) represent a metric not commonly addressed in the existing literature on layout evaluation for maritime terminals. While traditional studies focus primarily on metrics such as TTT and DCLE, the PC indicator introduces a safety-oriented perspective that has been largely overlooked in terminal operational assessments. The potential collision sites were determined based on historical conflictive points identified from the company’s operational records and incident reports.
Six scenarios, based on the simulation model, were designed to evaluate this safety metric and traditional performance measures under different operational conditions at the depot. Specifically, these scenarios systematically combined different truck arrival frequencies with varying operational conditions (reefer-to-total container ratio). Through this systematic parameter alteration, this study aims to provide insights into the dynamics of key performance indicators and identify areas for potential improvement. Each simulation run spanned one day of operations, with 30 replications.
The parameterization of these scenarios relied on two complementary datasets documenting 2023 container operations: Dataset 1 provided monthly aggregate data on capacity utilization and damaged container proportions, offering reefer-specific insights (45% of containers were reefer units) but lacking operational detail. Dataset 2 captured detailed daily movements of dry and combined containers without storage location information. Together, they enabled comprehensive analysis across different temporal and operational scales.
Subsequently, drawing from this empirical foundation, truck arrivals were segmented into three categories (high-, regular, and low-frequency arrivals) based on terciles from daily movements, while reefer-to-total container ratios were defined at low and high levels corresponding to minimum and maximum monthly ratios from 2023 data.
Finally, a detailed overview of the simulation model development and experimental scenarios is presented in
Section 5.
3.3. Analytical Framework for the Results Analysis
The results analysis employs a structured analytical framework to examine simulation outcomes and derive actionable insights for operational enhancement. The method integrates quantitative statistical evaluation with qualitative contextual interpretation. Numerical data analysis and visualization techniques identify trends and variations across experimental scenarios, while contextual evaluation provides a theoretical grounding for observed patterns and their operational implications.
Statistical significance testing is conducted using ANOVA to evaluate mean differences between scenario groups, enabling robust comparison of performance indicators across different operational conditions. This approach addresses whether truck arrival frequency significantly affects collision risks at dangerous intersections and examines how operational conditions, such as reefer-to-dry container proportions, influence potential collisions.
Poisson regression analysis is performed to investigate the effect of TTT and DCLE on the number of potential collisions. The analysis examines whether extended truck turnaround times and enlarged lifting equipment travel distances increase collision risks. Also, it explores if traditional efficiency indicators can serve as reliable safety predictors for collision estimation at critical intersections. The models are constructed based on a backward elimination as feature selection technique using
p-values. Model fit is assessed using McFadden’s pseudo R-squared [
37] to evaluate the explanatory power of efficiency metrics in predicting collision occurrence patterns.
This comprehensive analytical approach enables the identification of operational bottlenecks and efficiency enhancement opportunities, transforming simulation data into practical insights for ECD evaluation.
4. A Case Study in a Multipurpose Maritime Terminal
This study examines a multipurpose maritime terminal in southern Chile that serves as a critical hub for regional industrial development, handling significant volumes of empty containers primarily for pulp wood consolidation and international trade.
The terminal’s ECD faces three major operational challenges. First, structural limitations from separate processing zones create bottlenecks and container flow disruptions, causing queues that extend into access roads. Second, coordination difficulties arise as Reach Stackers and Top Lifters operate across multiple areas, resulting in increased idle time and excessive travel distances. Third, critical safety concerns stem from dangerous intersections with poor visibility that increase accident risks between trucks and lifting equipment problems underscored by previous collision incidents.
4.1. Documentation Process
The depot’s operational framework encompasses three primary simulation elements that interact to drive facility activities: (1) Trucks: dynamic entities that flow through the system to deliver or collect containers, while also acting as spatial resources that occupy physical space and create movement constraints affecting efficiency and safety. (2) Containers: primary entities being processed, including 1 and 2 TEU dry containers and 2 TEU reefer containers, each with specific attributes determining processing requirements, storage locations, and handling procedures. (3) Lifting Equipment: mobile resources providing dual functionality—processing capacity for container operations and spatial occupation requiring coordinated movement. Reach Stackers and Top Lifters each have specific operational capabilities and constraints that must be managed to prevent conflicts and ensure safe, efficient operations across the depot.
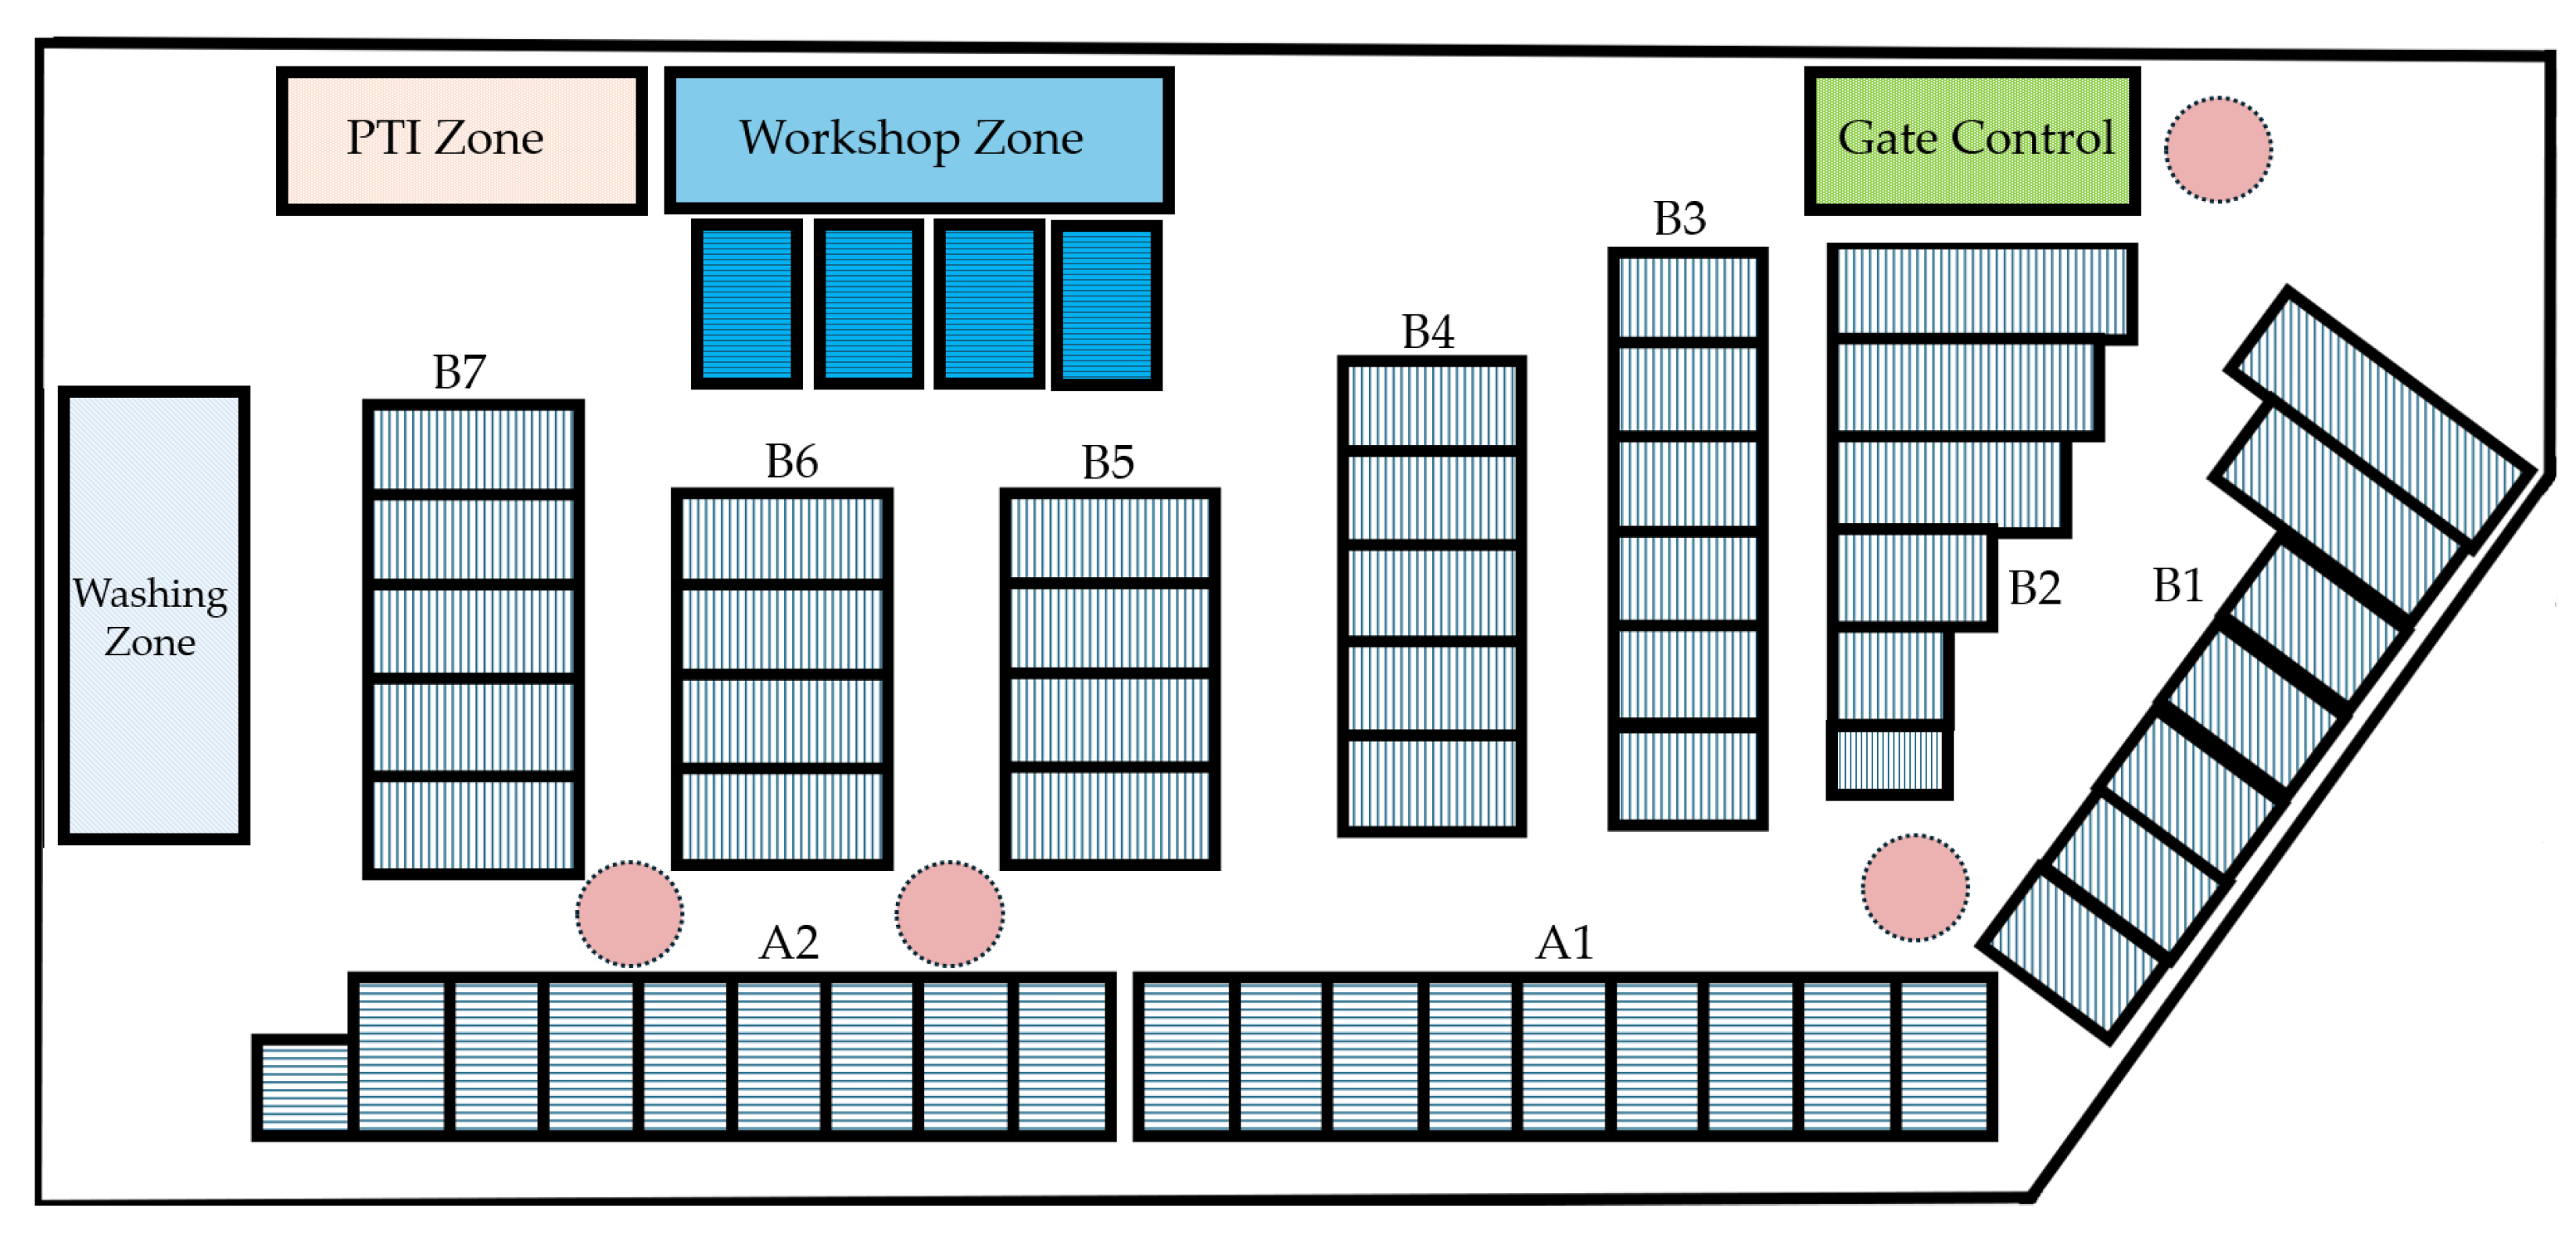
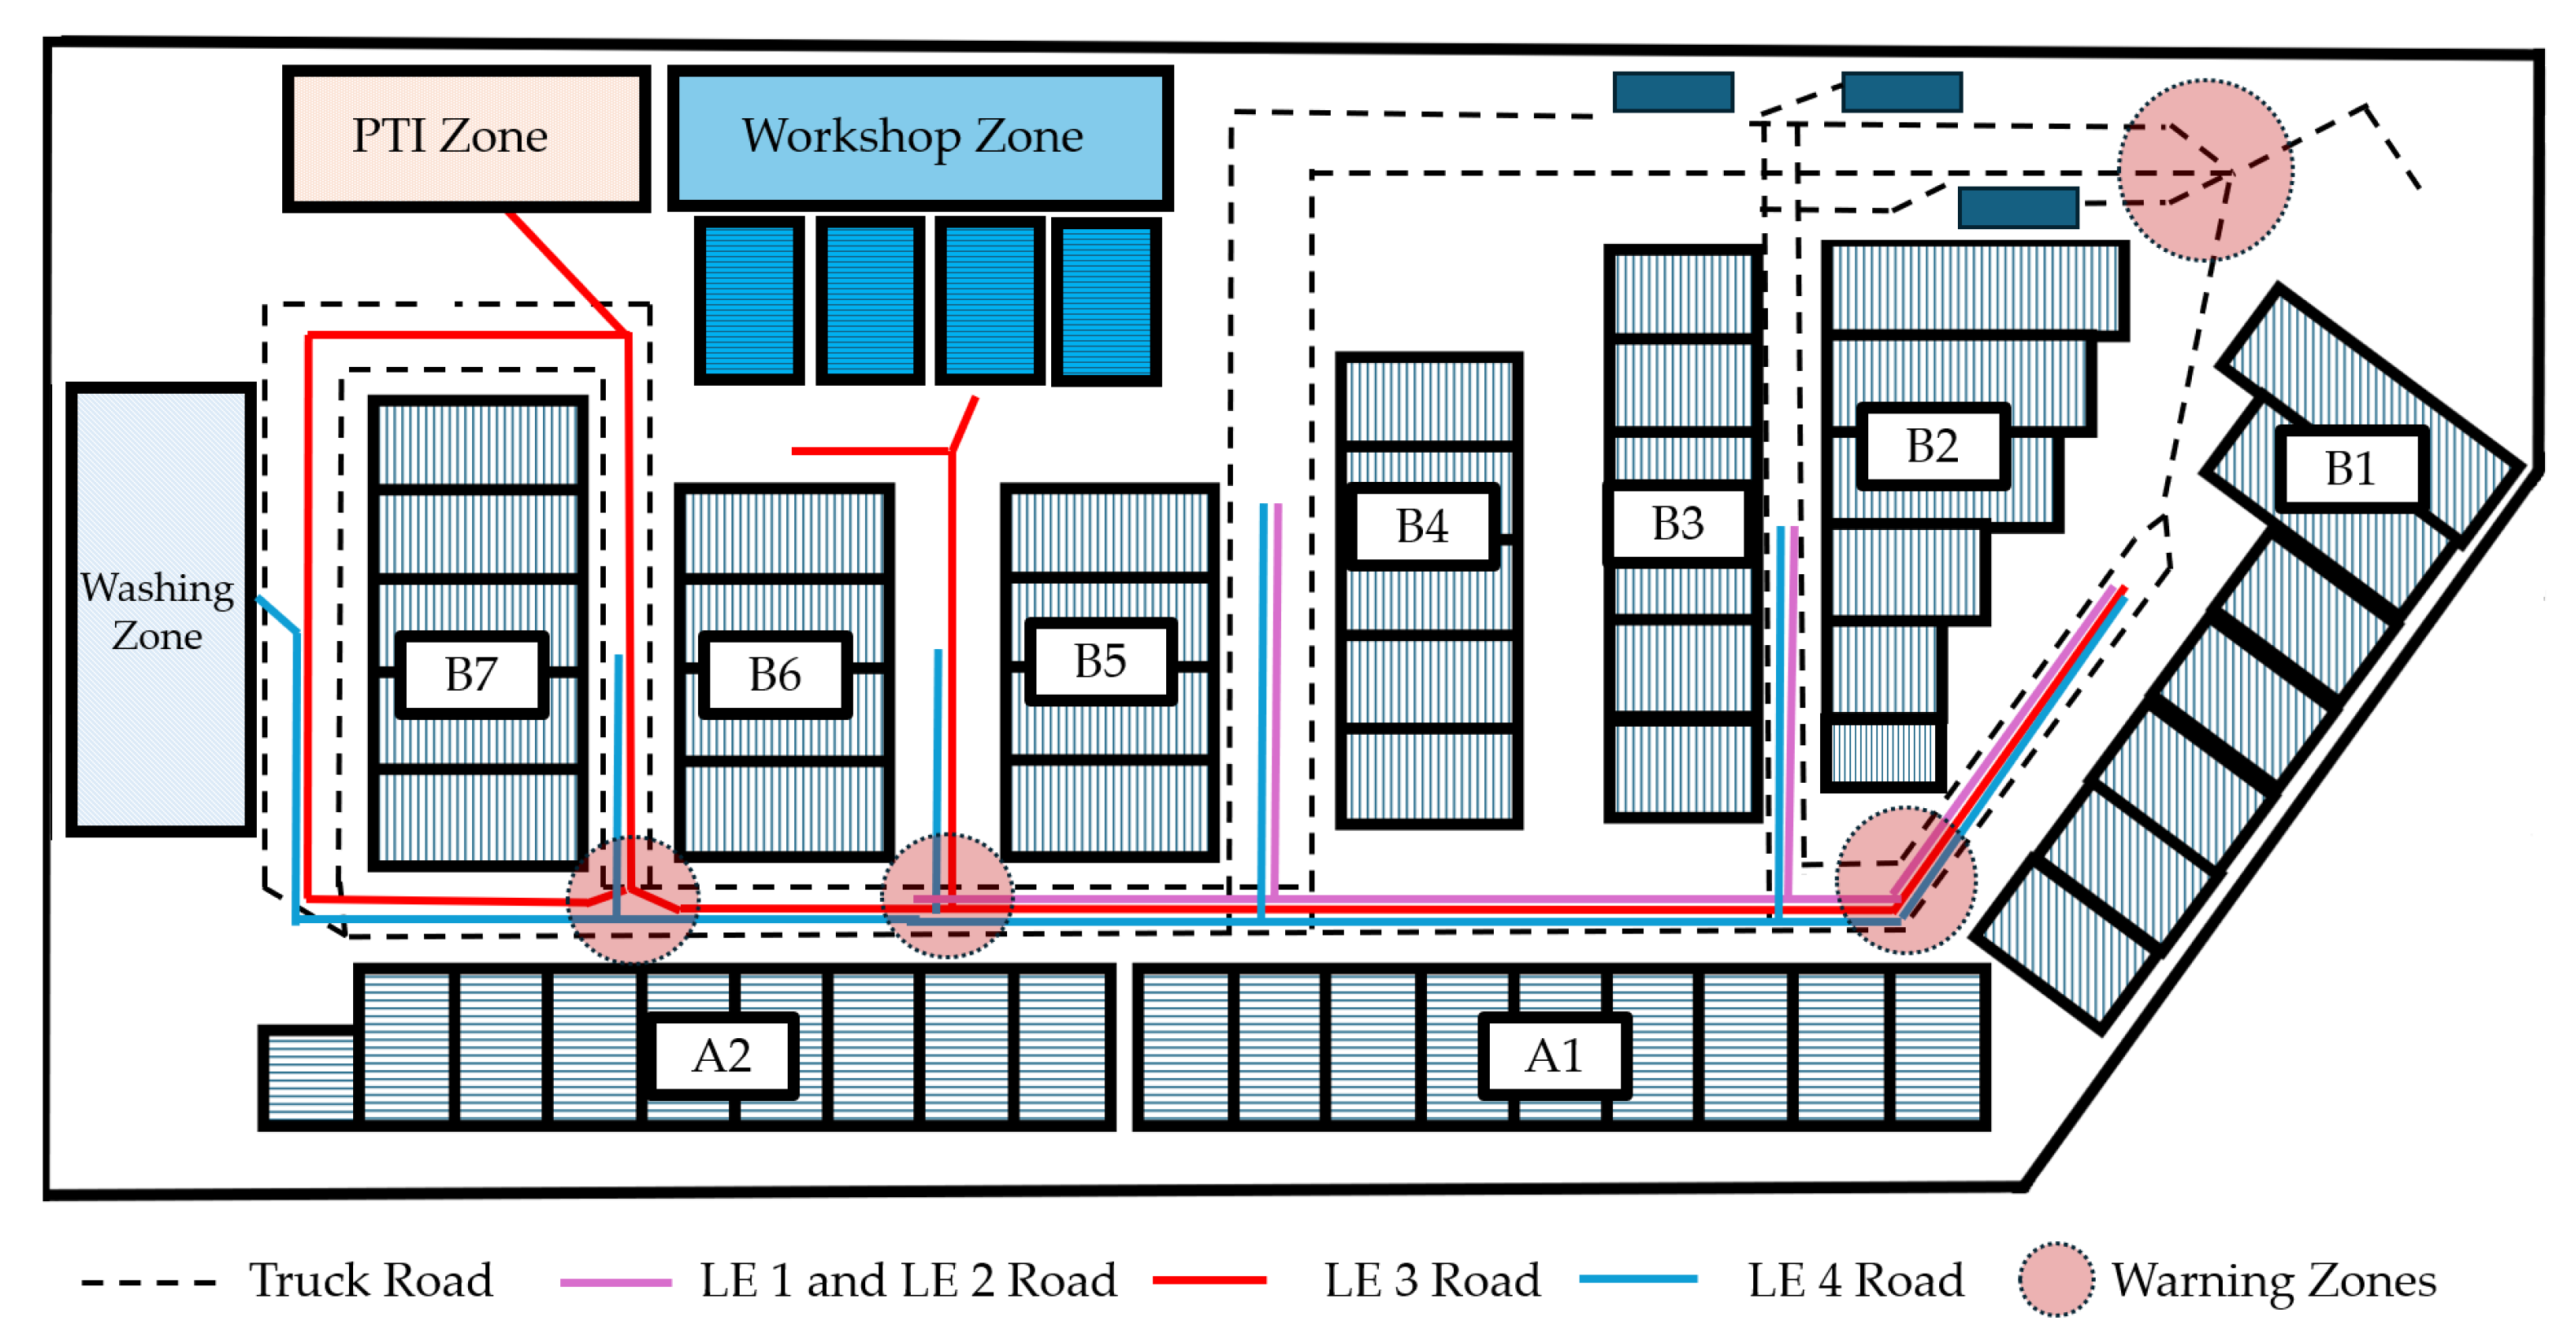
The container terminal features nine storage blocks with distinct capacities and purposes.
Figure 2 shows the main storage and service yard sections. Five blocks handle operative dry containers: B1 with 702 TEU capacity, B2 with 605 TEU, B3 with 455 TEU, B4 with 480 TEU, and Block A1 with 820 TEU capacity. The remaining blocks serve specialized functions, including B5 for non-operative dry containers (320 TEU), B6 for both non-operative dry and reefer containers (460 TEU), B7 for mixed operative and non-operative reefer containers (550 TEU), and A2 exclusively for operative reefer containers (820 TEU). Additionally, the depot operates a workshop zone for damaged units, a washing zone for cleaning preparation, a pre-trip inspection (PTI) for reefer containers for potential repairs and malfunctioning refrigeration units, and the gate where drivers present withdrawal documentation and receive container location instructions. Also, collision risk areas were identified using historical conflict points from company operational records and incident reports (red points in
Figure 2).
A brief description of each zone in an ECD is as follows:
Gate Control zone: Manages truck flow and container verification. Documentation processing (Gate-in) handles the exchange between drivers and depot personnel where drivers present withdrawal documentation and receive location instructions, operating with single-truck capacity and variable processing times depending on truck origin. Container assessment (Inspection) conducts visual evaluations to identify structural damage while containers remain mounted on trucks, accommodating two trucks simultaneously with consistent processing durations regardless of origin. Administrative validation (Gate-Out) confirms loaded container accuracy and destination verification before departure, processing one truck at a time.
Workshop and PTI zone: The depot operates two specialized processing zones for container maintenance and preparation. The Workshop zone handles structural damage repairs identified during inspection (Workshop Repair), accommodating 48 containers in four lines of 12 each, with maximum two lines processing concurrently following sequential inside-out arrangements for repairs ranging from minor replacements to extensive reconstructions. The Pre-Trip Inspection (PTI) zone exclusively manages reefer container refrigeration systems through multiple non-sequential processes: automated technical inspections (PTIs) of 44 containers in four lines of 11 each with simultaneous 4 h processing; flexible repair operations (PTI Repair) for malfunctions with ideal capacity of four containers based on workforce availability; and manual temperature parameter setup (PTI Set Up) involving technical workers and truck drivers connecting units to truck generators, processing one container at a time in arrival order.
Washing zone: Prepares container interiors for clean cargo consolidation through water washing, adhesive removal, and odor elimination. The area accommodates 36 containers in four lines (three for reefer, one for dry), processing one line at a time with two containers simultaneously, beginning once four containers are arranged and maintaining safety gaps during operations.
Block zone: Manages container handling and storage operations through lifting equipment and truck coordination. Container transfer operations (Truck Loading and Unloading) involve coupling or decoupling containers from trucks, with operators receiving precise instructions for truck identification and container destinations, processing one truck at a time while vehicles remain in designated spots. Storage management operations (Container Stacking and Unstacking) control container movement within the depot using lifting equipment for placement into designated storage blocks or processing areas and retrieval for removal or further handling, with each equipment handling one container at a time according to specific placement or retrieval instructions.
The depot operations are supported by four specialized pieces of lifting equipment, each assigned to specific operational zones and container types. Lifting equipment 1 and 2 (LE1 and LE2, respectively) are responsible for handling dry containers, performing essential tasks such as truck loading and unloading operations alongside container stacking and unstacking activities within the dry area. Lifting equipment 3 (LE3) is dedicated exclusively to container maneuvers in the Workshop and PTI Areas, focusing solely on stacking and unstacking operations to support repair and inspection processes. Lifting equipment 4 (LE4) manages container operations in the Reefer and Washing Areas, handling both the reception and dispatch of refrigerated containers as well as performing specialized maneuvers at the washing station, including truck loading and unloading and container stacking and unstacking operations.
Lifting equipment operations follow established priority hierarchies to optimize efficiency and prevent bottlenecks. LE3 prioritizes arranging lines over picking up containers to maximize production efficiency by keeping operators continuously engaged, with Workshop and PTI priorities alternated to prevent exclusive occupation of one busy area. Lifting equipment 4 (LE4) in the Washing and Reefer Areas prioritizes truck operations (loading/unloading) above arranging and picking up washing lines to prevent queue formation and bottlenecks within the depot’s street network, as truck processing delays could compromise overall site performance by blocking access to storage blocks and processing areas.
The depot operates two daily shifts (8:10 a.m.–3:30 p.m. and 3:40 p.m.–10:45 p.m.) with operational constraints due to residential proximity. Reefer operations must cease by 8:00 p.m. for noise reduction, affecting lifting equipment for Workshop, PTI, Washing, and Reefer dispatching that work continuously during the second shift until 8:00 p.m. without standard breaks, while Gate, Inspection, Gate-Out, and dry sector operations maintain full two-shift schedules. Truck arrivals halt 20 min before breaks (11:20 a.m., 6:50 p.m. for reefers, 7:50 p.m. for dry containers), creating active arrival windows of 705 min for dry containers and 550 min for reefers. Contractor operations follow distinct schedules with Workshop repairs operating 8:00 a.m.–1:00 p.m. and 2:00 p.m.–5:00 p.m., and Washing extending until 11:00 p.m. due to minimal noise generation, though lifting equipment serving contractor areas maintain depot standard schedules to ensure operational continuity within the 8:00 p.m. constraint.
4.2. Operational Flows Definition
The operational flow within the ECD follows distinct pathways depending on container type and operational purpose. These flows encompass the complete lifecycle of containers from arrival to departure, including all intermediate processing steps required to ensure containers meet operational standards before dispatch. The following subsection details the specific operational flows for dry containers, reefer containers, container returns, and container requests, highlighting the sequential processes and LE-facilitated movements that characterize depot operations.
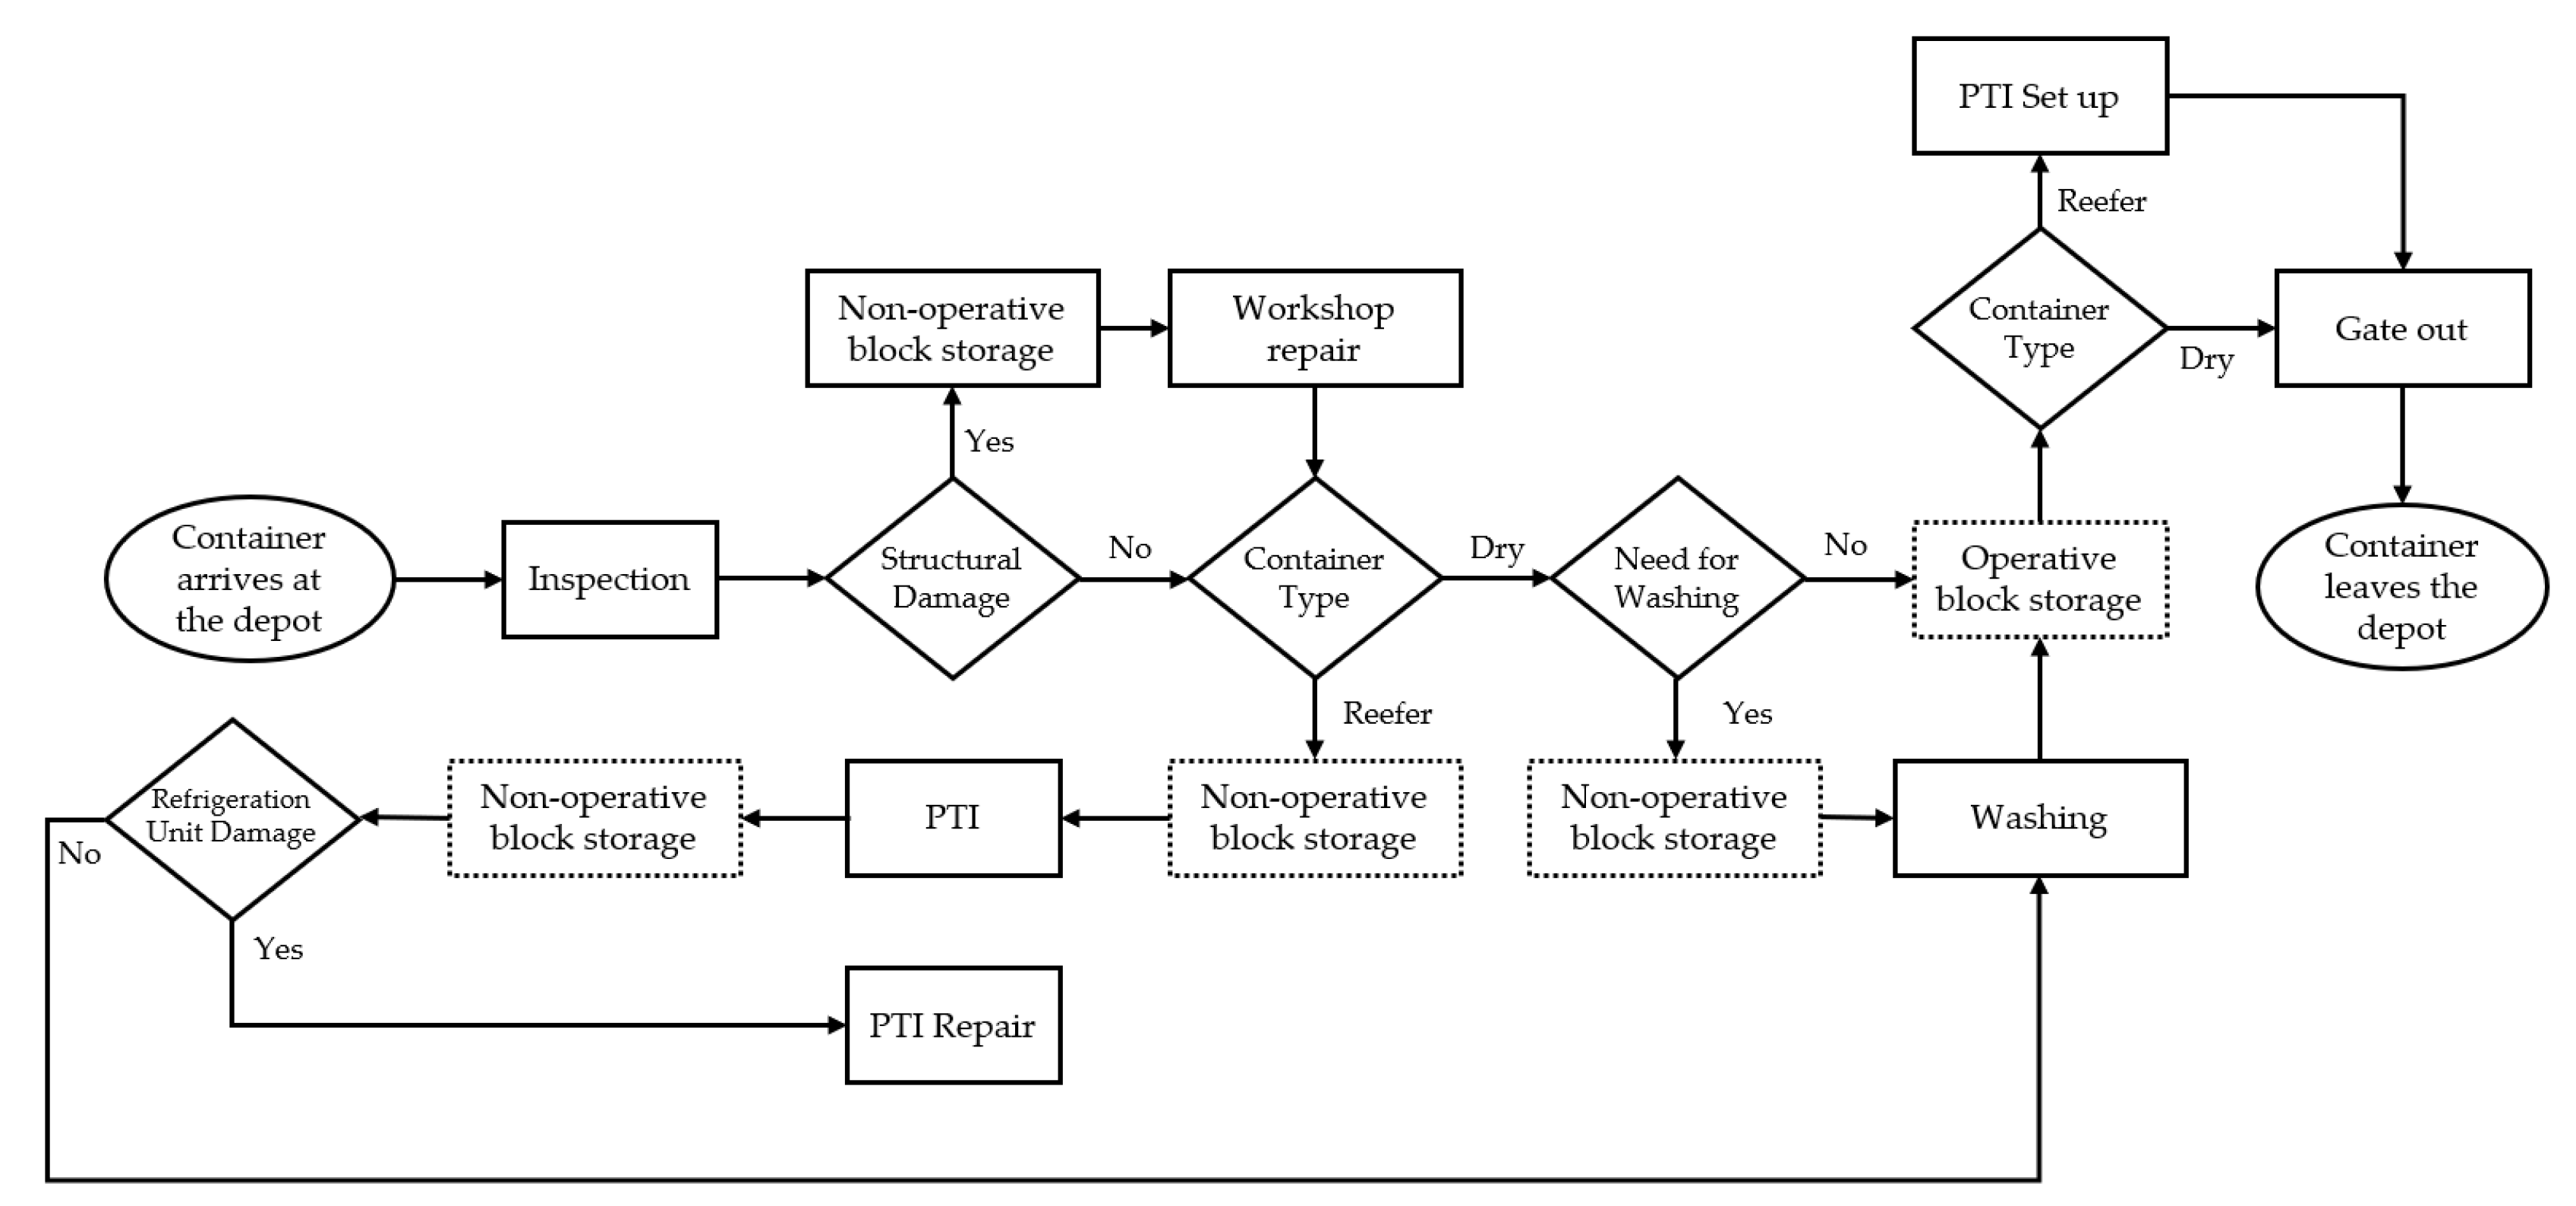
As depicted in
Figure 3, the dry container flow begins with the container’s arrival at the depot on a truck, followed by inspection. After waiting for lifting equipment availability, the container is unloaded from the truck and stacked in a storage block. Depending on its condition and specific requirements (such as structural repair or washing), the container is placed in either an operational or non-operational block. Once all necessary procedures are completed, the container is stacked in an operational block. Based on a request from an external or internal client, the container is unstacked, loaded onto a truck, processed through Gate-Out procedures, and exits the depot. All container movements between storage blocks and processing areas are carried out by lifting equipment.
The reefer container flow, detailed in
Figure 3, involves additional steps compared to dry containers. After initial inspection, the container is unloaded and stacked in a non-operational block. Any necessary structural repairs are conducted at the Workshop, after which the container is placed in a non-operational block while awaiting Pre-Trip Inspection (PTI) and mandatory washing. If PTI reveals refrigeration unit damage, the container returns to the PTI line for repairs. Once PTI and any required repairs are completed, the container moves to a non-operational block while awaiting washing. After washing completion, the container is stacked in an operational block. Based on a request from an external or internal client the container is unstacked and loaded onto a truck. Before departing, the refrigeration unit is set to the required temperature, and the container passes through Gate-Out procedures before exiting the depot. All container movements between storage blocks and processing areas are carried out by lifting equipment.
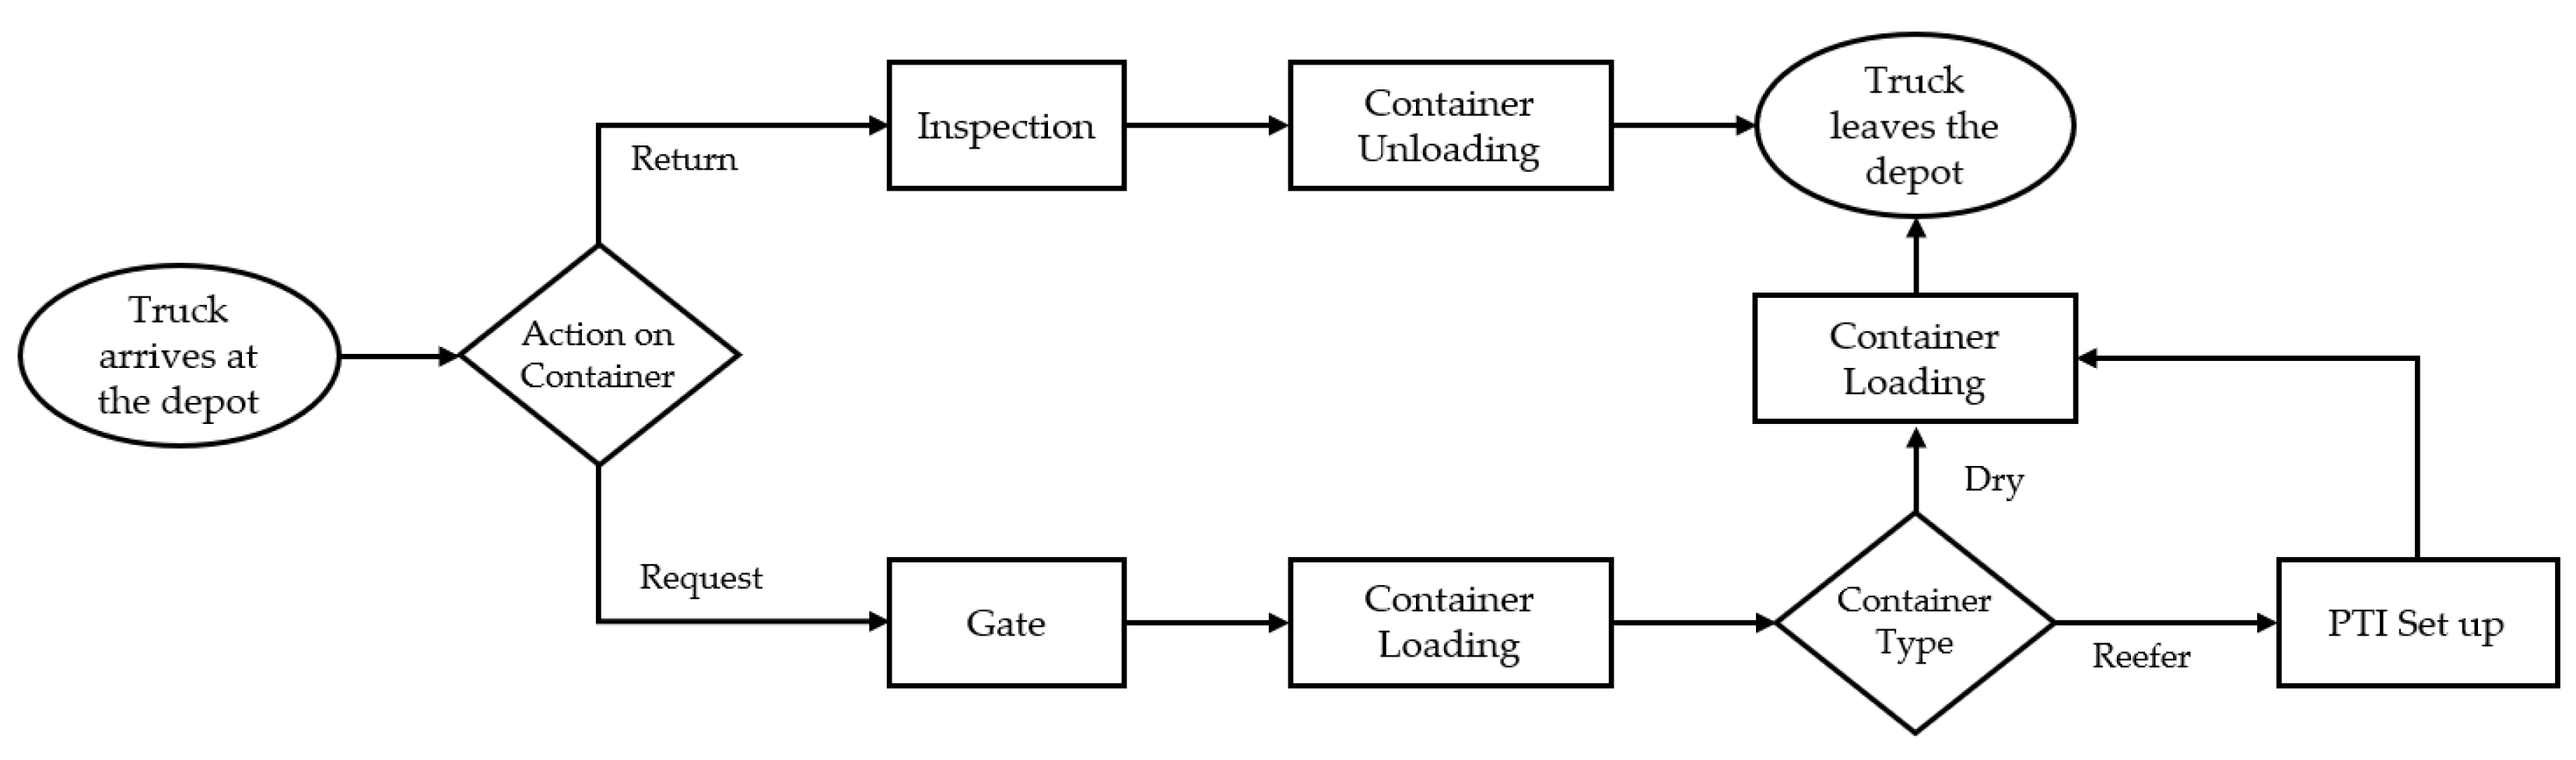
As illustrated in
Figure 4, the returning container flow begins with trucks entering the depot, where structural inspection is performed while containers remain mounted. Trucks then proceed to assigned storage blocks and wait for lifting equipment to unload containers. Once unloaded, trucks exit the depot without requiring additional procedures.
Figure 4 outlines the container requests flow, starting with trucks entering and passing through the gate. Trucks proceed to designated storage blocks for specific containers (operative dry or reefer), wait for lifting equipment availability, and have containers loaded. If the container is a reefer unit, it undergoes PTI setup after loading. Finally, trucks proceed through Gate-Out processing and exit the depot.
4.3. Data Gathering: Analysis and Statistical Modelling
The operational processes within the empty container depot exhibit varying temporal characteristics and behavioral patterns that reflect the complexity and nature of each activity.
Table 2 summarizes the descriptive statistics for all measured processes, revealing distinct performance profiles across gate operations, maintenance activities, and container handling procedures.
Gate operations exhibit distinct behavioral patterns between internal and external trucks. Internal truck processing demonstrates relatively fast operations with moderate variability, while external trucks require significantly longer processing times with high variability, indicating more complex documentation or verification procedures. Inspection processes demonstrate the longest durations with substantial variability, reflecting the thorough nature of container examinations. Gate-Out operations maintain stable processing times with moderate variability, suggesting standardized exit procedures. All gate processes show positive skewness, indicating occasional extended processing times that are likely to reflect complex cases or operational bottlenecks.
Workshop repair operations display high variability, indicating diverse repair complexities ranging from minor fixes to major interventions. PTI repair processes show longer durations with moderate variability, depending on problems associated with the repairs. PTI setup operations are considerably shorter but exhibit high variability, suggesting different preparation requirements based on container specifications. The positive skewness in all repair processes indicates that while most operations follow standard timeframes, complex cases occasionally require extended attention.
Container handling operations present efficient and uniform performance patterns. Loading and unloading show moderate variability with slight positive skewness, indicating standardized procedures with occasional variations. Stacking operations exhibit similar patterns, suggesting well-established operational procedures. Driving speeds for both lifting equipment (5.9 km/h) and trucks (12.58 km/h) demonstrate tight clustering around median values with minimal variability, indicating strict adherence to safety protocols and operational guidelines within the terminal environment.
Table 3 presents the best-fit probability distributions for all measured processes, determined through rigorous statistical testing and goodness-of-fit criteria.
5. Simulation Model Development and Experimental Design
The model was developed using Simulation software Simio version 15 to accurately replicate the physical depot layout with precise scaling of processing areas and storage blocks, as shown in
Figure 2. All elements, including shapes, sizes, and distances, were meticulously reproduced based on CAD specifications given by the terminal.
5.1. Infrastructure Modelling
The model incorporates a comprehensive street network that replicates the depot’s road infrastructure, including accurate lengths and directional specifications as depicted in the original CAD layout. A critical design consideration involves the implementation of separate street networks for different vehicle types, recognizing that while depot roads are predominantly double-lane and bidirectional, operational patterns vary significantly between trucks and lifting equipment. Trucks adhere to conventional double-lane traffic rules, whereas lifting equipment typically traverse along street centers, effectively occupying both lanes regardless of directional designations.
The intersection of truck and lifting equipment networks creates overlapping zones at specific junctions, as illustrated in
Figure 5. The model incorporates these critical intersection points for detailed safety analysis. A strategically positioned roundabout between storage blocks B1 and B2 facilitates efficient container return traffic flow within the truck network. This roundabout enables trucks servicing block B1 to execute turning maneuvers and navigate toward the dedicated exit route between the two blocks, while trucks returning to block B2 can access this exit directly without using the roundabout.
Storage blocks, which feature multiple access points along their full length in reality, are represented through a single-node approach where all operations converge at one designated point positioned on adjacent streets near each block’s estimated center of mass. This center is determined based on TEU capacity distribution, with irregular-shaped blocks having centers positioned closer to areas of highest TEU concentration. For processing areas such as Workshop, PTI, and Washing zones, single nodes are placed at the estimated center of mass within each sector rather than on adjacent streets, reflecting the direct lifting equipment–container interaction patterns in these operations.
5.2. Entities and Resource Modelling
The model incorporates three container types (1 TEU Dry, 2 TEU Dry, and 2 TEU Reefer), four truck classifications (Request/Return for both Dry and Reefer containers), and four specialized lifting equipment (LE1 to LE4). The four lifting equipment are differentiated by operational zones and responsibilities: LE1 and LE2 handle dry container operations, LE3 manages Workshop and PTI area maneuvers, and LE4 oversees Reefer and Washing area operations.
5.3. Operational Logic and Special Considerations
The simulation model is constructed by incorporating all processes documented in preceding chapters, with their real-world time parameters and operational logics appropriately adapted. The logic and some special considerations associated with the operations are presented in
Appendix A.
5.4. Experimental Design
The experimental design considers three truck arrival frequencies (Low, Regular and High) with two reefer-to-total container ratios (Low and High), creating six scenarios that systematically test depot performance under varying demand conditions based on historical data. Inter-arrival times are assumed to follow exponential distributions with rate parameters expressed as trucks per minute, calculated from the expected number of vehicles and respective operating hours for dry trucks and for reefer trucks. The exponential distribution rate parameters are presented in
Table 4.
The experimental design systematically evaluates depot performance by manipulating two critical operational factors: truck arrival intensity and reefer container proportion. This factorial approach captures realistic demand variations from low-traffic periods to high-volume scenarios with substantial refrigerated-container processing requirements. The design enables identification of performance bottlenecks and safety trade-offs across the full spectrum of expected operational conditions, providing comprehensive insights into how varying demand patterns affect truck turnaround times, equipment utilization, and collision risks.
6. Results
This study employs a comprehensive analytical framework combining quantitative statistical evaluation with qualitative contextual interpretation to examine simulation outcomes and derive actionable insights for operational enhancement. The analysis utilizes ANOVA for statistical significance testing to evaluate mean differences between scenario groups, enabling robust comparison of performance indicators across different operational conditions. Additionally, Poisson regression analysis investigates the effects of truck turnaround time (TTT) and lifting equipment travel distance (DCLE) on collision occurrence, with model construction based on backward elimination feature selection and model fit assessed using McFadden’s pseudo R-squared. This integrated approach transforms simulation data into practical insights for collision risk assessment and operational efficiency evaluation at critical terminal intersections.
The results address key research objectives: (1) examining relationships between arrival frequency and operational conditions in performance indicators; (2) exploring the effect of TTT and DCLE on the number of potential collisions; (3) transforming simulation data into actionable insights for terminal layout optimization.
6.1. Results for ANOVA Analysis
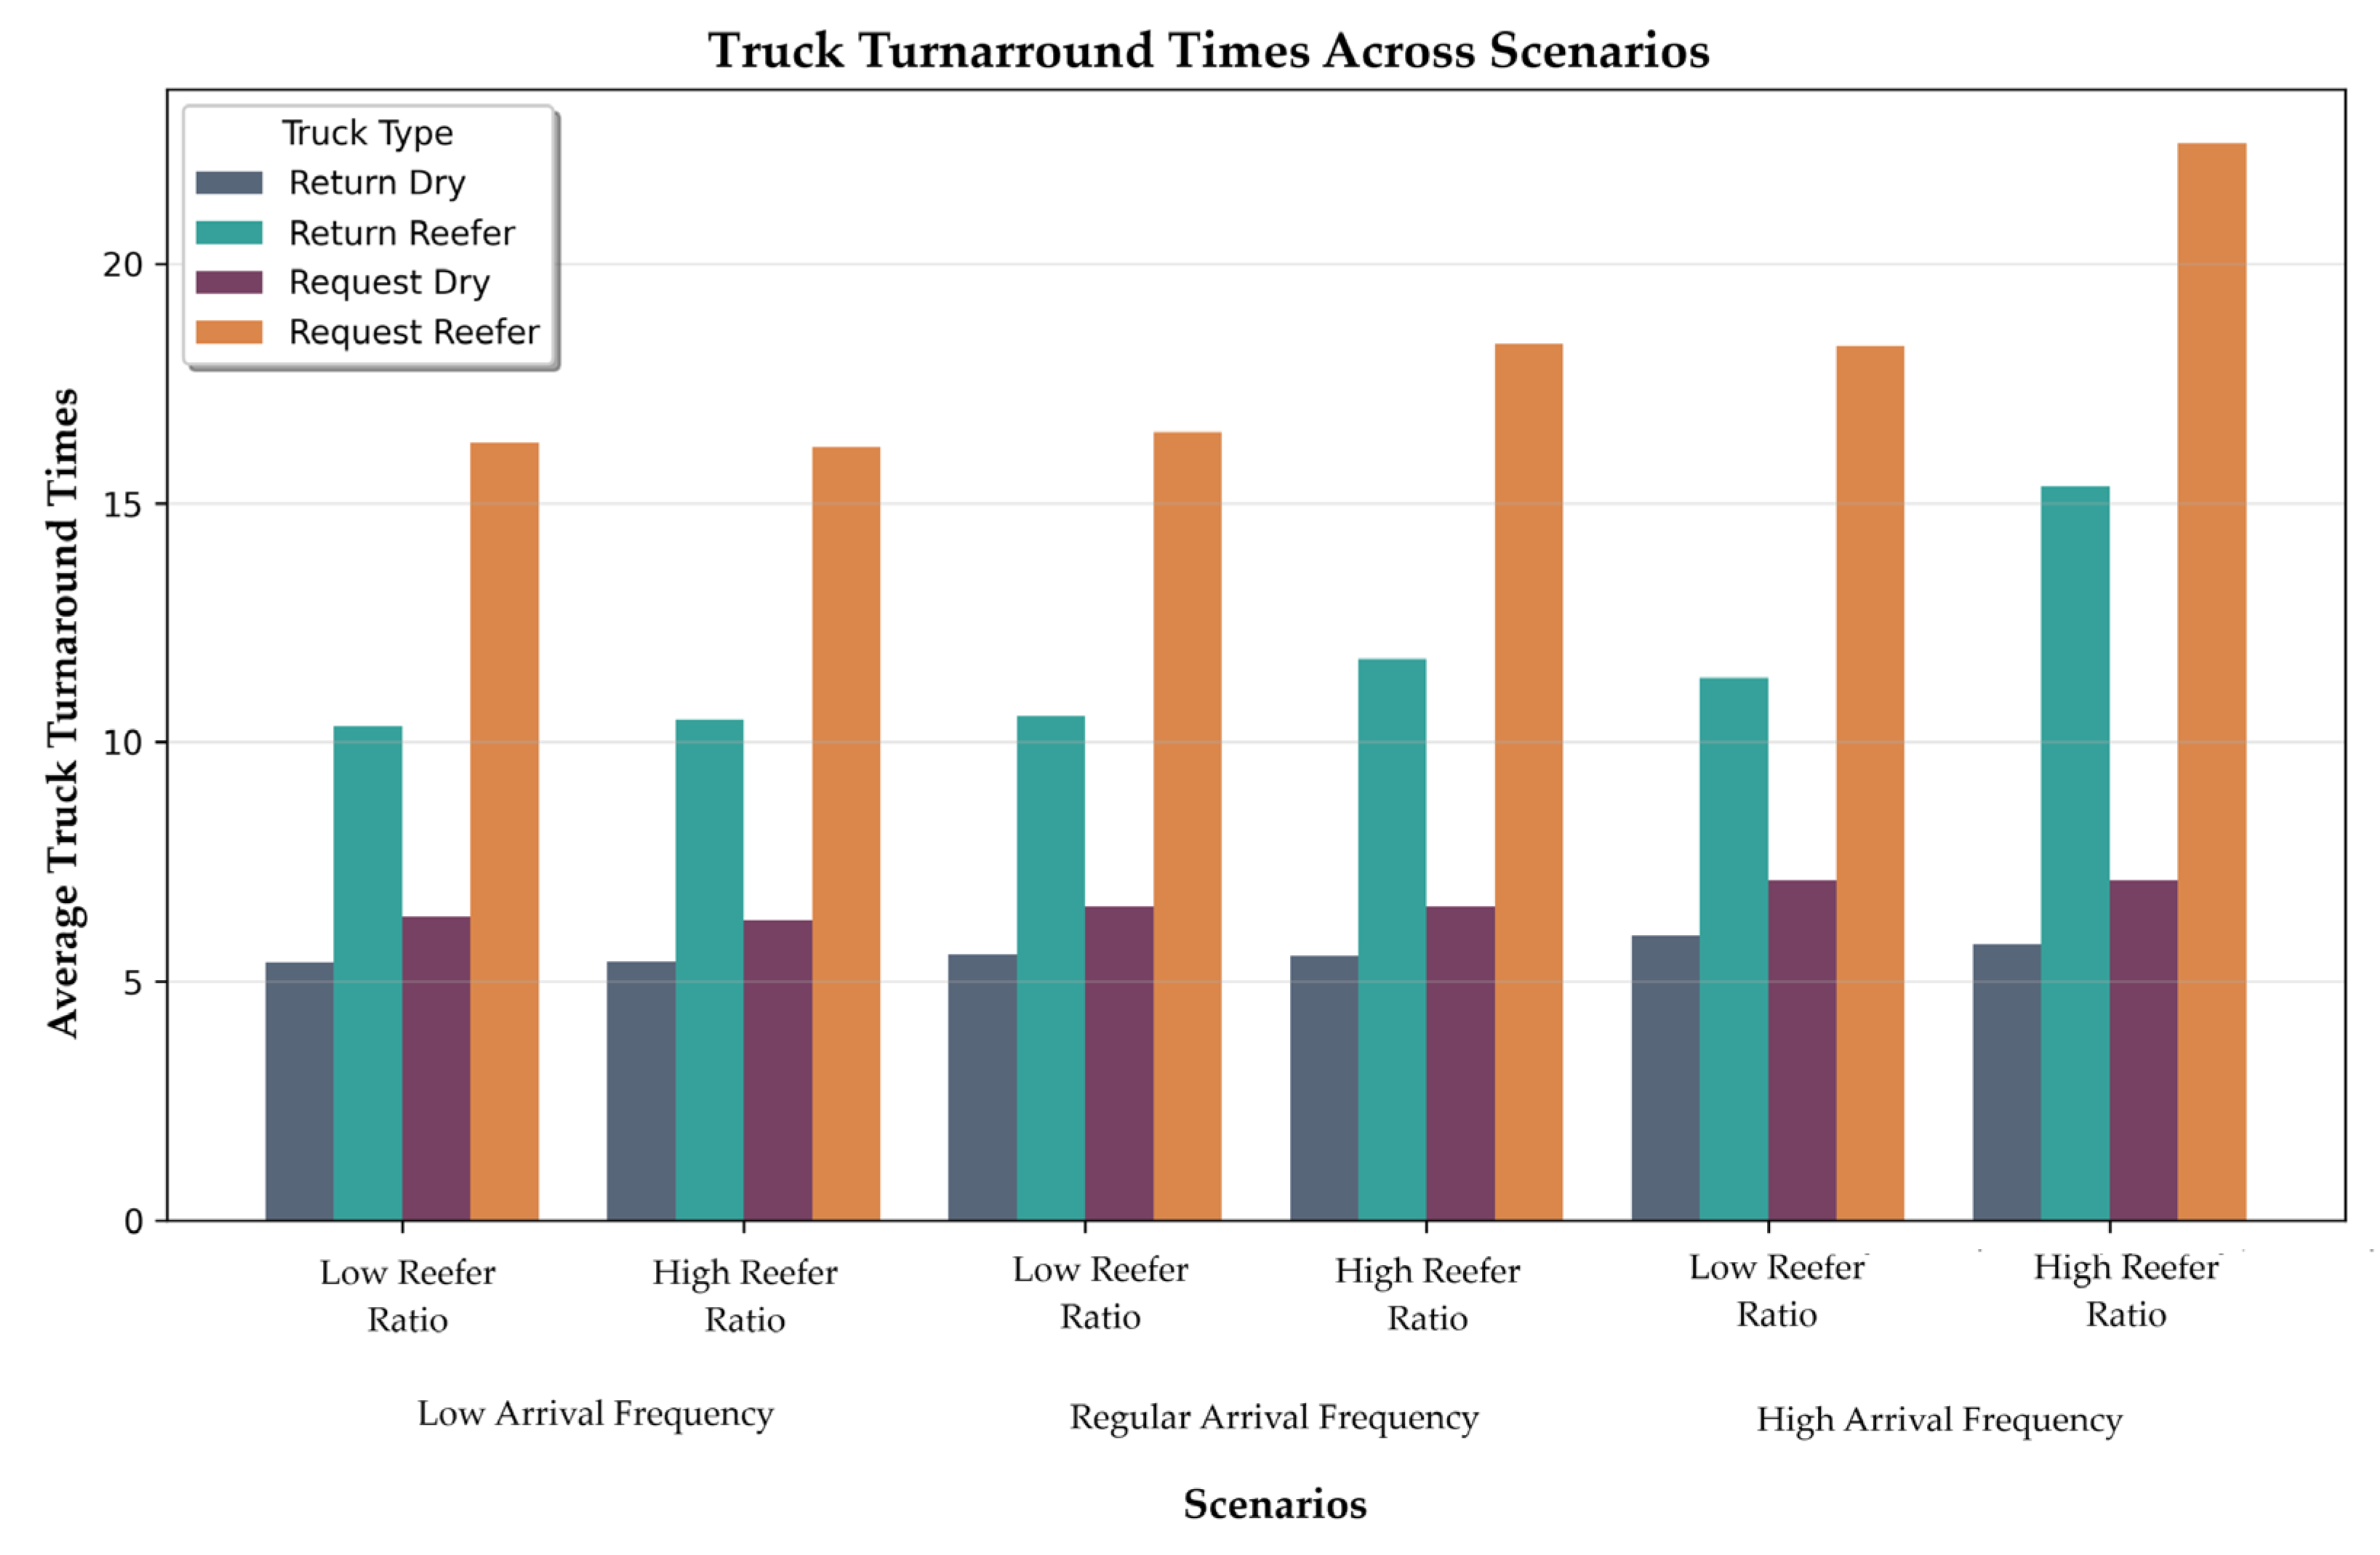
6.1.1. Truck Turnaround Time Analysis
The TTT analysis across four truck categories reveals systematic performance differentials, with dry operations demonstrating higher efficiency compared to reefer operations. This disparity reflects the inherent complexity of refrigerated container processing requirements. Performance variations intensify under operational stress, with reefer categories exhibiting greater sensitivity to changing operational parameters than dry categories. The confidence intervals for the mean are presented in
Table 5.
Arrival frequency exhibits the strongest influence on TTT variations across all categories, with statistical analysis confirming significant differences between arrival frequency groups for each truck type and reefer ratio setting (p-value < 0.05). Dry operations exhibit moderate progressive increases between frequency levels. For return and request trucks in low reefer ratio settings, escalations are 3.06% and 7.04%, and 3.48% and 8.15% across low-to-regular and regular-to-high frequency transitions, respectively. In high reefer ratio scenarios, return and request trucks show escalations of 2.06% and 4.27%, and 4.71% and 8.24% across the same frequency transitions, respectively.
Reefer operations demonstrate substantially higher sensitivity to arrival frequency variations compared to dry operations. In low reefer ratio settings, return and request trucks show escalations of 2.08% and 7.49%, and 1.30% and 10.87% across low-to-regular and regular-to-high frequency transitions, respectively. Under high reefer ratio scenarios, sensitivity intensifies substantially, with return and request trucks exhibiting escalations of 12.10% and 30.66%, and 13.42% and 22.82%, respectively, across the same frequency transitions. This increased sensitivity under high reefer ratio conditions suggests that specialized container processing creates operational constraints when combined with higher arrival frequencies, as illustrated in
Figure 6.
ANOVA statistical analysis reveals significant differences in reefer ratio effects depending on arrival frequency intensity. Under low arrival frequencies, ratio impacts remain minimal across all categories (<2% variation). At regular frequencies, reefer trucks (return and request) show substantial increases of approximately 11% when transitioning from low to high ratios, while dry trucks remain unaffected. Under high arrival scenarios, these effects intensify, with increases of 35.33% for reefer return and 23.21% for reefer request operations.
The TTT analysis reveals that arrival frequency serves as the primary driver of performance variations across all truck categories, with dry operations consistently outper-forming reefer operations due to specialized processing requirements. While dry operations exhibit moderate, predictable increases in frequency levels, reefer operations show higher sensitivity, particularly under combined high stress conditions. Specifically, reefer operations experience high performance reduction under peak stress scenarios, compared to minimal variations under low arrival frequencies, showing critical operational thresholds that require specialized capacity planning strategies to prevent system-wide bottlenecks during peak periods.
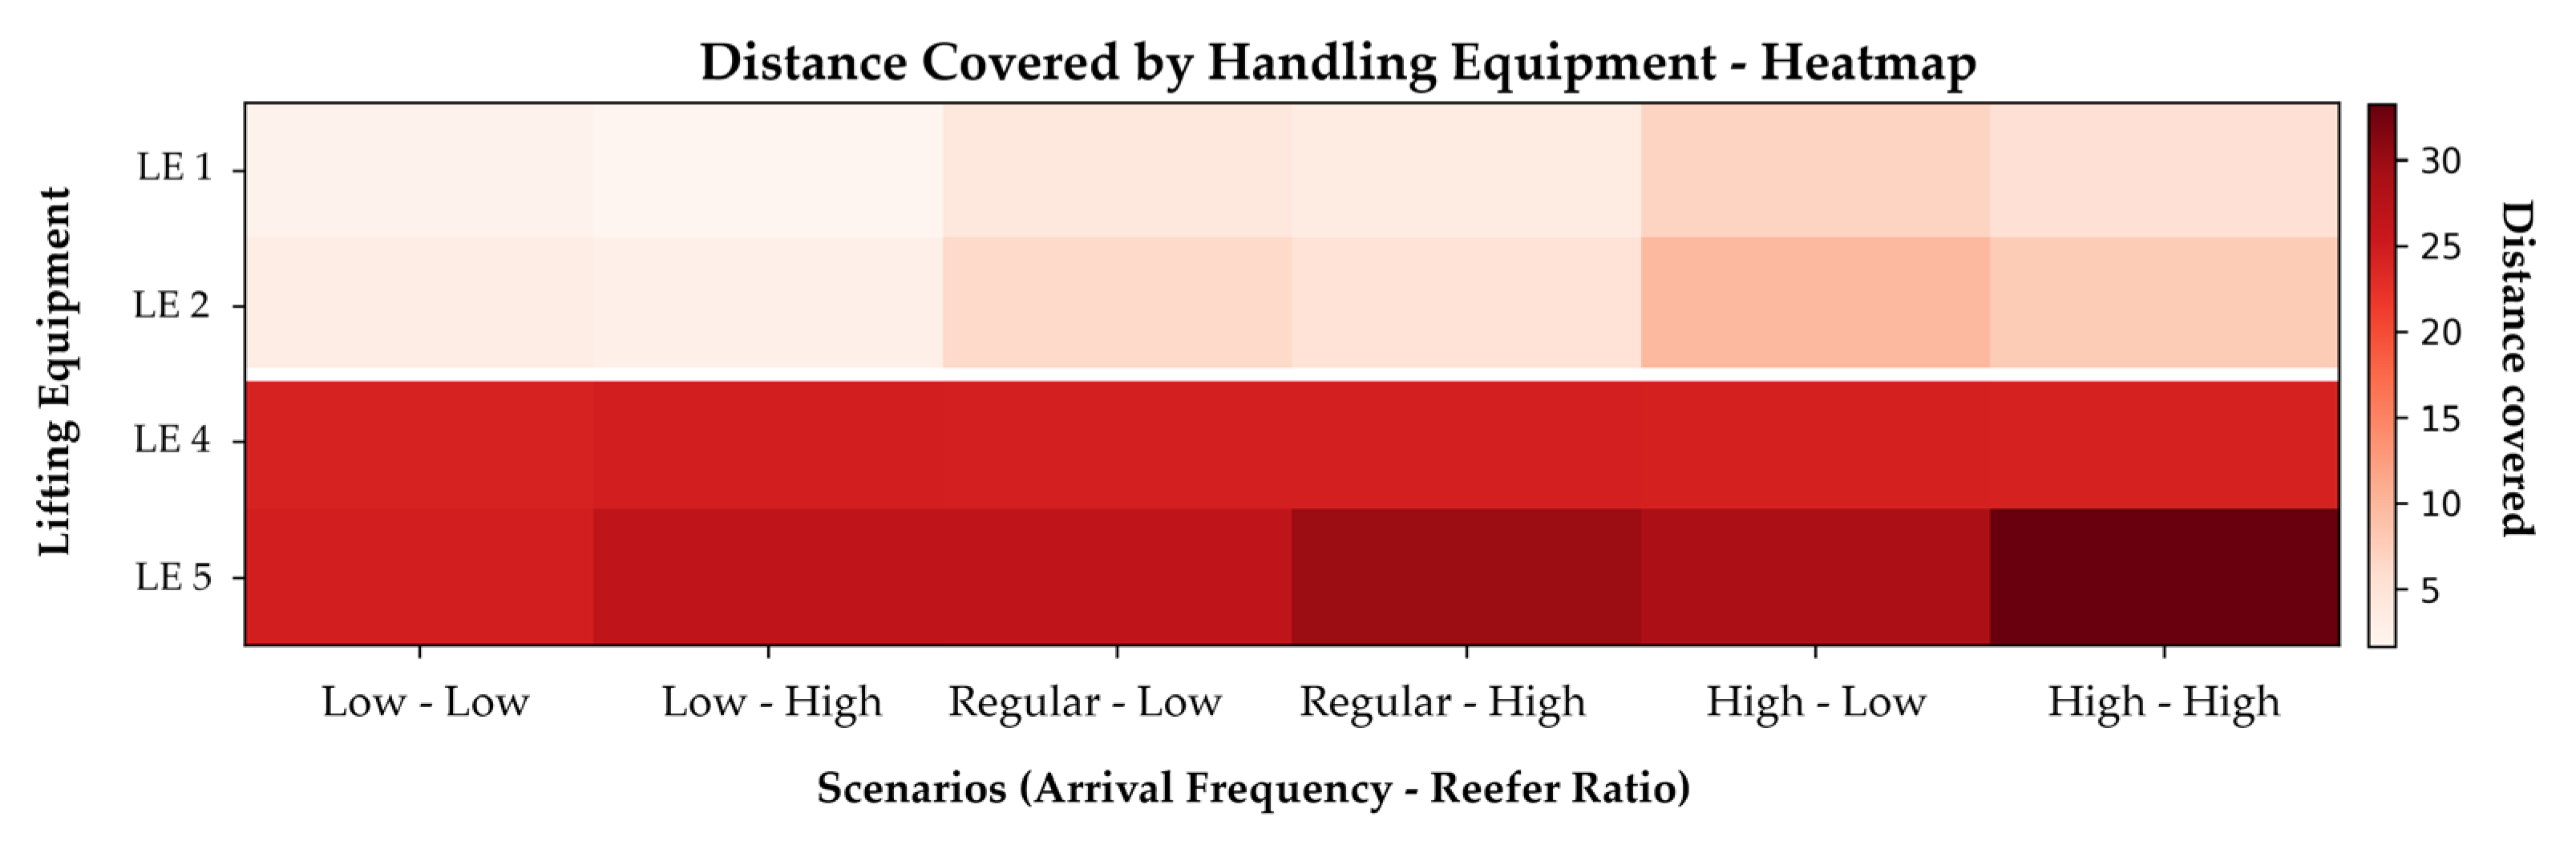
6.1.2. Distance Covered by Lifting Equipment Analysis
The lifting equipment travel distance analysis reveals distinct operational patterns aligned with their specialized functions and priority hierarchies. LE1 and LE2, dedicated to dry container operations, show progressive increases in daily travel distances with arrival frequency, ranging from approximately 1.6–3.2 km under low frequency conditions to 5.2–7.8 km under high frequency scenarios. These units demonstrate moderate sensitivity to reefer ratio variations, with LE2 consistently traveling greater distances than LE1 across all operational conditions.
LE3, serving the Workshop and PTI Areas with priority given to scheduled operations, maintains relatively stable travel distances of around 24 km regardless of operational parameters, indicating consistent movement requirements between repair and inspection facilities. LE4, managing the Reefer and Washing Areas with truck operation prioritization, exhibits the most variable travel patterns, with distances increasing from approximately 24.6 km under low-demand conditions to 33.2 km under high arrival frequency and high reefer ratio scenarios.
ANOVA analysis reveals significant differences in lifting equipment sensitivity to operational parameters, with distinct patterns emerging across equipment types (
Table 6). LE1, LE2, and LE4 demonstrate significant sensitivity to arrival frequency variations under both low and high reefer ratio conditions, while also showing significant responses to reefer ratio changes across all arrival frequency levels. In contrast, LE3 exhibits no significant sensitivity to either parameter, confirming its operational independence from traffic density and reefer activity variations.
As shown in
Figure 7, LE4 has a critical role in preventing bottlenecks through truck prioritization, with travel distances escalating significantly when both arrival frequency and reefer processing demands intensify simultaneously. The heatmap reveals significant utilization imbalance, with LE1 and LE2 operating at low travel distances (under 10 km daily) while LE3 and LE4 maintain consistently high operational demands (20–33 km daily), indicating potential optimization opportunities through workload redistribution.
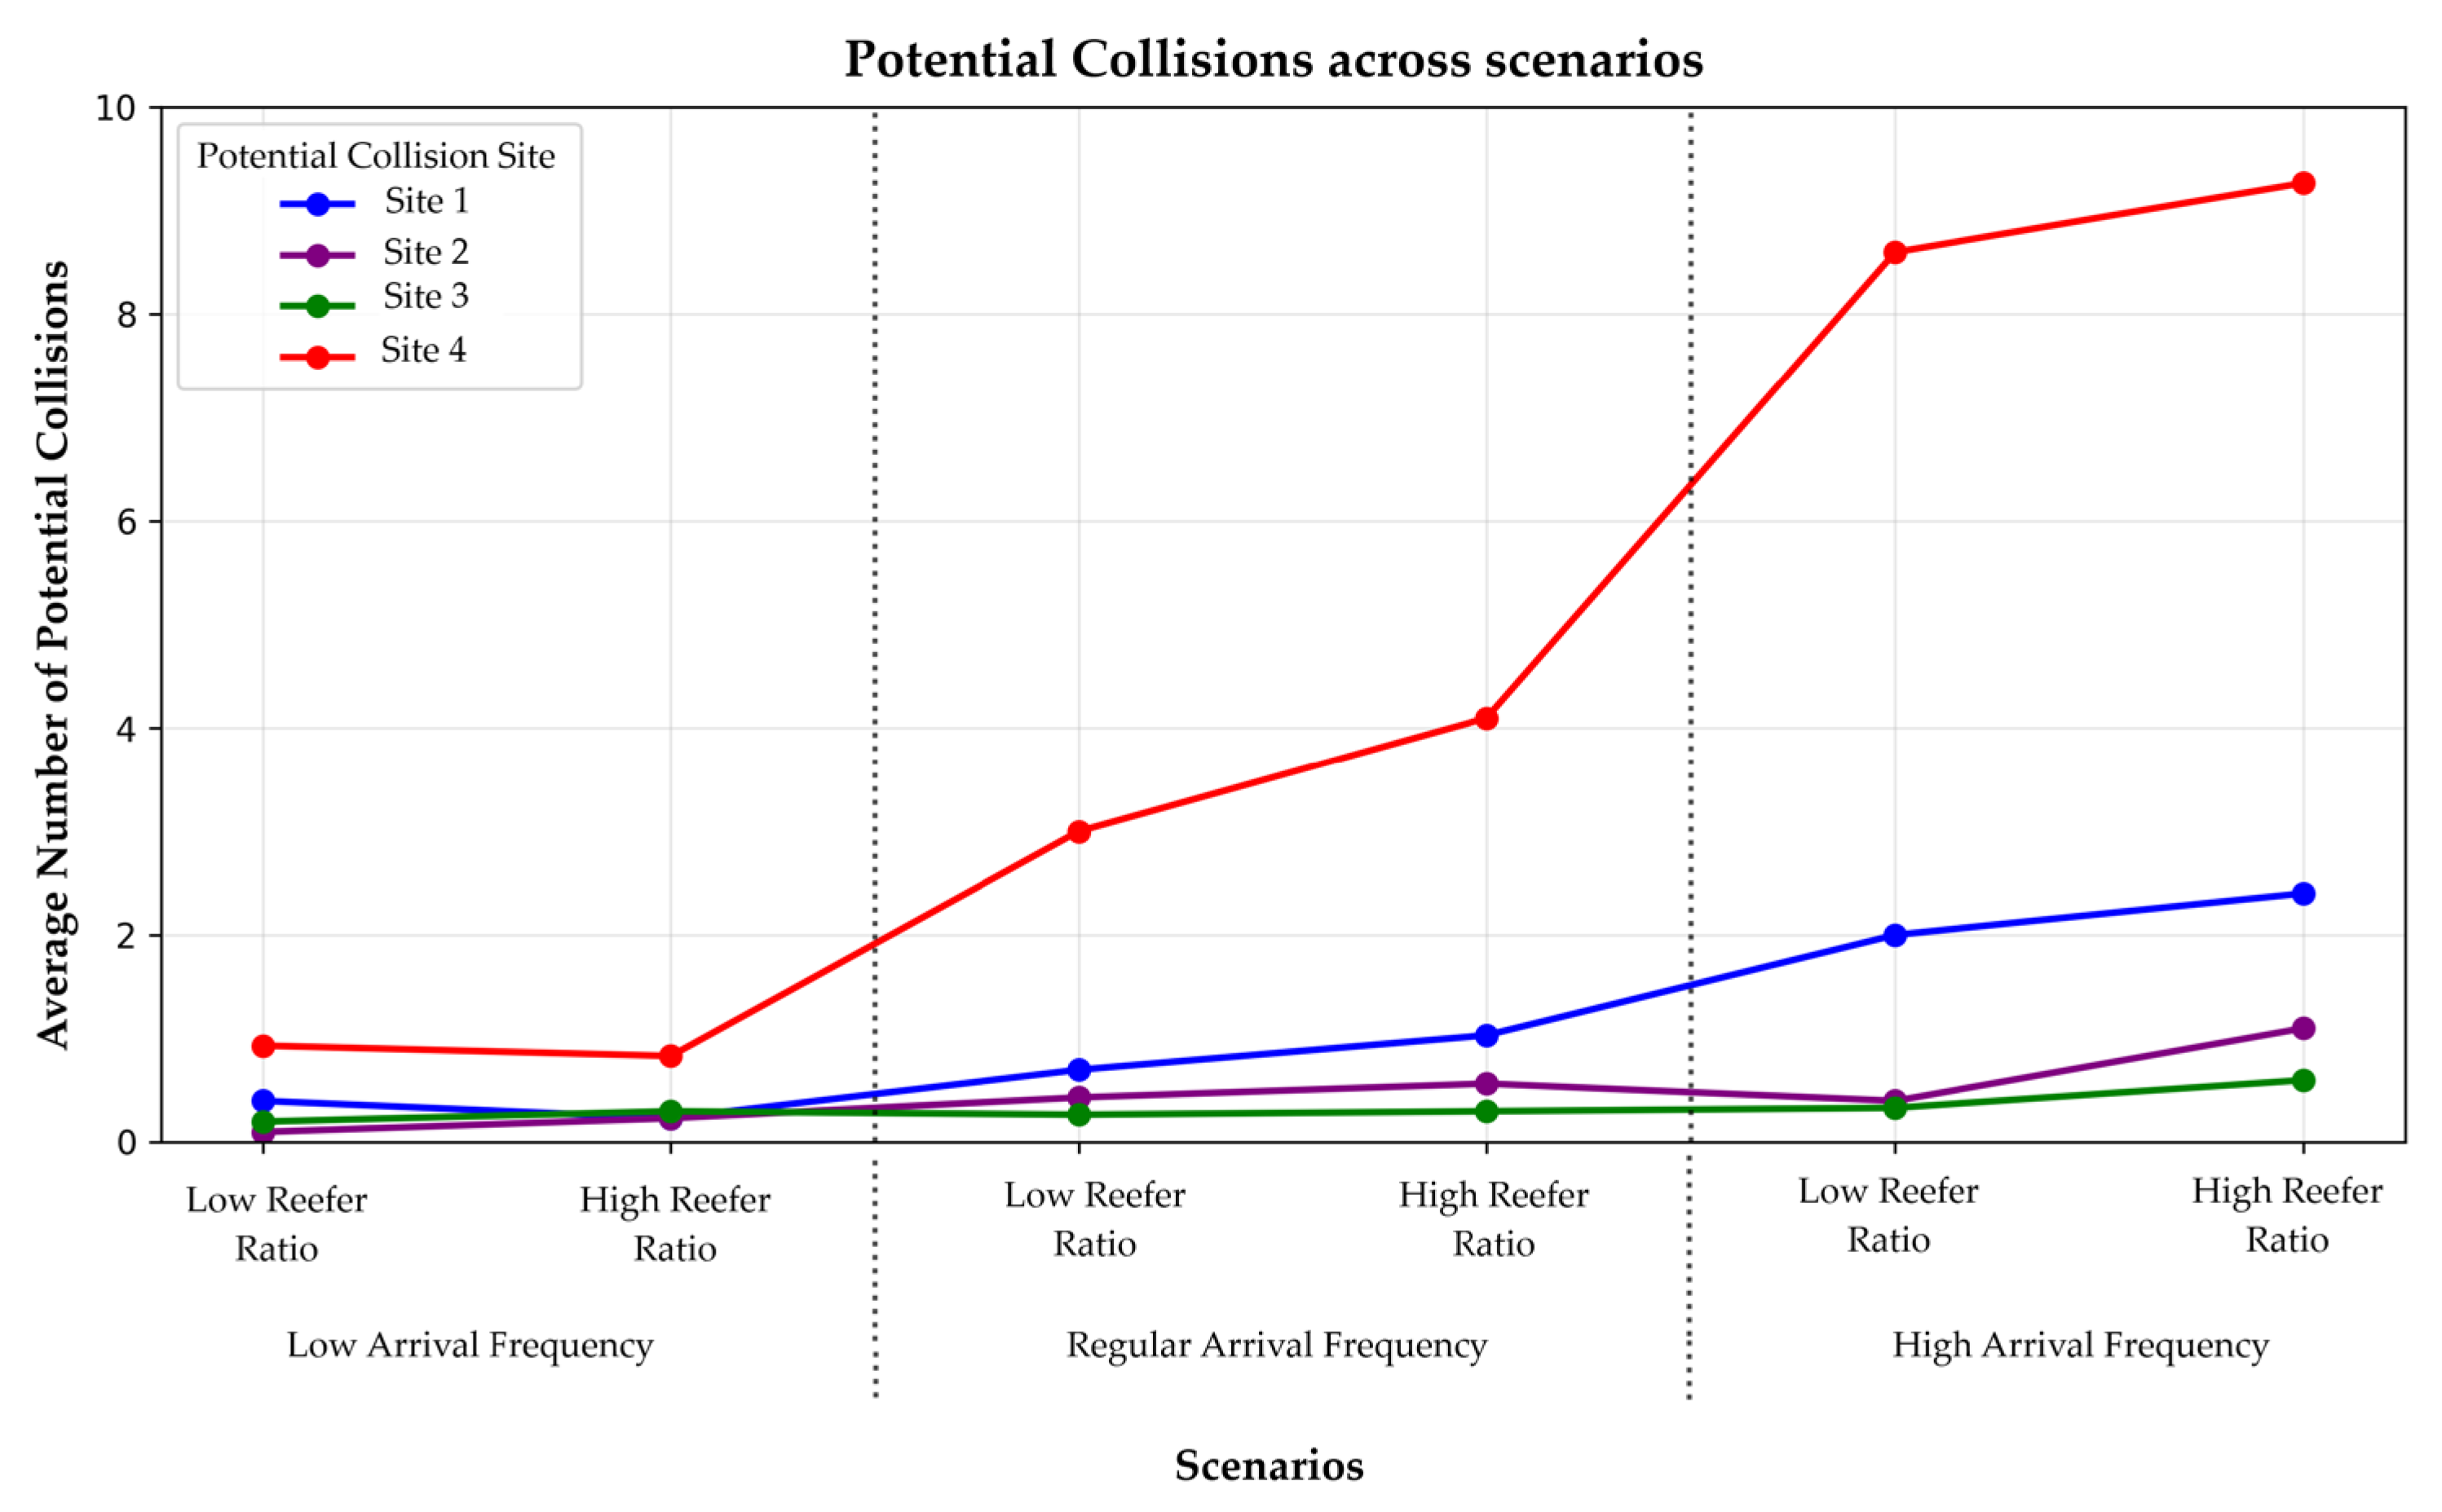
6.1.3. Potential Collisions Analysis
The collision analysis reveals distinct safety patterns across four identified conflict zones within the depot’s operational layout (see
Figure 8). ANOVA statistical analysis confirms significant differences in collision sensitivity patterns across the sites (
Table 7).
Figure 8 shows the average number of potential collisions across four identified conflict zones within the depot’s operational layout. Site 1 is located in the Dry sector at the B2-B3-A2 intersection, Site 2 is positioned at the Dry/Reefer intersection zone between B5-B6 blocks, Site 3 is situated in the Reefer zone encompassing B6-B7 and A2 blocks, and Site 4 is located at the Gate sector intersection between B1-B2 blocks. Sites 1, 2, and 4 demonstrate significant sensitivity to arrival frequency variations, indicating that traffic density is the primary driver of collision risk at these locations. However, their responses to reefer ratio changes vary considerably: Site 1 shows no significant sensitivity to reefer ratio variations, while Site 2 exhibits significant sensitivity only under high arrival frequency conditions, and Site 4 demonstrates significant ratio sensitivity exclusively under regular arrival frequency scenarios. Site 3 maintains operational independence from both parameters, suggesting its collision patterns are driven by factors beyond the analyzed operational variables.
The collision analysis reveals distinct safety patterns across these sites. Site 1 represents a low-impact zone with minimal collision frequencies across all operational scenarios. Site 2 demonstrates the lowest absolute occurrence rates but shows sensitivity to operational stress during peak conditions. Site 3 exhibits moderate collision activity with increases under high operational stress. Site 4 shows the highest collision frequencies with notable increases under high traffic density conditions, representing the primary operational challenge where traffic converges and requiring enhanced management procedures.
6.2. Regression Analysis to Explain the Number of Potential Collisions
Poisson regression was employed to analyze the effects of truck turnaround time (TTT) and distance covered by lifting equipment (DCLE) on the number of potential collisions. This analysis examines whether longer TTTs and greater DCLEs increase collision risk, and whether traditional efficiency metrics can predict collision likelihood at critical intersections.
Table 8 presents the significant variables and goodness-of-fit measures for Poisson regression models explaining the number of potential collisions at conflict zones.
The model developed to explain the number of collisions at Site 1, located at the intersection of blocks handling dry containers, shows a moderate fit (). One of the statistically significant variables for this model is DCLE1 (), which is associated with container handling equipment in this zone. This establishes a directly proportional relationship. As the distance traveled by the lifting equipment (LE) increases, there is a tendency toward a higher number of potential collisions.
However, another statistically significant variable is TTT of trucks requiring reefer containers (). This finding indicates that the number of potential collisions tends to increase as the residence time of this type of container in the system increases. It is important to note that these trucks represent those that spend the longest time in ECD. Consequently, any increase in their TTT generates increased congestion in specific sectors, particularly in the corridor between areas A1 and A2.
The TTT of trucks requiring reefer containers constitutes the only statistically significant variable in the model developed for Site 3 (). However, the model fails to adequately fit the number of potential collisions observed at this point (). A similar pattern emerges in the results obtained for Site 2, where the only variable showing statistical significance is DCLE4 (). This equipment is directly associated with the intersection sector in question. Similarly, satisfactory results are not obtained in terms of model fit ().
Both results strongly suggest that it is necessary to consider the incorporation of specific safety indicators in the comprehensive evaluation of CDS layouts. These would function as a complement to traditional TTT and DCLE metrics.
In contrast, the model associated with Site 4 exhibits the best fit among all analyzed models (). In particular, TTT variables associated with both dry () and reefer () container requirements demonstrate statistical significance for the model. Similarly, the distances traveled by lifting equipment DCLE1 (), DCLE2 (), and DCLE4 () are significant. Consequently, most of the variables incorporated in the analysis are relevant for explaining the behavior of potential collisions at PC4.
It is essential to observe that Site 4 is strategically located in the Gate zone. This is an area where vehicular congestion manifests as a direct result of the convergence of most operational processes associated with the ECD. Under this same conceptual logic, the total number of collisions, considering all identified conflict sites, faithfully reproduces the same behavior observed at Site 4. This confirms its representativeness as a comprehensive system indicator.
Managerial Insights
The analysis of three key performance indicators has identified significant inefficiencies, workload imbalances, and safety risks throughout the depot’s operations. Based on this, we propose some recommendations to address these critical challenges.
The Reefer area operates with single lifting equipment for both truck servicing and container maneuvers. Deploying additional lifting equipment would distribute these dual responsibilities and provide performance alignment with dry area operations. Task redistribution should include reallocation of workshop operations or container maneuvers to maintain resource utilization across operational areas.
The current layout generates congestion during operations. Relocating PTI setup processes from the Reefer area would reduce truck processing times. Street network and block configuration optimization should address the traffic conflicts and processing delays through dedicated traffic lanes and improved sight lines.
The depot entrance at Site 4 requires traffic pattern reconfiguration with improved lane directionality and flow management. Automated traffic management systems including traffic signals and motion sensors would provide systematic traffic regulation throughout the facility.
Finally, manual gate processes impact truck operations, particularly trucks that request containers. Automating gate entry and exit procedures would streamline workflows and reduce processing times. This automation would provide consistent service delivery across varying traffic volumes.
Based on the findings and recommendations from this research study, the terminal has initiated a comprehensive layout modification project to address the identified operational inefficiencies and safety concerns. The terminal management has begun implementing structural changes to optimize traffic flow patterns, redistribute equipment allocation, and reconfigure critical operational areas to enhance overall performance and reduce processing bottlenecks throughout the facility.
7. Conclusions
This study addressed three critical research objectives in container terminal operations: examining relationships between arrival patterns and operational conditions with performance indicators, analyzing the effect of truck turnaround times and equipment travel distances on potential collision frequency, and exploring how efficiency metrics explain collision risk while transforming simulation insights into actionable optimization strategies.
The operational analysis reveals significant disparities between dry and reefer container operations. TTT analysis demonstrates superior efficiency in dry truck operations due to streamlined processing requirements, with minimal efficiency losses under increasing arrival frequencies. Conversely, reefer operations exhibit escalating inefficiencies under high-demand conditions, requiring targeted capacity optimization strategies. The simulation model confirms this resource imbalance, showing reefer-dedicated equipment operates 3–4 times the travel distance of dry-dedicated equipment, highlighting intensive operational requirements and optimization opportunities.
From a safety perspective, the collision analysis examined four conflict zones with distinct risk profiles. Site 1 at the gate intersection shows the highest collision frequencies that increase under high traffic density conditions, while other sites demonstrate varying sensitivities to operational parameters. Site 4 requires management protocol enhancements as the primary traffic convergence point, while Sites 1–3 require targeted interventions based on their specific operational dependencies.
The Poisson regression analysis reveals that different conflict zones respond to distinct operational factors with varying predictive strength. Site 4 shows the strongest explanatory power with multiple significant predictors, while Sites 2 and 3 exhibit poor model fits, indicating that traditional efficiency metrics inadequately predict collision occurrence at these locations. Notably, TTT for reefer request trucks emerges as a significant predictor across multiple sites, demonstrating that reefer operations generate systemic congestion effects throughout the depot.
The poor model performance at several conflict zones challenges the adequacy of conventional efficiency metrics for comprehensive safety assessment. This finding emphasizes that effective ECD layout evaluations must integrate specific safety indicators alongside traditional efficiency metrics.
Based on these findings, four critical recommendations emerge: optimizing lifting equipment allocation to address reefer operation bottlenecks while redistributing tasks to prevent overloading; redesigning physical layout and traffic flow by relocating PTI processes and optimizing street networks; implementing enhanced safety measures focused on high-risk areas through automated traffic management systems; and automating administrative gate operations to eliminate processing delays. These integrated strategies provide a comprehensive framework for achieving balanced resource utilization, improved operational efficiency, and enhanced safety protocols.
The convergence of these findings establishes a comprehensive DES-Framework for terminal layout evaluation that prioritizes both operational efficiency and safety performance.
Current research is extending this framework along two complementary directions. First, the simulation model is being adapted to evaluate real-world layout modifications currently under implementation by the partnering maritime terminal. Based on this study’s recommendations and additional operational requirements, the terminal has developed a comprehensive redesign proposal encompassing container type relocations, gate infrastructure modifications, service facility repositioning, and traffic flow optimization. These modifications are being systematically assessed through enhanced versions of our simulation framework to quantify individual and synergistic effects on both operational efficiency and safety performance.
Second, we are developing an integrated mathematical optimization model for dynamic space allocation within ECD operations. This model addresses the strategic positioning of container segregations according to shipping line ownership, container specifications (reefer/dry), and maintenance requirements (damaged/undamaged). Given that segregation placement significantly influences internal traffic patterns, equipment workload distribution, and potential collisions, the simulation framework is being enhanced to incorporate space allocation decisions and evaluate their effects on overall yard performance. These ongoing developments will enable more comprehensive evaluation of ECD layout alternatives and their operational implications.


