Article

An Assessment of Shipping Network Resilience Under the Epidemic Transmission Using a SEIR Model

1
China Institute of FTZ Supply Chain, Shanghai Maritime University, Shanghai 201306, China
2
School of Logistics Engineering, Shanghai Maritime University, Shanghai 201306, China
*
Author to whom correspondence should be addressed.
J. Mar. Sci. Eng. 2025, 13(6), 1166; https://doi.org/10.3390/jmse13061166
Submission received: 11 May 2025 / Revised: 6 June 2025 / Accepted: 10 June 2025 / Published: 13 June 2025

Abstract

Epidemics spread through shipping networks and have dual characteristics as both biological sources of infection and triggers of cascading failures. However, existing resilience models fail to capture this dual and coupled dynamics. To minimize the cascading impacts of epidemics on global shipping networks, this paper proposes an innovative resilience assessment framework that considers the interaction between epidemic transmission and the shipping network cascading failure. First, a weighted shipping network topology is constructed based on route flow characteristics to quantify route frequency, stopping time, and the number of infected people, and the epidemic transmission across ports is modeled with an improved SEIR model, which contains a heterogeneous infectivity function and a dynamic transmission matrix, revealing a dual transmission mechanism inside and outside the ports. Second, a two-stage cascading failure model is developed: a direct failure triggered by infected people exceeding the threshold and an indirect failure triggered by the dynamic redistribution of loads. The load redistribution strategy is optimized to reconcile the residual port capacity and the risk of infection. Finally, a multidimensional resilience assessment framework covering structural destruction resistance, network efficiency, path redundancy, and a cascading failure propagation rate is constructed. Example validation shows that the improved load redistribution strategy reduces the maximum connected subgraph decay rate by 68.2%, reduces the cascading failure rate by 88%, and improves the peak network efficiency by 128.2%. In case of multi-source epidemics, the state of the network collapse can be shortened by 12 days if the following recovery strategy is adopted: initially repair high connectivity hubs (e.g., Port of Shanghai), and then repair high centrality nodes (e.g., Antwerp Port) to achieve a balance between recovery efficiency and network functionality. The research results reduce the risk of systemic disruptions in maritime networks and provide decision-making tools for dynamic port scheduling during pandemics.

1. Introduction

As the main artery of international trade, the global shipping network carries more than 80% of the cargo volume [1], and its strategic role in international logistics is directly related to supply chain stability and economic security. However, the maritime industry, due to its inherent characteristics, such as the high mobility of crew members and the cross-border connectivity of ships, has become an important vehicle for the spread of an epidemic. In addition, due to the irreplaceable nature of port nodes and the complexity of the shipping network itself, the entire shipping network is extremely susceptible to interference and disruption from a variety of factors, including extreme weather, political conflicts, economic fluctuations, and public health crises [2]. According to the World Health Organization, more than 70% of pandemic outbreaks have significant spatial correlation with international transportation [3]. It is also revealed that ports have a hub effect in cross-border transmission of epidemics, which further confirms the dual role of the shipping network: both as an economic lifeline and as a key way of epidemic spread [4].
The impact of pandemic outbreaks on shipping networks is dynamic and accompanied by a cascading effect. The COVID-19 outbreak was an unprecedented global public health event, which had a severe impact on shipping networks [5]. For example, multiple port blockades occurred during the COVID-19 pandemic, such as key ports in Shanghai, Los Angeles, and Ningbo, leading to disruptions in the global shipping system [6]. Verschuur et al. [7], based on high-frequency ship tracking data, found that COVID-19 lockdown measures caused global maritime trade volumes to decline by 7.0–9.6% in the first eight months of 2020, with manufacturing suffering the most severe damage (−11.8%). Xu et al. [8] pointed out that disruptions in a single port were sufficient to trigger cascading failure of connected ports. This chain reaction suggests that epidemics not only can lead to direct disruptions in ports but can also exacerbate pressures on neighboring ports through load redistribution mechanisms, which can ultimately lead to a decline in the whole network’s efficiency and even the collapse of regional networks. Currently, the international maritime safety system is primarily managed by the International Maritime Organization (IMO). Nam et al. [9] pointed out that COVID-19 exposed legal loopholes in the IMO Convention during global inspection interruptions. Classification societies can invoke “force majeure” to extend the deadline by three months, but the convention cannot cover systemic crises, leading to the risk of overdue operations. They recommended revising classification society rules and IMO provisions to include pandemic response measures. Zhang et al. [10] utilized corpus linguistics methods to analyze IMO circulars related to the pandemic, revealing the dynamic evolution of maritime management in the shipping industry during the COVID-19 pandemic. The study found that during the early, mid, and late stages of the crisis, the IMO introduced coordinated measures such as certificate extensions, protection of seafarers’ human rights, and electronic management to enhance the resilience of the shipping system. During the COVID-19 outbreak, shipping companies and ports developed and implemented emergency procedures for vessels under pandemic conditions, guided by recommendations and policy directives from international organizations such as the World Health Organization (WHO) and the IMO. However, due to the rapid spread of the pandemic, the response measures adopted by affected vessels and ports were largely temporary and lacked many essential elements [11]. Therefore, accurately and swiftly assessing the risks of pandemic spread and establishing a shipping network resilience system to guide the mitigation of pandemic impacts has become a critical issue in global trade security and public health governance.
This paper proposes an innovative shipping network resilience assessment framework taking into consideration the interaction between epidemic transmission and the shipping network cascading failure. First, the influence of port node heterogeneity on epidemic transmission along the shipping network is analyzed. Second, a two-stage cascading failure model is designed such that in the first stage, the number of infected people in a port increases until the port stops operating normally, which triggers the redistribution of the network load; in the second stage, a port receiving the redistributed load reaches its maximum load and then fails, forming a cascading failure chain. Note that in the second stage, the port receiving extra load from other disabled ports can also fail due to the spread of infection, making the interaction between epidemic transmission and the shipping network failure more complicated.
The main contributions of this paper are summarized below:
(1)
A shipping network–epidemic transmission coupling dynamics framework is proposed. Breaking through traditional research’s assumption of static disruption patterns, this framework integrates the SEIR model with a dynamic transmission matrix to depict the coupling dynamics between epidemic propagation and network topology evolution, accurately predicting the dual transmission paths of epidemics within ports and across ports.
(2)
A two-stage cascading failure mechanism and a dynamic load allocation strategy are developed. With defined direct failures triggered by infection exceeding thresholds and indirect failures caused by the load reallocation, this study innovatively proposes a dynamic weight allocation strategy based on the node remaining capacity and real-time infection risk, providing a theoretical basis for port load scheduling under pandemic shocks.
(3)
A multidimensional resilience assessment indicator system is constructed, integrating structural robustness, network efficiency, path redundancy, and a cascading failure propagation rate. This breaks through the limitations of traditional research relying on only topological indicators. Based on simulation experiments, the feasibility of the aforementioned model is validated, providing decision support for optimizing the resilience of the global shipping network.
The rest of the paper is organized as follows: Section 2 reviews the current state of research in related fields. Section 3 presents the methodological framework of the resilience assessment model. Section 4 conducts experimental validation and result analysis. Section 5 gives a summary of the study and points out some future work directions.

2. Literature Review

2.1. Epidemic Transmission Research

The epidemic transmission dynamics model is an important tool to study the transmission pattern of an epidemic in the population. With the help of mathematical modeling and computer simulation, Wang et al. [12] not only quantitatively analyzed the transmission process of epidemic but also effectively predicted the development trend of the epidemic. In recent years, researchers have significantly improved the predictive ability of the SEIR model. For example, Zheng et al. [13] developed an improved SEIR dynamics model to more accurately estimate the actual inter-infection scale by considering three implied factors: self-recovering asymptomatic individuals, recovered individuals, and deceased individuals. Lu et al. [14] established an improved SEIR dynamics model to more accurately estimate the actual inter-infection scale by developing a regression and heuristic algorithm adapted to population parameters and developed an improved SEIR model to analyze the epidemic data from February to September 2020 in two phases, using the second outbreak in Italy as a case study, and the results highlighted the importance of epidemic prevention measures in COVID-19 modeling. Wang et al. [15] enhanced the traditional SEIR model based on China’s epidemic prevention strategy and the characteristics of COVID-19 transmission by introducing two major categories of quarantine and asymptomatic cases, and they proposed the SQEAIR model. Validated by AIC and MAE assessment indexes, the model showed higher fitting accuracy in Shanghai and Guangzhou infected case data and was able to predict the epidemic more accurately, providing a powerful tool for evaluating prevention and control strategies. Jing et al. [16] investigated the impact of heterogeneous infection rates on the spread of epidemic, used the mean-field approximation and the continuous-time Markov chain to establish the model control equations, adjusted the infection heterogeneity parameter to control the epidemic spread range and threshold, and verified the accuracy of the theoretical prediction.
However, the classical SEIR model is based on the homogeneous mixing assumption, which is applicable to the simulation of the spread of closed systems, but it is difficult to portray the heterogeneous contact network in real scenarios. It is noteworthy that Qian et al. [17] innovatively proposed the Trans-SEIR model, combining the urban transportation system with the spread of outbreaks to optimize the outbreak prevention and control strategies. Liu et al. [18] proposed a region-based SEIR model focusing on the spread of infections in transportation, especially the risk during commuting, which more accurately reflects the spread pattern of outbreaks in cities. Kuzdeuov et al. [19] developed a network-based stochastic epidemic simulator, which can combine information on demographics, mobility data, and healthcare resources to simulate the spread of COVID-19 and assess the effects of different epidemic prevention policies. This provides some reference for this paper to construct a shipping network transmission model.
With the continuous deepening of research, scholars have gradually adopted complex network analysis methods to model the spread of epidemics. Scabini et al. [20] constructed a multilayered social network model to reveal the social diffusion mechanism of COVID-19 in different scenarios by deconstructing the topological differences between work–home–school scenarios. Tsiotas et al. [21] constructed a global travel and transportation network multidimensional weighted network model by integrating three-dimensional variables of network connectivity, economic openness, and spatial impedance in order to elucidate the topology-dependent characteristics of COVID-19 transnational spread. Ma et al. [22] focused on the relationship between the outbreak spread and community structure in a multilayered network and, using network analysis and modeling techniques, found that an increase in the average degree of communities in the infection layer or a decrease in the probability of inter-community connectivity promotes the spread of outbreaks, whereas an information layer community average degree increase or an increase in the number of communities in the infection layer has an inhibitory effect. In addition, Ma et al. [23] constructed a model of traffic-driven SIR outbreak spread on a “logical-physical” hierarchical network and found that traffic flow significantly affected the intensity and scope of outbreak spread, and the homogeneous network structure was more likely to promote the spread of outbreaks, which provided a basis for the design of prevention and control strategies.
Yazir et al. [24] revealed the asymmetric impact of COVID-19 on the shipping industry: oil tankers saw a surge in profits due to an increased demand for floating storage, while container throughput decreased by 8.47%, and the cruise industry collapsed due to the risk of transmission in enclosed spaces. Li et al. [25] used complex network theory and AIS data to find that COVID-19 caused a sharp decline in global container freight traffic, but the number of network connections actually increased slightly, enhancing overall resilience; however, the vulnerability of major hub ports became evident, and regional trade disparities intensified. Dirzka et al. [26] analyzed liner service suspension announcements and found that the initial phase of the COVID-19 pandemic led to the cancellation of 19.6% to 26.4% of global shipping network services, with disruptions first concentrated in Asia and then spreading along major trade routes. Prieto et al. [27] analyzed 23,803 Paris MoU port state control (PSC) inspection records from the top ten European ports and proposed using multivariate spatiotemporal analysis (such as CO-X-STATIS) as a tool for assessing the dynamic risk of COVID-19 among flag states, providing data support for maritime authorities to optimize their target vessel screening mechanisms.
To date, the majority of existing research has concentrated on land-based transportation networks such as roads and railroads. In contrast, fewer studies have modeled the spread of epidemics through maritime networks, which serve as the primary channels for global trade. Furthermore, current models inadequately capture the cross-border transmission of epidemics via shipping networks. They also fail to account for the diverse characteristics of individual ports when setting infection rates, leading to inaccurate depictions of epidemic transmission patterns and dynamics.
To overcome the limitations of existing studies, this paper innovatively proposes a framework of epidemic transmission dynamics that combines SEIR models with shipping networks. Unlike the traditional homogenization assumption, the paper introduces a heterogeneous infection rate function to link the port connectivity index, epidemic prevention intensity, and infection risk, revealing the regulatory mechanism of node heterogeneity on epidemic transmission. Furthermore, the spatial and temporal coupling effects of route frequency, stopping time, and the number of infected persons are quantified. A dynamic transmission matrix is constructed and integrated into the SEIR model to characterize the transmission mechanism of epidemics within and across ports through the shipping network.

2.2. Shipping Network Resilience Study

Resilience, as a core concept in the performance assessment of complex systems, refers to the ability of a network to maintain its functional integrity and achieve rapid recovery after an external perturbation. In the field of shipping, resilience research focuses on quantifying the dynamic response mechanism of networks to unexpected events (e.g., epidemics, natural disasters, and geopolitical conflicts), and the mainstream methodologies include graph theory analysis, complex network theory, and mathematical modeling simulation, with the following research progress and limitations:
(1)
Resilience assessment based on graph theory: Graph theory reveals the vulnerability and recovery potential of shipping networks through topology analysis. Bai et al. [28] constructed a global liner shipping network using high-frequency ship movement data, identified the overlapping cluster structure and key nodes by using the cluster penetration method, and accurately assessed the impact of traffic on the system’s resilience by layering weighted networks through network decomposition methods. Ducruet et al. [29] used container ship movement history data to construct port networks based on graph theory and complex network methods and calculated the degree centrality and meso-centrality of ports in order to analyze the resilience of shipping networks.
(2)
Resilience optimization based on complex network theory: Complex network theory provides strategic support for shipping resilience enhancement through attack–recovery simulation and dynamics analysis. Poo et al. [30] proposed to configure alternative shipping routes from a system perspective, combining climate risk indicators, centrality analysis, and ship route optimization to assess the climate resilience of global shipping networks. Yang et al. [31] constructed a maritime Silk Road shipping network based on route data, using transferability and diversity to represent network and node resilience. Maritime Silk Road shipping network, denoting network and node resilience by transmissibility and diversity, identified 9 dominant nodes and 15 vulnerable nodes by disruption simulation. Experiments show that the failure of dominant ports and the emergence of vulnerable ports weaken the network structural resilience, and the disruption of major ports greatly affects the network structural resilience. Peng et al. [32] designed statistical metrics based on the complex network theory and used four attack strategies, including random attacks and three intentional attacks (i.e., degree-based attacks, mediator-based attacks, and flux-based attacks), to evaluate the robustness of the three typical cargo ship transport networks. He et al. [33] proposed a CPSN resilience framework based on complex network theory, including prevention, resistance, recovery, adaptation, and optimization; they evaluated CPSN resilience by analyzing the performance changes of network metrics and found that protecting the central node can improve network resilience. Guerrero et al. [34] used complex network analysis to find that COVID-19 significantly reduced global maritime connectivity, leading to an increase in port concentration in Asia and North America and a decrease in Europe and Africa. Large and localized small ports were more resilient, while hub ports were severely damaged.
(3)
Resilience simulation based on mathematical modeling: Mathematical modeling simulates the evolutionary behavior of shipping networks under perturbations by means of kinetic equations. Wang et al. [35] focused on inland waterway transport resilience, proposed flexible freight consolidation strategies under intermodal transport systems, and constructed a nonlinear mathematical planning model that is solved by a branch bounding algorithm to cope with the impacts of disruptions such as epidemics on transport. Zohoori et al. [36] proposed an analytical method to quantify the resilience of a narrow waterway system during a disaster, selecting the number of inbound and outbound vessels and the total berthing time as indicators, developing heuristics to extract KPIs from AIS data, and using the data of the Houston waterway during Hurricane Harvey as an example to provide support for decision-makers. Wang et al. [37] developed a discrete event simulation based on the complex network theory model to quantify network resilience, introduce resilience indicators containing ship load, delay, and recovery cost, and verify the validity of the resilience indicators using the deep-water channel at the mouth of the Yangtze River as a case study. Qin et al. [38] proposed the concept of port node resilience from the perspective of the shipping network and constructed a three-dimensional econometric model. By analyzing the data of Chinese container ports in 2008 and 2018, it is found that the port node resilience index is clustered, and the average resilience index is increased, and the regional resilience difference is reduced. Cao et al. [39] proposed a data-driven resilience analysis framework for the global container shipping network (GCSN) and designed two new load redistribution rules for cascading failures: breadth-first (BFRR) and depth-first (DFRR). The study showed that BFRR improves system redundancy through multi-objective allocation but is prone to spreading overload, while DFRR concentrates loads on a single hub, which reduces fault propagation but increases pressure on critical nodes.
In addition, Wan et al. [40] designed a resilience cost ratio metric based on a resilience loss triangle model to measure the performance of a liner shipping network (LSN) during recovery and proposed four recovery strategies to test the rationality and feasibility of the developed metrics in assisting the decision-making of LSNs from a resilience perspective. Asadabadi et al. [41] proposed a stochastic two-level game model, which considers port competition and cooperation to assess and improve the resilience of global port networks.
Nevertheless, existing research on the resilience of maritime shipping networks exhibits certain limitations. Prior studies have predominantly concentrated on network vulnerability to emergencies such as natural disasters or extreme weather, while largely overlooking epidemic spread dynamics. Epidemic outbreaks exhibit unique propagation characteristics: first, they are initiated by internal infections rather than external transient disruptions; second, they often trigger cascading failures. Additionally, current assessment frameworks suffer from dimensional homogenization and an overemphasis on static structural indicators, such as topological connectivity, which fail to adequately capture the dynamic cascading effects and functional degradation caused by epidemic shocks.
To address these gaps, this paper proposes a two-stage cascading failure model combined with a dynamic load allocation strategy. By setting infection thresholds to trigger direct failures and using dynamic load redistribution to induce indirect failures, the model reveals the dynamic evolution of shipping network resilience under epidemic impacts. Furthermore, a dynamic weight allocation strategy is introduced, integrating residual capacity and infection risk considerations to provide a theoretical foundation for port load scheduling during epidemics. A multidimensional resilience assessment index system is also constructed, incorporating structural destruction resistance, network efficiency, path redundancy, and cascading propagation rates. This system breaks through the limitations of single topology index assessments and offers decision-making support for optimizing shipping network resilience.

3. Methods

3.1. Coupled Model Construction

The aim of this section is to construct an improved SEIR model of a coupled shipping network to simulate the propagation dynamics of an outbreak in a shipping network. The following section will detail the topological modeling of the shipping network, the construction of the heterogeneous infection rate function and dynamic transmission matrix, the improvement of the SEIR model and the design of its dynamical equations.

3.1.1. Network Architecture Definition

The shipping network can be abstracted as an undirected weighted graph G = (V, E, W) consisting of port nodes and route edges between ports. The attributes of each port not only affect its own ability to spread the epidemic but also interact with other ports through the routes. Its topology is defined as follows:
(1)
Node set V represents the port nodes in the network. Each node vi contains the following attributes:
Connectivity index ki: reflecting the connectivity and hub status of ports in the global shipping network, the data are from UNCTAD and are normalized due to the possibility of large differences in the index between different ports.
Epidemic prevention intensity q i : reflecting the port’s ability to prevent epidemics, related to the density of medical and quarantine personnel in the port, epidemic prevention equipment, etc., the data come from WHO by weighting the density of medical personnel and the number of epidemic prevention equipment in the port’s hinterland, and the same data are normalized.
Total number of people in the port Ni: reflecting the total number of staff in the port according to the official website of each port, part of the missing data are in accordance with the size of the port to be synthesized.
(2)
Side set E represents the direct routes between ports, and each side ei has the following attributes:
Route frequency fij, based on AIS trajectory data statistics, reflects the route flow between ports.
Docking time tij: Calculated from AIS data, it reflects the average time of a ship’s docking in a port between two ports.

3.1.2. Heterogeneous Infection Rate Function

The traditional SEIR model assumes that the population is uniformly distributed and that transmission occurs at the same infection rate. However, the heterogeneity of nodes in shipping networks (such as connectivity indices and epidemic prevention intensity) requires differentiated modeling of infection rates. This model introduces a heterogeneous infection rate function, designed based on two core mechanisms: the hub effect amplifies transmission risks as high-connectivity ports with frequent vessel calls and dense operational staff lead to increased effective contact rates per unit time, thus requiring positive adjustment of infection rates; epidemic prevention intensity suppresses transmission by reducing effective contact rates. Additionally, the inhibitory effect of epidemic prevention measures on infection rates is not a simple linear relationship. In the early stages of epidemic prevention and control, when prevention and control intensity is low, a slight increase in prevention and control measures (such as increasing the density of medical personnel and improving the supply of epidemic prevention materials) often leads to a significant decrease in the infection rate. However, when prevention and control intensity is already high, further increases in prevention and control efforts may only result in a marginal decrease in the infection rate. This diminishing marginal effect can be effectively captured through the nonlinear characteristics of an exponential function, which reflects the complex relationship between epidemic prevention and control intensity and the infection rate.
Therefore, this model introduces the heterogeneous infection rate function βi, combined with the port connectivity index and epidemic prevention intensity, as a way to reflect the risk of epidemic transmission in each port, which is calculated by the following formula:
β i = β 0 k i e q i
where β0 is the baseline infection rate, ki is the connectivity index of the port, and q i is the intensity of epidemic prevention in each port.

3.1.3. Dynamic Communication Matrix

Accurate quantification of inter-port transmission risk is essential when studying the risk of epidemic transmission in shipping networks. It is difficult for traditional methods to capture the dynamic changes and complex associations of transmission risk, so this model defines the dynamic transmission matrix Wij(t) across ports to comprehensively and dynamically quantify the transmission risk between ports. Its calculation formula is:
W i j t = f i j t i j e I j t N j
where Ij(t) denotes the number of infected people in port j at moment t, and N j is the total number of people in port j. This transmission matrix has two properties: flow-driven property—the longer the frequency of routes and the duration of stops, the greater the risk of transmission between ports; and outbreak feedback—the higher the number of infected people in a port, the more the risk of the route is amplified. In addition, this model has strict mathematical constraints as by boundedness proof: since 0 ≤ Ij(t)/Nj 1, eIj(t)/Nj∈[1,e] ≈ [1,2.718], ensuring that Wij(t) does not diverge to infinity; convergence guarantee: when epidemic prevention measures take effect, Ij(t) will gradually decay, satisfying limt→ eIj(t)/Nj = 1, at which point the transmission matrix converges to the steady state fij tij.

3.1.4. Improvement of SEIR Kinetic Equations

The traditional SEIR model has significant limitations when simulating the spread of epidemics in shipping networks: its assumption of homogeneity ignores differences in port node characteristics and cannot reflect the dense contact risks of highly connected hub ports; at the same time, the closed-system design makes it difficult to characterize cross-port transmission triggered by shipping activities. To overcome these limitations, this paper improves the model by introducing a heterogeneous infection rate function for ports, quantifying hub contact density through connectivity indices, and combining epidemic prevention intensity to suppress transmission risks. It also constructs a dynamic transmission matrix, coupling shipping route frequencies, berthing times, and infection numbers with feedback mechanisms to dynamically characterize cross-port transmission pathways. This achieves dynamic interaction between epidemic transmission and shipping network states, comprehensively considering the dual transmission mechanisms of epidemics within ports and across ports, and improves the four main state equations: susceptible (S), exposed (E), infected (I), and recovered (R). For port vi, the four population dynamics equations are as follows:
d S i d t = β i t S i I i + θ j W i j t S j
d E i d t = β i t S i I i σ E i θ j W i j t E i
d I i d t = σ E i γ I i
d R i d t = γ I i
where βi(t) denotes the heterogeneous infection rate function, θ is the cross-port exposure coefficient, and σ and γ are parameters for the incubation and infection periods, respectively.

3.2. Cascade Failure Model

The current cascading failure model has shown some limitations under the impact of a pandemic, as its static load distribution mechanism ignores the infection risk of nodes, and failure triggers rely solely on topological overload, failing to accurately capture the dynamic failure process caused by the pandemic. To address this, this paper proposes a two-stage dynamic cascading failure model that overcomes these limitations: the direct failure mechanism is triggered when the infection scale at a port exceeds a threshold, accurately representing the pandemic’s impact on ports; the indirect failure mechanism is achieved through port overload caused by load redistribution. The two-stage failure mechanism not only aligns with the actual patterns of epidemic transmission but also precisely quantifies the dynamic failure pathways of the shipping network under epidemic impacts. This model encompasses key elements such as initial node load, capacity constraints, state evolution, and failure mechanisms, depicting the dynamic process of port nodes transitioning from normal operation to failure.

3.2.1. Initial Load

The initial load of a port node is defined as the average daily throughput (unit: 10,000 tons), denoted as Li. This indicator reflects the scale of the port’s normal operation and is the basic parameter for evaluating the function of the node. In the actual shipping network, the throughput of different ports varies significantly, which needs to be normalized to fit the dynamic process of the model.

3.2.2. Node Capacity and Limit Capacity

The capacity of a port node characterizes its maximum sustainable operating capability. The situation of nodes in real networks is often more complex, and the relationship between their load and capacity is not simply linear. Therefore, this paper assumes that the relationship between the node capacity Ci and the initial load Li is nonlinear, with the following equation:
C i = L i + α L i δ
where α is the capacity redundancy factor (capacity increases with load growth rate for α > 1) and is the capacity parameter.
The limit capacity C i m a x is further introduced, defined as the short-term maximum load that a node can sustain in an emergency situation, satisfying C i m a x > Ci, which is expressed as:
C i m a x = μ C i
where μ is the ultimate capacity factor (μ > 1); the design reflects the port’s ability to maintain some of its functions in an overloaded condition, but with a significant reduction in operational efficiency.

3.2.3. Node State

Based on the load–capacity relationship, the port node state is divided into:
Normal operation: When Lj(t) ≤ Cj, the port is in normal operation.
Overloaded operation: When Cj < Lj(t) C j m a x , the port’s operational efficiency decreases, and it no longer accepts load redistribution from neighboring ports.
Node failure: When Lj(t) > C j m a x , or the number of infected people exceeds a threshold, the port shuts down operations.

3.2.4. Node Failure Mechanism

The failure of the shipping network cascade triggered by the spread of an epidemic across ports presents a two-stage dynamic process:
(1)
Direct failure: When the number of infected people Ii(t) in a port node exceeds a threshold value, the port vi will trigger a shutdown and stop operation. The failure trigger condition is given by the following equation:
I i t λ N i
where Ni is the total number of people in the port vi and the threshold ratio indicates that the port will shut down operations when the number of infected people in the port reaches λ of its total number of people.
(2)
Indirect failure: When a port failure occurs, the node vi load Li is redistributed to the neighboring node vj according to the rules. if the new load L j of vj exceeds its limit capacity, the port will enter into an overloaded state, triggering a secondary failure and forming a cascading failure diffusion chain. The triggering conditions of secondary failure are as follows:
L j = L j + Δ L i j
L j > C i m a x

3.2.5. Load Redistribution Policy

Traditional load allocation strategies only allocate loads based on network topology or static capacity, ignoring the real-time infection risk of nodes during the spread of an epidemic. This flaw causes loads to easily concentrate in ports with high infection rates, thereby exacerbating the risk of epidemic transmission and network collapse. To overcome this limitation, the dynamic load allocation strategy proposed in this paper integrates a dual constraint mechanism of remaining capacity and epidemic risk. This strategy only allows normally operating nodes to participate in load allocation. By dynamically adjusting load allocation weights through real-time calculations of a node’s remaining carrying capacity and infection rate, it guides load allocation toward ports with high capacity and low risk. The load of the failed node is distributed to the neighboring nodes according to the following rules:
(1)
Filter nodes: Only neighboring nodes with normal operation status can accept loads; overloaded and failed nodes do not participate in the allocation.
(2)
Dynamic allocation of weights: The allocation ratio wj(t) of node vj depends on its remaining capacity at moment t and the epidemic risk factor, and the allocation weight formula is as follows:
R j t = C j L j
w j t = R j t 1 I j t / N j k N i R k 1 I k t / N k
where Rj(t) denotes the remaining capacity of node vj at moment t, and Ii(t) is the number of infected people of node vj at moment t.
(3)
Load transfer amount: The equation for the load increment received by the node vj is as follows:
Δ L i j = w j L i
The rule reflects the dual constraints on the operational capacity of ports under epidemics by integrating the residual capacity of nodes with the risk of epidemics to avoid over-concentration of loads on high-risk nodes.

3.3. Resilience Assessment Indicators

Existing resilience assessment methods have certain limitations, primarily relying on static topological indicators (such as node connectivity), which fail to capture the dynamic degradation of network functionality and the speed and path of cascading failures during an epidemic. This can lead to assessment results that may deviate from reality. For example, relying solely on structural metrics may overestimate the resilience of highly connected hubs while overlooking their vulnerability as nodes for epidemic transmission. To address this, the multidimensional assessment framework proposed in this paper integrates four dynamic metrics: structural stability, functional efficiency, redundancy and fault tolerance, and failure propagation rate. This framework overcomes the limitations of existing methods, providing more precise resilience assessment outcomes and supporting subsequent analysis and decision-making.

3.3.1. Structural Resistance

Destruction resistance refers to the degree to which the structural integrity of a shipping network is maintained after a cascade failure, measured by the ratio of the remaining maximum connected subgraph to the number of nodes in the original maximum connected subgraph. The formula is as follows:
R t = G t G
where G′(t) is the number of nodes in the remaining maximally connected subgraph at time t, and G is the number of nodes in the original maximally connected subgraph. The higher the ratio, the more complete the structure of the network remains after an impact, and the protection strategy for critical nodes is more effective.

3.3.2. Network Operating Efficiency

Network operational efficiency reflects the connectivity and flow efficiency between nodes in a shipping network and is calculated by the inverse cumulative average of the shortest path lengths between nodes. The formula is as follows:
E t = 1 N N 1 i j 1 d i j t
where N denotes the total number of nodes in the port, N(N − 1) denotes the number of all possible node pairs, and dij(t) represents the length of the shortest path between node vi and node vj at moment t. A larger value of network efficiency indicates better connectivity and mobility of the network and more efficient movement of goods and people between ports.

3.3.3. Path Redundancy

Path redundancy measures the number of alternative paths in the network and is evaluated by the percentage of independent path entries between nodes. The formula is as follows:
P t = 1 N N 1 i j I i j t
where Iij(t) denotes the number of independent paths between node vi and node vj at time t. A higher value indicates that the network is able to continue operation through other alternative paths when some ports fail, thus ensuring the stability of the whole network.

3.3.4. Cascade Failure Propagation Rate

The cascade failure propagation rate reflects the rate and extent of spread of failed nodes under an outbreak shock and is calculated by the ratio of the number of failed nodes in the cascade to the total number of nodes. The formula is as follows:
C t = N f a i l e d t N
where Nfailed(t) is the number of nodes whose cascade fails at time t. The higher the value, the more severe the impact of the epidemic on the shipping network and the worse the resilience of the network.

4. Case Study

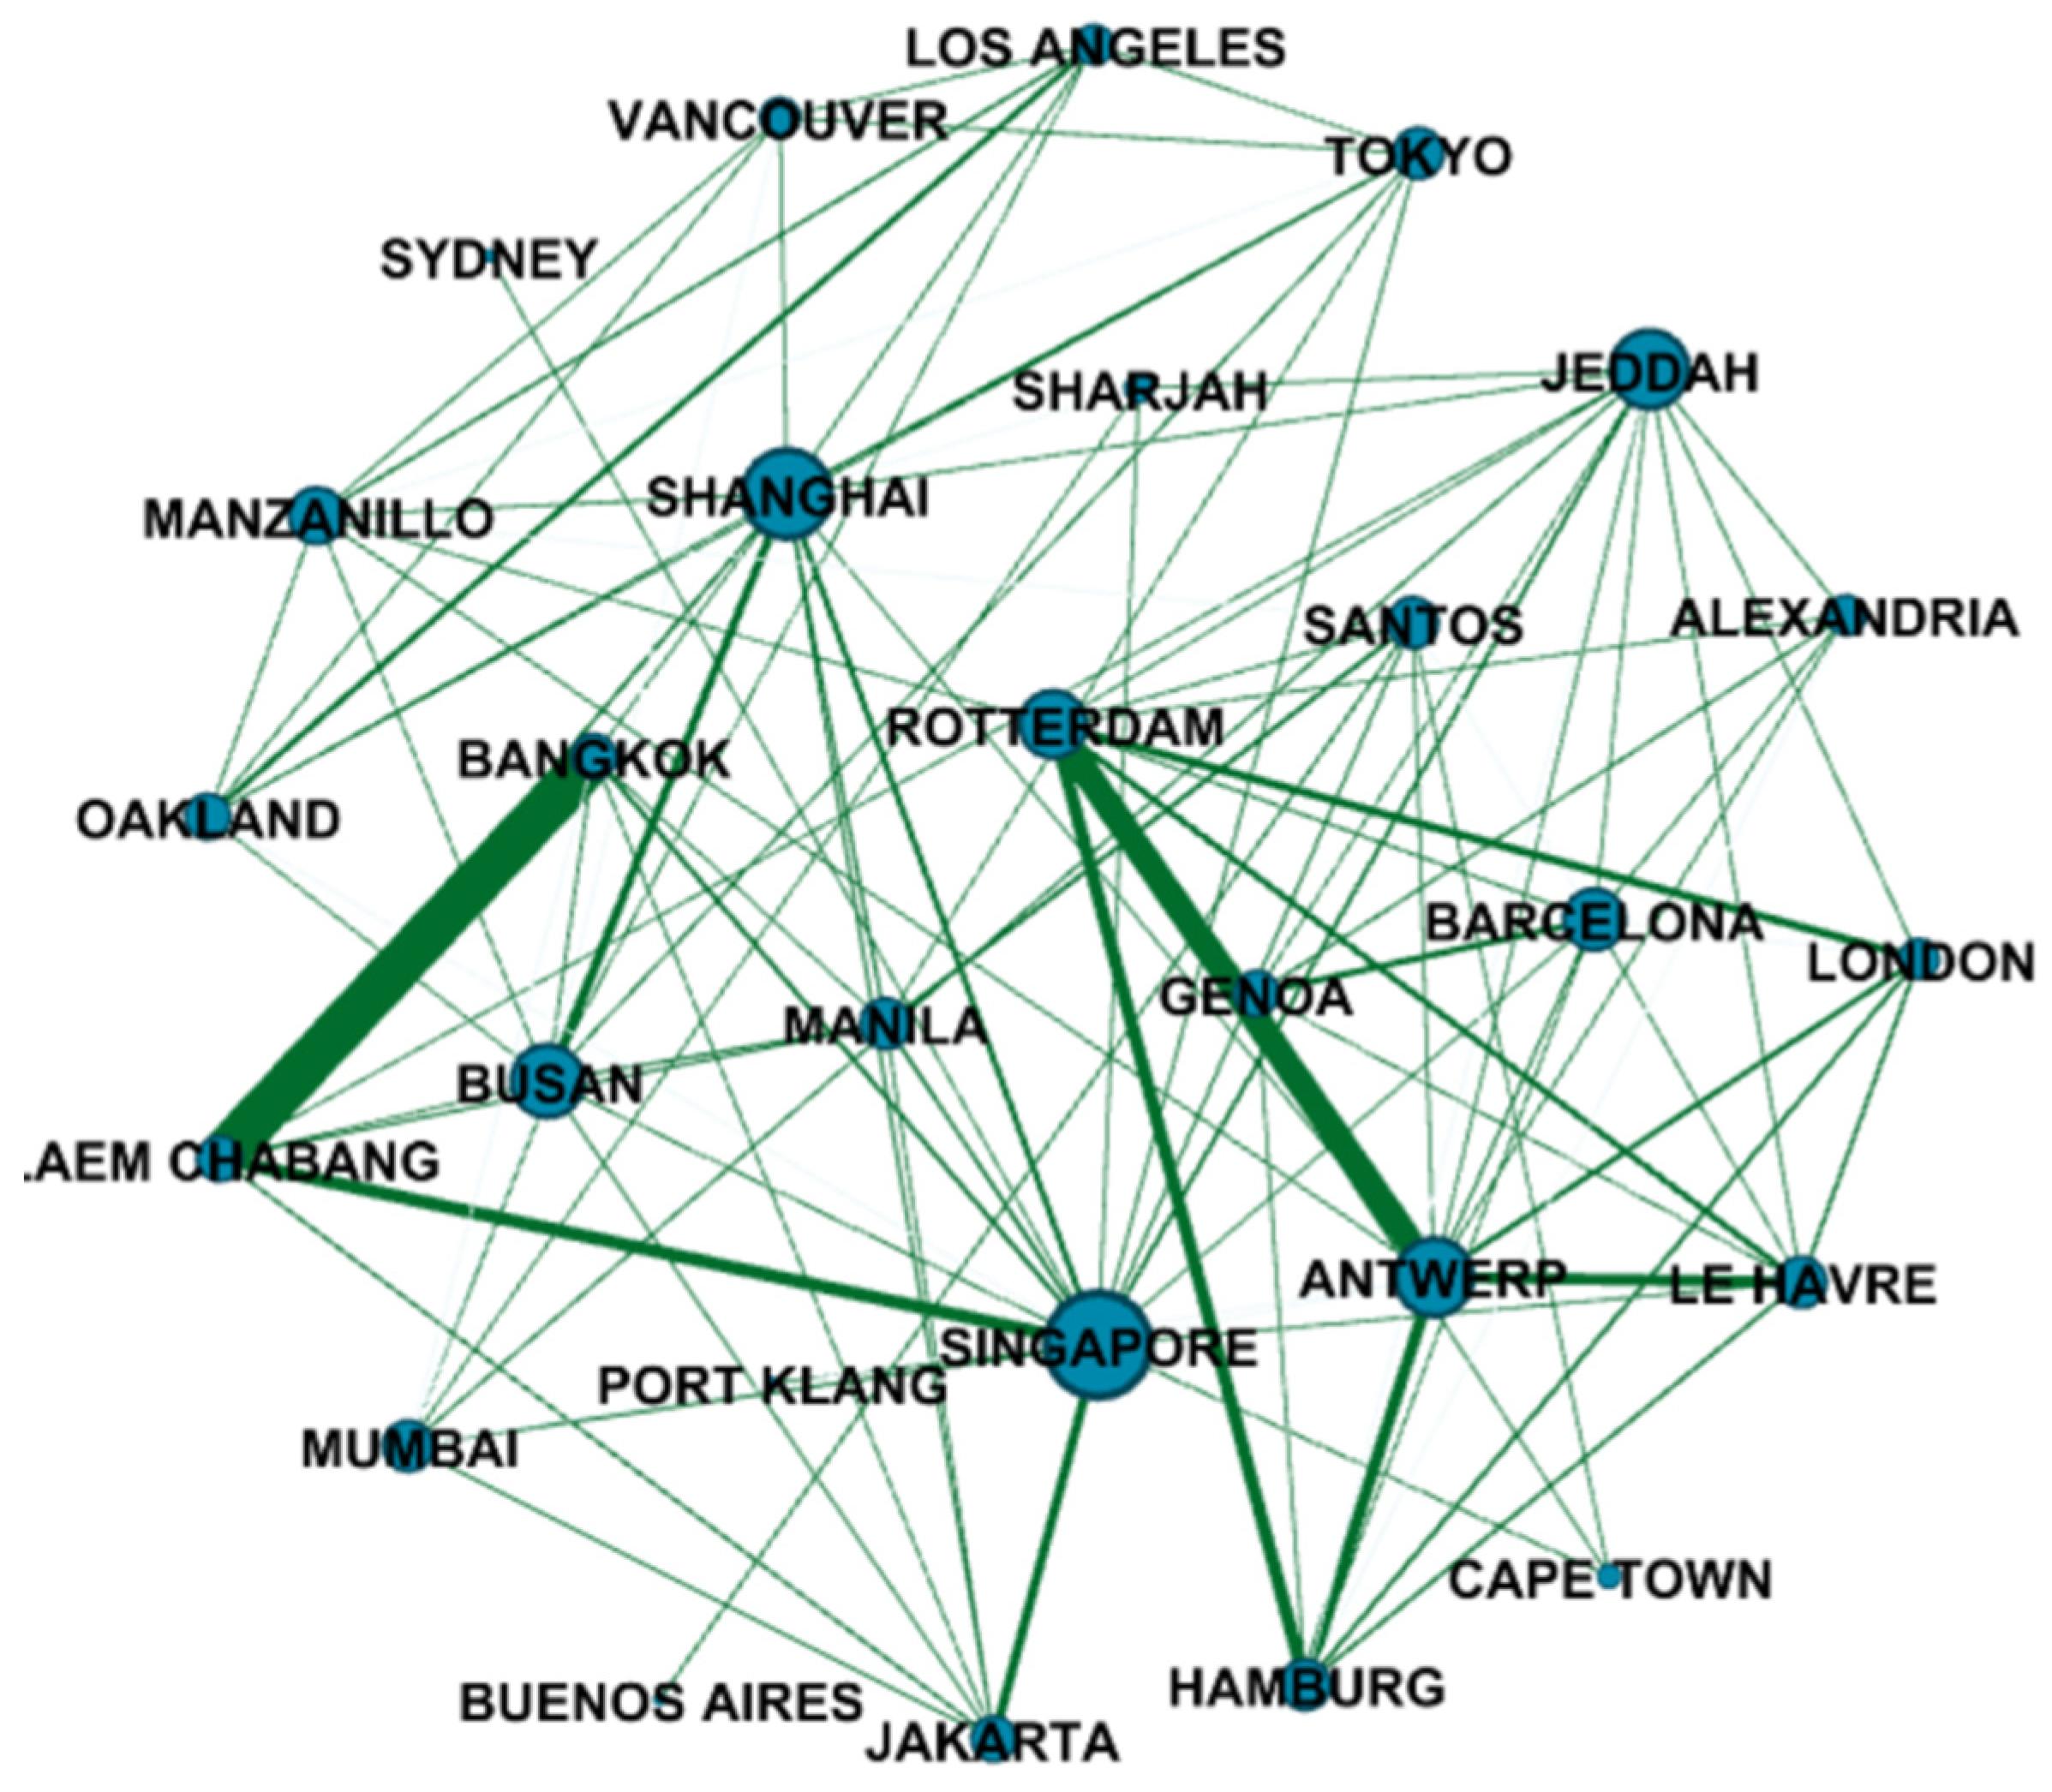
4.1. Data Processing and Network Construction

This study is based on real-time monitoring data from the Global Automatic Identification System (AIS) in 2023, sourced from commercial data provided by third-party shipping companies. A shipping network was constructed using 28 core ports in major countries worldwide, covering the majority of global foreign trade cargo throughput. Previously, these ports had experienced multiple cases of port-related infections and associated outbreaks, including major hub ports such as the Port of Singapore and the Port of Shanghai, as well as ports in developing countries like ports of Cape Town and Santos, which are distributed across all continents. It is important to note that while the data do not cover all global AIS monitoring stations, spatial distribution validation ensures the integrity of data from major shipping nodes, laying the foundation for expanding this model to the global shipping network.
In this study, a shipping network is established with ports as nodes and direct routes between ports as edges. The network comprises 28 nodes, 218 edges, 125.21 independent paths, and has a network efficiency of 0.61. Additionally, Gephi 0.9.2 software is utilized to generate a visualization of the shipping network, with node dimensions reflecting the degree of the ports, and the widths of the edges mapping the frequencies of the routes, as shown in Figure 1 below.

4.2. Experimental Design

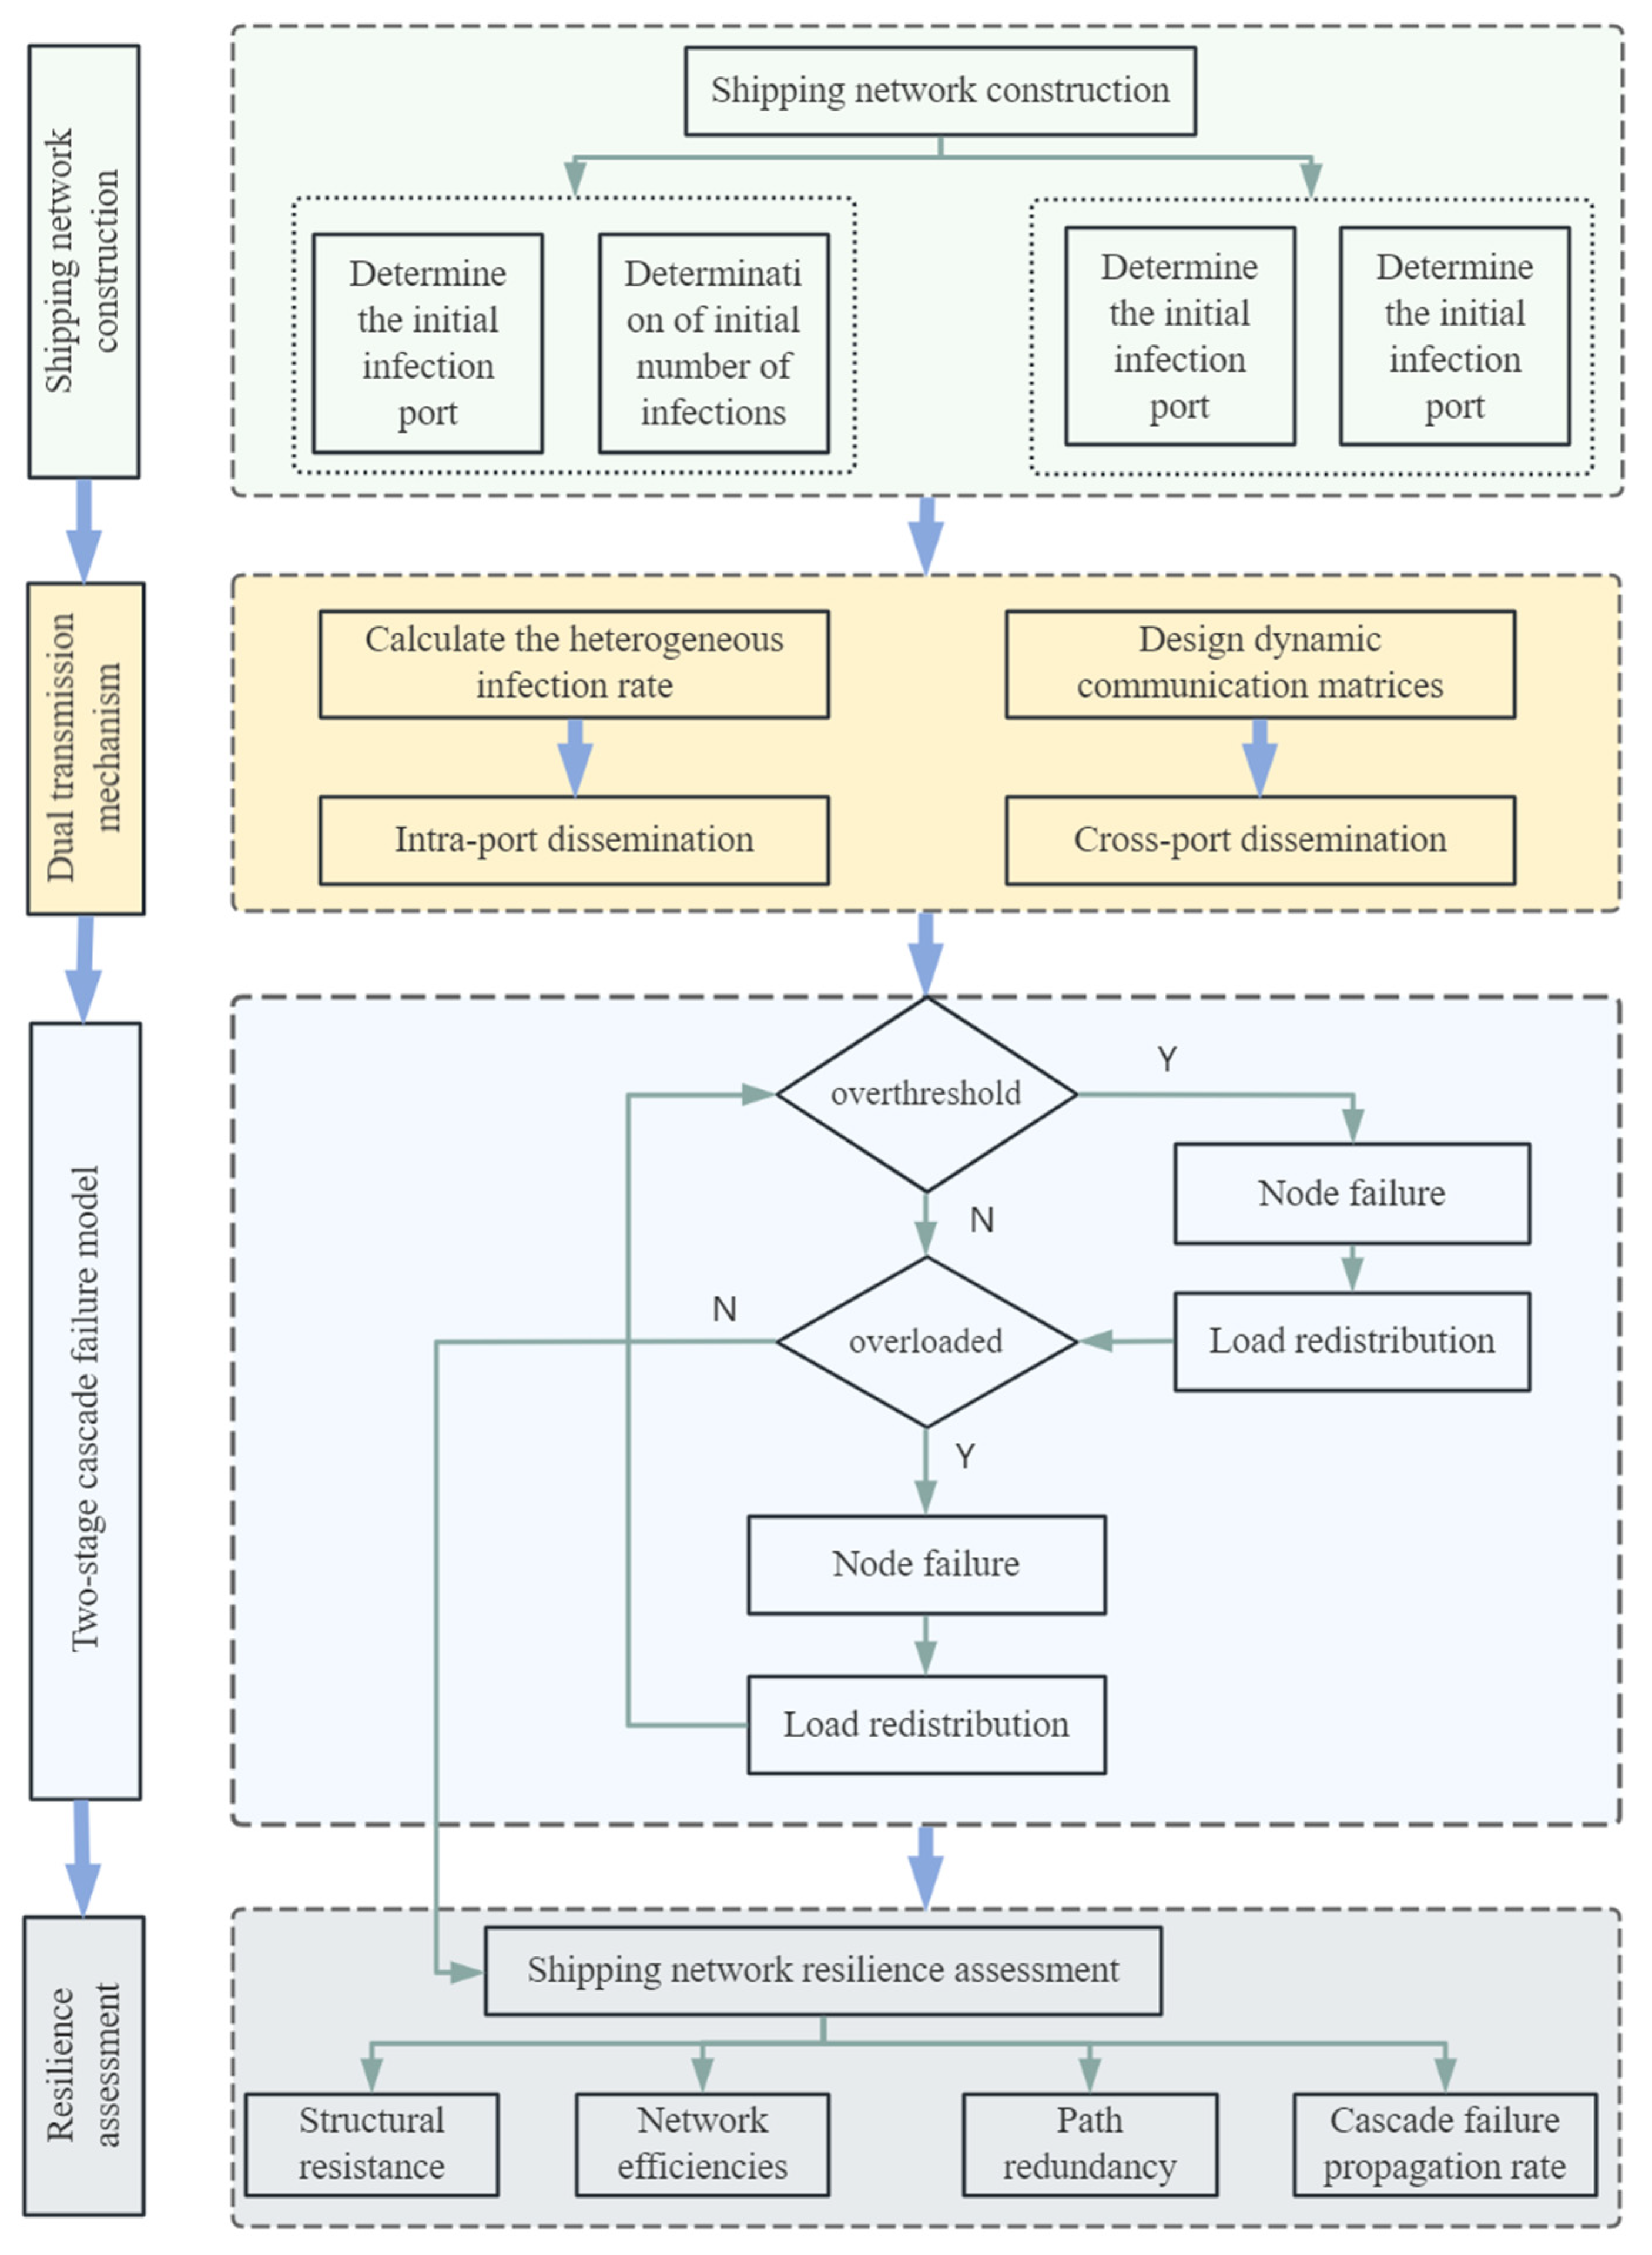
4.2.1. Simulation Experimental Flow

Based on the complex network cascade failure theory, this experiment integrates the characteristics of the shipping network with epidemic propagation mechanisms. It designs an epidemic double-propagation mechanism and a two-stage cascade failure model to evaluate the dynamic changes in network resilience under epidemic impact. The specific simulation experiment flow is presented in Figure 2.
Step 1: Construct the shipping network and initialize the network state.
Step 2: Select a specific port as the initial infection source, set the initial number of infected individuals, and designate it as the propagation starting point.
Step 3: Initialize the load based on throughput, and define the node’s operational capacity and threshold capacity using the capacity adjustment factor.
Step 4: Calculate the heterogeneous infection rate in each port where the epidemic starts to spread within the port and update the dynamic transmission matrix so that the epidemic can spread across ports through the shipping network.
Step 5: Check if the number of infected individuals in a node exceeds the threshold. If exceeded, the port fails and its load is dynamically redistributed to neighboring nodes with sufficient residual capacity and lower infection risk. If not exceeded, proceed to Step 6.
Step 6: Assess whether load-redistributed ports or ports with infection levels below the threshold are overloaded. If overloaded, continue redistributing the load according to the established rules. If not overloaded, return to Step 5.
Step 7: Update the status of all nodes in the network and compute the shipping network resilience metrics for each time step.
Step 8: Verify if all nodes in the network have failed. If not, return to Step 4 to continue the simulation; if yes, terminate the experiment.
Step 9: Conclude the cascade failure simulation under the epidemic propagation mechanism.

4.2.2. Parameter Settings

The key parameters of this study are taken and set based on the following table (Table 1):
The infection threshold is derived from the recommended standards of the International Chamber of Shipping. This threshold is determined based on industry operational experience and expert recommendations. However, in practical application, considering the differences in scale and type among ports, it may be necessary to adjust this threshold appropriately. For example, for large ports like the Port of Shanghai, with a throughput exceeding 40 million TEUs, due to higher personnel density, a lower infection threshold (e.g., λ < 0.10) may be required. Conversely, for specialized ports with lower personnel mobility and controlled access (e.g., automated or industrial terminals), a higher infection threshold (λ = 0.20–0.25) may be acceptable. However, to simplify the model, this paper uniformly adopts the intermediate value of 0.15 as the infection threshold. Sensitivity analysis is also conducted on this value in the subsequent sections, validating the reasonableness of the 0.15 threshold.

4.3. Analysis of Results

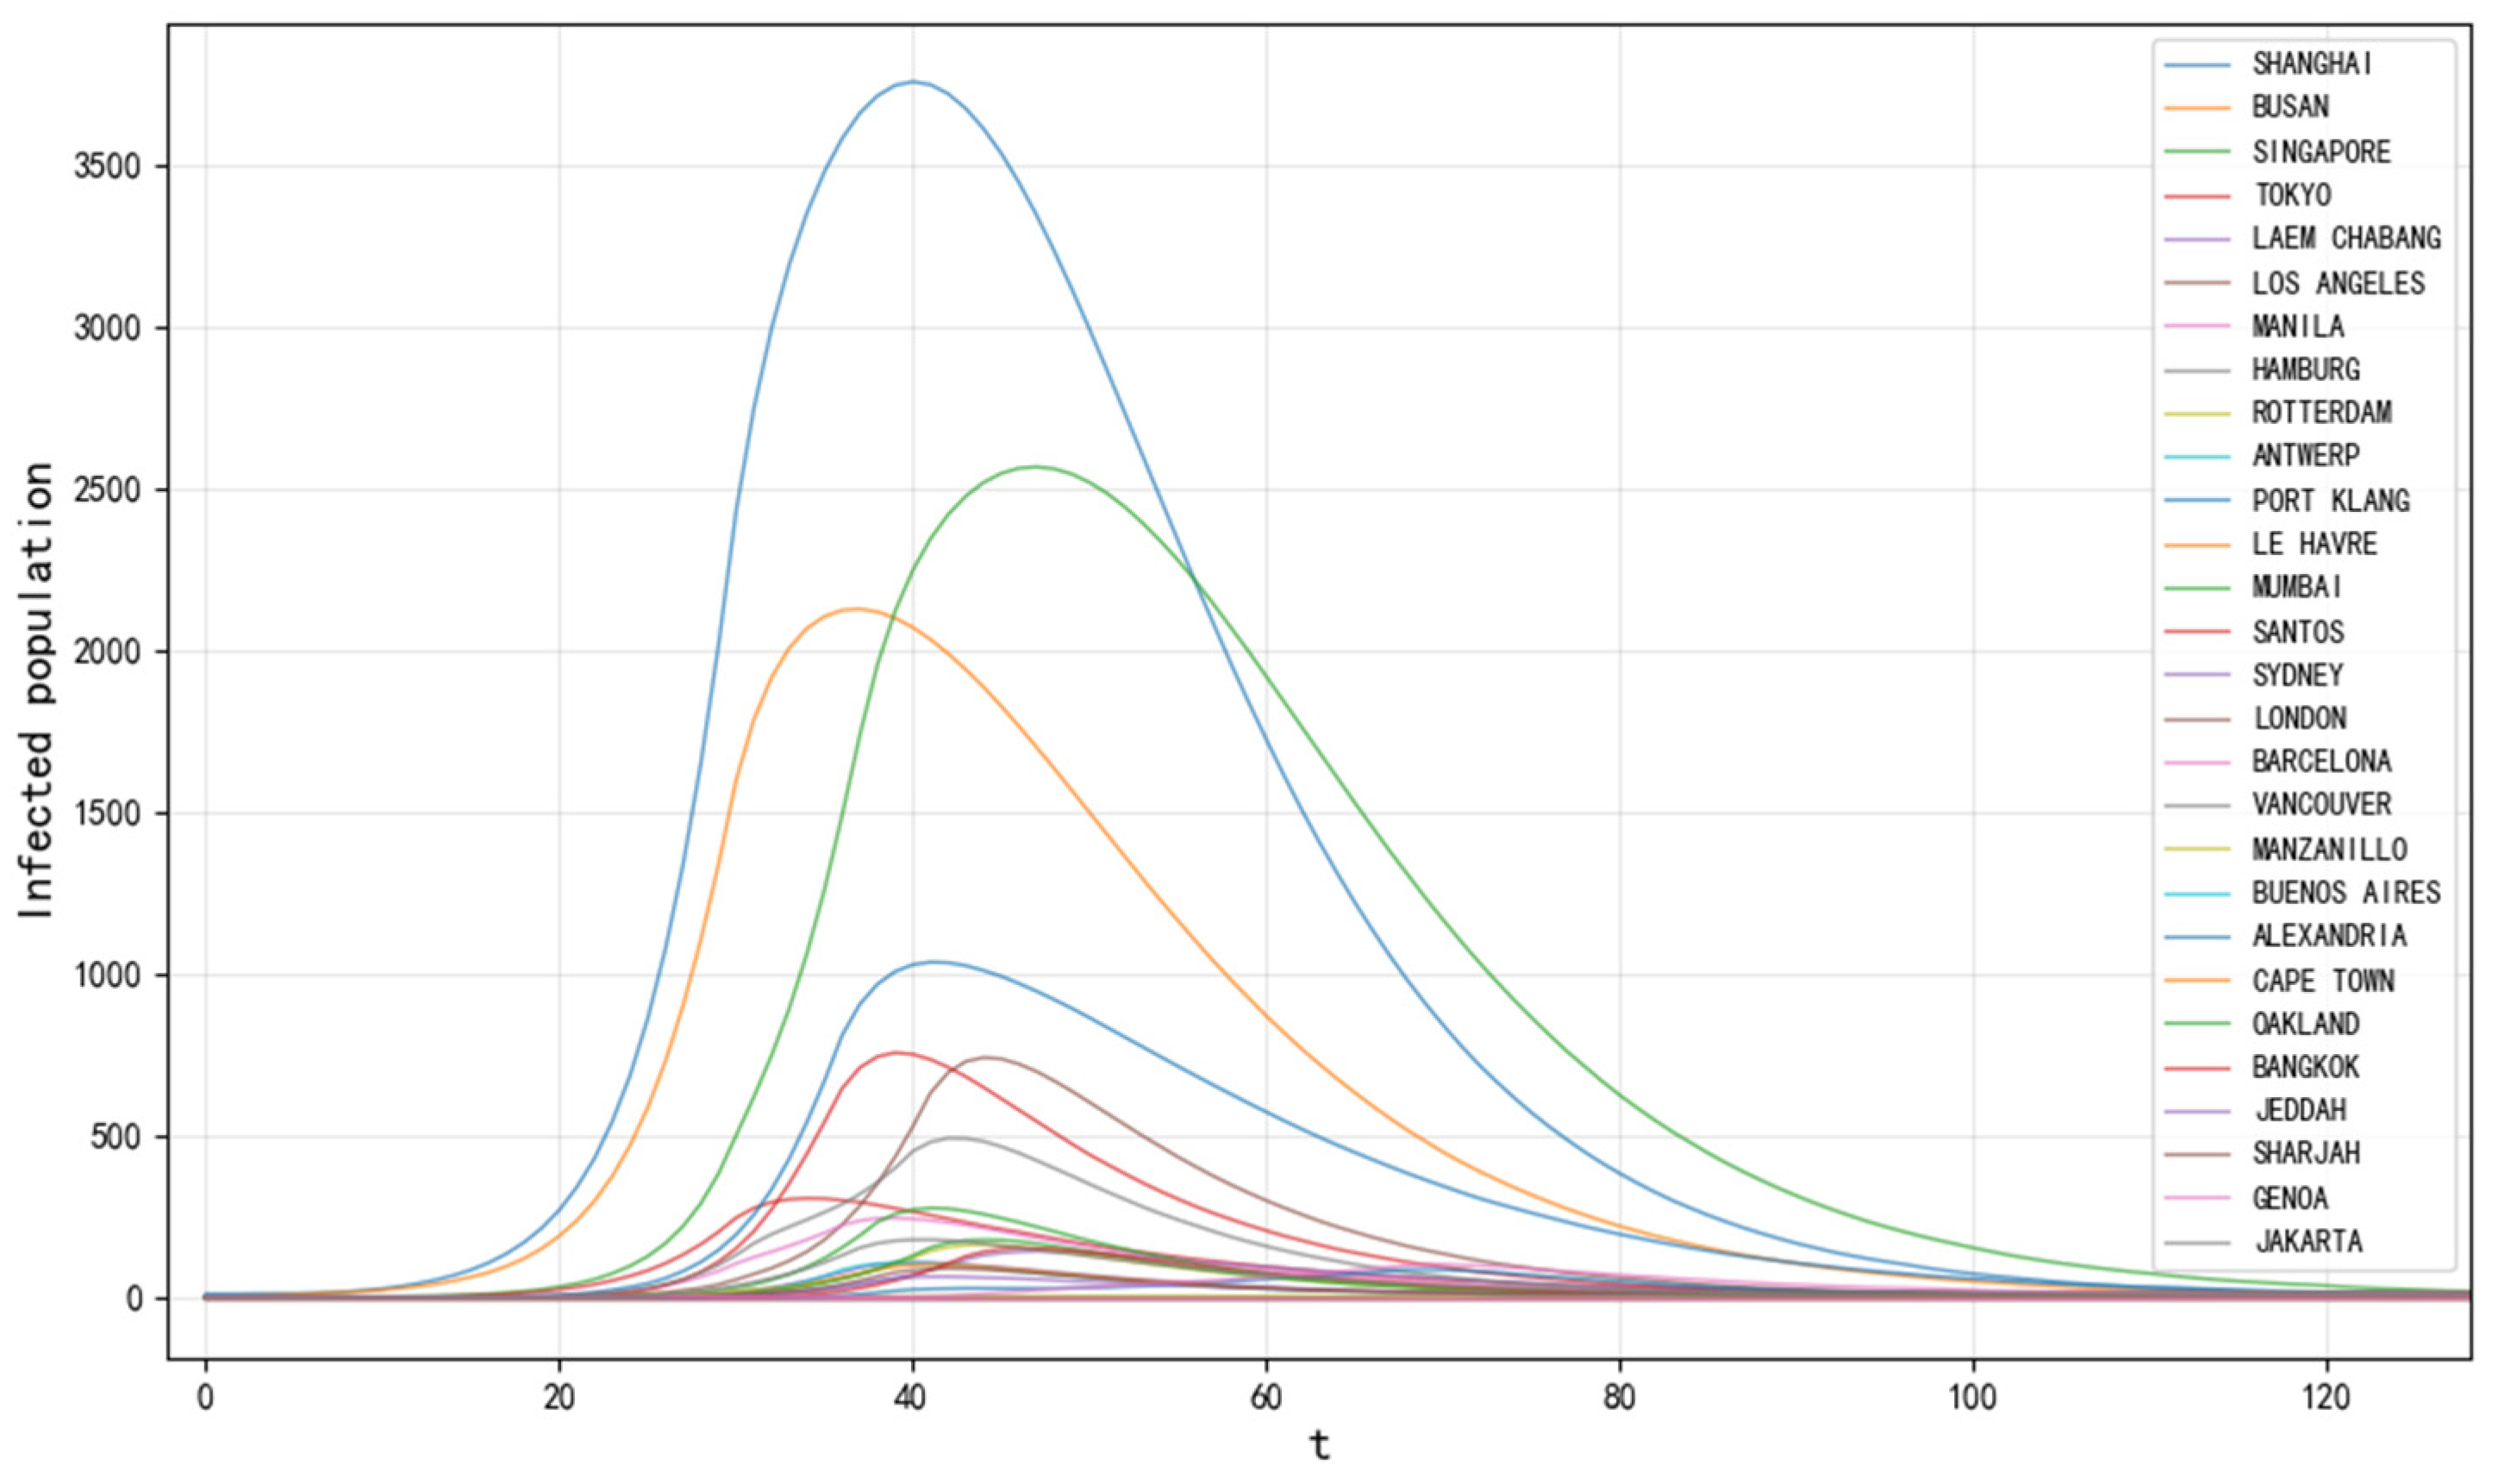
4.3.1. Trends in the Spread of the Epidemic by Port

In this experiment, the Shanghai Port is designated as the initial infection source, simulating the spread of infectious diseases both within the port and across the shipping network via maritime routes. The model developed in this study effectively captures the epidemic’s transmission dynamics across different ports, thereby providing critical insights for devising targeted epidemic prevention and control strategies.
Figure 3 illustrates the trends in the number of infected individuals across ports as determined by the improved SEIR model. The figure reveals that the epidemic spread exhibits varying dynamic characteristics across different ports. In some ports, the number of infected individuals rises rapidly to a peak, whereas in others, it remains relatively stable. This variability primarily results from the combined effects of the port’s connectivity index, epidemic prevention intensity, and the initial number of infected individuals.
This experiment also compares epidemic infections across ports under different infection rates. As shown in Table 2, the heterogeneous infection rate function significantly reduces the prediction gap. For example, in the case of the Port of Tokyo, the homogeneous model predicts a peak infection of 469 cases, whereas the heterogeneous model predicts 304 cases, reducing the gap by 35.2%. Furthermore, the heterogeneous model predicts an earlier infection peak, such as 20 days earlier, at the Port of Los Angeles. This indicates that integrating the port connectivity index with epidemic prevention intensity more accurately reflects the actual transmission risk.

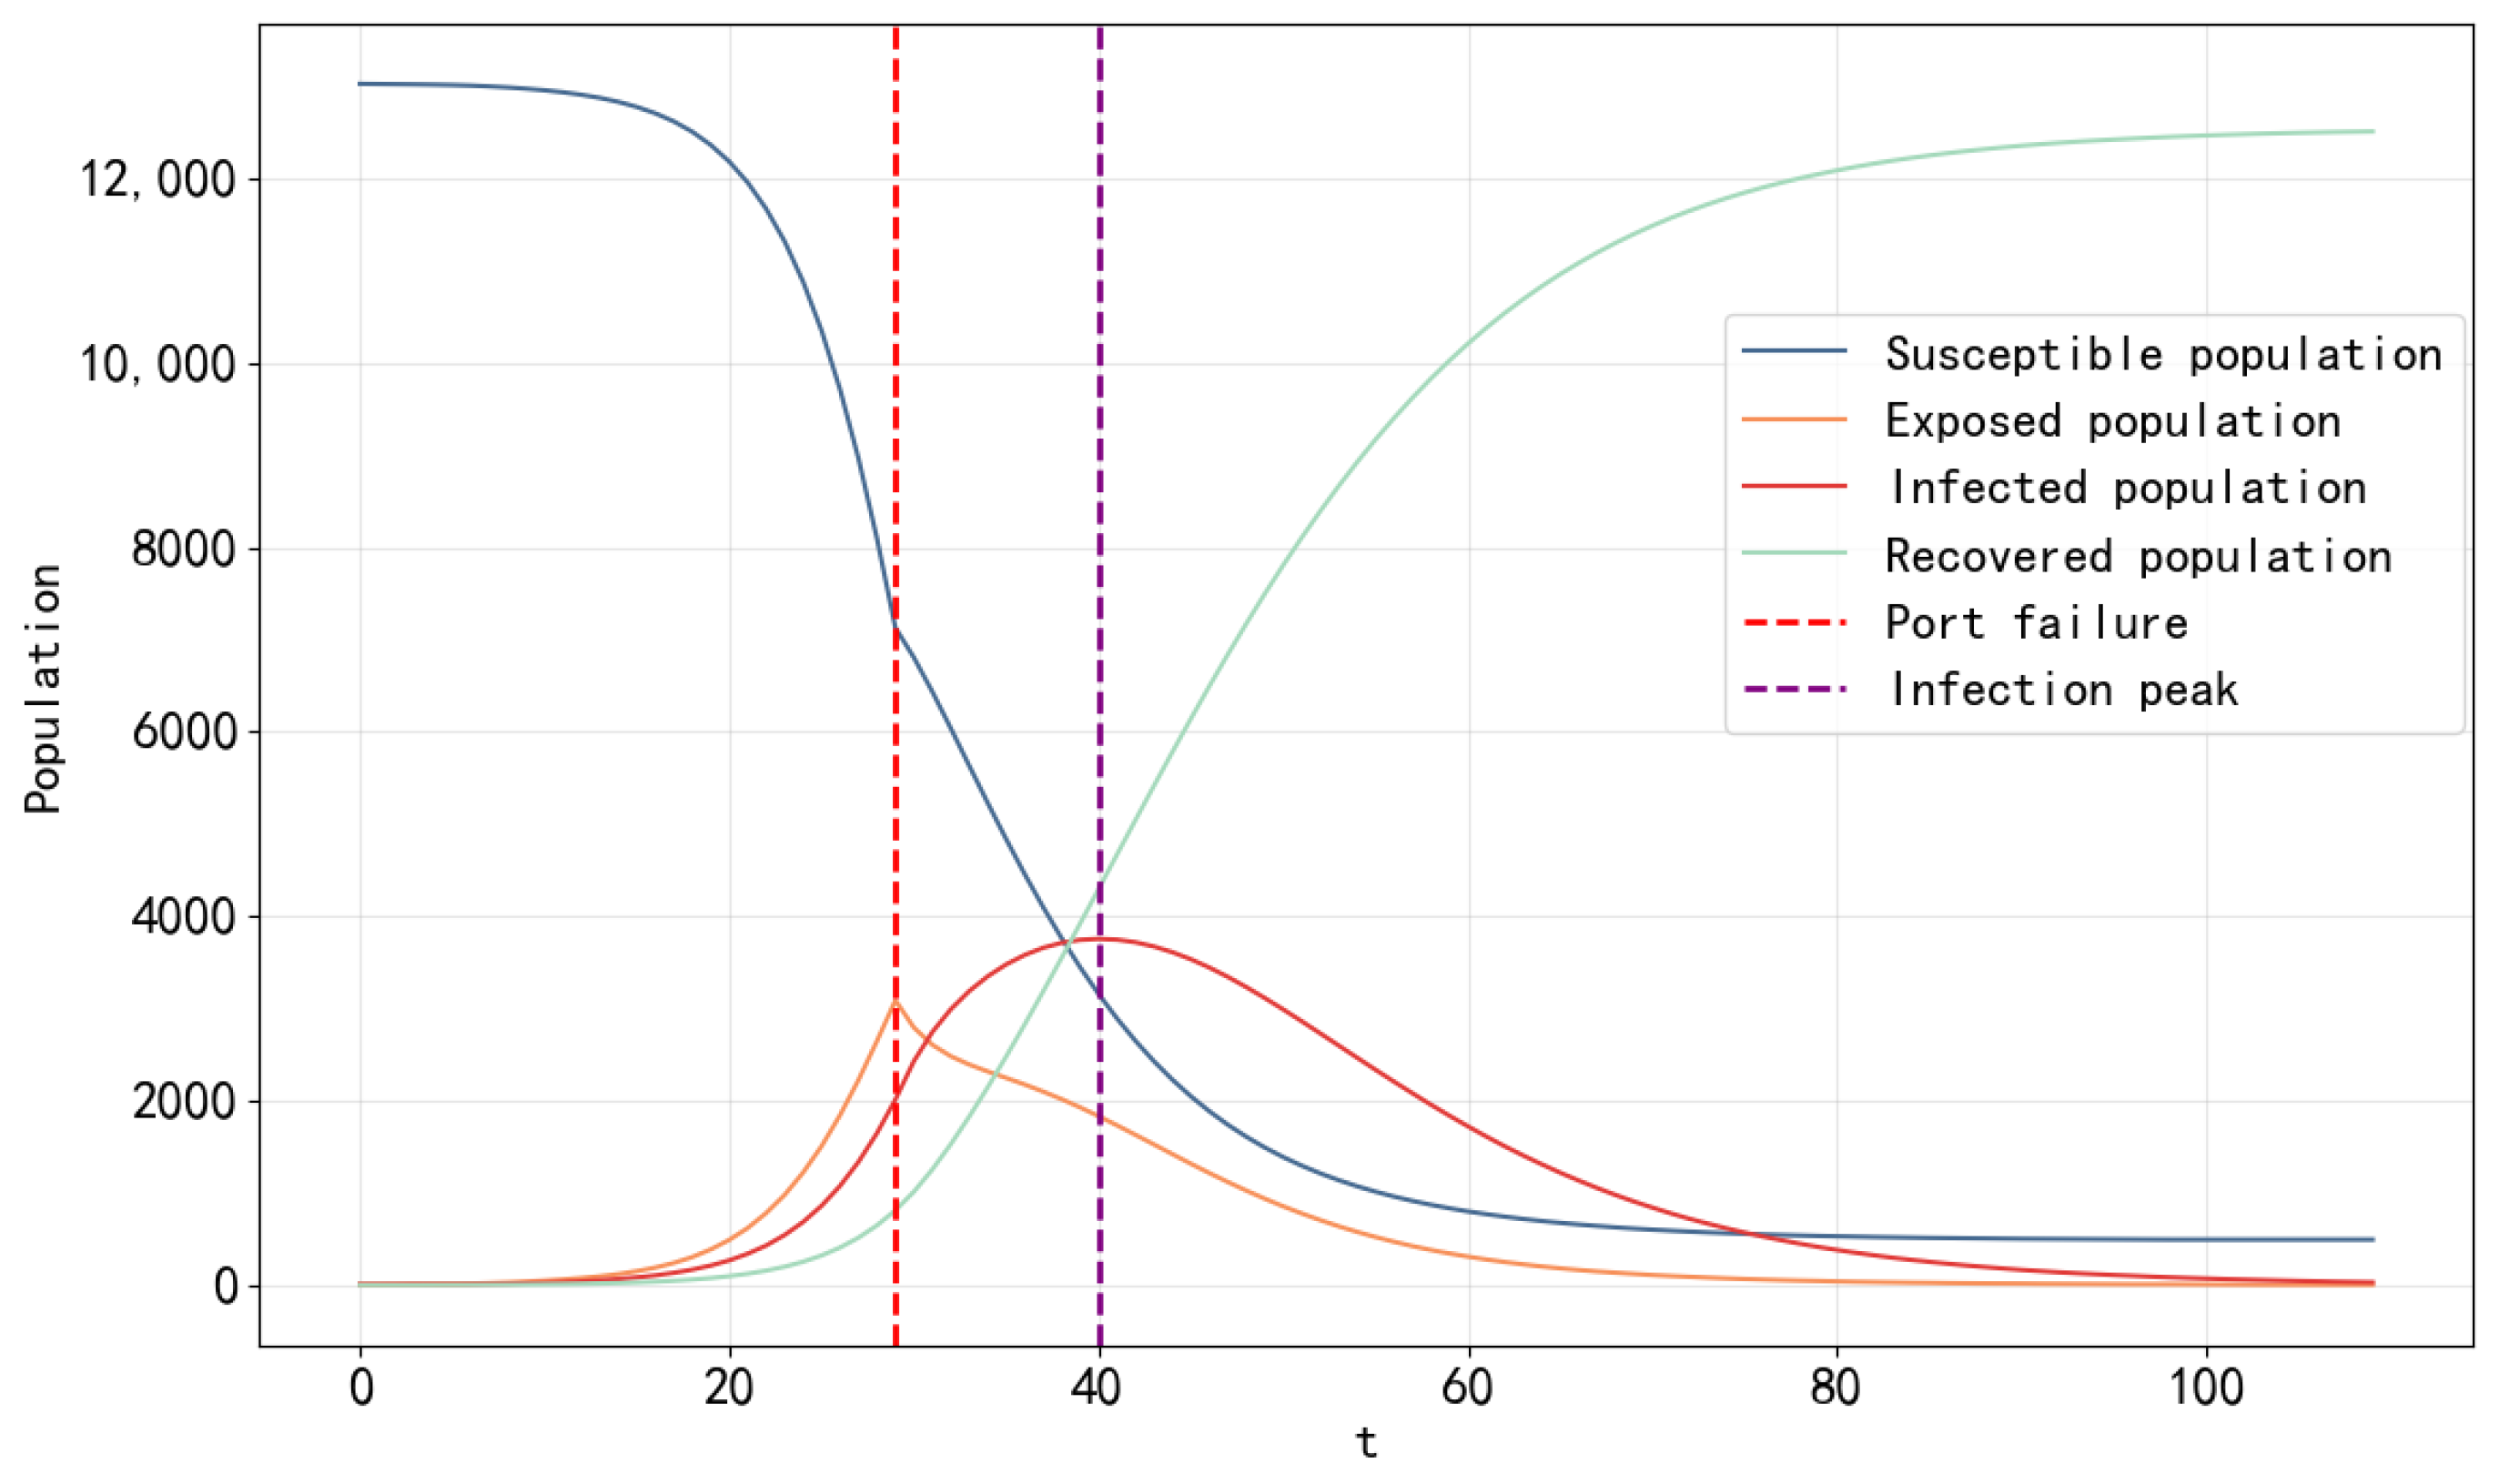
4.3.2. Dynamics of Epidemic Spread and Cascade Failure in Port of Shanghai

As a globally important shipping hub, the Port of Shanghai’s performance in the spread of the epidemic has a significant impact on the stability of the entire shipping network. By further analyzing the experiments in the previous section, the spreading process of the epidemic in Shanghai Port and the cascading failure effects on the network can be clearly seen.
As shown in Figure 4, the number of infected individuals at the Port of Shanghai exceeds the threshold on day 30, triggering node failure. The load is dynamically redistributed to neighboring ports based on residual capacity and infection risk. The number of infected individuals peaks at 3743 cases on day 40.
When node failure is triggered at the Port of Shanghai, its load redistribution is detailed in Table 3 (only ports with a distribution ratio exceeding 5% are listed). Notably, the Port of Singapore receives the highest share of redistributed load at 28.9% (578,000 tons) but does not experience secondary failures due to its high residual capacity and low infection numbers. Conversely, the Port of Vancouver only receives 7.3% of the redistributed load due to its high infection risk, which effectively suppresses cascading failures. These results demonstrate that the dynamic weight allocation strategy offers significant advantages in balancing the residual capacity and infection risk. By integrating both residual capacity and infection risk considerations, this strategy optimizes load redistribution pathways, thereby ensuring network efficiency.

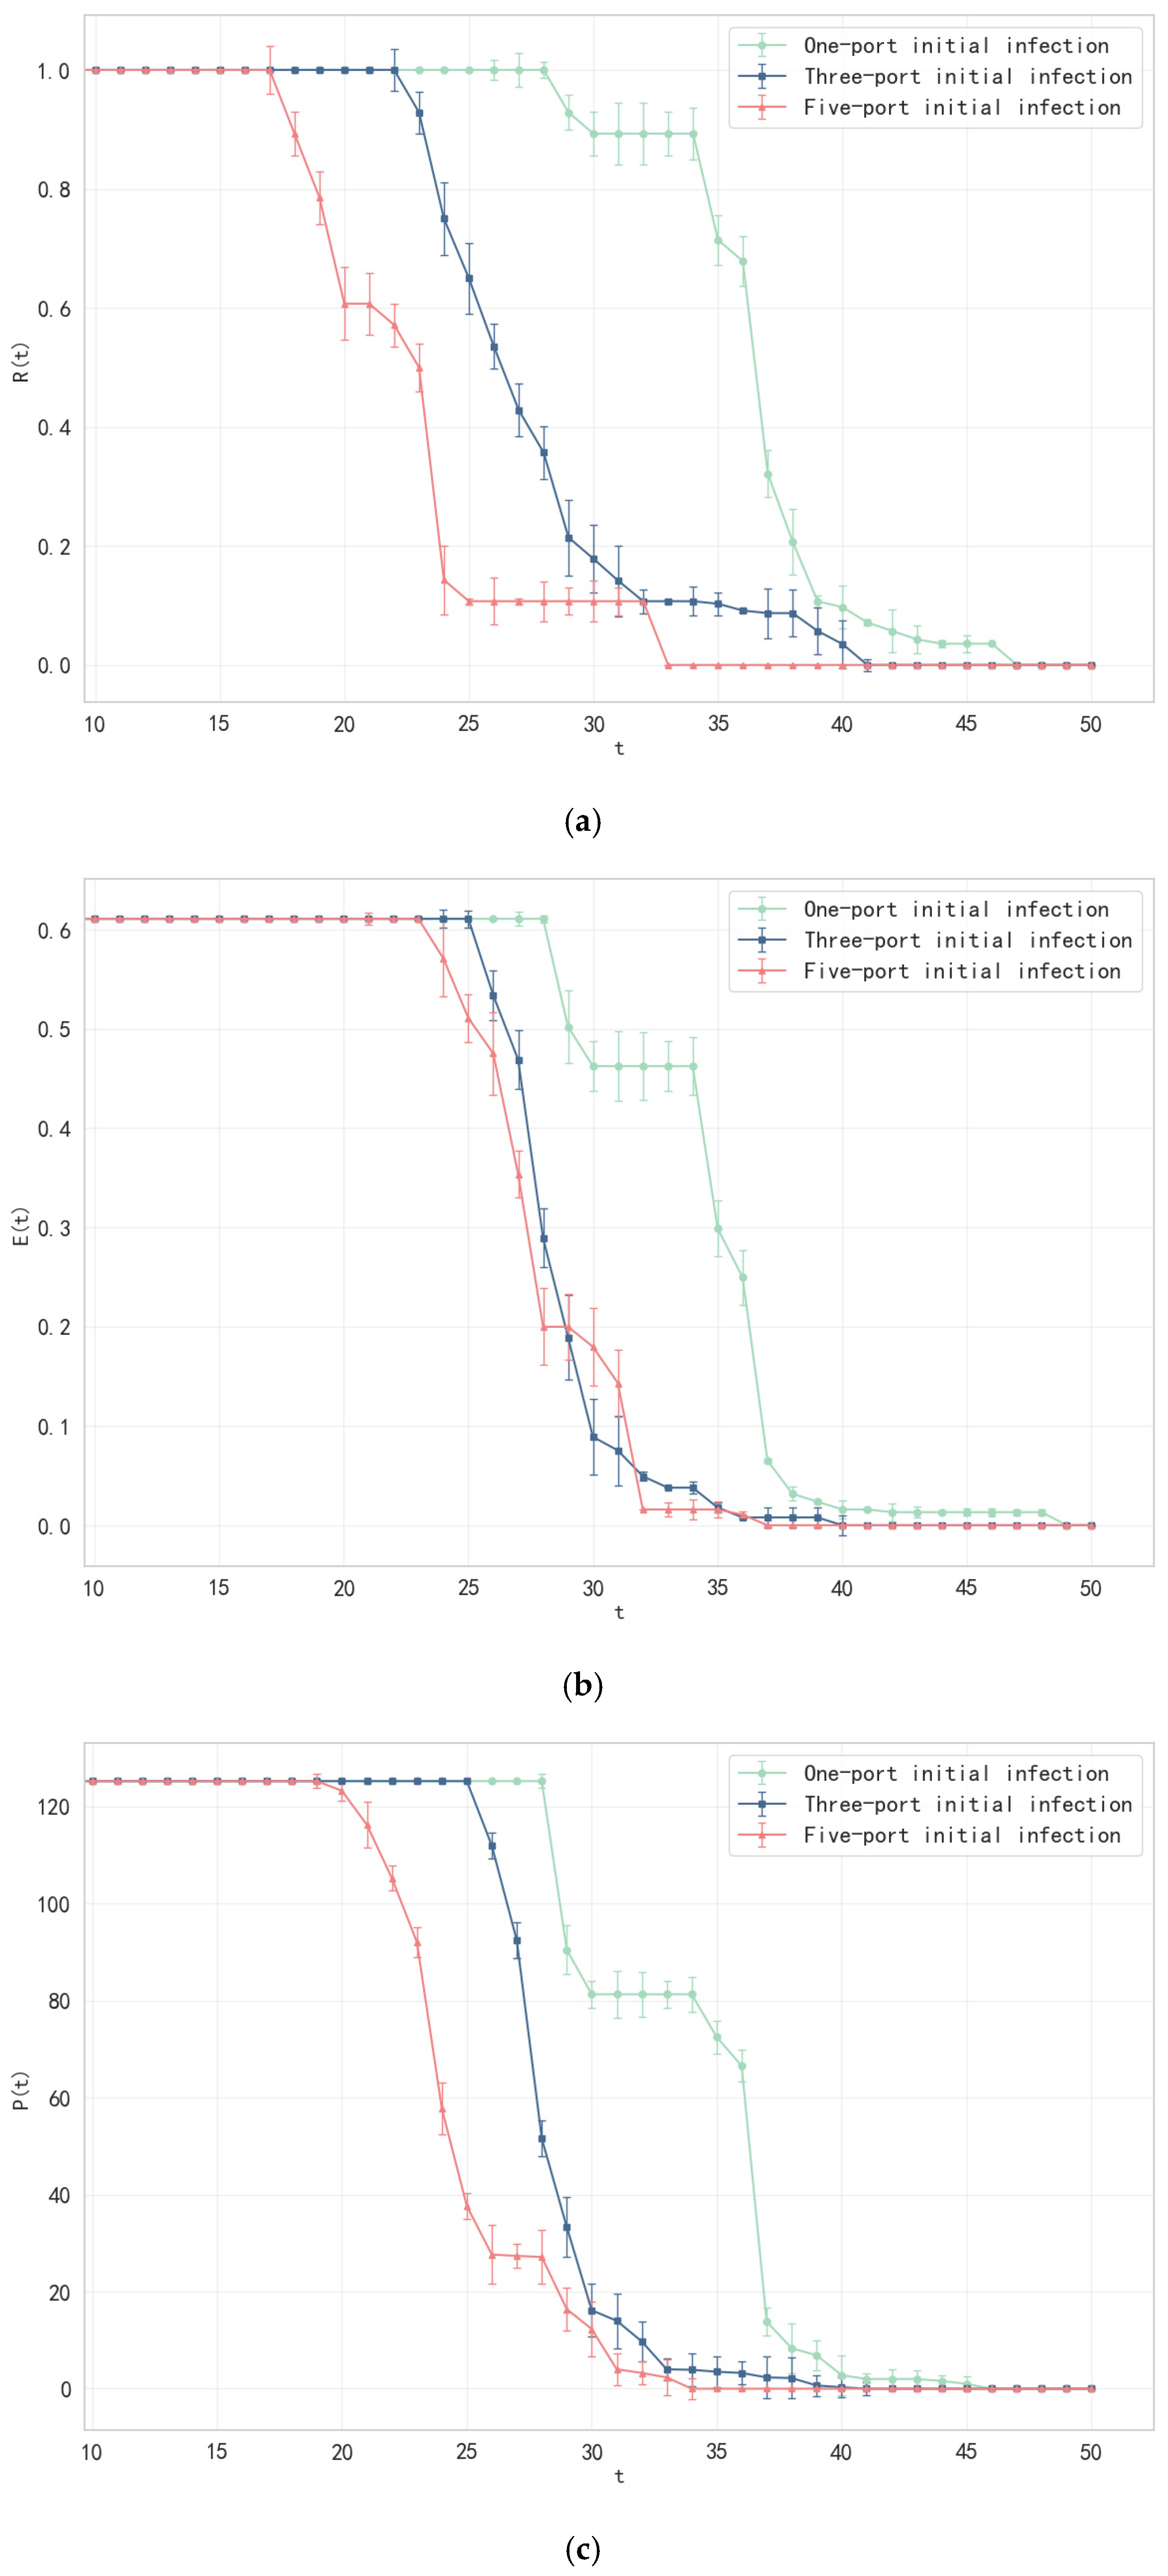
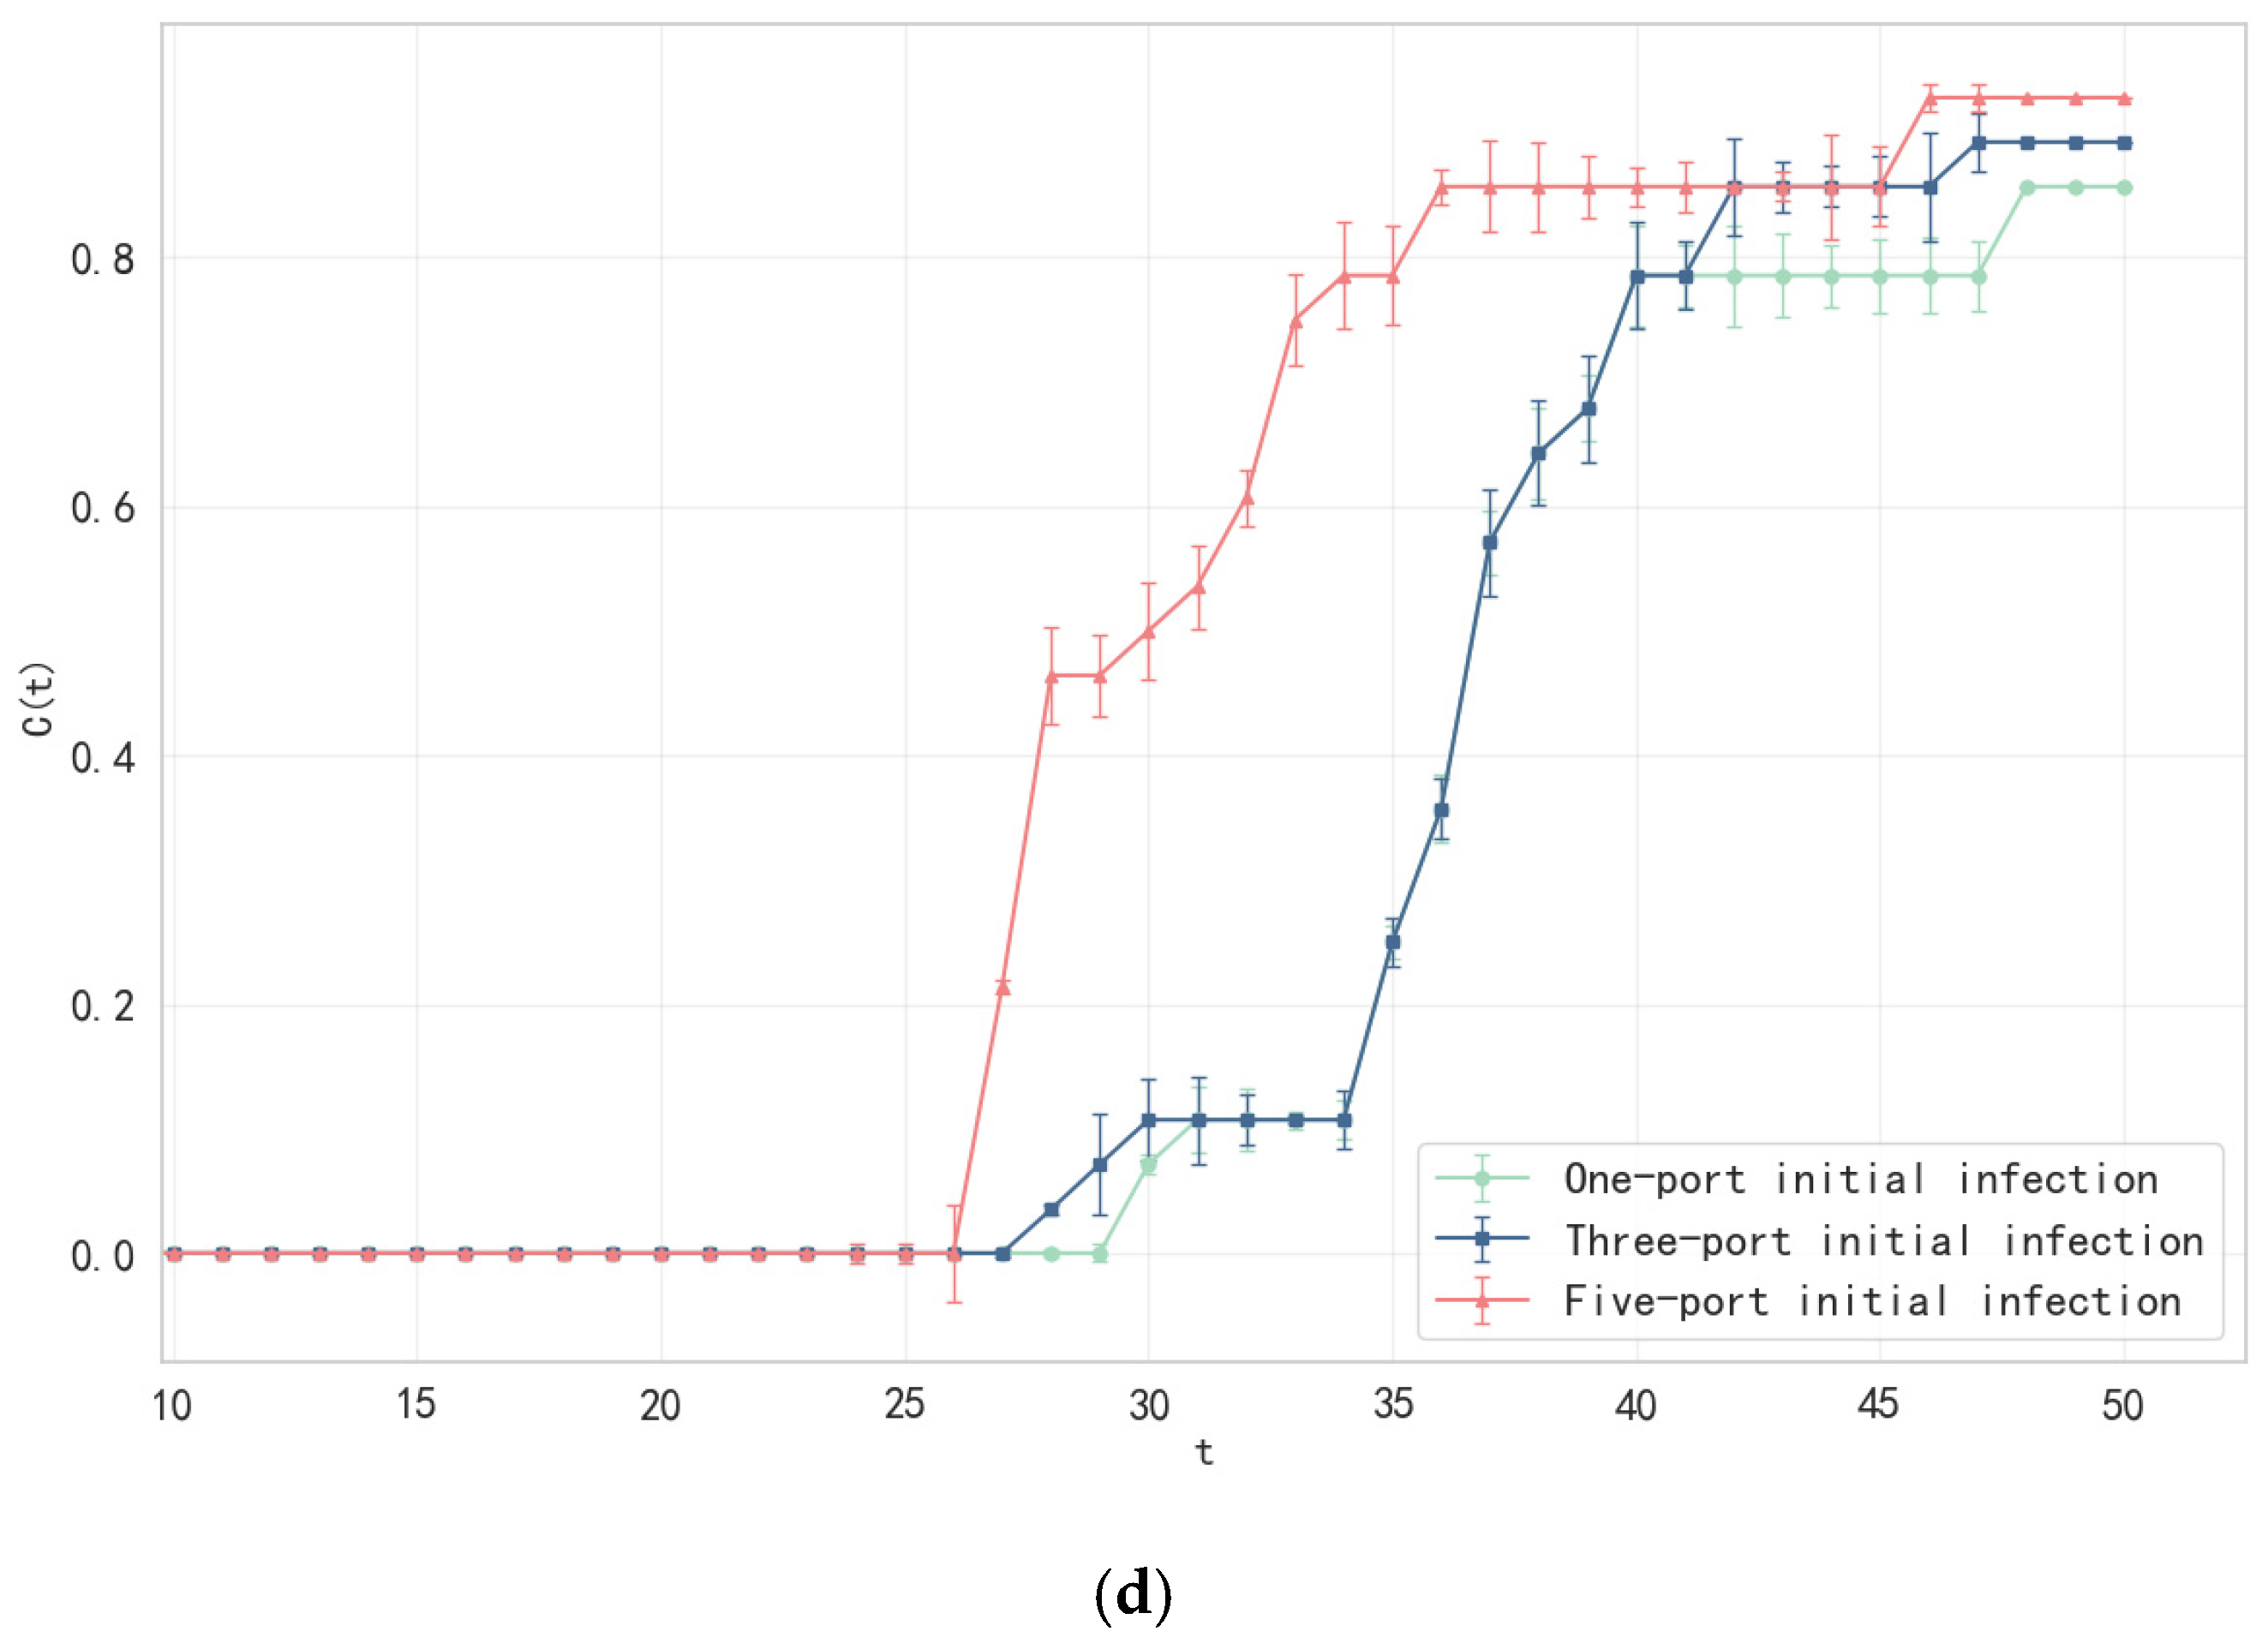
4.3.3. Analysis of Network Resilience Under the Impact of Multi-Source Outbreaks

In order to explore the impact of the number of initial infection sources on the resilience of the shipping network, this study designed three outbreak scenarios for comparative experiments: single-port outbreak—the above seaport is the initial infection source, simulating the number of infected people spreading from 10 cases and analyzing the spatial and temporal spreading paths of the cascade failure; three ports at the same time—selecting the Port of Busan (Asia), the Port of Santos (South America), and the Port of Rotterdam (Europe) as the simultaneous infection source, with the initial number of infected people as 10 cases each to explore the impact of multi-source propagation on network load redistribution; five-port simultaneous outbreak—the Port of Cape Town (Africa) and the Port of Sydney (Oceania) are added as the infection sources, and the initial number of infected people is 10 cases each to verify the resilience limit of the network under the impact of an extreme epidemic. For each scenario, the experiment was independently repeated 20 times, and the average values of each indicator were calculated. The variability of the indicator values for each scenario is displayed through vertical error bars (95% confidence interval) on the trend line.
The experimental results in Figure 5 show that increasing the number of initially infected ports significantly accelerates both the functional degradation and structural collapse of the shipping network. In the single-port outbreak scenario, network resilience indicators begin to decline from day 29. The proportion of maximally connected subgraphs, network efficiency, and the number of independent paths drop to zero on days 47, 49, and 46, respectively. Meanwhile, the cascading failure propagation rate peaks at 0.8571 on day 29. In the three-port outbreak scenario, the deterioration of each indicator accelerates significantly. The proportion of the maximum connected subgraph begins to decline from day 23 and reaches zero on day 40. Network efficiency and independent path values start to decrease from day 26 and drop to zero on day 41. The cascading failure propagation rate peaks at 0.8929. In the extreme five-port outbreak scenario, network collapse is significantly accelerated. The proportion of the maximum connected subgraph begins to decline on day 18 and reaches zero on day 35. Network efficiency and independent path values start to decrease on days 24 and 20, respectively, and drop to zero on days 38 and 34. The peak cascading failure propagation rate increases to 0.9286.
The results show that the number of initial infection sources is nonlinearly positively correlated with the network collapse speed. In the five-port outbreak scenario, the proportion of maximum connected subgraphs declines to complete collapse in just 17 days, which is 12 days shorter than in the single-port scenario. This indicates that multi-source propagation creates a synergistic effect of cascading failures through cross-infected paths. There is a threshold for redundant paths. In the three-port scenario, the proportion of independent paths drops to zero in 15 days, whereas in the five-port scenario, it takes only 14 days to completely fail. This suggests that the substitution capacity of redundant paths is rapidly exhausted when the number of infected sources exceeds the threshold. The peak rate of cascading failure propagation marginally increases with the number of infected sources, emphasizing the deeper threat posed by multi-source propagation to the entire system’s stability.
Based on this, it is necessary to establish an agile monitoring mechanism at the early stage of a multi-port outbreak (e.g., the 18-day window of the five-port scenario), extend the redundant path protection cycle by adding regional backup routes, and prioritize the restoration of high-connectivity nodes (Shanghai and Singapore ports) and dynamically adjust the weight of the load distribution in order to inhibit the crossover effects of the failure diffusion chain.

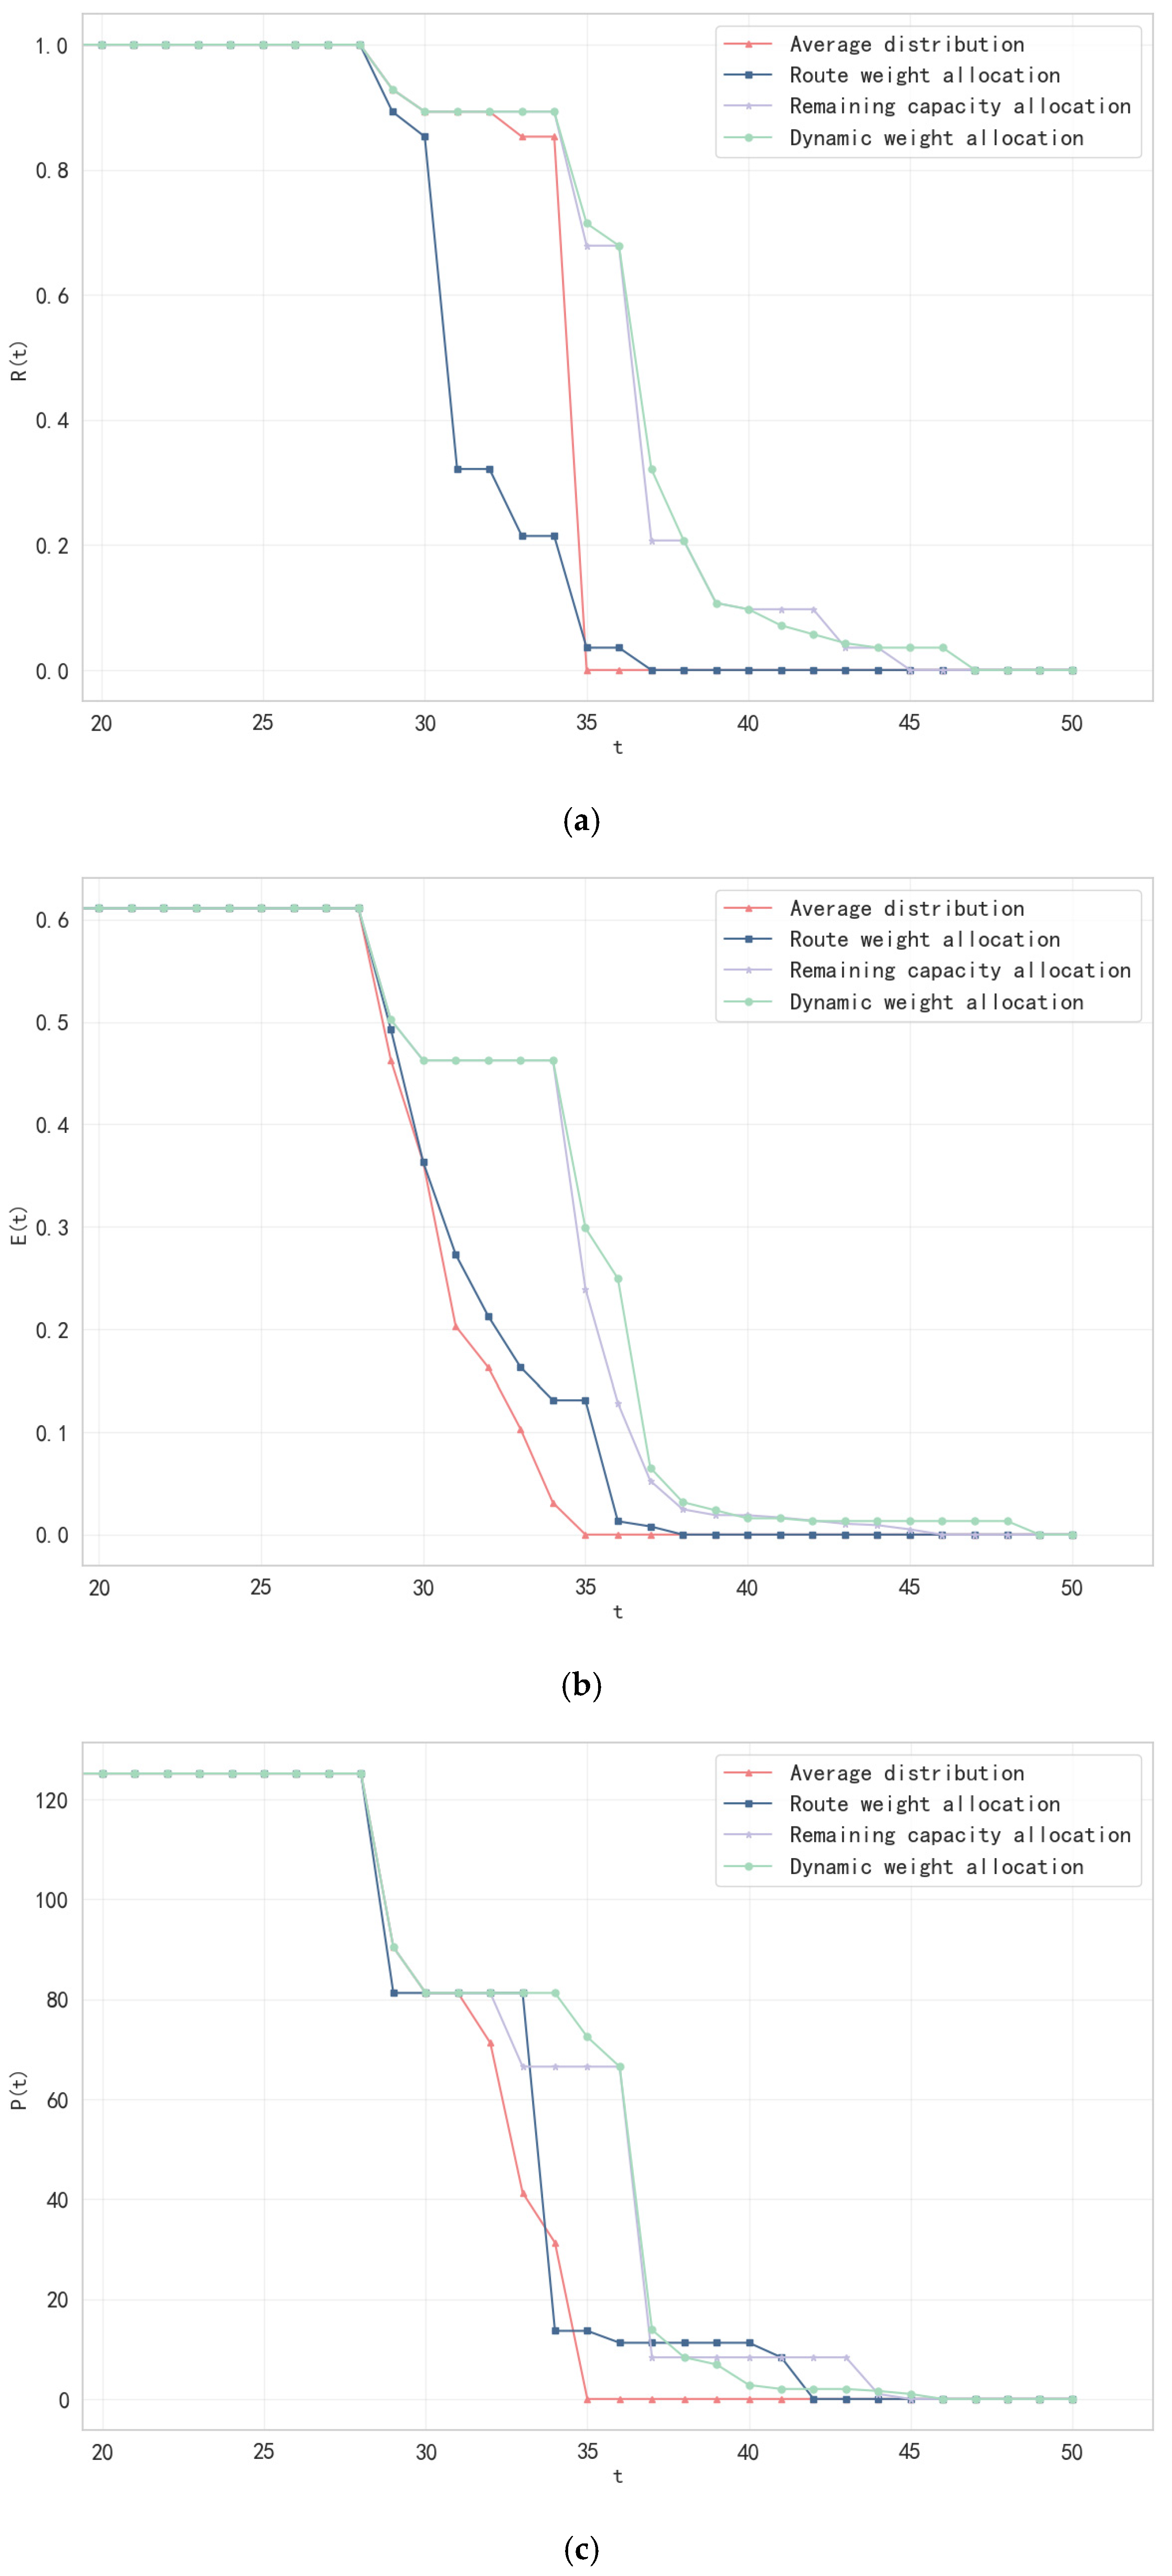
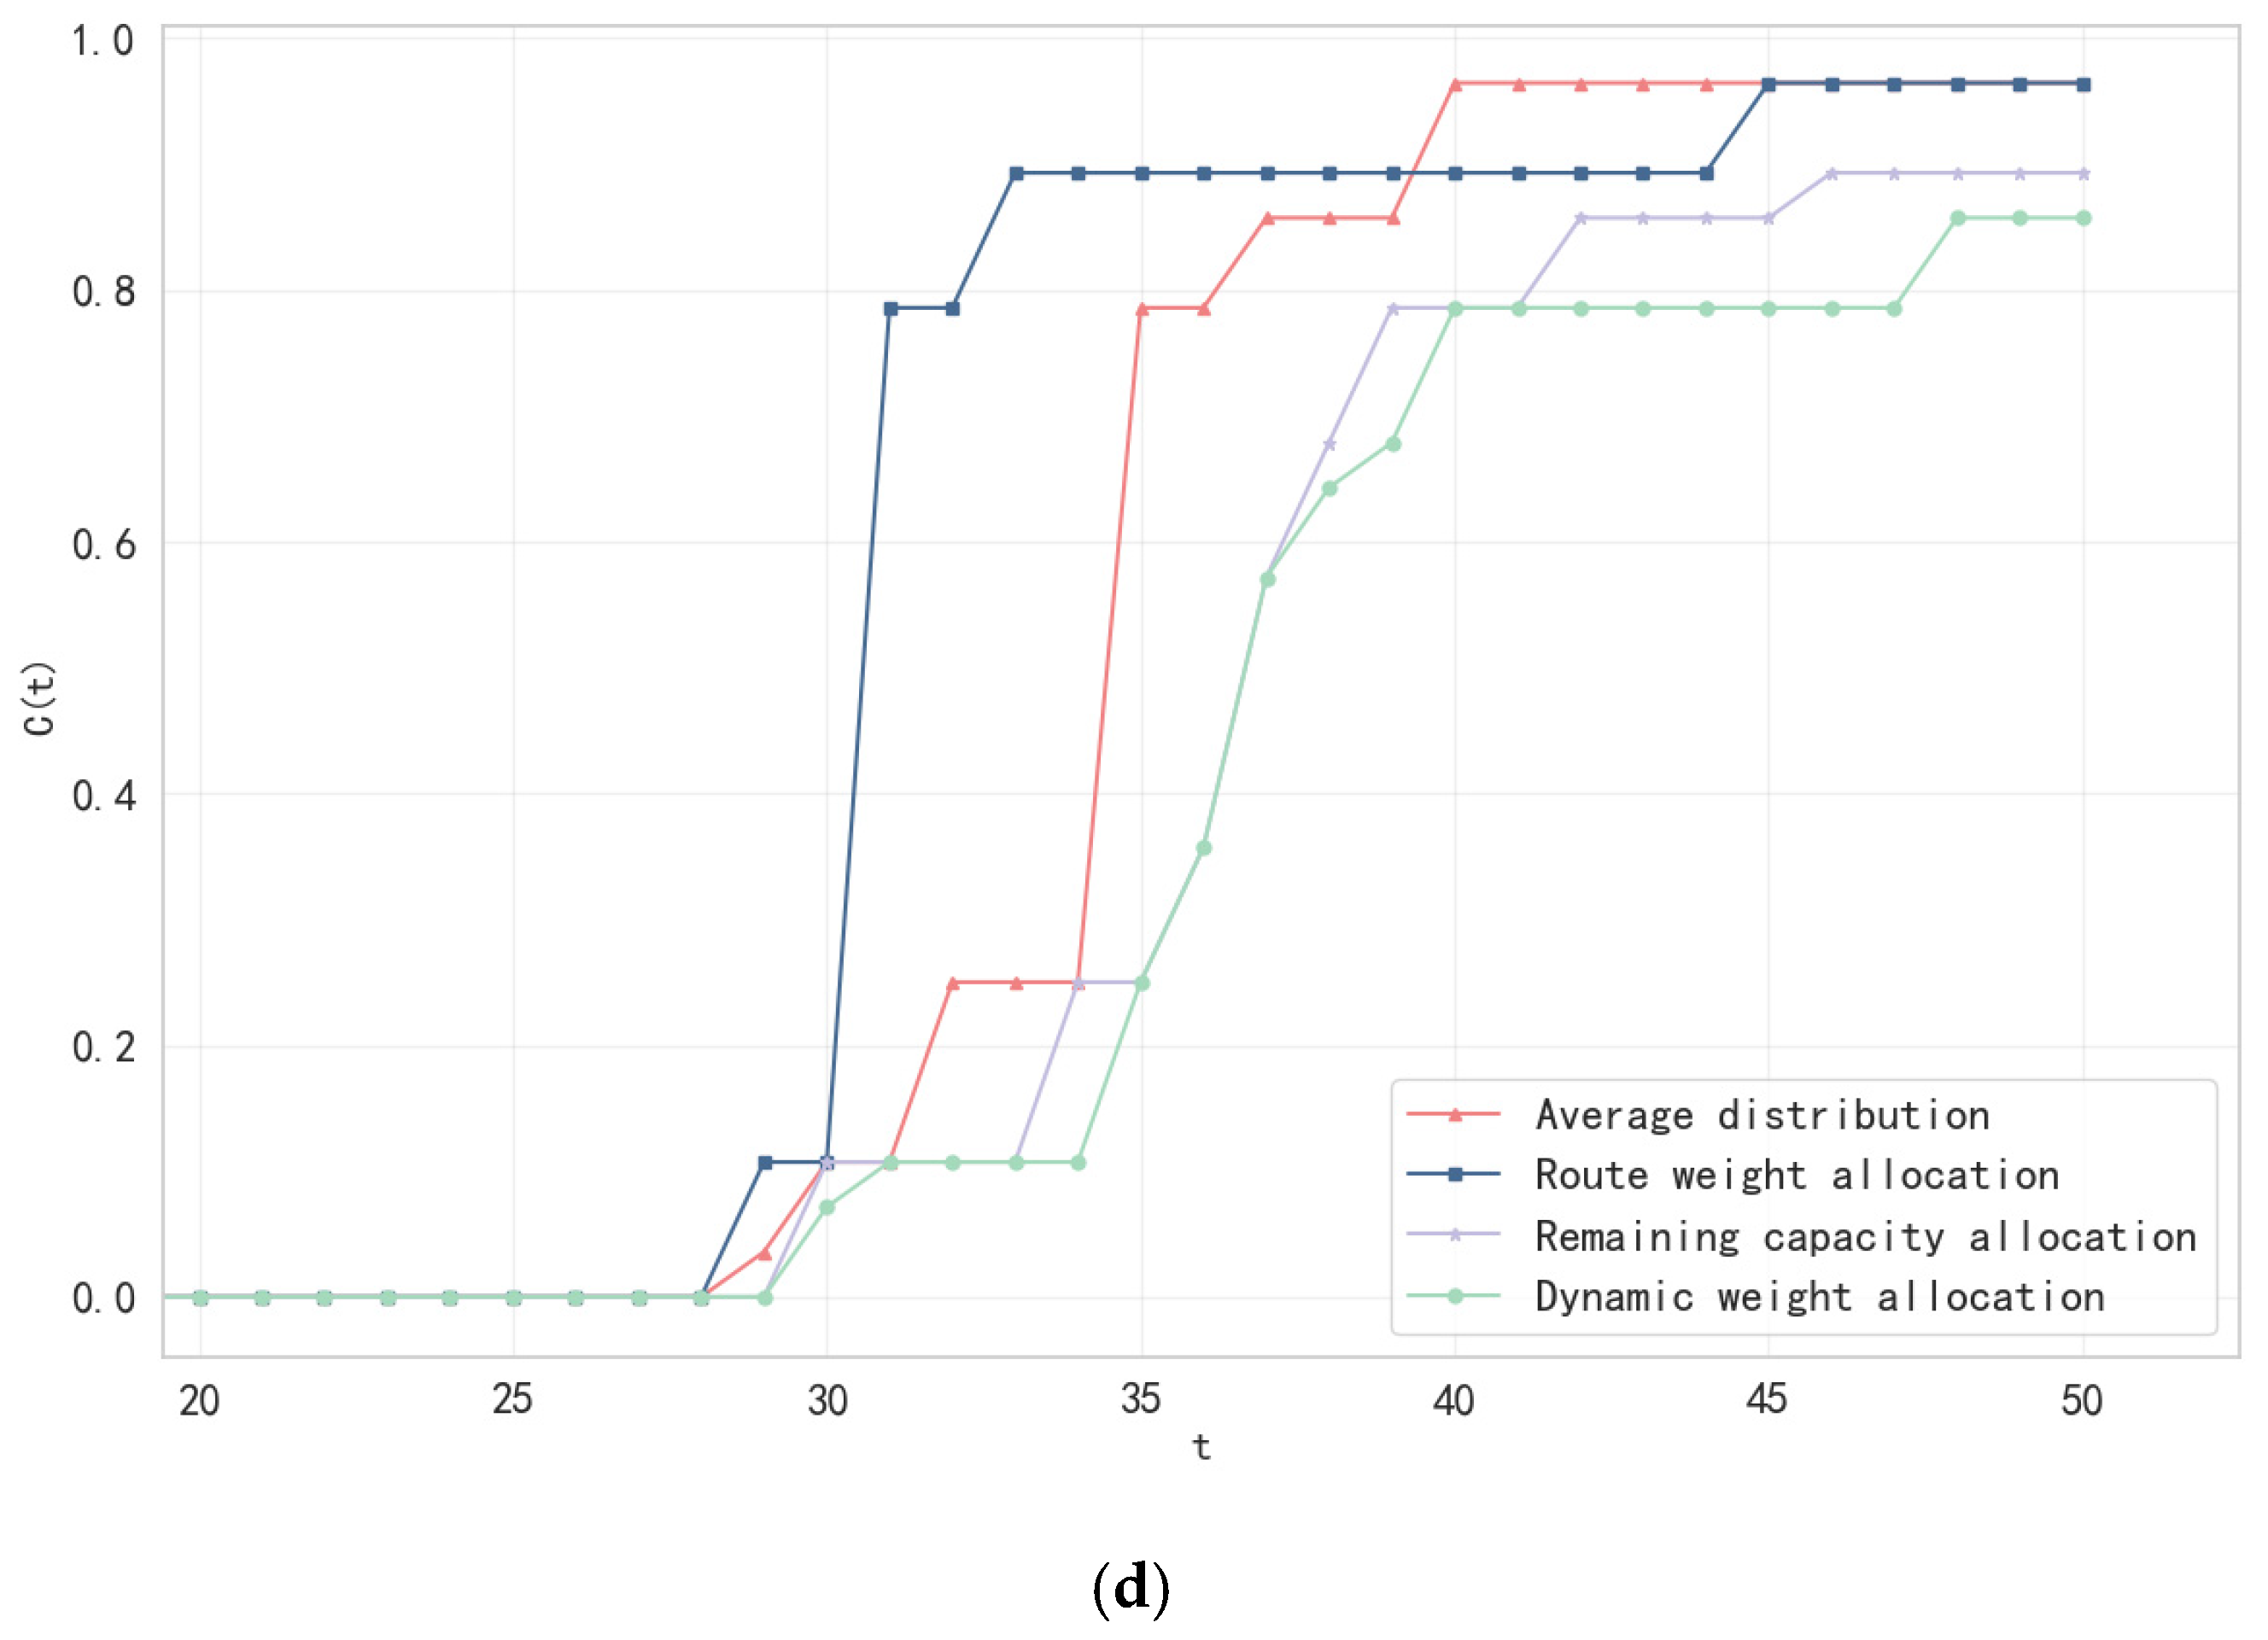
4.3.4. Multidimensional Impact of Load Redistribution Policies on Network Resilience

To further verify the effectiveness of the dynamic weight allocation strategy, this study compares four load redistribution mechanisms: average allocation (homogenized load transfer), route weight allocation (based on route frequency), residual capacity allocation (prioritized allocation to low-load nodes), and dynamic weight allocation (combining residual capacity and infection risk as described in Equation (13)). The analysis begins with the failure state of a single-port outbreak as the initial condition. Simulations compare the dynamic changes in network resilience under different load redistribution strategies.
Combined with the experimental results presented in Figure 6, the dynamic weight allocation strategy demonstrates significant advantages in multidimensional resilience indicators, and the analysis is as follows:
(1)
Structural destruction resistance optimization: The dynamic weight allocation strategy significantly slows the decay of the network’s maximum connected subgraph ratio. By day 35, the ratio remains at 0.7143 under the dynamic strategy. In contrast, the route weight and residual capacity policy allocations decrease to 0.0357 and 0.6786, respectively, and the average allocation drops to 0. This difference can be attributed to the dynamic strategy’s dual consideration of residual capacity and infection risk. It prioritizes transferring the load of failed nodes to ports with high residual capacity and low infection risk (e.g., the Port of Antwerp) while avoiding high-risk nodes (e.g., the Port of Rotterdam). Conversely, the route weight allocation strategy relies solely on the historical route frequency. This results in the Port of Singapore receiving a high traffic load even after overloading, thereby accelerating the collapse of the network structure.
(2)
Network efficiency improvement: The dynamic weight allocation strategy demonstrates optimal performance in enhancing network efficiency. On day 35, the network efficiency under this strategy reaches 0.2989, representing increases of 298.9%, 128.2%, and 19.87% over the average allocation (0), route weight allocation (0.131), and remaining capacity allocation (0.2395) strategies, respectively. This performance advantage is attributed to the strategy’s optimization of shortest paths between nodes by redirecting traffic to nodes with higher residual capacity and lower infection risks, thereby minimizing path disruptions caused by node overloading.
(3)
Enhanced protection of redundant paths: The dynamic weight allocation strategy also exhibits the slowest rate of decline in independent path values. Specifically, the decrease in independent path values begins on the 28th day and remains non-zero until the 45th day, which is 10, 3, and 1 days later than the average allocation, route weight allocation, and remaining capacity allocation strategies, respectively. This indicates that the dynamic weight allocation strategy effectively prolongs the availability of redundant paths by balancing residual capacity and infection risk considerations. For example, by retaining the Southeast Asia–Europe alternate route (18.4% of the number of independent paths), the network is provided with critical emergency routes.
(4)
Cascade failure propagation rate suppression: The dynamic weight allocation strategy significantly slows the growth of cascade failure propagation rates. By day 34, its propagation rate is 0.1071, which is 57.16% lower than both the average allocation strategy (0.25) and the residual capacity policy allocation (0.25), and 88% lower compared to the route weighting strategy (0.8929). This can be attributed to the dual constraints of the dynamic weighting formula: first, it prevents excessive load concentration on a small number of nodes; second, it restricts load reception at high-risk nodes.
The dynamic weight allocation strategy achieves global optimization of load allocation paths by integrating the real-time states of residual capacity and infection risk, with a consideration of the balance between network efficiency and destruction resistance. Experimental results demonstrate that this strategy significantly outperforms traditional methods across several key metrics. Specifically, it exhibits a 68.2% reduction in the decay rate of the maximum connected subgraph ratio, a 128.2% enhancement in peak network efficiency, a 10-day extension of the redundant path availability period, and an 88% decrease in the peak cascade failure propagation rate. In practical implementations, particularly during epidemics, it is advisable to prioritize the dynamic weight allocation strategy. Furthermore, dynamically adjusting the parameters can effectively mitigate the crossover effect of multi-source propagation.

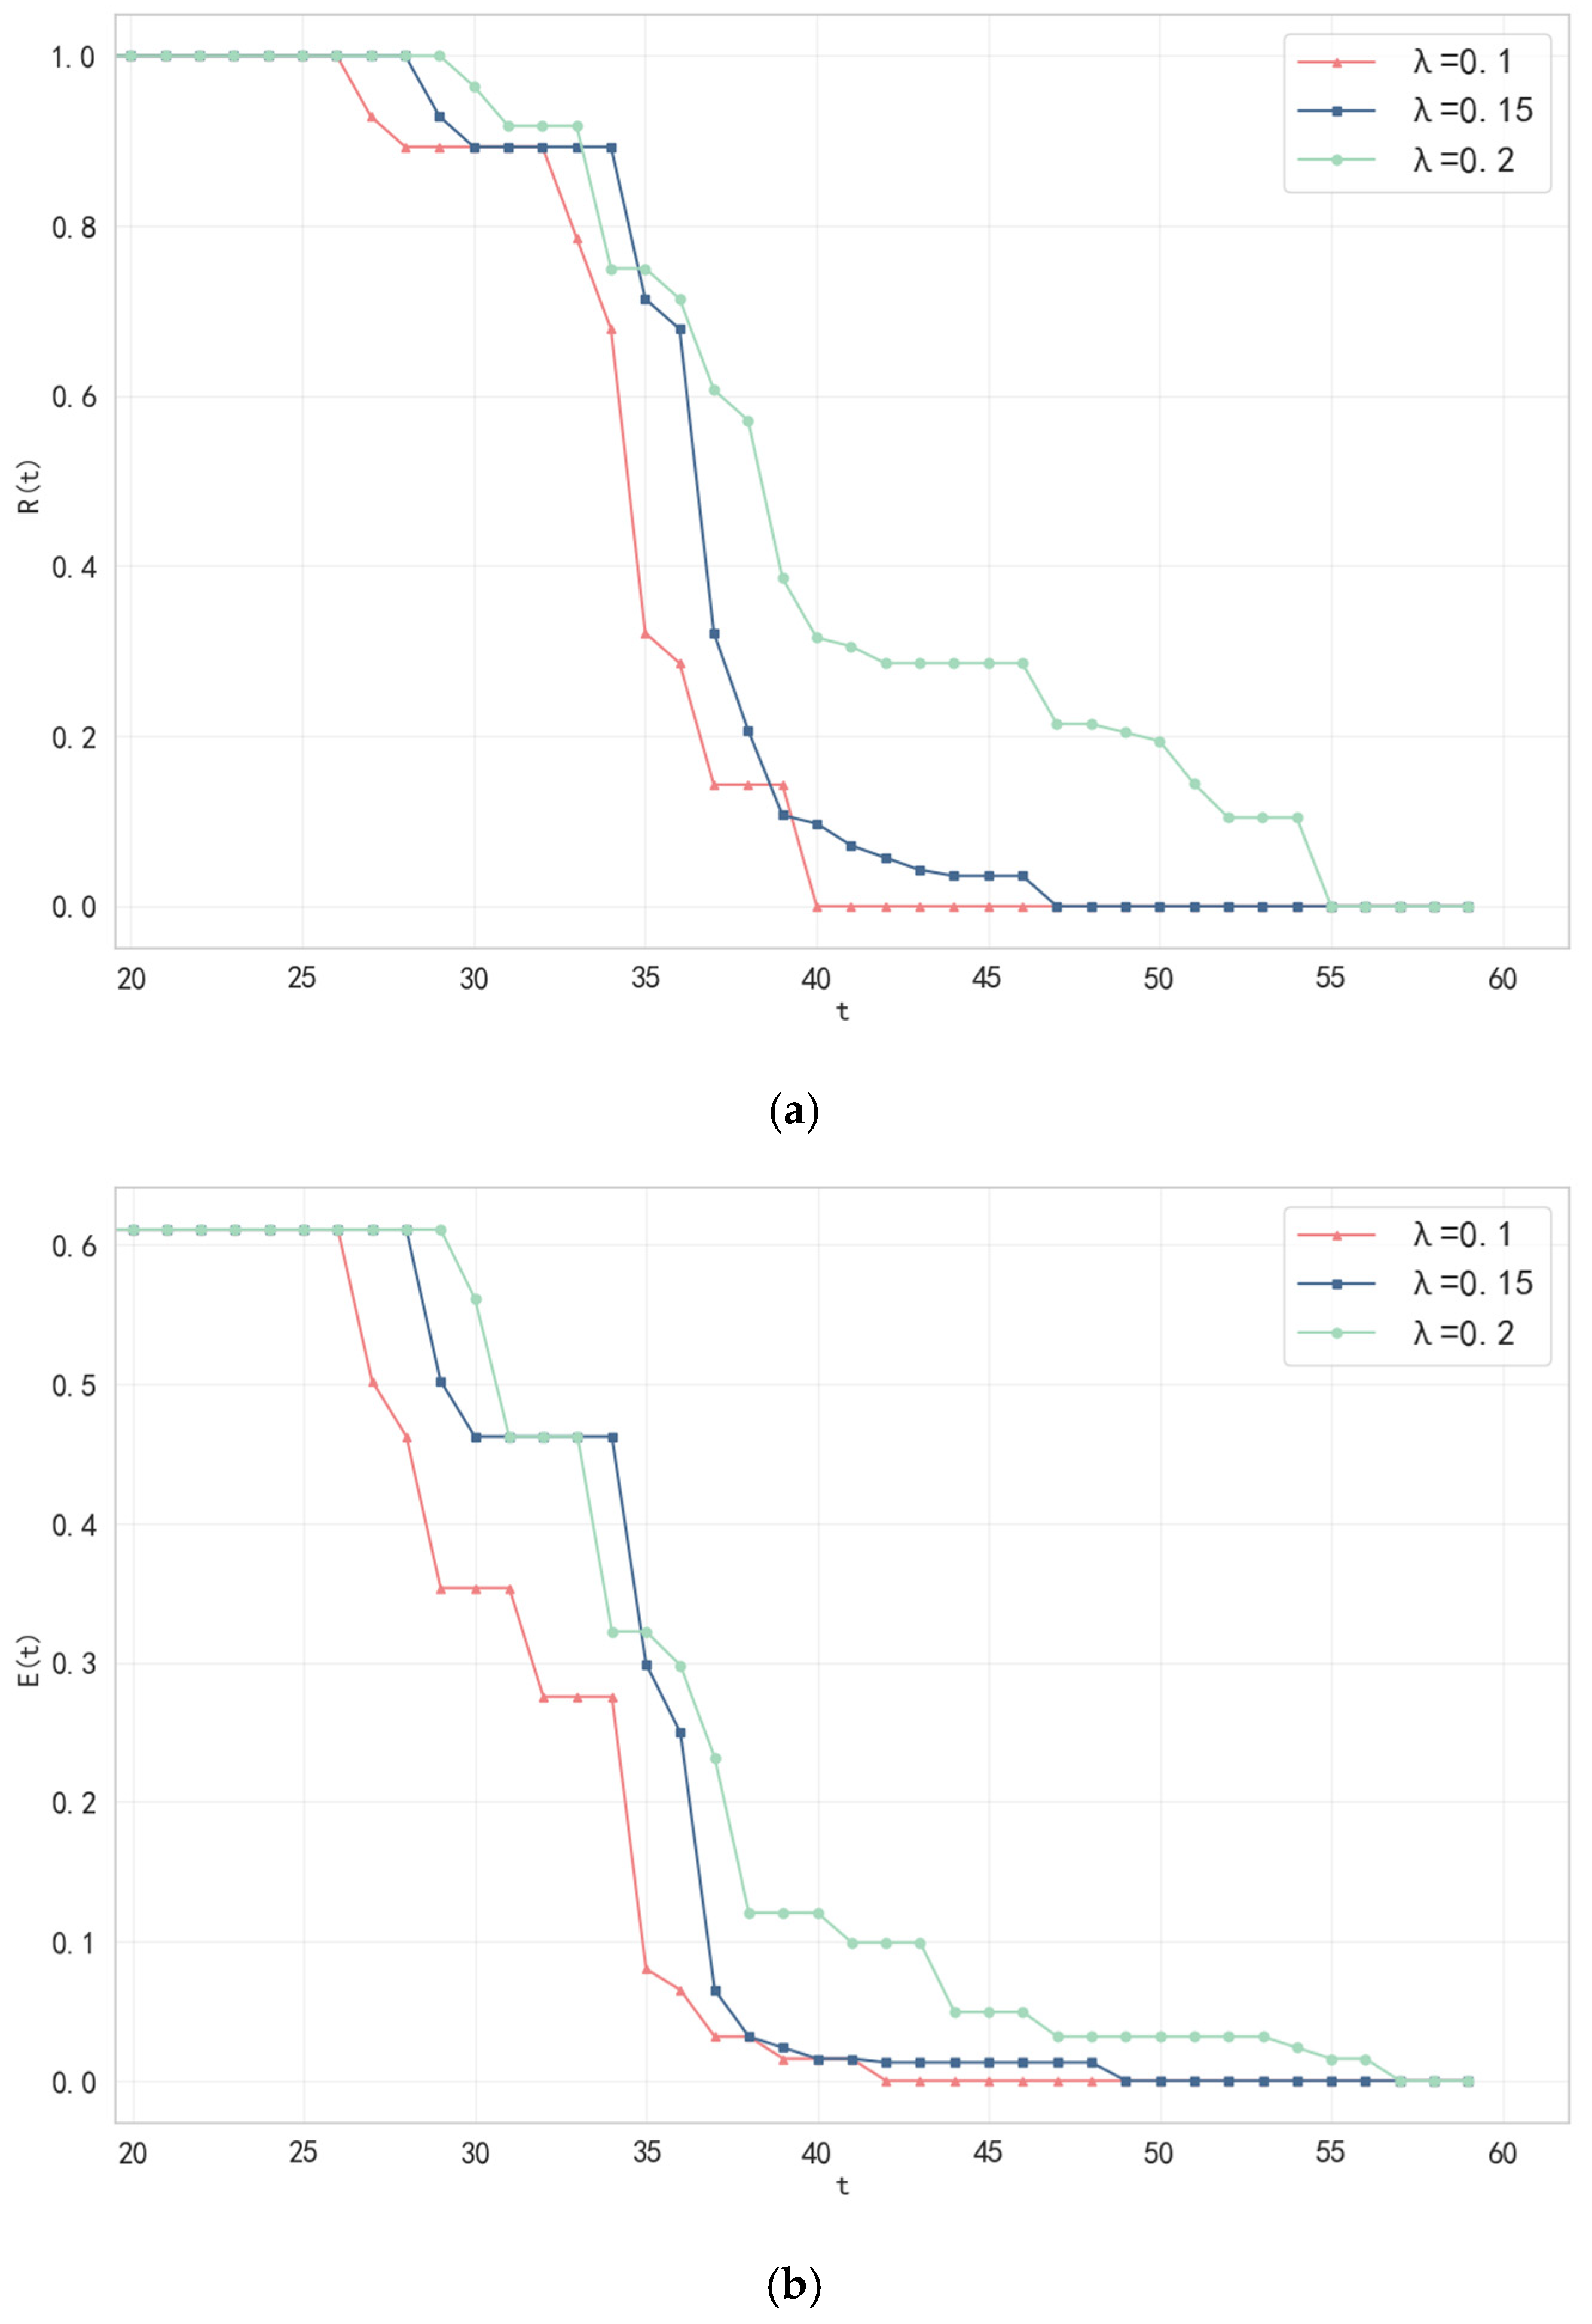
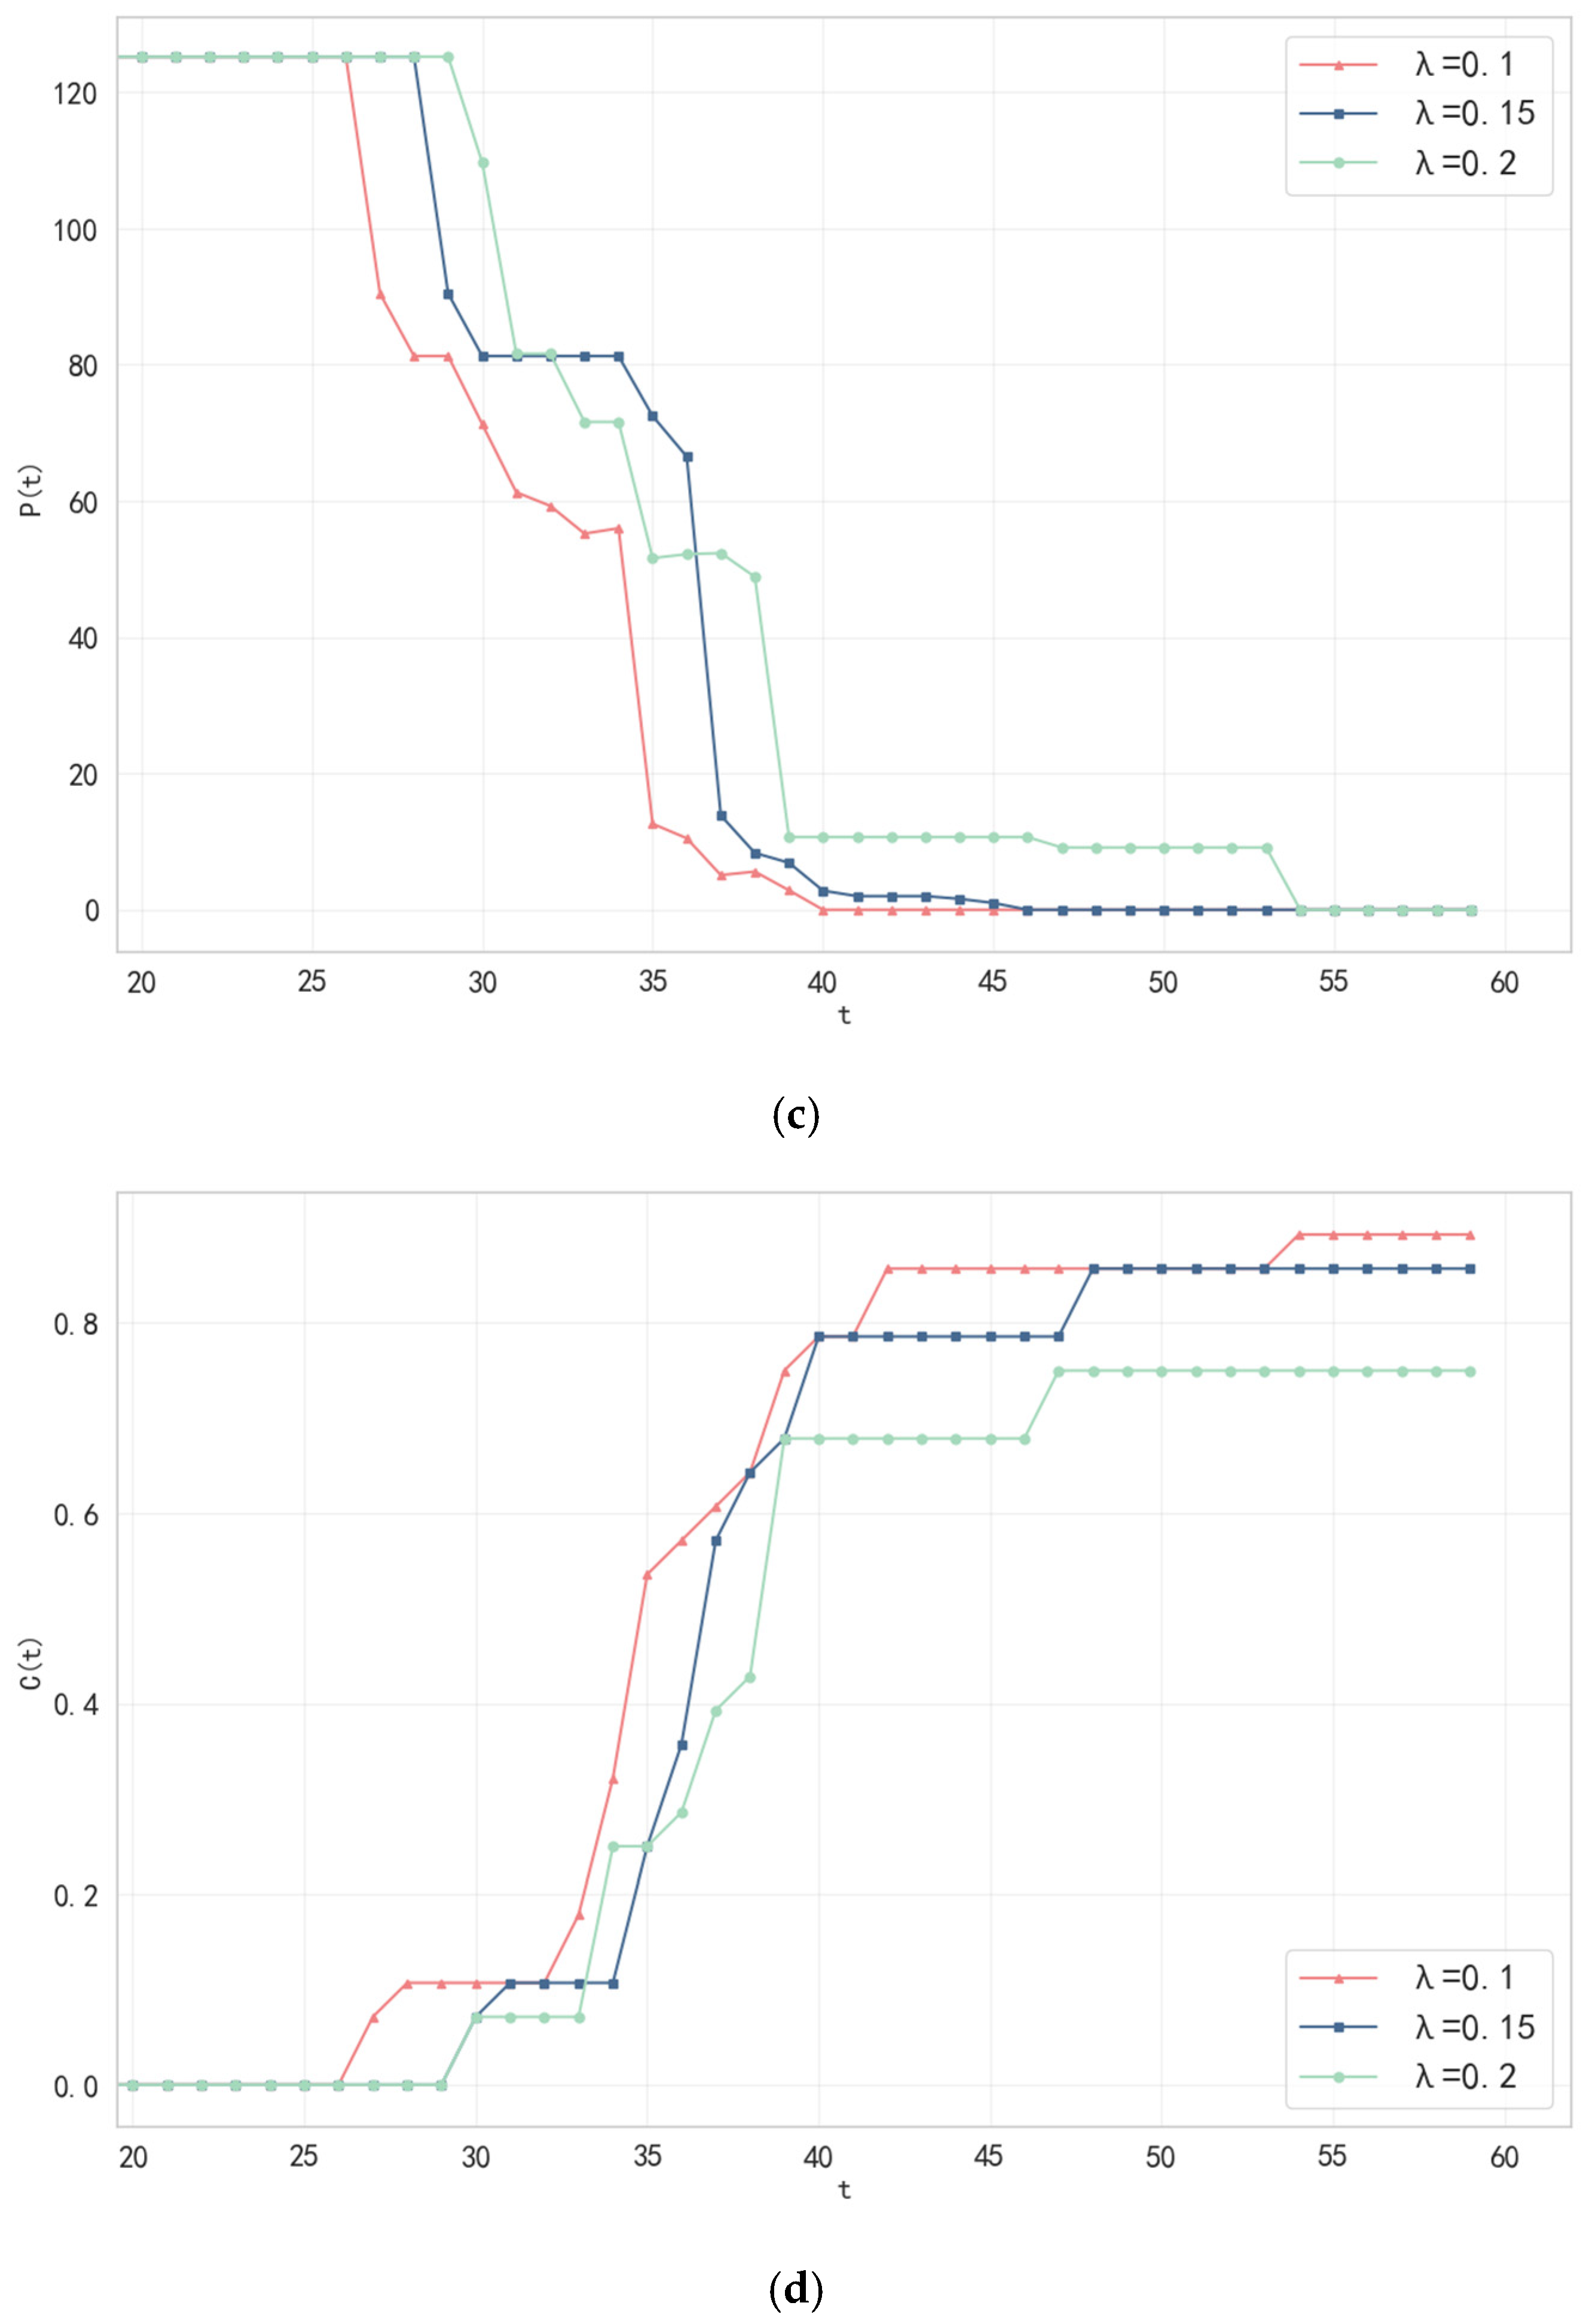
4.3.5. Sensitivity Analysis of Infection Thresholds

To assess the robustness of the model results to key parameters, this section conducts a sensitivity analysis on the infection threshold λ. As the direct trigger condition for port failure, the setting of λ has a decisive impact on the cascade failure dynamics. The analysis employs the control variable method: the single-source epidemic scenario (initial infection at the Port of Shanghai with an initial infection count of 10) is fixed, along with the dynamic load allocation strategy, while all other parameters remain unchanged. The response of network resilience metrics is examined under three values of λ: {0.1, 0.15, 0.2}.
Based on the results of the sensitivity analysis experiment shown in Figure 7, this paper selects λ = 0.15 as the optimal threshold for adjusting the resilience of the shipping network under the impact of the epidemic. Time-series evolution data indicate that when λ = 0.15, the network begins to collapse at t = 28 days, delayed by 10% compared to λ = 0.1, but does not completely collapse until t = 43 days, delayed by 7.5% compared to λ = 0.1, thereby forming a 15-day golden regulatory window. In contrast, when λ = 0.1, the network collapses at t = 40 days, with the peak value of the cascading failure propagation rate C(t) reaching 0.85, leading to the premature failure and closure of ports, causing a large accumulation of goods and triggering cascading failures, resulting in certain economic losses. When λ = 0.2, although the collapse is delayed to t = 55 days, the relaxed strategy allows many infected ports to remain operational, which actually increases the risk of cross-port transmission of the epidemic. This could ultimately lead to the entire shipping network becoming paralyzed, with a prolonged collapse period of 26 days causing the network efficiency E(t) to remain below 0.3 for over 30 days, resulting in severe resource idleness.

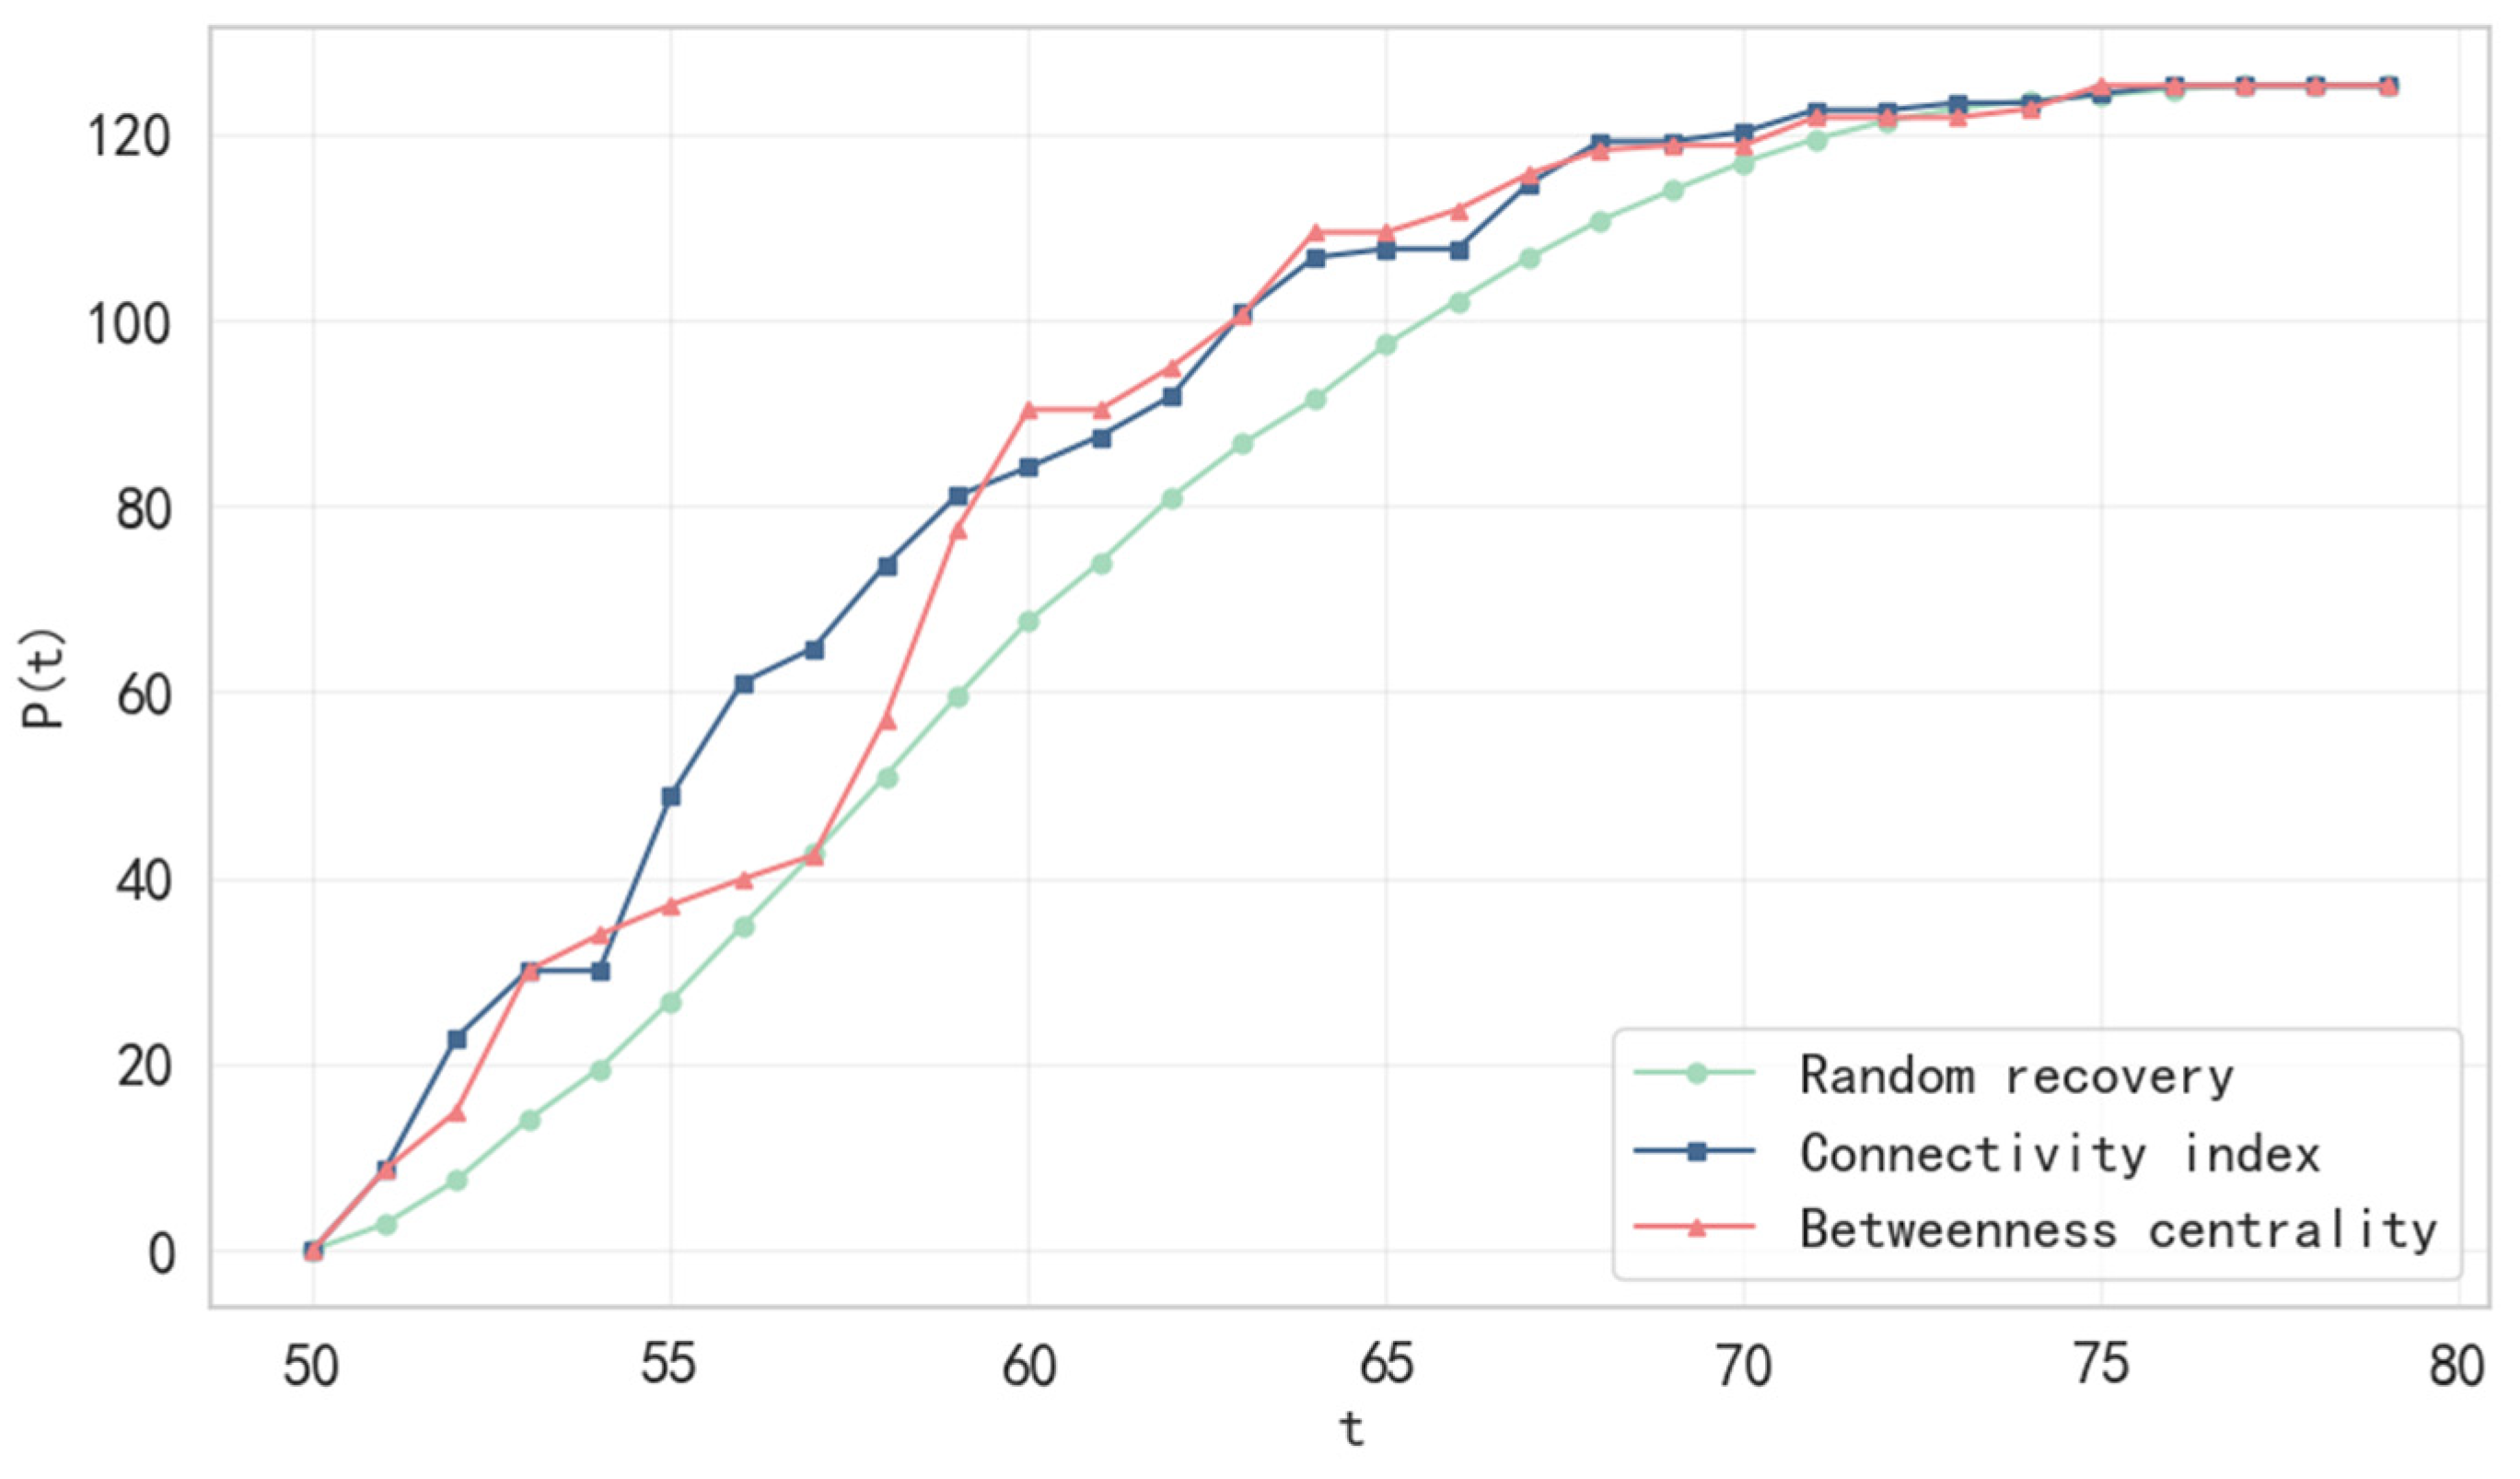
4.3.6. Analysis of Network Resilience Under Different Recovery Strategies

To evaluate the impact of recovery strategies on the resilience of the shipping network after an epidemic shock, three recovery strategies were developed in this experiment: prioritizing the recovery of ports with high connectivity based on the port connectivity index (Table 4), prioritizing the recovery of ports with high meso-centrality based on the meso-centrality index (Table 4), and randomly selecting failed ports for recovery.
The experiment uses the failure state following a single-port outbreak as the initial condition, simulates the dynamic recovery processes of the network under various recovery strategies, and records changes in key indicators, including the proportion of maximally connected subgraphs, network efficiency, and the number of independent paths. The purpose of this experiment is to assess the effectiveness of different recovery strategies in enhancing network resilience after an epidemic shock.
The experimental results (Figure 8, Figure 9 and Figure 10) show that different recovery strategies exhibit distinct phase differences in the network resilience recovery process. The high connectivity strategy is more effective in the early recovery stage (days 50–60), quickly rebuilding the network’s core structure by prioritizing the restoration of hub ports (e.g., the ports of Shanghai and Singapore). At day 56, its maximum connectivity subgraph ratio reaches 0.9643, representing a 31.48% and 18.74% improvement over the stochastic strategy (0.6607) and the median strategy (0.7835), respectively. The high route density and remaining capacity of the hub node effectively absorb the load to prevent cascading failures, thereby activating backbone paths and driving a significant increase in network efficiency (0.4859 on day 56) and independent path values (64.71 on day 57). However, the meso-centrality strategy gradually demonstrates its advantage in the middle recovery period (days 60–70). At day 60, its network efficiency (0.5454) nearly matches that of the high connectivity strategy (0.5406), while its independent path value (90.3571) surpasses the latter (84.1429). This is because the recovery of high meso-centrality nodes (e.g., the Port of Jeddah) optimizes regional bypass paths (e.g., Middle East–Europe routes), reduces shortest path lengths between critical nodes, and alleviates local bottlenecks (e.g., Red Sea shipping lanes), thereby enhancing global efficiency. The random recovery strategy performs the worst, lagging in recovery rate and efficiency due to its lack of targeting. For example, on day 56, the network efficiency is only 0.3172, with an independent path value of 34.7857, significantly lower than those of the other strategies. Random recovery may prematurely restore low-capacity nodes (e.g., Mumbai Harbor), potentially triggering secondary failures and causing imbalanced load distribution.
Based on the experimental results and network topology analysis, when the shipping network is paralyzed due to epidemic spread, a phased hybrid recovery strategy can be implemented as follows: During the early recovery phase, priority is given to restoring high-connectivity ports (e.g., the Port of Shanghai and the Port of Singapore), leveraging their dense routes to rapidly reconstruct the network’s core skeleton; during the middle recovery phase, high meso-centrality ports (e.g., the Port of Jeddah, the Port of Antwerp) are progressively incorporated, and regional key routes are optimized to enhance network efficiency; in the late recovery phase, the strategy is dynamically adjusted by establishing alternative routes based on real-time port conditions, thereby balancing efficiency and redundancy to achieve global shipping network stability. Through the progressive logic of “core skeleton reconstruction—critical path optimization—dynamic redundancy enhancement”, this strategy balances recovery speed and functional improvement, offering a theoretical foundation and practical pathway for hierarchical port recovery in the post-epidemic era.

5. Conclusions

To address the systemic threat posed by epidemic transmission across shipping networks, this study proposes a dynamic resilience assessment framework for shipping networks based on the SEIR model. By integrating heterogeneous infection rate functions with dynamic transmission matrices, this framework can accurately depict the spatiotemporal spread patterns of the epidemic within shipping networks. Furthermore, a two-stage cascading failure model is designed, encompassing failures caused by epidemic transmission and those triggered by load redistribution, and a multidimensional resilience assessment indicator system is constructed. Empirical studies based on real shipping network cases demonstrate the significant effectiveness of the proposed model. The following are the key conclusions of this study:
(1)
This study couples the SEIR model with the shipping network topology, breaking through the traditional port resilience assessment paradigm based on static disruptions. This framework can quantitatively analyze the dual dynamic processes of epidemic transmission and shipping network topology evolution driven by load redistribution and cascading port failures. By introducing an infection rate function that characterizes node heterogeneity, it reveals the key impact of port connectivity indicators and epidemic control intensity on the speed and scope of epidemic transmission. Results show that the risk quantification is highly effective: it accurately predicted that the Port of Shanghai closed on day 40 due to infection levels exceeding the threshold, and despite bearing 28.9% of the Port of Shanghai’s load redistribution, the Port of Singapore successfully avoided secondary failure due to its high remaining capacity and low infection risk. Therefore, the model effectively captures the spatiotemporal characteristics of epidemic transmission between ports, providing a more precise quantitative tool for risk assessment.
(2)
The proposed two-stage cascading failure model considers not only nodes that fail directly due to the number of infections exceeding the threshold but also the indirect failure process caused by load redistribution. Compared with traditional load redistribution strategies, the improved strategy considers the remaining capacity of ports and the dynamic allocation of epidemic risks and has significant advantages in improving the resilience of port networks. Experiments show that this strategy outperforms traditional methods in key metrics: The maximum subgraph connectivity decay rate is reduced by 68.2%, the peak network efficiency is increased by 128.2%, the available cycle of redundant paths is extended by 10 days, and the peak cascade failure propagation rate is reduced by 88%. In practical applications, it is recommended to prioritize the use of dynamic load allocation strategies during the pandemic to suppress the crossover effects of multi-source transmission.
(3)
The resilience performance of shipping networks under different epidemic scenarios was comprehensively evaluated using four key metrics: structural robustness, network operational efficiency, path redundancy, and the cascading failure propagation rate. Results showed a nonlinear positive correlation between the initial number of infection sources and network collapse speed, emphasizing the importance of early intervention. For shipping networks paralyzed by a pandemic, it is recommended to adopt a phased hybrid recovery strategy: initially prioritize the restoration of highly connected ports (such as the Port of Shanghai and the Port of Singapore) to rapidly rebuild the network’s core framework; gradually incorporate high-degree centrality ports (such as the port of Jeddah and the Port of Antwerp) in the intermediate phase to optimize regional critical paths; and dynamically adjust strategies in the later phase to balance efficiency and redundancy, ultimately achieving global stability.
This study provides important decision-making references for policymakers and port management departments. It is recommended that government departments prioritize the allocation of epidemic prevention resources to highly connected hub ports, thus enhancing port capacity redundancy to mitigate the risk of cascading failures triggered by epidemic transmission. Shipping companies can leverage dynamic load allocation strategies to integrate real-time port capacity surplus data with infection risk data, optimize cargo routing paths during pandemic peaks, and prevent the network efficiency collapse. Implementing this systematic recovery approach ensures efficient restoration of global shipping network functionality.
Although this study proposes an SEIR-shipping network coupling model, filling a research gap in this field, it still has the following limitations. First, this study assumes a single epidemic transmission and does not consider the competitive transmission dynamics when multiple infectious diseases coexist, which may underestimate the risk of network failure under the impact of compound epidemics. Second, the dynamic transmission matrix relies on liner route frequencies and infection counts, without integrating micro-level factors such as differences in vessel types and cabin density, and due to lack of port-level infection data, real-world epidemic data (e.g., COVID-19) has not been used to calibrate the results, which may limit the accuracy of risk predictions. Finally, this study has conducted a sensitivity analysis on the key parameter of infection threshold, but the settings for other parameters (such as capacity factor and transmission coefficient) are primarily based on extrapolation from historical data and expert experience. Such parameters may be influenced by regional epidemic prevention policies, temporal dynamics, and differences in shipping networks, and their potential variability requires further exploration in future studies.
Given the above limitations, future research could focus on the following directions. First, construct a database of multi-pathogen interaction rules to quantify cross-immunity and co-infection probabilities, revealing the failure modes of shipping networks under complex epidemic conditions. Second, integrate vessel identification system (AIS) vessel characteristic data (such as vessel type, cabin density, etc.), construct a dynamic transmission matrix by vessel type, and combine it with real epidemic data to extract key features and patterns for optimizing dynamic transmission matrix parameter estimation and model validation, thereby improving the accuracy of risk quantification between ports. Third, develop robust parameter analysis frameworks to quantify how the features of epidemics, ports, and shipping lines influence resilience under epidemic scenarios. This includes establishing parameter–resilience mapping relationships through advanced global sensitivity analysis and developing adaptive parameter optimization strategies that account for regional and temporal variations in epidemic prevention measures.

Author Contributions

Conceptualization, B.S. and Z.M.; methodology, B.S. and L.S.; software, L.S.; validation, B.S. and L.S.; formal analysis, B.S.; investigation, L.S.; resources, Z.M.; data curation, L.S.; writing—original draft preparation, L.S.; writing—review and editing, B.S.; visualization, L.S.; supervision, B.S. and Z.M.; project administration, Z.M.; funding acquisition, Z.M. All authors have read and agreed to the published version of the manuscript.

Funding

This study was funded by the National Key Research and Development Program of China under Grant No. 2022YFC2302804.

Data Availability Statement

Third-party data. The availability of these data is limited. The data are obtained from third parties and are available from the authors with the permission of the third parties.

Conflicts of Interest

The authors declare no conflicts of interest.

References

  1. UNCTAD Review of Maritime Transport 2023. United Nations Conference on Trade and Development. 2023. Available online: https://unctad.org/publication/review-maritime-transport-2023 (accessed on 22 October 2024).
  2. Nguyen, P.N.; Kim, H. The effects of the COVID-19 pandemic on connectivity, operational efficiency, and resilience of major container ports in Southeast Asia. J. Transp. Geogr. 2024, 116, 103835. [Google Scholar] [CrossRef]
  3. Li, K.X.; Wang, H.; Yang, Y.; Li, M. Resilience in maritime logistics: Theoretical framework, research methodology, and indicator system. Ocean Coast. Manag. 2024, 259, 107465. [Google Scholar] [CrossRef]
  4. Baker, R.E.; Mahmud, A.S.; Miller, I.F.; Rajeev, M.; Rasambainarivo, F.; Rice, B.L.; Takahashi, S.; Tatem, A.J.; Wagner, C.E.; Wang, L.-F.; et al. Infectious disease in an era of global change. Nat. Rev. Microbiol. 2022, 20, 193–205. [Google Scholar] [CrossRef] [PubMed]
  5. Pan, J.J.; Zhang, Y.F.; Fan, B. Strengthening container shipping network connectivity during COVID-19, A graph theory approach. Ocean Coast. Manag. 2022, 229, 106338. [Google Scholar] [CrossRef]
  6. Li, Z.; Yan, W.; Wang, L. Measuring mobility resilience with network-based simulations of flow dynamics under extreme events. Transp. Res. Part D Transp. Environ. 2024, 135, 104362. [Google Scholar] [CrossRef]
  7. Verschuur, J.; Koks, E.E.; Hall, J.W. Global economic impacts of COVID-19 lockdown measures stand out in high-frequency shipping data. PLoS ONE 2021, 16, e0248818. [Google Scholar] [CrossRef]
  8. Xu, X.; Zhu, Y.; Xu, M.; Deng, W.; Zuo, Y. Vulnerability analysis of the global liner shipping network: From static structure to cascading failure dynamics. Ocean Coast. Manag. 2022, 229, 106325. [Google Scholar] [CrossRef]
  9. Nam, D.; Kim, M. Implication of COVID-19 Outbreak on Ship Survey and Certification. Mar. Policy 2021, 131, 104615. [Google Scholar] [CrossRef]
  10. Zhang, Y.; Sun, Z. The Coevolutionary Process of Maritime Management of Shipping Industry in the Context of the COVID-19 Pandemic. J. Mar. Sci. Eng. 2021, 9, 1293. [Google Scholar] [CrossRef]
  11. Kasińska, J.; Jendryczka, V. Determinants of COVID-19 Infections on Sea-Going Ships and Their Socio-Economic Consequences for Seafarers and Shipowners in Terms of Modeling Ship Emergency Procedures. Sustainability 2022, 14, 10882. [Google Scholar] [CrossRef]
  12. Wang, Y.; Yuan, F.; Song, Y.; Guo, H.; Xiao, L.; Li, M.; Zhang, X.; Wang, J.; Yang, J.; Rao, H.; et al. Prediction of cross-border spread of the COVID-19 pandemic: A predictive model for imported cases outside China. PLoS ONE 2024, 19, e0301420. [Google Scholar] [CrossRef] [PubMed]
  13. Zheng, P.; Li, J.; Cui, Z.; Tolba, A.; Alharbi, A. An Improved SEIR Dynamics Model for Actual Infection Scale Estimation of COVID-19. J. Circuits Syst. Comput. 2024, 33, 2550003. [Google Scholar] [CrossRef]
  14. Lu, M.; Zheng, X.; Jia, W.-N.; Tian, C.-Z. Analysis and prediction of improved SEIR transmission dynamics model: Taking the second outbreak of COVID-19 in Italy as an example. Front. Public Health 2023, 11, 1223039. [Google Scholar] [CrossRef]
  15. Wang, C.Y.; Zhou, L.; Liu, D.; Wang, X.; Jin, Y.; Hou, W.; Wang, J. SQEAIR: An Improved Infectious Disease Dynamics Model. J. Nonlinear Math. Phys. 2024, 31, 28. [Google Scholar] [CrossRef]
  16. Jing, X.L.; Chen, J.; Ling, X.; Hu, M.B.; Li, Y.Q. Impact of heterogeneous infection rates on traffic-driven epidemic spreading dynamics in complex networks. Int. J. Mod. Phys. C 2025, 36, 2550003. [Google Scholar] [CrossRef]
  17. Qian, X.; Ukkusuri, S.V. Connecting urban transportation systems with the spread of infectious diseases: A Trans-SEIR modeling approach. Transp. Res. Part B Methodol. 2021, 145, 185–211. [Google Scholar] [CrossRef]
  18. Liu, J.; Ong, G.P.; Pang, V.J. Modelling effectiveness of COVID-19 pandemic control policies using an Area-based SEIR model with consideration of infection during interzonal travel. Transp. Res. Part A Policy Pract. 2022, 161, 25–47. [Google Scholar] [CrossRef]
  19. Kuzdeuov, A.; Baimukashev, D.; Karabay, A.; Ibragimov, B.; Nurpeiissov, M.; Mirzakhmetov, A.; Lewis, M.; Varol, H.A. A network-based stochastic epidemic simulator: Controlling covid-19 with region-specific policies. IEEE J. Biomed. Health Inform. 2020, 24, 2743–2754. [Google Scholar] [CrossRef]
  20. Scabini, L.F.S.; Ribas, L.C.; Neiva, M.B.; Junior, A.G.; Farfán, A.J.; Bruno, O.M. Social interaction layers in complex networks for the dynamical epidemic modeling of COVID-19 in Brazil. Phys. A Stat. Mech. Its Appl. 2021, 564, 125498. [Google Scholar] [CrossRef]
  21. Tsiotas, D.; Tselios, V. Understanding the uneven spread of COVID-19 in the context of the global interconnected economy. Sci. Rep. 2022, 12, 666. [Google Scholar] [CrossRef]
  22. Ma, J.; Wang, P. Epidemic spreading on multilayer community networks. Phys. Lett. A 2025, 532, 130199. [Google Scholar] [CrossRef]
  23. Ma, J.; Xiang, T.; Zhao, Y. Epidemic spreading dynamics on two-layer complex networks. Int. J. Mod. Phys. C 2024, 35, 2450023. [Google Scholar] [CrossRef]
  24. Yazr, D.; Ahin, B.; Yip, T.L.; Şahin, B.; Tseng, P.H. Effects of COVID-19 on maritime industry: A review. Int. Marit. Health 2021, 71, 253–264. [Google Scholar] [CrossRef] [PubMed]
  25. Li, Z.; Li, H.; Qi, Z.X. Data-driven research on the impact of COVID-19 on the global container shipping network. Ocean Coast. Manag. 2024, 248, 106969.1–106969.14. [Google Scholar] [CrossRef]
  26. Dirzka, C.; Acciaro, M. Global shipping network dynamics during the COVID-19 pandemic’s initial phases. J. Transp. Geogr. 2022, 99, 103265. [Google Scholar] [CrossRef]
  27. Prieto, J.M.; Amor-Esteban, V.; Almorza-Gomar, D.; Turias, I.; Piniella, F. Application of Multivariate Statistical Techniques as an Indicator of Variability of the Effects of COVID-19 on the Paris Memorandum of Understanding on Port State Control. Mathematics 2023, 11, 3188. [Google Scholar] [CrossRef]
  28. Bai, X.; Ma, Z.; Zhou, Y. Data-driven static and dynamic resilience assessment of the global liner shipping network. Transp. Res. Part E Logist. Transp. Rev. 2023, 170, 103016. [Google Scholar] [CrossRef]
  29. Ducruet, C.; Cocuzza, E.; Ignaccolo, M. Analysis of the maritime networks: Criticalities and resilience. Transp. Res. Procedia 2023, 69, 878–885. [Google Scholar] [CrossRef]
  30. Poo, M.C.P.; Yang, Z. Optimising the resilience of shipping networks to climate vulnerability. Marit. Policy Manag. 2024, 51, 15–34. [Google Scholar] [CrossRef]
  31. Yang, Y.; Liu, W. Resilience analysis of maritime silk road shipping network structure under disruption simulation. J. Mar. Sci. Eng. 2022, 10, 617. [Google Scholar] [CrossRef]
  32. Peng, P.; Cheng, S.; Chen, J.; Wu, L.; Liu, X.; Lu, F.; Liao, M. A fine-grained perspective on the robustness of global cargo ship transportation networks. J. Geogr. Sci. 2018, 28, 881–889. [Google Scholar] [CrossRef]
  33. He, Y.; Yang, Y.; Wang, M.; Yang, Y. Resilience analysis of container port shipping network structure: The case of China. Sustainability 2022, 14, 9489. [Google Scholar] [CrossRef]
  34. Guerrero, D.; Letrouit, L.; Montes, C.P. The container transport system during COVID-19, An analysis through the prism of complex networks. Transp. Policy 2022, 115, 113–125. [Google Scholar] [CrossRef] [PubMed]
  35. Wang, M.; Tan, Z.; Chen, J. Improving the resilience of the inland river transportation chain with flexible freight consolidation strategy under epidemic. Ocean Coast. Manag. 2023, 243, 106757. [Google Scholar] [CrossRef]
  36. Zohoori, S.; Jafari Kang, M.; Hamidi, M.; Zohoori, S.; Kang, M.J. An AIS-Based approach for measuring waterway resiliency: A case study of Houston ship channel. Marit. Policy Manag. 2023, 50, 797–817. [Google Scholar] [CrossRef]
  37. Wang, N.; Yuen, K.F. Resilience assessment of waterway transportation systems: Combining system performance and recovery cost. Reliab. Eng. Syst. Saf. 2022, 226, 108673. [Google Scholar] [CrossRef]
  38. Qin, Y.; Guo, J.; Liang, M.; Feng, T.; Qin, Y. Resilience characteristics of port nodes from the perspective of shipping network: Empirical evidence from China. Ocean Coast. Manag. 2023, 237, 106531. [Google Scholar] [CrossRef]
  39. Cao, Y.; Xin, X.; Jarumaneeroj, P.; Li, H.; Feng, Y.; Wang, J.; Wang, X.; Pyne, R.; Yang, Z. Data-driven resilience analysis of the global container shipping network against two cascading failures. Transp. Res. Part E Logist. Transp. Rev. 2025, 193, 103857. [Google Scholar] [CrossRef]
  40. Wan, C.; Tao, J.; Yang, Z.; Zhang, D. Evaluating recovery strategies for the disruptions in liner shipping networks: A resilience approach. Int. J. Logist. Manag. 2022, 33, 389–409. [Google Scholar] [CrossRef]
  41. Asadabadi, A.; Miller-Hooks, E. Maritime port network resiliency and reliability through co-opetition. Transp. Res. Part E Logist. Transp. Rev. 2020, 137, 101916. [Google Scholar] [CrossRef]
Figure 1. The topology of the shipping network.
Jmse 13 01166 g001
Figure 2. A flow chart of the simulation experiment.
Jmse 13 01166 g002
Figure 3. Trends in the number of infected people by port based on the improved SEIR model.
Jmse 13 01166 g003
Figure 4. Changes in epidemic transmission trends at the Shanghai Port.
Jmse 13 01166 g004
Figure 5. A comparison of resilience metrics for different numbers of initially infected ports: (a) maximum connectivity subgraph ratio; (b) network efficiencies; (c) the number of independent paths; (d) the cascade failure propagation rate.
Jmse 13 01166 g005aJmse 13 01166 g005b
Figure 6. A comparison of resilience metrics for different load redistribution strategies: (a) maximum connectivity subgraph ratio; (b) network efficiencies; (c) the number of independent paths; (d) the cascade failure propagation rate.
Jmse 13 01166 g006aJmse 13 01166 g006b
Figure 7. A comparison of resilience indicators at different infection thresholds: (a) maximum connected subgraph ratio; (b) network efficiency; (c) the number of independent paths; (d) the cascade failure propagation rate.
Jmse 13 01166 g007aJmse 13 01166 g007b
Figure 8. The maximum connectivity subgraph ratio under different recovery strategies.
Jmse 13 01166 g008
Figure 9. Network efficiency under different recovery strategies.
Jmse 13 01166 g009
Figure 10. The number of independent paths under different recovery strategies.
Jmse 13 01166 g010
Table 1. Key parameters.
Parameter NameSymbolValueBasis and Description
Baseline infection rateβ00.3Assuming an epidemic with parameters between SARS and COVID-19
Incubation period parametersσ0.2
Recovery period parameterγ0.1
Capacity redundancy factorα1.2Results of nonlinear regression analysis based on port operation data
Capacity parameter δ 0.5
Ultimate capacity factor μ 1.5
Infection thresholdλ0.15Emergency response thresholds recommended by the International Chamber of Shipping (ICS)
Dynamic exposure factorθ0.35Results based on the fitting of historical propagation data
Time stept150Assuming a time step of one day
Table 2. A comparison of port outbreaks with different infection rates.
PortHomogeneous InfectedHeterogeneous InfectedDifferenceHomogeneous Peak TimeHeterogeneous
Peak Time
Difference
Busan23232125−19837370
Singapore23852561+1765447−7
Tokyo469304−1653834−4
Los Angeles669739+706444−20
Port Klang10111034+235241−11
Vancouver633490−1435142−9
Mumbai270274+46241−21
Santos726754+285239−13
Manila314243−714639−7
Shanghai38243743−813940+1
Table 3. The Port of Shanghai cascade failure load redistribution ratio.
PortsReallocated PortsAllocated Loads (Tons)Allocation Ratio (%)
ShanghaiSingapore57.828.9
Busan36.218.1
Antwerp27.413.7
Los Angeles17.88.9
Vancouver14.67.3
Table 4. Topological attributes of shipping networks TOP10.
RankPortConnectivity IndexPortMedian Centrality
1Shanghai2041.63Singapore0.3178
2Singapore1720.22Shanghai0.1059
3Busan1619.98Jeddah0.0998
4Port Klang1023.22Antwerp0.0956
5Rotterdam1003.16Santos0.0945
6Antwerp887.35Manzanillo0.0656
7Laem Chabang671.8Rotterdam0.0517
8Hamburg654.71Busan0.0363
9Jakarta531.06Barcelona0.0320
10Barcelona460.13Mumbai0.0165
Disclaimer/Publisher’s Note: The statements, opinions and data contained in all publications are solely those of the individual author(s) and contributor(s) and not of MDPI and/or the editor(s). MDPI and/or the editor(s) disclaim responsibility for any injury to people or property resulting from any ideas, methods, instructions or products referred to in the content.

