Article

Research on Operational Risk for Northwest Passage Cruise Ships Using POLARIS

1
Naval Architecture and Shipping College, Guangdong Ocean University, Zhanjiang 524088, China
2
Key Laboratory of Philosophy and Social Science in Hainan Province of Hainan Free Trade Port, International Shipping Development and Property Digitization, Hainan Vocational University of Science and Technology, Haikou 570100, China
3
Guangdong Provincial Engineering Research Center for Ship Intelligence and Safety, Guangdong Ocean University, Zhanjiang 524088, China
4
Guangdong Provincial Key Laboratory of Intelligent Equipment for South China Sea Marine Ranching, Guangdong Ocean University, Zhanjiang 524088, China
5
School of Mechanical Engineering, Guangdong Ocean University, Zhanjiang 524088, China
6
Shenzhen Institute of Guangdong Ocean University, Shenzhen 518116, China
7
Qingdao Institute of Shipping Development Innovation, Qingdao 266200, China
*
Author to whom correspondence should be addressed.
J. Mar. Sci. Eng. 2025, 13(7), 1335; https://doi.org/10.3390/jmse13071335
Submission received: 13 June 2025 / Revised: 10 July 2025 / Accepted: 11 July 2025 / Published: 12 July 2025

Abstract

In the context of global warming, polar tourism is developing rapidly, and the demand for polar cruise travel in the Northwest Passage continues to increase, while sea ice has long been a key factor limiting the development of polar cruise tourism. This study focuses on the operational risk of sea ice on cruise ships in the Northwest Passage (NWP), aiming to provide a scientific basis for ensuring the safety of cruise ship navigation and promoting the sustainable development of polar tourism. Based on ice data from 2015 to 2024, this study used the Polar Operational Limit Assessment Risk Indexing System (POLARIS) methodology recommended by the International Maritime Organization (IMO) to establish three scenarios for the route of ice class IC cruise ships: light ice, normal ice, and heavy ice. The navigable windows were systematically analyzed and critical waters along the route were identified. The results indicate that the navigable windows for IC ice-class cruise ships under light ice conditions are from mid-July to early December, while the navigable period under normal ice conditions is only from mid- to late September, and navigation is not possible under heavy ice conditions. The study identified Larsen Sound, Barrow Strait, Bellot Strait and Eastern Beaufort Sea as critical waters on the NWP cruise route. Among them, Larsen Sound and Eastern Beaufort Sea have a more prominent impact on voyage scheduling because their navigation weeks overlap less with other waters. This study provides a new idea for the risk assessment of polar cruise ships in ice regions. The research results can provide an important reference for the safe operation of polar cruise ships in the NWP and the decision-making of relevant parties.

1. Introduction

Global warming has accelerated the melting of Arctic sea ice and significantly improved seasonal navigation in polar waters. Tourism has become a major human activity in the Arctic in recent decades [1], and sea ice in polar waters remains key to the development of polar tourism. The Northwest Passage (NWP) and the Canadian Arctic have the potential to become a major maritime cruise ship passage [2]. This waterway passes through a primitive and fragile high-latitude ecological region, with magnificent glaciers, unique wildlife, and endless tundra along the way. The cultural heritage and historical exploration sites of the Inuit people are also preserved along the waterway, and it is famous for its “rich history, diverse landscapes and cultural interweaving” [3,4,5]. According to statistics, the number of visitors to the NWP has increased from 124 in 2008 to 1199 in 2017 [6], with an average of approximately 35 passages per year from 2022 to 2024, more than double the average of 16.5 passages per year from 2012 to 2021 [7]. This trend highlights the dramatic rise in demand for polar navigation and tourism in the context of ice retreat. However, the extent, condition, and behavior of sea ice remain a critical factor for future cruise ship travel in the region [3]. As a major part of the NWP, the waters of the Canadian Arctic Archipelago (CAA) are a mix of multi-year and first-year ice, and ships can be limited in their navigation [8]. At the same time, changes in the sea ice pattern have brought new risks to navigation. A large amount of multi-year ice has drifted southward into the NWP and gathered into ice barriers in the narrow waterway, posing a serious threat to the safety of ship navigation [9]. In addition, due to the need for sightseeing, cruise ships need to consider stopping at shoals or visiting local communities when designing routes, further increasing the sea ice risks and uncertainties faced by cruise ships in the waters of the NWP. Therefore, research on the sea ice risks faced by cruise ships in the NWP is of great significance for ensuring the safety of cruise navigation and promoting the sustainable development of polar tourism.
With regard to the study of cruise ship risks in the NWP, scholars have first focused on the impact of sea ice on navigation in the NWP. Multiple studies have pointed out that on short- to medium-term time scales, dramatic fluctuations in sea ice cover and accelerated drift speeds may shorten the safe navigation period in Arctic waters and reduce the range of safe navigable routes. Dynamically drifting ice poses a significant collision risk to ships, and the volume and hardness of multi-year ice can cause severe damage to ship hulls, even leading to icebreaking accidents and ship sinking [10,11]. For example, Cook noted that between 2007 and 2021, the summer navigable period in several key regions has tended to shorten, despite the reduction in overall ice extent [9]. Regarding the polar risks of cruise ships, scholars are also exploring risk assessment methods for cruise ships sailing in polar regions. Fu et al. proposed a quantitative analysis framework for the causes of Arctic shipping grounding accidents by constructing a map Bayesian network coupling model, thereby analyzing the risk of polar cruise ship grounding accidents [12]. Johannsdottir et al. took into account the risk of both passengers and shipowners when considering the risk of polar cruise ships and explored the systematic nature of the polar cruise ship accident risk [13]. Polar cruise ships need a method to assess the risks of sailing in the NWP in the face of complex ice conditions. Polar Operational Limit Assessment Risk Indexing System (POLARIS) methodology was proposed by the International Maritime Organization (IMO). This method determines the Risk Index Values (RIVs) based on the ship’s ice class and the sea ice stage of development in the navigable waters. Furthermore, it derives the Risk Index Outcome (RIO) for the navigable waters according to the concentration of sea ice at different stages of development, thereby specifying operational restrictions for ships in those waters. Additionally, the route RIO for a vessel can serve as a basis for determining navigable windows. POLARIS methodology has been integrated into the polar navigation review processes of multiple classification societies and coastal authorities and has become a widely recognized reference standard for shipowners, operators, regulatory bodies, and insurers to assess the feasibility of ice zone operations [14,15]. Currently, Transport Canada mandates the use of POLARIS methodology for Polar Class vessels and vessels built after 2017 when navigating outside the operational windows determined by the Zone Date System (ZDS) [16]. Some scholars have begun to use POLARIS methodology to conduct related studies, such as Stoddard et al. used POLARIS methodology combined with historical ice conditions charts to conduct route planning studies in the NWP [17]; Lee et al. conducted a route planning study for vessels in Arctic waters combined with POLARIS methodology [18]; Wang et al. used POLARIS methodology to explore the navigable time of PC6 ship on the NWP [19]; based on the POLARIS methodology and using the Coupled Model Multi-model Intercomparison Project Phase 6 (CMIP6) data, Chen et al. analyzed the navigability of PC3, PC7, and OW class vessels in the Northeast Passage and the NWP under the background of a global temperature increase of 1.5 °C [20]. In general, although there are many studies on the impact of ice conditions on the navigability of the NWP, most of them focus on cargo ships, with less attention paid to cruise ships. Due to its particularity, cruise ships not only need to consider navigation safety, but also passenger comfort and travel experience. In addition, the need for sightseeing also poses additional requirements for the route design of cruise ships, such as stopping at shallow waters or visiting local communities, thereby increasing their risk and uncertainty of facing sea ice. In summary, ice conditions remain the primary obstacle and challenge for cruise ships traversing the NWP. It is necessary to study the risks posed by ice conditions for cruise ship routes in the NWP, optimize polar cruise ship routes, ensure the safety of cruise ship navigation, and support the development of polar tourism.
This study is based on the September 2022 voyage of the FS Ice Class (IC) cruise ship L’AUSTRAL. Sea ice data spanning 2015–2024 (a 10-year period) were utilized. Using the IMO-recommended POLARIS methodology, the ship’s route RIO was calculated. Based on this, three typical scenarios—light, heavy, and normal ice conditions—were constructed to quantitatively assess operational risks for the IC ice-class cruise ship, determine navigable windows across scenarios, and identify critical waters along the route. The aim is to assist the crew in balancing scenic viewing needs with sea ice risks, optimizing voyage planning, and enhancing the efficiency and safety of cruise operations.
The remainder of this paper is structured as follows: Section 2 outlines the study area and data; Section 3 introduces the POLARIS methodology and technical route; Section 4 addresses operational risks in the Northwest Passage, applying the POLARIS methodology to derive the route RIO, navigable windows, and critical waters for the cruise route; Section 5 discusses the results; Section 6 summarizes key findings and potential future research directions.

2. Study Area and Data
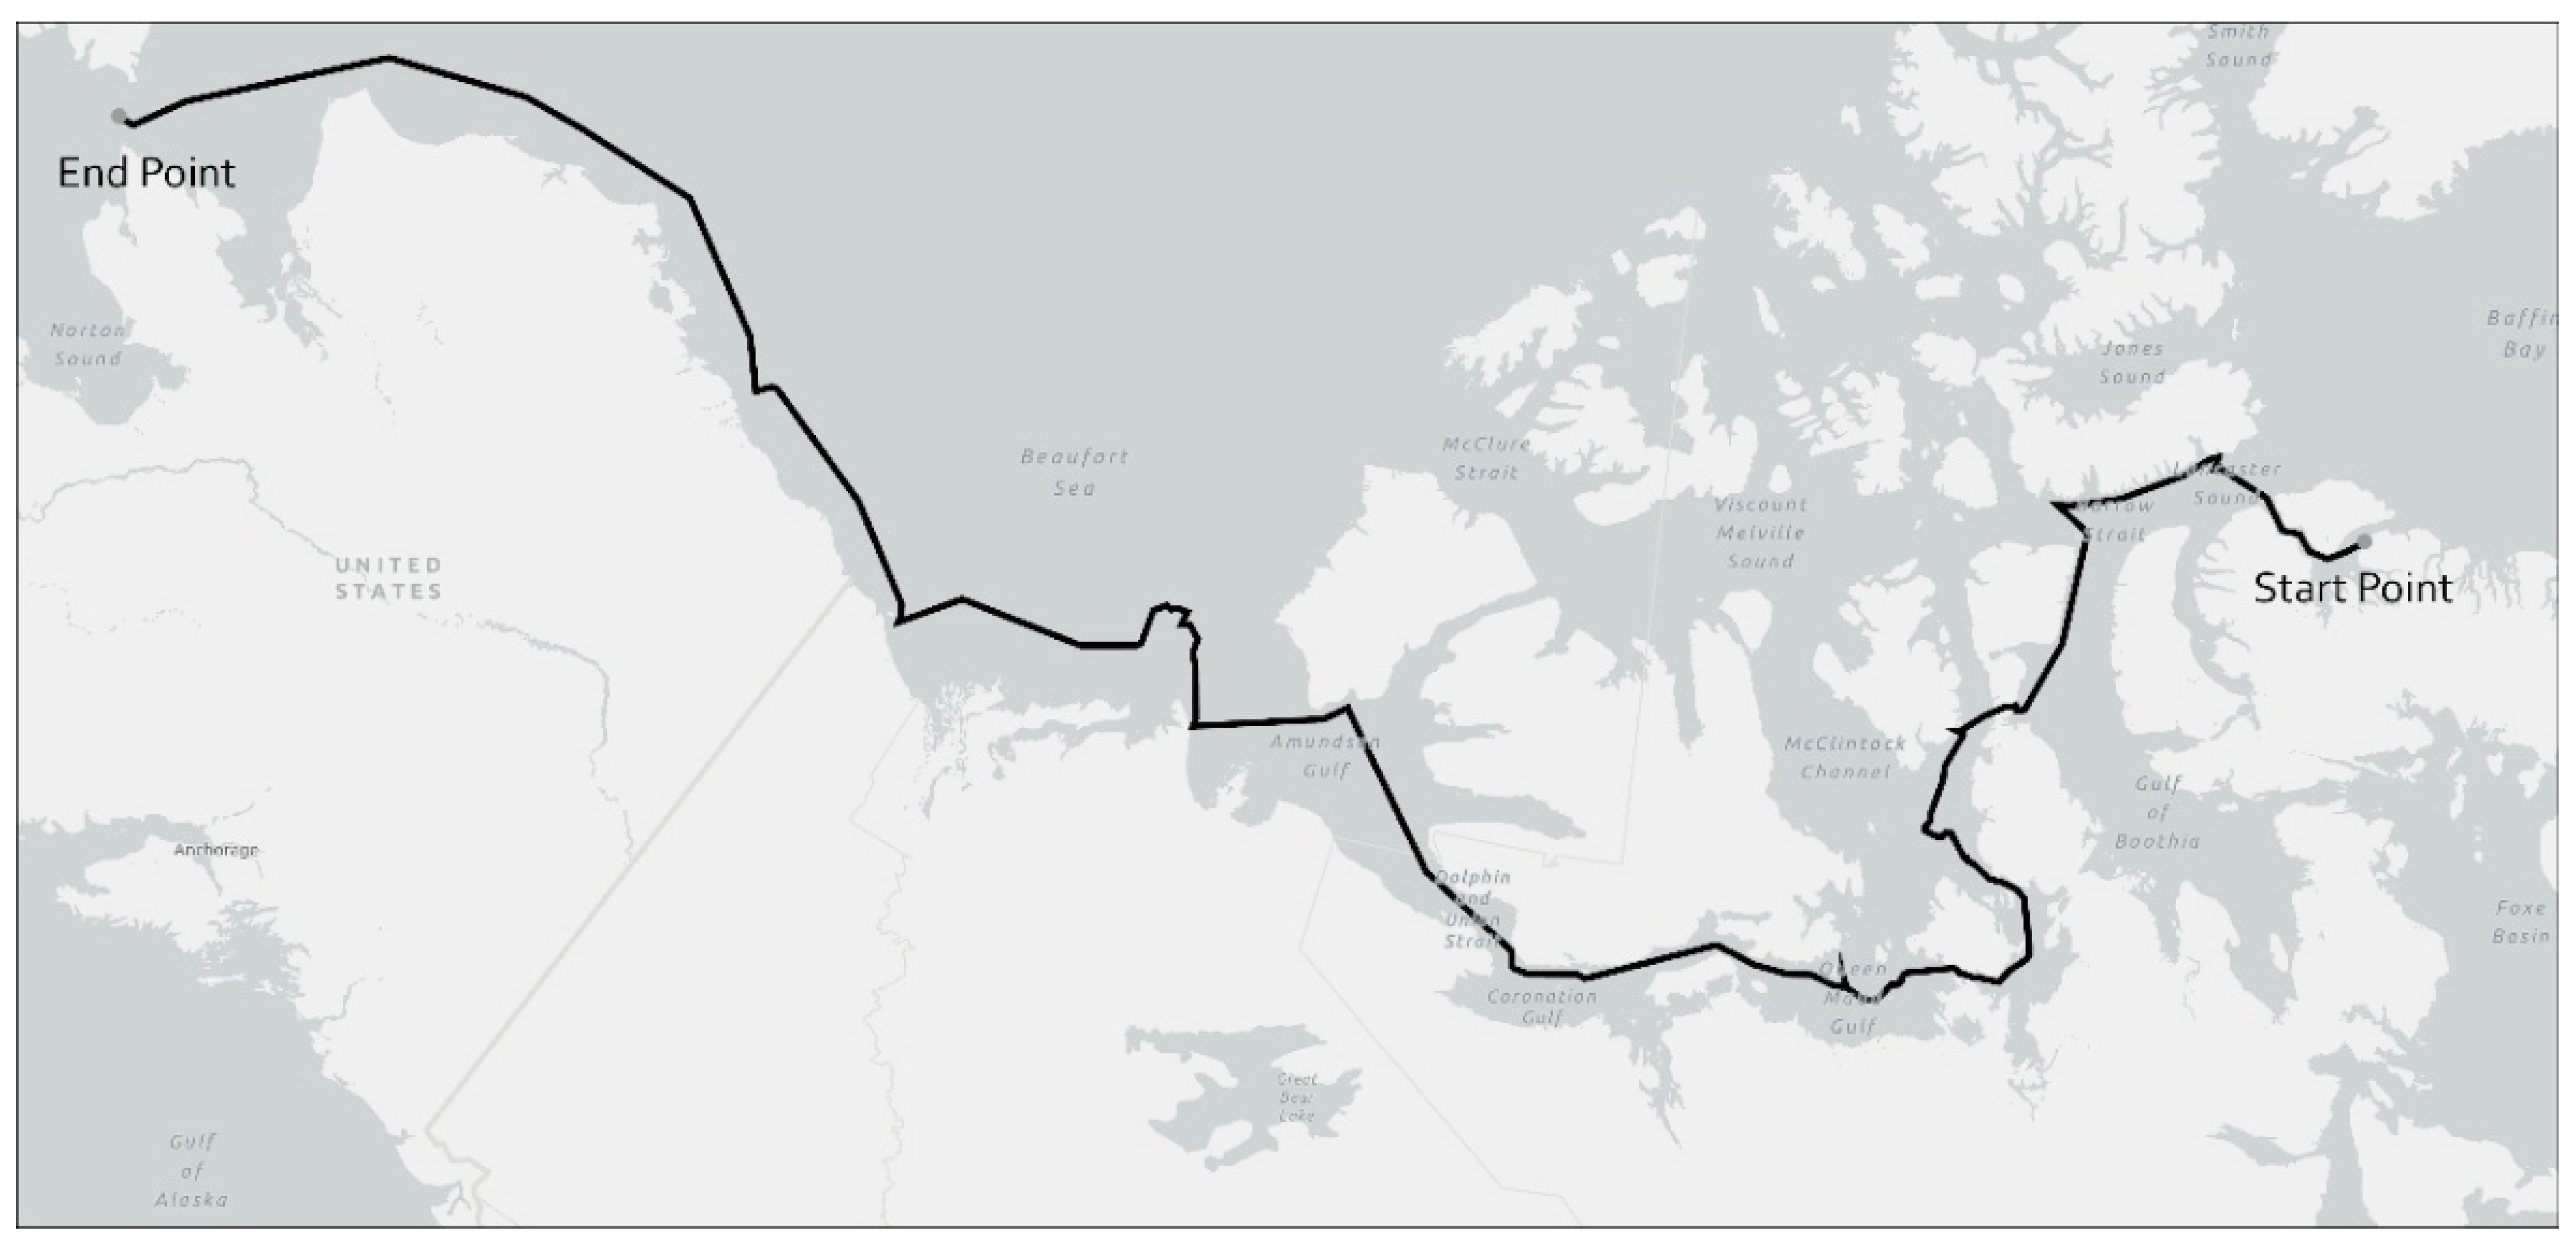
2.1. Study Area

The study area refers to the waters of the NWP through which the cruise ship line passes. The NWP refers to the general name of the route starting from the Bering Strait in the North Pacific Ocean, passing through the northern part of Alaska, the United States, eastward through the Canadian Arctic islands, entering Baffin Bay, passing through Davis Strait, and finally entering the Atlantic Ocean. According to the ice condition data of the NWP, the ice condition of Baffin Bay is good. Therefore, the study examined the waters of the NWP in the Canadian Arctic Archipelago and west to the Bering Strait.
The cruise ship route is mainly based on the information of cruise ships operating in the Northwest Passage (NWP). This information is sourced from the Arctic Shipping Traffic Database System (ASTD System) and pertains to the period from 2013 to 2019 in the International Maritime Organization Polar Code area. This study analyzed cruise routes in the Northwest Passage using hifleet.com. Considering overlaps among cruise routes, key attractions in the Northwest Passage, and the economic viability of navigation, the 1–14 September 2022 voyage of the FS IC ice-class cruise ship L’AUSTRAL was selected as the study route (Figure 1). This ensures the research findings are representative and applicable to NWP cruise routes. Additionally, conclusions on operational risks in ice-covered areas derived from low ice-class vessels are relatively conservative, which benefits vessel navigation safety. The route passes through the waters of the NWP from east to west in the following order: first from Baffin Bay into Lancaster Sound, and then west through Barrow Strait to Victoria Strait. The ship then enters Queen Mudd Bay through the narrow Simpson Strait, crossing its waters before heading into Coronado Bay. After leaving Coronado Bay, the route passes through the Dolphin and Union Strait into Amundsen Gulf. Finally, the ship sailed into the Beaufort Sea in the Arctic Ocean and into the Chukchi Sea, completing the full east-to-west passage of the NWP.

2.2. Data

Sea ice data of the NWP is provided by the U.S. National Ice Center (USNIC). Sea ice data were primarily derived from synthetic aperture radar (SAR) images of Sentinel-1 and RADARSAT, supplemented by visible light and passive microwave observations from VIIRS/MODIS. The data adopt the WGS 1984 coordinate system, with weekly updates, and have been continuously updated since 2003, showing good continuity and stability. Notably, around 2012, the USNIC adjusted sea ice concentration classification rules, affecting data continuity; however, this adjustment did not impact the data used herein.
The data follow the Sea Ice Grid Version 3 (SIGRID-3) format—a vector archive standard for sea ice charts adopted by the WMO in 1989—and provide the ice condition information required for the POLARIS methodology. For each spatial region, the data include total sea ice concentration (Total Concentration, CT), along with the concentrations (CA, CB, CC) of the three thickest sea ice types and their corresponding stages of development (SA, SB, SC) (Table 1). The sea ice stage of development determines RIVs for specific ice-class vessels in navigable waters, while concentration data quantify RIV contributions from different stages. Using the POLARIS methodology, the RIO for specific ice-class vessels in navigable waters is ultimately derived, reflecting their operational risk in such waters: a negative RIO indicates high risk, and a positive value indicates low risk.

3. Methodology and Technical Roadmap

3.1. POLARIS Method

The POLARIS methodology combines the ice class of vessels and the ice condition of navigable waters to quantitatively assess the operational risk of polar waters. The method gives the RIVs for vessels of different ice classes at different stages of sea ice development. Considering that there are often multiple thicknesses of sea ice in navigable waters, the study mainly examines the top three thicknesses of sea ice based on the ice condition data. RIO is obtained by multiplying the RIV of the top three sea ice thicknesses by their ice concentration (in tenths) and summing them up. The RIO value is used as the basis for decision-making on navigation restrictions, and the lower the value, the higher the risk [14].
To enhance the effectiveness of the POLARIS methodology in risk assessment and decision support for polar cruise operations, this study used long-term sea ice data to calculate the cruise route RIO for IC ice-class vessels along typical Northwest Passage cruise routes. Based on these results, various typical ice condition scenarios were constructed to analyze navigability under different ice conditions, identifying navigable windows and critical waters for cruise ships. This approach not only helps assess the navigational potential of Northwest Passage cruises from a macro perspective but also provides shipping companies with more practical references for route planning and navigation timing decisions.

3.1.1. Risk Index Values

In the POLARIS methodology, RIVs are jointly determined by the ship’s ice class and by the sea ice stage of development (Table 1). According to the ice data, the top three sea ice thicknesses are characterized by the developmental stage reference fields SA, SB, and SC [21,22]; the FS Ice Class IC ice class cruise ship examined in this study corresponds to the IC ship ice class in Table 2, which results in RIVs ranging from −8 to +3 depending on the different sea ice developmental stages.

3.1.2. Risk Index Outcome

The risk index outcome comprehensively considers the contribution of sea ice to operational risk at different stages of development (Equation (1)). This contribution refers to the concentration of sea ice at different stages of development within the statistical unit, which can be obtained from the CA, CB, and CC fields of ice condition data. For independent sailing vessels, the risk index result is
R I O = C 1 × R I V 1 + C 2 × R I V 2 + C 3 × R I V 3 + + C n × R I V n
where C1, C2, and C3 are the concentrations of the top three sea ice thicknesses in the statistical unit (expressed in deciles); RIV1……RIVn are the corresponding risk index values for each ice type [15].

3.2. Technical Route

The technical route of this study mainly includes three parts: data preprocessing, RIO calculation, and risk analysis (Figure 2).
(1)
Data preprocessing contains, first, special value processing. Due to data observation and other problems, there will be null values or other special values in the ice condition data, which need to be processed for the sake of subsequent calculations; secondly, the coordinate system of the data is unified. Here, the coordinates of the cruise ship route are transformed into WGS 1984 to facilitate subsequent data processing.
(2)
The RIO calculation includes the RIO calculation of the NWP waters and the RIO calculation of the cruise ship route. The RIO of the cruise ship route is obtained by spatially superimposing the cruise route with the RIO of the NWP water area, resulting in a total of 10 years and 52 weeks of cruise ship route RIO. Based on the RIO of the cruise ship route, establish statistical measures to obtain the navigable windows and critical waters of the cruise ship route.
(3)
The risks of the NWP cruise ship route are mainly analyzed based on the navigable windows and critical waters of the cruise ship route. The navigable windows refer to the start time, end time, and duration when the ice condition does not prevent ships from safely passing through the navigable waters [23], while the ice condition in the critical waters is relatively complex or serious, which has a relatively large impact on the safety of ship operation.

4. Operational Risks in the NWP

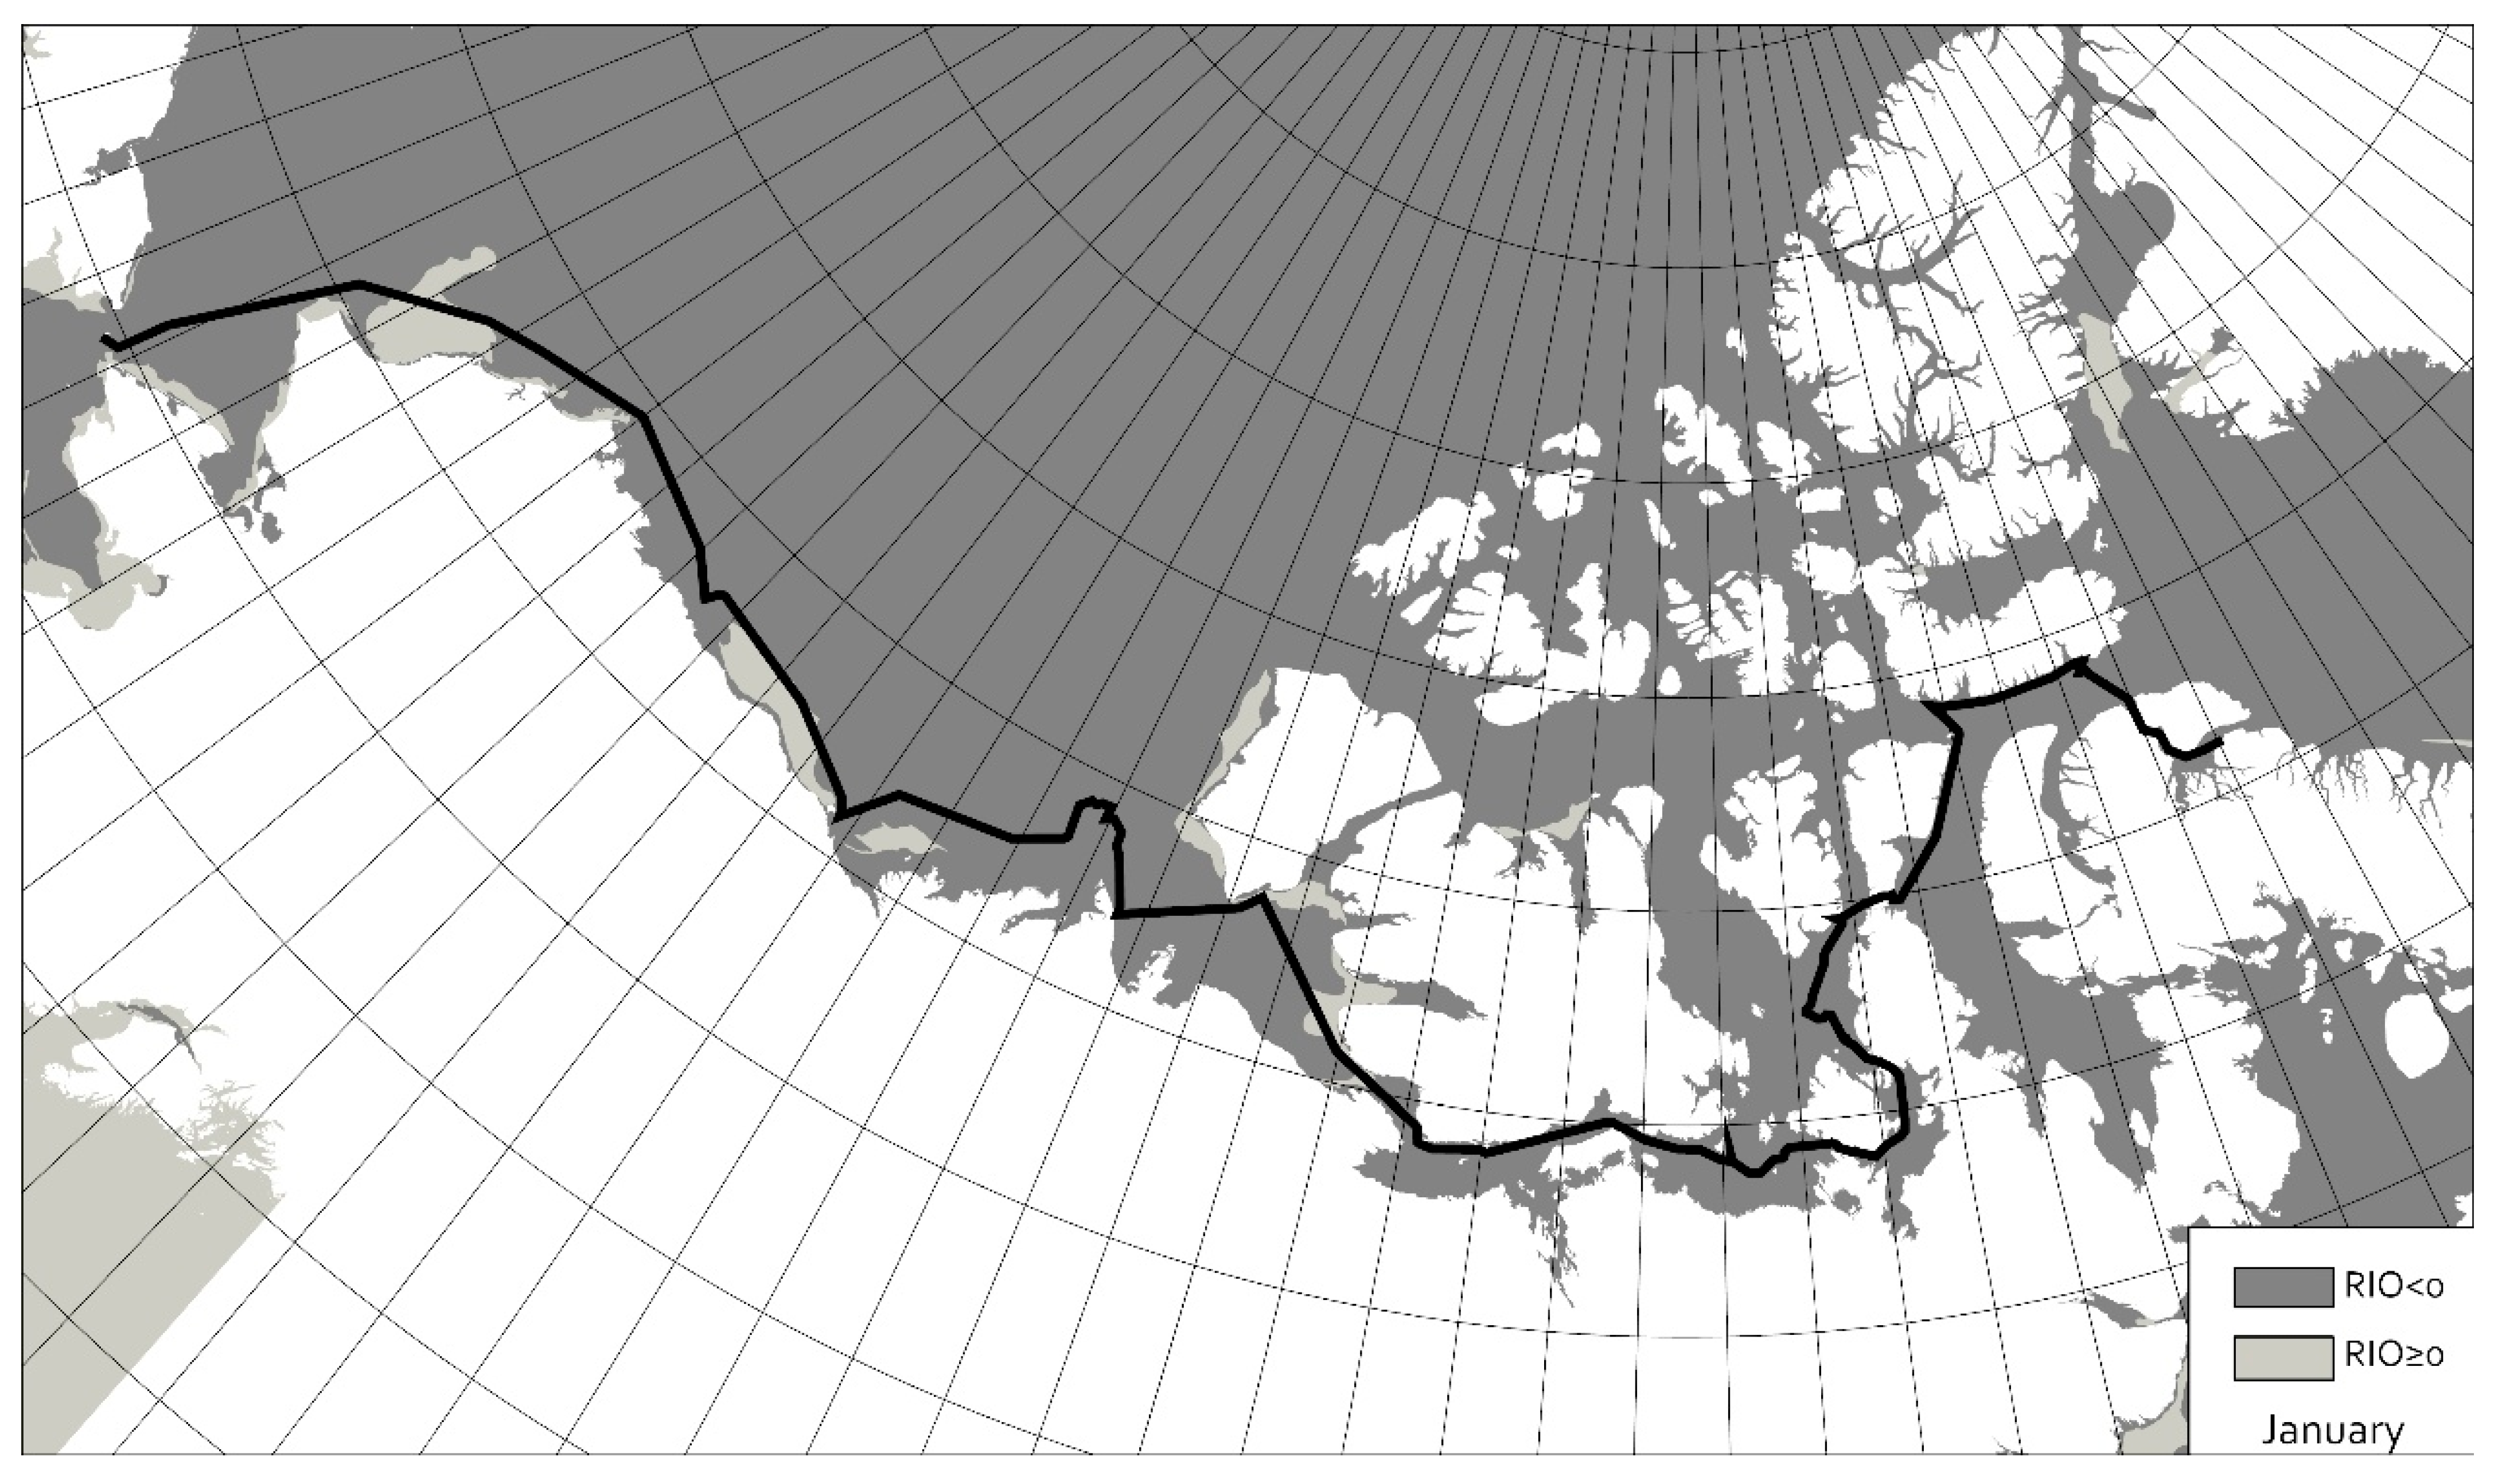
4.1. RIO in the NWP Waters

According to the technical route, in order to obtain the RIO of cruise ship routes, the RIO of the NWP should be obtained first. The study utilized the preprocessed ice condition data for IC ice class ships, and the study obtained the RIO values of the Northwest Passage waters for 10 years and 52 weeks using the POLARIS methodology. Taking the RIO of the NWP waters in the 2nd week of heavier ice conditions and the 33rd week of lighter ice conditions in 2024 as an example (Figure 3 and Figure 4), it can be seen that the ice conditions in the NWP waters vary significantly with seasons. For IC ice class vessels, the navigation conditions are poorer in winter; meanwhile, it is noted that even in the week of 2024, when the navigation conditions are better, there are still waters with RIO less than 0. From this, it can be seen that the ice conditions in the waters of the NWP not only pose challenges to cruise ship operations due to seasonal changes, but there may also be some waters that can pose risks to cruise ship operations even in summer.

4.2. Navigable Windows for Cruise Ship Route

The navigable window refers to the starting time, ending time, and duration when the sea ice conditions do not hinder the safe passage of vessels through the water area. The study examines the navigable windows of cruise ship routes under light ice conditions, normal ice conditions, and heavy ice conditions based on ten years of RIO values. For light ice conditions, the maximum RIO value over the past ten years on the cruise route is selected every week, denoted as MaxRIO; Similarly, for normal ice conditions, the average RIO of the cruise ship route over the past ten years is selected every week and recorded as MeanRIO; For heavy ice conditions, select the minimum RIO value of ten years and record it as MinRIO.
Figure 5, Figure 6 and Figure 7 show the weekly proportion of routes with RIO greater than or equal to 0 for an IC ice-class cruise ship under light, normal, and heavy ice conditions. The x-axis is the week of the year, and the y-axis is the proportion of the route. The study stipulates that when the proportion of RIO greater than or equal to 0 for a certain week exceeds 95%, it indicates that the entire route is navigable in that week; if the proportion is less than 95%, it means that the route is not navigable in that week.
According to Table 3, it can be seen that sea ice is an important factor restricting the development of cruise ship tourism in the NWP. For IC ice-class cruise ships, under normal ice conditions, the window for cruise itineraries is only two weeks, and only one voyage can be scheduled for NWP cruise tourism; meanwhile, it is also noted that under light ice conditions, the window for cruise itineraries increases significantly, which means that with global warming, cruise tourism in the NWP has great potential.

4.3. Critical Waters of Cruise Ship Routes

The study identifies critical waters on the cruise ship route based on the cruise ship route RIO that are characterized by complex or severe ice conditions. The study classified cruise line waters into four categories: navigable waters, risky waters, hazardous waters, and critical waters. Navigable waters are those on the route with MinRIO greater than or equal to 0; risky waters are those on the route where the variance of the RIO is higher than the average of the RIO variance of the entire route and the RIO contains negative values; if MaxRIO in risky waters is less than 0, then the waters are hazardous; and critical waters are the portions of the route that are in risky or hazardous waters throughout the year. Table 3 shows the critical waters on cruise routes in the Northwest Passage identified by the study, and the navigable windows for the critical waters under light ice, normal ice, and heavy ice conditions were obtained.
From Table 4, it can be known that the NWP cruise ship routes cannot be navigated under heavy ice conditions; under normal ice conditions, through the observation of the navigation weeks of critical waters, Larsen Sound and Eastern Beaufort Sea have a greater impact on the navigation of the NWP cruise ship route because the navigation weeks of these two critical waters overlap less with those of other critical waters, which has a greater impact on the cruise schedule. Under light ice conditions, there is more overlap between the navigation weeks of critical waters, and considering the navigation weeks of Barrow Strait 2, Larsen Sound, and Eastern Beaufort Sea, the NWP cruise itineraries are less impacted by the ice conditions in critical waters from late July through the end of November. Overall, Larsen Sound and Eastern Beaufort Sea are two waters to watch on the IC ice-class cruise ship itineraries in the NWP.

5. Discussion

This study identified navigable windows and critical waters for IC ice-class cruise ships in the Northwest Passage under light, normal, and heavy ice conditions, using sea ice data from 2015 to 2024 and the POLARIS method. The findings indicate that under normal ice conditions, the navigable window for cruise ships primarily occurs from mid-September to late September, aligning with the current operational period (typically weeks 36 to 40). This consistency supports the practical representativeness of the ice condition scenarios constructed in this study.
Among the critical waters identified across the three ice scenarios, Larsen Sound exhibits the lowest navigability, followed by the Eastern Beaufort Sea, Bellot Strait, and Barrow Strait. These regions are characterized by thick multi-year ice and complex ice dynamics, consistent with previous research. Melling [24] observed that multi-year ice constitutes 85–90% of the sea ice entering Larsen Sound, with an average thickness of 3–4 m and ice ridge depths of 12–16 m. The Eastern Beaufort Sea is primarily composed of thick first-year and multi-year ice: first-year ice reaches an average thickness of 1.5 m by late winter, while multi-year ice exceeds 3 m [25]. Bellot Strait, known as the “bottleneck” of the Northwest Passage, accumulates second-year and multi-year ice from the Canadian Arctic Archipelago throughout the year, with late-winter measurements averaging about 3.4 m [26]. Barrow Strait is dominated by first-year ice, but complex conditions arise from the continuous influx of multi-year ice driven by winds and currents, resulting in an average ice thickness of about 2.2 m [27].
Consistent with these observations, other studies have corroborated the complexity and severity of ice conditions in key segments of Northwest Passage cruise routes. Cook, Howell, Babb et al. identified Larsen Sound as a key segment of the southern route through the Canadian Arctic Archipelago [8,9,28,29]. Using Canadian Ice Service (CIS) ice charts and the POLARIS methodology, Cook et al. found that the navigable season in the Eastern Beaufort Sea has shortened significantly in recent years—from 20–25 weeks in 2007–2011 to 10–15 weeks in 2017–2021—noting that this waterway functions as a “Throat Point” outside the Arctic Canadian Archipelago [9]. Liu et al. analyzed navigable windows across Northwest Passage segments and concluded that Bellot Strait is the critical bottleneck for vessel navigation [30]. Using ADCP and IPS observational data, Prinsenberg attributed the complex ice conditions in Barrow Strait to ocean current disparities between its northern and southern shores [31].
This study further observes that certain tourist attractions, such as Radstock Bay and Beechey Island, are located near Barrow Strait—waters critical to navigation. In practical route planning, scheduling visits to these sites may prolong a vessel’s stay in ice-prone areas, thereby heightening navigational risks. During years with normal ice conditions, while a navigable window exists, its duration is limited; cruise operators must thus balance sightseeing needs against navigational safety. If Barrow Strait and the Eastern Beaufort Sea are avoided, alternative routes are available, such as the passage through Hudson Strait → Foxe Channel → Foxe Basin → Fury and Hecla Strait → Gulf of Boothia. This alternative offers an average navigable period of 111 days and a mean water depth of approximately 10 m, rendering it suitable for shallow-draft vessels [30].
Methodologically, this study introduces the POLARIS methodology to polar cruise risk assessment, integrating long-term sea ice data to develop a risk analysis framework specific to polar cruise operations. This approach not only quantifies navigable windows under varying ice conditions but also identifies critical waters with substantial impacts on navigational safety, thereby providing a pragmatic decision-support tool for cruise operators. However, it is important to note that the POLARIS methodology employed in this study relies on historical sea ice data and does not account for real-time sea ice dynamics, meteorological conditions, or ship maneuverability. Future applications could enhance the accuracy and timeliness of risk assessments by integrating real-time sea ice charts, weather forecasts, and vessel movement data.

6. Conclusions

With global warming, polar tourism has continued to gain momentum. The Northwest Passage, renowned for its unique natural landscapes and ecosystems, has emerged as a key route for polar cruises. However, due to complex ice conditions, navigational risks along this route remain high—particularly for cruise operations, which must balance safety, passenger experience, and route flexibility. Systematically assessing the impact of sea ice on cruise operations, and identifying navigable windows and critical waters, is therefore crucial for enhancing polar cruise risk management, optimizing route design, and promoting the sustainable development of polar tourism.
This study focused on IC ice-class cruise ships, utilizing sea ice data from 2015 to 2024, and employed the IMO recommended POLARIS methodology to develop three typical ice condition scenarios: light, normal, and heavy ice conditions. It systematically assessed the navigable windows and critical waters of the Northwest Passage cruise route. The findings indicate that under light ice conditions, the navigable window for IC ice-class cruise ships spans from mid-July to early December; under normal conditions, it is concentrated in mid- to late September, lasting roughly two weeks; and under heavy conditions, the route is impassable. Critical waters primarily encompass Larsen Sound, Barrow Strait, Bellot Strait, and the Eastern Beaufort Sea. Among these, Larsen Sound and the Eastern Beaufort Sea exhibit the most complex ice conditions, with their navigation periods overlapping minimally with those of other waters—significantly impacting voyage planning. Additionally, the study found that some tourist attractions lie near critical waters. Even in years with normal ice conditions, while a navigable window exists, the available time is limited; if these waters must be avoided, alternative routes may be considered.
The main contribution of this study lies not only in applying the POLARIS methodology to polar cruise risk assessment but also in proposing a POLARIS-based technical approach to identify navigable windows and critical waters. These findings can serve as a basis for cruise companies to develop flexible itineraries and provide scientific support for relevant authorities in formulating polar tourism management policies. Future research could extend to other scenic sections of the NWP, incorporating performance characteristics of vessels across different ice classes to optimize route design. It is further recommended that Arctic waters be treated as an integrated system, with comprehensive consideration of sea-ice conditions, meteorological factors, and ecological concerns, to establish a more systematic risk assessment framework for polar cruises—thereby enhancing the overall safety and sustainability of polar tourism.

Author Contributions

Conceptualization, L.M. and J.F.; methodology, L.M. and J.F.; software, J.F. and X.M.; validation, L.M., J.X., and S.Q.; formal analysis, X.M., J.X., S.Q., and Y.L.; investigation, L.C., B.X. and B.Y.; resources, L.C. and X.L.; data curation, B.X. and B.Y.; writing—original draft preparation, J.F.; writing—review and editing, L.M., J.F., and J.X.; visualization, S.Q., B.X., and B.Y.; supervision, L.M., J.X., L.C., and X.M.; project administration, L.M., J.X., and X.M.; funding acquisition, L.M. All authors have read and agreed to the published version of the manuscript.

Funding

This research was funded by the Scientific Research Start-up Funds of Guangdong Ocean University: Research on the Navigability of Arctic Shipping Routes Based on Sea Ice Condition Analysis, grant number 060302132106, the Guangdong Provincial Key Laboratory of Intelligent Equipment for South China Sea Marine Ranching, grant number 080508132401, Guangdong Basic and Applied Basic Research Foundation, grant numbers 2025A1515010886, 2023A1515011212, the Special Projects in Key Fields of Ordinary Universities in Guangdong Province, grant number 2022ZDZX3005, the Shenzhen Science and Technology Program, grant number JCYJ20220530162200001, Postgraduate Education Innovation Project of Guangdong Ocean University, grant numbers 202421, 202539, 202551.

Data Availability Statement

The sea ice condition data can be downloaded from https://usicecenter.gov/Products/ArcticData (accessed on 12 January 2025).

Conflicts of Interest

The authors declare no conflicts of interest.

References

  1. Larsen, J.N.; Fondahl, G. (Eds.) Arctic Human Development Report: Regional Processes and Global Linkages; Nordic Council of Ministers: Copenhagen, Denmark, 2015. [Google Scholar]
  2. Lasserre, F.; Têtu, P.-L. The Cruise Tourism Industry in the Canadian Arctic: Analysis of Activities and Perceptions of Cruise Ship Operators. Polar Rec. 2015, 51, 24–38. [Google Scholar] [CrossRef]
  3. Stewart, E.J.; Howell, S.E.; Draper, D.; Yackel, J.; Tivy, A. Sea ice in Canada’s Arctic: Implications for cruise tourism. Arctic 2007, 60, 370–380. [Google Scholar] [CrossRef]
  4. Dawson, J.; Johnston, M.E.; Stewart, E.J. Governance of Arctic Expedition Cruise Ships in a Time of Rapid Environmental and Economic Change. Ocean. Coast. Manag. 2017, 89, 88–99. [Google Scholar] [CrossRef]
  5. Long, Z.; Ren, X.; Li, X. Arctic Adventure Cruise Shipping Network: Itinerary Characteristics and Spatial Structure. Polar Rec. 2023, 59, e27. [Google Scholar] [CrossRef]
  6. Palma, D.; Varnajot, A.; Dalen, K.; Basaran, I.K.; Brunette, C.; Bystrowska, M.; Nowicki, R.C.; Ronge, T.A. Cruising the Marginal Ice Zone: Climate Change and Arctic Tourism. Polar Geogr. 2019, 42, 215–235. [Google Scholar] [CrossRef]
  7. The North West Passage. Available online: https://thenorthwestpassage.info/ (accessed on 13 June 2025).
  8. Howell, S.E.; Tivy, A.; Yackel, J.J.; McCourt, S. Multi-Year Sea-Ice Conditions in the Western Canadian Arctic Archipelago Region of the Northwest Passage: 1968–2006. Atmos. Ocean. 2008, 46, 229–242. [Google Scholar] [CrossRef]
  9. Cook, A.J.; Dawson, J.; Howell, S.E.; Holloway, J.E.; Brady, M. Sea Ice Choke Points Reduce the Length of the Shipping Season in the Northwest Passage. Commun. Earth Environ. 2024, 5, 362. [Google Scholar] [CrossRef]
  10. Dawson, J.; Cook, A.; Holloway, J.; Copland, L. Analysis of Changing Levels of Ice Strengthening (Ice Class) among Vessels Operating in the Canadian Arctic over the Past 30 Years. Arctic 2022, 75, 413–430. [Google Scholar] [CrossRef]
  11. Howell, S.E.; Brady, M. The Dynamic Response of Sea Ice to Warming in the Canadian Arctic Archipelago. Geophys. Res. Lett. 2019, 46, 13119–13125. [Google Scholar] [CrossRef]
  12. Fu, S.; Yu, Y.; Chen, J.; Xi, Y.; Zhang, M. A Framework for Quantitative Analysis of the Causation of Grounding Accidents in Arctic Shipping. Reliab. Eng. Syst. Saf. 2022, 226, 108706. [Google Scholar] [CrossRef]
  13. Johannsdottir, L.; Cook, D.; Arruda, G.M. Systemic Risk of Cruise Ship Incidents from an Arctic and Insurance Perspective. Elem. Sci. Anthr. 2021, 9, 00009. [Google Scholar] [CrossRef]
  14. Maritime Safety Committee (MSC). Guidance on Methodologies for Assessing Operational Capabilities and Limitations in Ice; Tech. Rep. MSC.1/Circ. 1519; International Maritime Organization: London, UK, 2016; Available online: https://www.nautinst.org/static/uploaded/2f01665c-04f7-4488-802552e5b5db62d9.pdf (accessed on 12 January 2025).
  15. Ma, L.; Qian, S.; Mou, X.; Fan, J.; Xu, J.; Cao, L.; Xu, B.; Yao, B.; Li, X.; Li, Y. Comparative Research on Vessel Navigability on the Northern Sea Route Based on the NSR Admission Criteria and POLARIS Methodology. J. Mar. Sci. Eng. 2025, 13, 1282. [Google Scholar] [CrossRef]
  16. Solski, J.J. The Polar Code Process and Sovereignty Bargains: Comparing the Approaches of Canada and Russia to POLARIS. Ocean. Dev. Int. Law 2023, 54, 111–134. [Google Scholar] [CrossRef]
  17. Stoddard, M.A.; Etienne, L.; Fournier, M.; Pelot, R.; Beveridge, L. Making Sense of Arctic Maritime Traffic Using the Polar Operational Limits Assessment Risk Indexing System (POLARIS). IOP Conf. Ser. Earth Environ. Sci. 2016, 34, 012034. [Google Scholar] [CrossRef]
  18. Lee, H.W.; Roh, M.I.; Kim, K.S. Ship Route Planning in Arctic Ocean Based on POLARIS. Ocean. Eng. 2021, 234, 109297. [Google Scholar] [CrossRef]
  19. Wang, C.; Ding, M.; Yang, Y.; Wei, T.; Dou, T. Risk Assessment of Ship Navigation in the Northwest Passage: Historical and Projection. Sustainability 2022, 14, 5591. [Google Scholar] [CrossRef]
  20. Chen, J.L.; Kang, S.C.; Wu, A.D.; Hu, D.D. Impacts of 1.5 °C Global Warming on Hydrological Conditions of Navigation along the Northern Sea Route and Northwest Passage. Adv. Clim. Change Res. 2023, 14, 904–912. [Google Scholar] [CrossRef]
  21. World Meteorological Organization (WMO). Intergovernmental Oceanographic Commission of the United Nations Educational, Scientific and Cultural Organization (IOC-UNESCO) SIGRID-3: A Vector Archive Format for Sea Ice Charts. Available online: https://library.wmo.int/records/item/37171-sigrid-3-a-vector-archive-format-for-sea-ice-charts (accessed on 30 October 2024).
  22. Ma, L.; Qian, S.; Dong, H.; Fan, J.; Xu, J.; Cao, L.; Xu, S.; Li, X.; Cai, C.; Huang, Y.; et al. Navigability of Liquefied Natural Gas Carriers Along the Northern Sea Route. J. Mar. Sci. Eng. 2024, 12, 2166. [Google Scholar] [CrossRef]
  23. Ma, L.; Li, Z.H.; Chen, G.; Li, Y. Research on the navigability of the Arctic Northeast Route based on sea ice conditions during the passage of M/V Yong Sheng. Chin. J. Polar Res. 2018, 30, 173–185. [Google Scholar] [CrossRef]
  24. Melling, H. Thickness of Multi-Year Sea Ice on the Northern Canadian Polar Shelf: A Second Look after 40 Years. Cryosphere 2022, 16, 3181–3197. [Google Scholar] [CrossRef]
  25. Babb, D.G.; Landy, J.C.; Barber, D.G.; Galley, R.J. Winter Sea Ice Export from the Beaufort Sea as a Preconditioning Mechanism for Enhanced Summer Melt: A Case Study of 2016. J. Geophys. Res. Oceans 2019, 124, 6575–6600. [Google Scholar] [CrossRef]
  26. Melling, H. Sea Ice of the Northern Canadian Arctic Archipelago. J. Geophys. Res. 2002, 107, 3181. [Google Scholar] [CrossRef]
  27. Haas, C.; Howell, S.E.L. Show Modal Thicknesses of 1.8–2.0 m in Barrow Strait and Frequent Ridges > 4 m Thick-Extreme Deformations on Par with Larsen Strait. Geophys. Res. Lett 2011, 42, 7673–7680. [Google Scholar] [CrossRef]
  28. Howell, S.E.L.; Babb, D.G.; Landy, J.C.; Brady, M. Multi-Year Sea Ice Conditions in the Northwest Passage: 1968–2020. Atmos.-Ocean. 2022, 61, 202–216. [Google Scholar] [CrossRef]
  29. Babb, D.G.; Galley, R.J.; Howell, S.E.L.; Landy, J.C.; Stroeve, J.C.; Barber, D.G. Increasing Multiyear Sea Ice Loss in the Beaufort Sea: A New Export Pathway for the Diminishing Multiyear Ice Cover of the Arctic Ocean. Geophys. Res. Lett. 2022, 49, e2021GL097595. [Google Scholar] [CrossRef]
  30. Liu, X.-H.; Ma, L.; Wang, J.-Y.; Wang, Y.; Wang, L.-N. Navigable Windows of the Northwest Passage. Polar Sci. 2017, 13, 91–99. [Google Scholar] [CrossRef]
  31. Prinsenberg, S.; Pettipas, R. Ice and Ocean Mooring Data Statistics from Barrow Strait, Central Section of the Northwest Passage in the Canadian Arctic Archipelago. Int. J. Offshore Polar Eng. 2008, 18, 1–5. [Google Scholar]
Figure 1. Cruise lines passing through the NWP.
Jmse 13 01335 g001
Figure 2. Technical roadmap.
Jmse 13 01335 g002
Figure 3. RIO in the NWP waters, Week 33, 2024.
Jmse 13 01335 g003
Figure 4. RIO in the NWP waters, Week 2, 2024.
Jmse 13 01335 g004
Figure 5. Proportion of cruise ships with RIO greater than or equal to zero for each week of the year under light ice conditions.
Jmse 13 01335 g005
Figure 6. Proportion of cruise ships with RIO greater than or equal to zero for each week of the year under normal ice conditions.
Jmse 13 01335 g006
Figure 7. Proportion of cruise ships with RIO greater than or equal to zero for each week of the year under heavy ice conditions.
Jmse 13 01335 g007
Table 1. Sea ice data attributes.
FIDCTCACBCCSASBSC
0923070−99591−9
1923070−99591−9
2923070−99591−9
392−9−9−991−9−9
492−9−9−991−9−9
Table 2. Risk index values.
Ice ClassIFNGGWTNFY1TNFY2MFY1MFYTKFYSYLMY-2.5HMY
PC1333322222211
PC2333322222110
PC333332222210−1
PC43333222210−1−2
PC5333322110−1−2−2
PC632222110−1−2−3−3
PC73222110−1−2−3−3−3
IA Super3222210−1−2−3−4−4
IA322210−1−2−3−4−5−5
IB32210−1−2−3−4−5−6−6
IC3210−1−2−3−4−5−6−7−8
No Ice Class310−1−2−3−4−5−6−7−8−8
Notes: IF—ice-free; N—new ice; G—gray ice; GW—gray white ice; TNFY1—thin first-year ice, 1st stage; TNFY2—thin first-year ice, 2nd stage; MFY1—medium first-year ice, less than 1 m thick; MFY—medium first-year ice; TKFY—thick first-year Ice; SY—second-year Ice; LMY-2.5—light multi-year ice, less 2.5 m thick; HMY—heavy multi-year ice [21].
Table 3. According to Figure 5, Figure 6 and Figure 7, we can obtain the navigable windows of the IC ice-class cruise ship route under different ice conditions.
Ice ConditionsNavigable Start WeekNavigable End WeekNumber of Navigable Weeks
Light ice conditionsWeek 29Week 4921
Normal ice conditionsWeek 38Week 392
Heavy ice conditions--0
Note: “-” means not navigable.
Table 4. Critical waters on the NWP cruise ship route, and their navigable windows.
Critical WatersEast & West BoundariesNavigable Period Under Light Sea Ice ConditionsNavigable Period Under Normal Sea Ice ConditionsNavigable
Period Under Heavy Sea Ice Conditions
Barrow strait 189°24.53′ W 74°43.00′ N & 89°43.78′ W 74°44.22′ NWeek (1, 10–12, 16–52) (total:41 weeks)Week (27–44) (total: 18 weeks)Week (43, 44) (total: 2 weeks)
Barrow strait 289°61.01′ W 74°04.83′ N & 90°46.50′ W 74°43.96′ NWeek (23–48) (total:26 weeks)Week (34, 37–40) (total: 5 weeks)-
Bellot strait93°99.22′ W 71°93.13′ N & 94°05.27′ W 71°93.17′ NWeek (27–51) (total:25 weeks)Week (30–32, 34–44) (total: 14 weeks)-
Larsen Sound96°64.15′ W 69°97.02′ N & 97°96.43′ W 70°86.35′ NWeek (30–49) (total:20 weeks)Week (38, 41) (total: 2 weeks)-
Eastern Beaufort Sea128°32.48′ W 71°30.88′ N & 130°34.40′ W 71°09.40′ NWeek (1, 4, 9, 21–48) (total:31 weeks)Week (38, 39, 44) (total: 3 weeks)-
Note: “-” means not navigable.
Disclaimer/Publisher’s Note: The statements, opinions and data contained in all publications are solely those of the individual author(s) and contributor(s) and not of MDPI and/or the editor(s). MDPI and/or the editor(s) disclaim responsibility for any injury to people or property resulting from any ideas, methods, instructions or products referred to in the content.

