Article

Alternative Fuels in the Maritime Industry: Emissions Evaluation of Bulk Carrier Ships

by
Diego Díaz-Cuenca
1,2,*,
Antonio Villalba-Herreros
1,2,
Teresa J. Leo
1,2 and
Rafael d’Amore-Domenech
1,2
1
Departamento de Arquitectura, Construcción y Sistemas Oceánicos y Navales, Escuela Técnica Superior de Ingenieros Navales, Universidad Politécnica de Madrid, Avenida de la Memoria 4, 28040 Madrid, Spain
2
Grupo de Investigación UPM Pilas de Combustible, Tecnología del Hidrógeno y Motores Alternativos (PiCoHiMA), Escuela Técnica Superior de Ingenieros Navales, Universidad Politécnica de Madrid, Avenida de la Memoria 4, 28040 Madrid, Spain
*
Author to whom correspondence should be addressed.
J. Mar. Sci. Eng. 2025, 13(7), 1313; https://doi.org/10.3390/jmse13071313
Submission received: 4 June 2025 / Revised: 28 June 2025 / Accepted: 1 July 2025 / Published: 8 July 2025

Abstract

The maritime industry remains a significant contributor to global greenhouse gas (GHG) emissions. In this article, a systematic study has been performed on the alternative fuel emissions of large cargo ships under different route scenarios and propulsion systems. For this purpose, a set of key performance indicators (KPIs) are evaluated, including total equivalent CO2 emissions (CO2eq), CO2eq emissions per unit of transport mass and CO2eq emissions per unit of transport mass per distance. The emissions analysis demonstrates that Liquified Natural Gas (LNG) paired with Marine Gas Oil (MGO) emerges as the most viable short-term solution in comparison with the conventional fuel oil propulsion. Synthetic methanol (eMeOH) paired with synthetic diesel (eDiesel) is identified as the most promising long-term fuel combination. When comparing the European Union (EU) emission calculation system (FuelEU) with the International Maritime Organization (IMO) emission metrics, a discrepancy in emissions reduction outcomes has been observed. The IMO approach appears to favor methanol (MeOH) and liquefied natural gas (LNG) over conventional fuel oil. This is attributed to the fact that the IMO metrics do not consider unburned methane emissions (methane slip) and emissions in the production of fuels (Well-to-Tank).

1. Introduction

Greenhouse gases (GHGs) such as carbon dioxide (CO2), alongside pollutants like nitrogen oxides (NOx) and sulfur oxides (SOx), contribute to global warming, air pollution, and adverse health effects, particularly within the maritime industry [1]. This sector remains a significant contributor to GHG emissions. Currently, international shipping accounts for nearly 3% of global CO2 emissions, which, if left unchecked, is projected to rise as global trade increases. In addition to CO2, the maritime industry is responsible for approximately 15% of global NOx emissions and 13% of SOx emissions [2], pollutants that are primarily released by the combustion of heavy fuel oils used by large ships. NOx emissions contribute to smog, fine particulate matter, acid rain, and respiratory and cardiovascular health issues. SOx emissions lead to the formation of sulfuric acid, contributing to acid rain and severe respiratory problems in coastal regions [3]. Despite regulatory efforts from the International Maritime Organization (IMO) 2020, like the Global Sulfur Cap, which limits the sulfur content in marine fuels to 0.5% in mass fraction, the industry still significantly impacts global air quality and environmental health [4].
The IMO has taken significant steps toward decarbonizing the maritime industry through regulatory frameworks such as the Energy Efficiency Design Index (EEDI) [5], the Energy Efficiency Existing Ship Index (EEXI) [6] and the Carbon Intensity Indicator (CII) [7]. The EEDI, introduced in 2011, requires new ships to meet progressively stricter energy efficiency standards, reducing CO2 emissions per ton-mile through optimized ship design [5]. Building on this, the EEXI, launched in 2023, applies similar efficiency standards to existing ships, pushing for retrofitting and operational improvements to align older vessels with modern energy efficiency requirements [6]. The CII, also introduced in 2023, mandates that ships actively measure, report, and improve their operational carbon intensity annually [7]. These combined measures represent critical milestones in the IMO efforts to reduce GHGs from shipping by at least 50% by 2050 compared to 2008 levels, with the aim of achieving full decarbonization of the sector [8].
This article addresses a study in emission reduction for large cargo ships by systematically comparing combinations of alternative fuels across various propulsion systems and route scenarios. For a comprehensive understanding of the problem, the introductory section analyzes emissions in the maritime sector and provides the rationale for the selection of the cargo vessels used in this study. Furthermore, a series of considerations related to marine fuels will be discussed, including economic considerations, safety aspects and refueling infrastructure.
Figure 1 presents the distribution of CO2 emissions of various types of vessels by category. It highlights that approximately 60% of total emissions originate from vessels transporting dry bulk and liquid cargo. Among these, bulk carriers (vessels transporting dry bulk) are the most significant contributors, accounting for 27.5% of overall emissions. This underscores the substantial environmental impact of ships transporting large masses of unpackaged goods (minerals, grain, or coal) within the maritime sector. In this sense, the iron ore market, which moves over 1.5 thousand million tons annually through global maritime trade, accounting for approximately 13% of the total seaborne cargo transported worldwide [9] (more than 30% of the total dry bulk), is the main pollutant within dry bulks. This market is increasingly prioritizing alternative fuels to reduce carbon emissions [10].
Ships dedicated solely to the transport of iron ore represent approximately 2% of the global merchant bulk carrier fleet by number (255 vessels) but approximately 20% of total Death Weight Tonnage (DWT) [12]. Due to their large size and high fuel consumption, they contribute significantly to maritime pollution. Ore carriers are defined as bulk carriers capable of transporting cargo with a minimum density capacity of 3.0 t/m3 [13]. They are classified under the notation “Ore Carrier” [14]. Currently, these vessels are subdivided into three major segments based on their DWT: 250,000, 325,000 and 400,000 tons [15]. The first segment primarily operates in traffic from Australia, while the two largest segments predominantly transport cargo from Brazil and are denominated very large ore carriers (VLOC). The installation of renewable fuels in ore carriers is highly suitable due to several factors inherent to these vessels [16,17]. Ore carriers, with their large cargo holds and ample empty spaces, provide significant flexibility for the integration of alternative fuels storage and systems [18]. Their fixed routes, often between major mining regions and key ports, enable consistent refueling and operational efficiency [19]. This combination of spatial advantages and operational characteristics makes alternative fuels a viable and effective choice for enhancing the environmental performance of ore carriers [16,18,19,20]. To date, several studies have been conducted on the impact, installation, life cycle and requirements of alternative fuels for ships [21,22]. However, few have focused on ore carriers specifically. Technical challenges associated with the installation are resolved, although the potential emission reduction remains unresolved [23,24]. Additionally, ore carriers are currently having to modify their operational profile to comply with the IMO energy efficiency regulations. Ore carriers that were originally designed to operate at 14.5 knots are now running at 12 knots due to their continued reliance on conventional fuel oil for propulsion [25]. To restore their operational speeds, a transition to alternative fuels is necessary.
The objectives of this article are as follows. First, to provide a solid background on alternative fuels and their role in reducing greenhouse gas emissions in shipping. Second, to quantify equivalent CO2 emissions (CO2eq). CO2 refers only to carbon dioxide emissions, while CO2eq includes all greenhouse gases expressed in CO2 equivalents based on their global warming potential. The study also aims to calculate EEDI and CII values for the three segments of ore carriers under different fuel combinations and operational profiles.
To achieve this purpose, the article is structured to provide a thorough analysis of alternative fuels within the iron ore market. Section 1 (Introduction) presents the problem statement and outlines the context motivating this study. Section 2 provides a solid background on alternative fuels, including their economic considerations, safety aspects, and refueling infrastructure. Section 3 describes the methodology in detail, covering the base vessel specifications, route scenarios, and emission calculations. Section 4 presents the results and discusses the comparative performance of different fuel options. Finally, Section 5 summarizes the key findings and offers conclusions on the potential of green methanol and green LNG to contribute to maritime decarbonization.

2. Alternative Fuels in the Maritime Sector

The maritime sector has traditionally relied on Heavy Fuel Oil (HFO) and Marine Diesel Oil (MDO) as its primary energy source contributing significantly to GHGs, air pollution and environmental degradation [26,27]. In response to stricter international regulations, such as those set by the IMO, aimed at reducing harmful emissions, the industry has been compelled to explore cleaner and more sustainable fuel alternatives. Two of the most promising options for large cargo ships that have emerged are LNG and MeOH [4,28,29]. MeOH offers a promising solution to reducing greenhouse gas emissions and air pollutants in the maritime industry [30,31]. As a low-carbon fuel, it significantly lowers CO2 emissions compared to conventional marine fuels, while its cleaner combustion process reduces NOx and virtually eliminates SOx emissions [32]. Thus, transitioning to methanol could help mitigate both climate change and air quality issues [28]. Furthermore, the adoption of methanol as a marine fuel can improve a vessel performance under the CII and EEDI [33], as it directly enhances the vessel carbon intensity and overall energy efficiency, aligning with the IMO decarbonization targets, apart from a potential economic benefit for the shipowner [21]. Despite efforts to introduce these fuels, the general trend is to replace HFO with very low sulfur fuel oil (VLSFO) and MDO with Marine Gas Oil (MGO). In addition, ships are reducing their sailing speeds to lower fuel consumption, taking advantage of the fact that power requirements increase with the cube of the speed [34].
To achieve full decarbonization, the available options for new alternative fuels must be explored. This work studies ELNG, bioLNG, eMethanol, and bioMethanol. EDiesel and biodiesel are examined as well, although their application in maritime transport appears more challenging compared to the other options [35]. ELNG or eMethane, is a synthetic form of liquefied natural gas produced by combining renewable hydrogen with carbon dioxide through a methanation process, creating methane that is then cooled to a liquid state for storage and transport [36]. BioLNG, also referred to as bioMethane liquefied natural gas, is derived from biogas produced through the anaerobic digestion of organic waste materials, such as agricultural residues, food waste, or sewage. This biogas, primarily composed of methane, is purified and liquefied to create bioLNG [37]. EMethanol is a synthetic methanol produced by combining renewable hydrogen with captured carbon dioxide, resulting in a low-carbon fuel that can serve multiple industrial applications. Like other synthetic fuels, eMethanol aims to be carbon-neutral when produced using renewable energy sources [38]. BioMethanol is produced from biomass sources, including agricultural waste, forestry residues, or municipal waste. Through thermochemical processes, such as gasification, these organic materials are converted into methanol [39]. EDiesel, also known as synthetic diesel, is produced through a process that combines renewable hydrogen, typically obtained from water electrolysis using renewable electricity, with carbon dioxide captured from the atmosphere or industrial sources. EDiesel can be used in conventional diesel engines without requiring modifications, making it a promising option for reducing greenhouse gas emissions in sectors where electrification presents significant challenges [40]. BioDiesel is a renewable fuel produced from organic sources such as vegetable oils, animal fats, or recycled cooking oils. Through a process called transesterification, the fatty acids in these oils are separated from glycerin, resulting in a fuel with similar properties to petroleum diesel [41]. The characteristics of each previously mentioned fuel have been sourced from the EU JEC Well-to-Tank Report v5 [42], which details emissions associated with the production of each fuel type. This report provides both emission ranges and typical emissions figures for the production process of each fuel.
From an economic point of view, LNG and MeOH each come with distinct economic implications. LNG has become more cost-effective over time due to the growth in its supply and infrastructure [28]. However, LNG-powered vessels often involve higher capital expenditure (CAPEX) [43] due to the complexity of storage systems and cryogenic fuel tanks. Methanol, while simpler and cheaper to store, typically involves higher operational expenditure (OPEX) due to its lower energy content and the current higher price of methanol compared to LNG [44]. Retrofitting engines for either fuel also presents significant costs, though the methanol conversion process tends to be less complex and expensive than that for LNG [45,46].
A comprehensive analysis of the CAPEX in Ore Carriers can be made by comparing them with a Very Large Crude Carrier (VLCC) of 300,000 DWT, which uses the same main engine and very similar power output (22,500 kW) as the vessels under analysis. The conventional system, which refers to the installation of a fuel oil engine with no scrubber, has the lowest CAPEX at USD 13.2 million. LNG dual-fuel solutions, both low-pressure and high-pressure, significantly raise CAPEX, adding between USD 16.5 million (124.8%) and USD 20.5 million (155.3%), mainly due to LNG-related infrastructure such as tanks, piping, and gas supply systems [47]. Meanwhile, the methanol LP configuration represents a middle-ground alternative, increasing CAPEX by USD 6.2 million (47.3%) in comparison with the conventional system without the heavy investment required for LNG [48,49]. Since ore carriers share the same engine platform and power output as this VLCC, these CAPEX values can be directly applied to their evaluation, providing valuable insights into the financial impact of transitioning to alternative fuels.
Regarding OPEX, Table 1 displays the actual and projected fuel prices. The costs of alternative fuels exhibit significant variability and are heavily dependent on prevailing electricity costs [40]. In the case of biofuels, their cost fluctuations are more localized due to production limitations and the inherent challenges in scaling up their output [50]. For this reason, in a long-term scenario, synthetic fuels are projected to dominate the market. In the most favorable scenario, the synthetic fuel with the lowest cost per unit of energy would be eMeOH.
Safety considerations are paramount when implementing LNG and MeOH as marine fuels, as both present distinct challenges that must be carefully managed to ensure the safe operation of vessels [59]. LNG is stored at extremely low temperatures (−162 °C) to maintain its liquid state at ambient pressure, requiring advanced cryogenic storage tanks and insulation systems. Any breach in the storage system could result in rapid evaporation and the formation of a gas cloud, which, if ignited, could lead to fires or explosions. To mitigate these risks, stringent safety protocols have been established under the IMO International Code of Safety for Ship Using Gases or Other Low-flashpoint Fuel (IGF Code) [60], which outlines standards for design, construction, and operation of LNG-fueled ships. The fact that MeOH is liquid at ambient temperature significantly simplifies its usage compared to LNG. Methanol, while not requiring cryogenic storage, has its own set of safety concerns [61]. It is toxic if ingested, inhaled, or absorbed through the skin, necessitating careful handling procedures to prevent exposure. In addition, methanol is flammable, though it burns with a nearly invisible flame, which poses a unique fire hazard as it may not be immediately detectable. The IMO has addressed these risks through safety regulations specific to alcohol fuels, such as MSC.1/Circ.1621 [62], which provides guidelines for the safe operation of vessels using methanol and ethanol as fuels. This includes requirements for fuel storage, ventilation, detection systems, and firefighting equipment designed specifically for methanol characteristics [44].
Another crucial aspect when selecting one fuel over another is its availability at the ports of origin and destination. In the case of dry bulk, the main discharge ports are in China. All major ports in the country (Shanghai, Ningbo-Zhoushan, Shenzhen, and Tianjin) are equipped for LNG bunkering for large vessels [63]. Additionally, China has achieved significant milestones, such as refueling large ships like a 300,000 DWT VLCC [64], which is comparable in size to the vessels analyzed in this study. Regarding methanol, only the Port of Shanghai currently offers MeOH refueling for large vessels [65].
For vessels operating on the Australia-China route, the loading port is Port Hedland. LNG bunkering is expected to be available in the coming years [66], specifically to help decarbonize iron ore shipping to China. However, methanol bunkering is unlikely to be available before 2030 due to low demand and the high production cost of eMeOH at the local level. In the case of Brazil, Port Tubarao does not have LNG or MeOH bunkering infrastructure. While there are projects aimed at developing LNG infrastructure, a lack of capital is causing delays. Nevertheless, Brazil is one of the most promising countries for bioLNG production [67], which presents a great opportunity for decarbonizing this trade route.

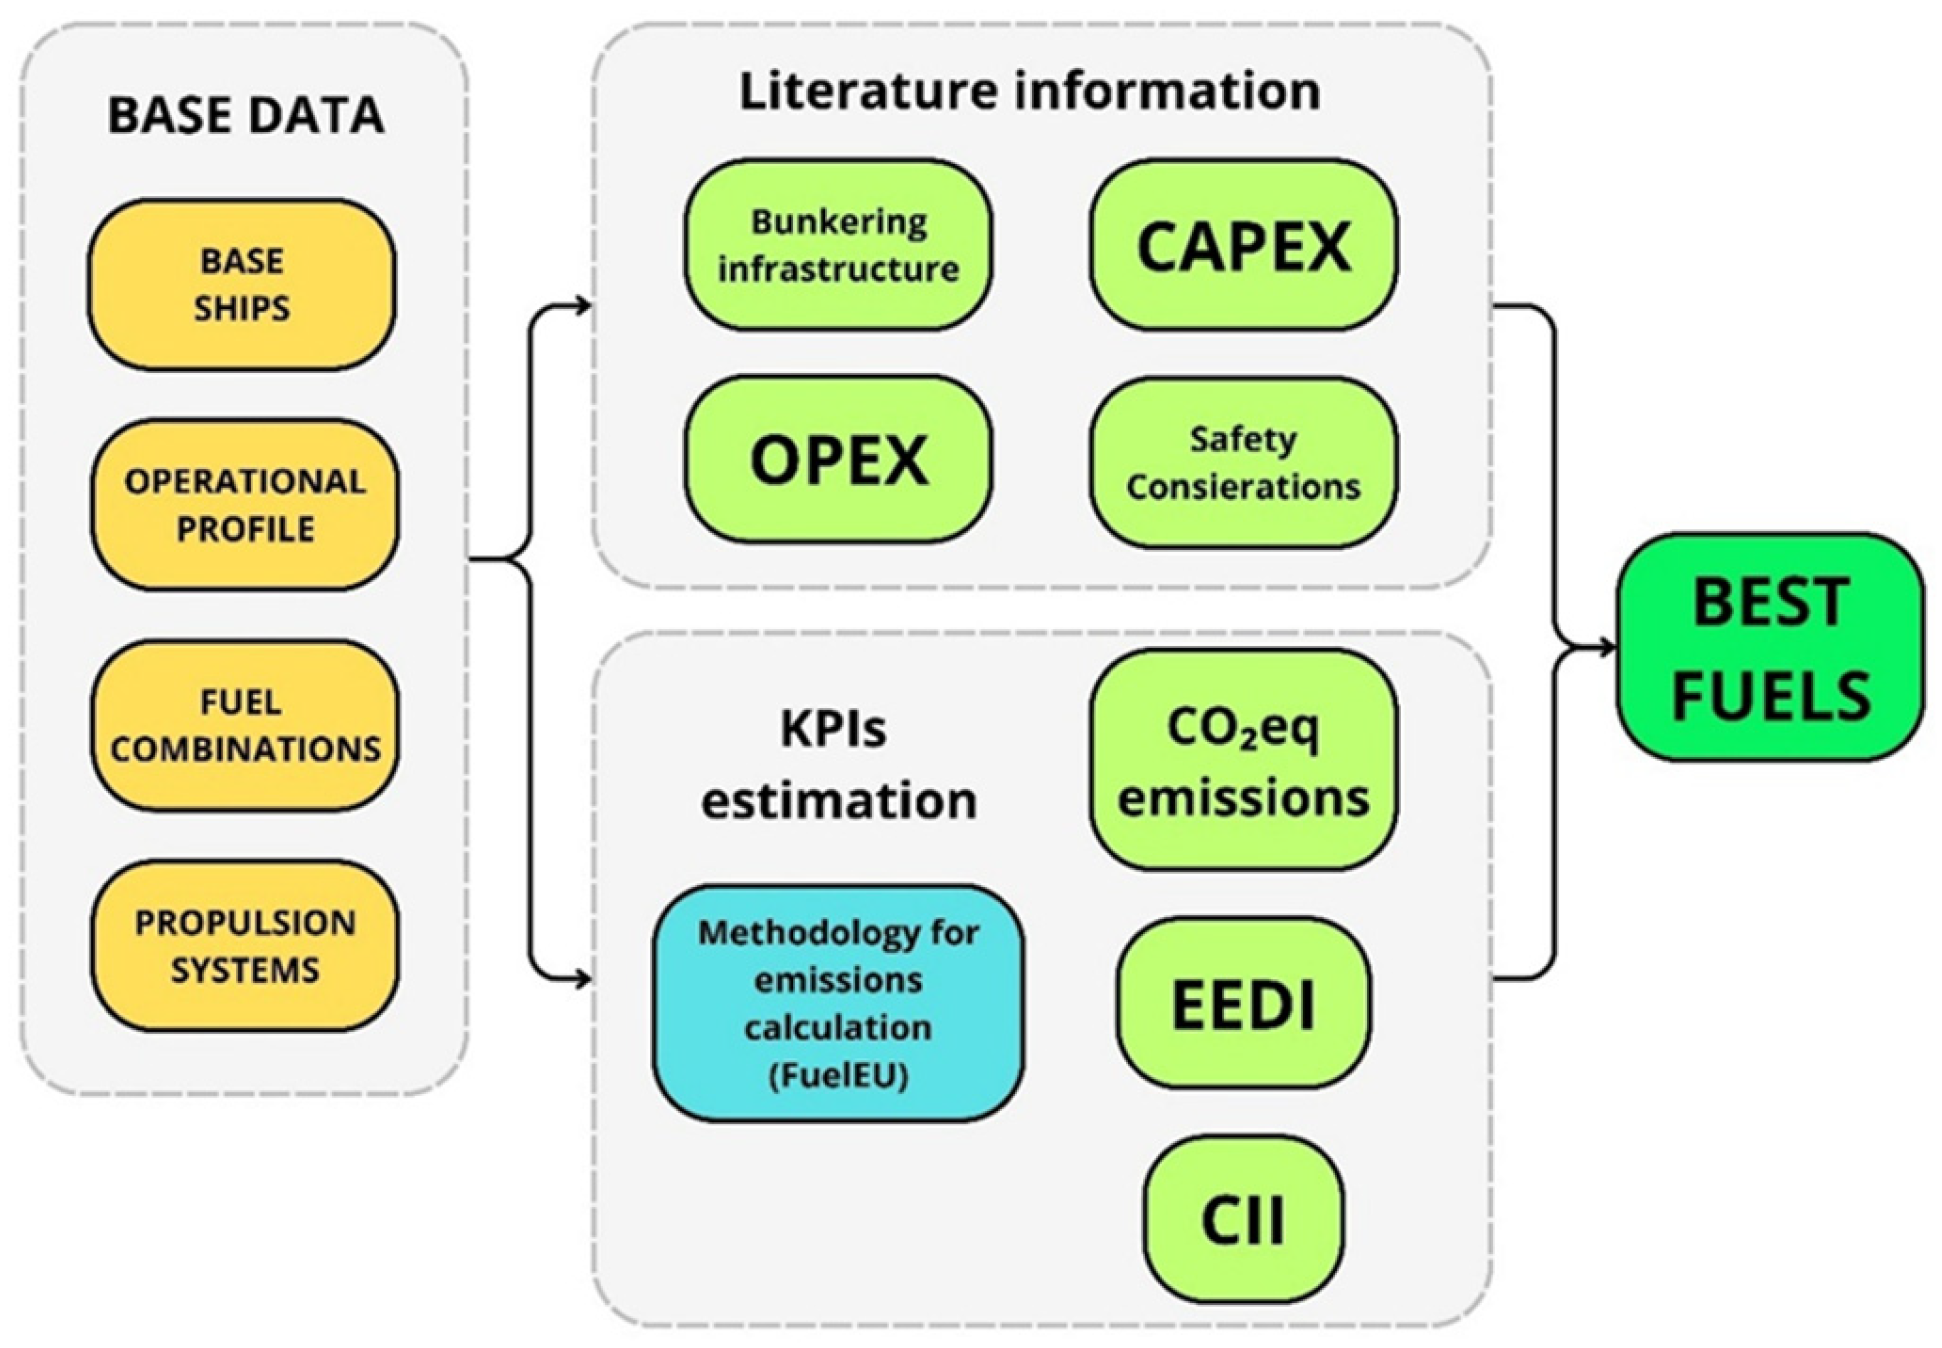
3. Materials and Methods

The approach to conducting the analysis in this article is summarized in Figure 2 and is divided into three distinct steps. First, it is necessary to define the nine scenarios to establish a comprehensive comparison between the different fuel combinations. These scenarios result from the combination of three vessel size categories and three primary fuel options, providing a clear and structured framework for analyzing performance, efficiency, and environmental impact across all segments. Second, using manuals and supplier data for propulsion engines, fuel systems for both LNG and MeOH will be specified, enabling the determination of equipment dimensions. To assess environmental performance, emissions will be calculated based on a Well-to-Tank (WtT) and Tank-to-Wake (TtW) approach, providing a comprehensive view of total emissions per voyage. Third, these calculations will form the basis for evaluating four key performance indicators (KPIs) throughout the article: mass of CO2eq for each fuel, mass of CO2eq per mass of cargo transported, mass of CO2eq per mass and per distance of cargo transported, CII and EEDI. With these five metrics plus the literature information, conclusions will be drawn regarding the best and worst fuel combinations.
Additionally, an analysis of the vessel route between the loading and unloading ports has been conducted to precisely determine the required power. The system sizing is based on the manuals from current available options, currently these vessels use the engine 7G80ME-C10.5 [68]. Consequently, engines equivalent to those used in fuel-oil mode have been selected for both LNG and methanol. Specifically, the LNG engine is the G80ME-C10.5-GI [69]. The methanol engine selected is the G80ME-C10.5-LGIM [70]. It is important to highlight these two engines as they are exactly equivalent, with the first operating on LNG and the other on MeOH. Both have the same propulsion characteristics and are the only available options for this power range that can also be directly compared. This approach ensures that the engine performance metrics align with the operational requirements and fuel specifications of the vessel. As electrical generator groups (gen-sets), the 8L23/30H and 8L23/30DF [71,72], will be used across all three vessel segments. The first one will operate with MGO, while the second is compatible with LNG and MeOH or MGO if it is necessary.

3.1. Operational Profile

The operational profile is determined by the route and the operational conditions. The ship route is primarily focused on transporting iron ore from major export hubs, such as Brazil or Australia, to ports in China [9]. Given the long distances involved, it is planned that refueling could only take place at the port of origin before each roundtrip. This means that the vessel must carry sufficient fuel to complete the entire round trip without requiring additional stops for refueling at intermediary ports. By limiting refueling to the port of origin, logistical complexity is reduced, allowing for a more streamlined and predictable operation. This approach also maximizes the vessel operational efficiency by ensuring uninterrupted voyages, as no time is lost at refueling ports along the route. The need for larger fuel storage capacity on board is crucial for this strategy, as the vessel must be equipped to maintain self-sufficiency throughout the entire voyage.
All details regarding vessels routes are summarized in Table 2. The routes have been selected, opting for the most typical ones and arriving into port Tianjin (the furthest one in China). The data have been obtained from the Vessel Finder maritime traffic website [73] and the distances from the Sea Distances website [74].
The four operational conditions are summarized in Table 3. The operational conditions of ore carriers include four main stages: full load, ballast, loading/unloading and port stay. Each of these phases is critical to maximizing vessel efficiency and minimizing costs across bulk shipping routes.
In the full load phase, the VLOC is loaded to its maximum capacity at the port origin, where bulk materials, such as iron ore, are loaded rapidly to optimize port operations. This efficiency minimizes port stay time and maximizes the payload, achieving cost-effective operations through economies of scale. The full load voyage from Brazil is estimated in 32.5 days and from Australia in 13.3 days. Following the full load phase, the vessel enters the ballast phase. Here, after discharging its cargo at the destination port, the VLOC returns to the origin port in ballast, meaning it travels without cargo. The ballast voyage to Brazil is estimated in 32.5 days and to Australia in 13.3 days. The loading/unloading phase typically takes around 2.5 days. Finally, the port stay phase is generally limited to approximately 12 h, covering essential checks and preparations for the next voyage cycle while the vessel is docked. Each of these stages plays a key role in sustaining the efficiency and profitability of VLOC operations.

3.2. Base Ships

The characteristics of the nine scenarios are presented in Table 4. The main specifications will remain consistent across all fuel types, with the primary difference lying in the engine models designed for each type of fuel. Special care has been taken in calculating cargo capacities, considering both the density and energy density of different fuels. In the main fuel consumption column, the consumption of fuel per trip is presented in tons: the first number corresponds to the main engine, while the second refers to the gen-sets. Subsequently, MGO consumption is provided.

3.3. Fuels

Table 5 presents the main characteristics of four selected marine fuels: VLSFO, MGO, LNG and MeOH. The parameters considered include the lower heating value (LHV), which represents the energy released per mass of fuel; density (ρ), which affects storage and fuel consumption; carbon content, which determines the proportion of carbon present in the fuel; and the carbon conversion factor (Cf), which quantifies the mass of CO2 emitted per mass of fuel burned. This Cf value can be directly used in the calculation of the Energy Efficiency Design Index (EEDI) and the Carbon Intensity Indicator (CII), as both metrics focus exclusively on CO2 emissions and do not consider CO2eq emissions [80]. This simplifies their application, as no adjustments are required for additional greenhouse gases such as methane (CH4) or nitrous oxide (N2O).
Table 6 highlights the global warming potential (GWP100) of three major greenhouse gases emitted during fuel combustion: CO2, N2O, CH4. GWP100 measures the relative impact of each gas on global warming over a 100-year period, expressed in CO2eq terms. CO2 serves as the baseline with a GWP of 1, meaning that each unit of CO2 emitted contributes directly to climate change. N2O has a significantly higher GWP of 298, indicating that its impact on global warming is 298 times greater than that of CO2 over the same period. Similarly, CH4 has a GWP of 25, meaning it is 25 times more potent than CO2 in terms of greenhouse effect. These values highlight the importance of considering not only CO2 emissions but also other exhaust gases when evaluating the environmental impact of different fuels. LNG, for example, emits a lower mass of CO2 than VLSFO, but it suffers the unintended release of unburned CH4 emissions (methane slip), which has a higher warming potential.
Equation (1) calculates the WtT CO2eq emissions per unit of energy ( C O 2 e q   W t T ) emit by a certain fuel. It is calculated by subtracting the division of mass of CO2 produced per mass of fuel ( C s f   C O 2 ) by its energy content (LHV) to the CO2eq emissions per unit of energy (E) to obtain the fuel. The equation accounts for CO2 reductions in biofuels and synthetic fuels, where carbon absorption during biomass growth or CO2 capture in fuel synthesis lowers net emissions. Negative values of E indicate net CO2 removal, making such fuels crucial for decarbonization and achieving carbon neutrality.
C O 2 e q   W t T   i = E C s f C O 2 L H V i
where C O 2 e q   W t T i stands for the CO2eq mass production per fuel energy burned in g C O 2 e q M J ; E stands for GHG emissions that are generated during the production of each type of fuel in g C O 2 M J ; C s f C O 2 stands for the CO2 mass production per fuel mass in g C O 2 g f u e l ; L H V stands for the lower heating value measure in M J k g .
Table 7 presents the CO2eq WtT emissions per unit of energy for the different fuel types. These emissions account for the CO2 produced during fuel production, processing, and transportation before combustion. The data originates from the JEC Well-to-Tank report [42], which provides standardized assessments of fuel emissions across different production pathways. This report has been used because WtT emissions have significant uncertainty [82], and this study relies on industry data while identifying the most probable production pathway for each fuel. This report is the recommended approach, along with Directive 2018/2001 [83] and FuelEU [81], for the calculation of total CO2eq emissions. The LHV represents the energy content per mass of fuel, with higher values indicating a more energy-dense fuel. The CsfCO2 column shows the mass of CO2 produced per mass of fuel during production. The E column provides emissions per unit of energy to produce each fuel, with three key values: Min (minimum emissions scenario), WtT selected (the most expected value according to [42]), and Max (maximum emissions scenario). The C O 2 e q   W t T i column represents the total life cycle CO2eq emissions, incorporating broader environmental impacts.
Key insights can be drawn from the table. Fossil fuels (VLSFO, MGO, LNG, MeOH) exhibit relatively high emissions, as they do not involve CO2 absorption during production. Biofuels (bioDiesel, bioLNG, bioMeOH) and synthetic fuels (eDiesel, eLNG, eMeOH) tend to have lower or even negative minimum emissions, reflecting the role of biogenic CO2 absorption or carbon capture technologies in their production. Notably, bioLNG and eDiesel show significant variability, indicating that their carbon impact depends heavily on the specific production process. A particularly important takeaway is that negative E values (e.g., bioLNG, eDiesel) suggest that these fuels may remove more CO2 from the atmosphere during production than they emit during use. This makes them promising candidates for low-carbon and carbon-neutral energy solutions.
Table 8 presents CO2eq emissions per unit of energy for various fuel types and combustion systems in internal combustion engines (ICEs). It includes the mass of CO2, CH4 and N2O emissions per unit of fuel mass, as well as the total CO2eq for the Tank to Wake (TtW) cycle. Additionally, it provides the C s l i p   , which represents the percentage of unburned methane released into the atmosphere relative to the total fuel mass consumed.
Methane slip is particularly significant in engines utilizing LNG. The table indicates that LNG Diesel cycle engines exhibit a relatively low methane slip (0.2%), whereas LNG Otto cycle engines show a significantly higher methane slip (3.1%). This difference is due to the combustion characteristics of each engine type. Diesel engines operate with high compression ratios and lean fuel mixtures, leading to more complete combustion and lower methane slip. In contrast, Otto cycle engines use a premixed air-fuel mixture, which increases the likelihood of unburned methane escaping through the exhaust. Additionally, bioLNG and eLNG, which are renewable alternatives to conventional LNG, exhibit the same methane slip behavior.
Finally, the Specific Fuel Oil Consumption (SFOC) in g/kWh for the various fuel types and engine configurations, including VLSFO, LNG, MeOH, and MGO, measured at different engine load levels (50%, 75%, 85%, and 100%) are presented in Appendix A (Table A1).

3.4. Fuel Combinations for CO2eq Emissions

Once the vessel propulsion systems, route, and operational profile are established, CO2eq emissions calculations can be performed for each fuel combination. Fuel combinations in ships refer to the practice of using two types of fuels, either simultaneously or alternately, to optimize performance, reduce emissions, and comply with environmental regulations. The criterion for selecting fuel combinations has been, first and foremost, to combine only two types of fuel. This is because the inclusion of a combination of three or more fuels would greatly complicate the fuel handling and loading chain and would also not be realistic given current practices. Therefore, in the case of LNG and MeOH, these must be combined with another fuel that serves also as pilot fuel. The base fuels for comparison will be those currently used: VLSFO in the main engine and MGO in the gen-sets (the fuel used in the gen-sets will be called generator fuel). This baseline will serve as a point of comparison to assess whether alternative solutions outperform the existing setup.
Considering the initial criteria outlined, and the fuels presented earlier, 31 possible fuel combinations emerge, which are shown in Table 9 in Section 4. First, calculations will focus exclusively on fossil fuels (1–5). This will involve combining VLSFO, MGO, LNG and MeOH in both the main engine and auxiliary engines. Second, the analysis will account for whether MGO is used solely as pilot fuel or as the fuel in gen-sets, as this will have a significant impact on emissions, particularly in LNG configurations, due to methane slip [85,86]. Following this approach, a second analysis group (6–13) will focus on combining alternative fuels bioLNG, bioMeOH, eLNG and eMeOH with fossil fuels. This approach is based on the anticipated availability of renewable versions of these fuels in the future, while renewable diesel is expected to remain less accessible due to its higher production costs and likely allocation to other industries [52]. The third fuel combination (14–31) will assume that all fuels used are alternative, including the pilot fuel, which will be biodiesel or eDiesel. Based on these combinations, the CO2eq emissions per trip will be calculated, allowing for a discussion of the impact of each option. The subscript i refers to the fuels, while j corresponds to the different engines.

3.5. Estimation of Fuel Emissions

Total emissions are estimated per complete voyage. For the 400,000 DWT and 325,000 DWT vessels, a complete voyage cycle is estimated at 71 days, encompassing all four operational phases, with an annual total of 5 complete voyages. In contrast, the 250,000 DWT vessels complete each voyage in approximately 32.5 days, achieving an annual total of 11 full voyages [73,74]. The emissions calculation framework is shown in Figure 3, where this diagram outlines the calculation of total CO2eq emissions for a vessel based on its operational profile, service speed, range and engine characteristics. It evaluates three engine types: 7G80ME-C10.5, 7G80ME-C10.5-GI (LNG), and 7G80ME-C10.5-LGIM (MeOH) along with the L23/30 H MK 3 dual-fuel auxiliary engine. Emissions are quantified through two metrics: WtT, which measures emissions from fuel production and transport and TtW, which measures emissions during vessel operation. Efficiency is assessed using SFOC. By integrating these factors, total CO2eq emissions can be estimated, offering a detailed evaluation of the vessel environmental performance.
The calculation of total fuel consumption is based on the SFOC of the main engine at its operating load, considering engine power and days of operation. Auxiliary engines will be calculated similarly following Equation (2) [81]:
m i = j n   e n g i n e S F O C i , j · % M C R j · W ˙ j · t
where m i stands for the fuel mass consumed of each engine at a determined regime and in a specific period in t ; S F O C i , j stands for de mass of fuel consumed per unit of power and unit of time of each engine and fuel type in g k W · h ; % M C R j stands for the regime of functioning of each engine per condition as a % ; W ˙ j stands for the power of each engine in k W ; t stands for the voyage time in h .
The emissions calculation will account for both WtT and TtW emissions. These calculations will follow the guidelines provided by the FuelEU regulation [81], which outlines the methodology for accurately assessing both components. Emissions are derived from fuel consumption, LHV parameters [83] and CO2eq emissions per energy density. WtT emissions are calculated using Equation (3).
C C O 2 e q   W t T = i n   f u e l m i · C O 2 e q   W t T   i · L H V i
where C O 2 e q   W t T   i stands for the CO2eq mass production per fuel energy produced in g C O 2 e q M J ; C C O 2 e q   W t T stand for stands for the mass of GHG WtT measure in CO2eq mass in g C O 2 e q ; L H V i stands for the lower calorific value measure in M J k g .
In the case of TtW emissions, the first step will be to calculate the CO2eq by considering the emissions of CO2, N2O and CH4, along with their respective GWP values (Equation (4)). Once this is calculated, it will be possible to determine the emissions using the fuel mix (Equation (5)). For LNG, the effect of methane slip will need to be added to the calculation (Equation (6)). Methane emissions are particularly significant, especially in engines that use the Otto cycle [87]. On average, methane slip is 1.7% for slow-speed engines and 3.1% for medium-speed engines operating at 50% of their maximum continuous rate (MCR), while engines using the Diesel cycle (only for 2-stroke slow-speed engines) produce 0.2% [81]. In the case of the engines selected for this study, the primary engines are of the Diesel cycle, which are expected to become the dominant technology in the industry due to their reduced methane slip [88] compared to medium-speed LNG gen-sets operating on the Otto cycle [89,90].
C O 2 e q   T t W   i , j = C s f C O 2   i , j · G W P C O 2 + C s f C H 4   i , j · G W P C H 4 + C s f N 2 O   i , j · G W P N 2 O
C C O 2 e q   T t W = i n   f u e l j n   e n g i n e m i · C O 2 e q   T t W   i , j
C C O 2 e q   T t W   s l i p = i n   f u e l j n   e n g i n e m i · C O 2 e q   T t W   i , j · C s l i p   j 100 · G W P C H 4
C C O 2 e q   T t W   T O T A L = C C O 2 e q   T t W + C C O 2 e q   T t W   s l i p
where C s f C O 2   i , j stands for the CO2 mass production per fuel mass in g C O 2 g f u e l ; C s f C H 4   i , j stands for the CH4 mass production per fuel mass in g C H 4 g f u e l ; C s f N 2 O   i , j stands for the N2O mass production per fuel mass in g N 2 O g f u e l ; G W P C O 2 stands for the CO2 global warming potential in g C O 2 e q g C O 2 ; G W P C H 4 stands for the CH4 global warming potential in g C O 2 e q g C H 4 ; G W P N 2 O stands for the N2O global warming potential in g C O 2 e q g N 2 O ; C O 2 e q   T t W   i , j stands for the CO2eq mass production per fuel mass in g C O 2 e q g f u e l ; C s l i p   j stands for methane slip as a percentage of fuel consumption in g C H 4 g f u e l ; C C O 2 e q   T t W stands for the mass of GHG TtW measure in CO2eq mass without considering the methane slip in g C O 2 e q ; C C O 2 e q   T t W   s l i p stands for the mass of methane slip measure in CO2eq mass in g C O 2 e q ; C C O 2 e q   T t W   T O T A L stands for the mass of GHG TtW measure in CO2eq mass in g C O 2 e q .
Therefore, the total emissions are calculated as:
C C O 2 e q   T O T A L = C C O 2 e q   W t T + C C O 2 e q   T t W   T O T A L
where C C O 2 e q   T O T A L stands for the total mass of GHGs measured in CO2eq mass in g C O 2 e q .
Once the total CO2eq emissions on a TtW basis are calculated, the CII (Equation (9)) [7] and EEDI (Equation (10)) [5] coefficients can be determined. Following the IMO guidelines, the EEDI and the CII consider only CO2 emissions (not all GHGs), and only the TtW emissions. Emissions associated with the EEDI are calculated as an efficiency coefficient for a typical voyage at full load and at the ship reference speed. For the CII, emissions are calculated based on the total CO2 emissions for the vessel operational range over a full year of navigation, excluding emissions during port stays or cargo loading/unloading operations. The coefficients, baseline for the EEDI and the LHV of the fuels have been derived using the IMO factors provided in MEPC 79/15/Add.1 [5]. Both EEDI and CII are measured in g C O 2 t · n m .
C I I = C O 2   e m i s s i o n s   i n   a   y e a r D W T · R a n g e
E E D I = C O 2   e m i s s i o n s   i n   a   v o y a g e D W T · v r e f
where v r e f stands for reference speed of the vessel [5] in k n ; Range stands for the covered distance in m i l e s .

4. Results and Discussion

In the results section, the KPI calculations will be presented. Section 4.1 displays the CO2eq emissions for a single voyage for each vessel segment, while Section 4.2 presents the mass of CO2eq produced per mass of transported iron ore. Section 4.3 shows the mass of CO2eq per mass of transported iron ore and per distance travel. Finally, the EEDI and CII have been calculated in Section 4.4 and Section 4.5, respectively.

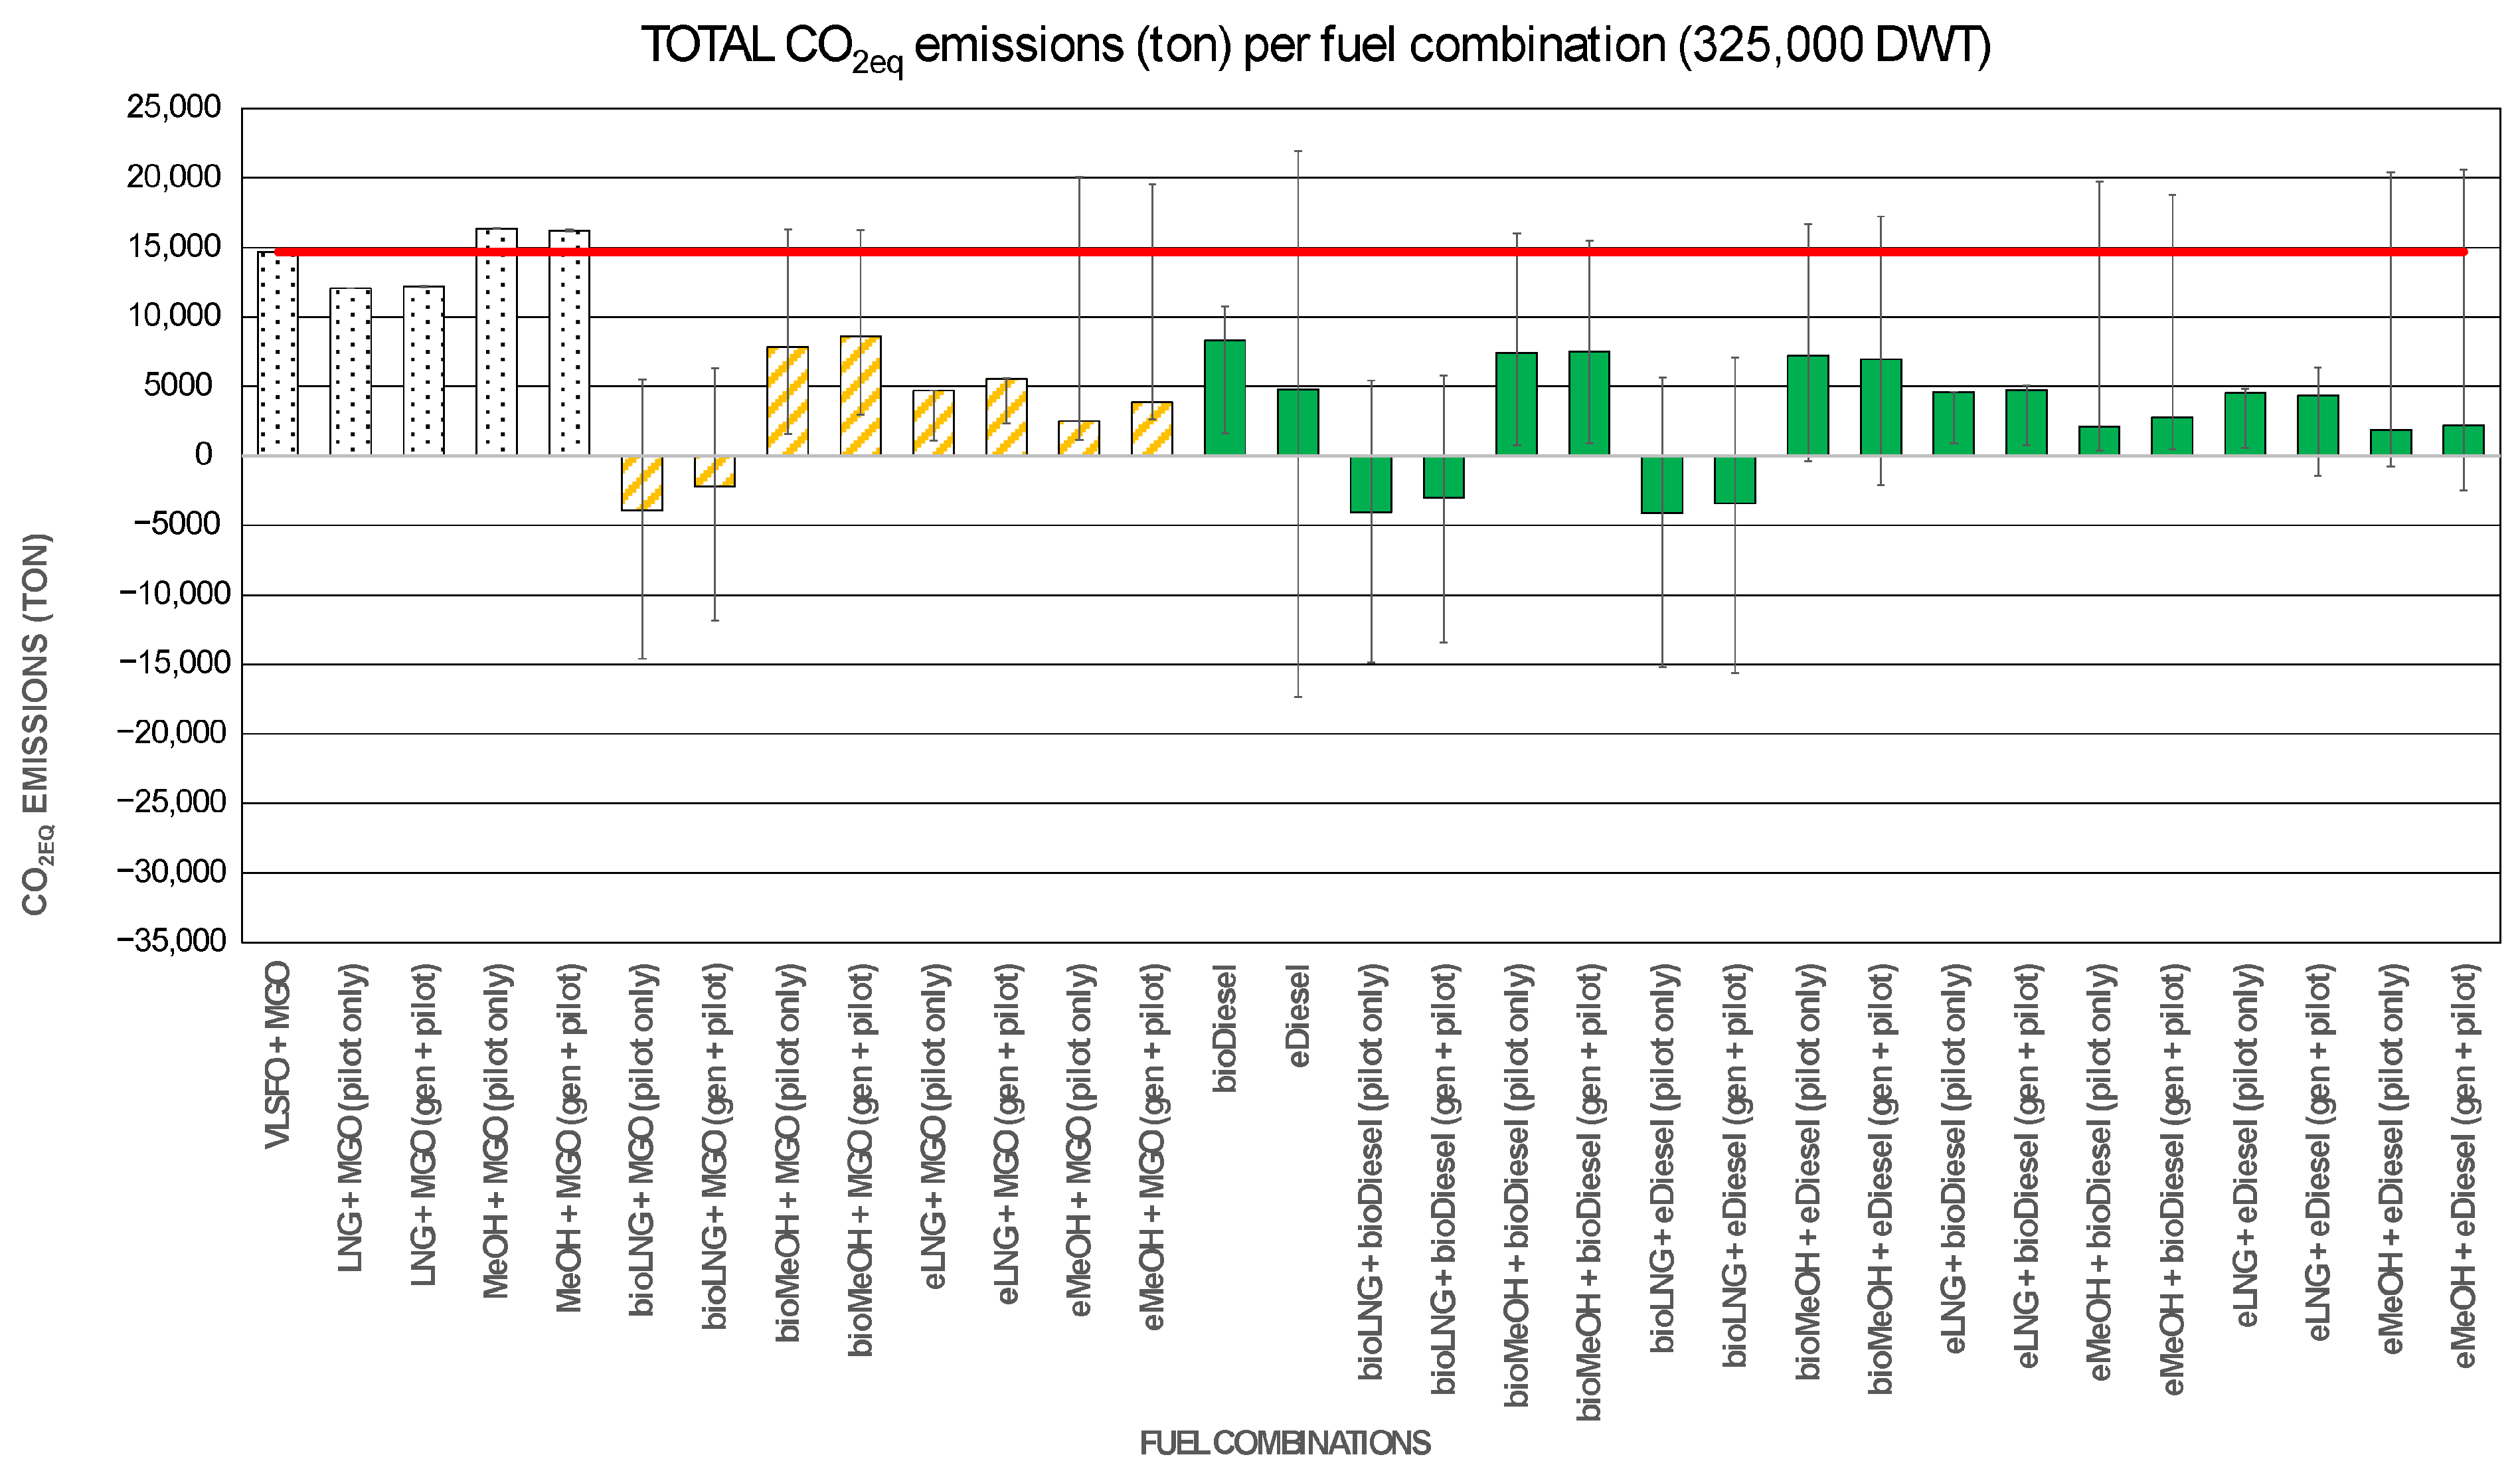
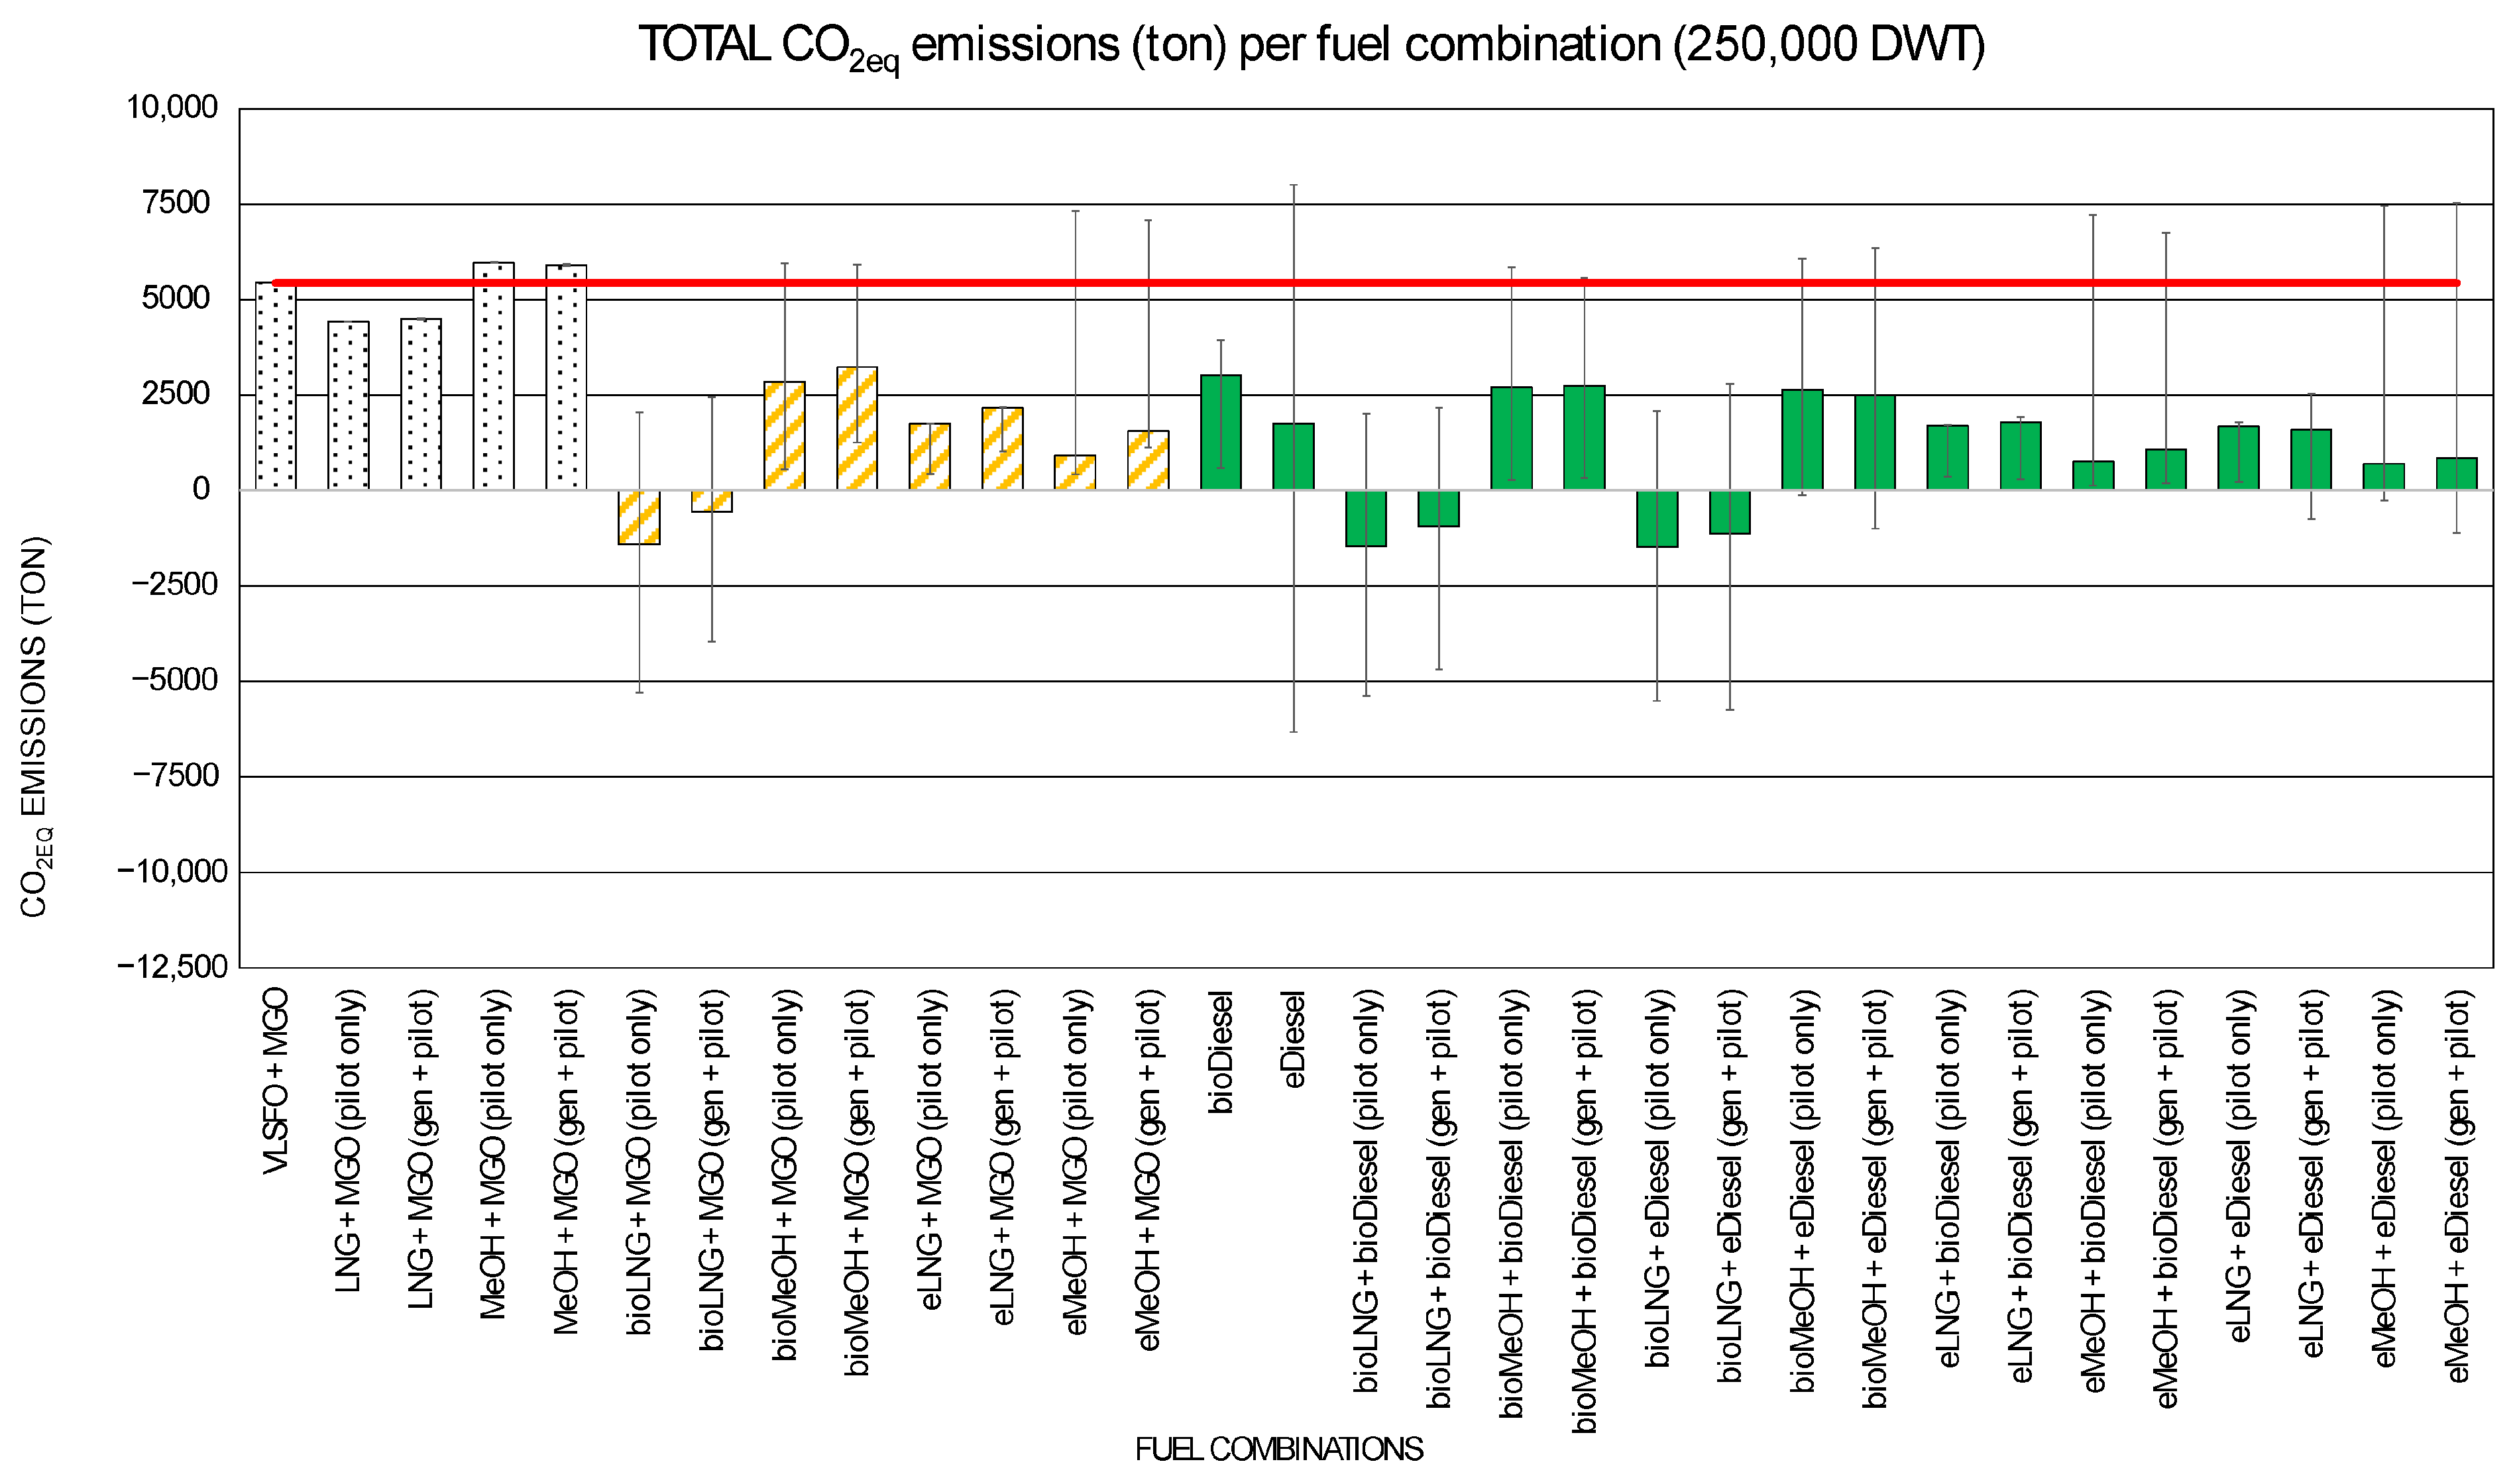
4.1. Potential Emissions Reductions

Once fuel consumption has been determined based on the operational profile, and both propulsion and auxiliary engines, and after presenting the methodology and sources for calculating CO2eq emissions, the mass of CO2eq produced by each vessel per trip has been calculated. In Appendix B, emissions are presented by vessel type, origin, and fuel combination. The continuous line represents the baseline emissions of the vessel operating with VLSFO and MGO, meaning that any fuel combination exceeding this threshold would result in a penalty compared to the current propulsion system and should therefore be ruled out as an option. The dashed column represents fossil fuels, the one with crossed lines represents alternative fuels plus MGO, and the opaque columns represent only alternative fuels.
Table 9 displays the potential emission reductions per voyage for each vessel type and fuel combination, based on the pathway identified as the most feasible in the JEC v5 report (Table 7) [84]. When focusing on the use of fossil fuels, the emissions reduction across the three vessel segments are similar. Furthermore, it is understood that the only viable option for emission reduction is using LNG in the main engine with MGO. The reduction achieved by using MGO solely as pilot fuel (18% emissions reduction) or as both pilot fuel and gen-set fuel (16% to 17% emissions reduction) is practically equal. This is because methane slip significantly penalizes the alternative LNG configuration. Regarding MeOH, although it has lower TtW emissions, the emissions generated during its production (WtT emissions) result in its total emissions being between 10% and 11% greater than those of VLSFO with MGO. Therefore, the only fossil fuel combination capable of reducing GHG emissions is LNG with MGO.
Within the group of alternative fuels plus MGO, several additional insights can be drawn. The best combination would be bioLNG with MGO used solely as pilot fuel, closely followed by the same option but with MGO used both as pilot fuel and as the main fuel in the gen-sets. Focusing on the specific emission reductions by combination, bioLNG stands out with reductions ranging from 127% to 126%, meaning it would result in net negative emissions in both cases when using MGO as pilot fuel. This occurs because producing bioLNG from organic waste captures methane that would otherwise be emitted directly into the atmosphere, and since methane has a much higher global warming potential than CO2, this avoided release more than offsets the CO2 generated during combustion [91]. The process by which bioLNG achieves these negative emissions is explained in detail in Section 2. The second-best option, with a potential reduction of 117% to 111%, is bioLNG when using MGO as the pilot fuel and main fuel in the gen-sets. Following bioLNG, the next best fuel is eMeOH, which is the most effective synthetic fuel, achieving a reduction of up to 83% in CO2eq emissions when used in the gen-sets as well. If MGO is used as both the pilot and generator fuel, the reduction in emissions decreases to 74%. The least effective combinations are bioMeOH and eLNG, each achieving reductions of approximately 42% to 47% and from 33% to 53%, respectively. This positions bioLNG using MGO as pilot fuel and main fuel in the gen-sets as the most favorable option for CO2eq emission reductions among the alternatives analyzed.
Similar results are observed for the third group of fuels that include only alternative fuels. Between eDiesel and bioDiesel, the former stands out with a potential reduction of 67%, compared to 50% for bioDiesel. Consequently, all combinations utilizing eDiesel outperform those using bioDiesel. Once again, the top performing fuel is bioLNG, achieving emission reductions of 128% to 127% when combined with eDiesel as the pilot fuel. Among synthetic fuels, eMeOH emerges as the best option when combined with eDiesel, with the latter used solely as the pilot fuel. This combination achieves reductions of 87%. The least effective combinations are bioMeOH and eLNG, with reductions ranging between approximately 50% to 52% and 68% to 70%, respectively. This position bioLNG combined with eDiesel is used solely as pilot fuel as the most favorable option for CO2eq emission reductions in this group.

4.2. Comparative Analysis of CO2eq Emissions per Mass of Iron Ore

The primary objective of this work was to determine the most effective approach for reducing CO2eq emissions in the maritime sector. One of the KPIs of interest is the mass of CO2eq produced per mass of iron ore transported. Transporting a specified quantity of iron ore requires a fully loaded journey, a ballast journey, one loading operation, one unloading operation, and two port stays. Based on the operational profile, fuel combinations and consumption rates for each condition, CO2eq emissions are calculated for each vessel and fuel combination. The ratio in this context will thus be the CO2eq emissions divided by the mass of iron ore transported. The lower the mass of CO2eq produced per mass of iron ore transported, the more efficient the vessel will be.
In Figure 4, a column chart displays the results for the three ship segments: the dotted bar represents the 400,000 DWT vessel, the bar with diagonal lines corresponds to the 325,000 DWT vessel, and the solid bar represents the 250,000 DWT vessel. It can be observed that the 250,000 DWT vessel produces less CO2eq per unit of mass transported, primarily because its route, from Australia to China, is shorter than the Brazil to China route, and the scale effect of the two larger segments is insufficient to offset this advantage. The 400,000 DWT vessel outperforms the 325,000 DWT vessel on the same route due to scale effects.
Therefore, the 250,000 DWT vessel is significantly more efficient in terms of mass of CO2eq per mass of iron ore transported, highlighting the importance of route optimization as a means of reducing GHGs. The vessel will emit between 40% and 50% less CO2eq per mass of iron ore transported, except for combinations where eLNG and bioLNG are used. This is particularly interesting to note that the 250,000 DWT vessel is only outperformed under specific conditions involving eLNG and bioLNG, where methane slip increases emissions. Under these conditions, emissions due to methane slip can potentially double the GHGs. This is because the 250,000 DWT vessel has more port stays (11 trips compared to 5 for the other vessels), and during these port stays, medium-speed Otto-cycle gen-sets are used, which exacerbate emissions due to methane slip.

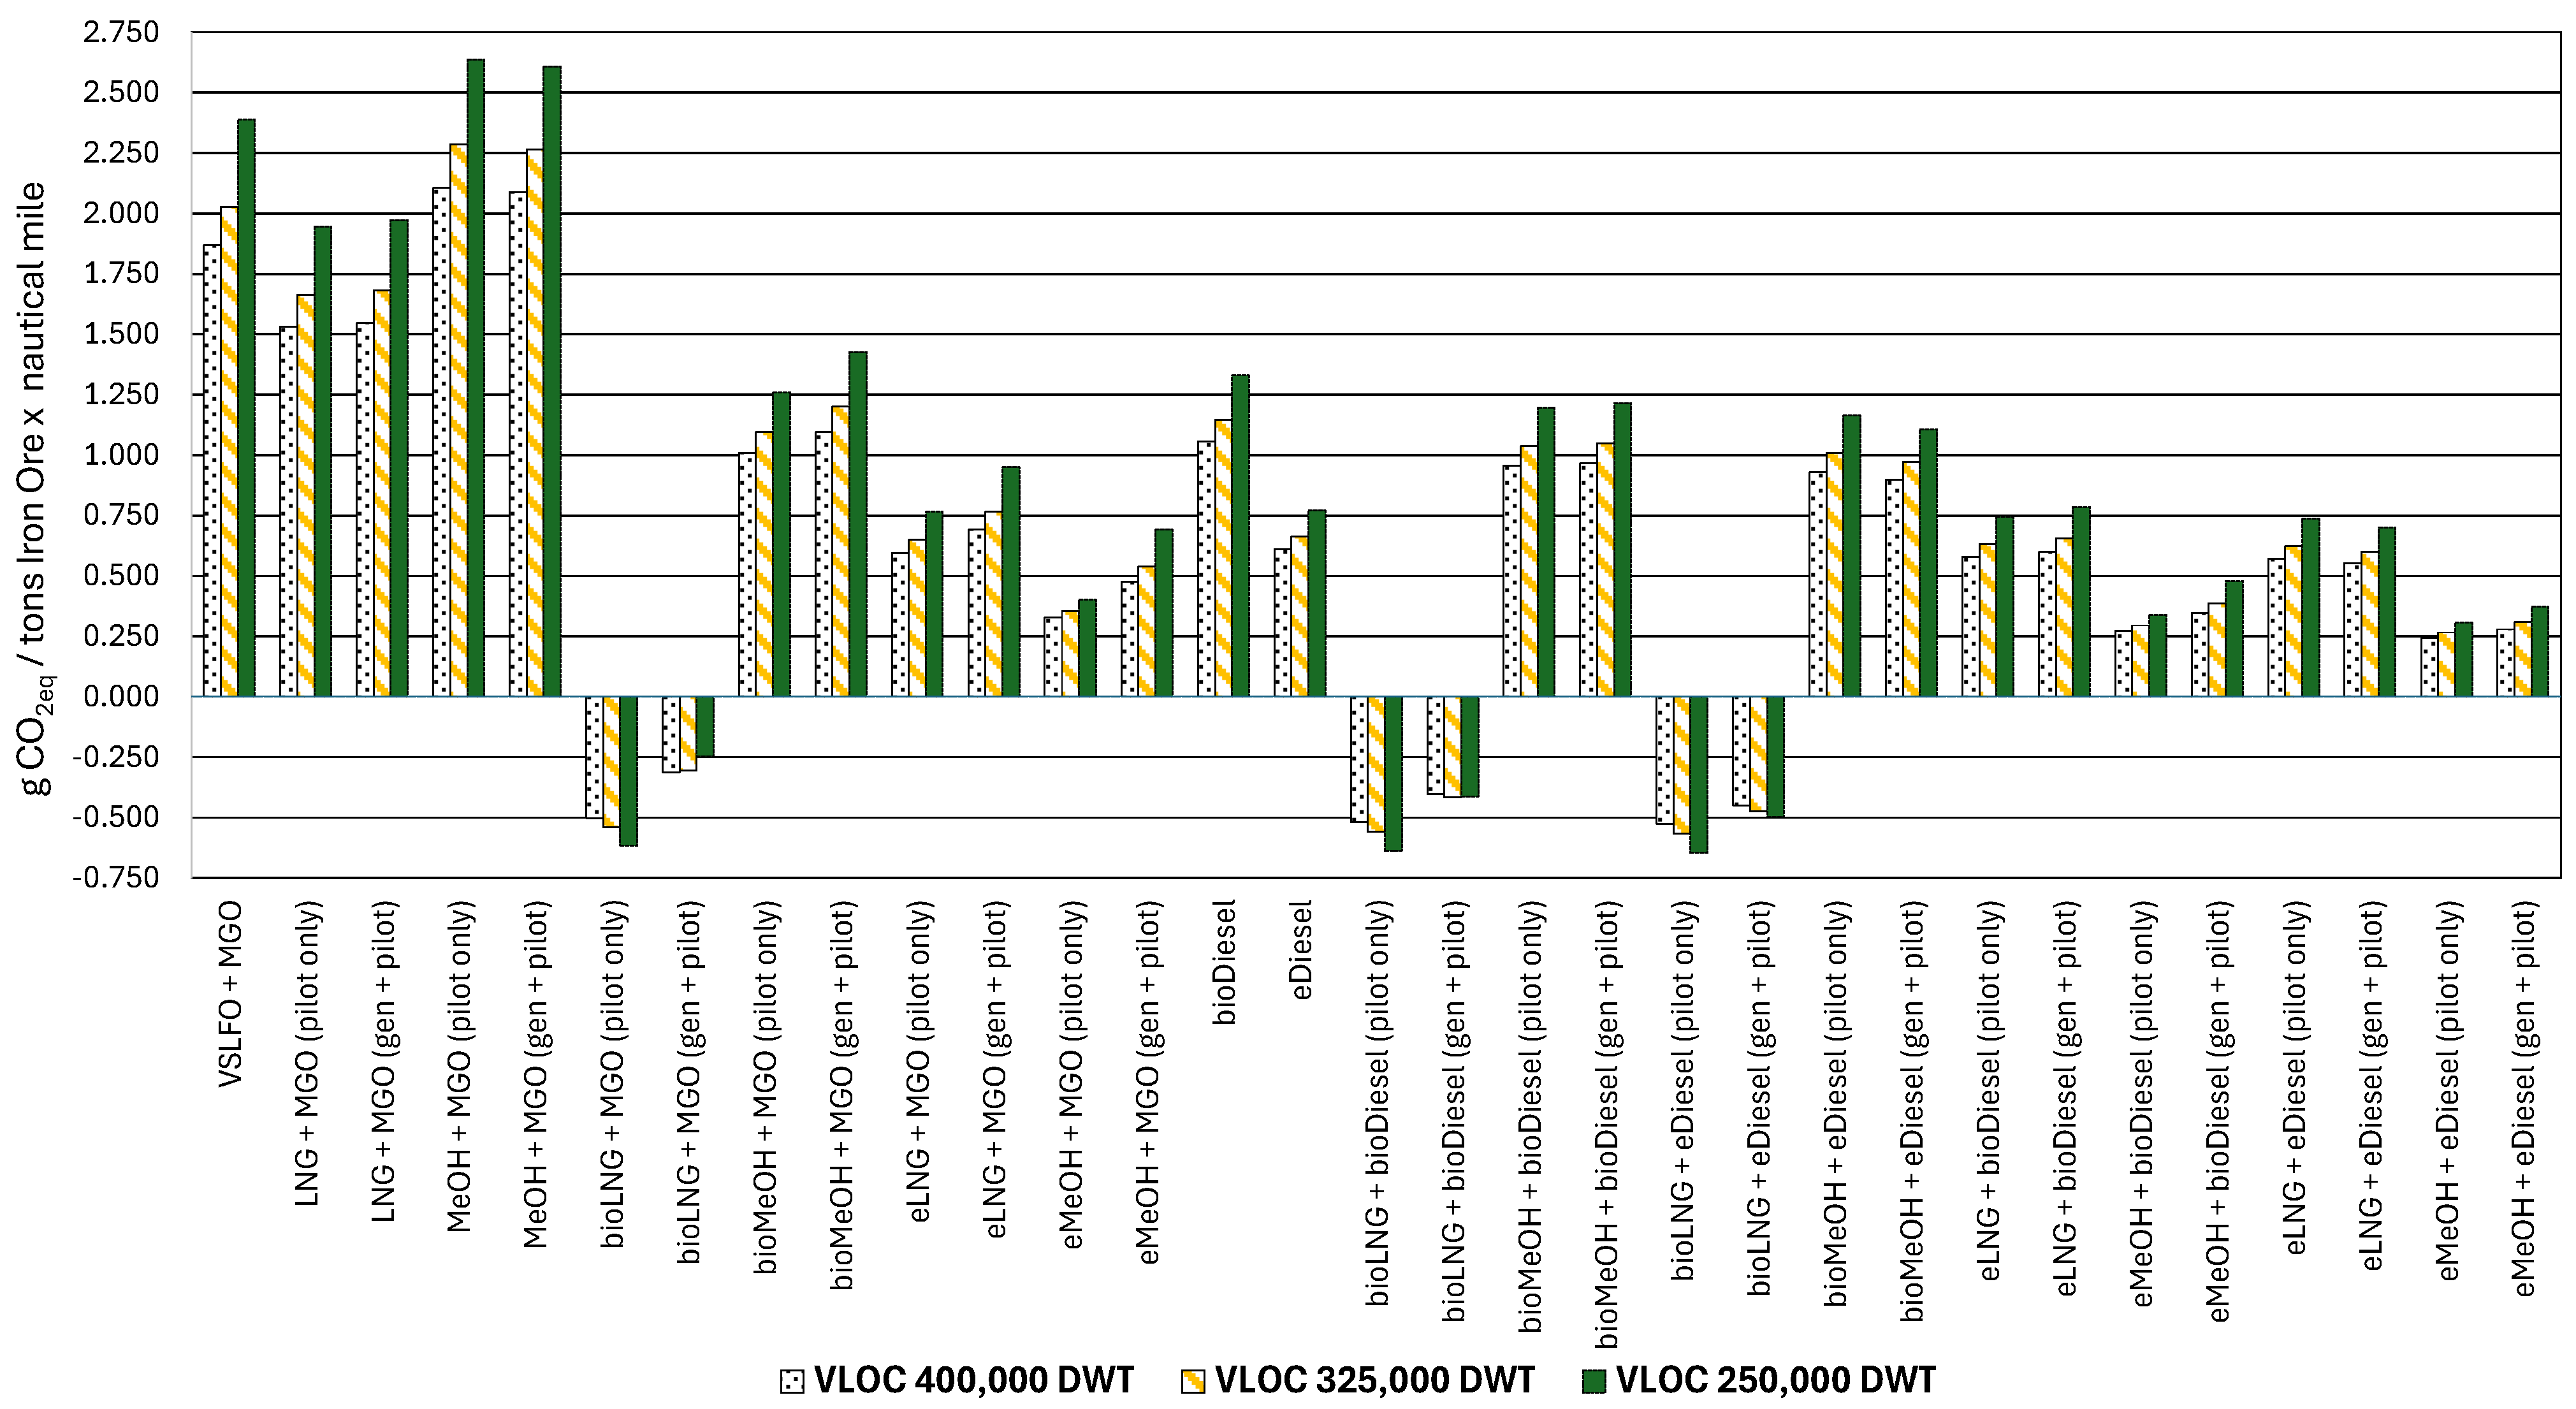
4.3. Comparative Analysis of CO2eq Emissions per Unit of Mass and per Distance Transported of Iron Ore

The KPI total mass of CO2eq emissions per unit of transported mass of cargo and distance is a crucial measure of operational efficiency in maritime transportation. While the mass indicator only measures the total cargo, it does not account for the distance covered, fuel efficiency, or environmental impact. The mass per distance indicator, however, links both the cargo mass and the distance, offering deeper insights into cost optimization, sustainability, and operational effectiveness.
This correction, by incorporating the transported distance, will be crucial for truly understanding the efficiency of each segment of the vessel, as it might lead to the mistaken belief that the 250,000 DWT vessel is more emission-efficient than the 400,000 DWT or 325,000 DWT vessels. The reality is that the first operates over a route that is nearly three times shorter than its counterparts, resulting in a better coefficient in terms of mass of CO2eq per mass of iron ore transported. When factoring in the distance traveled and expressing the value as mass of CO2eq per mass and per distance of cargo transported, a metric that is both more commonly used and accurate in maritime transport, as it better reflects the true value of the transported cargo, the analysis provides a clearer and more representative assessment.
Delving into Figure 5, it can be observed that the vessel producing the least CO2eq per mass and distance traveled is the 400,000 DWT vessel, followed by the 325,000 DWT vessel, demonstrating that the scale effect positively contributes to emission reductions. Under certain conditions, albeit almost imperceptibly, the 250,000 DWT vessel becomes the most efficient, owing to longer port times and, consequently, reduced time burning fuel with the main engine during navigation. The reduction in mass of GHG emissions per mass and distance ranges from 19% to 31% between the 400,000 DWT vessel and the 250,000 DWT vessel, and from 13% to 19% for the 325,000 DWT vessel compared to the 250,000 DWT vessel.
Therefore, it can be concluded that, although the 400,000 DWT vessel is more efficient in terms of emissions per mass and distance compared to smaller versions, the 250,000 DWT vessel will outperform in terms of CO2eq emissions per mass of iron ore transported due to its route optimization.

4.4. EEDI Coefficient

The Energy Efficiency Design Indicator (EEDI) is a measure established by the IMO to promote energy efficiency in the design of new ships. It is part of the IMO strategy to reduce GHGs from international shipping. The difference from the KPI in Section 4.3 is that the EEDI currently considers only CO2 as a GHG, excluding N2O and CH4, and does not account for WtT emissions. The EEDI is calculated as the mass of CO2 emitted per mass and distance of cargo transported (e.g., the grams of CO2 emitted per ton of cargo transported over one nautical mile). This metric helps to evaluate how energy-efficient a ship design is, considering its engine power, fuel consumption, and the vessel operational profile, such as speed and cargo capacity. The EEDI sets mandatory minimum energy efficiency standards for new ships. These standards become progressively more stringent over time, with the aim of driving technological innovation and the adoption of cleaner, more efficient technologies in the maritime industry. The baseline values are adjusted periodically to reflect technological advancements and to progressively tighten emissions reduction targets in line with international climate goals. The Maximum EEDI value permitted by vessel segment is given in Table 10.
Table 11 presents the EEDI values for the various fuel combinations. At this point, it is essential to compare the baseline EEDI (Table 10) values with the EEDI values calculated for each ship type and fuel type. It is important to clarify that for the purpose of the EEDI calculation, only fossil fuel combinations will be considered. This is because the EEDI coefficient considers only TtW emissions. Therefore, until an update is made in this regard, the true environmental impact of alternative fuels cannot be accurately assessed, as their TtW emissions are currently treated as equivalent to conventional fuels without considering the WtT emissions [80,92], generally negative for alternative fuels. Additionally, it is worth noting that the EEDI does not account for methane slip emissions, which means LNG will appear to have a more favorable performance under this calculation.
By comparing the data in Table 10 and Table 11 several key conclusions can be drawn regarding the different fuel combinations. First, starting from 1 January 2025, combinations using VLSFO will require a significant reduction in service speed to meet the EEDI requirements (in fact, as it was said in the introduction, the 400,000 DWT vessels owned by Vale S.A are currently operating at 12 knots [25]). Second, it can be observed that from 1 January 2030, no vessel using any of these fuel combinations will be able to maintain its design operational profile if fossil fuels continue to be consumed. It is evident that LNG in both of its usage forms (with MGO as a pilot fuel or with MGO pilot and generator), performs considerably better than both methanol and VLSFO. This advantage is exacerbated due to the exclusion of methane slip emissions in the EEDI calculation. Last, and in line with the previous observation, it presents that the combination of MeOH with MGO results in a better EEDI score compared to VLSFO with MGO, which yields a somewhat contradictory result when considering actual CO2eq emissions discussed in Section 4.3.

4.5. CII Coefficients

The Carbon Intensity Indicator (CII) is a metric introduced by the IMO to measure and assess the carbon emissions efficiency of ships. It calculates the grams of CO2 emitted per cargo-carrying capacity and distance (gCO2/ton per mile) for a vessel over a year. The CII rating system ranges from A (most efficient) to E (least efficient), encouraging operators to improve energy efficiency and reduce emissions. It is part of the IMO strategy to achieve significant GHG reductions in the maritime industry. Unlike EEDI, the CII is not mandatory but serves as a baseline for comparison specific to each vessel and is updated over time. Table 12 shows the required CII values.
Regarding the conclusions on the CII, it can be stated that they are equivalent to those of the EEDI, as only TtW emissions are considered, disregarding methane slip. Table 13 presents the CII for each vessel along with its rating for 2025. CII ratings are assigned based on a scale rating where the efficiency index is determined dividing the CII calculated by the required CII. For bulk carriers, A is to be less than 0.86 to E more than 1.18. Vessels rated D, between 1.18 and 1.06, for three consecutive years or rated E for a single year must develop a corrective action plan to improve their efficiency. B rating is to be between 0.86 and 0.94 and C from 0.94 to 1.06. Compliance with the CII is generally less stringent than with the EEDI for this type of vessel. Moreover, the best fuels for improving the energy efficiency rating are the same as those that enhance the EEDI coefficient.

5. Conclusions

The maritime industry is a major contributor to global warming and air pollution, emitting large quantities of greenhouse gases (GHGs) that harm the environment and contribute to climate change. Around 60% of total emissions originate from bulk cargo vessels, with bulk carriers (vessels transporting dry bulk) being the most significant contributors, accounting for 27.5% of overall emissions. Within this vessel segment, ore carriers are identified as the main contributors to GHGs.
Prior to this work, there was no information on the GHG emission estimations for ore carriers. This article has addressed this issue for the first time in the available literature in a systematic way by analyzing three main categories of fuel combinations: fossil fuels, alternative fuels with fossil pilot fuels, and fully alternative fuels, each with different levels of emissions reduction and feasibility.
Among fossil fuels, Liquified Natural Gas (LNG) combined with Marine Gas Oil (MGO) used only as a pilot fuel emerges as the most viable short-term solution, achieving an 18% reduction in CO2eq emissions in comparison with the conventional fuel oil propulsion system. This makes LNG the only fossil fuel capable of reducing the actual levels of emissions. However, unburned methane emissions (methane slip) remain a concern as it significantly impacts greenhouse gas (GHG) emissions. Using LNG only in the main engine leads to an only slight efficiency loss (16–17% reduction).
For alternative fuels with fossil pilot fuels, bioLNG combined with MGO used only as a pilot fuel provides the largest emissions reduction (127%) in comparison with the fuel oil propulsion system, making it the most effective short-term alternative if availability improves. The advantage of bioLNG is that it leverages existing LNG infrastructure, minimizing the need for new bunkering facilities. However, securing a reliable supply of bioLNG remains a challenge, as production capacity is still limited and geographically dependent.
Looking toward full decarbonization of the maritime industry, the most effective long-term solution with only alternative fuels is synthetic methanol (eMeOH) combined with synthetic diesel (eDiesel) used only as a pilot fuel, achieving an 87% reduction in comparison with the conventional fuel oil propulsion system. eMeOH offers significant advantages over synthetic Liquified Natural Gas (eLNG), including simpler storage requirements, lower engine acquisition costs and expected lower production costs in the future.
Regarding the analyzed trade routes, their selection has a major impact on emissions, with the Australia–China route proving to be the most efficient one. Its shorter distance compared to the Brazil–China route enables a 40–50% reduction in CO2eq emissions per mass transported. This leads to the conclusion that prioritizing shorter routes for transporting the same material effectively reduces GHG emissions.
From a regulatory standpoint, LNG and MeOH improve Energy Efficiency Design Index (EEDI) and Carbon Intensity Indicator (CII) scores, ensuring compliance with IMO decarbonization targets in the near-term. LNG is already aligned with existing IMO regulations, making it an attractive choice for shipowners looking to transition quickly. However, current IMO efficiency metrics do not take into consideration unburned methane (methane slip) and Well-to-Tank-(WtT) emissions. Similarly, fossil MeOH true environmental benefits are overestimated in IMO regulatory calculations because CII and EEDI focus only on Tank-to-Wake (TtW) emissions and fully ignore Well-to-Wake (WtW) emissions. This regulatory gap must be addressed to ensure a fair and accurate comparison of all fuels.

Author Contributions

Conceptualization, Methodology, Validation, Formal Analysis, Investigation, Resources, Data Curation, Writing—Original Draft Preparation, Visualization: D.D.-C.; Writing—Review and Editing, Supervision, Project Administration: A.V.-H., T.J.L. and R.d.-D.; Writing—Review, Editing, Supervision, Project Administration and Funding Acquisition: T.J.L. All authors have read and agreed to the published version of the manuscript.

Funding

This research was funded by MCIN/AEI/10.13039/501100011033 and by “ERDF a way of making Europe” grant number PID2021-124263OB-I00. This work has been also conducted in the framework of the Project GreenH2CM funded by the Regional Government of Madrid and the Government of the Kingdom of Spain through the Recovery, Transformation and Resilience Plan (PRTR) funded by the European Union—NextGenerationEU.

Data Availability Statement

All data will be available on request.

Conflicts of Interest

The authors declare no conflicts of interest.

Abbreviations

The following abbreviations are used in this manuscript:
BBeam
bioDieselDiesel form biomass
bioLNGNatural gas (methane) from biomass
bioMeOHMethanol from biomass
CAPEXCapital Expenditure
CCSChina Classification Society
CH4Methane
CIICarbon Intensity Indicator
CO2Carbon dioxide
CO2eqImpact of different greenhouse gases in terms of the mass of CO2
DDepth
DWTDeadweight Tonnage
EEDIEnergy Efficiency Design Index
EEXIEnergy Efficiency Existing Ship Index
EUEuropean Union
eDieselSynthetic diesel
eLNGSynthetic natural gas (synthetic methane)
eMeOHSynthetic methanol
GHGGreenhouse gases
GTGross tonnage
GWPGlobal Warming Potential
HFOHeavy Fuel Oil
IGF CodeInternational Code of Safety for Ship Using Gases or Other Low-flashpoint Fuel
IMOInternational Maritime Organization
IMSBCInternational Maritime Solid Bulk Cargoes Code
LOALength overall
LBPLength between perpendiculars
LNGLiquified Natural Gas
mMass
MCRMaximum Continuous Rating (%)
MDOMarine Diesel Oil
MGOMarine Gas Oil
MSC.1/Circ.1621Guidelines for the safety of ships using methyl/ethyl alcohol as fuel
N2ONitrous oxide
NOxNitric oxide (NO) and nitrogen dioxide (NO2)
OPEXOperational expenditures
SOxSulfur dioxide (SO2) and sulfur trioxide (SO3)
TtWTank to Wake
VLOCVery Large Ore Carrier
VLCCVery Large Crude Carrier
VLSFOVery Low Sulfur Fuel Oil
WtTWell-to-Tank
Symbols
C C O 2 e q   T O T A L Total mass of CO2eq  g C O 2 e q
C C O 2 e q   T t W Mass of CO2eq produced during TtW without methane slip g C O 2 e q
C C O 2 e q   T t W   s l i p Mass of CO2eq produced during TtW due to methane slip g C O 2 e q
C C O 2 e q   T t W   T O T A L Total mass of CO2eq produced during TtW g C O 2 e q
C C O 2 e q   W t T Total mass of CO2eq produced during WtT g C O 2 e q
C O 2 e q   T t W   i , j Mass of CO2eq per energetic unit in TtW g C O 2 e q g f u e l
C O 2 e q   W t T   i Mass of CO2eq per unit of energy in WtT g C O 2 e q M J
C s f C H 4   i , j CH4 TtW GHG emission factor by slipped fuel i towards fuel consumer unit j g C H 4 g f u e l
C s f C O 2   i , j CO2 TtW GHG emission factor by slipped fuel i towards fuel consumer unit j g C O 2 g f u e l
C s f N 2 O   i , j N2O TtW GHG emission factor by slipped fuel i towards fuel consumer unit j g N 2 O g f u e l
C s l i p   j Non-combusted fuel (methane) coefficient as a percentage of the mass of the fuel i consumer unit j g C H 4 g f u e l
G W P C H 4 CH4 global warming potential g C O 2 e q g C H 4
G W P C O 2 CO2 global warming potential g C O 2 e q g C O 2
G W P N 2 O N2O global warming potential g C O 2 e q g N 2 O
L H V i Lower Heating value M J k g
m i Fuel consumed per engine at a specific regime of functioning in t o n
P j Unitary power of each engine k W
R j Regime of functioning of each engine %
S F O C i , j Specific Fuel Oil Consumption g k W · h
v r e f Reference speed of the vessel as calculated in the MEPC 79/15/Add.1 k n

Appendix A

Table A1. SFOC (g/kWh) for every engine (VLSFO, Very Low Sulfur Fuel Oil; LNG, Liquified Natural Gas; MeOH, methanol; MGO, Marine Gas Oil; SFOC, Specific Fuel Oil Consumption) [68,69,70,71].
SFOC (g/kWh)G80ME-C10.5
[68]
G80ME-C10.5-GI [69]G80-C10.5-LGIM [70]8L23/30H [71]8L23/30DF [72]8L23/30DF [72]
VLSFO 50%156.2
VLSFO 75%158.5
VLSFO 85%161.1
VLSFO 100%165.0
MGO 50% 3.912.9185.0
MGO 75% 3.09.9185.0
MGO 85% 2.89.2185.0
MGO 100% 2.58.2185.0
LNG 50% 126.8 150.0
LNG 75% 128.0 150.0
LNG 85% 130.6 150.0
LNG 100% 134.6 150.0

Appendix B

The continuous red line represents the emissions of the vessel operating with VLSFO and MGO, meaning that any fuel combination exceeding this threshold would result in a penalty compared to the current propulsion system and should therefore be ruled out as an option. The dashed column represents fossil fuels, the one with crossed lines represents alternative fuels plus MGO, and the solid bars represent only alternative fuels. The error bars represent the reliability margins considered in the calculation of WtT emissions. These error bars are smaller for traditional fuels due to the extensive experience and data available regarding their production. However, they are larger for alternative fuels, particularly for newer options that are still undergoing feasibility studies.
Figure A1. WtT CO2eq emissions (ton) per fuel combination (400,000 DWT).
Jmse 13 01313 g0a1
Figure A2. TtW CO2eq emissions (ton) per fuel combination (400,000 DWT).
Jmse 13 01313 g0a2
Figure A3. TOTAL CO2eq emissions (ton) per fuel combination (400,000 DWT).
Jmse 13 01313 g0a3
Figure A4. WtT CO2eq emissions (ton) per fuel combination (325,000 DWT).
Jmse 13 01313 g0a4
Figure A5. TtW CO2eq emissions (ton) per fuel combination (325,000 DWT).
Jmse 13 01313 g0a5
Figure A6. TOTAL CO2eq emissions (ton) per fuel combination (325,000 DWT).
Jmse 13 01313 g0a6
Figure A7. WtT CO2eq emissions (ton) per fuel combination (250,000 DWT).
Jmse 13 01313 g0a7
Figure A8. TtW CO2eq emissions (ton) per fuel combination (250,000 DWT).
Jmse 13 01313 g0a8
Figure A9. TOTAL CO2eq emissions (ton) per fuel combination (250,000 DWT).
Jmse 13 01313 g0a9

References

  1. IMO. Resolution MEPC.377(80). Strategy on Reduction of GHG Emissions from Ships. 2023. Available online: https://wwwcdn.imo.org/localresources/en/MediaCentre/PressBriefings/Documents/Resolution%20MEPC.377(80).pdf (accessed on 12 February 2025).
  2. IMO. IMO Review of Maritime Transport 2023. 2023. Available online: https://unctad.org/system/files/official-document/rmt2023_en.pdf (accessed on 12 February 2025).
  3. IMO. International Convention for the Prevention of Pollution from Ships. Amended by Resolution MEPC.330(76) and Previous Ones. 2022. Available online: https://wwwcdn.imo.org/localresources/en/KnowledgeCentre/IndexofIMOResolutions/MEPCDocuments/MEPC.330(76).pdf (accessed on 12 February 2025).
  4. Herdzik, J. Decarbonization of marine fuels—The future of shipping. Energies 2021, 14, 4311. Available online: https://www.researchgate.net/publication/353335037_Decarbonization_of_Marine_Fuels-The_Future_of_Shipping (accessed on 12 February 2025). [CrossRef]
  5. IMO. Resolution MEPC.364(79). Guidelines on the Method of Calculation of the Attained Energy Efficiency Design Index (EEDI) for New Ships. 2022. Available online: https://wwwcdn.imo.org/localresources/en/KnowledgeCentre/IndexofIMOResolutions/MEPCDocuments/MEPC.364%2879%29.pdf (accessed on 12 February 2025).
  6. IMO. Resolution MEPC.333(76). Guidelines on the Method of Calculation of the Attained Energy Efficiency Existing Index (EEXI). 2021. Available online: https://wwwcdn.imo.org/localresources/en/KnowledgeCentre/IndexofIMOResolutions/MEPCDocuments/MEPC.333(76).pdf (accessed on 12 February 2025).
  7. IMO. Resolution MEPC.336(76). Guidelines on Operational Carbon Intensity Indicators and the Calculation Methods (CII). 2021. Available online: https://wwwcdn.imo.org/localresources/en/KnowledgeCentre/IndexofIMOResolutions/MEPCDocuments/MEPC.336(76).pdf (accessed on 12 February 2025).
  8. Mallouppas, G.; Yfantis, E.A. Decarbonization in shipping industry: A review of research, technology development, and innovation proposals. J. Mar. Sci. Eng. 2021, 9, 415. [Google Scholar] [CrossRef]
  9. FBI. Iron Ore Market Size, Share & Industry Analysis, By Type (Hematite, Magnetite, and Others), By Application (Steel Production and Others), and Regional Forecast, 2024–2032. 2024. Available online: https://www.fortunebusinessinsights.com/iron-ore-market-108698 (accessed on 12 February 2025).
  10. Chen, S.; Miao, C.; Zhang, Q. Understanding the evolution of China’s green shipping policies: Evidence by social network analysis. J. Clean. Prod. 2024, 482, 144204. [Google Scholar] [CrossRef]
  11. Hauhia, E. Bulk Shipping in Numbers and Emissions. SEABER 2021. Available online: https://www.seaber.io/blog/bulk-shipping-numbers-emissions#:~:text=Bulk%20shipping%20accounts%20for%20368,down%20this%20number%20even%20further (accessed on 12 February 2025).
  12. USDA. Bulk Vessel Fleet; United States Department of Agriculture (USDA): Washington, DC, USA, 2020. Available online: https://agtransport.usda.gov/stories/s/Bulk-Vessel-Fleet-Size-and-Rates/bwaz-8sgs/ (accessed on 17 September 2024).
  13. IMO. International Maritime Solid Bulk Cargoes Code (IMSBC). 2019. Available online: https://wwwcdn.imo.org/localresources/en/KnowledgeCentre/IndexofIMOResolutions/MSCResolutions/MSC.462(101).pdf (accessed on 12 February 2025).
  14. BV. 467-NR_PartA_2024-01. 2024. Available online: https://erules.veristar.com/dy/data/bv/pdf/archives/467-NR_PartC_2024-01.pdf (accessed on 12 February 2025).
  15. CCS. Performances and Services on Ore Carriers. 2024. Available online: https://drive.google.com/drive/folders/1SRH8kc7TX7gUaltsBxQyr8vIpkIRQj-4?usp=drive_link (accessed on 5 March 2024).
  16. Wang, Y.; Du, L.; Jin, Q. Decarbonization Path of Bulk Carrier Based on Economic Analysis. Ship Boat 2023, 34, 28. [Google Scholar]
  17. Radonja, R.; Bebić, D.; Glujić, D. Methanol and ethanol as alternative fuels for shipping. Promet-Traffic Transp. 2019, 31, 321–327. [Google Scholar] [CrossRef]
  18. Kuai, J.; Lu, H. On Design of Large Methanol Dual-Fuel Bulk Carrier. Ship Boat 2024, 35, 109. [Google Scholar]
  19. Díaz-Cuenca, D. Anteproyecto de un Buque Mineralero ULOC de 400.000 T de Peso Muerto Propulsado Con Metanol. Master’s Thesis, Universidad Politécnica de Madrid, Madrid, Spain, 2024. [Google Scholar]
  20. Adami, G.; Figari, M. Feasibility analysis of a methanol fuelled bulk carrier. Model. Optim. Ship Energy Syst. 2023. [Google Scholar] [CrossRef]
  21. Corbett, J.J.; Winebrake, J.J. Life Cycle Analysis of the Use of Methanol for Marine Transportation. Prepared for US Department of Transportation Maritime Administration (MARAD). 2018. Available online: https://www.maritime.dot.gov/sites/marad.dot.gov/files/docs/innovation/meta/11056/marine-methanol-report-20180810final-002.pdf (accessed on 12 February 2025).
  22. Rachow, M.; Loest, S.; Bramastha, A.D. Analysis of the requirement for the ships using methanol as fuel. Int. J. Mar. Eng. Innov. Res. 2018, 3, 59–68. [Google Scholar] [CrossRef]
  23. Wang, L.; Lei, J.; Xing, H.; Ji, Y.; Pan, C. Research on the development path of methanol fuel powered ships in China. In Advances in Energy, Environment and Chemical Engineering; CRC Press: Boca Raton, FL, USA, 2022; Volume 1, pp. 515–521. [Google Scholar]
  24. Harahap, F.; Nurdiawati, A.; Conti, D.; Leduc, S.; Urban, F. Renewable marine fuel production for decarbonised maritime shipping: Pathways, policy measures and transition dynamics. J. Clean. Prod. 2023, 415, 137906. [Google Scholar] [CrossRef]
  25. Wang, J.; Zhang, W.; Wang, Y. The sensitivity to metocean data on using data-driven methods for a Valemax vessel speed prediction. Ocean Eng. 2022, 252, 111155. [Google Scholar] [CrossRef]
  26. Dotto, A.; Satta, F.; Campora, U. Energy, environmental and economic investigations of cruise ships powered by alternative fuels. Energy Convers. Manag. 2023, 285, 117011. [Google Scholar] [CrossRef]
  27. Rivarolo, M.; Rattazzi, D.; Magistri, L.; Massardo, A.F. Multi-criteria comparison of power generation and fuel storage solutions for maritime application. Energy Convers. Manag. 2021, 244, 114506. [Google Scholar] [CrossRef]
  28. McKinlay, C.J.; Turnock, S.R.; Hudson, D.A. Route to zero emission shipping: Hydrogen, ammonia or methanol? Int. J. Hydrogen Energy 2021, 46, 28282–28297. [Google Scholar] [CrossRef]
  29. Jimenez, V.J.; Kim, H.; Munim, Z.H. A review of ship energy efficiency research and directions towards emission reduction in the maritime industry. J. Clean. Prod. 2022, 366, 132888. [Google Scholar] [CrossRef]
  30. Dierickx, J.; Beyen, J.; Block, R.; Hamrouni, M.; Huyskens, P.; Meichelböck, C.; Verhelst, S. Strategies for Introducing Methanol as an Alternative Fuel for Shipping. 7th Transport Research Arena TRA 2018 (TRA 2018); Ghent University: Ghent, Belgium, 2018; pp. 1–10. [Google Scholar]
  31. Dettner, F.; Hilpert, S. Modelling CO2 emissions and mitigation potential of Northern European shipping. Transp. Res. Part D Transp. Environ. 2023, 119, 103745. [Google Scholar] [CrossRef]
  32. Svanberg, M.; Ellis, J.; Lundgren, J.; Landälv, I. Renewable methanol as a fuel for the shipping industry. Renew. Sustain. Energy Rev. 2018, 94, 1217–1228. [Google Scholar] [CrossRef]
  33. Ghosh, A.K. Impact of EEDI and EEXI on Bulk Carriers. In Proceedings of the INEC, Delft, The Netherlands, 8–10 November 2022; Available online: https://www.researchgate.net/publication/364764649_Impact_of_EEDI_and_EEXI_on_Bulk_Carriers (accessed on 12 February 2025).
  34. Cao, N.N.D.; Andrianov, D.; Vecchi, A.; Davis, D.; Brear, M.J. Achieving affordable, clean shipping by integrating ship design and clean fuels. Transp. Res. Part D Transp. Environ. 2025, 139, 104579. [Google Scholar] [CrossRef]
  35. Zincir, B.A.; Arslanoglu, Y. Comparative Life Cycle Assessment of Alternative Marine Fuels. Fuel 2024, 358, 129995. [Google Scholar] [CrossRef]
  36. Nemmour, A.; Inayat, A.; Janajreh, I.; Ghenai, C. Green hydrogen-based E-fuels (E-methane, E-methanol, E-ammonia) to support clean energy transition: A literature review. Int. J. Hydrogen Energy 2023, 48, 29011–29033. [Google Scholar] [CrossRef]
  37. Calise, F.; Cappiello, F.L.; Cimmino, L.; d’Accadia, M.D.; Vicidomini, M. A review of the state of the art of biomethane production: Recent advancements and integration of renewable energies. Energies 2021, 14, 4895. [Google Scholar] [CrossRef]
  38. Grabow, L.C.; Mavrikakis, M. Mechanism of methanol synthesis on Cu through CO2 and CO hydrogenation. ACS Catal. 2011, 1, 365–384. [Google Scholar] [CrossRef]
  39. Subudhi, S.; Saha, K.; Mudgil, D.; Sarangi, P.K.; Srivastava, R.K.; Sarma, M.K. Biomethanol production from renewable resources: A sustainable approach. Environ. Sci. Pollut. Res. 2023, 32, 1–17. [Google Scholar] [CrossRef] [PubMed]
  40. Dell’Aversano, S.; Villante, C.; Gallucci, K.; Vanga, G.; Di Giuliano, A. E-Fuels: A Comprehensive Review of the Most Promising Technological Alternatives towards an Energy Transition. Energies 2024, 17, 3995. [Google Scholar] [CrossRef]
  41. Monteiro, M.R.; Kugelmeier, C.L.; Pinheiro, R.S.; Batalha, M.O.; da Silva César, A. Glycerol from biodiesel production: Technological paths for sustainability. Renew. Sustain. Energy Rev. 2018, 88, 109–122. [Google Scholar] [CrossRef]
  42. Matteo, P.; Marta, Y.; Luis, D.P.; Monica, P.; Robert, E.; Laura, L. JEC Well-to-Tank Report v5; Publications Office of the European Union: Luxembourg, 2020. [Google Scholar] [CrossRef]
  43. Marrero, Á.; Martínez-López, A. Decarbonization of Short Sea Shipping in European Union: Impact of market and goal based measures. J. Clean. Prod. 2023, 421, 138481. [Google Scholar] [CrossRef]
  44. Chen, Z. Study on Risk Assessment of Methanol Fueled Ship 2021. Available online: https://commons.wmu.se/cgi/viewcontent.cgi?article=1301&context=msem_dissertations (accessed on 12 February 2025).
  45. Bayraktar, M.; Yuksel, O.; Pamik, M. An evaluation of methanol engine utilization regarding economic and upcoming regulatory requirements for a container ship. Sustain. Prod. Consum. 2023, 39, 345–356. [Google Scholar] [CrossRef]
  46. Taghavifar, H.; Perera, L.P. Life cycle emission and cost assessment for LNG-retrofitted vessels: The risk and sensitivity analyses under fuel property and load variations. Ocean Eng. 2023, 282, 114940. [Google Scholar] [CrossRef]
  47. SEA-LNG.ORG. LNG as a Marine Fuel-the Investment Opportunity Sea\Lng Study-Newbuild 300k dwt Very Large Crude Carrier (VLCC) Sailing from the Arabian Gulf to China. 2020. Available online: https://sea-lng.org/wp-content/uploads/2020/04/SEA-LNGStudyVLCC4_compressed.pdf (accessed on 12 February 2025).
  48. Karin Andersson CMS. Methanol as a Marine Fuel Report. 2015. Available online: https://www.methanol.org/wp-content/uploads/2018/03/FCBI-Methanol-Marine-Fuel-Report-Final-English.pdf (accessed on 12 February 2025).
  49. Hagen, G. The State of Methanol as Marine Fuel 2023. Sustain Ships. 2023. Available online: https://www.sustainable-ships.org/stories/2023/methanol-marine-fuel (accessed on 12 February 2025).
  50. Xing, H.; Stuart, C.; Spence, S.; Chen, H. Alternative fuel options for low carbon maritime transportation: Pathways to 2050. J. Clean. Prod. 2021, 297, 126651. [Google Scholar] [CrossRef]
  51. Ship & Bunker. 2025. Available online: https://shipandbunker.com/prices/av/global/av-g20-global-20-ports-average (accessed on 12 February 2025).
  52. Souissi, N. E-Diesel in the Shipping Sector: Prospects and Challenges. OIES Paper: ET. 2024. Available online: https://www.oxfordenergy.org/wpcms/wp-content/uploads/2024/03/ET30-E-diesel-in-the-Shipping-Sector-Final_NS.pdf (accessed on 12 February 2025).
  53. Gebremariam, S.N.; Marchetti, J.M. Economics of biodiesel production: Review. Energy Convers. Manag. 2018, 168, 74–84. [Google Scholar] [CrossRef]
  54. Pasha, M.K.; Dai, L.; Liu, D.; Guo, M.; Du, W. An overview to process design, simulation and sustainability evaluation of biodiesel production. Biotechnol. Biofuels 2021, 14, 1–23. [Google Scholar] [CrossRef]
  55. Qi, M.; Liu, Y.; He, T.; Yin, L.; Shu, C.-M.; Moon, I. System perspective on cleaner technologies for renewable methane production and utilisation towards carbon neutrality: Principles, techno-economics, and carbon footprints. Fuel 2022, 327, 125130. [Google Scholar] [CrossRef]
  56. Gorre, J.; Ortloff, F.; van Leeuwen, C. Production costs for synthetic methane in 2030 and 2050 of an optimized Power-to-Gas plant with intermediate hydrogen storage. Appl. Energy 2019, 253, 113594. [Google Scholar] [CrossRef]
  57. Mukherjee, A.; Bruijnincx, P.; Junginger, M. Techno-economic competitiveness of renewable fuel alternatives in the marine sector. Renew. Sustain. Energy Rev. 2023, 174, 113127. [Google Scholar] [CrossRef]
  58. IRENA. Innovation Outlook: Renewable Methanol; International Renewable Energy Agency (IRENA): Abu Dhabi, United Arab Emirates, 2021. [Google Scholar]
  59. Vandebroek, L.; Berghmans, J. Safety Aspects of the use of LNG for Marine Propulsion. Procedia Eng. 2012, 45, 21–26. [Google Scholar] [CrossRef]
  60. IMO. Safety for Ships Using Gases or Other Low-Flashpoint Fuels (IGF Code). 2017. Available online: https://www.imo.org/en/ourwork/safety/pages/igf-code.aspx (accessed on 12 February 2025).
  61. Ammar, N.R. An environmental and economic analysis of methanol fuel for a cellular container ship. Transp. Res. Part D Transp. Environ. 2019, 69, 66–76. [Google Scholar] [CrossRef]
  62. IMO. MSC.1-Circ.1621 Guidelines for the Safety of Ships Using Methyl/Ethyl Alcohol as Fuel. 2020. Available online: https://wwwcdn.imo.org/localresources/fr/Documents/MSC.1-Circ.1621.pdf (accessed on 12 February 2025).
  63. Kawasaki, A.; Liang, C. East China LNG Bunker Prices More Competitive After New Barge Addition: Sources. S&P Global. 2025. Available online: https://www.spglobal.com/commodity-insights/en/news-research/latest-news/lng/012425-east-china-lng-bunker-prices-more-competitive-after-new-barge-addition-sources (accessed on 14 February 2025).
  64. Ovcina Mandra, J. World’s Largest LNG Bunkering Vessel Refuels First VLCC in Milestone Operation. Offshore Energy. 2023. Available online: https://www.offshore-energy.biz/worlds-largest-lng-bunkering-vessel-refuels-first-vlcc-in-milestone-operation/ (accessed on 12 February 2025).
  65. Ovcina Mandra, J. China Debuts Its First Methanol Bunkering Vessel. Offshore Energy. 2024. Available online: https://www.offshore-energy.biz/china-debuts-its-first-methanol-bunkering-vessel/ (accessed on 17 February 2025).
  66. Wijaya, M. Pilbara Clean Fuels to Develop eLNG Bunkering Facility with Oceania Marine. Lloyd’s List. 2023. Available online: https://www.lloydslist.com/LL1143479/Pilbara-Clean-Fuels-to-develop-eLNG-bunkering-facility-with-Oceania-Marine (accessed on 14 February 2025).
  67. Aluko, L. The Growing Bunker Fuel Opportunity in Brazil. Illuminem. 2023. Available online: https://illuminem.com/illuminemvoices/the-growing-bunker-fuel-opportunity-in-brazil (accessed on 14 February 2025).
  68. MAN. G80ME-C10.5. 2023. Available online: https://drive.google.com/drive/folders/1SRH8kc7TX7gUaltsBxQyr8vIpkIRQj-4?usp=drive_link (accessed on 4 April 2024).
  69. MAN. G80ME-C10.5-GI. 2024. Available online: https://man-es.com/applications/projectguides/2stroke/content/printed/G80ME-C10_5-GI.pdf (accessed on 7 March 2025).
  70. MAN. G80ME-C10.5-LGIM. 2024. Available online: https://drive.google.com/drive/folders/1SRH8kc7TX7gUaltsBxQyr8vIpkIRQj-4?usp=drive_link (accessed on 11 April 2024).
  71. MAN. GenSet-L23/30H. 2024. Available online: https://www.man-es.com/docs/default-source/document-sync-archive/man-l23-30h-mk-3genset-eng.pdf?sfvrsn=bdb4d4f7_2 (accessed on 1 October 2024).
  72. MAN. GenSet-L23/30DF. 2024. Available online: https://www.man-es.com/docs/default-source/document-sync-archive/man-l23-30df-eng.pdf?sfvrsn=7a9b60b8_3 (accessed on 1 October 2024).
  73. Astra Paging Ltd. VesselFinder. 2024. Available online: https://www.vesselfinder.com/vessels/details/9806873 (accessed on 14 November 2024).
  74. SeaDistance. SEA-DISTANCE.ORG. 2024. Available online: https://sea-distances.org/ (accessed on 8 November 2024).
  75. ABS. Ocean Pacific (Ore Carrier). American Bureau of Shipping. 2024. Available online: https://absrecord.eagle.org/#/absrecord/details (accessed on 31 October 2024).
  76. ABS. Ore Wuhan (Ore Carrier). American Bureau of Shipping. 2024. Available online: https://absrecord.eagle.org/#/absrecord/details (accessed on 31 October 2024).
  77. ABS. Ore Zhanjiang (Ore Carrier). American Bureau of Shipping. 2024. Available online: https://absrecord.eagle.org/#/absrecord/details (accessed on 31 October 2024).
  78. Wikipedia. Chinamax. 2024. Available online: https://en.wikipedia.org/wiki/Chinamax (accessed on 30 August 2024).
  79. RINA. Yuan He Hai (ULOC). In Significant Ships 2018; The Royal Institution of Naval Architect: London, UK, 2018; pp. 82–83. [Google Scholar]
  80. Zamboni, G.; Scamardella, F.; Gualeni, P.; Canepa, E. Comparative analysis among different alternative fuels for ship propulsion in a well-to-wake perspective. Heliyon 2024, 10, e26016. [Google Scholar] [CrossRef]
  81. EU. Regulation (EU) 2023/1805 of the European Parliament and of the Council of 13 September 2023 on the Use of Renewable and Low-Carbon Fuels in Maritime Transport, and Amending Directive 2009/16/EC. 2023. Available online: https://eur-lex.europa.eu/legal-content/EN/TXT/PDF/?uri=CELEX:32023R1805 (accessed on 12 February 2025).
  82. Yuan, J.; Ng, S.H.; Sou, W.S. Uncertainty quantification of CO2 emission reduction for maritime shipping. Energy Policy 2016, 88, 113–130. [Google Scholar] [CrossRef]
  83. EU. Directive (EU) 2018/2001 of the European Parliament and of the Council of 11 December 2018 on the Promotion of the Use of Energy from Renewable Sources. 2018. Available online: https://eur-lex.europa.eu/legal-content/EN/TXT/PDF/?uri=CELEX:32018L2001 (accessed on 12 February 2025).
  84. EU. JEC Well-to-Tank Report v5. Luxembourg. 2020. Available online: https://publications.jrc.ec.europa.eu/repository/handle/JRC119036 (accessed on 12 February 2025).
  85. Carvalho, F.; Müller-Casseres, E.; Poggio, M.; Nogueira, T.; Fonte, C.; Wei, H.K.; Portugal-Pereira, J.; Rochedo, P.R.R.; Szklo, A.; Schaeffer, R. Prospects for carbon-neutral maritime fuels production in Brazil. J. Clean. Prod. 2021, 326, 129385. [Google Scholar] [CrossRef]
  86. Hörteborn, A.; Hassellöv, I.-M. Economic incentives and technological limitations govern environmental impact of LNG feeder vessels. J. Clean. Prod. 2023, 429, 139461. [Google Scholar] [CrossRef]
  87. Kuittinen, N.; Koponen, P.; Vesala, H.; Lehtoranta, K. Methane slip and other emissions from newbuild LNG engine under real-world operation of a state-of-the art cruise ship. Atmos. Environ. X 2024, 23, 100285. [Google Scholar] [CrossRef]
  88. Lehtoranta, K.; Kuittinen, N.; Vesala, H.; Koponen, P. Methane Emissions from a State-of-the-Art LNG-Powered Vessel. Atmosphere 2023, 14, 825. [Google Scholar] [CrossRef]
  89. Kuittinen, N.; Heikkilä, M.; Jalkanen, J.-P.; Aakko-Saksa, P.; Lehtoranta, K. Methane slip emissions from LNG vessels-review. In Proceedings of the 30th CIMAC World Congress, Busan, Republic of Korea, 12–16 June 2023; p. 629. [Google Scholar]
  90. IMO. Resolution MEPC 391(81). Study of Actual Methane Slip from Newbuild LNG Engine of a State-of-the Art Cruise Ship. 2024. Available online: https://greenray-project.eu/wp-content/uploads/2024/11/MEPC-82-INF.16-Study-of-actual-methane-slip-from-newbuild-LNG-engine-ofa-state-of-the-art-cruise-ship-Finland-002.pdf (accessed on 12 February 2025).
  91. Atkins, P.; Milton, G.; Atkins, A.; Morgan, R. A local ecosystem assessment of the potential for net negative heavy-duty truck greenhouse gas emissions through biomethane upcycling. Energies 2021, 14, 806. [Google Scholar] [CrossRef]
  92. Adami, G.; Figari, M. Multi-Parametric Methodology for the Feasibility Assessment of Alternative-Fuelled Ships. J. Mar. Sci. Eng. 2024, 12, 905. [Google Scholar] [CrossRef]
Figure 1. CO2 emissions by vessel segment [2,11].
Jmse 13 01313 g001
Figure 2. Flowchart for the development of the work (CAPEX, capital expenditure; OPEX, operational expenditure).
Jmse 13 01313 g002
Figure 3. Emission calculation framework (v, service speed; SFOC, Specific Fuel Oil Consumption).
Jmse 13 01313 g003
Figure 4. Column chart representing kg of CO2eq produced per ton of iron ore transported by vessel segment (the dotted bar represents the 400,000 DWT vessel, the bar with diagonal lines corresponds to the 325,000 DWT vessel, and the solid bar represents the 250,000 DWT vessel; VLSFO, Very Low Sulfur Fuel Oil; MGO, Marine Gas Oil; LNG, Liquified Natural Gas; MeOH, methanol; bioLNG, Liquified Natural Gas from biomass; bioMeOH, methanol from biomass; eLNG, synthetic Liquified Natural Gas; eMeOH, synthetic methanol; bioDiesel, diesel from biomass; eDiesel, synthetic diesel).
Jmse 13 01313 g004
Figure 5. Column chart representing the grams of CO2eq emissions per ton and per mile of Iron Ore transported by vessel segment (the dotted bar represents the 400,000 DWT vessel, the bar with diagonal lines corresponds to the 325,000 DWT vessel, and the solid bar represents the 250,000 DWT vessel; VLSFO, Very Low Sulfur Fuel Oil; MGO, Marine Gas Oil; LNG, Liquified Natural Gas; MeOH, methanol; bioLNG, Liquified Natural Gas from biomass; bioMeOH, methanol from biomass; eLNG, synthetic Liquified Natural Gas; eMeOH, synthetic methanol; bioDiesel, diesel from biomass; eDiesel, synthetic diesel).
Jmse 13 01313 g005
Table 1. Actual and expected operational costs for 2050 of the distinct fuels under analysis. (VLSFO, Very Low Sulfur Fuel Oil; MGO, Marine Gas Oil; LNG, Liquified Natural Gas; MeOH, methanol; bioLNG, Liquified Natural Gas from biomass; bioMeOH, methanol from biomass; eLNG, synthetic Liquified Natural Gas; eMeOH, synthetic methanol; bioDiesel, diesel from biomass; eDiesel, synthetic diesel).
FuelReference Date of the Current CostActual Cost (USD/t)Actual Cost (USD/GJ)Expected Cost 2050 (USD/t)Expected Cost 2050 (USD/GJ)Reference
VLSFO (0.5% S)12 February 2025570–63214.1–15.6--[51]
MGO (0.1% S)12 February 2025726–81717.0–19.1--[51]
eDiesel20231778–549541.6–128.7800–475018.7–111.2[52]
bioDiesel2021632–241514.8–56.5--[53,54]
LNG12 February 2025725–104114.8–21.2--[51]
eLNG20223678–21,14274.9–430.6972–836219.8–170.3[55,56]
bioLNG20221473–294630.0–60.0--[57]
MeOH12 February 2025360–46818.1–23.5--[51]
eMeOH2021820–238041.2–119.6250–63012.6–31.7[58]
bioMeOH2021327–101316.4–50.9227–88411.4–44.4[58]
Table 2. Summary of routes by type of vessel (DWT, Deadweight Tonnage) [74].
Vessel TypeDepartureArrivalDistance (km)Sailing Time (Days)
400,000 & 325,000 DWTPort Tubarao (Brazil)Port Tianjin (China)18,31832.5
250,000 DWTPort Headland (Australia)Port Tianjin (China)740013.3
Table 3. Operational profile for the three vessel segments (Nº ME, number of main engines operating; RM, regime of operation of the main engine; Nº GE, number of gen-sets operating; RN, regime of operation of the gen-sets) [19].
Operational ConditionsNº MERM (%)Nº GERN (%)Time at Port (Days)
Sailing Full Load1/1851/385-
Sailing Ballast Load1/1501/385-
Loading/Unloading0/1-2/3852 × 2.5
Stay at Port0/1-1/3752 × 0.5
Table 4. Main characteristics of the nine vessels (DWT, Deadweight Tonnage; MCR, maximum continuous rate) [19,75,76,77,78,79].
Analysis
Scenarios
Main EngineMCR (kW)Maximum Cargo
Capacity (t)
Main Fuel
Consumption (t)
MGO/Diesel
Consumption (t)
400,000 DWT (VLSFO)7G80ME-C10.524,200392,0564059.0385.2
400,000 DWT (LNG)7G80ME-C10.5-GI24,200392,8133292.8 + 312.381.7
400,000 DWT (MeOH)7G80ME-C10.5-LGIM24,200387,4577961.6 + 812.0269.7
325,000 DWT (VLSFO)7G80ME-C10.521,000317,8633522.3385.2
325,000 DWT (LNG)7G80ME-C10.5-GI21,000318,5292857.4 + 312.370.9
325,000 DWT (MeOH)7G80ME-C10.5-LGIM21,000313,8156908.8 + 812.0234.0
250,000 DWT (VLSFO)6G80ME-C10.518,000247,1451234.7190.2
250,000 DWT (LNG)6G80ME-C10.5-GI18,000247,3891001.7 + 154.224.9
250,000 DWT (MeOH)6G80ME-C10.5-LGIM18,000245,6652421.9 + 400.982.0
Table 5. Fuel properties (LHV, Lower Heating Value; VLSFO, Very Low Sulfur Fuel Oil; MGO, Marine Gas Oil; LNG, Liquified Natural Gas) [5].
FuelLHV (MJ/kg)ρ (kg/m3)Carbon
Content
Cf
(m CO2/m Fuel)
VLSFO40.509500.85943.151
Diesel/MGO42.709000.87443.206
LNG48.004500.75002.750
MeOH19.907900.37501.375
Table 6. Global warming potential of the exhaust gases for 100 years [81].
Chemical CompoundGWP100 (m CO2eq/m Compound)
CO21
CH425
N2O298
Table 7. gCO2eq produce per MJ of fuel in the WtT scenario (E, CO2eq emissions that are generated during the production of each fuel; LHV, Lower Heating Value; C O 2 e q   W t T i , CO2eq mass production per fuel mass burned; bioLNG, Liquified Natural Gas from biomass; bioMeOH, methanol from biomass; eLNG, synthetic Liquified Natural Gas; eMeOH, synthetic methanol; bioDiesel, diesel from biomass; eDiesel, synthetic diesel) [5,42,81,83,84].
FuelLHV
(MJ/kg)
CfCO2
(kg CO2/kg Fuel)
E (gCO2eq/MJ) C O 2 e q W t T i (gCO2eq/MJ)
MinWtT
Selected
MaxMinWtT
Selected
Min
VLSFO40.53.15113.213.213.213.213.213.2
MGO42.73.20613.114.417.013.114.417.0
LNG49.12.75016.616.616.616.616.616.6
MeOH19.91.37531.331.331.331.331.331.3
bioDiesel42.73.2068.348.463.3−66.3−26.2−11.3
bioLNG49.12.750−98.7−30.130.5−154.7−86.1−25.5
bioMeOH19.91.3754.445.0100−64.7−24.130.9
eDiesel42.73.206−105.127.5130.3−180.2−47.655.2
eLNG49.12.7502.425.325.3−53.6−30.7−30.7
eMeOH19.91.3751.810.5124.3−67.3−58.655.2
Table 8. gCO2eq produced per MJ of fuel in TtW scenario ( C s f   C O 2 , CO2 mass production per fuel mass; C s f C H 4 , CH4 mass production per fuel mass; C s f N 2 O , N2O mass production per fuel mass; C f T t W , total mass of CO2eq per mass of fuel; C s l i p , methane slip as a percentage of fuel consumption) [5,42,81,83,84].
FuelFuel Consumer Unit Class C s f C O 2 (m CO2/m Fuel) C s f C H 4
(m CH4/m Fuel)
C s f N 2 O
(m N2O/m Fuel)
C f T t W
(m CO2eq/m Fuel)
C s l i p *
(%)
VLSFOALL ICEs3.1510.000050.000183.2060
MGOALL ICEs3.2060.000050.000183.2610
LNGLNG Diesel2.75000.000112.7830.2
LNGLNG Otto (M)2.75000.000112.7833.1
MeOHALL ICEs1.375001.3750
bioDieselALL ICEs3.2060.000050.000183.2610
bioLNGLNG Diesel2.75000.000112.7830.2
bioLNGLNG Otto (M)2.75000.000112.7833.1
bioMeOHALL ICEs1.375001.3750
eDieselALL ICEs3.2060.000050.000183.2610
eLNGLNG Diesel2.75000.000112.7830.2
eLNGLNG Otto (M)2.75000.000112.7833.1
eMeOHALL ICEs1.375001.3750
* As a percentage of the fuel consumed.
Table 9. Potential CO2eq emissions reduction per fuel combination (JEC path [84]) in a unitary voyage establishing the baseline with the combination of fuels currently in use. (VLSFO, Very Low Sulfur Fuel Oil; MGO, Marine Gas Oil; LNG, Liquified Natural Gas; MeOH, methanol; bioLNG, Liquified Natural Gas from biomass; bioMeOH, methanol from biomass; eLNG, synthetic Liquified Natural Gas; eMeOH, synthetic methanol; bioDiesel, diesel from biomass; eDiesel, synthetic diesel; pilot only, use of the fuel only as pilot fuel in the main engine; gen + pilot, use as pilot fuel in the main engine and main fuel in the gen-sets).
Fuel Combinations400,000 DWT
Emissions
Reduction (%)
325,000 DWT
Emissions
Reduction (%)
250,000 DWT
Emissions
Reduction (%)
1. VLSFO + MGO0%0%0%
2. LNG + MGO (pilot only)−18%−18%−19%
3. LNG + MGO (gen + pilot)−17%−17%−17%
4. MeOH + MGO (pilot only)11%11%10%
5. MeOH + MGO (gen + pilot)11%10%9%
6. bioLNG + MGO (pilot only)−127%−127%−126%
7. bioLNG + MGO (gen + pilot)−117%−115%−110%
8. bioMeOH + MGO (pilot only)−47%−47%−48%
9. bioMeOH + MGO (gen + pilot)−42%−41%−41%
10. eLNG + MGO (pilot only)−68%−68%−68%
11. eLNG + MGO (gen + pilot)−63%−62%−60%
12. eMeOH + MGO (pilot only)−83%−83%−83%
13. eMeOH + MGO (gen + pilot)−75%−74%−71%
14. bioDiesel−43%−43%−44%
15. eDiesel−67%−67%−68%
16. bioLNG + bioDiesel (pilot only)−128%−128%−127%
17. bioLNG + bioDiesel (gen + pilot)−122%−121%−117%
18. bioMeOH + bioDiesel (pilot only)−49%−49%−50%
19. bioMeOH + bioDiesel (gen + pilot)−49%−49%−49%
20. bioLNG + eDiesel (pilot only)−128%−128%−127%
21. bioLNG + eDiesel (gen + pilot)−124%−123%−121%
22. bioMeOH + eDiesel (pilot only)−51%−51%−52%
23. bioMeOH + eDiesel (gen + pilot)−52%−53%−54%
24. eLNG + bioDiesel (pilot only)−69%−69%−69%
25. eLNG + bioDiesel (gen + pilot)−68%−68%−67%
26. eMeOH + bioDiesel (pilot only)−86%−86%−86%
27. eMeOH + bioDiesel (gen + pilot)−82%−81%−80%
28. eLNG + eDiesel (pilot only)−69%−69%−69%
29. eLNG + eDiesel (gen + pilot)−70%−70%−71%
30. eMeOH + eDiesel (pilot only)−87%−87%−87%
31. eMeOH + eDiesel (gen + pilot)−85%−85%−85%
Table 10. Maximum EEDI value permitted per vessel segment [5]. The EEDI is calculated as the grams of CO2 emitted per ton of cargo transported over one nautical mile [gCO2/(t·nm)].
Vessel
Segment
(DWT)
Required EEDI (10%) 1 January 2015Required EEDI (20%) 1 January 2020Required EEDI (30%) 1 January 2025Required EEDI (50%) 1 January 2030
400,0002.1871.9441.7011.215
325,0002.1871.9441.7011.215
250,0002.3042.0481.7921.280
Table 11. EEDI by vessel segment and fuel combination and its potential reduction versus the EEDI baseline (Table 10). The EEDI is calculated as the grams of CO2 emitted per ton of cargo transported over one nautical mile [gCO2/(t·nm)].
Fuel Combination400,000 DWT325,000 DWT250,000 DWT
VLSFO + MGO1.9172.0672.330
LNG + MGO (pilot only)1.387 (−28%)1.495 (−28%)1.684 (−28%)
LNG + MGO (gen + pilot)1.423 (−26%)1.539 (−26%)1.741 (−25%)
MeOH + MGO (pilot only)1.766 (−8%)1.903 (−8%)2.145 (−8%)
MeOH + MGO (gen + pilot)1.777 (−7%)1.917 (−7%)2.163 (−7%)
Table 12. CII ratings by vessel segment and year [7]. CII calculates the grams of CO2 emitted per cargo capacity and distance [gCO2/(t·nm)] for a vessel over a year.
Vessel
Segment (DWT)
Required CII (5%) 1 January 2023Required CII (7%) 1 January 2024Required CII (9%) 1 January 2025Required CII (11%) 1 January 2026
400,0001.8481.8091.7711.732
325,0001.8481.8091.7711.732
250,0001.9791.9371.8961.854
Table 13. CII coefficients and efficiency ratings for the three vessel segments in 2025 (A, B, C, D, and E are efficiency ratings, with A being the most efficient and E the least efficient).
Fuel
Combinations
400,000 DWT325,000 DWT250,000 DWT
CIIRatingCIIRatingCIIRating
VLSFO + MGO1.5400.87 (B)1.6670.94 (C)1.9581.03 (C)
LNG + MGO (pilot only)1.118 (−27%)0.63 (A)1.209 (−27%)0.68 (A)1.417 (−28%)0.75 (A)
LNG + MGO (gen + pilot)1.159 (−25%)0.65 (A)1.260 (−24%)0.71 (A)1.498 (−23%)0.79 (A)
MeOH + MGO (pilot only)1.420 (−8%)0.80 (A)1.536 (−8%)0.87 (B)1.803 (−8%)0.95 (C)
MeOH + MGO (gen + pilot)1.433 (−7%)0.81 (A)1.552 (−7%)0.88 (B)1.828 (−7%)0.96 (C)
Disclaimer/Publisher’s Note: The statements, opinions and data contained in all publications are solely those of the individual author(s) and contributor(s) and not of MDPI and/or the editor(s). MDPI and/or the editor(s) disclaim responsibility for any injury to people or property resulting from any ideas, methods, instructions or products referred to in the content.

