Article

Effects of Different Solid–Liquid Parameters on Flow Characteristics and Performance Output of Mineral Extraction Pumps: Analysis and Experimental Validation

by
Shunjun Hong
1,
Yuanwen Li
2,
Xiaozhou Hu
3,*,
Zihai Yang
1,
Shaowei Lei
1,
Pengyun Wei
1,
Junhong Hu
1 and
Xingpeng Wang
1
1
College of Hydraulic and Architectural Engineering, Tarim University, Alal 843300, China
2
College of Mechanical and Electrical Engineering, Changsha University, Changsha 410000, China
3
College of Mechanical and Electrical Engineering, Central South University, Changsha 410083, China
*
Author to whom correspondence should be addressed.
J. Mar. Sci. Eng. 2025, 13(7), 1218; https://doi.org/10.3390/jmse13071218
Submission received: 2 April 2025 / Revised: 24 April 2025 / Accepted: 27 April 2025 / Published: 25 June 2025
(This article belongs to the Special Issue Deep-Sea Mineral Resource Development Technology and Equipment)

Abstract

It is essential to investigate the performance output and flow characteristics within deep-sea mineral extraction pumps using appropriate numerical calculation methods. In this study, by taking a deep-sea mineral extraction pump prototype as the subject, a small-scale mineral extraction pump model was constructed. Computational fluid dynamics methods, incorporating the SST k - ω turbulence model and the discrete phase model, were utilized to systematically investigate the pressure distribution, velocity field, streamline patterns, and performance characteristics of the mineral extraction pump under three operating conditions—low flow rate, rated flow rate, and high flow rate—while transporting mineral particles of three distinct sizes. The results demonstrated that the larger size of the mineral particles induced greater disturbance to the liquid phase. Under different flow conditions, the correlations between the particle size and both the head drop rate and power drop rate exhibited distinct characteristics. Experiments verified the rationality and precision of the numerical simulation approach. This study provides a methodological reference for analyzing the flow characteristics and performance output of deep-sea mineral extraction pumps.

1. Introduction

As part of the core equipment of the deep-sea mineral conveyance system, the deep-sea mineral extraction pump is influenced by operating environments, working conditions, and other factors. There are higher demands for its abrasion resistance, lifting capacity, corrosion resistance, and reliability. The performance of the deep-sea mineral extraction pump is critical to the stability, lifting efficiency, and operational duration of the mineral transportation system [1]. Studies have investigated the performance metrics output and flow characteristics of deep-sea mineral extraction pumps, but there are fewer studies on the applicability of numerical calculation methods and experimental validation for these pumps [2,3]. In the analysis of the flow characteristics, wear characteristics, and performance output of deep-sea mineral extraction pumps, it is necessary to focus on numerical calculation methods in addition to parameters such as the density, concentration, and size of mineral particles [4,5,6].
Computational fluid dynamics coupled with the discrete element method (CFD-DEM) has been widely applied in research on deep-sea mineral extraction pumps. For instance, Li investigated the turbulence characteristics within a deep-sea mineral extraction pump using this model, and the results indicated that as the rotational speed increased, the operational performance of the mineral extraction pump improved [7]. Li et al. used this model to study the particle transport characteristics of a deep-sea mineral extraction pump subjected to external vibration. The results indicated that as the vibration frequency increased, the number of collisions between the particles and the impeller pressure surface decreased [8]. Zhu et al. used this model to simulate the hydraulic transport characteristics of three ellipsoidal particles. The results indicated that a larger aspect ratio corresponded to a more significant aggregation of the particles at the inlet of the pump impeller, which reduced the transport stability of the deep-sea mineral extraction pump [9]. Zhang et al. used this model to analyze the backflow characteristics of spherical particles with different sizes (5, 6, and 7 mm) in a deep-sea mining pump. When backflow occurred, the particles tended to accumulate at the joint between the impeller and guide vanes [10]. Li et al. employed this model to investigate the particle size distribution and wear behavior characteristics in a mixing and conveying pump. Low-velocity particles led to particle accumulation at the inlet of the first stage, and the variation in particle forces was closely related to the number of collisions between the particles and the wall surface [11]. Chen et al. used this model to analyze the effect of the fluid pre-rotation phenomenon on the wear of the inlet pipe in a deep-sea mining pump. Pre-rotation increased the collision energy loss of the particles, leading to higher wear [12]. Deng et al. assessed the particle transport characteristics and improvements in hydraulic performance of a deep-sea mineral extraction pump with three manifold lengths (50, 100, and 150 mm) using this model. Their results confirmed that the 100 m manifold scheme was optimal [13]. Lv et al. employed this model to analyze the effects of different particle sizes on velocity slip in a deep-sea mining pump. They found that the peak velocity slip was significantly reduced for particles of various sizes between 5 and 15 mm [14]. Other researchers have also conducted studies on various properties of deep-sea mineral extraction pumps using these models [15,16,17,18,19].
Researchers have also employed other numerical calculation methods. Cheng et al. used the Eulerian–Eulerian method to investigate the performance variation of deep-sea mineral extraction pumps with different inlet particle volume fractions. The results indicated that as the inlet particle volume fraction increased, the shaft power and head gradually increased [20]. Xie et al. used the CFD-DEM model and entropy generation method to investigate energy losses in deep-sea mineral extraction pumps under different conditions. They found that under rated operating conditions, >70% of the total energy dissipation occurred at the spatial guide vanes, followed by the impeller [21]. Hu et al. used a coupled CFD-DEM approach to analyze the transport characteristics of two-phase flow with complex particle states inside a deep-sea mining pump. The distribution of non-spherical particles differed significantly from that of spherical particles [22]. Jin et al. used a CFD-DEM model to investigate the flow and wear characteristics of coarse-grained two-phase flow in a deep-sea mineral extraction pump [23]. Hu et al. analyzed the impact of the impeller and guide vane structure on the hydraulic performance characteristics of deep-sea mineral extraction pumps using a multi-objective optimization strategy that combined CFD, a genetic algorithm–backpropagation neural network, and the Non-Dominated Sorting Genetic Algorithm III. The results indicated that the former accurately predicted the hydraulic performance of the deep-sea mineral extraction pump and that NSGA-III global optimization was effective [24]. Xu et al. formulated solid–liquid two-phase flow control equations for mining slurry pumps based on the Eulerian model and numerically simulated the two-phase flow in the hose conveying particles. They found that sea current variations significantly affected the pressure loss in the hose [25]. Zhu et al. used a radial basis function (RBF) neural network to analyze the dynamic characteristics of a marine hoisting system containing a pump [26]. Chen et al. used a CFD-DEM method to analyze the motion process of a sphere inside a deep-sea mineral extraction pump under different initial motion conditions. The vortex caused by the motion of the sphere combined with the main flow to provide sufficient lift for the sphere [27].
With the rapid development of deep-sea mining, numerical methods for studying the performance of deep-sea mineral extraction pumps have expanded. In this study, we mainly explored the use of the SST k-ω turbulence model and discrete phase model (DPM) to analyze the flow characteristics and performance output of deep-sea mineral extraction pumps and conducted experimental validation. The objective was to provide ideas and methodological references for advancing basic research on deep-sea mineral extraction pumps.

2. Basis for Numerical Calculations

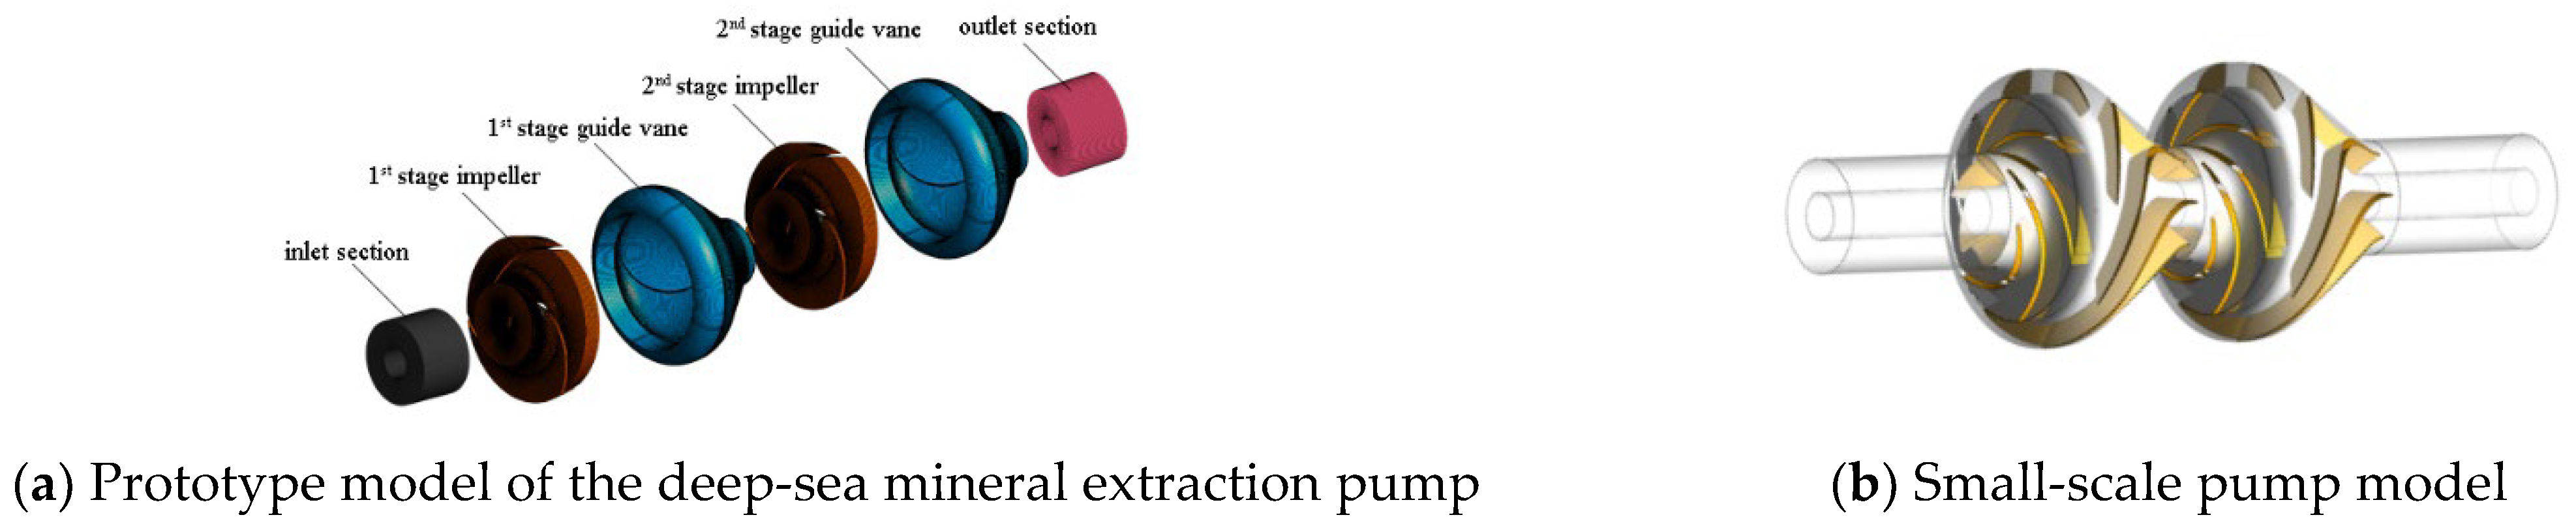
2.1. Model Construction

To verify the applicability of the DPM and SST k - ω turbulence model for analyzing the performance metrics output and flow characteristics of deep-sea mineral extraction pumps, a scaled-down model of a deep-sea mineral extraction pump was developed based on geometric similarity principles. The primary parameters of the small-scale pump are as follows: head, H d = 30 m; rated flow rate, Q d = 20 m3/h; rated rotational speed, n = 2860 r/min; and rated efficiency, η d = 64%. To enhance the hydraulic efficiency of the mining pump, the impeller model was designed using the increased flow method. The prototype model of the deep-sea mineral extraction pump is shown in Figure 1a, and the small-scale pump model is shown in Figure 1b.

2.2. Numerical Calculation Method

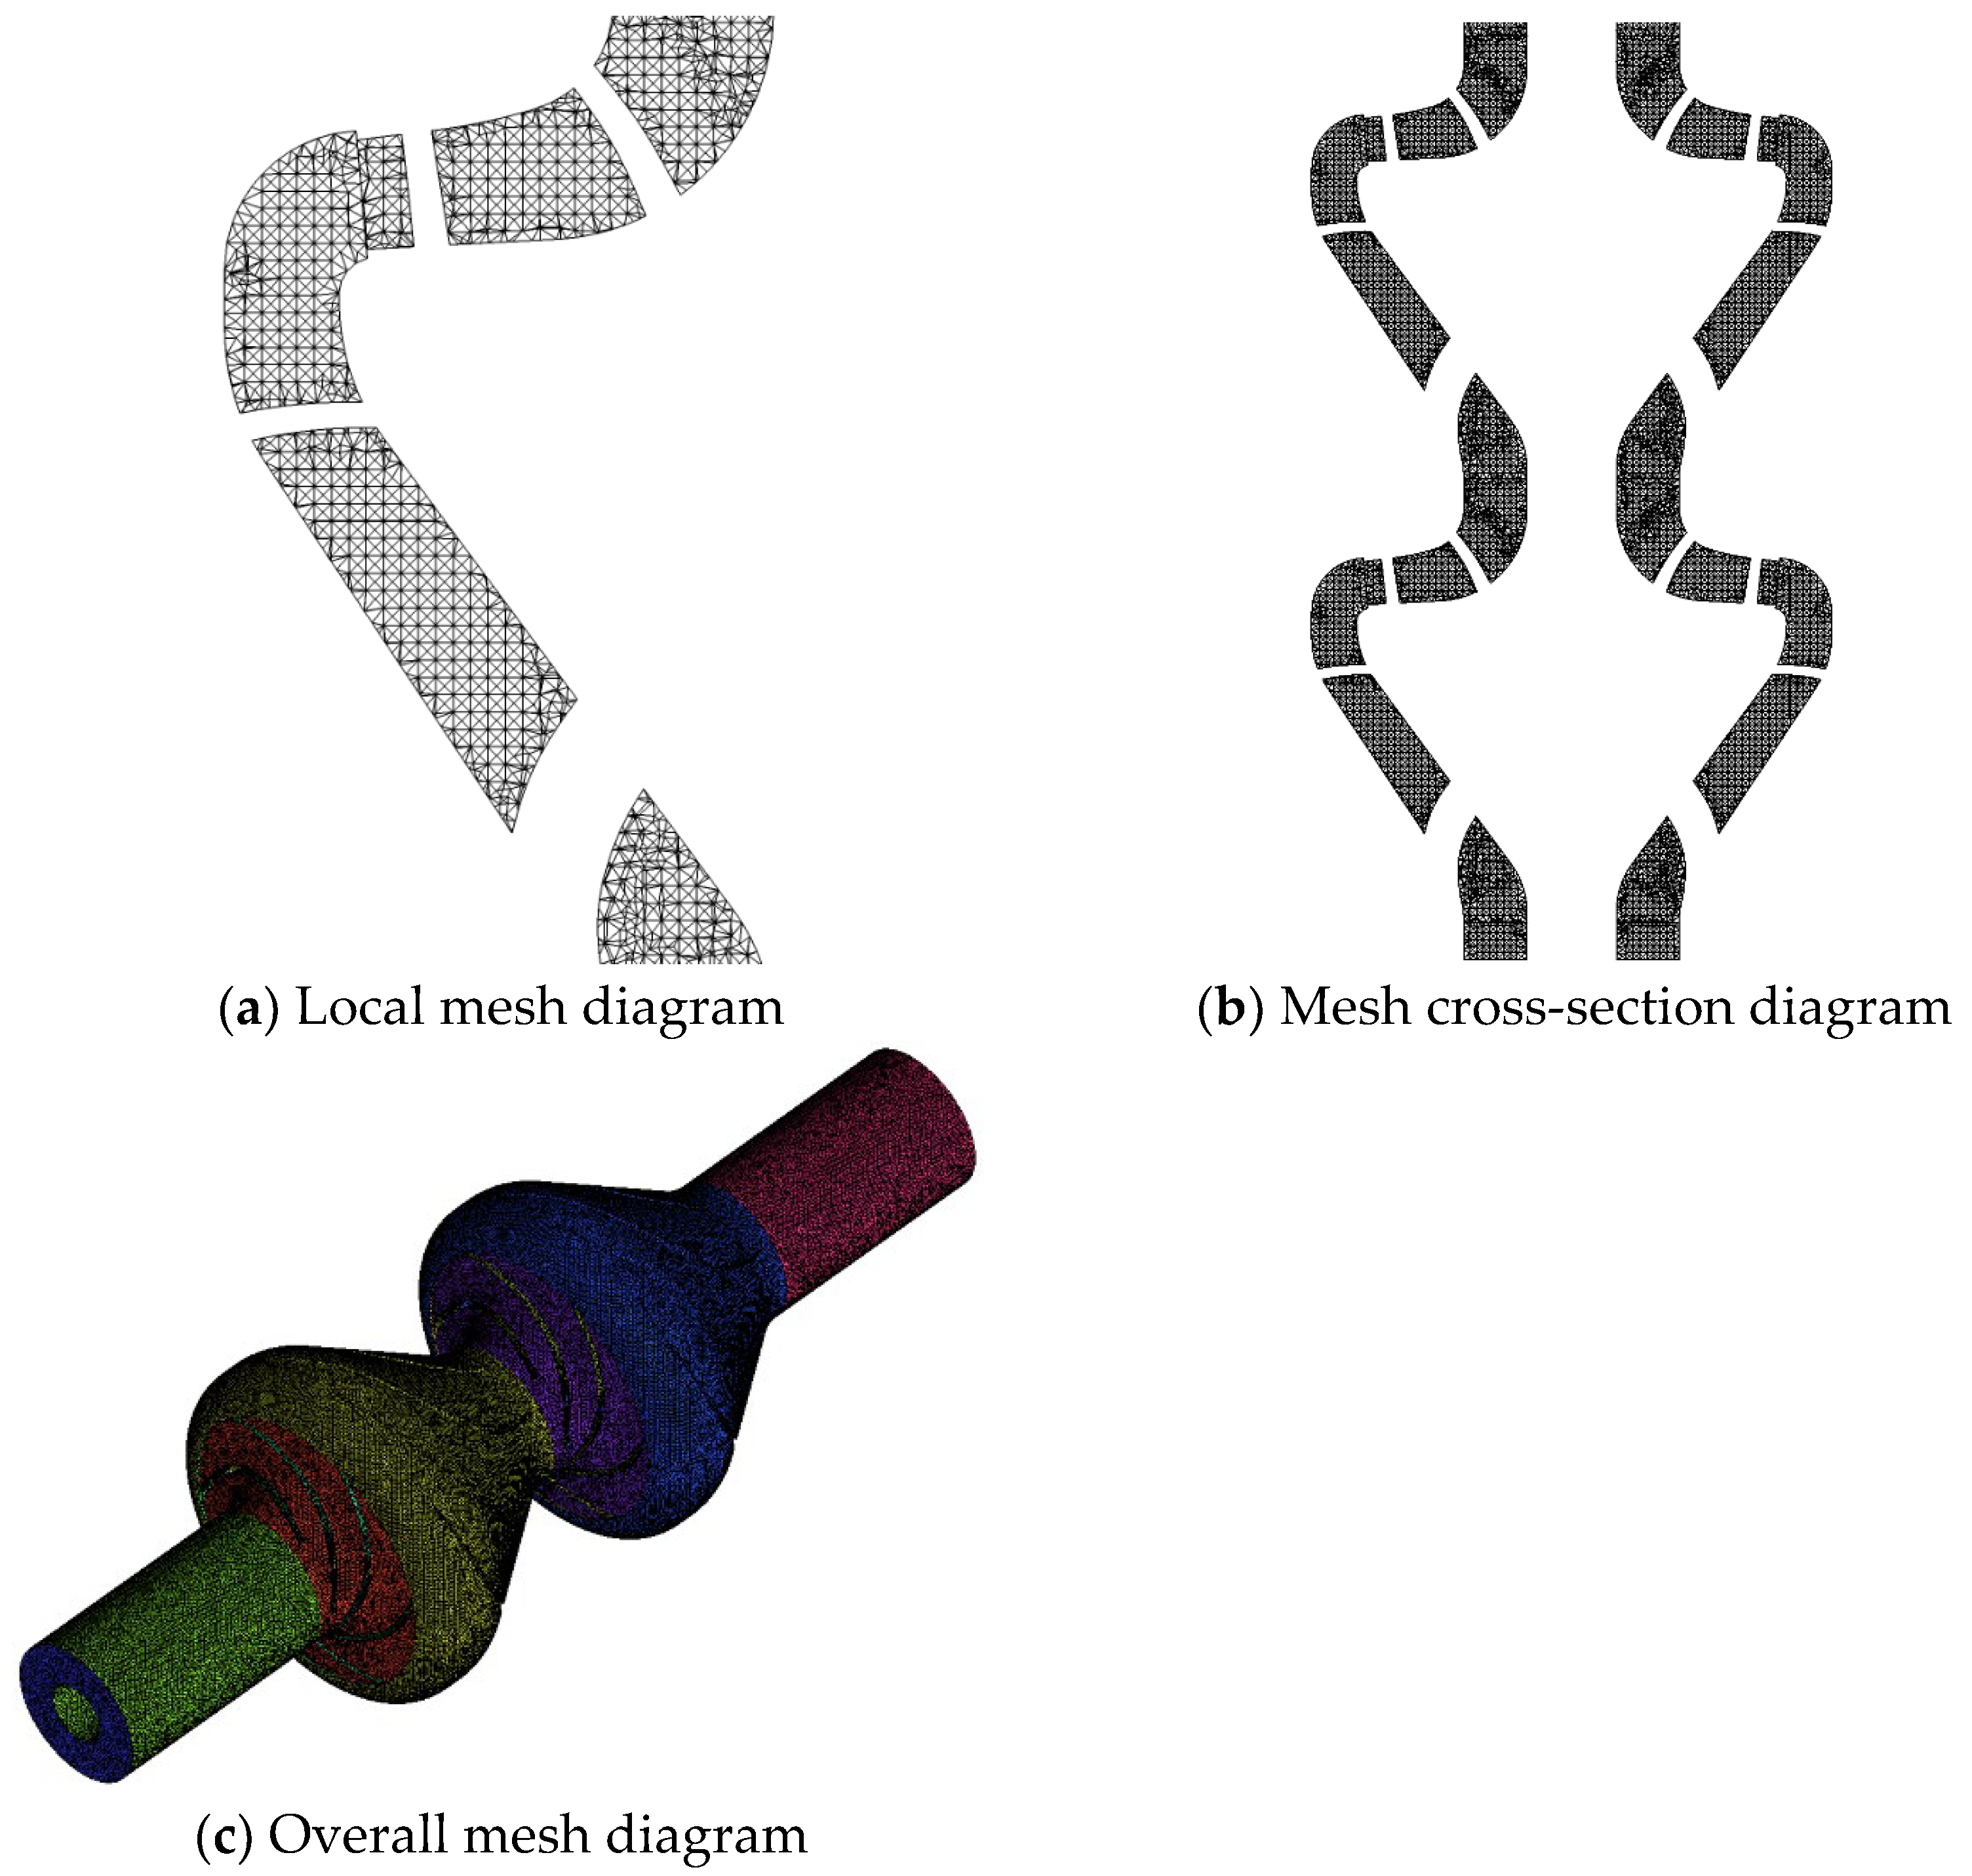
2.2.1. Mesh Generation

To increase the accuracy of the numerical calculations, the inlet and outlet pipes of the small-scale mineral extraction pump were extended to 1.5 times their respective diameters. The ICEM 2018 software was used to generate the mesh for the entire computational domain before performing numerical calculations. To validate the scientific basis of the mesh division, six sets of meshes with varying densities were generated. The relationship between the number of meshes and the variation in the pump’s external characteristics was analyzed to serve as the foundation for the mesh independence check. Table 1 illustrates the correlation between the number of meshes and the pump head. When the total mesh count exceeded 3 million, the head variation rate of the pump was controlled within 1%. Therefore, the total number of computational meshes was determined to be approximately 3 million.
In terms of mesh quality, the maximum skewness is 0.799, which is less than 0.95; the Orthogonal Quality is 0.790. According to reference [28], these data are all within a good range. The computational domain mesh of the pump is shown in Figure 2.

2.2.2. Numerical Method

Steady-state numerical simulation of a solid–liquid two-phase flow was performed for the computational domain of the mineral extraction pump using ANSYS Fluent 18.0. The simulation assumed no energy or mass exchange between the particle phase and the fluid phase, and the influence of gravity on the flow field was considered. The flow field was solved using the SST k-ω turbulence model, and the motion of the particle phase was modeled using the DPM based on Euler–Lagrange coordinates. In this approach, the liquid phase is treated as a continuous medium in the Eulerian framework. The solid particles are considered a discrete phase and tracked in the Lagrangian framework. This model effectively accounts for turbulence effects, captures detailed particle motion within the flow field, and quantifies the wear and erosion of flow passage components when the particle material properties are appropriately set. The Navier–Stokes equations were discretized using the second-order upwind scheme. The convergence criterion for numerical simulation was set at 10−4; i.e., when the pressure and flow rate differences at the pump’s inlet and outlet between adjacent calculation steps are less than this value, the calculation is determined to have converged.

2.2.3. Boundary Conditions

The pump inlet was defined as a velocity inlet. The inlet velocity was calculated using the inlet flow rate and the cross-sectional area of the inlet flow passage. Mineral particles at the inlet surface were assumed to enter the computational domain axially, with an entry velocity equal to the fluid velocity, ensuring no relative velocity between the phases. The pump outlet was set as an outflow boundary condition, with a flow-rate weighting factor of 1. For all flow passage surfaces within the computational domain, no-slip boundary conditions were applied. The wall roughness was 0.5 mm, according to the actual vanes of the mining pump. Data transfer for the front part, as well as between the impeller and the guide vanes, was implemented using Interface settings. For solid-phase particle boundary conditions, escape boundary conditions were applied at the pump inlet and outlet; reflect boundary conditions were employed on the surfaces of other flow passage components.

2.2.4. Wear Model Selection

According to the literature, various researchers have proposed empirical wear models. Despite their differences, these models have similar patterns and can generally be expressed using the following equation [29]:
R e r o s i o n = p = 1 N p a r t i c l e s m p C ( d p ) f ( θ ) v b ( v ) A f a c e
The impact angle function f ( θ ) was represented by piecewise polynomial method:
For θ ≤ 15°,
f ( θ ) = b θ 2 + c θ
For θ > 15°,
f ( θ ) = x cos 2 θ sin ( w θ ) + y sin 2 ( θ ) + z

3. Analysis of Internal Flow Characteristics

The analysis was conducted for different working conditions and mineral particle sizes (1, 3, and 5 mm). The low flow rate is 0.65 Q d , and the high flow rate is 1.3 Q d .

3.1. Low Flow Rate

The internal pressure distribution of the mineral extraction pump under different particle sizes under the low-flow rate condition is shown in Figure 3. Under different particle sizes, the pressure in the flow field of the computational domain increased gradually from the pump inlet to the outlet, forming a pressure gradient. The maximum pressure at the pump outlet was approximately 3.1 × 10⁵ Pa. Owing to the suction effect of the first-stage impeller, a localized negative pressure region appeared at the pump inlet. However, as the impeller continued to rotate and impart energy, both the kinetic and potential energies of the fluid increased significantly. The fluid, carrying a certain amount of energy, entered the first-stage guide vane, where the diffusion effect of the guide vane further increased the pressure energy. Subsequently, the fluid underwent the same energy-conversion process in the second-stage impeller and guide vane. During this process, the rotational work of the two-stage impellers contributed progressively to energy augmentation. Compared with the case of a 1 mm particle size, the influence of 5 mm particles on the pressure distribution within the flow field of this model pump was relatively insignificant.
The velocity cloud and streamline distribution inside the pump under different particle sizes under the low-flow rate condition is shown in Figure 4. Regardless of the particle size, the fluid entered the impeller with a relatively uniform velocity from the pump inlet. Owing to the rotational work of the impeller, two clear velocity increases were observed in the first- and second-stage impeller regions of the computational domain. However, as the fluid entered the region of the space guide vane, its velocity decreased. Localized vortex flows appeared in the transition area between the impeller outlet and the space guide vane inlet, as well as within the flow passage of the space guide vane. This caused flow instability, leading to chaotic flow patterns and backflow phenomena in these regions. The backflow at the impeller outlet occurred because high-energy fluid was expelled radially from the impeller outlet and converted into axial motion through the transition section between the impeller and the space guide vane. This change in flow direction inevitably deteriorated the flow pattern. Within the region of the space guide vane, as the cross-sectional area of the flow passage increased in the axial direction, the fluid velocity decreased significantly, leading to flow instability and increased flow losses.
Comparing Figure 3 and Figure 4 reveals that the pressure variation in the B2B section followed a similar trend to the velocity distribution, which indicates that the impeller effectively converted energy under all particle sizes. Nevertheless, due to the dynamic and static interference between the impeller and the space guide vane, the flow in their transition region became more turbulent. Localized high-velocity regions appeared at the impeller outlet, while localized low-velocity regions emerged at the guide vane outlet. The low-speed zone at the outlet of the second-stage guide vanes is relatively large. The reduced constraint of the guide vanes on the fluid led to an expansion of the low-energy fluid region near the pump outlet. The B2B section is utilized to display the simulation results, wherein the impeller and guide vanes are unfolded along the circumferential direction, enabling comprehensive observation of the simulation results for all flow channels.

3.2. Rated Flow Condition

The pressure distribution inside the computational domain for three different particle sizes under the rated flow condition is shown in Figure 5. Similar to the conditions of low flow velocity, the total pressure gradually increases from the pump inlet to the outlet. Additionally, there was no significant pressure drop near the pump outlet. However, as the solid particle size increased, the disturbance of these particles on the liquid-phase flow field gradually intensified. Consequently, there was an increase in the area of localized pressure fluctuation regions, greater flow turbulence, and, subsequently, greater energy losses in the computational domain.
The velocity cloud and streamline distribution inside the pump for different particle sizes under the rated flow condition is shown in Figure 6. The velocity inside the impeller increased with the radius. As the fluid entered the space guide vane, its velocity decreased because part of the kinetic energy was converted into pressure energy. Within the space guide vane, the accumulation of solid particles on the vane surface and rapid changes in the vane angle weakened the vane’s ability to control the flow field. This resulted in clear flow instability phenomena such as vortex formation, backflow, and secondary flows, causing significant hydraulic losses within the guide vane. Additionally, as the particle size increased, the influence of solid-phase particles on the liquid-phase flow became more pronounced, leading to an expansion of the vortex region within the space guide vane.

3.3. High Flow Rate

The internal pressure distribution of the mineral extraction pump for different particle sizes under the high flow rate condition is shown in Figure 7. The pressure distribution exhibited a similar trend to that under the rated and low flow conditions but with a more stable gradient. Comparing the three cases revealed that particle size had a relatively small effect on the pressure distribution under the high flow rate condition.
The velocity cloud and streamline distribution inside the mineral extraction pump for different particle sizes under the high flow rate condition is shown in Figure 8. Compared with the low and rated flow conditions, the velocity gradient inside the pump was more uniform. Moreover, vortex and backflow phenomena within the first- and second-stage space guide vanes were significantly weakened. This reduction in flow instability led to lower hydraulic losses and increased hydraulic efficiency. Comparing Figure 8a–c reveals that as the particle size increased, the vortex intensity within the space guide vane increased significantly, along with an expansion of the unstable flow region.

4. Performance Analysis

4.1. Definition of Head and Efficiency Drop Rates

The mutual coupling between fluid particles and the solid phase can be characterized using the dimensionless Stokes number, which is determined by the ratio of the particle relaxation time to the characteristic time of the flow field. It is expressed by Equation (4). The magnitude of the Stokes number reflects the relationship between the inertial force and the drag force acting on the particles within the solid–liquid two-phase flow field.
S t = ρ p d p 2 u 18 μ D
here, d p represents the particle size (in μm), μ represents the dynamic viscosity of the fluid (in N·s/m2), and u and D represent the characteristic velocity and characteristic size (in mm) of the fluid, respectively.
From Equation (4), as particle size d p increases, the Stokes number increases. This indicates that particle motion is increasingly influenced by inertia. Meanwhile, the influence of fluid drag decreases accordingly, causing solid particles to better maintain their original trajectories. The correlation between solid-particle parameters and pump performance output has been investigated in mining slurry pumps, solid–liquid two-phase flow centrifugal pumps, and hydraulic turbines. Compared with clear water conditions, conveying a two-phase flow containing solid particles generally leads to varying degrees of performance degradation. Therefore, we introduced the head variation coefficient H r and the efficiency variation coefficient η r , which are defined as follows:
H r = H m / H w
η r = η m / η w
where H m and H w represent the pump heads under solid–liquid two-phase flow and clear water conditions, respectively (in m), and η m and η w represent the pump efficiencies under solid–liquid two-phase flow and clear water conditions, respectively (in %).
In Equation (5), the head of the pump can be expressed by Equation (7):
H = p 2 p 1 ρ g + v 2 2 v 1 2 2 g
The pump efficiency is calculated as follows:
η = ρ g Q H P × 100 %
where p 2 and p 1 represent the outlet pressure and inlet pressure of the pump, respectively (in Pa); v 2 and v 1 represent the outlet velocity and inlet velocity of the pump, respectively (in m/s); ρ represents the density of the conveying medium (in kg/m3); Q represents the inlet flow rate of the mining slurry pump (in m3/s); g represents gravitational acceleration (in m/s2); and P represents the shaft power (in kW).
Based on the above formula, the head drop rate RH and efficiency drop rate RE for conveying solid–liquid two-phase flows are defined as follows, respectively:
R H = 1 H r
R E = 1 η r

4.2. Effect of Particle Size Under Different Flow Conditions

4.2.1. Low Flow Rate

Figure 9 illustrates the variation in pump performance when conveying solid particles of different sizes. As the solid particle size increased from 1 to 5 mm, the pump performance declined to varying degrees. Specifically, the head drop rate RH increased from 4.6% to 5.5%, whereas the efficiency drop rate RE decreased from 3.3% to 2%.

4.2.2. Rated Flow Condition

Figure 10 presents the pump performance variations when conveying solid particles of different sizes. As shown, as the solid-particle size increased from 1 to 5 mm, the pump performance output decreased to different extents. However, with an increase in particle size, RH increased, while RE decreased. When the pump conveyed a solid–liquid two-phase flow, the solid-particle size had a positive correlation with the pump head drop rate and a negative correlation with the efficiency drop rate.

4.2.3. High Flow Rate

Figure 11 illustrates the variation in pump performance when conveying solid particles of different sizes. As the size increased from 1 to 5 mm, RH increased, while RE essentially remained the same. This indicated that under the high flow rate condition, the solid particle size was positively correlated with the head drop rate but had a small impact on efficiency. Specifically, the head drop rate RH increased from 6.3% at a particle size of 1 mm to 6.8% at 5 mm, while the efficiency drop rate RE remained nearly constant at 2.9%.

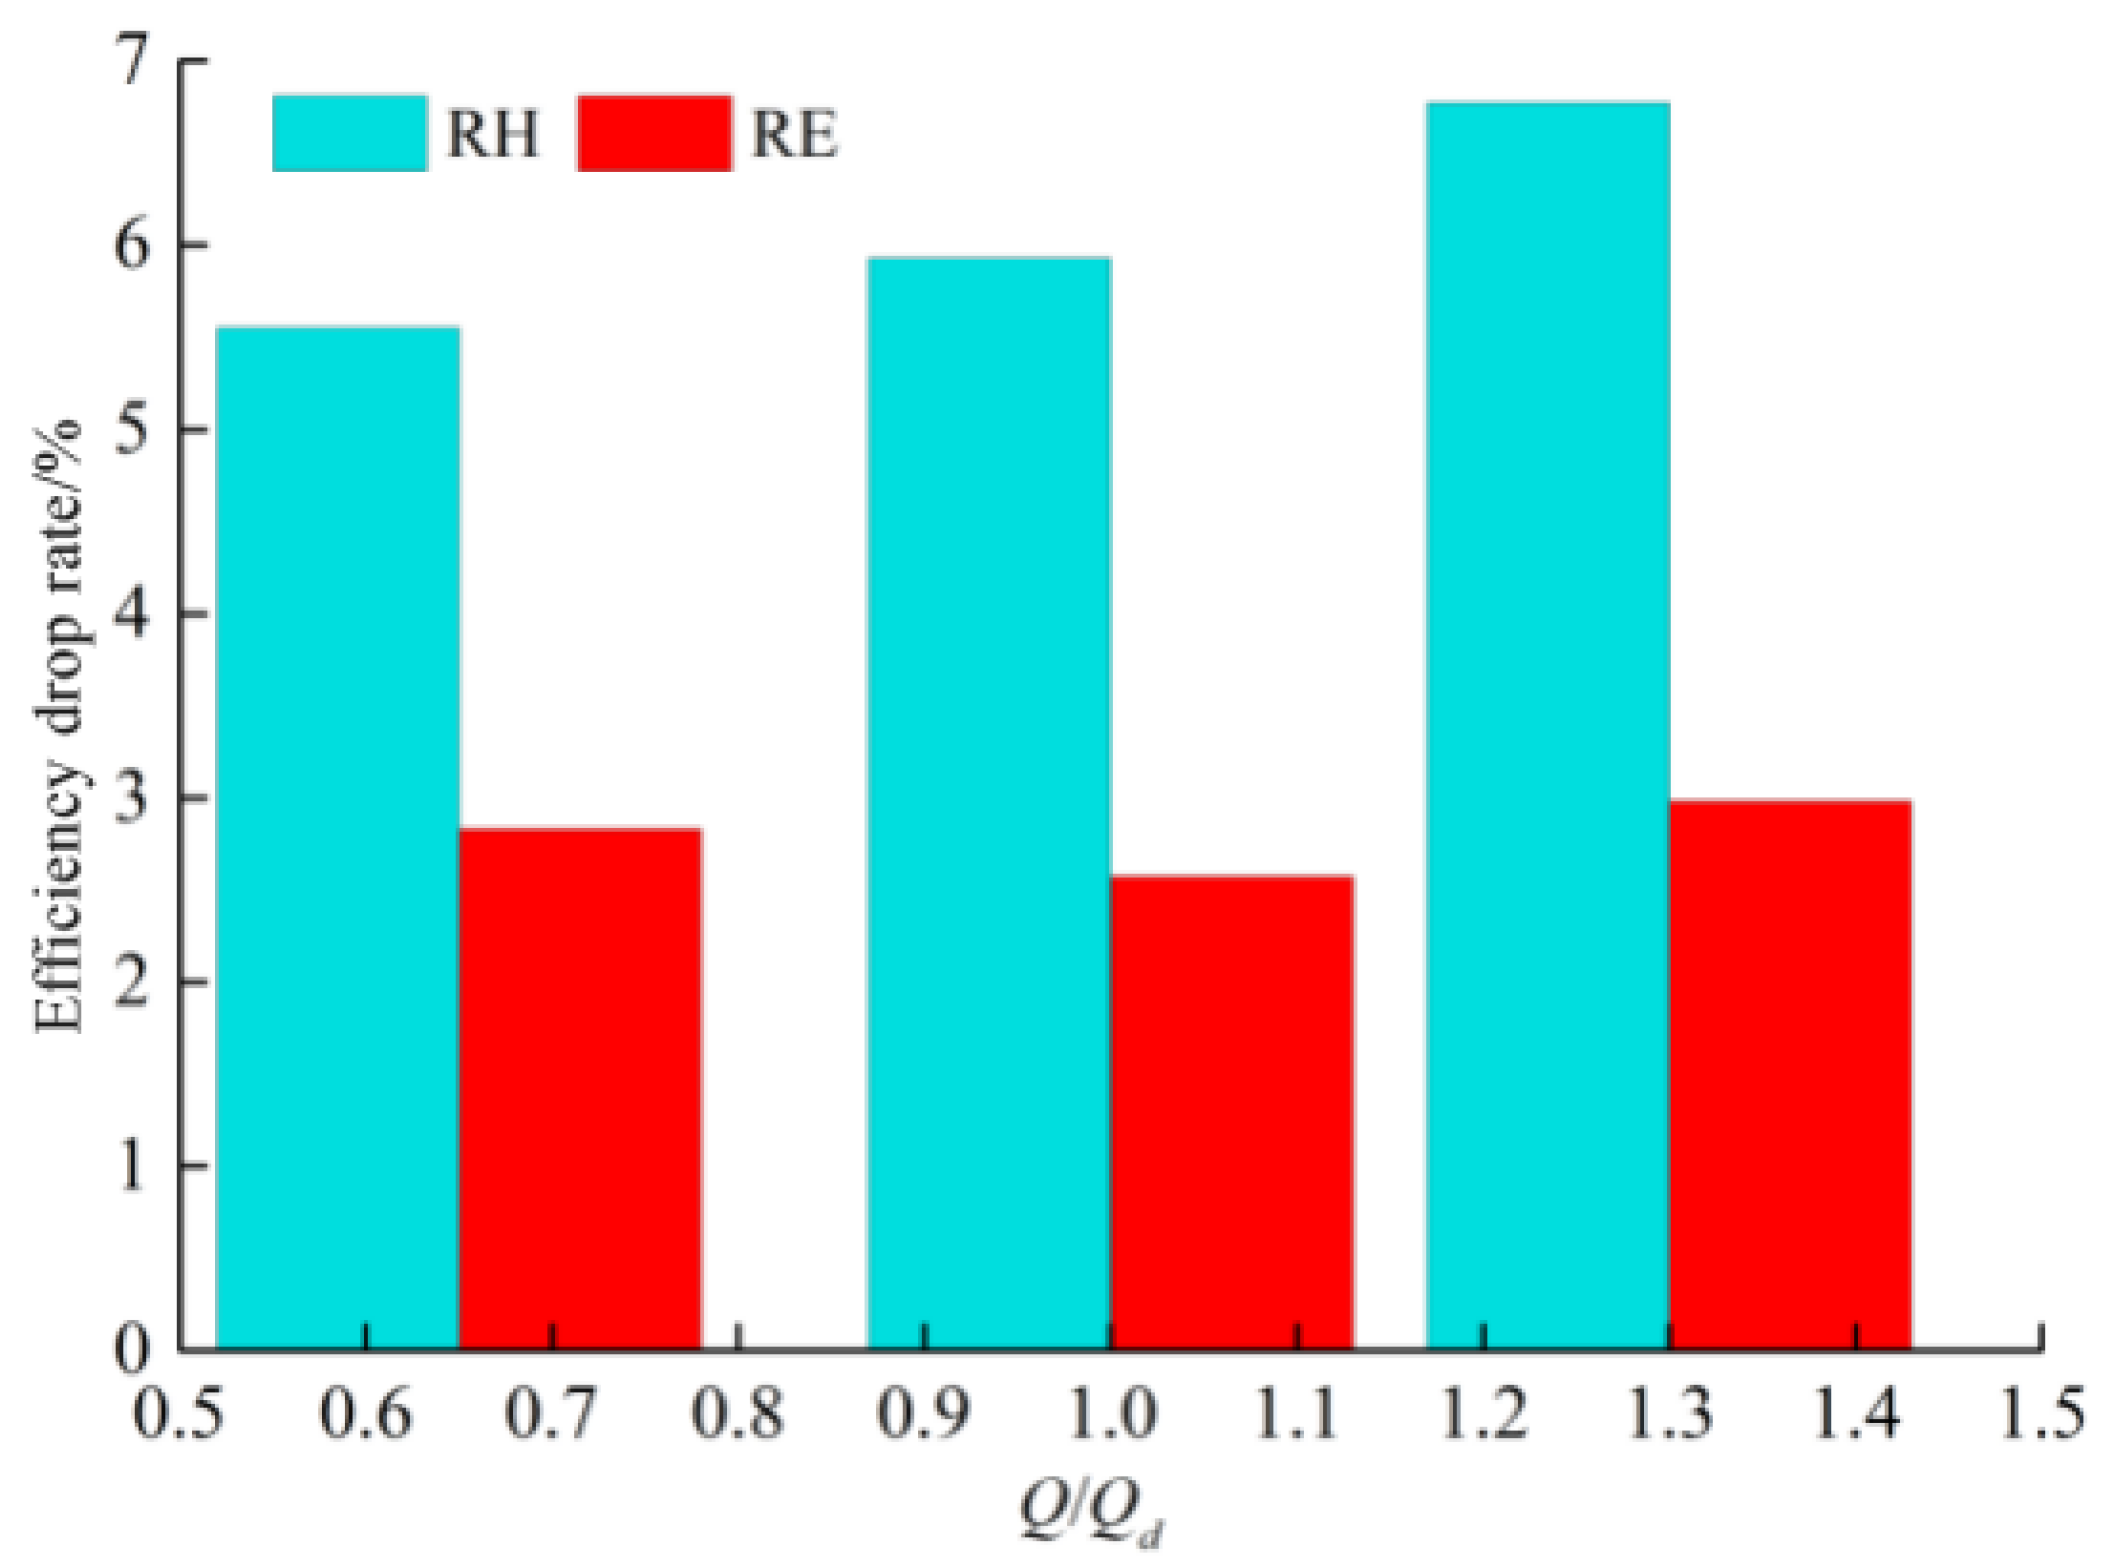
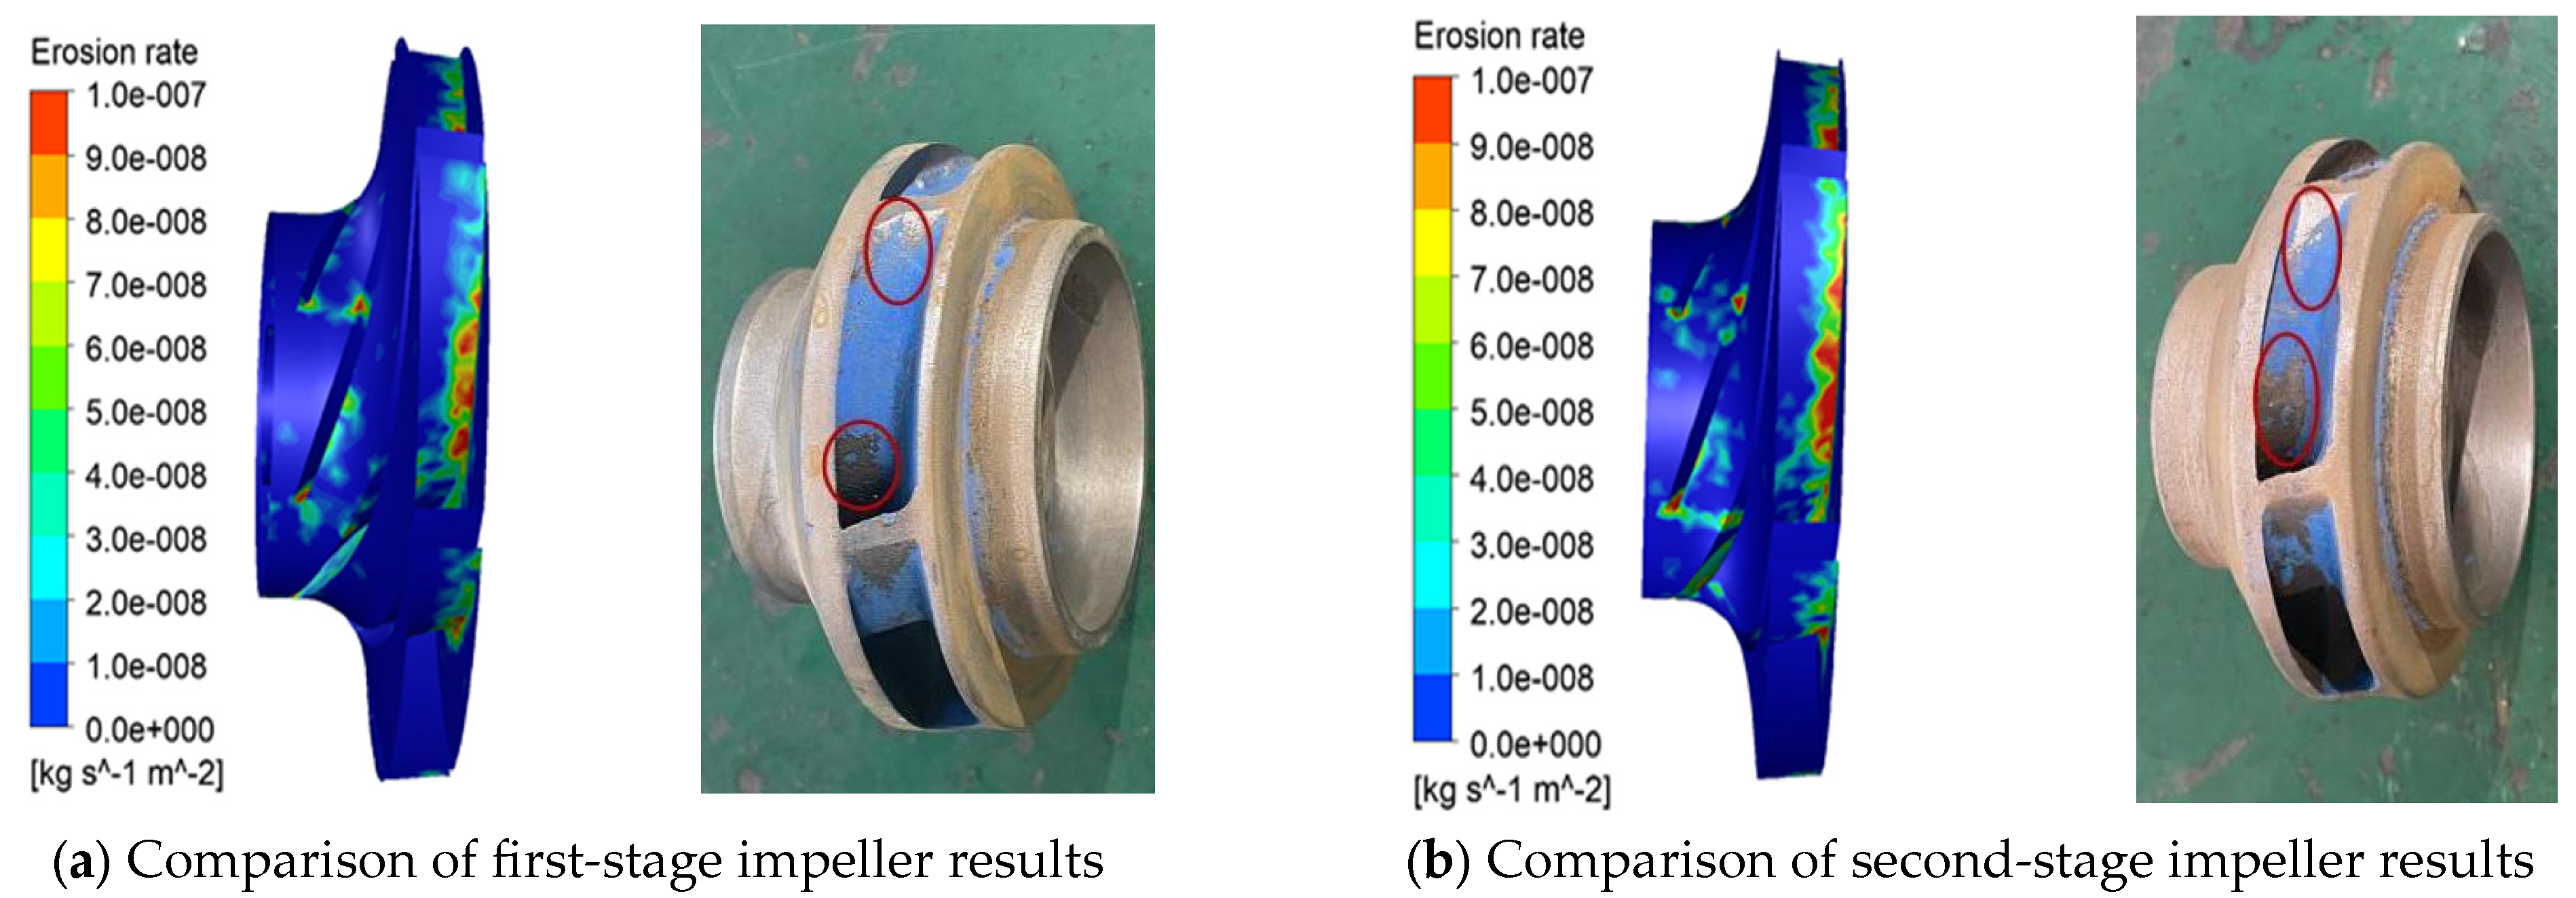
4.2.4. Effects of 3 mm Particles on Pump Wear and Performance Output

Figure 12 illustrates the influence of the flow rate on the surface wear intensity of the four main flow passage components when the pump conveyed a solid–liquid two-phase flow with a particle size of 3 mm. As the flow rate increased, the wear intensity of the first-stage impeller and the second-stage guide vane increased, and the wear intensity of the second-stage impeller decreased. The wear intensity of the first-stage guide vane initially decreased and then increased. This trend reflects the complex relationship between motion parameters, such as flow rate and particle size, and the wear intensity of flow passage components.
Figure 13 presents the effect of the flow rate on the pump performance when conveying a solid–liquid two-phase flow with a particle size of 3 mm. As the flow rate increased, RH increased, while RE first decreased and then increased, although the overall variation remained small. This suggests that when the pump conveyed a solid–liquid two-phase flow, the flow rate had a positive correlation with the pump head drop rate, whereas its relationship with the efficiency drop rate was more complex.

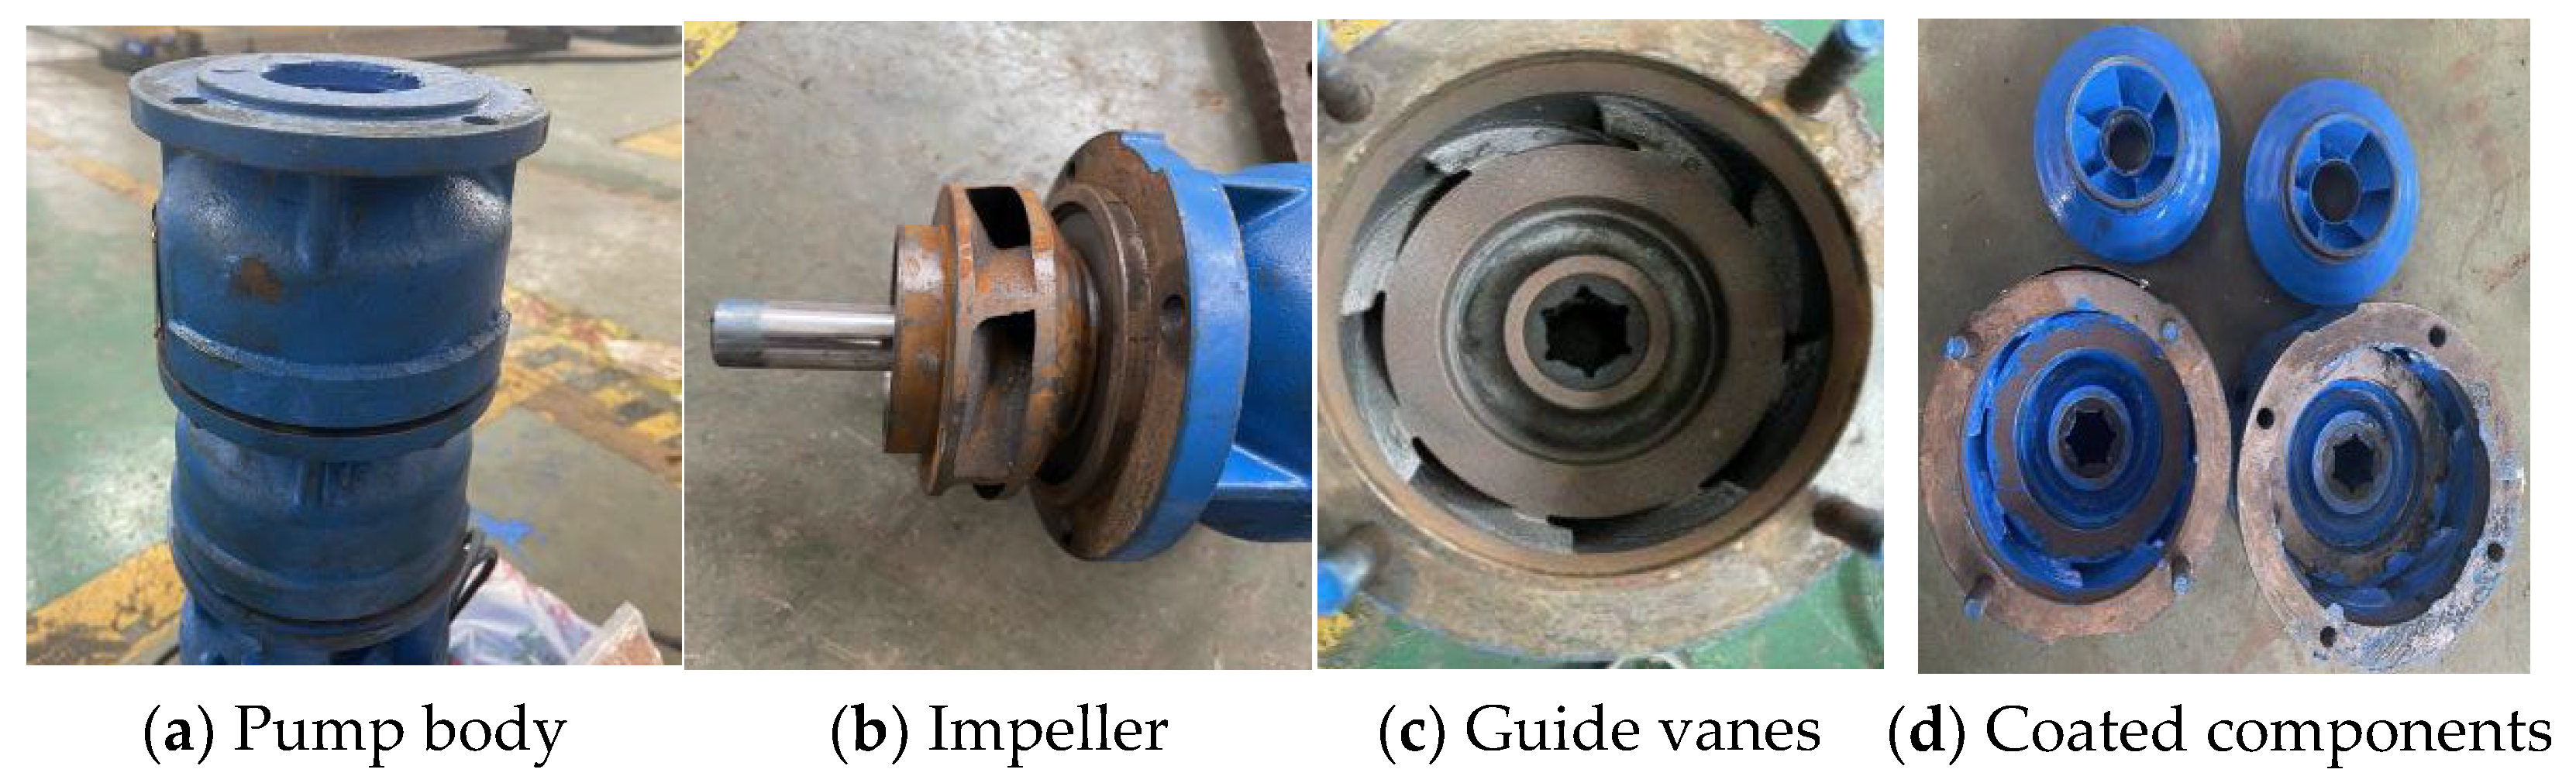
5. Experimental Validation

To validate the numerical simulation results obtained using the SST k - ω turbulence model and the DPM, a performance output test of the mineral extraction pump was conducted under the particle size of 3 mm. The experimental results under the same boundary conditions were compared and analyzed against the numerical simulation results.

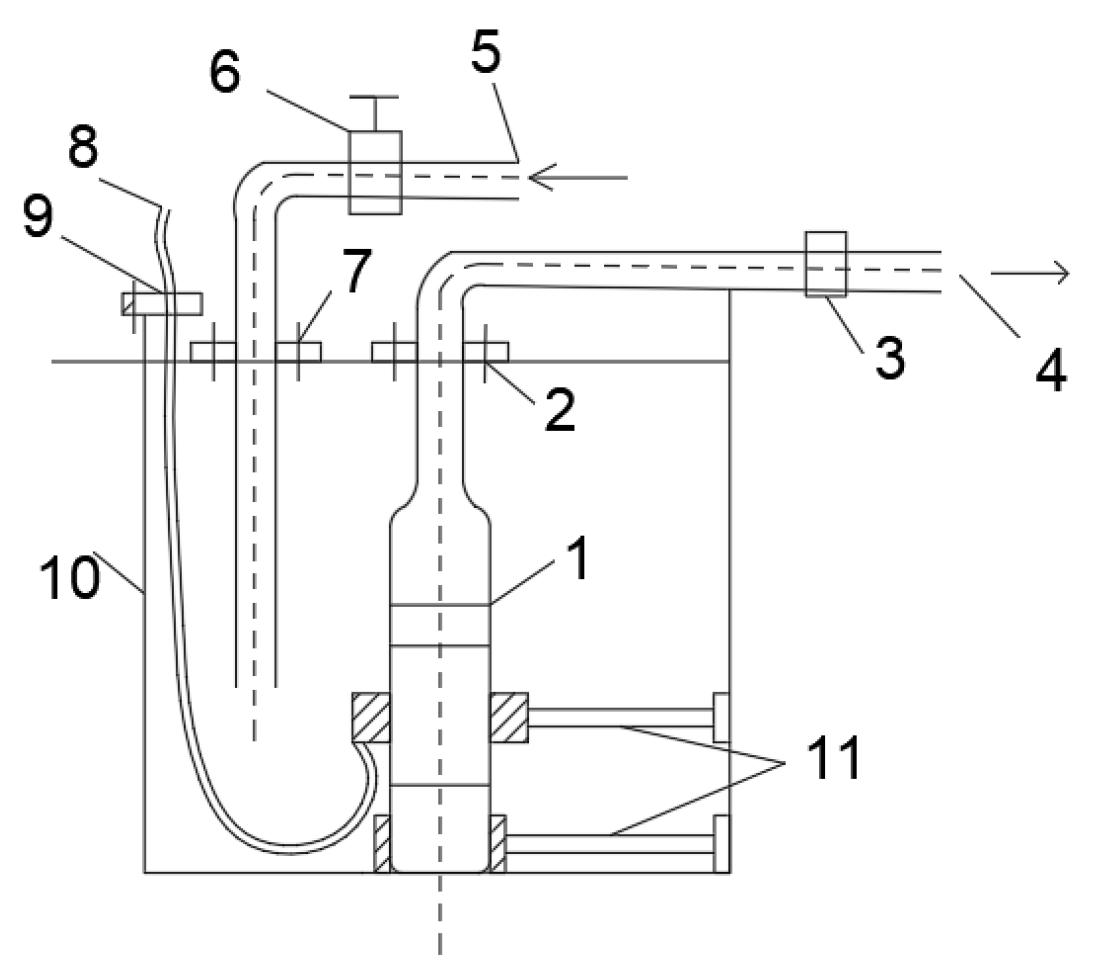
Experimental Principles

A physical pump based on the hydraulic model of the small-scale pump was fabricated for testing. The model of the test pump was 175QJ20-30 and is shown in Figure 14. The test was conducted on the test platform of Hunan Jianeng Pump Station Co., Ltd., China.
The experiment system of this experiment pump is composed of an experiment pump, a water tank, a regulating valve, a pipeline, a data measurement system, etc. See Figure 15.
This test served as a validation of the methodology. Considering the actual flow passage conditions of the test pump, we conducted experiments using 3 mm particles, and the test concentration was 7.5%. The test was conducted under the rated flow condition (20 m3/h). The applicability of the method was mainly verified through wear tests. Prior to the test, a uniform layer of water-based paint was applied to the inner wall of the impeller flow passage. Once the paint had completely dried, the test was commenced. Following 2 h of unstable flow within the passage, the extent of particle-induced erosion on the flow passage was assessed. Thereafter, the experimental findings were juxtaposed with the numerical simulation results under identical boundary conditions. The test site is shown in Figure 16.
With the DPM and SST k - ω turbulence model, the wear characteristics of the pump were analyzed using the same boundary conditions as in Section 2.2.3. We compared the numerical simulation results with the experimental results, as shown in Figure 17.
As shown in Figure 17a,b, the numerical simulation results for the wear of the first-stage impeller and the second-stage impeller agreed well with the experimental results, verifying the applicability of the DPM and SST k - ω turbulence model for studying the flow characteristics and wear characteristics of deep-sea mineral extraction pumps.

6. Conclusions

(1)
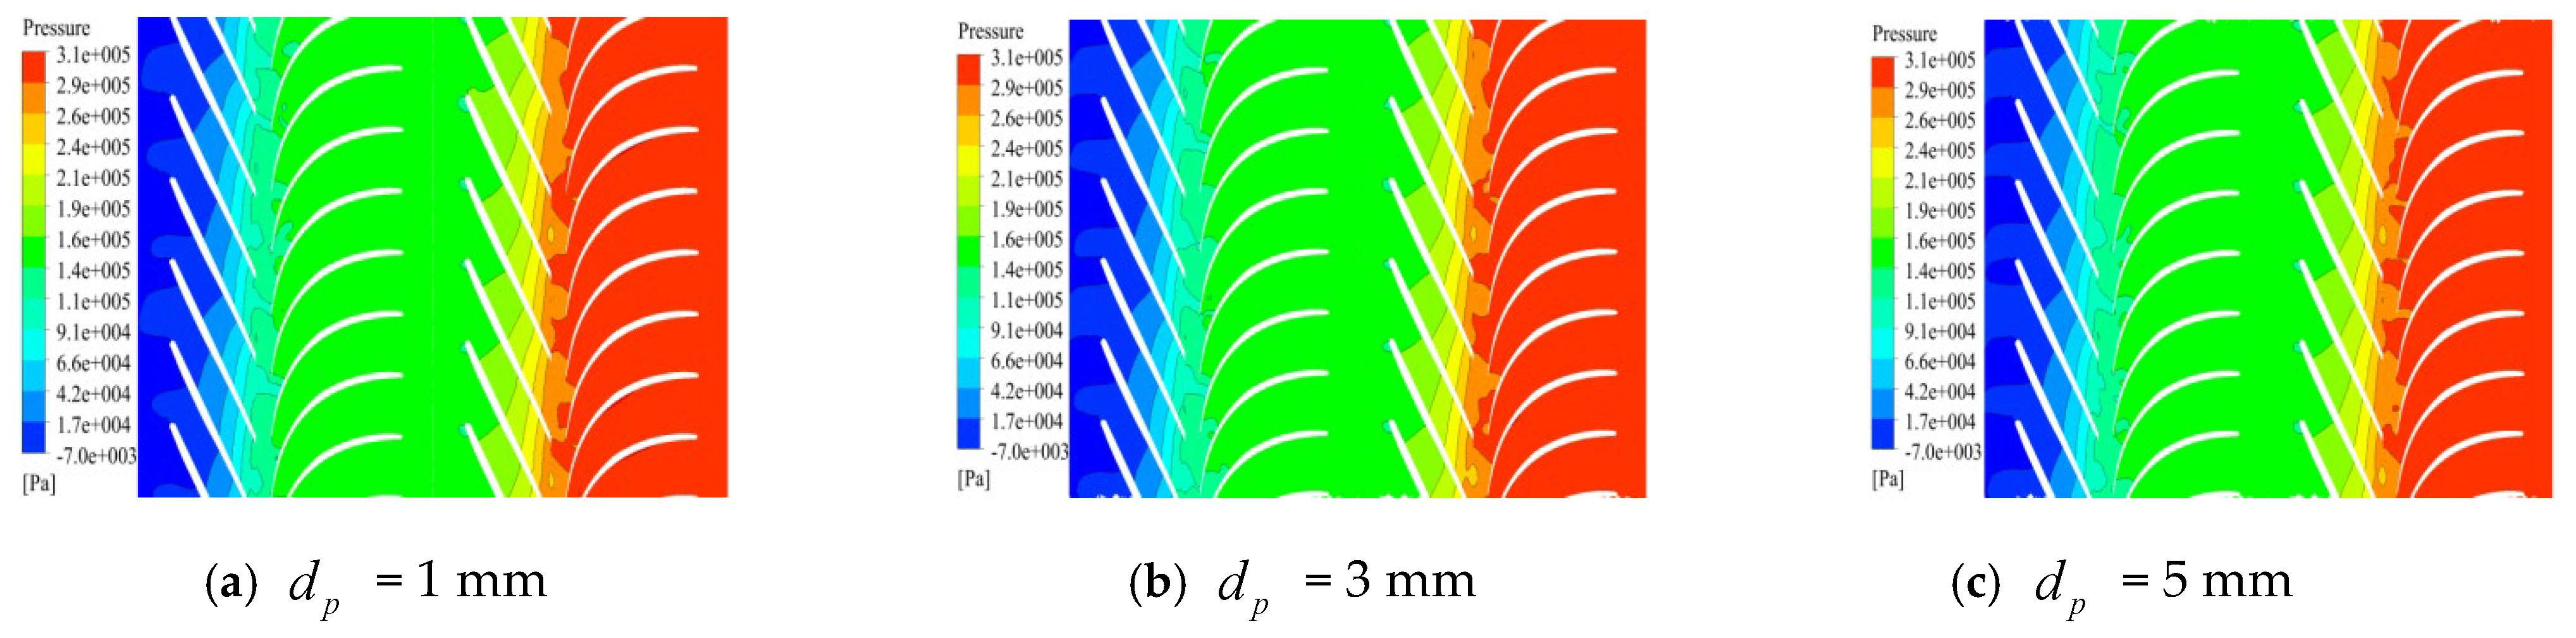
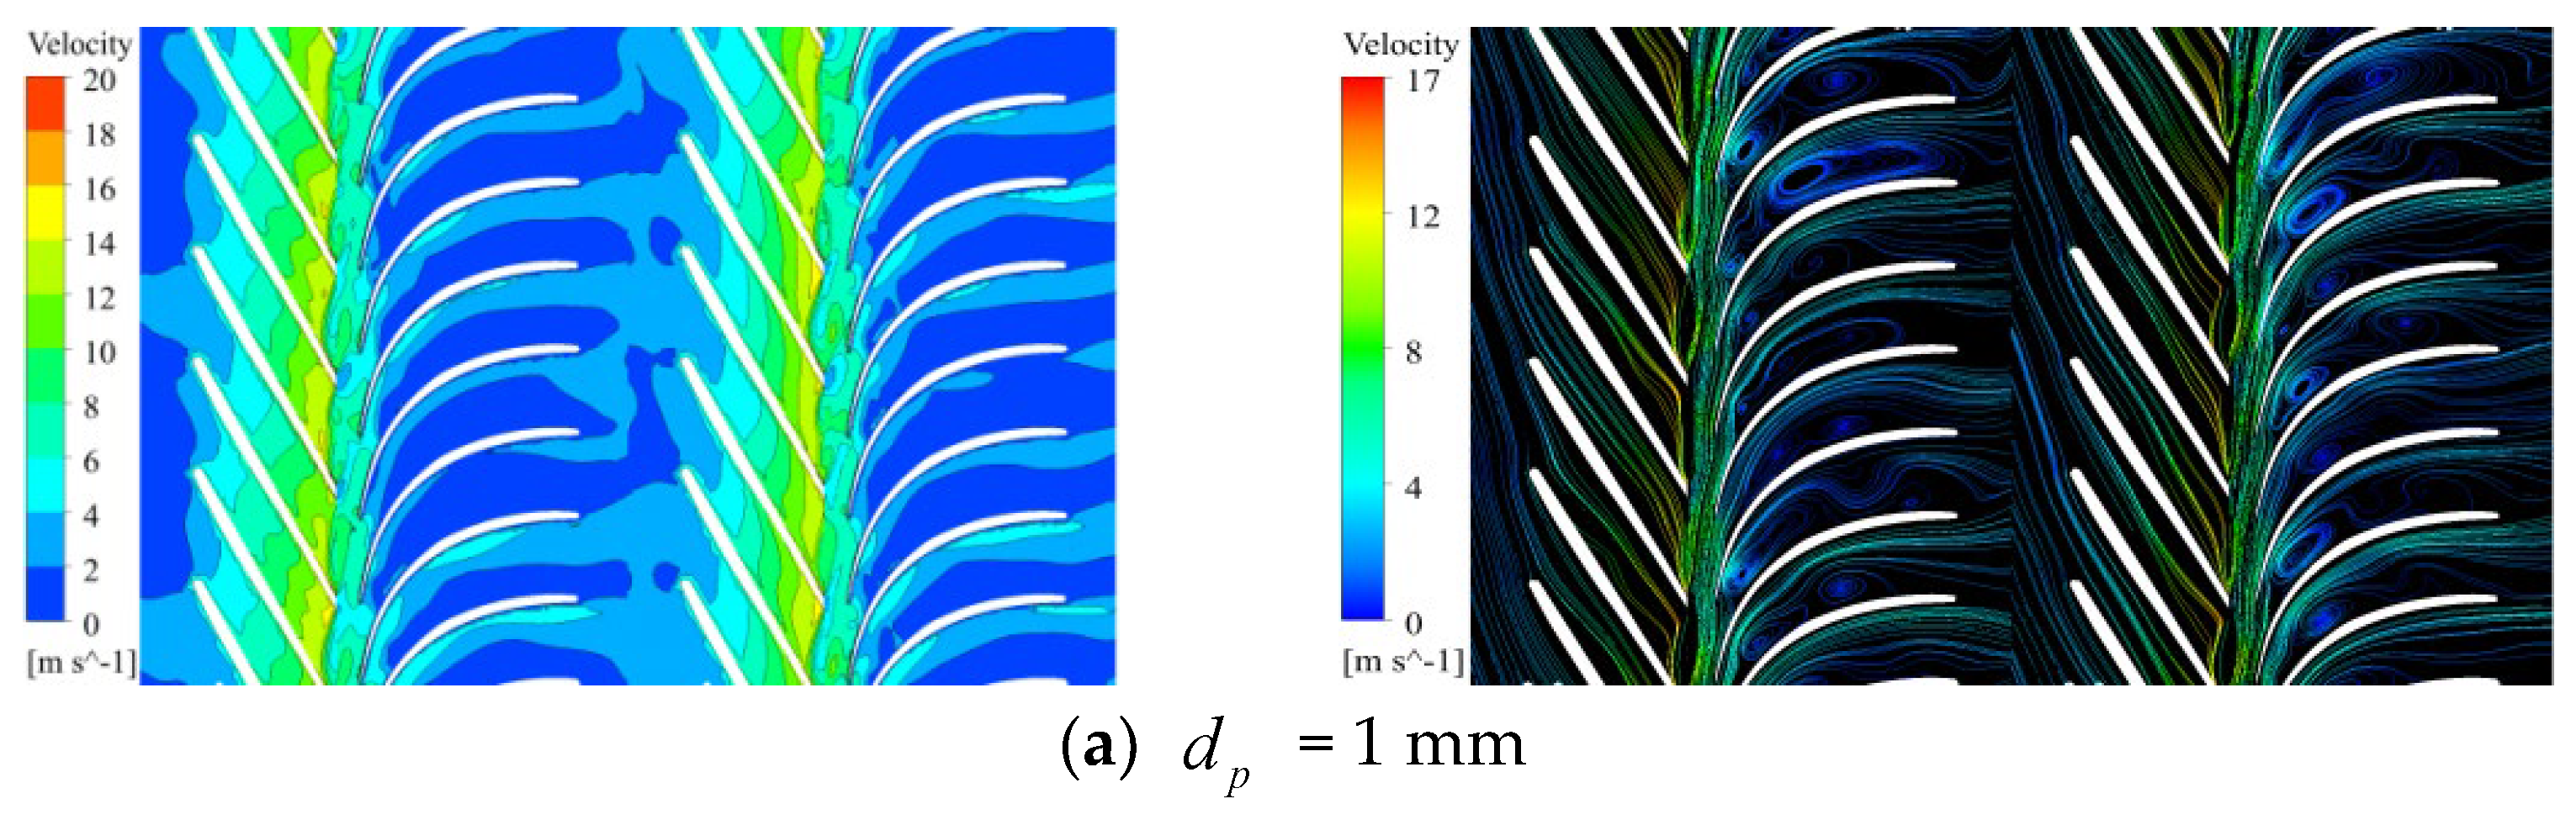
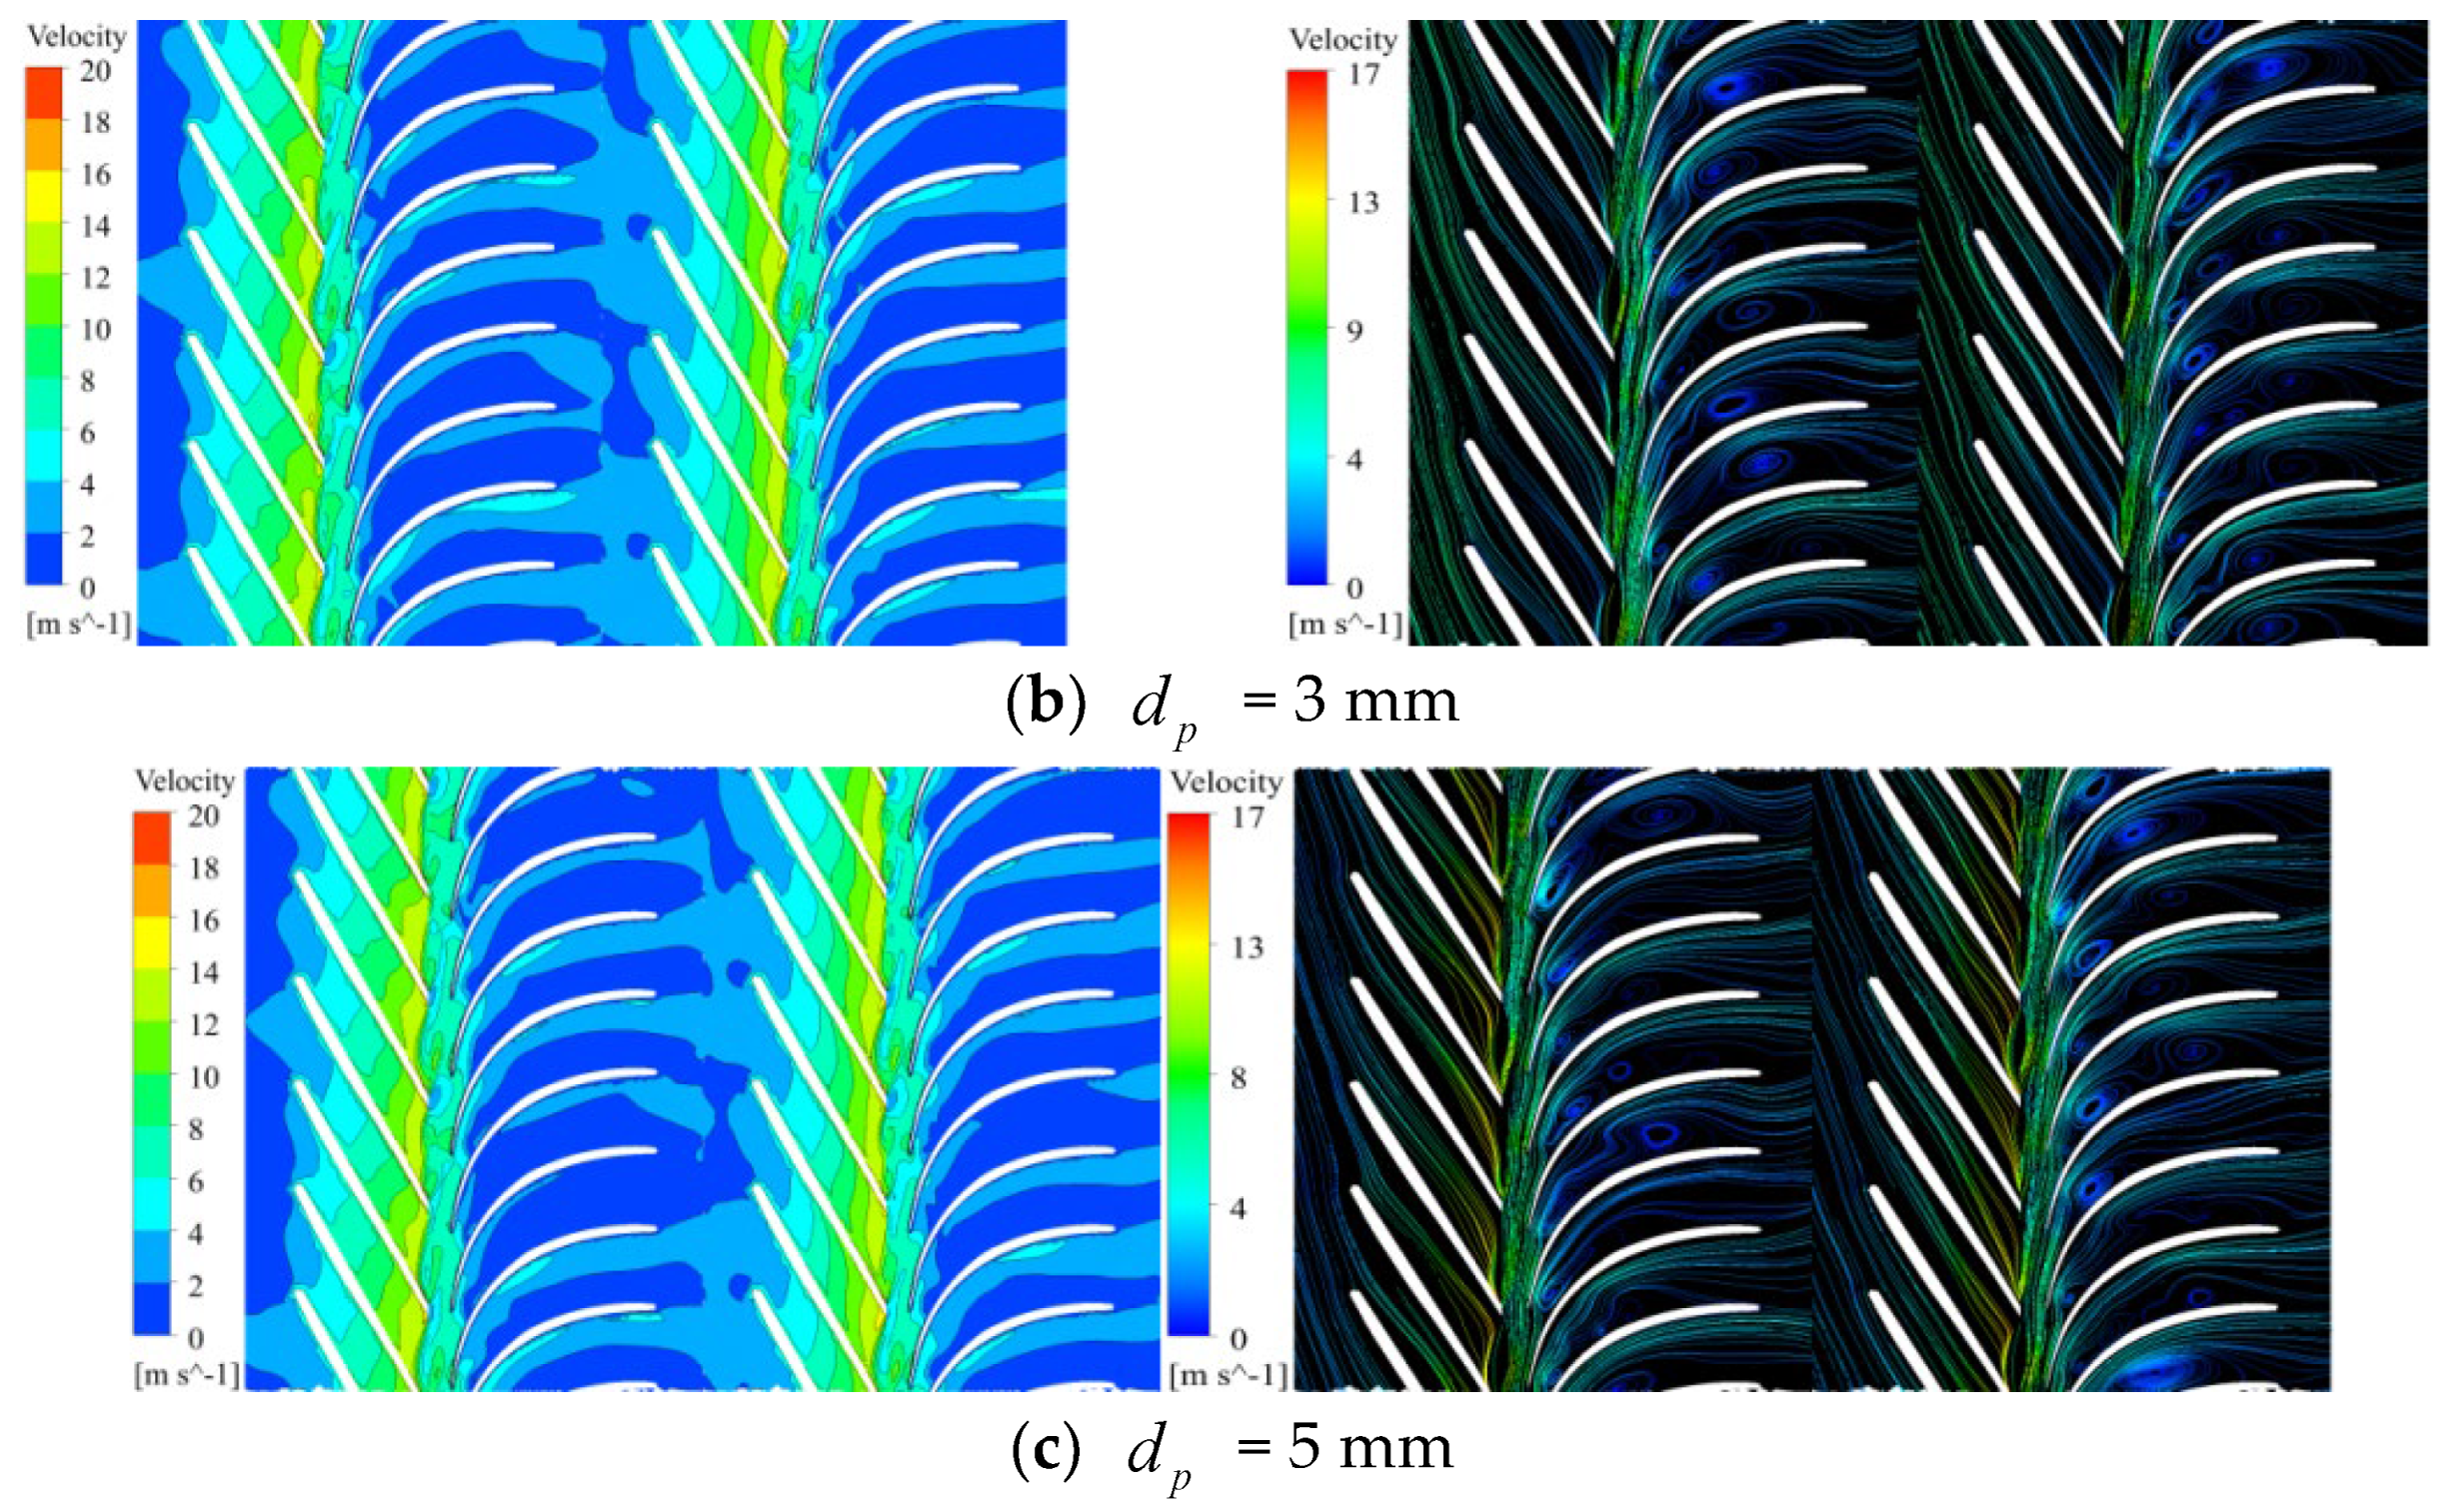
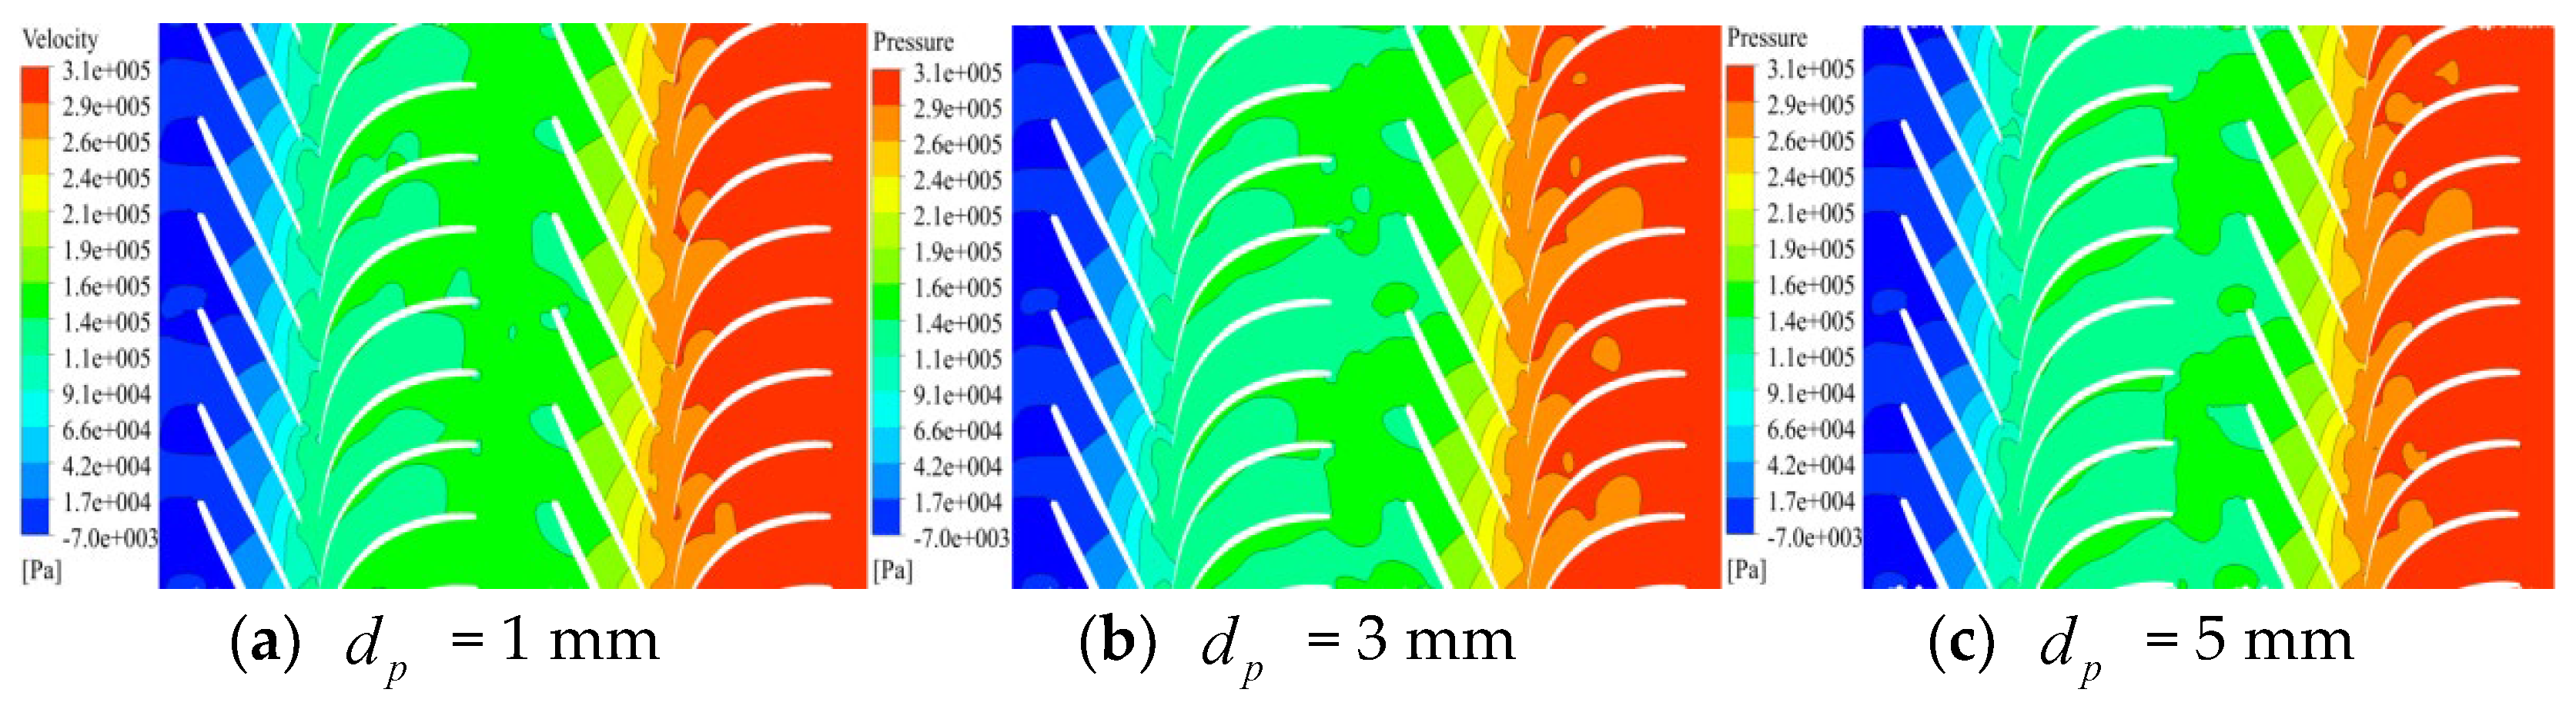
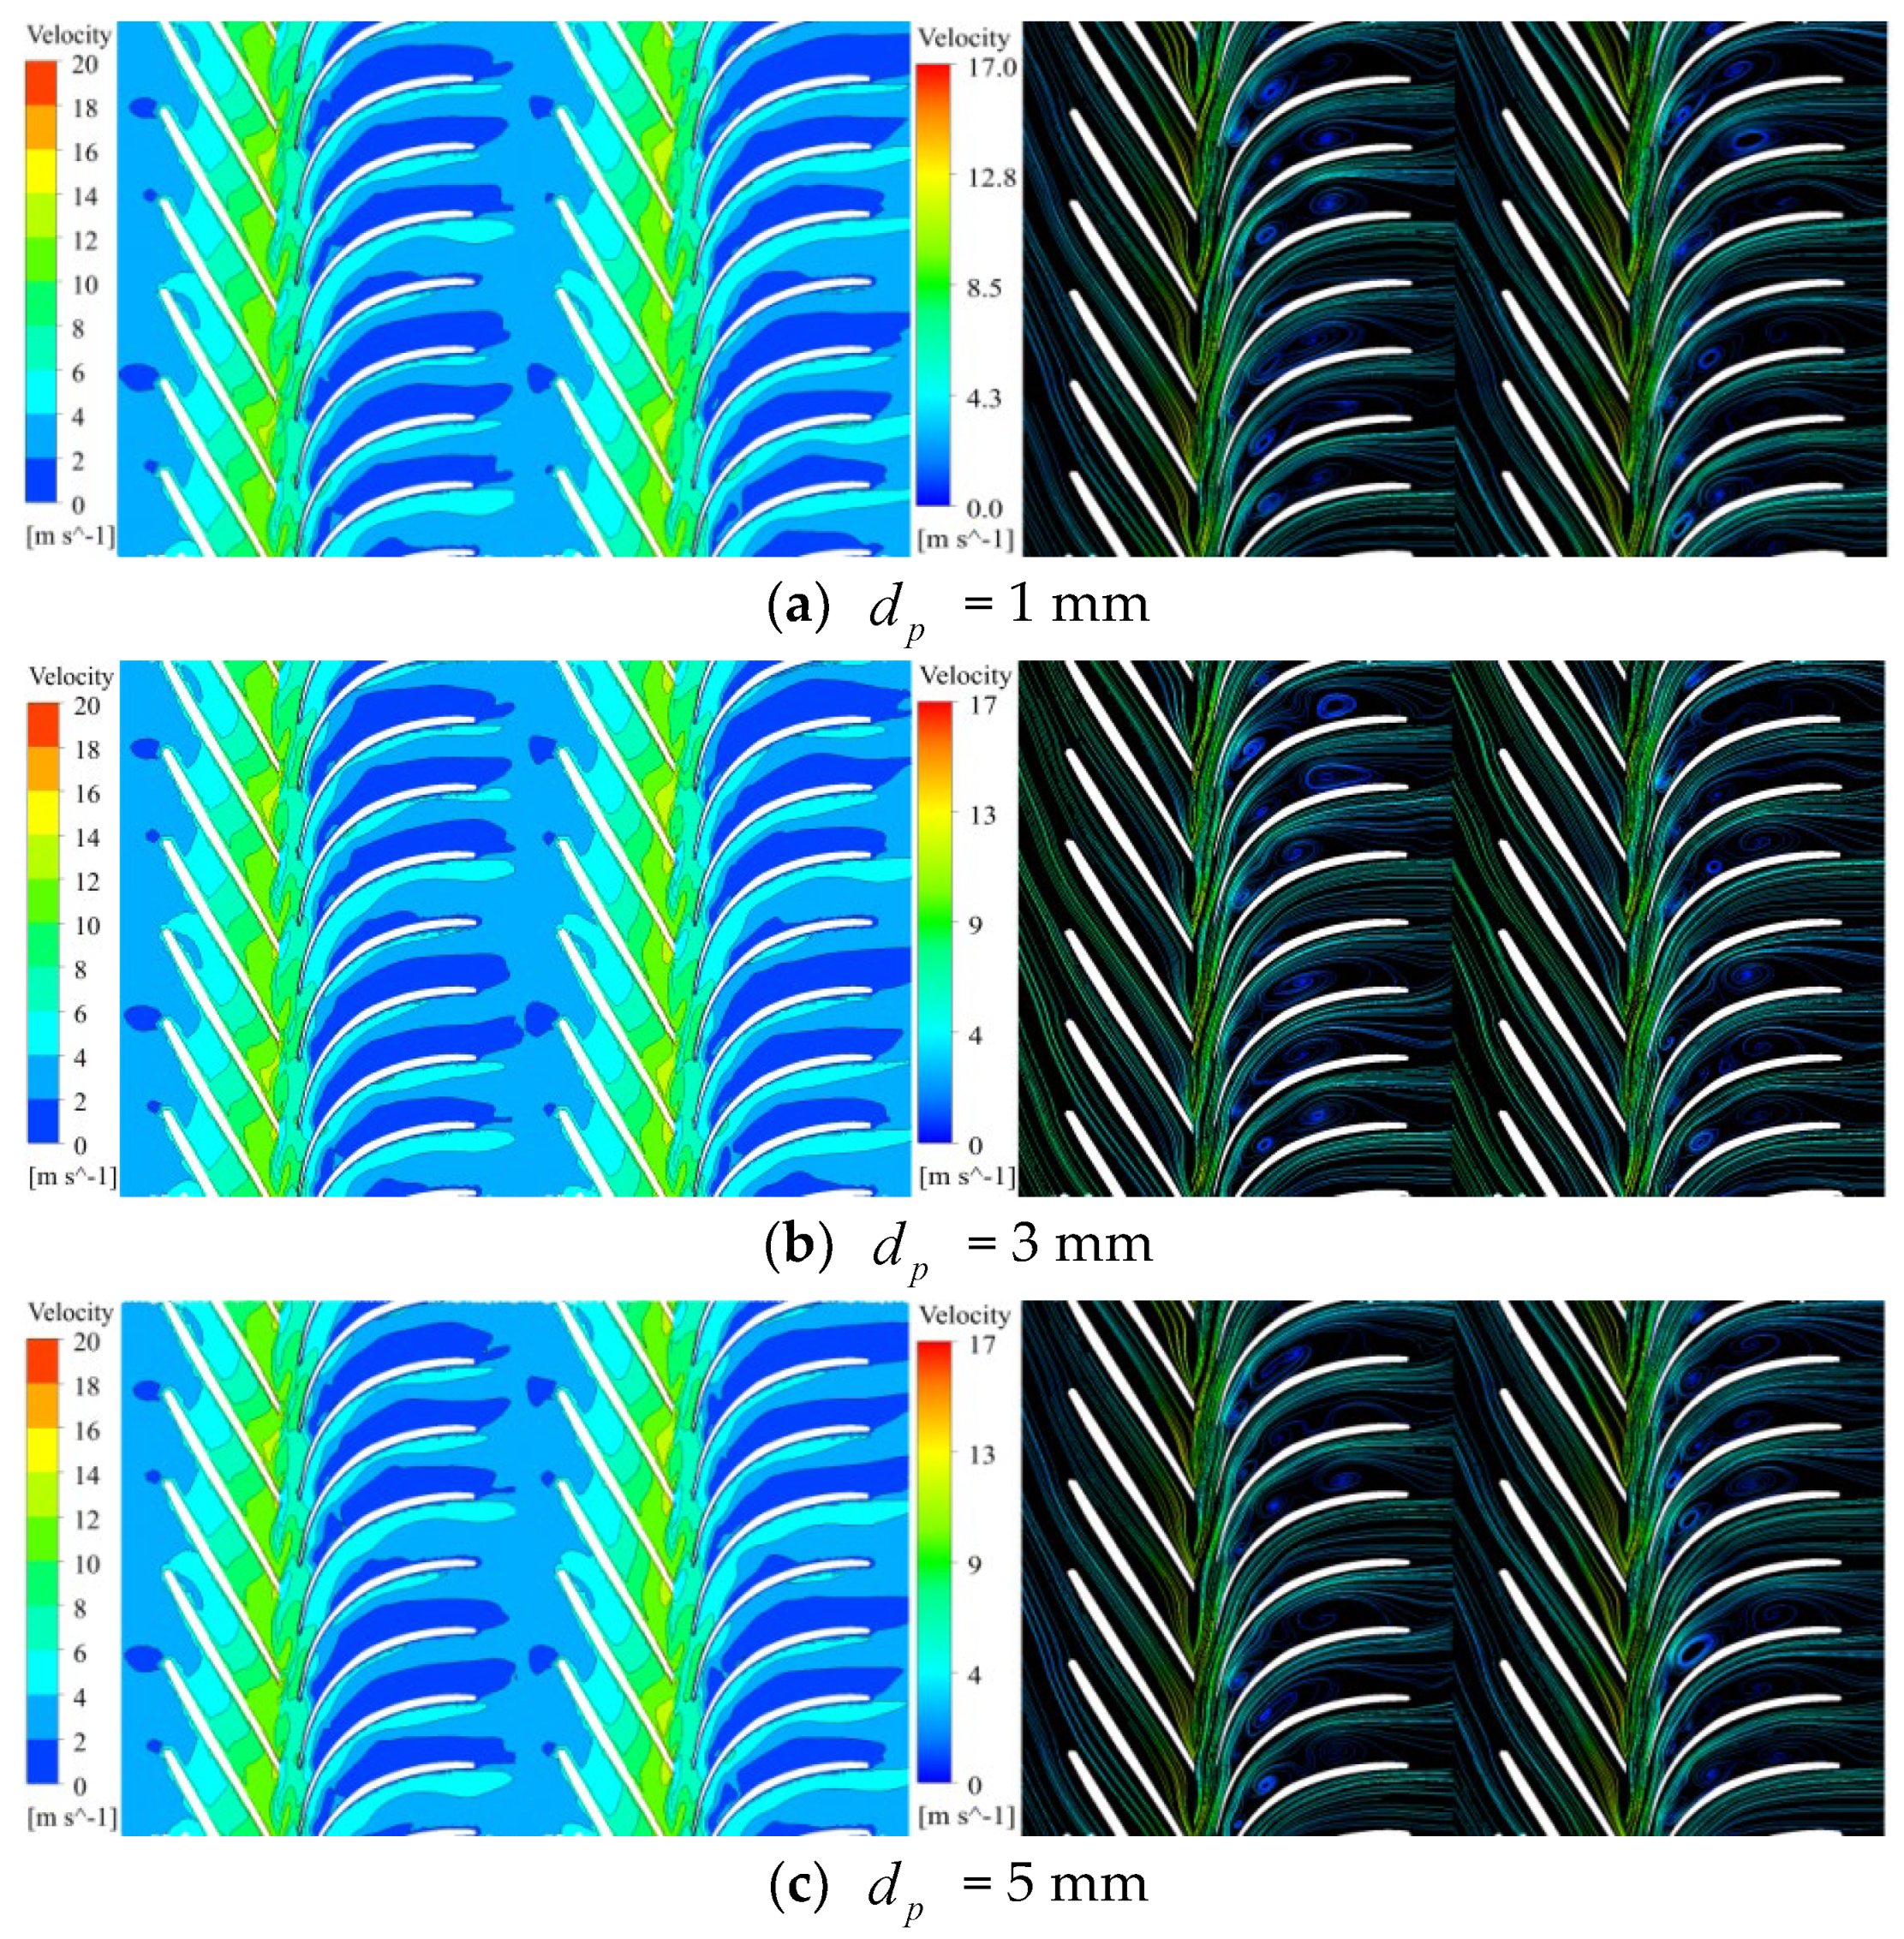
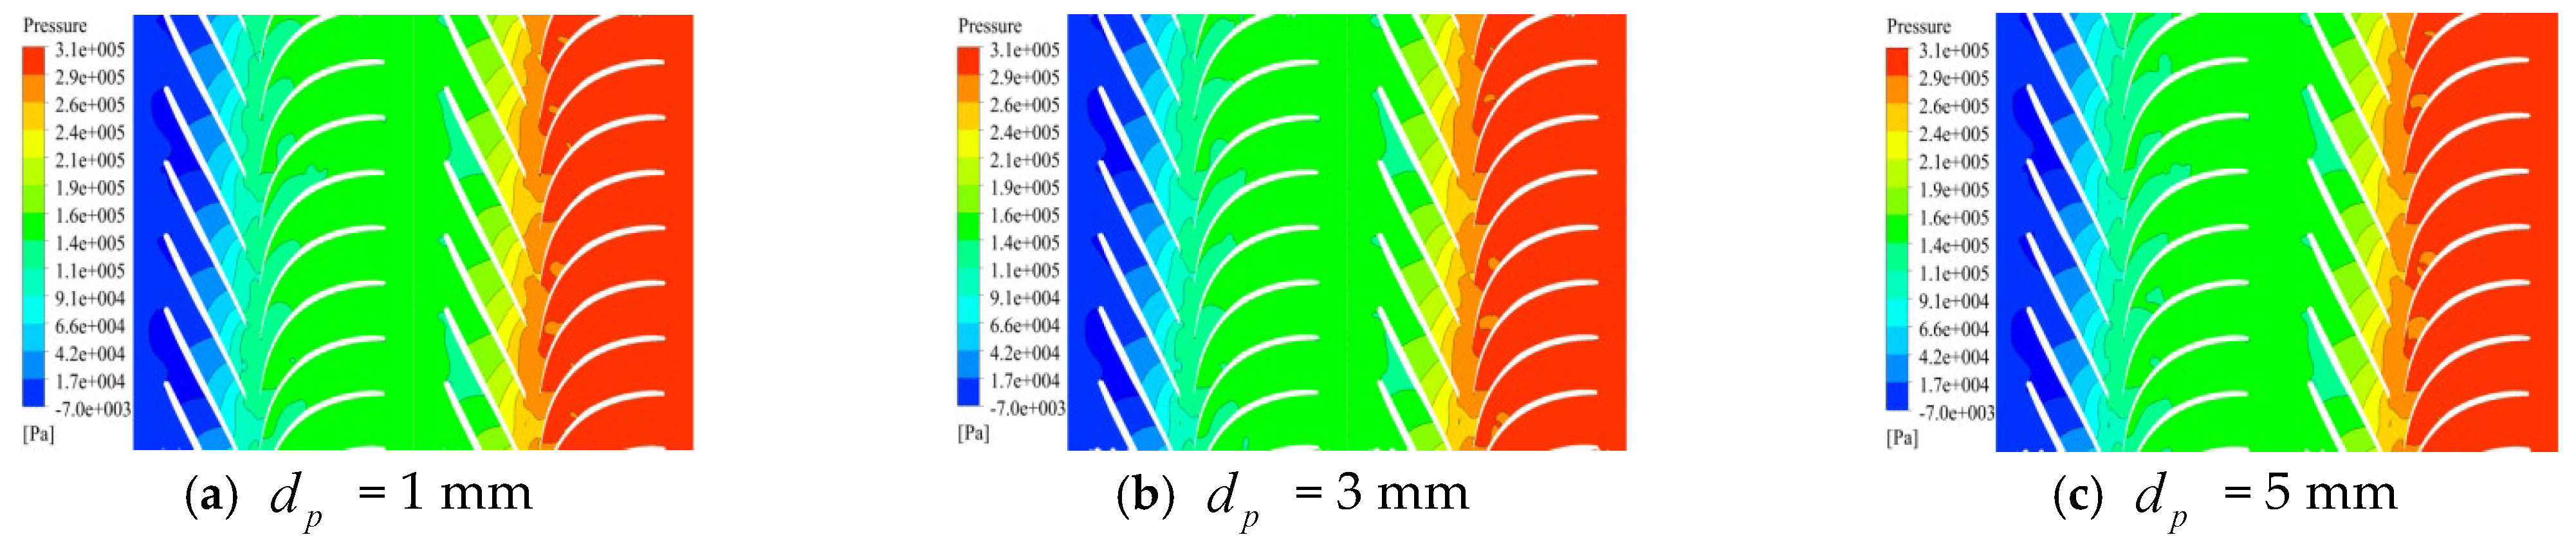
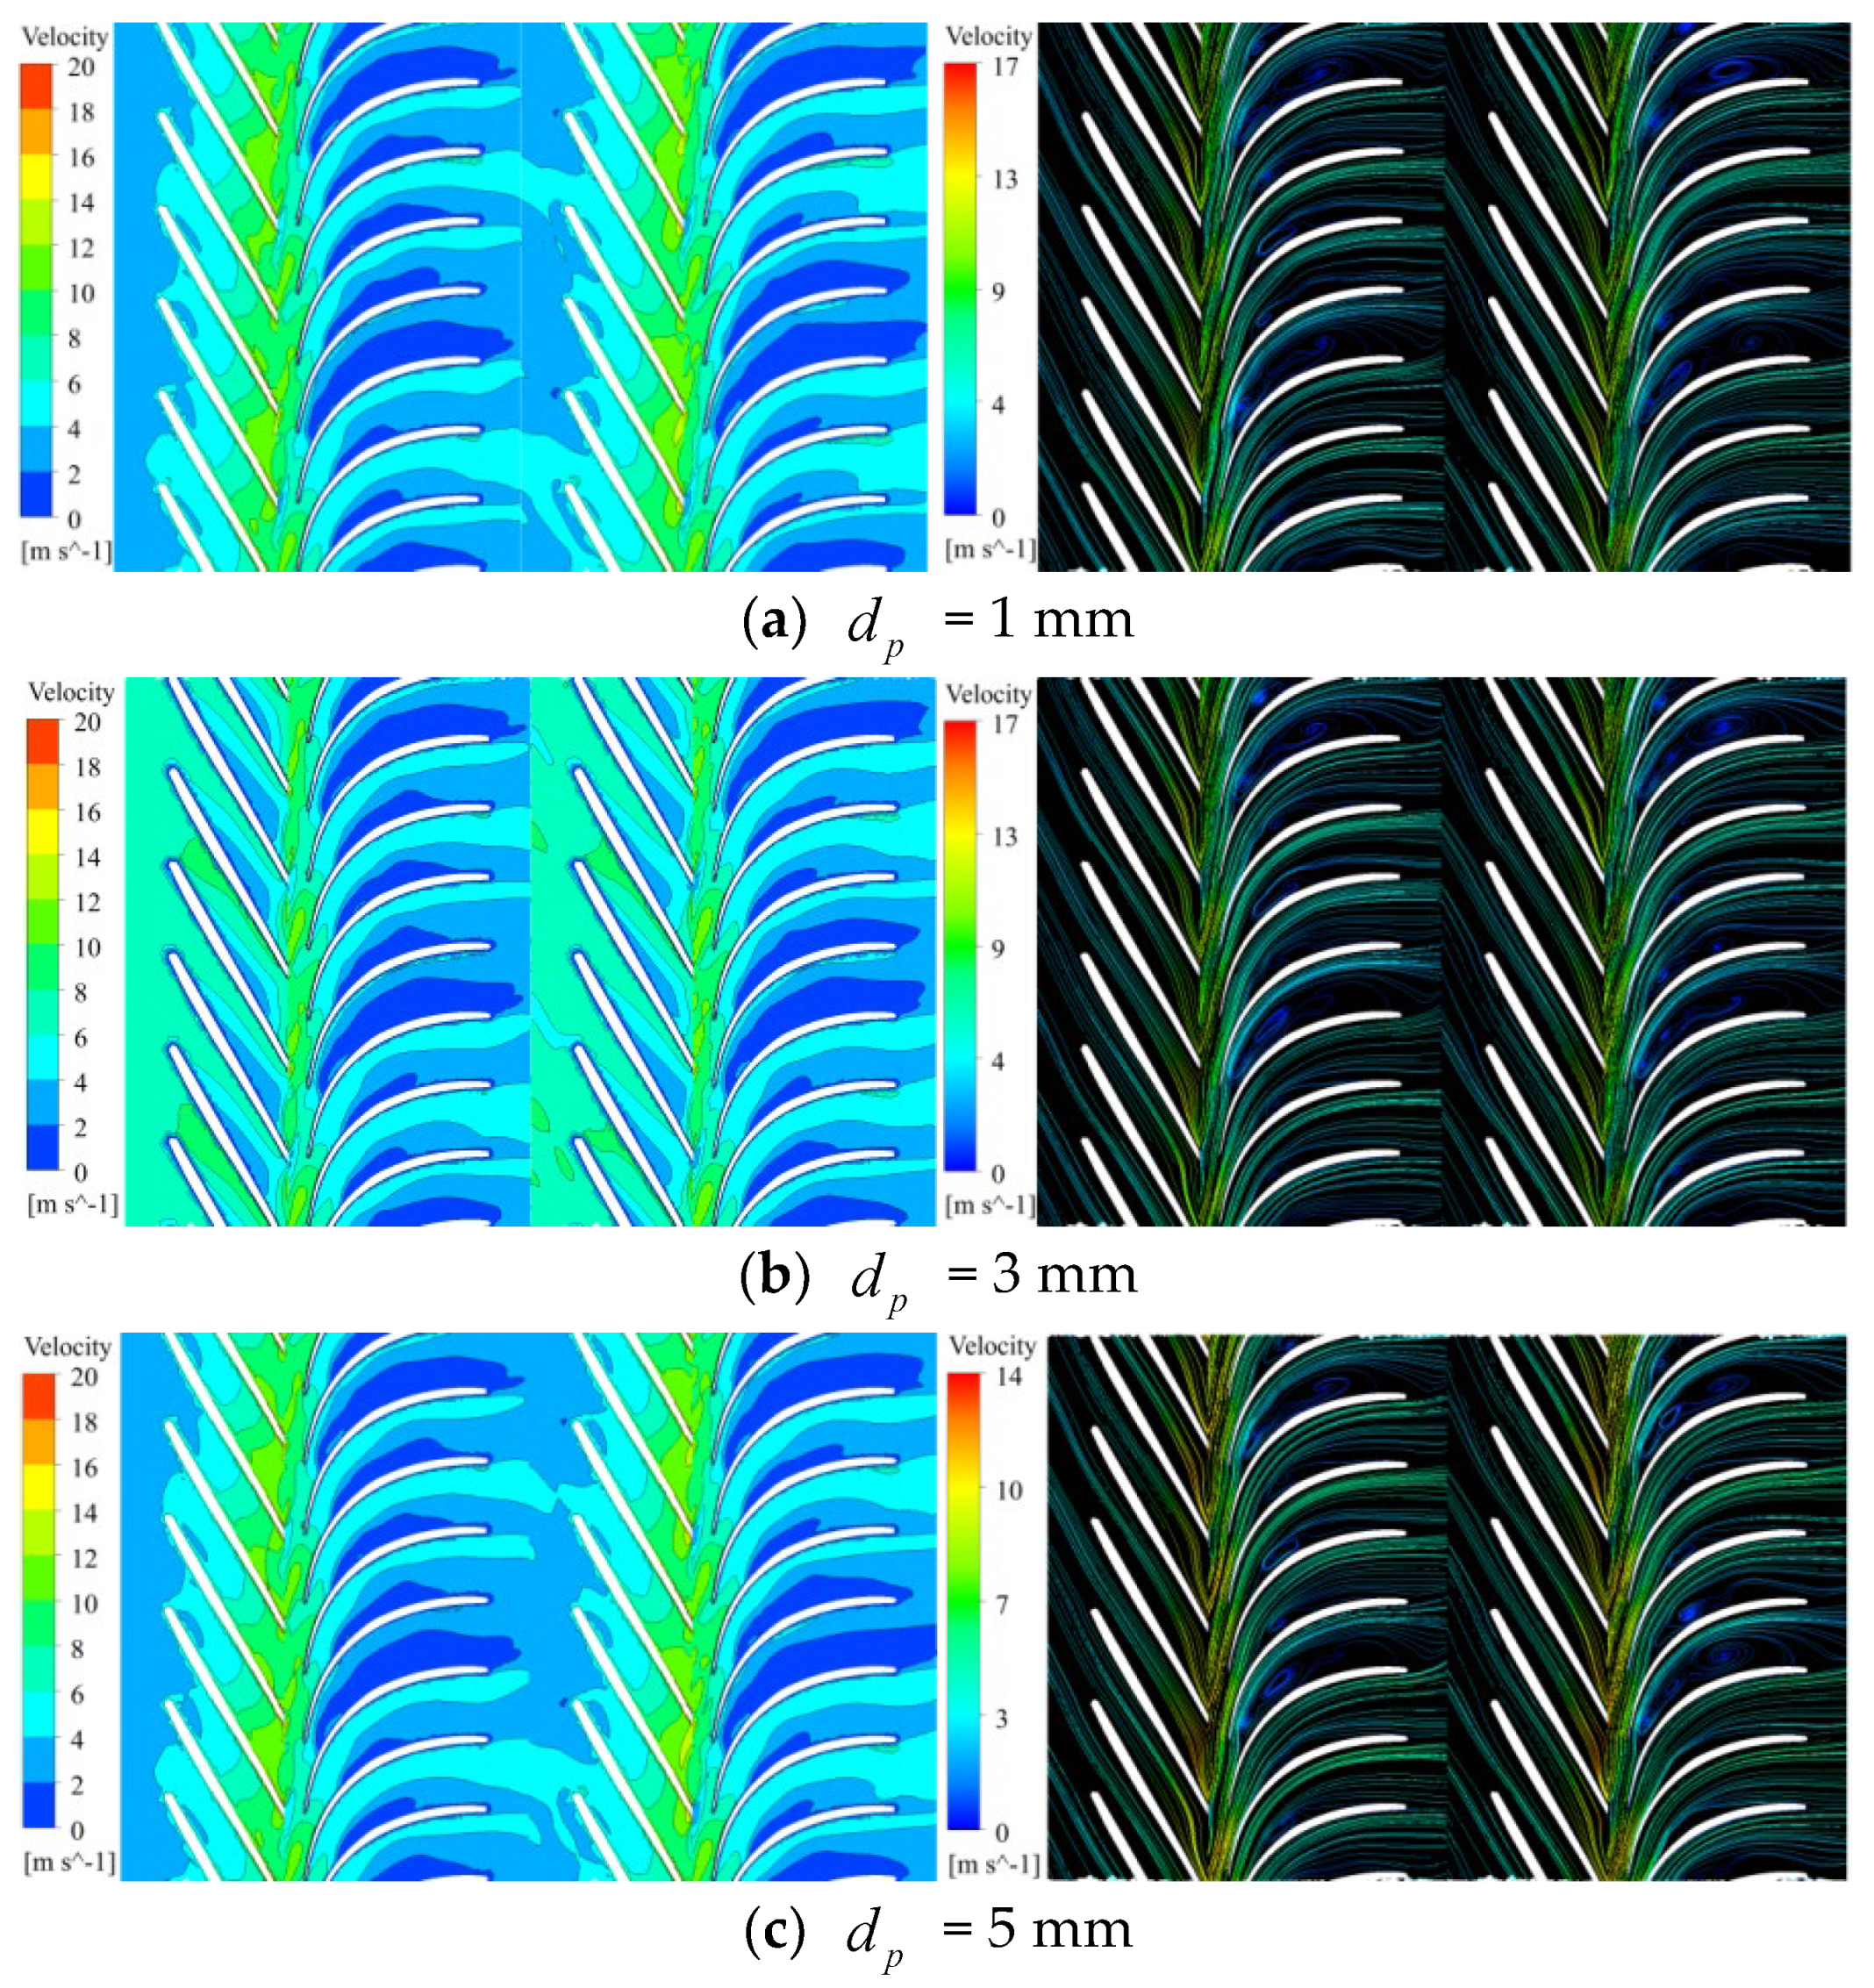
According to the numerical calculation results, under the same flow condition, larger particle sizes result in a more pronounced disturbance effect on the liquid phase, leading to an expansion of the vortex region within the mining pump.
(2)
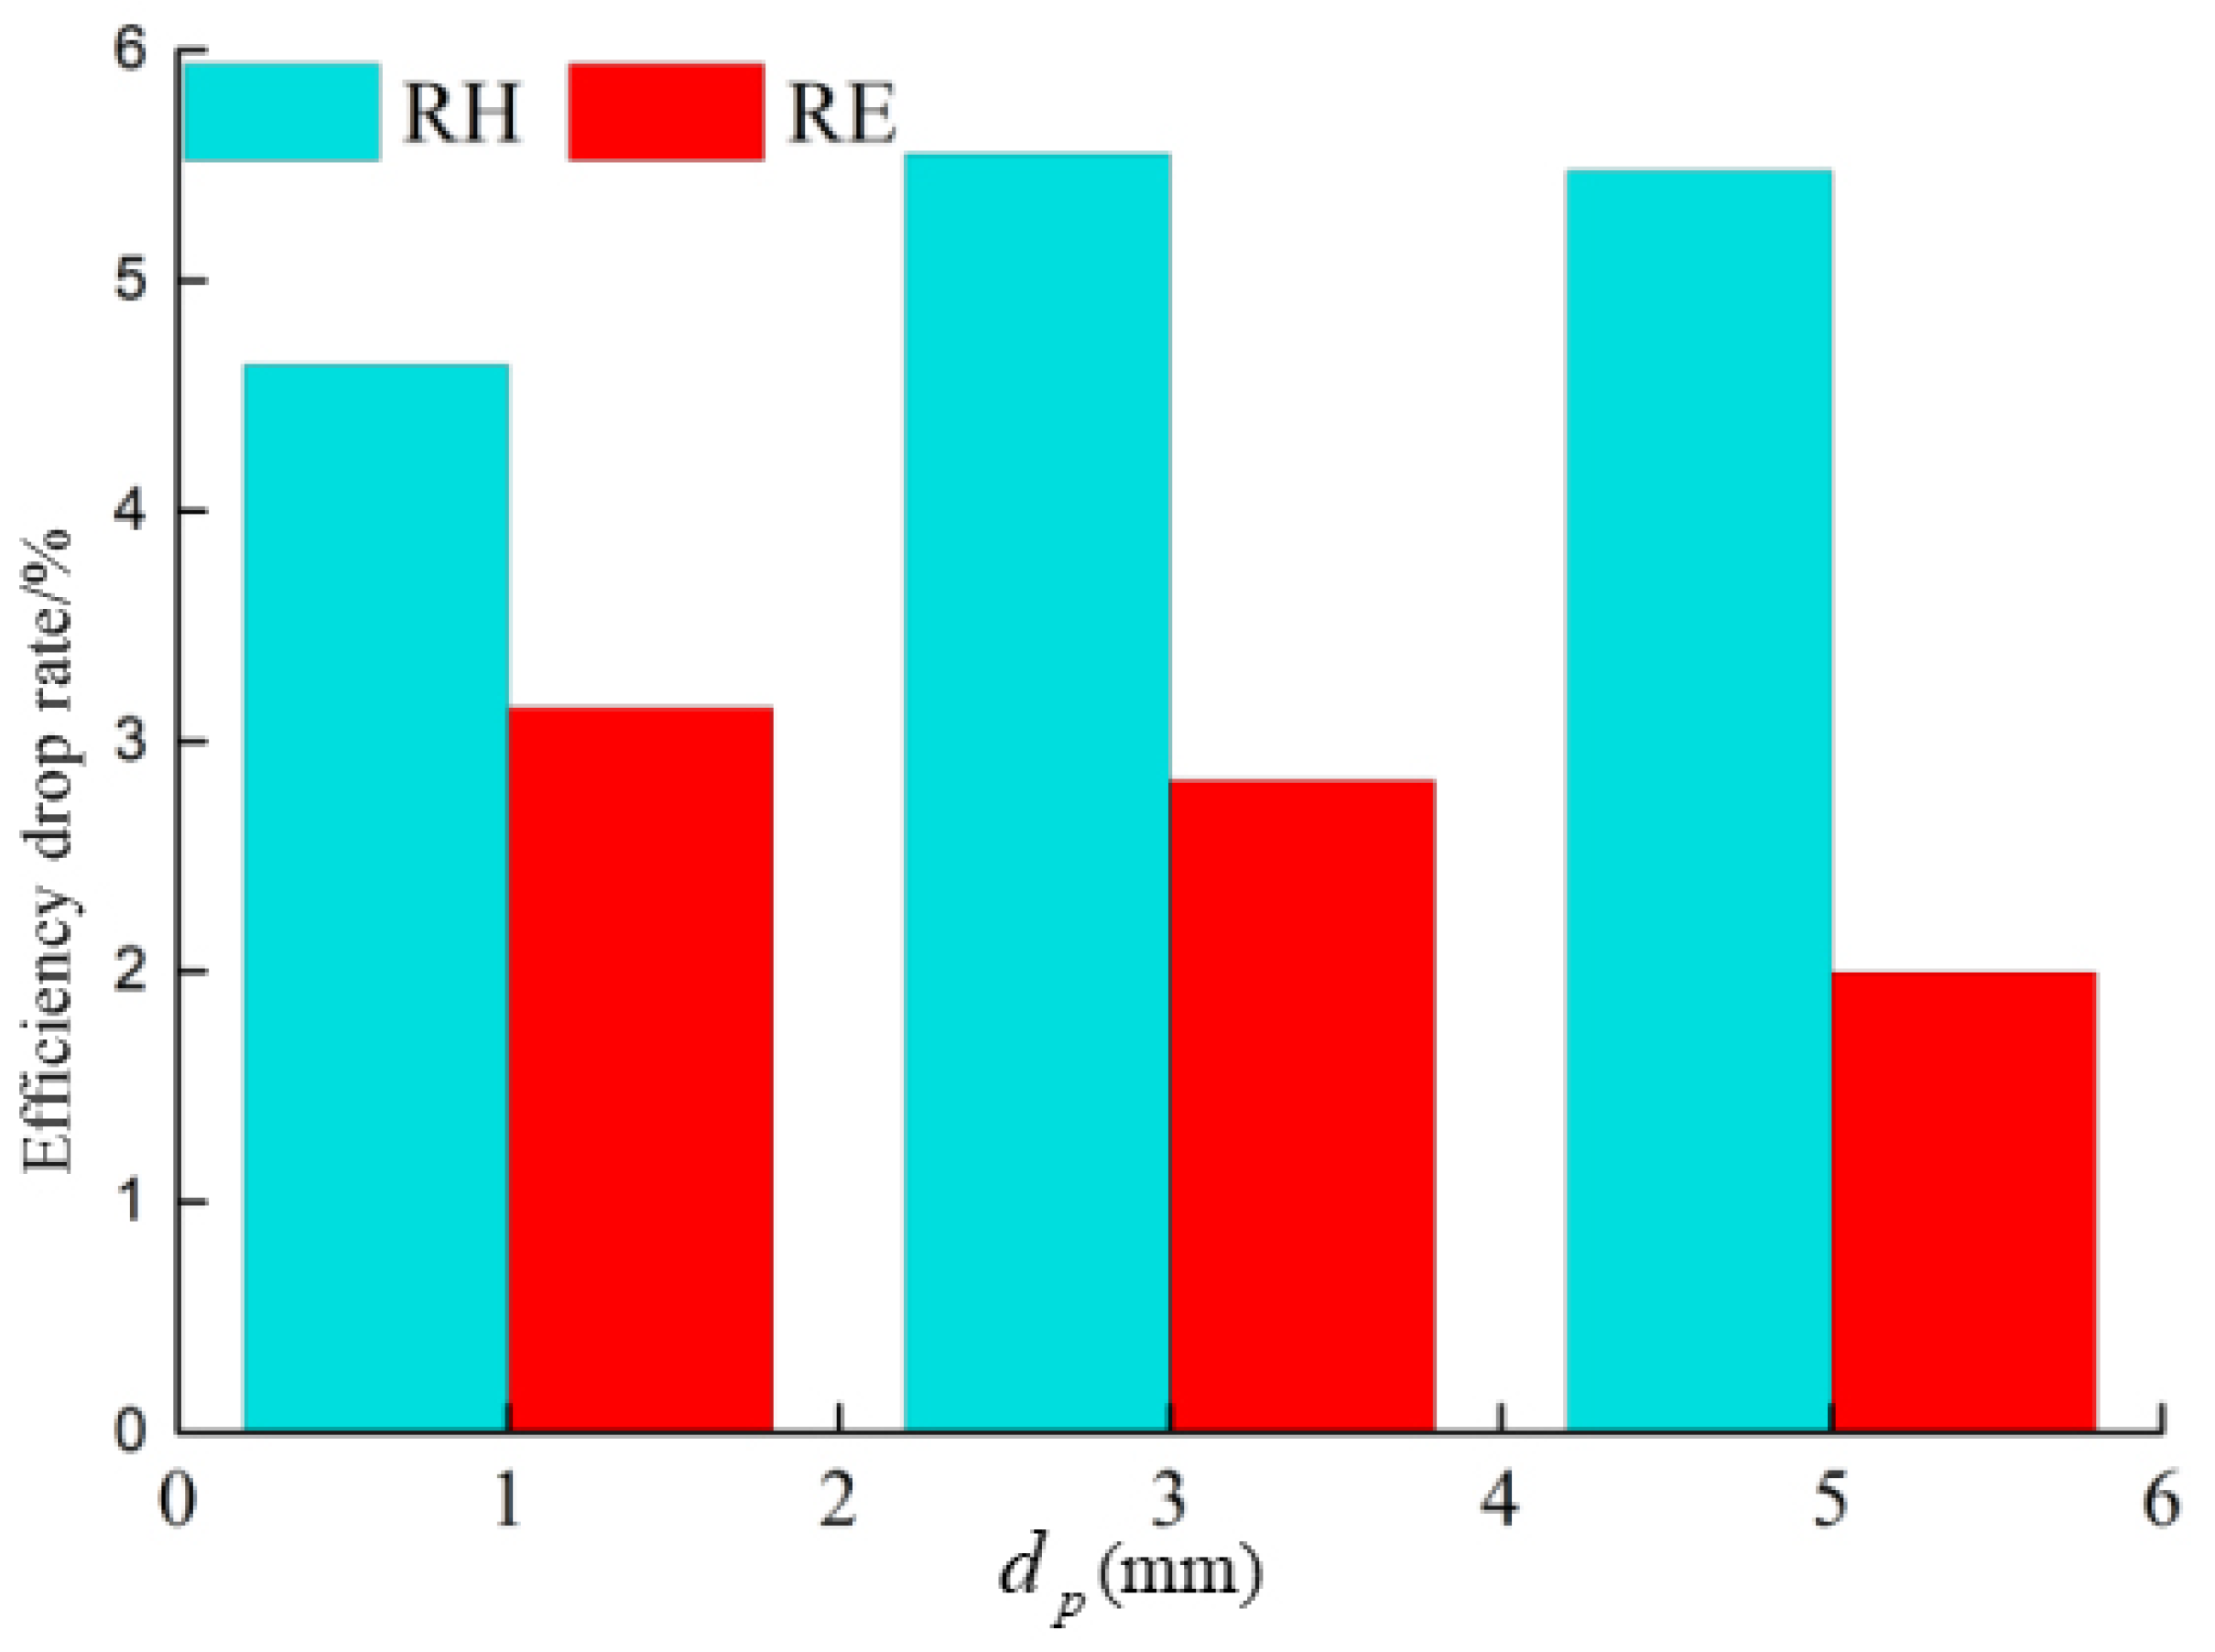
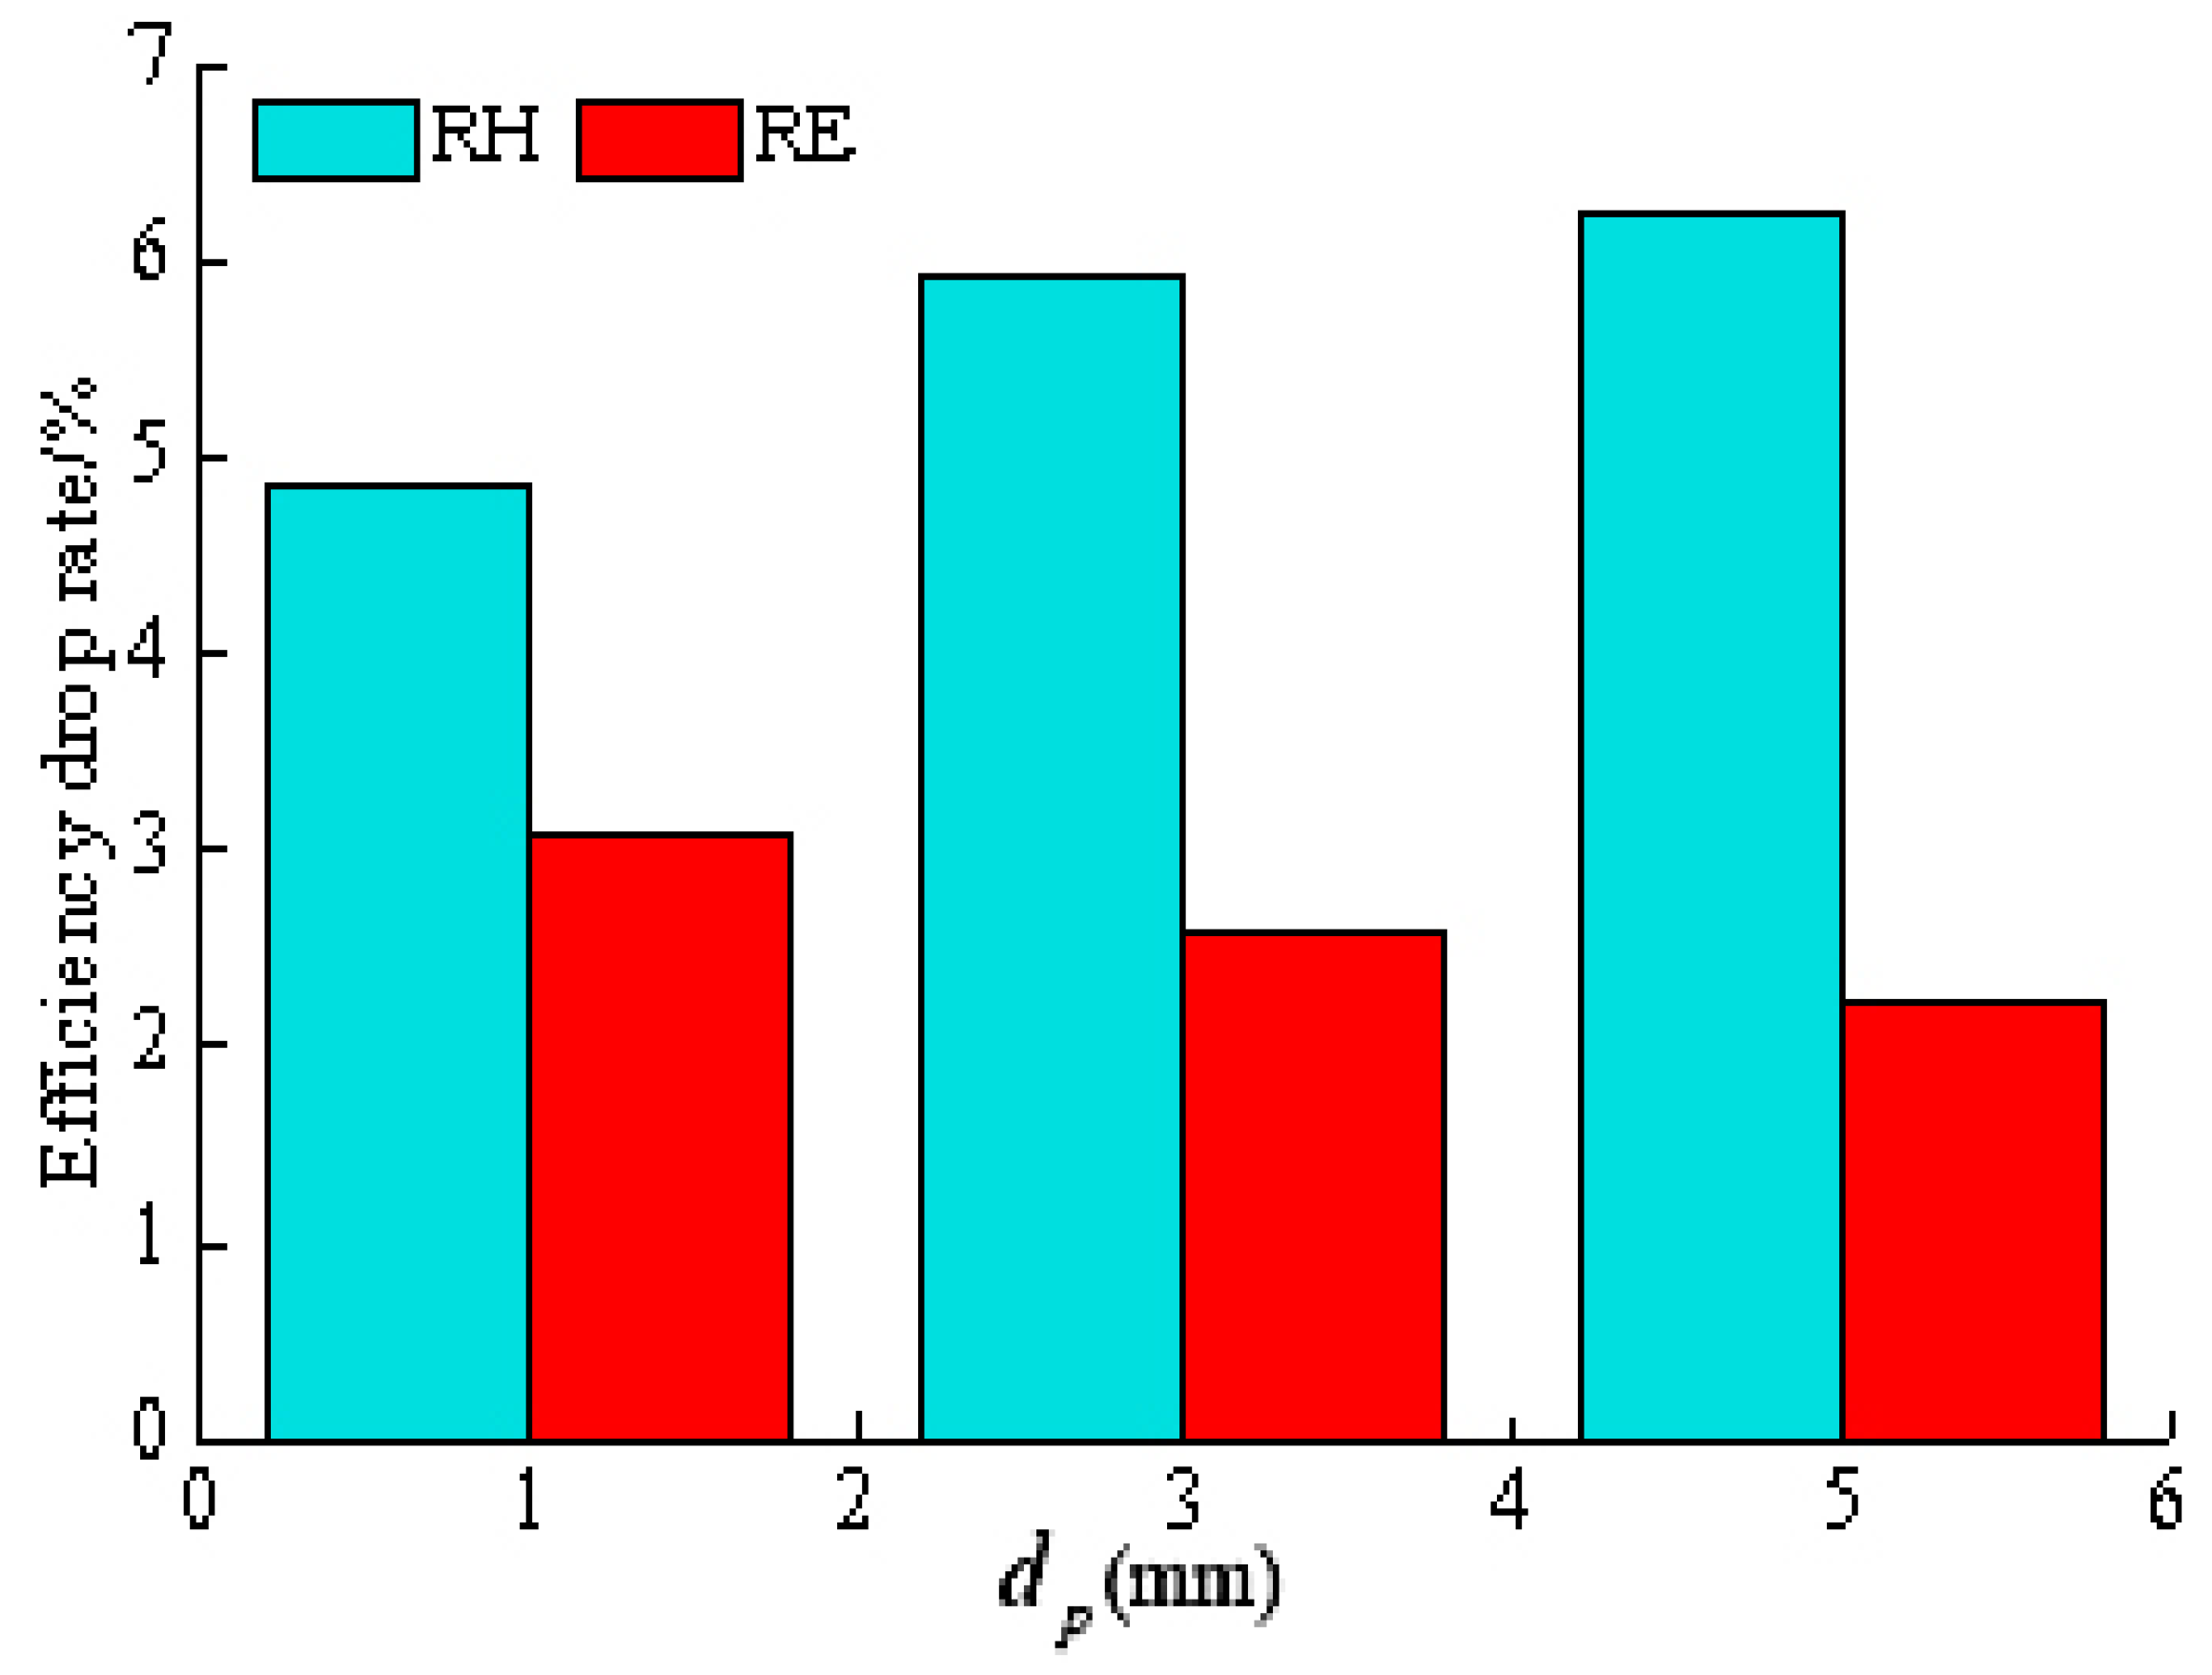
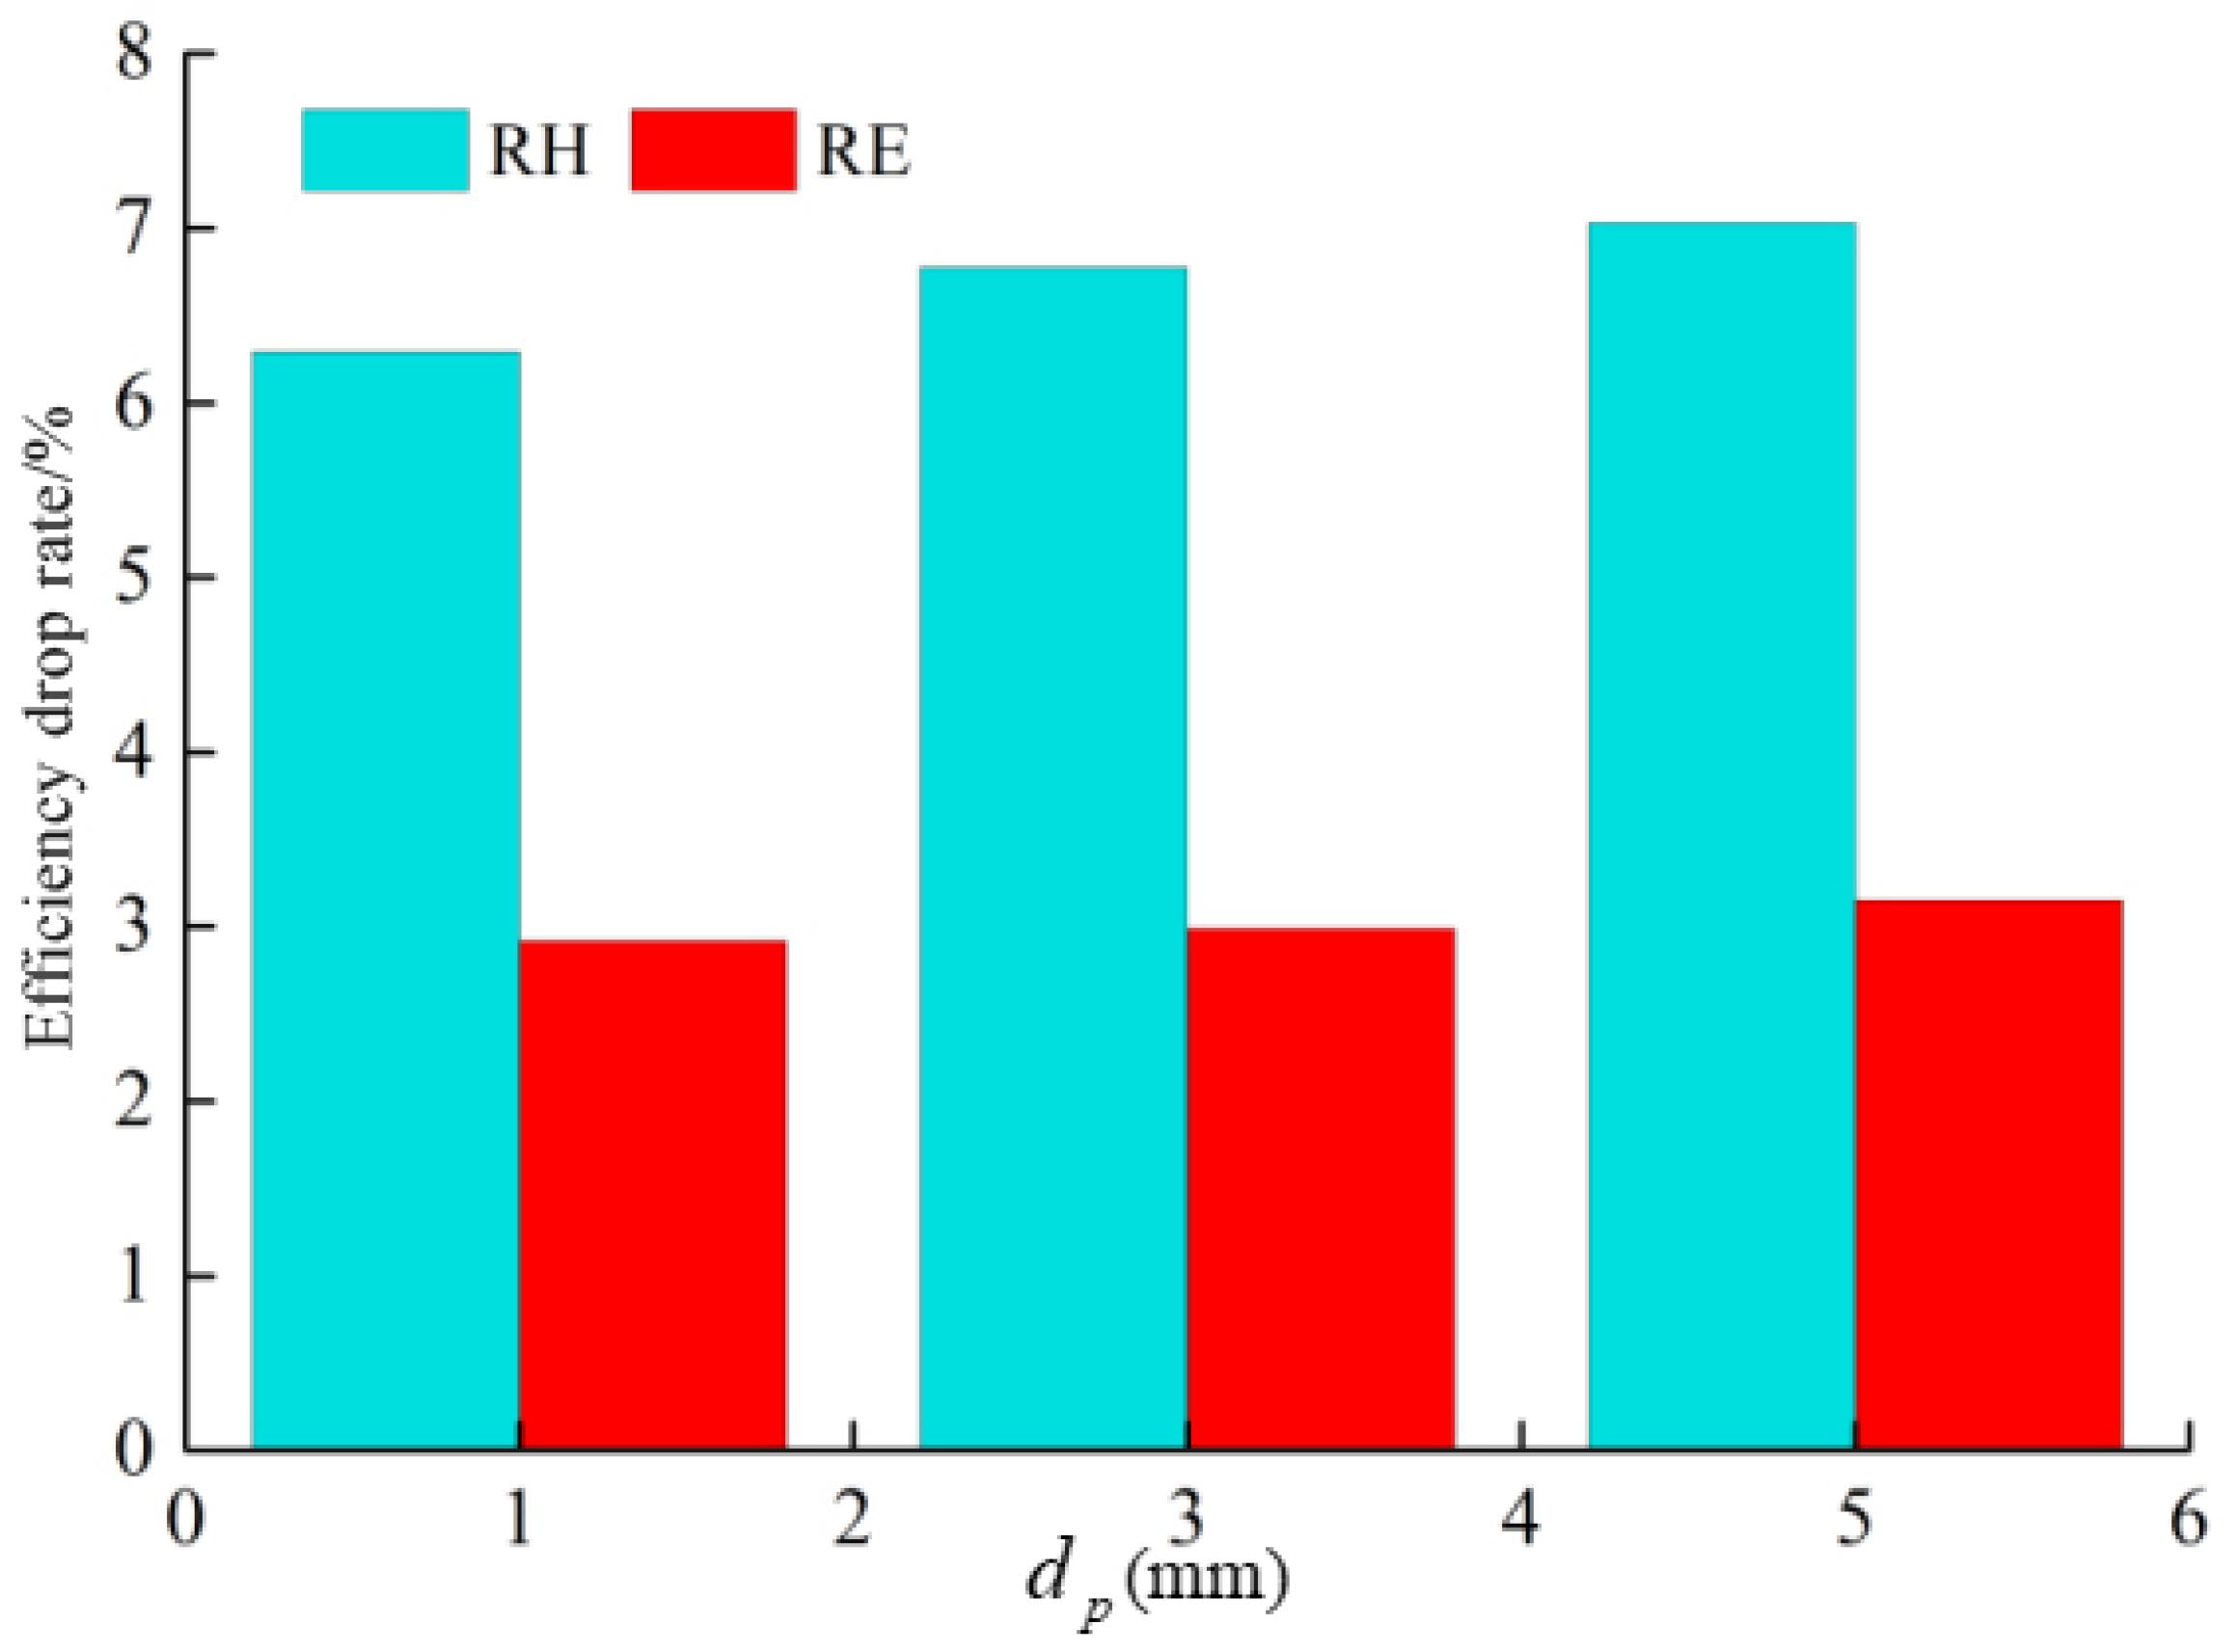
According to the numerical calculation results, under the low flow rate condition, an increase in particle size leads to varying degrees of performance degradation in the mining pump. Under the rated flow condition, the particle size is positively correlated with the pump head drop rate and negatively correlated with the efficiency drop rate. Under the high flow rate condition, the particle size is positively correlated with the head drop rate but has a small impact on efficiency.
(3)
According to the experimental validation results, the numerical calculation method employed in this study for analyzing the flow characteristics, performance output, and wear characteristics of small-scale pumps is reasonable and effective. The small-scale pump was developed as a scaled-down model based on a prototype deep-sea mining pump. This method can be applied to the prototype deep-sea mining pump, thus further expanding the methodologies for the numerical analysis of deep-sea mineral extraction pumps.

Author Contributions

Conceptualization, S.H. and X.H.; Methodology, S.H.; Software, S.H., Y.L., Z.Y., S.L. and J.H.; Validation, S.H.; Formal analysis, S.H.; Investigation, Z.Y., S.L., P.W. and J.H.; Resources, Y.L. and X.H.; Data curation, S.H.; Writing—original draft, S.H.; Writing—review and editing, S.H. and X.H.; Visualization, Z.Y.; Supervision, X.W.; Project administration, S.L., P.W. and J.H.; Funding acquisition, S.H., Y.L., X.H. and X.W. All authors have read and agreed to the published version of the manuscript.

Funding

This work was supported by the Outstanding Youth Project of Hunan Provincial Department of Education (23B0798), Natural Science Foundation of Changsha City (kq2208430), Hunan Provincial Natural Science Foundation (Youth) (2024JJ6090), and National Key Research and Development Project of China (2016YFC0304103).

Data Availability Statement

The original contributions presented in this study are included in the article. Further inquiries can be directed to the corresponding author.

Conflicts of Interest

The authors declare no conflicts of interest.

References

  1. Ji, L.L.; He, X.R.; Li, W.; Tian, F.; Shi, W.D.; Zhou, L.; Liu, Z.B.; Yang, Y.; Xiao, C.; Agarwal, R. Research progress of advanced design method, numerical simulation, and experimental technology of pumps in deep-sea resource exploitation. Water 2024, 16, 1881. [Google Scholar] [CrossRef]
  2. Liu, S.J.; Liu, C.; Dai, Y. Status and progress on researches and developments of deep ocean mining equipments. J. Mech. Eng. 2014, 50, 8–18. [Google Scholar] [CrossRef]
  3. Yu, H.Y.; Liu, S.J. Dynamics of vertical pipe in deep-ocean mining system. J. Cent. South Univ. Technol. 2007, 14, 552–556. [Google Scholar] [CrossRef]
  4. Kumar, D.; Amudha, K.; Gopakumar, K.; Ramadass, G.A. Air-lift pump systems for vertical solid particle transport: A comprehensive review and deep sea mining potential. Ocean Eng. 2024, 297, 116928. [Google Scholar] [CrossRef]
  5. Wang, R.K.; Zhu, Z.C.; Su, X.H.; Tang, D.S.; Jin, X.; Gruszczynski, M. Influence on the solid-liquid two-phase flow from cross-section area of slurry pumps for deep-sea mining. China Ocean Eng. 2022, 36, 439–450. [Google Scholar] [CrossRef]
  6. Zhu, Z.; Lv, Y.; Su, X.; Zhang, J.; Wang, R.; Lu, W.; Sun, J. Balance of Efficiency and Security-influence on Slurry Transport from the Diffusion of Flow Passages of a Deep-sea Mining Pump. J. Appl. Fluid Mech. 2023, 16, 1690–1703. [Google Scholar]
  7. Li, Y.W. CFD-DEM analysis of internal flow characteristics in multistage deep-sea mining pumps. Ships Offshore Struct. 2024, 1–14. [Google Scholar] [CrossRef]
  8. Li, Y.; Liu, D.X.; Cui, B.L.; Lin, Z.; Zheng, Y.H.; Ishnazarov, O. Studying particle transport characteristics in centrifugal pumps under external vibration using CFD-DEM simulation. Ocean Eng. 2024, 301, 117538. [Google Scholar] [CrossRef]
  9. Zhu, Z.C.; Sun, J.B.; Lin, Z.; Jin, Y.J.; Li, Y. Characterization of the ellipsoidal particle motion in a two-stage lifting pump using CFD-DEM method. Comput. Part. Mech. 2024, 1–16. [Google Scholar] [CrossRef]
  10. Zhang, Z.H.; Tan, M.G.; Wu, X.F.; Liu, H.L.; Shao, C.; Qu, B. The effect of particle size on the reflux performance of the lifting pumps. Comput. Part. Mech. 2024, 11, 1837–1847. [Google Scholar] [CrossRef]
  11. Li, Y.; Chen, J.C.; Lin, Z.; Zhang, G.; Gao, Z.J.; Ishnazarov, O. Liquid-solid two-phase flow and wear characteristics in a two-stage mixed-transport pump. J. Mech. Sci. Technol. 2024, 38, 4187–4197. [Google Scholar] [CrossRef]
  12. Chen, J.L.; Chen, X.; Li, W.J.; Zheng, Y.H.; Li, Y. Research on two-phase flow and wear of inlet pipe induced by fluid prewhirl in a centrifugal pump. J. Mar. Sci. Eng. 2024, 12, 950. [Google Scholar] [CrossRef]
  13. Deng, L.W.; Lu, H.N.; Liu, S.J.; Hu, Q.; Yang, J.M.; Kang, Y.J.; Sun, P.F. Particle anti-accumulation design at impeller suction of deep-sea mining pump and evaluation by CFD-DEM simulation. Ocean Eng. 2023, 279, 114598. [Google Scholar] [CrossRef]
  14. Lv, Y.; Su, X.; Yang, H.; Zhang, J.; Wang, R.; Zhu, Z. Velocity slip in a deep-sea slurry pump and its effect on particle transportation. J. Appl. Fluid Mech. 2023, 16, 1654–1665. [Google Scholar]
  15. Hu, Q.; Chen, J.; Deng, L.W.; Kang, Y.J.; Liu, S.J. CFD-DEM simulation of backflow blockage of deep-sea multistage pump. J. Mar. Sci. Eng. 2021, 9, 987. [Google Scholar] [CrossRef]
  16. Wang, P.K.; Guan, Y.J.; Jin, X.; Tang, Z.J.; Zhu, Z.C.; Su, X.H. Impact of particle sizes on flow characteristics of slurry pump for deep-sea mining. Shock Vib. 2021, 2021, 6684944. [Google Scholar] [CrossRef]
  17. Deng, L.W.; Hu, Q.; Chen, J.; Kang, Y.J.; Liu, S.J. Particle distribution and motion in six-stage centrifugal pump by means of slurry experiment and CFD-DEM simulation. J. Mar. Sci. Eng. 2021, 9, 716. [Google Scholar] [CrossRef]
  18. Hu, Q.; Zou, L.; Lv, T.; Guan, Y.J.; Sun, T.Z. Experimental and numerical investigation on the transport characteristics of Particle-Fluid Mixture in Y-Shaped Elbow. J. Mar. Sci. Eng. 2020, 8, 675. [Google Scholar] [CrossRef]
  19. Li, Y.; Liu, S.; Hu, X. Research on reflux in deep-sea mining pump based on DEM-CFD. Mar. Georesour. Geotechnol. 2019, 38, 744–752. [Google Scholar]
  20. Cheng, Z.M.; Liu, H.L.; Zhang, R.J.; Kim, H.B.; Dong, L.; Wang, X.L.; Zhou, R.Z. Energy characteristics of a deep-sea mining pump under solid-phase interaction. Ocean Eng. 2024, 311, 118835. [Google Scholar] [CrossRef]
  21. Xie, B.Q.; Cheng, Y.R.; Tang, P.; Wang, T.; Ma, W.B. Energy loss of deep-sea mining pump for polymetallic nodule particles transport based on entropy production method. Powder Technol. 2024, 445, 120080. [Google Scholar] [CrossRef]
  22. Hu, J.; Jin, G.Q.; Zou, L.; Yu, Z.B.; Dong, X.L.; Qian, H.Y. Solid-liquid two-phase flow characteristics considering nonspherical mineral particles in deep-sea mining systems. Ocean Eng. 2025, 320, 120323. [Google Scholar] [CrossRef]
  23. Jin, Y.Z.; Cai, Z.X.; Cui, J.Y. The characteristics of coarse particle solid-liquid two-phase flow and wear properties in deep-sea multistage mining pumps. Phys. Fluids 2025, 37, 013339. [Google Scholar] [CrossRef]
  24. Hu, Q.; Zhai, X.Y.; Li, Z.F. Multi-objective optimization of deep-sea mining pump based on CFD, GABP Neural Network and NSGA-III algorithm. J. Mar. Sci. Eng. 2022, 10, 1063. [Google Scholar] [CrossRef]
  25. Xu, H.L.; Chen, W.; Li, L.; Yang, F.Q. Morphology of deep-sea mining hydraulic conveying pipeline and its influencing laws in marine dynamic environment. J. Cent. South Univ. 2023, 30, 3790–3807. [Google Scholar] [CrossRef]
  26. Zhu, X.M.; Sun, L.P.; Li, B. Dynamic analysis of vessel/riser/equipment system for deep-sea mining with RBF neural network approximations. Mar. Georesour. Geotechnol. 2020, 38, 174–192. [Google Scholar] [CrossRef]
  27. Chen, Y.X.; Xiong, H.; Cheng, H.; Yu, C.L.; Xie, J.H. Effect of particle motion on the hydraulic collection of coarse spherical particles. Acta Mech. Sin. 2020, 36, 72–81. [Google Scholar] [CrossRef]
  28. Adam, N.M.; Attia, O.H.; AI-Sulttani, A.O.; Mahmood, H.A.; As’arry, A.; Rezali, K.A.M. Numerical analysis for solar panel subjected with an external force to overcome adhesive force in desert areas. CFD Lett. 2020, 12, 60–75. [Google Scholar] [CrossRef]
  29. Zhao, R.J.; Zhao, Y.L.; Zhang, D.S.; Li, Y.; Geng, L.L. Numerical investigation of the characteristics of erosion in a centrifugal pump for transporting dilute particle-laden flows. J. Mar. Sci. Eng. 2021, 9, 961. [Google Scholar] [CrossRef]
Figure 1. Prototype and small-scale models of the deep-sea mining pump.
Jmse 13 01218 g001
Figure 2. Mesh generation diagram.
Jmse 13 01218 g002
Figure 3. Internal pressure distribution of the mineral extraction pump.
Jmse 13 01218 g003
Figure 4. Velocity cloud and streamline distribution inside the mineral extraction pump.
Jmse 13 01218 g004aJmse 13 01218 g004b
Figure 5. Internal pressure distribution of the mineral extraction pump.
Jmse 13 01218 g005
Figure 6. Velocity cloud and streamline distribution inside the mining pump.
Jmse 13 01218 g006
Figure 7. Internal pressure distribution of the mineral extraction pump.
Jmse 13 01218 g007
Figure 8. Velocity cloud and streamline distribution inside the mining pump.
Jmse 13 01218 g008
Figure 9. Evolution results of pump performance.
Jmse 13 01218 g009
Figure 10. Evolution results of pump performance.
Jmse 13 01218 g010
Figure 11. Evolution results of pump performance.
Jmse 13 01218 g011
Figure 12. The surface wear rate of four flow passage components.
Jmse 13 01218 g012
Figure 13. Influence pattern of flow rate on pump performance.
Jmse 13 01218 g013
Figure 14. Physical test pump and internal components.
Jmse 13 01218 g014
Figure 15. Schematic diagram of the experimental system. 1—Experiment pump (including motor); 2—Experiment-pump support mechanism; 3—Flow meter; 4—Outlet pipe; 5—Return pipe; 6—Regulating valve; 7—Return-pipe support member; 8—Cable terminal; 9—Cable fixing component; 10—Water tank; 11—Anti-submersible pump swing component.
Jmse 13 01218 g015
Figure 16. Test site.
Jmse 13 01218 g016
Figure 17. Comparison of results.
Jmse 13 01218 g017
Table 1. Mesh independence verification.
Mesh PlanImpeller
(Ten Thousand)
Guide Vane (Ten Thousand)Inlet/Outlet (Ten Thousand)Total Number
(Ten Thousand)
Head (m)
19.124.913.29431.71
215.242.022.816030.84
320.055.129.921031.22
429.180.242.930030.35
551.514276.053030.36
666.018410170030.31
Disclaimer/Publisher’s Note: The statements, opinions and data contained in all publications are solely those of the individual author(s) and contributor(s) and not of MDPI and/or the editor(s). MDPI and/or the editor(s) disclaim responsibility for any injury to people or property resulting from any ideas, methods, instructions or products referred to in the content.

