Abstract
As terrestrial resources become increasingly scarce, the exploration and utilization of marine resources have become crucial for ensuring a stable resource supply. A maritime A-Frame is a specialized lifting mechanism mounted on the stern of a vessel, designed for deploying and retrieving heavy loads during subsea exploration. Real-time monitoring of the stress of A-Frames is essential for identifying potential failures and preventing accidents. This paper presents a stress-monitoring campaign conducted on a maritime A-Frame during a deep-sea mining project in the South China Sea. Fiber Bragg Grating (FBG) strain sensors were installed on the A-Frame to measure its stress responses throughout the deep-sea mining operation. The stress variations observed during the deployment and retrieval of a deep-sea mining vehicle were analyzed. The results indicate that the stress caused by the swinging motion of the A-Frame was significantly higher than that generated by the lifting and deployment of the mining equipment. Additionally, a finite element model (FEM) of the A-Frame was developed to estimate the stress of the hot spots by integrating the measured strain data. The analysis confirmed that the maximum stress experienced by the A-Frame was well below the allowable threshold, indicating that the structure had sufficient strength to withstand operational loads. In addition, the swing angle of the A-Frame significantly affects the stress value of the A-Frame, while lifting the mining vehicle has a very slight effect. Thus, it is advisable to accelerate the deployment and retrieval speeds of the mining vehicle and minimize the outward swing angle of the A-Frame. These findings provide valuable insights for optimizing the design and ensuring the safe operation of maritime A-Frames in deep-sea mining exploration.
1. Introduction
Against the backdrop of increasing terrestrial resource scarcity, the exploration and development of marine resources have become crucial strategies for alleviating resource crises [1,2]. The ocean contains vast reserves of seabed mineral resources, including cobalt-rich crusts, polymetallic nodules, and polymetallic sulfides. Notably, polymetallic nodules alone have an estimated reserve of approximately 3 trillion tons, containing valuable metals such as manganese, iron, copper, cobalt, and nickel, which can provide a stable and sustainable supply of resources for economic and industrial development [3,4,5]. These nodules are primarily distributed at depths of 3000 to 6000 m on the seafloor. One of the most effective methods for extracting seabed minerals is deploying deep-sea mining vehicles via mining vessels [6,7,8]. Throughout this process, mining vessels are continuously subjected to complex marine environmental loadings, including winds, waves, and currents. Ensuring the safety and stability of the mining vehicle during mining vehicle deployment, mineral extraction, and mining vehicle retrieval is a fundamental prerequisite for successful subsea mineral exploitation.
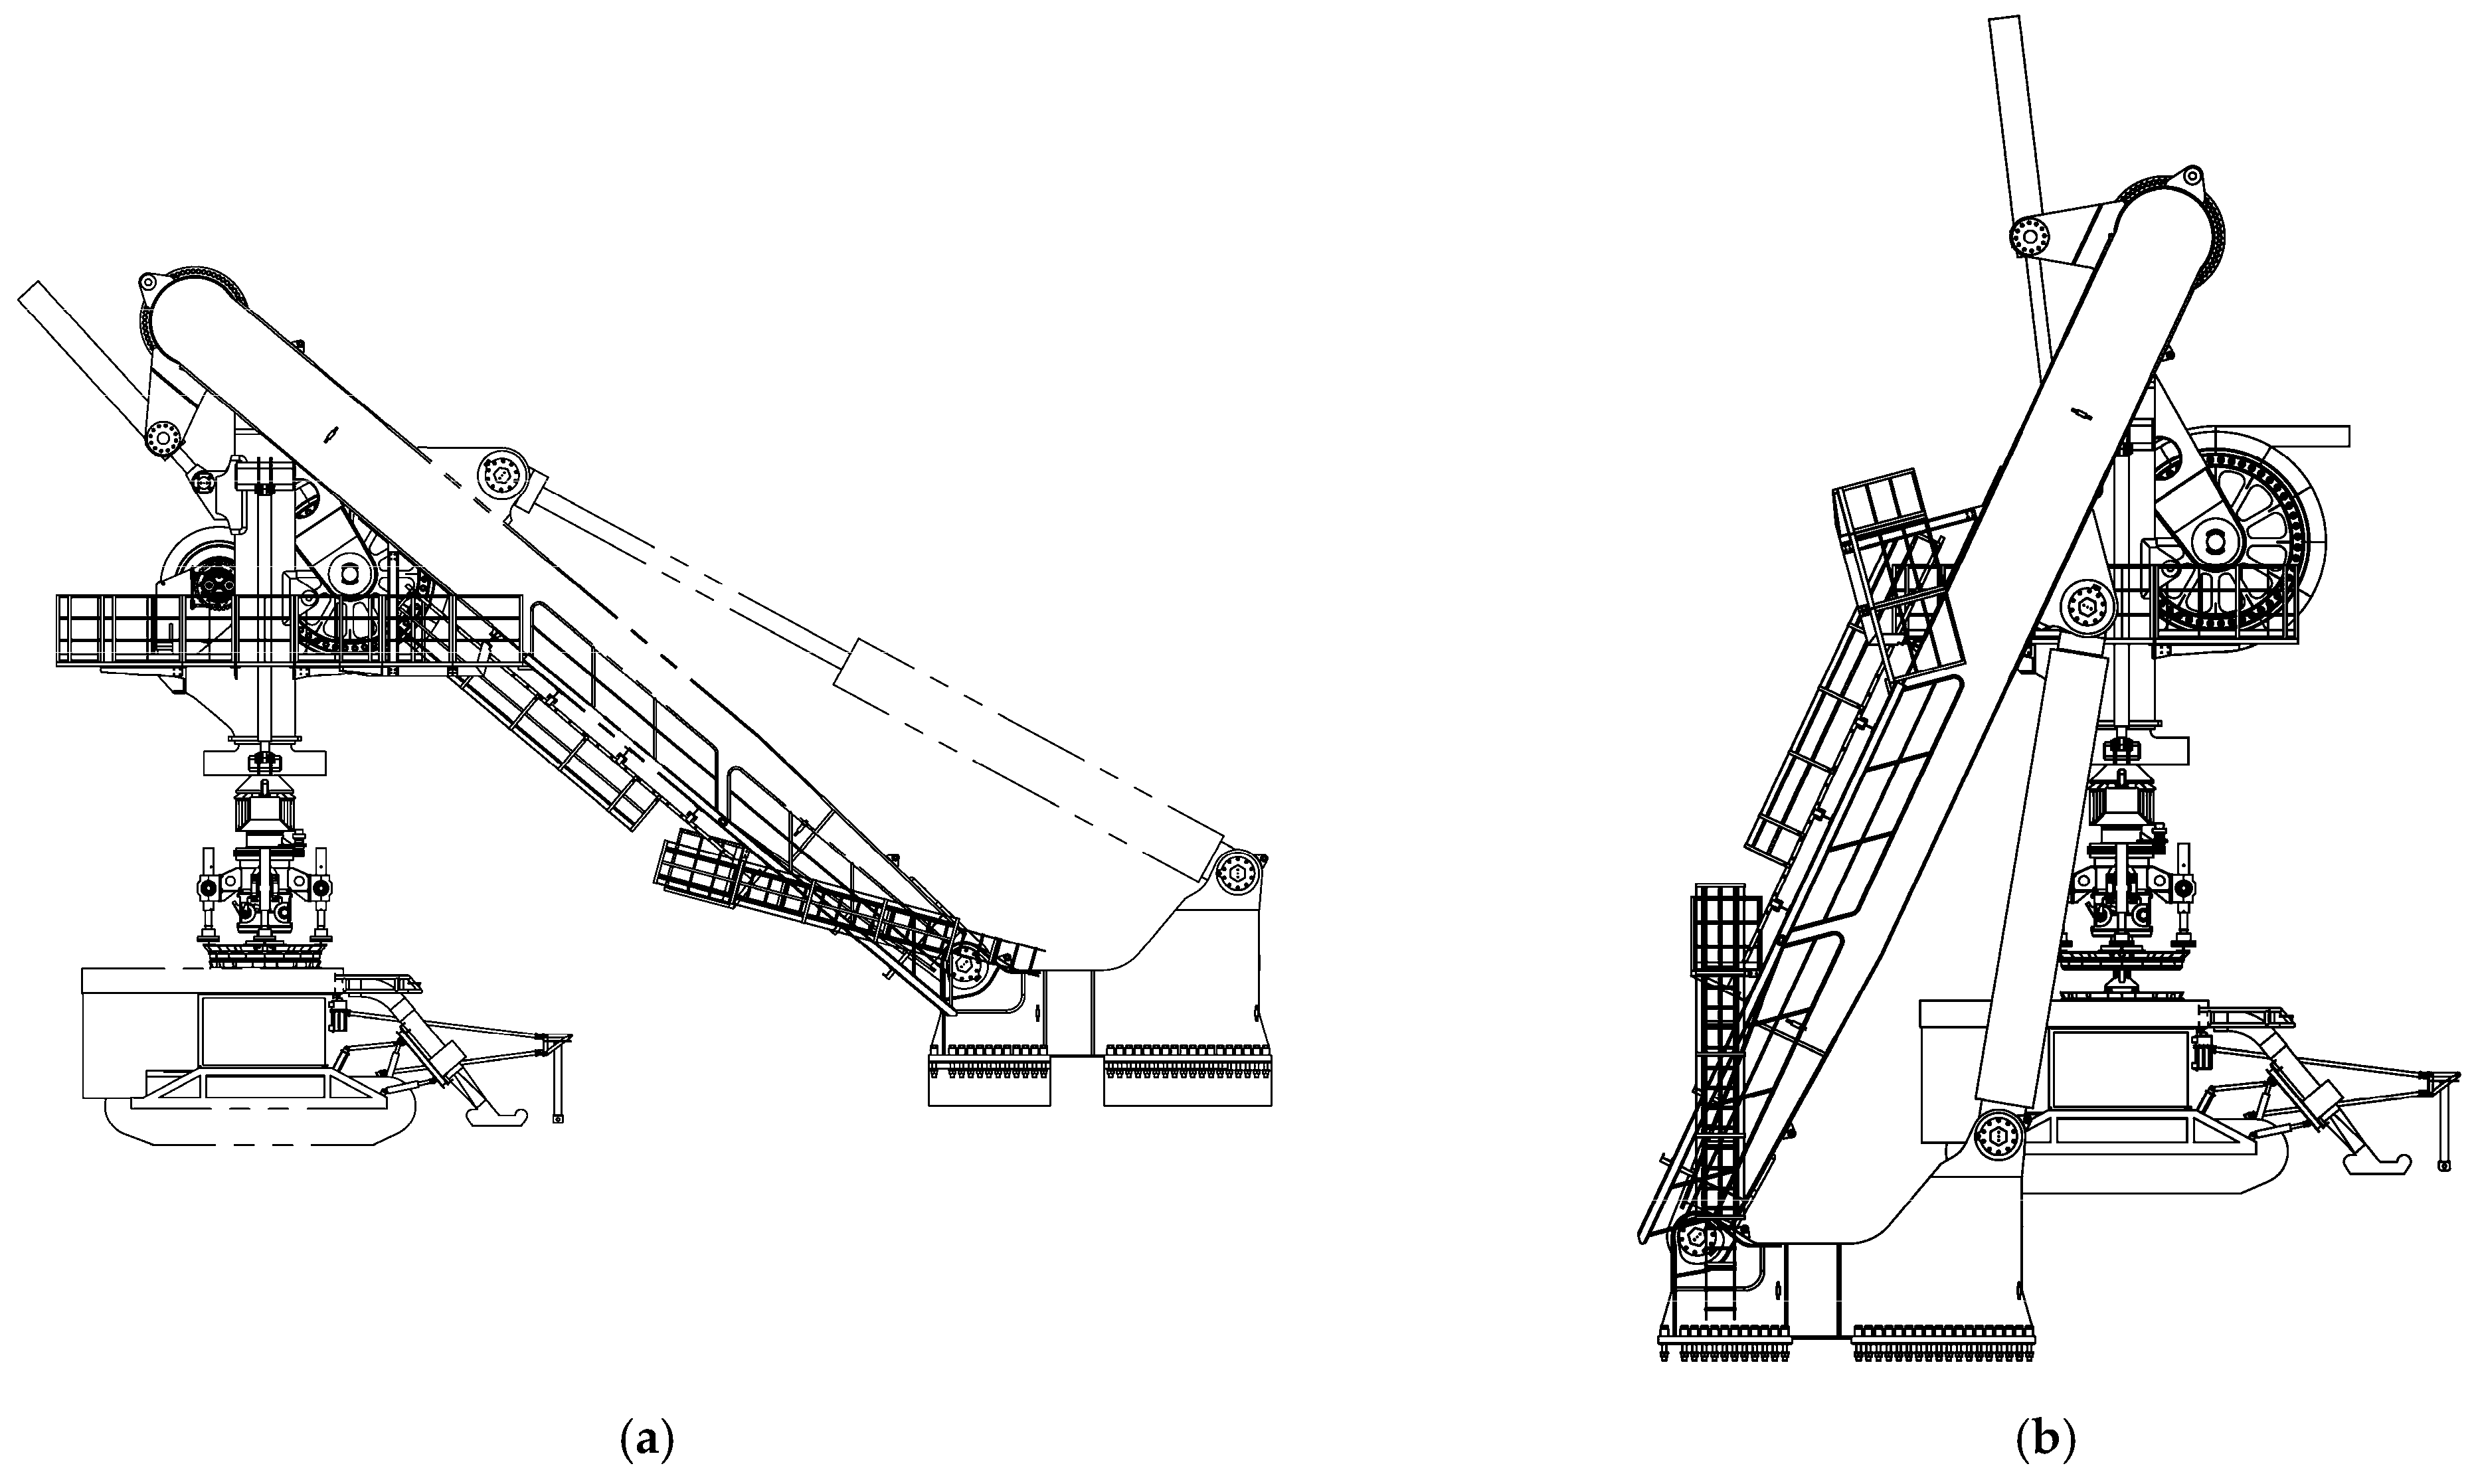
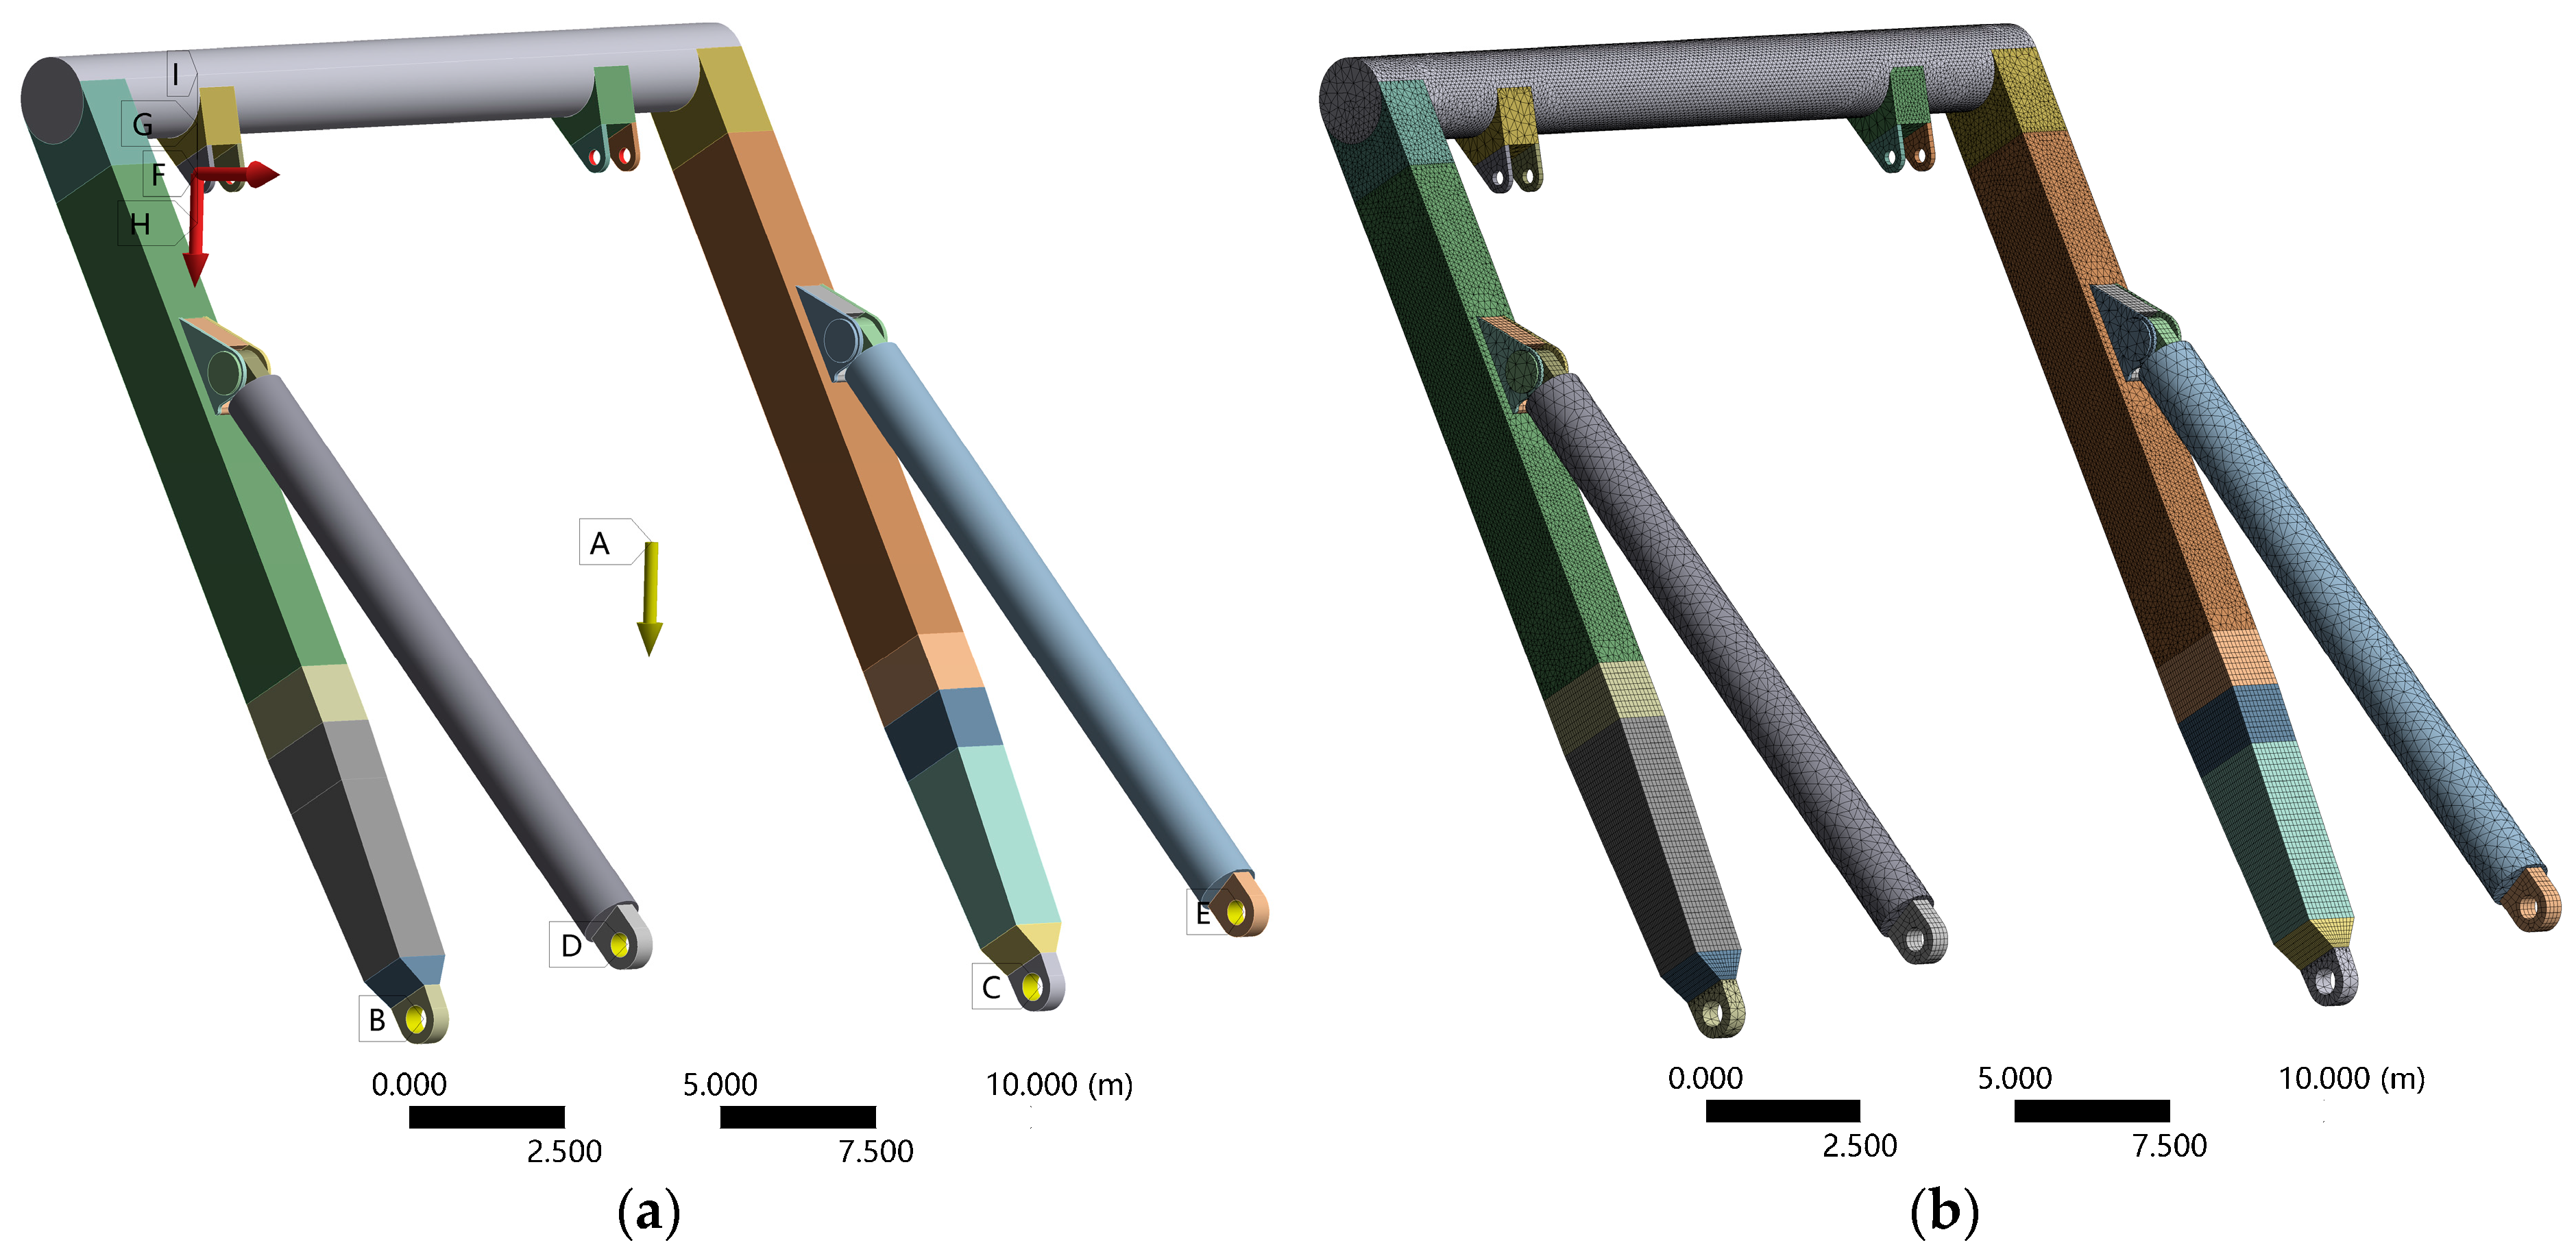
A maritime A-Frame is a type of mechanical framework used primarily in the maritime and offshore industries [9,10]. It is designed for lifting, handling, and deploying heavy loads, often in challenging and dynamic environments, such as floating vessels, offshore platforms, or rigs. In deep-sea mining operations, A-Frames provide essential structural support for deep-sea mining vehicles, facilitating the safe and efficient execution of deep-sea mineral extraction. An A-Frame system primarily comprises a base, gantry, luffing cylinder, list dampened system, docking head system and other assembly components, as shown in Figure 1. It performs essential functions such as hoisting, inboard and outboard movement, as well as the deployment and retrieval of equipment [11]. An A-Frame operates in two distinct statuses: inboard and outboard. The transitions between these two operational states result in variations in structural stress. In addition, during a deep-sea mining operation, an A-Frame must not only lift loads weighing tens of tons but also endures additional inertial forces induced by significant wave action. These dynamic loads impose substantial challenges on the structural integrity of the A-Frame, potentially affecting its long-term performance and safety. Consequently, implementing a comprehensive structural-health-monitoring system is essential to ensure the reliability and operational safety of the A-Frame during deep-sea resource exploitation [12,13].
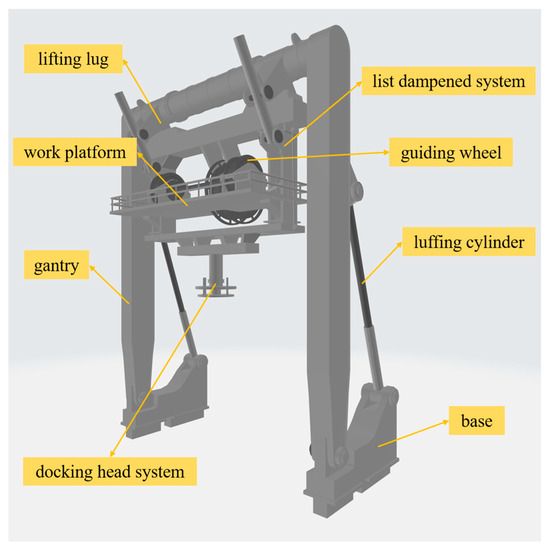
Figure 1.
Assembly components of the monitored A-Frame.
Strain or stress monitoring is a vital aspect of structural health monitoring [14,15,16,17]. Detailed strain monitoring and analysis not only provide in-depth insights into structural stress variations during operation but also facilitate further design optimization, thereby enhancing the operational safety of structures. Extensive research in stress monitoring and analysis has been conducted in the field of structural health monitoring. Liu and Ren [18] proposed a rapid acquisition method for structural stresses of the ship digital twin model. Yang et al. [19] performed real-time monitoring of stress variations across different construction phases of bridges. By developing a finite element model to analyze and compare stress variations throughout the construction process, the consistency between empirical monitoring data and theoretical predictions was effectively validated. Yuan et al. [20] proposed a method for evaluating the safety of crane metal structures based on the stress monitoring data in dangerous sections, thereby promoting the practical application of crane metal structures in engineering environments. Furthermore, studies have also been conducted on marine structures [21,22,23,24]. However, research specifically addressing the stress monitoring of A-Frames remains scarce. Existing studies provide only minimal exploration of stress monitoring and analysis within the context of real-world engineering applications.
By installing strain sensors at critical structural regions, such as the hot spots of a A-Frame, it is possible to capture variations in structural stress. However, due to constraints such as challenging on-site installation conditions and a limited number of available sensors, it is often impractical to place strain sensors at all critical locations [25,26,27]. As a result, stress data can only be obtained from a limited number of measurement points, making it difficult to directly assess structural stress variations at all key positions. This limitation leads to an incomplete evaluation of the stress performance of the A-Frame. Therefore, estimating the stress responses at unmeasured locations using limited measurement data is a fundamental aspect of the health monitoring and safety assessment of an A-Frame. The existing responses estimation methods can be broadly categorized into physics-driven [28,29] and data-driven [30,31,32] approaches, which attempt to reconstruct structural responses based on physical models and data analysis, respectively. While these methods have demonstrated effectiveness in reconstructing acceleration data, their performance in stress response estimation remains inadequate.
Another key challenge in stress estimation is the unknown initial stress state. For large self-weight structures such as A-Frames, the static strain, i.e., the strain under self-weight without external dynamic loads, constitutes a significant portion of the total measured strain [33] since the weight of the items lifted by the A-Frame may be relatively small compared to the A-Frame itself. However, strain sensors are typically installed after the structure has already undergone pre-straining due to self-weight, preventing direct measurement of the static strain. Consequently, the initial stress state cannot be accurately determined, leading to significant uncertainties in prestress estimation, which, in turn, affects the accuracy of stress monitoring and structural assessment. Existing studies have not provided effective solutions for the prestress estimation problem, limiting their applicability in stress response estimation.
This study addresses the unprecedented challenges of conducting the world’s first 6000 m deep ocean mining test, where the maritime A-Frame functions as the critical lifting and support structure for the mining vehicle—an operation with no precedent. To prevent catastrophic system failures and optimize deep-sea mining operations, stress data from the A-Frame were strategically collected using FBG strain sensors. These data were then thoroughly analyzed to identify stress variation patterns throughout the operational cycle. Additionally, an FEM was constructed for simulation analysis, serving to validate the accuracy and reliability of the measured data. By integrating FEM simulations with experimental stress measurements, the actual stress values at critical locations were estimated, providing a more comprehensive assessment of the A-Frame. The findings of this research are anticipated to offer valuable insights into optimizing the operational performance of the A-Frame in marine resource mining projects.
2. Monitoring of the Operating A-Frame
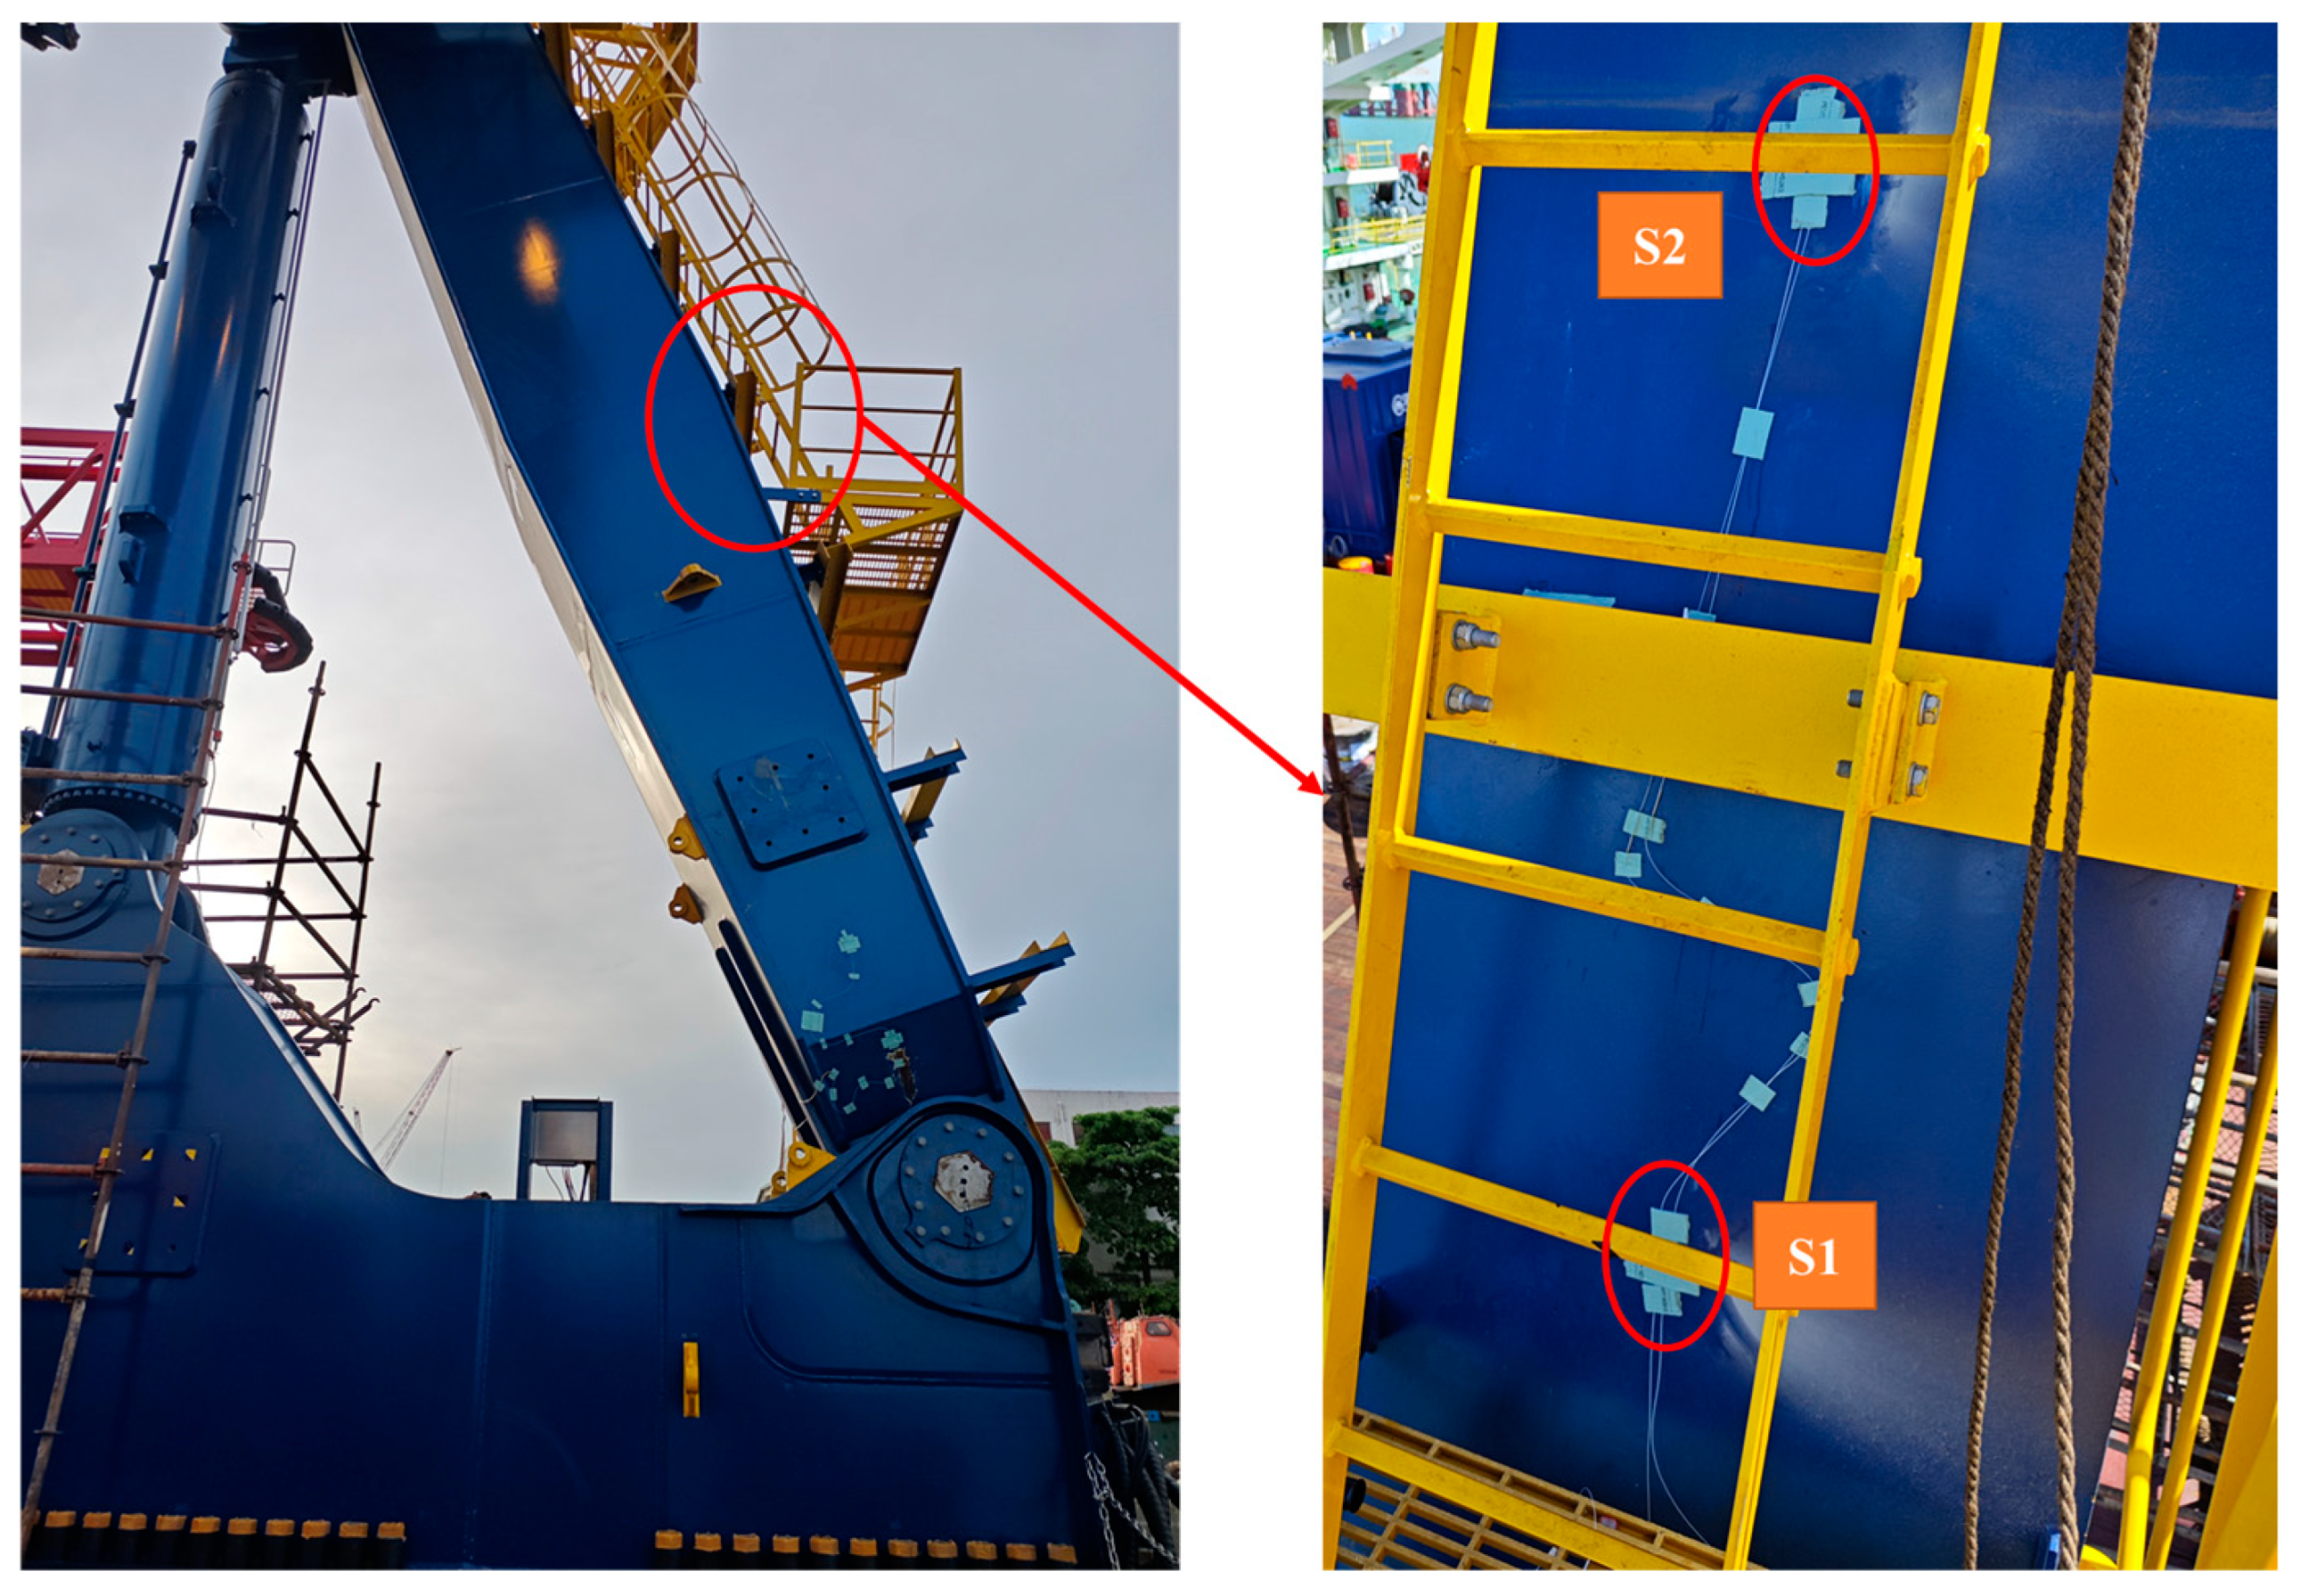
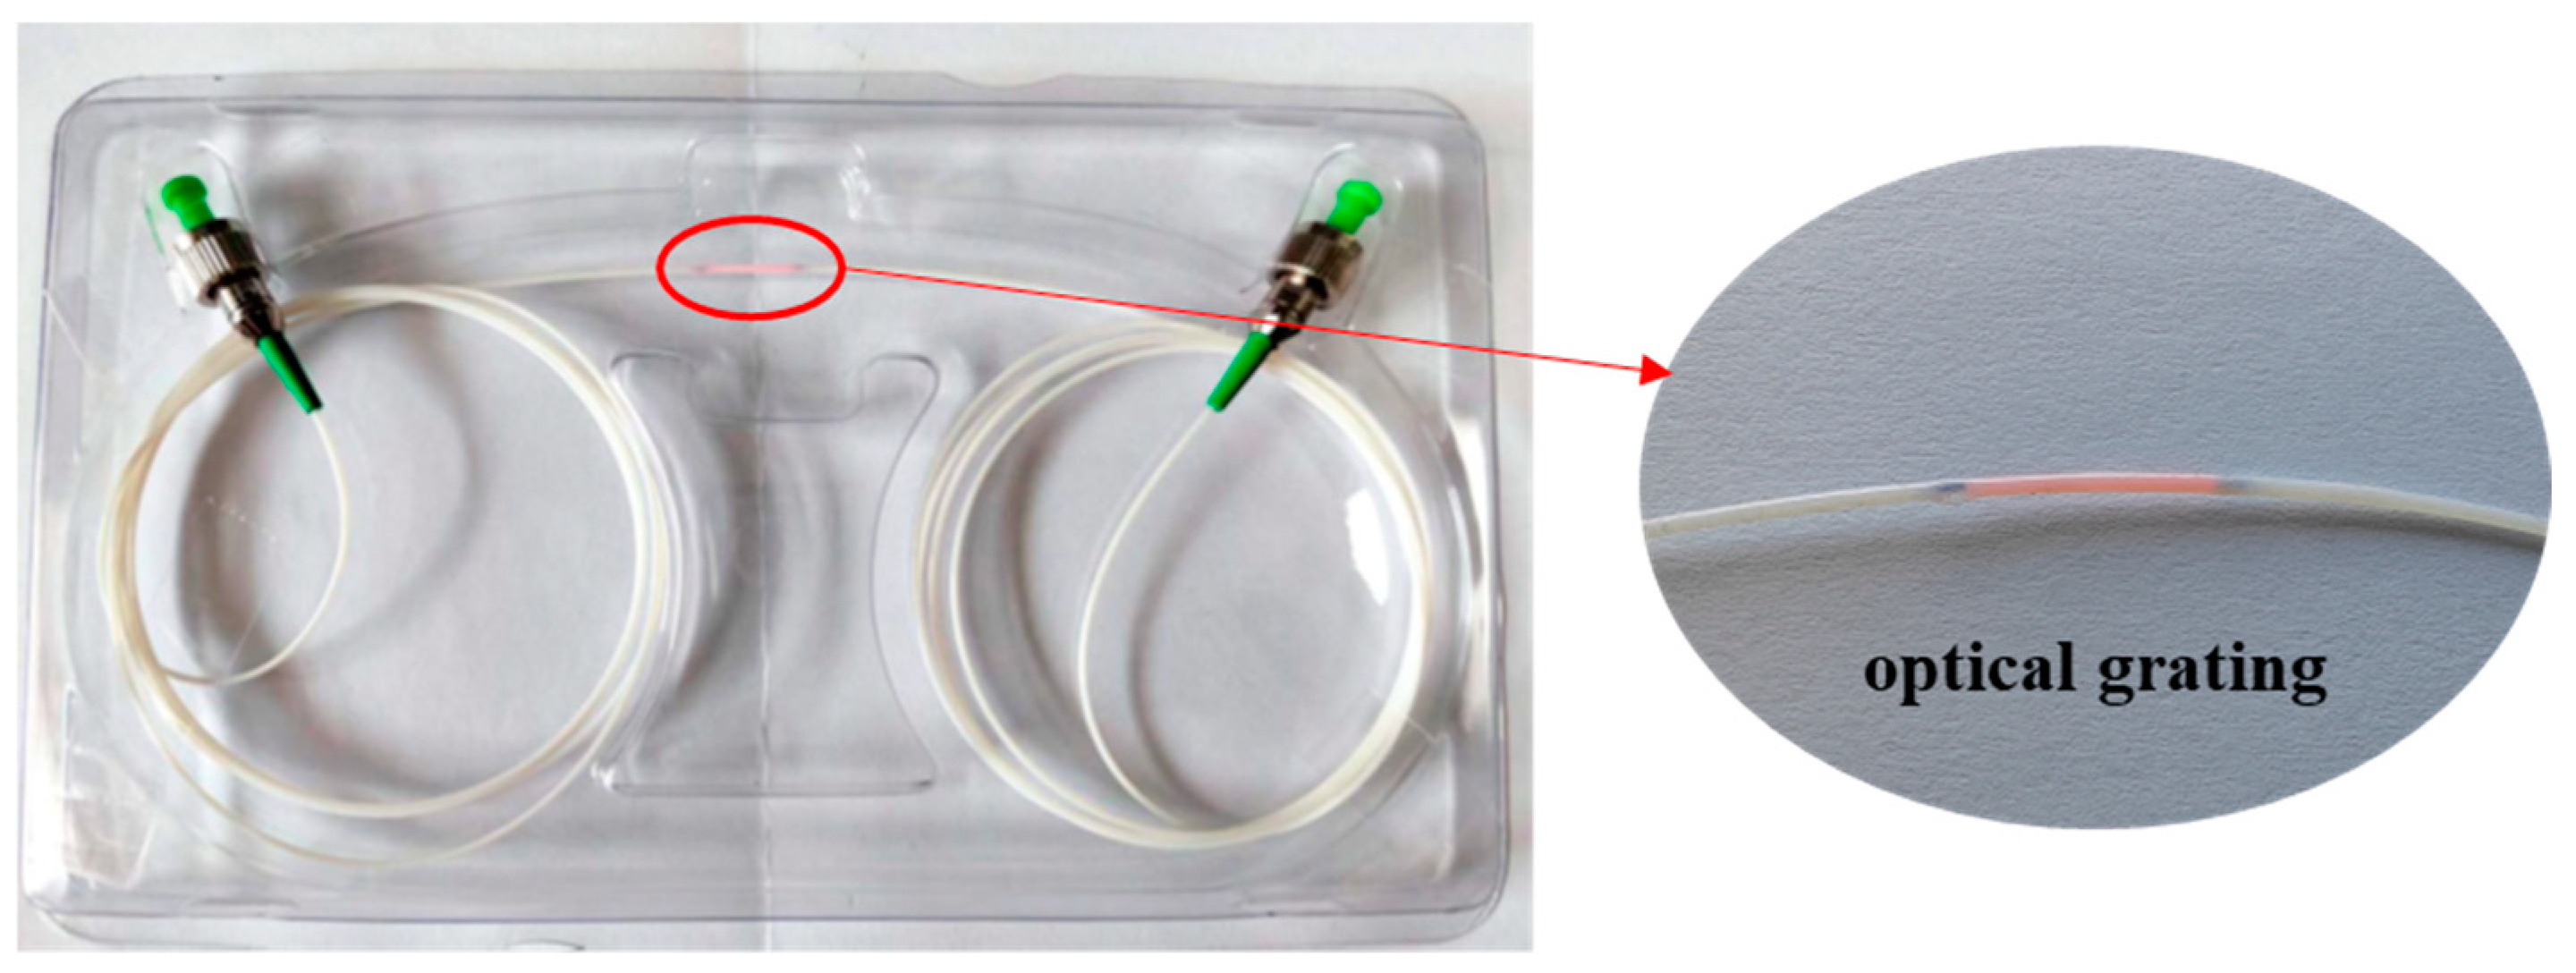
Both the mining vehicle and A-Frame are custom-designed for this field test. The mining vehicle weighs 19 metric tons, the A-Frame is constructed from Q345 steel, and it has a load-bearing capacity of 80 metric tons. The side views of the A-Frame are shown in Figure 2. Figure 3 shows the monitored A-Frame structure that was installed on the stern deck. Due to installation constraints, only two FBG strain sensors, labeled S1 and S2, respectively, were installed at the variable cross-section of the A-Frame to monitor its strain response. The FBG strain sensor and its technical parameters are shown in Figure 4 and Table 1, respectively. The reason for using FBG sensors instead of resistive strain gauges is to prevent the risk of electrical leakage on the ship and to avoid signal attenuation during long-distance transmission [34,35,36]. The sensors, labeled as S1 and S2, were positioned 0.4 m below and above, respectively, one of the variable cross-sections of the right portal frame of the A-Frame, as depicted in Figure 3. Since the force exerted by the lifted load on the A-Frame during hoisting primarily acts in the vertical direction, the portal frame of the A-Frame is mainly subjected to axial tension and compression. Therefore, the FBG sensors were attached along the axial direction of the right portal frame to measure its axial strain.

Figure 2.
The engineering drawings and dimensions of the A-Frame: (a) the side view of outboard; (b) the side view of inboard.

Figure 3.
The arrangement of the FBG strain sensors on the monitored A-Frame.
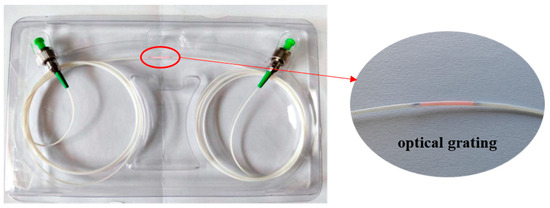
Figure 4.
The FBG strain sensor OSC3580.

Table 1.
The technical parameters of the FBG strain sensor OSC3580.
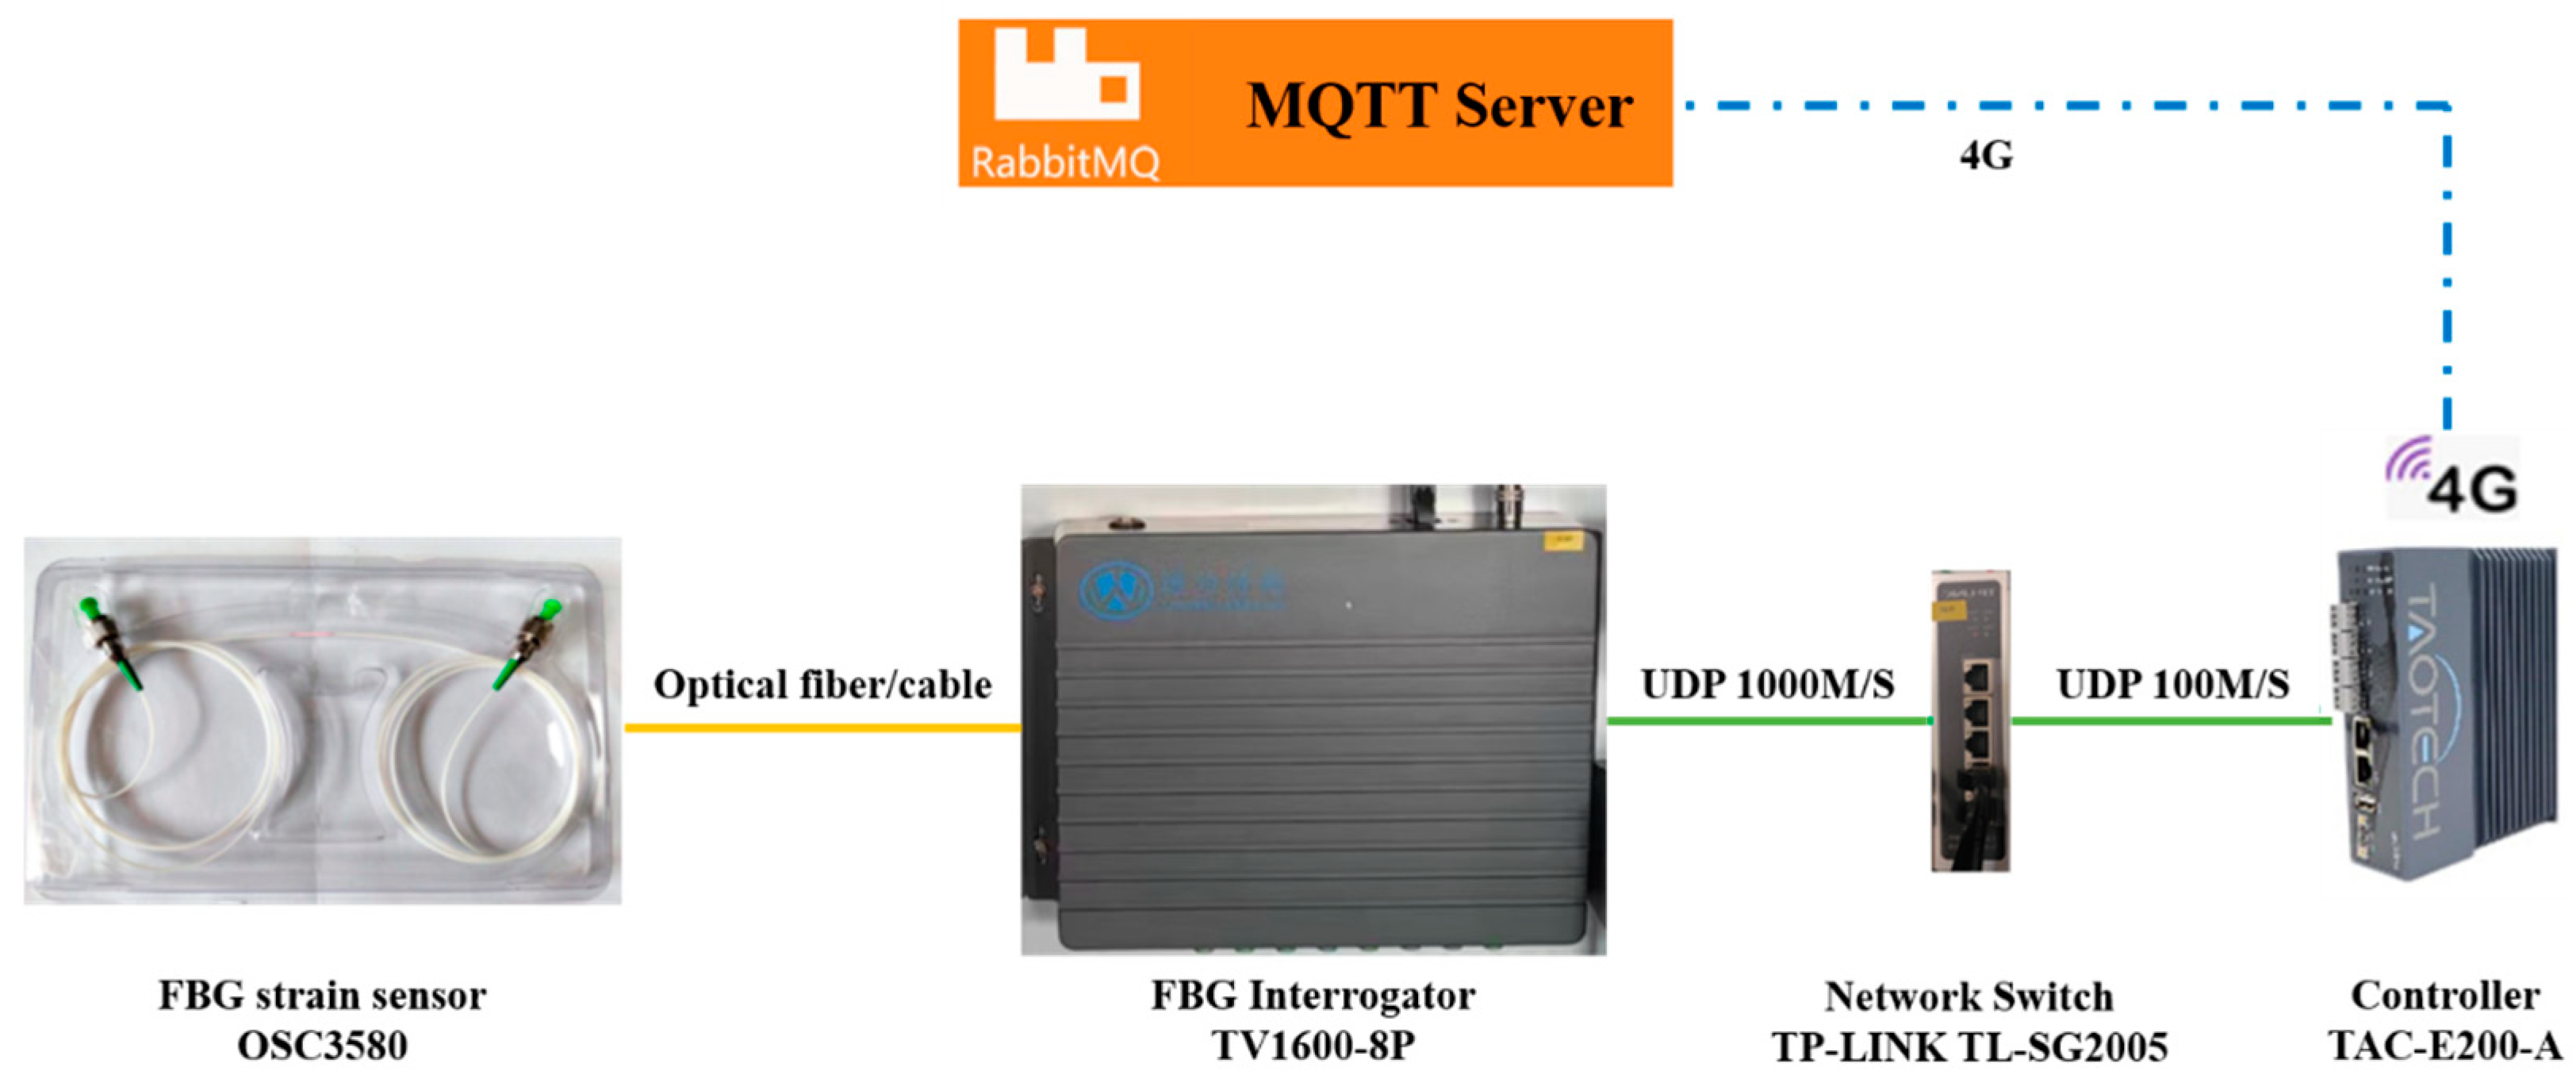
The marine resource mining vessel was equipped with a fiber optic data acquisition system in the control room on the deck to monitor and record stress variations at designated measurement points on the A-Frame. The system consists of a fiber optic demodulator TV1600-8P (integrating an FBG interrogator) produced by Tongwei Technology Co., Ltd., Beijing, China, a network switch, a controller, and a server, enabling continuous data acquisition and transmission. Strain data collected from the A-Frame are first converted from optical to electrical signals by the fiber optic demodulator, then transmitted to the server for further analysis. The data transmission pathway is illustrated in Figure 5. Optical signals are generated by the fiber optic demodulator using an amplified spontaneous emission broadband light source. The interrogator emits light, which is reflected by the strain sensors and subsequently received by the demodulator. Strain measurements are obtained by detecting shifts in the central wavelength of the reflected light, which correspond to variations in strain. The structural stress can be derived by multiplying the strain by the elastic modulus . The sampling rate of the strain monitoring was configured at 100 Hz.

Figure 5.
Schematic of the data transmission path.
3. Analysis of the Measured Strain Data
3.1. Deep-Sea Mining Process
The deep-sea mining operation was conducted in the South China Sea in September 2024, with two mining operations carried out on the 20th and 23rd, respectively. The operation officially commenced when the seafloor mining vehicle was placed on the deck of the vessel and connected to an umbilical cable, which was wound on the winch aboard the vessel. The seafloor mining vehicle was then attached to the docking head, which was connected to the main body of the A-Frame through steel cables. The seafloor mining vehicle was gradually hoisted by retracting the steel cables. Upon completing the lifting process, the A-Frame gradually swung outward, positioning the mining vehicle beyond the vessel’s stern before lowering it slowly to a depth of 10 m below the sea surface by releasing the steel cables. At this stage, the umbilical cable did not bear the weight of the seafloor mining vehicle. The docking head then disengaged from the mining vehicle, leaving it connected only via the umbilical cable. It is important to note that although the umbilical cable bore the entire weight of the seafloor mining vehicle, the A-Frame still carried a significant load because the umbilical cable passed through its guiding wheel. The mining vehicle continued to be lowered in a controlled manner, with the A-Frame swinging inboard to facilitate the installation of beacons and buoys. Upon reaching a depth of 200 m, the continuous deployment of the umbilical cable began, allowing the mining vehicle to descend steadily until it reached the designated operational depth. After completing the seabed exploration, the retrieval process followed the reverse sequence of the deployment of the mining vehicle.
Throughout both trial operations, the monitoring system continuously recorded the strain variations experienced by the A-Frame. The strain data were transformed into stress by multiplying the strain with the elastic modulus . The stress responses of the A-Frame during these two seabed exploration processes, along with the depth of the mining vehicle monitored by the beacon, are presented in Figure 6 and Figure 7, respectively. It should be noted that the depth data of the mining vehicle were missing after 20:36 on 20 September, as shown in Figure 6.
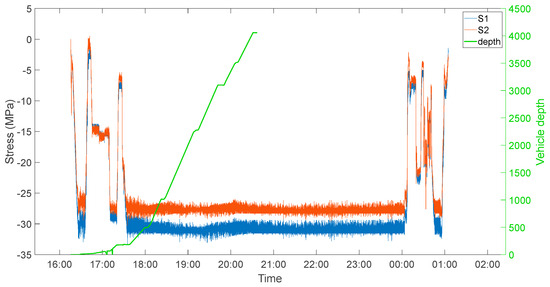
Figure 6.
Stress of the A-Frame and depth of the vehicle during the deep-sea mineral mining operation on 20 September.
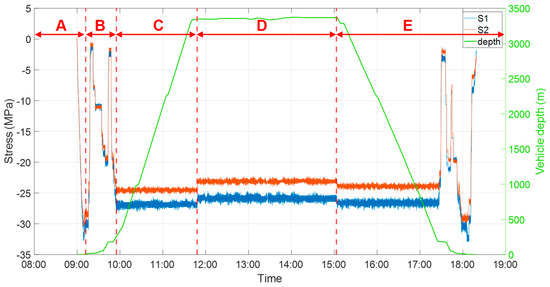
Figure 7.
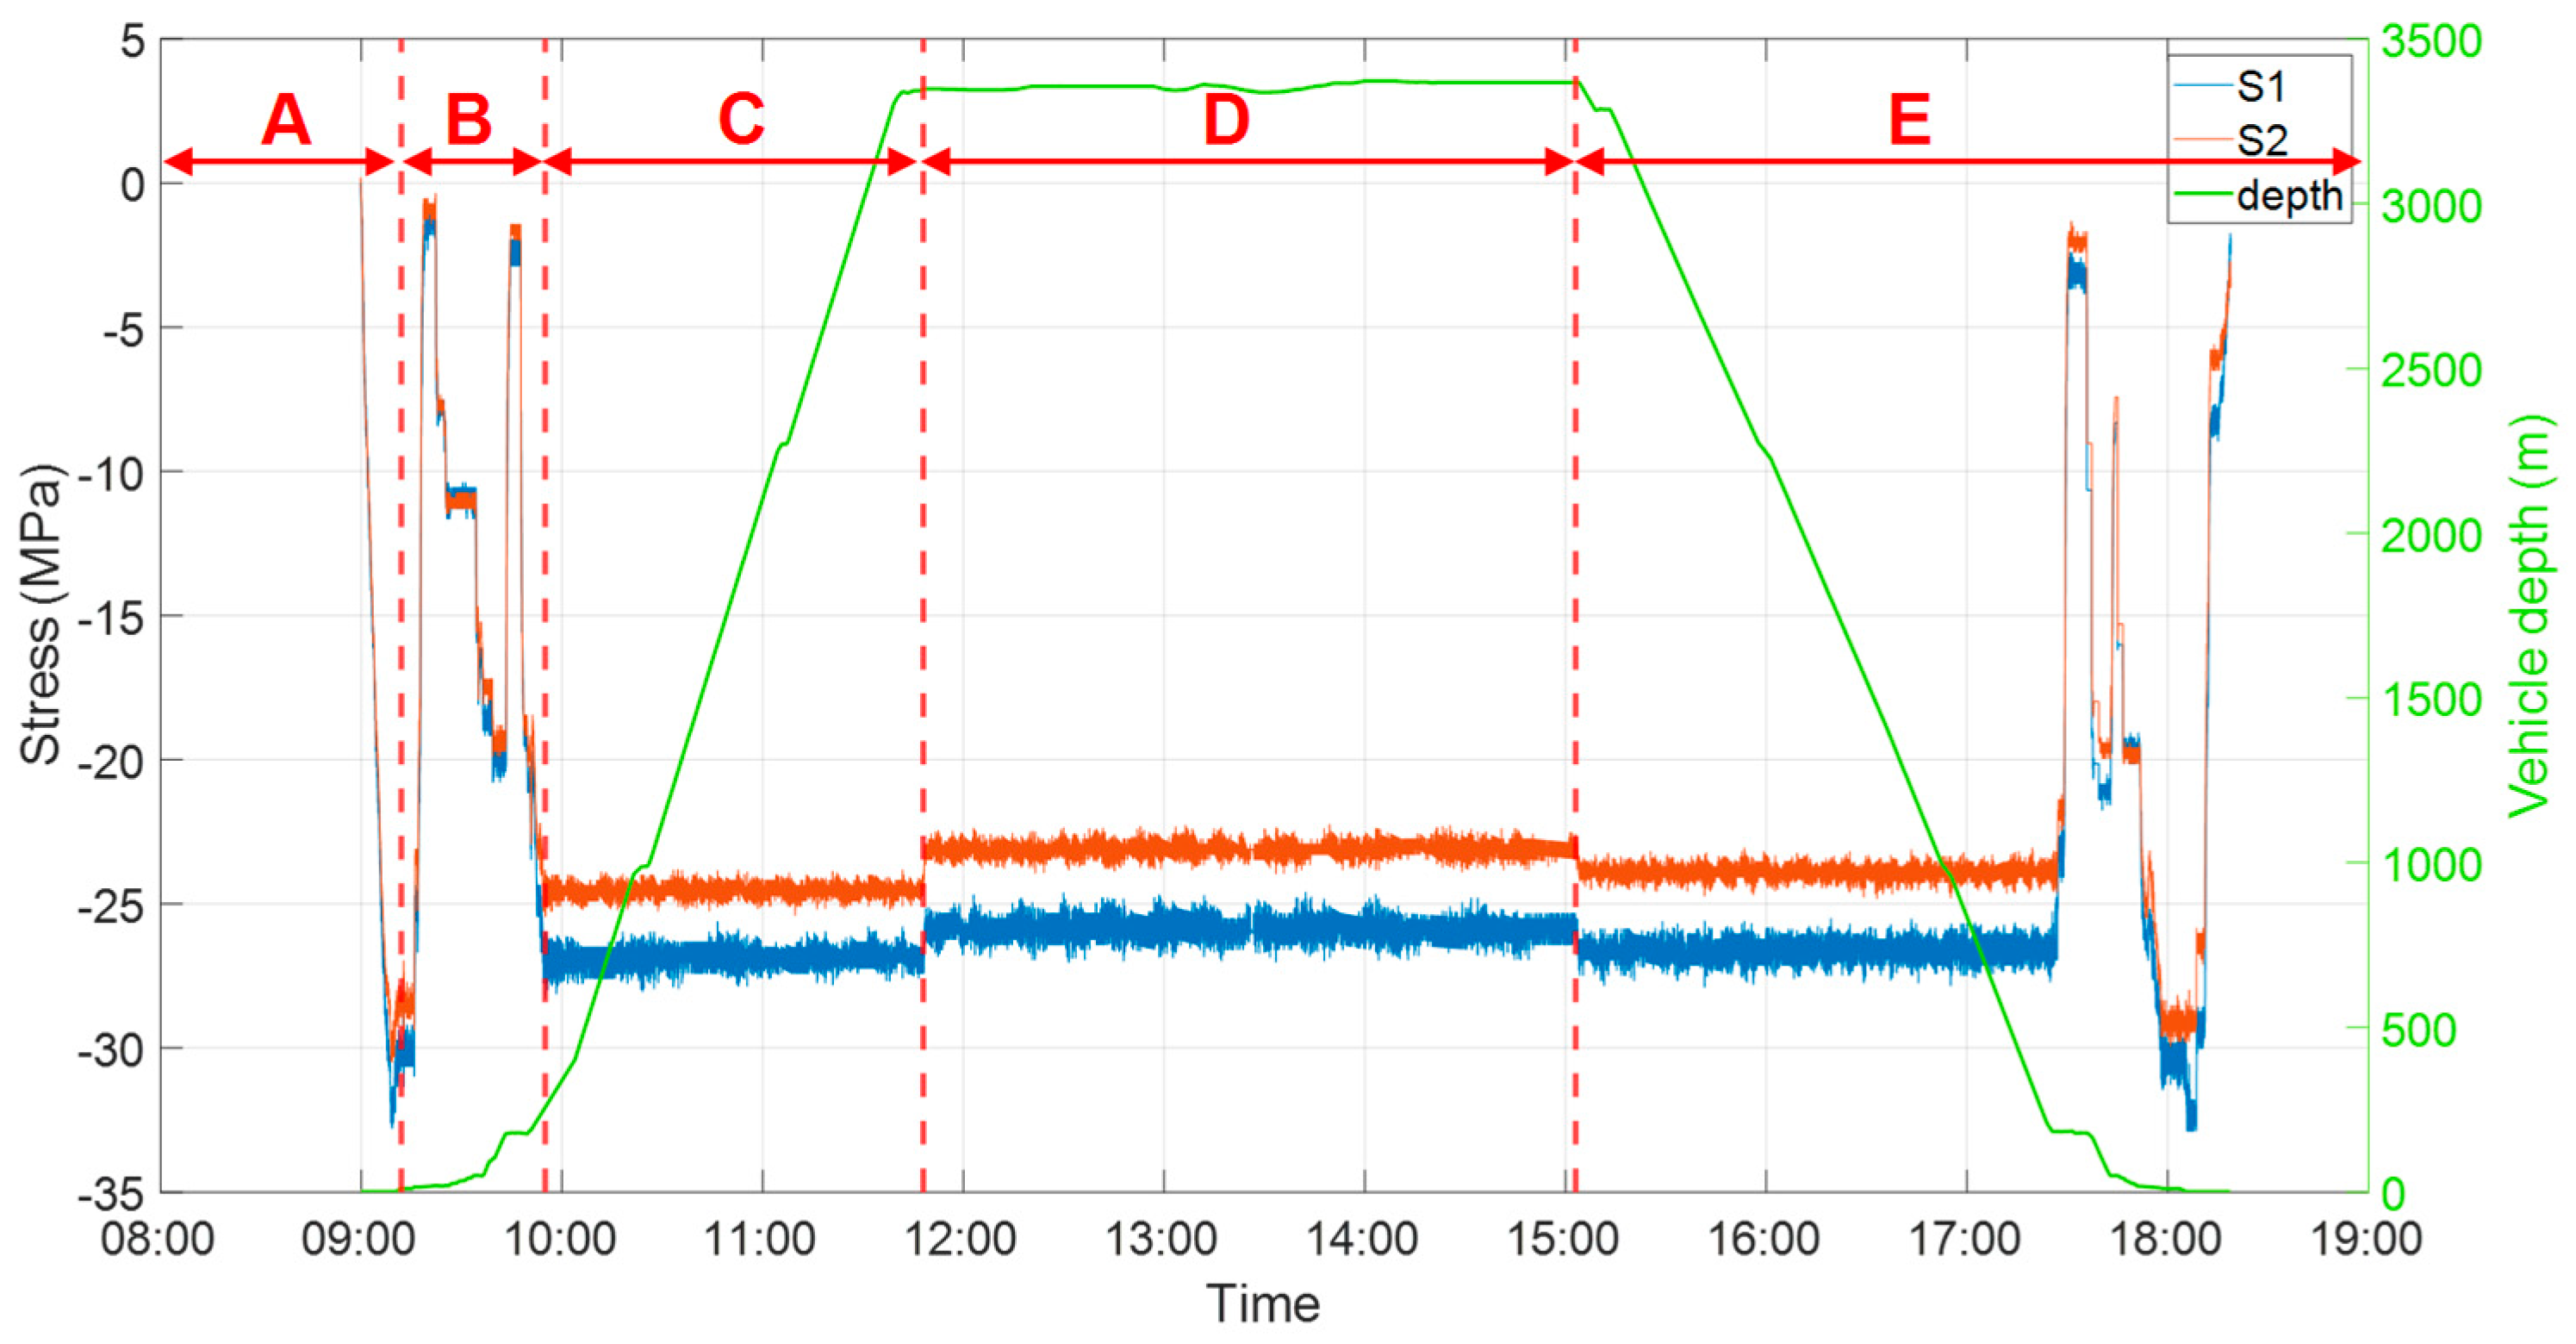
Stress of the A-Frame and depth of the vehicle during the deep-sea mineral mining operation on 23 September: (A) the mining vehicle was lifted, submerged, and released; (B) the beacons and buoys were installed to the umbilical cable; (C) the mining vehicle was continuously deployed to the seabed; (D) the mining vehicle conducted the seabed exploration; and (E) the mining vehicle was retrieved.
Figure 6 and Figure 7 show that the monitoring system comprehensively recorded the stress variations at the A-Frame measurement points. The stress values remained entirely negative, indicating that the axial stress in the A-Frame was compressive compared to the inboard status of the A-Frame during which the sensors ware installed. The stress history of both measurement points exhibited consistent trends, with the compressive stress at point S1 being slightly higher than that at point S2. Throughout the seabed exploration process, the measured stress increased from zero and later returned to near zero, reflecting a clear and reversible operational cycle.
3.2. Detailed Analysis of A-Frame Stress
It is noted that the mining vehicle did not reach the seabed on 20 September. Therefore, the stress data obtained on 23 September was selected for analysis to provide a more comprehensive understanding of stress variations during seabed exploration. On 23 September, the mining vehicle was deployed to a depth of 3330 m over a period of 9.5 h. According to the operational sequence, the stress data were segmented into five distinct stages: (A) the mining vehicle was lifted, submerged, and released; (B) the beacons and buoys were installed to the umbilical cable; (C) the mining vehicle was continuously deployed to the seabed; (D) the mining vehicle conducted the seabed exploration; and (E) the mining vehicle was retrieved. The stress variations in the measured points during these five stages are shown in Figure 7, which is accordingly divided into five regions.
Stage A: The mining vehicle was lifted, submerged, and released. Following the hoisting of the deep-sea mining vehicle, the A-Frame swung from a 25° inboard position to a 30° outboard maximum. Region A in Figure 7 shows a continuous decrease in stress as the A-Frame swings outward. This indicates a progressive increase in compressive stress at the measured locations. Moreover, the stress variation at position S1 is slightly greater than that at position S2. Therefore, the stress variation at position S1 is analyzed to explain the observed trends. At 9:09 a.m., the A-Frame reached its maximum outward angle, recording a stress of −32.2 MPa at the monitoring point S1. Shortly after, at 9:11 a.m., the deployment of the mining vehicle into the water was completed, and the stress reduced to −30.6 MPa due to the buoyant force partially counteracting the suspended load. Following this, the mining vehicle detached from the docking head, which was then lifted above the water surface, transferring the full weight of the mining vehicle to the umbilical cable. As mentioned above, although the umbilical cable bore the entire weight of the seafloor mining vehicle, the A-Frame still carried a significant load because it supported both the weight of the umbilical cable and the mining vehicle. Therefore, the stress on the A-Frame was largely influenced by the attached seafloor mining vehicle and the incremental umbilical cable.
Stage B: The beacons and buoys were installed to the umbilical cable. During this stage, the A-Frame was required to swing out and back to facilitate the installation of the beacons and buoys. The recorded maximal swing angle was 26° at this stage. Region B in Figure 7 demonstrates that the stress of the measured points was significantly influenced by the outward angle of the A-Frame, that is, the larger the angle, the greater the stress. Thus, in order to reduce the stress of the A-Frame when securing beacons and buoys, it is recommended to reduce the outward angle of the A-Frame if the deployment and retrieval operations of the deep-sea mining vehicle are allowed.
Stage C: The mining vehicle was continuously deployed to the seafloor. In this stage, the vehicle continuously lowered to the seafloor with the weight of the umbilical cable gradually increasing. The swing angle was kept at 26° during the continuous deployment. However, the stress at the monitoring points remained relatively stable with only minor fluctuations. This is because the weight of the incremental umbilical cable maximal, 4 tons, and of the mining vehicle, 9 tons, was negligible compared to the weight of the A-Frame, 114 tons. As a result, increasing the deployment speed could be considered to optimize operational efficiency without compromising safety.
Stage D: The mining vehicle conducted seafloor mining. When the mining vehicle reached the seabed at 11:48, the mining vehicle was fully supported by the seabed, resulting in approximately a 1 MPa decrease in stress at measurement point S1 of the A-Frame. At 15:03, after completing the seabed exploration, the mining vehicle was lifted, causing stress to increase by around 1 MPa. These slight stress variations confirm that the wet weight of the vehicle exerted minimal influence on the structural load of the A-Frame.
Stage E: The mining vehicle was retrieved. Region E of Figure 7 shows the stress changes during the retrieval of the vehicle, exactly the reverse of the deployment process. The stress remained stable during the lifting stage. Between 17:27 and 17:58, the repeated swinging in and out of the A-Frame for detaching beacons and buoys caused notable stress variations. However, these values remained below the peak stress −31.9 MPa recorded at the maximum outward angle, ensuring operational safety. This confirms two critical findings: (1) the load variations during the retrieval process minimally impacted the stress of the A-Frame; and (2) the outward angle of the A-Frame significantly influenced stress, with larger angles generating higher stress, which is consistent with the finding in Stage B. At approximately 18:05, after the vehicle reconnected with the docking head and lifted out of the sea level, the stress increased by around 2 MPa due to the loss of buoyancy. This mirrors the stress reduction observed during submersion. Finally, as the A-Frame retracted, stress gradually decreased with the reduced outward angle, eventually returning to near zero.
The analysis of the stress data from 20 September yielded similar results, with two key differences. First, the 20 September operation focused solely on verifying the deployment and recovery procedures of the A-Frame, without including the seabed mining phase. As a result, there were no stress variations associated with the touchdown and detachment of the mining vehicle from the seabed. The second difference lies in the stress magnitude observed during the descent and recovery phases. On 20 September, the outward swing angle of the A-Frame during both descent and recovery was consistent with the angle used when lifting the mining vehicle off the deck, leading to similar stress levels in these two phases. In contrast, on 23 September, considering the significant influence of the outward swing angle on A-Frame stress, adjustments were made to reduce the swing angle during these phases. Consequently, the monitored stress levels were lower compared to those observed at a 30° outward swing.
4. Numerical Evaluation of the A-Frame Stress
4.1. A-Frame Finite Element Model
It is noted from Figure 7 that the initial stress observed throughout the seafloor mining was modified as zero since the pre-stress of the A-Frame could not be measured by the FBG strain sensors. In addition, the maximal stress of the A-Frame might not be measured since the two sensors were not installed at the hot spots of the A-Frame, such as the connection regions between the gantry and the luffing cylinder. Therefore, it is necessary to evaluate the pre-stress and the stress of the hot spots, which were not measured during seafloor mining. To achieve this purpose, three FEMs of the A-Frame, including a maximum inboard swing of 25°, a maximum outboard swing of 30°, and an outboard swing of 26° when the mining vehicle reached the seabed, were developed to assist the inference of its maximal stress. These three swing angles correspond to the real three states of the seafloor mining process.
The A-Frame primarily comprises a base, a gantry, and luffing hydraulic cylinders, with several auxiliary components mounted on the structure, as shown in Figure 1. Performing a comprehensive static analysis of the entire assembly would be highly complex. Therefore, only the gantry and luffing hydraulic cylinders were modeled, while the remaining structural components were simplified as two gravities applied to the gantry. The FEM was constructed in the ANSYS Workbench 2023 R1 environment and it is shown in Figure 8.
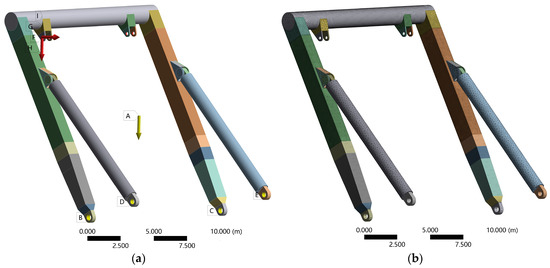
Figure 8.
The FEM of the A-Frame: (a) loading and boundary conditions; (b) FEM meshing.
The material properties of the structure are defined as follows: Young’s modulus E is 210 GPa, Poisson’s ratio ν is 0.3, and mass density ρ is 7850 kg/m3. The finite element mesh is generated using hexahedral SOLID186 and tetrahedral SOLID187 elements to ensure accurate structural representation. In the simulation model, the connection between the gantry and the luffing hydraulic cylinders is modeled as a hinged joint secured by bolts. Fixed contact is defined between the bolts and the gantry, while a frictionless contact is applied between the bolts and the luffing hydraulic cylinders, allowing for rotational movement of the cylinders around the bolts. Additionally, the gantry and the luffing hydraulic cylinders are hinged to the base, permitting inboard–outboard rotational motion while restricting movement in other directions.
For the loading conditions of the model, the weights of the gantry and the luffing hydraulic cylinders are 72 tons and 42 tons, respectively, applied through the global gravitational acceleration. In the retracted state without lifting the mining vehicle, the applied load primarily consisted of the weights of the auxiliary components of the A-Frame, including the list damper, docking head, damping cylinder, telescopic cylinder, work platform and other structural components. These loads were uniformly applied to the lifting lugs on the gantry. Under the operating conditions of an outboard swing of 26° and 30°, in addition to the aforementioned assembly loads, the submerged weight of the mining vehicle and the tension from the umbilical cable winch were also applied to the gantry lifting lugs. Furthermore, for the 26° outboard condition where the mining vehicle reached the seabed, only the self-weight of the umbilical cable was additionally considered.
4.2. Safety Assessment for the Measured Points
A static structural analysis was performed on the models, and the axial stress distribution of the A-Frame was generated. Figure 9 shows the stress contour maps of the measured region associated with the three operating conditions. The stress values at the monitoring points were extracted, as listed in Table 2.
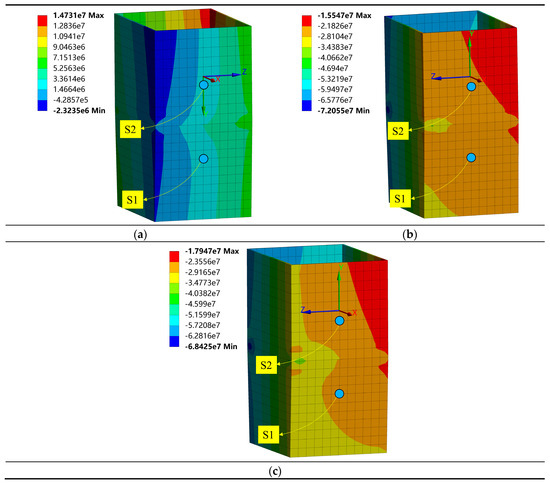
Figure 9.
Axial stress contour maps at the measurement point locations: (a) inboard 25°; (b) outboard 26°; (c) outboard 30°.
Table 2.
Measured and simulated stresses of S1 and S2 of the A-Frame.
Figure 9 shows that the monitored points primarily experienced tensile stress when the A-Frame swung inboard at 25°, whereas compressive stress was observed in the outboard configurations. Additionally, in all three operational conditions, significant stress variations were observed across the column cross-section. This is attributed to the combined effects of axial deformation and bending deformation caused by external loads applied to the lifting lugs of the A-Frame, leading to the observed stress distribution differences in the contour maps.
A comparison of the two monitoring points in the simulated data from Table 2 shows that, in all three operational conditions, the axial stress at the S1 location consistently exceeds that at S2, which aligns well with the field observations. However, discrepancies exist between the measured and simulated stresses, with the measured values consistently exceeding the simulated ones. Specifically, the simulated stress differences between the inboard 25° and outboard 30° conditions are 30.68 MPa and 28.04 MPa, respectively, both lower than the corresponding measured stress differences of 31.9 MPa and 29.9 MPa. These discrepancies may stem from the modeling simplifications, sensitivity of the FBG sensors, and other uncertainties.
5. Discussion
Although we obtained the stress values at the sensor locations, evaluating the structural strength requires determining the maximum stress at critical locations which were not directly measured. Additionally, since the sensors were installed after the A-Frame was constructed, the initial stress caused by the self-weight of the structure could not be captured. Therefore, it is also necessary to estimate this initial stress.
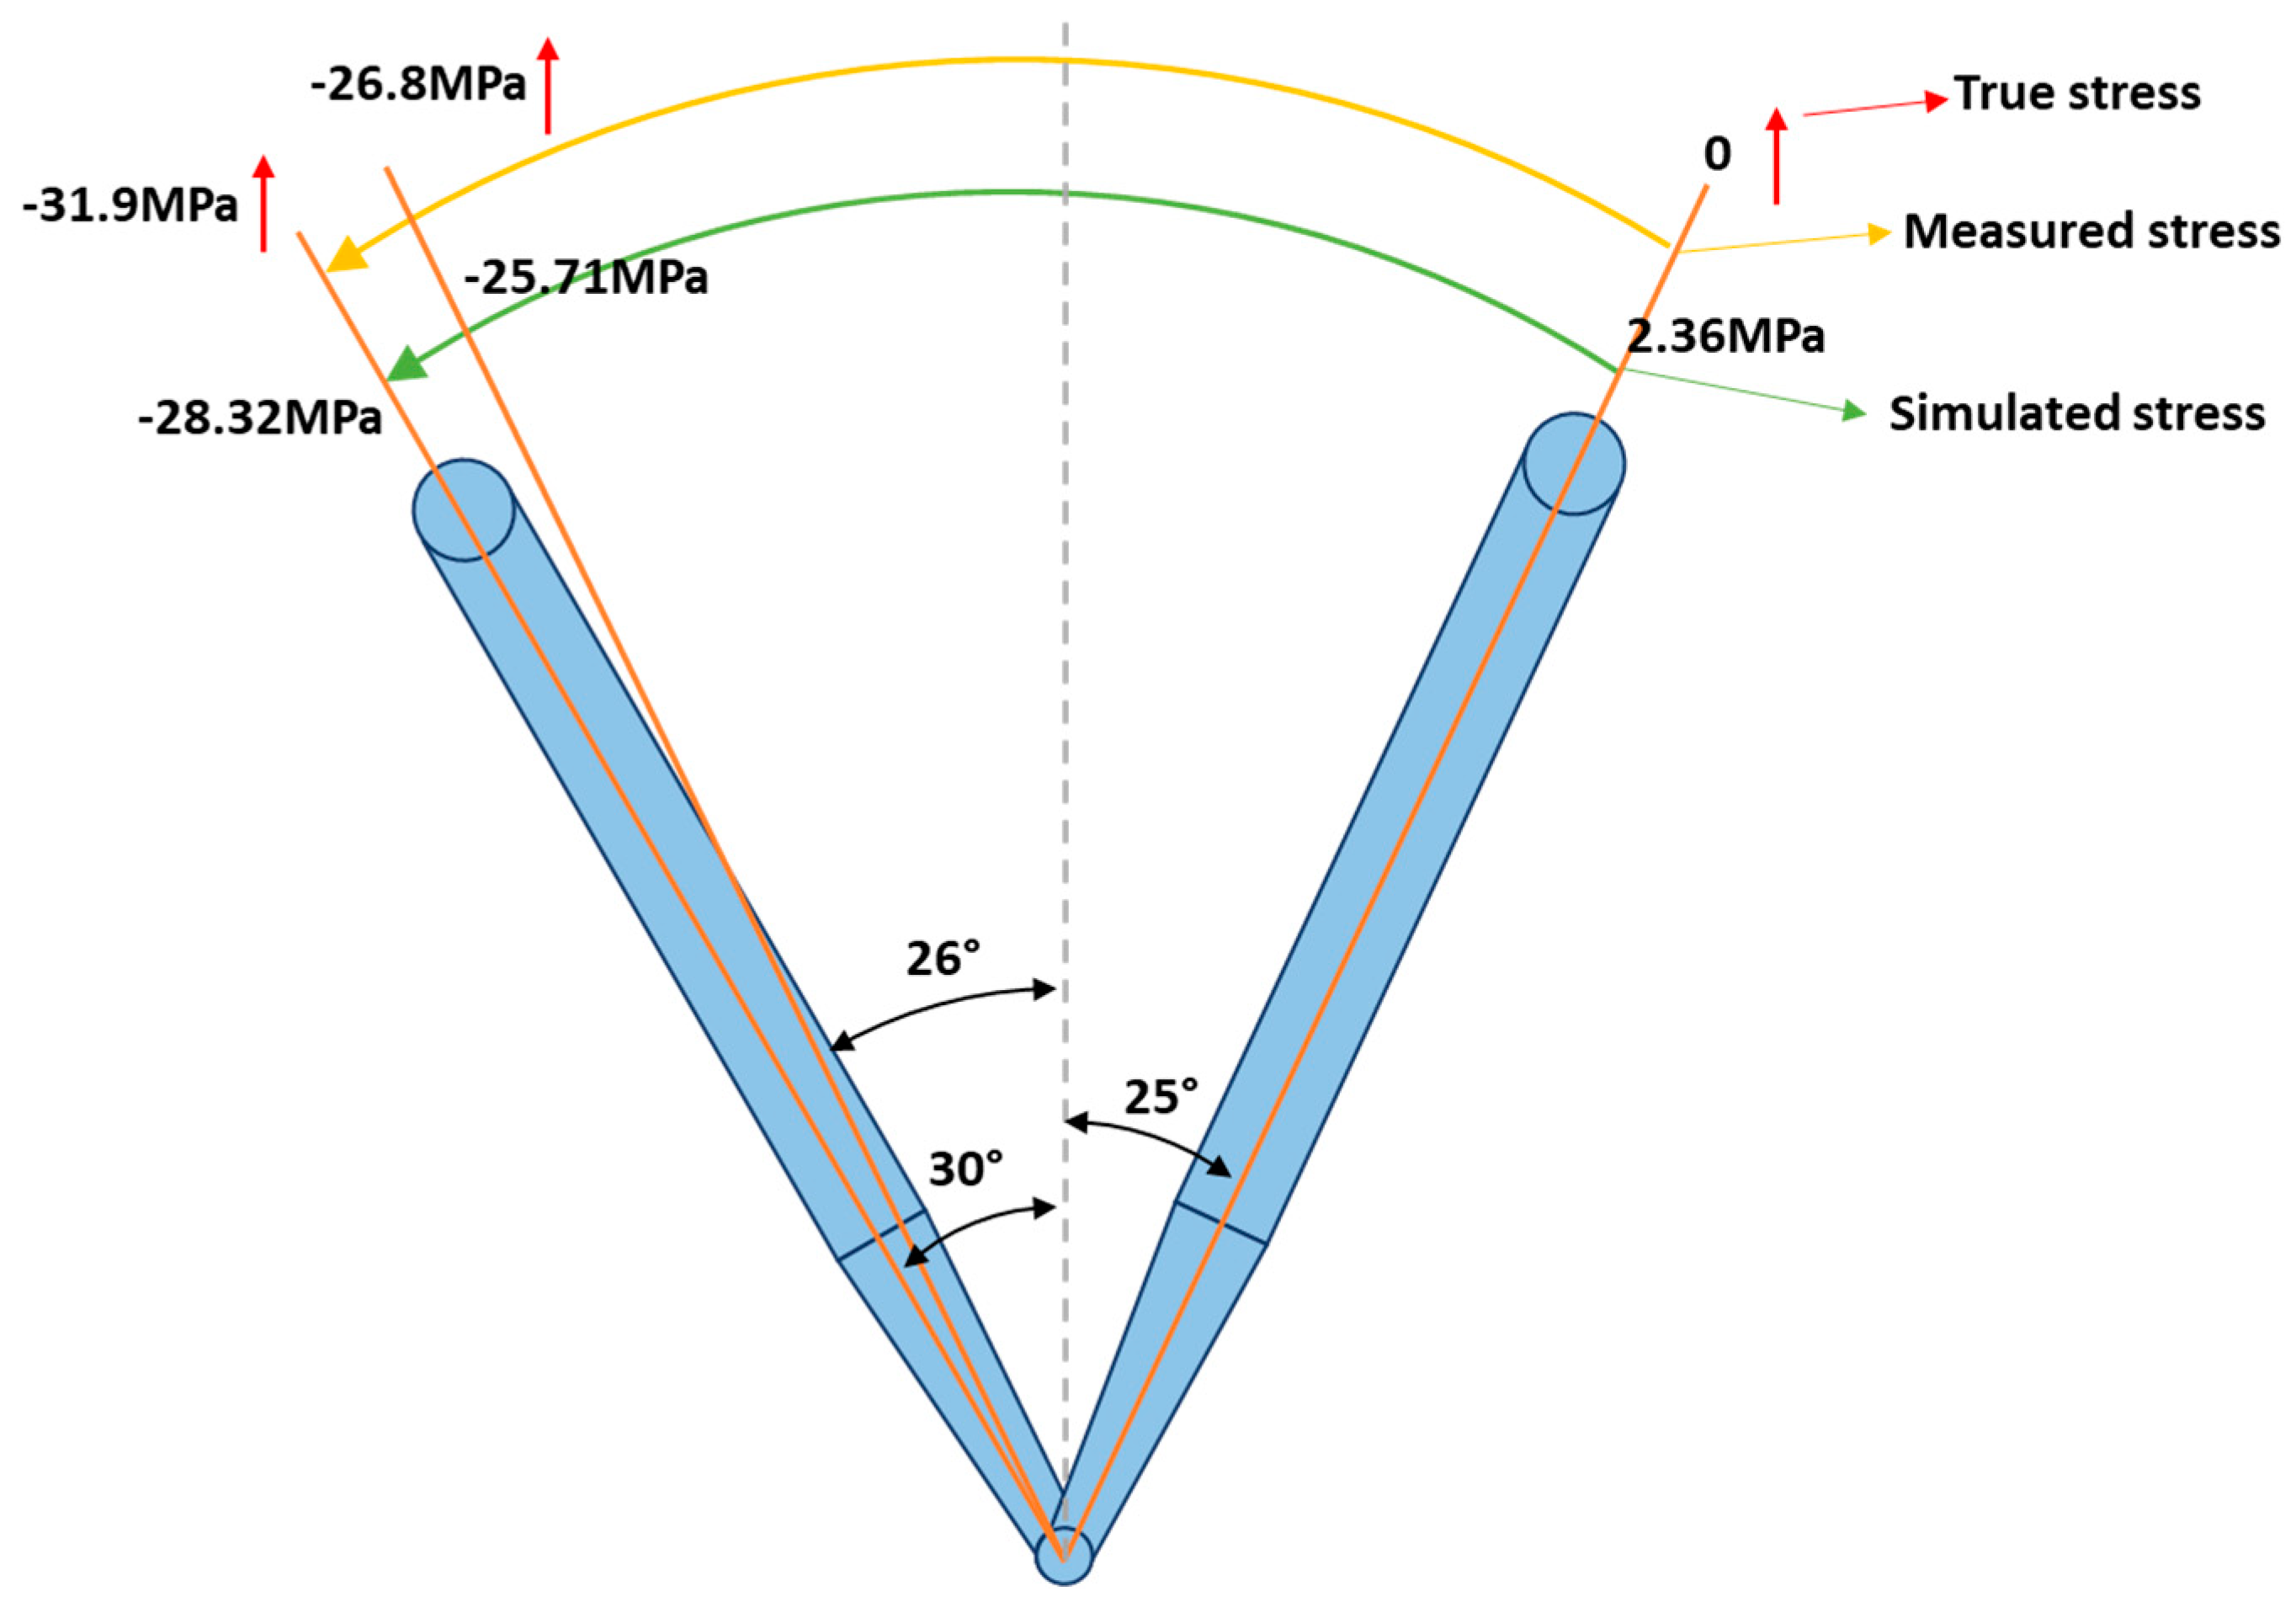
The swing angles of the A-Frame and the corresponding measured and simulated stress values at S1 are plotted in Figure 10. As previously mentioned, the initial stress induced by the structural self-weight cannot be directly measured by the FBG sensors. Consequently, the initial zero reference of the measured stress is defined at the inboard swing angle of 25° before the mining vehicle was lifted. However, the simulation results indicate that the theoretical stress at the monitoring point under this condition should be positive, representing tensile stress. Therefore, the actual stress should be adjusted by shifting the measured stress towards the positive direction. Although the simulated stress 2.36 MPa does not precisely quantify the offset magnitude, it suggests that the offset is relatively small. Thus, the actual maximum compressive stress is estimated to be slightly less than the measured value 31.9 MPa.

Figure 10.
The relationship of simulated stress, measured stress, and actual stress.
The A-Frame design in this study adheres to the Chinese standards GB/T 3811-2008 [37], GB/T 22437.1-2018 [38], and GB/T 22437.5-2021 [39]. According to these standards, the fundamental principle of failure prevention verification is to ensure that the calculated stresses induced by loads in crane structural components and mechanical parts remain below their corresponding design strengths. The standards recommend two structural design or capacity verification methods: the allowable stress method and the limit state method. The allowable stress method compares the design stress generated by combined loads with the allowable stress determined by component type or inspection conditions. In contrast, the limit state method applies partial safety factors to individual load components before combination and compares them against predefined limit states such as yielding or elastic instability. This study employs the allowable stress method for structural safety assessment, with the strength safety factor set at 1.34 as specified by the standards, resulting in an allowable stress of 235 MPa (315 MPa/1.34). Since the steel material used for the A-Frame has an allowable stress of 235 MPa that is far larger than 31.9 MPa, there is a substantial structural safety margin at the measured points.
The true stress of the critical locations of the A-Frame is expected to be inferred by considering the difference between the FEM and the real structure. Two critical steps need to be conducted. The first step is to understand the true stress values represented by the numerical simulation results in order to eliminate the differences between the numerical simulation and the measured data. Obviously, when the structural configuration remains unchanged and only the loading magnitudes change, the stress variations at different positions of A-Frame gantry columns exhibit remarkable similarity. This proportional correspondence in stress distribution enables an estimation of the critical stress values at hot spots through comparative analysis. In this paper, the stresses measured before and after the touchdown of the mining vehicle are used for the true stress estimation. These two conditions represent the scenarios where the structural state of the A-Frame remains unchanged with only the loading magnitudes varying. More specifically, after the mining vessel reached the seafloor, the A-Frame no longer bears the submerged weight of the mining vehicle, while all other conditions remain unchanged. By analyzing the proportional changes in the response of the A-Frame, the stress at unmeasured critical locations can be estimated based on the stresses obtained from other regions. A scaling coefficient characterizing modeling uncertainties is first established through comparative analysis of the numerical and measured stresses under two loading conditions, as follows:
where and denote the measured structural stress at the unmeasured and measured points, respectively; the superscript ^ denotes the corresponding simulated value that can be obtained by analyzing the FEM; and the subscripts 1 and 2 indicate the loading conditions before and after touchdown, respectively. represents the proportional relationship between the measured stress and its simulated counterpart. By instituting the numerical and measured stresses into Equation (1), one can obtain as 1.15. In addition, by incorporating into the simulated value, uncertainties, such as the sensitivity of the FBG sensors, can be eliminated.
The next critical step is to establish the stress mapping from the measured locations to the unmeasured locations. A proportional relationship for stress variation between these two locations is maintained:
where denotes the relationship between the two locations. Since only the axial stress is considered, is only determined by the cross section of the gantry column according to Hooke’s Law. Assuming that the cross section of the numerical model is consistent with the real structure, they share the same . Nevertheless, unlike numerical simulation, the measured data use an inboard swing of 25° as the reference zero point. Therefore, the initial stress at the inboard position needs to be eliminated by:
where denotes the simulated stress at the reference point under the inboard 25° angle. Note that is obtained from the scenario with an outboard angle of 26° instead of an inboard one of 25°. This is because the two distinct conditions where the A-Frame is unloaded and hoisting the mining vehicle cannot be identified only from the recorded strain. However, the obtained suggests that the numerical model effectively represents the stress state of the actual A-Frame. The effect of using obtained from another operating state may be negligible. By integrating Equations (1)–(3), the actual stress values and of the unmeasured location can be determined.
Figure 11 shows the stress contour maps of the monitored gantry column before and after the vessel’s touchdown. The maximum tensile and compressive stresses occur above and below the interface of the gantry column and the luffing cylinder, measuring 111.48 MPa and 116.34 MPa before touchdown, and 110.59 MPa and 114.52 MPa after touchdown, respectively, as listed in Table 3.
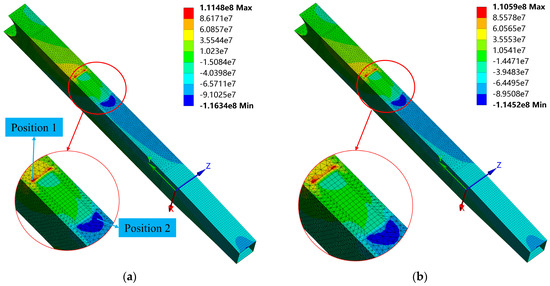
Figure 11.
Axial stress contour maps of the gantry column at a 26° outboard: (a) before touchdown; (b) after touchdown.
Table 3.
Simulated and estimated maximum tensile and compressive stresses of the A-Frame before and after touchdown.
By integrating the measured stress and the numerical simulation stress, the true maximal stress of the A-Frame structure is estimated, with the results summarized in Table 3. The stress change rate before and after touchdown is calculated by:
where is the change rate, and and represent the stress before and after touchdown, respectively. Additionally, the proportionality coefficient between the estimated and simulated values was calculated.
where is the proportionality coefficient, and and represent the estimated and simulated stress, respectively.
Table 3 shows that the simulated maximum tensile stress changes by 0.80%, while the evaluated maximum tensile stress changes by 0.81%. The consistency in these change rates verifies the effectiveness of the inversion method used. A similar conclusion can be drawn from the results for maximum compressive stress. Meanwhile, the results show a discrepancy of approximately 1.13 times between the estimated and simulated stress, indicating that the simulated values cannot accurately represent the true structural stress. This discrepancy likely arises from uncertainties in the actual testing process and errors in the finite element modeling. Therefore, it is necessary to combine finite element modeling and experimental data to infer the structure’s true stress state. Moreover, the table indicates that the inferred stress at critical locations is significantly lower than the allowable stress, 315 MPa, suggesting that the frame operated within the elastic range throughout all work cycles. This finding provides valuable guidance for future seabed mining operations when a larger mining vehicle is employed.
6. Conclusions
This study presents the stress-monitoring campaigns conducted on an A-Frame during the deep-sea mining process, providing a detailed analysis of the structural stress throughout the mining operation. Due to the monitoring being limited to specific locations of the A-Frame, a correlation between the measured stress at monitoring points and the actual stress was established by integrating limited test data with numerical analysis from a finite element model. The analysis of stress data yields valuable insights of the structural safety, leading to several key conclusions as follows:
(1) The load variations due to lifting the mining vehicle, disconnecting the docking head, and deploying the umbilical cable exert minimal influence on the stress of the A-Frame, causing only minor stress fluctuations of 1 to 2 MPa. Consequently, when operational conditions permit, accelerating the deployment and retrieval speeds is advisable to enhance operational efficiency.
(2) A comparative analysis of different outward swing angles reveals that the swing angle of the A-Frame significantly affects its stress response; a larger outward swing angle results in increased stress. The peak stress, corresponding to the most critical operational condition, occurs when the A-Frame reaches its maximum outward swing. Therefore, minimizing the outward swing angle, within operational constraints, is recommended to improve safety.
(3) Based on the measurements and FEM simulations, it was demonstrated that the frame operated within the elastic range throughout all work cycles. After addressing the initial value issue of the measured stress, the actual maximum compressive stress at the measurement location is slightly lower than the test value and remains well below the allowable stress of the A-Frame. Additionally, the inferred stress at critical locations is within the safe range, indicating a high level of structural safety for the A-Frame under the current operating conditions.
This study represents the world’s first 6000 m deep marine mining test conducted on a maritime A-Frame, where full-field stress was inversely derived through limited testing. The consistent stress variation rates between inferred and simulated results at critical locations demonstrate the effectiveness of the proposed inverse algorithm. The stress variation caused by lifting operations is minimal, while the self-weight of the A-Frame has a significant impact on its stress state. As a result, the structure is subjected to continuous high stress levels regardless of its operational state. Addressing fatigue issues under long-term cyclic loading on the A-Frame based on measured data represents an avenue for future work.
Author Contributions
Conceptualization, S.W., M.X. and J.L.; methodology, J.J., C.M., Y.L., S.W., M.X. and L.J.; software, C.M., Y.L. and M.X.; validation, L.L., J.L., S.W. and W.L.; formal analysis, J.J., C.M. and M.X.; investigation, C.M., H.Z. and J.J.; resources, J.L., L.L. and S.W.; data curation, C.M., J.J. and Y.L.; writing—original draft preparation, J.J., C.M., Y.L., H.Z., L.J. and M.X.; writing—review and editing, M.X., S.W., W.L., L.L. and J.L.; visualization, J.J., Y.L. and C.M.; supervision, S.W., W.L. and J.L.; project administration, J.L., L.L. and S.W.; funding acquisition, S.W. and M.X. All authors have read and agreed to the published version of the manuscript.
Funding
This research was funded by the National Science Foundation of China (52088102, 52401349), the Taishan Young Scholar Expert Program of Shandong Province (TSQN202408083), the Postdoctoral Fellowship Program of CPSF (GZB20240697), and the Qingdao Postdoctoral Funding Program (QDBSH20240202096).
Data Availability Statement
The original contributions presented in this study are included in this article. Further inquiries can be directed to the corresponding authors.
Conflicts of Interest
The author Jiahui Ji is employed by the company China Merchants Industry Holdings Co., Ltd., and the authors Ying Li, Jiancheng Liu, Lei Li and Lianjin Jiang were employed by the company Marine Equipment and System R&D Department China Merchants Marine Equipment Research Institute Co., Ltd. The remaining authors declare that this research was conducted in the absence of any commercial or financial relationships that could be construed as potential conflicts of interest.
References
- Du, K.; Xi, W.Q.; Huang, S.; Zhou, J. Deep-sea Mineral Resource Mining: A Historical Review, Developmental Progress, and Insights. Min. Metall. Explor. 2024, 41, 173–192. [Google Scholar] [CrossRef]
- Vlado, V. Uncharted depths: Navigating the energy security potential of deep-sea mining. J. Environ. Manag. 2024, 369, 122343. [Google Scholar]
- Hein, J.R.; Koschinsky, A.; Kuhn, T. Deep-ocean polymetallic nodules as a resource for critical materials. Nat. Rev. Earth Environ. 2020, 1, 158–169. [Google Scholar] [CrossRef]
- Sven, P.; Mark, H.; Anne, K. Technology developments in the exploration and evaluation of deep-sea mineral resources. Ann. Mines-Responsab. Environ. 2017, 85, 14–18. [Google Scholar]
- Ju, J.R.; Feng, Y.L.; Li, H.R.; Xue, Z.H.; Ma, R.Y.; Li, Y.H. Research advances, challenges and perspectives for recovering valuable metals from deep-sea ferromanganese minerals: A comprehensive review. Sep. Purif. Technol. 2023, 315, 123626. [Google Scholar] [CrossRef]
- Zhang, X.Z.; Zuo, Y.H.; Wei, J.K.; Sha, F.; Yuan, Z.Q.; Liu, X.L.; Xi, M.S.; Xu, J.Z. A Review on Underwater Collection and Transportation Equipment of Polymetallic Nodules in Deep-Sea Mining. J. Mar. Sci. Eng. 2024, 12, 788. [Google Scholar] [CrossRef]
- Xu, W.H.; Yang, J.M.; Wei, H.D.; Lu, H.N.; Tian, X.L.; Li, X. A localization algorithm based on pose graph using Forward-looking sonar for deep-sea mining vehicle. Ocean Eng. 2023, 284, 114968. [Google Scholar] [CrossRef]
- Dai, Y.; Xue, C.; Su, Q. An Integrated Dynamic Model and Optimized Fuzzy Controller for Path Tracking of Deep-Sea Mining Vehicle. J. Mar. Sci. Eng. 2021, 9, 249. [Google Scholar] [CrossRef]
- Kofi, M.B.; Haldar, A.; Huh, J.; Kim, I.-T.; Nguyen, V.B. Nonlinear time domain seismic response and performance evaluation of A-Frame jumbo-size container cranes. Appl. Ocean Res. 2024, 142, 103858. [Google Scholar]
- Adamiec-Wojcik, I.; Falat, P.; Maczynski, A.; Wojciech, S. Load stabilisation in an A-Frame—A type of an offshore crane. Arch. Mech. Eng. 2009, 56, 37–59. [Google Scholar] [CrossRef]
- Ren, Y.G.; Li, B.G.; Yang, L.; Zhao, Q.X.; Liu, Y.J.; Yu, J.X. Analysis of the Hydraulics Failures in A-Frame Launch & Recovery System for the Jiaolong Manned Submersible. In Proceedings of the 2020 IEEE Global Fluid Power Society PhD Symposium (GFPS), Online, 19 October 2020. [Google Scholar]
- Xu, M.Q.; Guo, J.; Wang, S.Q.; Li, J.; Hao, H. Structural damage identification with limited modal measurements and ultra-sparse Bayesian regression. Struct. Control Health Monit. 2021, 28, e2729. [Google Scholar] [CrossRef]
- Xu, M.Q.; Wu, W.K.; Wang, S.Q.; Jiang, Y.F.; Au, F.T. Output-only structural damage localization for deepsea mining risers using cointegration analysis. Struct. Health Monit. 2023, 22, 2251–2266. [Google Scholar] [CrossRef]
- Wang, X.; Kong, H.; Wang, K.Q.; Chen, Q. Dynamic stress monitoring for RC beam using PMN-PT-based three-direction normal stress sensor. Structures 2024, 68, 107091. [Google Scholar] [CrossRef]
- Wu, C.; Xiang, H.; Jiang, S.F.; Ma, S.L. Stress Monitoring of Concrete via Uniaxial Piezoelectric Sensor. Sensors 2022, 22, 4041. [Google Scholar] [CrossRef]
- Zhang, W.; Li, Y.X.; Sun, L.M. SHM-Oriented Hybrid Modeling for Stress Analysis of Steel Girder Bridge. J. Bridge Eng. 2021, 26, 05021002. [Google Scholar] [CrossRef]
- Hou, S.; Zhang, H.B.; Han, X.; Ou, J.P. Damage monitoring of the RC frame shaking table test and comparison with FEM results. Procedia Eng. 2017, 210, 393–400. [Google Scholar] [CrossRef]
- Liu, Y.C.; Ren, H.L. Rapid acquisition method for structural strength evaluation stresses of the ship digital twin model. Ocean Eng. 2023, 285, 115323. [Google Scholar] [CrossRef]
- Yang, W.; Yao, W.J.; Liu, X.Y. Stress Monitoring for the Whole Construction Process of Simply Supported to Continuous T-Beam Bridge. Appl. Mech. Mater. 2011, 1366, 3954–3957. [Google Scholar]
- Yuan, J.J.; Lv, X.; Kang, D.G.; Zhang, L.; Jia, S.Y.; Huang, Y.G. Safety assessment research of crane metal structure based on stress monitoring data of dangerous sections. J. Phys. Conf. Ser. 2024, 2775, 012042. [Google Scholar] [CrossRef]
- Dobrot, O.-M.; Mocanu, C.I. Variation of stress created by waves and marine currents in a leg of offshore platform. J. Eng. Stud. Res. 2011, 17, 22–29. [Google Scholar]
- Hirao, S.C.; Anai, Y.; Ishida, S.; Inoue, S. Study of Stress-Monitoring Method in Supporting Structure of Floating Offshore Wind Turbine. ISOPE Int. Ocean Polar Eng. Conf. 2016, 26, 219–224. [Google Scholar] [CrossRef]
- Du, J.F.; Zhang, D.Q.; Zhang, Y.F.; Xu, K.; Chang, A.T.; Zhao, S.J. Design and comparative analysis of alternative mooring systems for offshore floating photovoltaics arrays in ultra-shallow water with significant tidal range. Ocean Eng. 2024, 302, 117649. [Google Scholar] [CrossRef]
- Du, J.F.; Zhang, D.Q.; Jin, T.; Zhu, F.S.; Yuan, Z.M.; Incecik, A. Dynamic response characteristics of floating offshore photovoltaic systems with anchor position deviations under extreme environmental conditions. Phys. Fluids 2025, 37, 027121. [Google Scholar] [CrossRef]
- He, Z.Z.; Zhang, L.X.; Gao, H.G.; Wang, H.S.; Pan, P. Estimation of the displacement time history of high-rise building structures using limited measurement data and structural information. Mech. Syst. Signal Process. 2023, 202, 110716. [Google Scholar] [CrossRef]
- Wang, P.; Hu, G.Z.; Hu, W.L.; Xue, X.D.; Tao, J.; Wen, H.B. Deep Learning-Based Rapid Flow Field Reconstruction Model with Limited Monitoring Point Information. Aerospace 2024, 11, 871. [Google Scholar] [CrossRef]
- Oh, B.K.; Hwang, J.W.; Lee, J.H.; Kim, Y.; Park, H.S. A strain measurement model using a limited number of sensors for steel beam structures subjected to uncertain loadings. Meas. Sci. Technol. 2015, 26, 115007. [Google Scholar] [CrossRef]
- Sato, D.; Soriano, R.D.A.; Shegay, A.; Miyamoto, K.; She, J.; Kasai, K. Estimation of wind force time-history using limited floor acceleration responses by modal analysis. J. Fluids Struct. 2025, 132, 104203. [Google Scholar] [CrossRef]
- Tirado-Gutiérrez, R.J.; Vargas-Alzate, Y.F.; González-Drigo, R. Probabilistic estimation of the dynamic response of high-rise buildings via transfer functions. Eng. Struct. 2024, 302, 117299. [Google Scholar] [CrossRef]
- Isavand, J.; Kasaei, A.; Peplow, A.; Yan, J.H. Enhancing response estimation and system identification in structural health monitoring through data-driven approaches. Build. Acoust. 2024, 31, 57–73. [Google Scholar] [CrossRef]
- Yun, D.Y.; Park, H.S. Noise-robust structural response estimation method using short-time Fourier transform and long short-term memory. Comput. Aided Civ. Infrastruct. Eng. 2024, 40, 859–878. [Google Scholar] [CrossRef]
- Su, Q.; Yan, J.; Yang, Z.X.; Chai, W.; Zhao, C.Y.; Lu, Q.Z. Short-term extreme response estimation methodology for marine umbilical cables with two configuration types. Ocean Eng. 2024, 310, 118710. [Google Scholar] [CrossRef]
- Silionis, N.E.; Anyfantis, K.N. Static strain-based identification of extensive damages in thin-walled structures. Struct. Health Monit. 2022, 21, 2026–2047. [Google Scholar] [CrossRef]
- Shen, W.; Yan, R.J.; Xu, L.; Tang, G.N.; Chen, X.L. Application study on FBG sensor applied to hull structural health monitoring. Optik 2015, 126, 1499–1504. [Google Scholar] [CrossRef]
- Karatas, C.; Degerliyurt, B.; Yaman, Y.; Sahin, M. Fibre Bragg grating sensor applications for structural health monitoring. Aircr. Eng. Aerosp. Technol. 2020, 92, 355–367. [Google Scholar] [CrossRef]
- Mieloszyk, M.; Majewska, K.; Ostachowicz, W. Application of embedded fibre Bragg grating sensors for structural health monitoring of complex composite structures for marine applications. Mar. Struct. 2021, 76, 102903. [Google Scholar] [CrossRef]
- GB/T 3811-2008; Design Rules for cranes002C. General Administration of Quality Supervision, Inspection and Quarantine of the People’s Republic of China (AQSIQ); Standardization Administration of China (SAC): Beijing, China, 2008.
- GB/T 22437.1-2018; Cranes-Design Principles for Loads and Load Combinations-Part 1: General. State Administration for Market Regulation (SAMR); Standardization Administration of China (SAC): Beijing, China, 2018.
- GB/T 22437.5-2021; Cranes-Design Principles for Loads and Load Combinations-Part 5: Overhead Travelling and Portal Bridge Cranes. State Administration for Market Regulation (SAMR); Standardization Administration of China (SAC): Beijing, China, 2021.


Disclaimer/Publisher’s Note: The statements, opinions and data contained in all publications are solely those of the individual author(s) and contributor(s) and not of MDPI and/or the editor(s). MDPI and/or the editor(s) disclaim responsibility for any injury to people or property resulting from any ideas, methods, instructions or products referred to in the content. |
© 2025 by the authors. Licensee MDPI, Basel, Switzerland. This article is an open access article distributed under the terms and conditions of the Creative Commons Attribution (CC BY) license (https://creativecommons.org/licenses/by/4.0/).