Abstract
Since power demand varies due to uncertain environmental conditions, a deterministic power control strategy for hybrid electric propulsion ships contains a limitation in securing robust performance. To overcome this limitation, this study applies a stochastic power control strategy based on the augmented operational dataset. This study generated 150 datasets and derived the optimal control strategy set using a dynamic programming algorithm. By synthesizing a set of optimal control strategies, we divided them into a total of 10 bins according to the battery state of charge (SOC) and implemented a probabilistic map for the power distribution ratio according to the demanded power in each bin. Additionally, the memory and SOC correction factor were utilized to prevent frequent changes in power control and ensure that the SOC remains stable. This strategy resulted in a 3% improvement in efficiency compared to the deterministic method. In addition, it can be implemented in a real-time strategy utilizing stochastic maps.
1. Introduction
About 23% of carbon dioxide (CO2) emissions are emitted from the transportation sector, so emission regulations for transportation systems are being strengthened [1]. In particular, fossil fuels used for propulsion in transportation systems are known to be a major contributor to greenhouse gas emissions, as their combustion process releases a significant amount of CO2. Excluding the COVID-19 period in 2020, CO2 emissions from fossil fuel combustion in the transportation system have continued to increase, exceeding 8 Gt since 2020. The shipping sector accounts for about 3% of total CO2 emissions, which is lower than the automotive sector, but it has been steadily increasing. To address this situation, the International Maritime Organization (IMO) has been progressively tightening emission regulations in the shipping sector, aiming for net-zero greenhouse gas emissions by 2050 [2,3].
Achieving compliance with these regulations ultimately requires the electrification of propulsion systems [4]. However, depending on the type of ship or the operating profile, there may be limitations in securing total propulsion power using only electrified propulsion. For ships that need to travel long distances or require high propulsion power immediately, the capacity and cost of the energy storage system (ESS) limit their ability to meet the load demand of all-electric propulsion systems. In addition, all-electric propulsion still contains technical limitations, including insufficient charging infrastructure, energy management systems, and operational safety, which must be resolved before it can be applied in large mobility systems such as ships. For cases requiring immediate high propulsion power or power necessary for medium- to long-distance operations, a hybrid electric propulsion system that combines an internal combustion diesel engine with a battery-based electric propulsion system can be considered an appropriate solution [5]. The combination of marine diesel engines and batteries is one of the most widely used hybrid configurations.
The authors of [6] confirmed that an oceangoing bulk carrier with a diesel–battery hybrid propulsion system can reduce fuel consumption by 2–3% while lowering CO2 and NOX emissions by 5–7% [7]. The Viking Lady Offshore Supply Vessel, one of the hybrid electric propulsion ships currently in operation, is equipped with four Wärtsilä 6R32DF dual-fuel engines, each with a rated power of approximately 2100 kW, and two Alconza QD 560 M2-6W electric motors, each with a rated power of 2300 kW [8]. Another hybrid electric propulsion vessel, the Color Hybrid Ferry, is a plug-in hybrid ferry built in Norway. It is equipped with a Rolls-Royce Bergen B33:45L diesel engine capable of generating approximately 3600 kW of power and a battery with a capacity of approximately 5 MWh. Such a hybrid electric propulsion system offers high efficiency and performance during high-load operations while maintaining optimal fuel consumption rates during low-load operations [9,10]. A hybrid electric propulsion ship integrates a diesel engine as the primary power source with an electric propulsion system for auxiliary power, designed to reduce fuel consumption and emissions. It is generally known that hybrid electric propulsion can reduce fuel consumption by about 15 to 25% compared to conventional diesel engine-based systems.
In a land vehicle system, where hybrid electric propulsion was first applied, the power flow of the hybrid electric propulsion system is illustrated in Figure 1 [11]. Hybrid electric propulsion systems using different power sources can provide the power for operations by combining engines and electric power (case 1+3) or can charge the battery using the engine (case 2). However, since regenerative braking is impossible for ships, recovering operational load as electric energy is impossible (case 4). Therefore, compared to land vehicles, the strategies for distributing and managing hybrid power may be different. The algorithm for distributing and controlling power between the internal combustion engine and electric power corresponds to sigma (Σ) in Figure 1. The hybrid power control strategy controls the propulsion output at the center of different power sources and, in some cases, adjusts the energy flow accordingly.
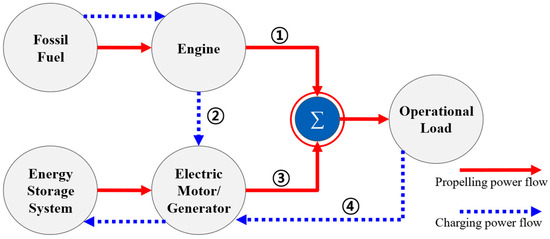
Figure 1.
Hybrid propulsion schematics and power flows [11].
In a hybrid propulsion system, the distribution of internal combustion engine power and electric propulsion power can be achieved through various control strategies. Representative power control strategies include thermostat control, load leveling, equivalent consumption minimization strategy (ECMS) [12], and horizon optimization. The thermostat control strategy is established based on the battery state of charge (SOC). When the SOC drops below a certain threshold, the engine increases power to recharge the battery [13]. In [14], thermostat control strategy was applied to a series hybrid electric vehicle (SHEV) to enable the propulsion system to operate at its efficient points. The load leveling control strategy determines the operating mode based on demanded power, selecting between electric propulsion, assist mode (using both the engine and motor), and charge mode for battery recharging. A representative application of load leveling was proposed in the field of electric vehicles, where charging and discharging times were strategically controlled to balance peak demand and minimize grid stress, particularly by employing regional time-shifted charging and daytime discharging of private EVs [15]. The ECMS control strategy, also known as the instantaneous optimization method, replaces the fuel consumption of the engine and the energy consumption of electric propulsion with an equivalent fuel consumption at each time step. By calculating the total fuel consumption, it determines the power distribution ratio that minimizes overall fuel usage. Although the control strategy does not have an optimal solution when considering the entire operation, it can be considered a pseudo-optimal solution because it contains an optimal solution, at least for each time interval. Huang et al. [16] proposed MPC-ECMS for hybrid trucks, and simulation results showed that the proposed control strategy improved fuel consumption by about 4.2% compared to the existing control strategy. Horizon optimization is a method for finding a global solution and is not used for real-time power control [17]. Instead, it is utilized to pre-evaluate the system’s optimal efficiency or to acquire prior knowledge for developing rule-based control strategies [18,19].
For hybrid power distribution control during actual ship operations, real-time computation must be feasible, and since future operational data is not precisely known, reliance on rule-based control strategies or the instantaneous optimization method is unavoidable. When establishing a control rule or an instantaneous optimization control strategy, it is generally necessary to optimize relevant control variables based on a representative operational profile [20]. For example, in the case of the load leveling method, the demanded power threshold for switching to electric mode must be optimized, while in ECMS, the fuel–electric energy equivalent parameter needs to be adjusted. However, the pre-set deterministic control variables may not be appropriate when variations in maritime environmental conditions and operational profiles occur. Consequently, a deterministic control strategy based on a single operational profile may result in lower performance in actual operation conditions than in ideal scenarios.
In this study, to overcome the limitations of the deterministic ship hybrid power control strategy, a control strategy with stochastic characteristics was established to deal with the variability of the operating load. While stochastic control methods have been explored in the hybrid electric vehicle [21], very few studies have attempted a probabilistic power control framework in the marine field. Most existing hybrid power control strategies rely on deterministic control variables optimized for specific reference operational profiles. However, under real-time operating conditions where power demands fluctuate, such deterministic strategies may result in degraded performance. This study introduces a novel approach by generating operational profiles based on a Markov chain and training a stochastic control map that accommodates variable load conditions. Through this, a real-time applicable probabilistic control strategy is proposed, representing a new contribution to marine hybrid propulsion control. A new operational profile is derived by adding variability to the reference operational profile, and a stochastic control strategy trained on this data is proposed. In order to derive a new operational profile, this study proposes a Markov chain-based operational profile generation algorithm. In addition, a memory factor is applied to solve the control fluctuation problem, which is a limitation of the stochastic control strategy, and a SOC correction factor is applied to sustain the battery SOC.
This paper is organized as follows: Section 2 introduces a Markov chain-based operational profile generation algorithm that can generate multiple operational profiles, including variations from a reference operational profile. Section 3 introduces a ship efficiency model for evaluating the algorithm and derives horizon-optimal solutions from various operational profiles. These solutions are then utilized for training the stochastic control strategy. Section 4 introduces the stochastic control strategy, and Section 5 evaluates its performance on new operational profiles.
The stochastic control strategy developed in this study demonstrates high efficiency even when the demanded power differs from the reference operational profile. Therefore, the results of this study can be utilized as a control strategy with real-time applicability to hybrid electric propulsion ships, demonstrating robust efficiency even in situations where operating fluctuations occur.
2. Markov Chain-Based Operational Cycle Augmentation
The demanded power required for ship operation can fluctuate due to variations in environmental operating conditions, such as wind loads, currents, and wave resistance, as well as changes in hotel loads and propulsion requirements. In the case of land vehicles, demanded power can be relatively categorized based on acceleration requirements, road incline, and aerodynamic load. If representative driving cycles for highway and urban driving conditions are established, variations in demanded power remain within a relatively small range. However, for ships, even when operating on a fixed route, the optimal control solution for a specific operational cycle may not be suitable in real-world conditions due to the large fluctuations in operational load. To overcome this issue, this study aims to generate a new operational cycle that considers fluctuations in operational load along a specific route to develop a control strategy trained on this data.
Based on the reference operational cycle, the Markov chain model was used as a method to generate a new operational cycle that incorporates variability. The Markov chain models state transitions over time based on the current state or the previous k states within a defined memory.
In this case, when the memory state k is set to k = 1, it is assumed that there is no memory of the previous state, which is defined as the Markov property. If the time of a specific state is t and its probability distribution follows the Markov property, the joint probability distribution, including previous time steps, can be simplified into a product of sequential probabilities as follows:
The driving or operating state of mobility systems is known to follow the Markov property, where the current state is determined by the immediately previous state [22]. In land vehicles, these Markov properties are used to generate standardized driving cycles [23,24]. In previous studies on these systems, actual vehicle driving data is first collected and segmented into smaller data sections with similar characteristics. After composing the segmented drive cycles into modal events of acceleration, deceleration, cruise, and idle modes, a new driving cycle is generated assuming that each modal event has a Markov property. Finally, among the generated driving cycles, the one with a speed–acceleration frequency distribution (SAFD) that is most similar to the actual driving data is selected as the standardized driving cycle.
The speed–acceleration frequency distribution (SAFD), used as a comparison standard, is a two-dimensional histogram representing the occurrence frequency of speed and acceleration combinations. It probabilistically characterizes the acceleration and deceleration patterns of the driving data and serves as a criterion for comparing the similarity of driving cycles in terms of demanded power.
Referring to the research cases of these land vehicles, this study applies a Markov chain-based operational data augmentation process, as shown in Figure 2, to create multiple operational cycles with variations in demanded power from a representative ship operational cycle.
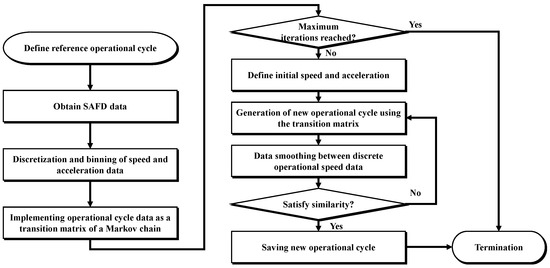
Figure 2.
Operational cycle augmentation based on a Markov chain model.
SAFD and Markov Transition Matrix of Operational Data
The target vessel in this study is a support vessel or cruise ship with large fluctuations in operating speed and acceleration. The power configuration of the vessel is illustrated in Figure 3. A diesel engine for primary propulsion is mechanically connected to the propeller shaft, while an electric motor is arranged in parallel to assist propulsion. This hybrid architecture allows for the simultaneous use of the engine and motor during propulsion and also enables partial conversion of engine power into electrical energy via the motor. Detailed specifications and efficiency maps of the power sources are presented in Section 3.1.

Figure 3.
Power configuration of the target vessel in this study.
The representative operation cycle shown in Figure 4 was derived from a hybrid electric recreational boat operating on the Kuala Terengganu (KT) river in Malaysia [25]. The KT operation cycle consists of the acceleration phase, deceleration phase, and cruise phase.
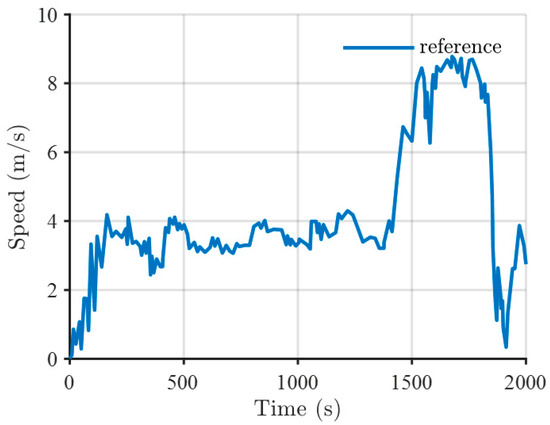
Figure 4.
Reference operational profile (for a recreation boat on the KT river).
The operational data shows that the vessel primarily operates at a speed of 3–4 m/s but accelerates to 8 m/s in the final segment to return to the port. The total operating time is 2000 s (approximately 33 min) per cycle. If the hybrid power control strategy is optimized based on the operational data in Figure 4, the speed of 3–4 m/s would account for the largest proportion of operation. Thus, the control strategy is likely to be optimized for this operating point. Additionally, considering the high-speed return condition in the later phase, the system may reserve electrical energy in advance and use it at the final step for more efficient operation. However, if the maximum speed operation time changes or the proportion of operation at 3–4 m/s varies, a power distribution control strategy optimized for a specific operational dataset may show suboptimal performance. Therefore, this study generated an SAFD based on the representative operational data in Figure 4 and used it to create multiple operational datasets with variations.
To generate the SAFD, the speed range was divided into 20 bins from the minimum speed (0 m/s) to the maximum speed (8.78 m/s). Similarly, the acceleration range was divided into 20 bins from the minimum acceleration (−0.6 m/s2) to the maximum acceleration (0.43 m/s2). The SAFD generated for a total of 400 bins is shown in Figure 5.
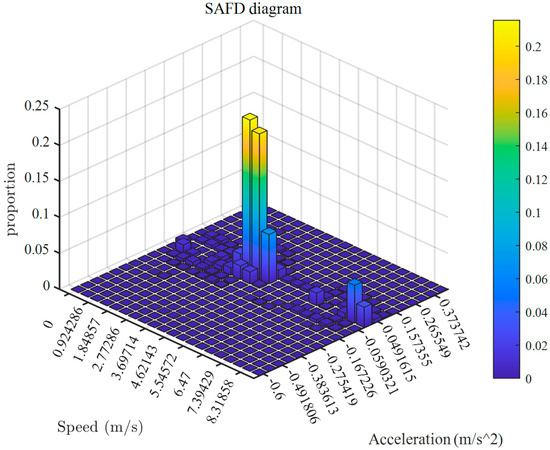
Figure 5.
Speed–acceleration frequency distributions (SAFDs) of the reference operational profile.
The SAFD results show that, as observed in the time series operational data, the largest number of operation points are concentrated in the 2–3 m/s speed range. For acceleration, the distribution is relatively concentrated around 0 m/s2.
In the SAFD, each combination of speed and acceleration is defined as a state, and the transition frequency between states is counted based on the time series operational data. By normalizing the transition frequencies between states, a Markov transition matrix can be constructed. Figure 6 presents a visualized graph of the Markov transition matrix generated.
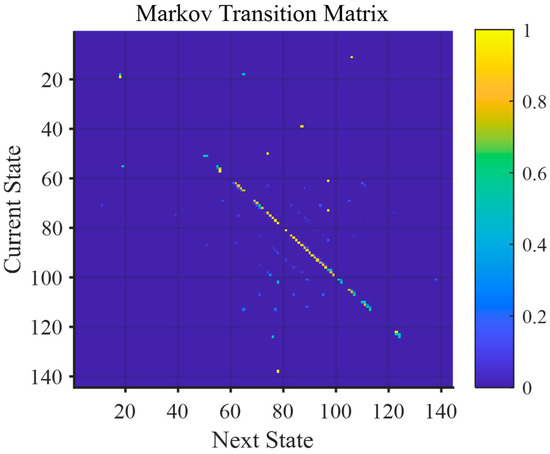
Figure 6.
Markov transition matrix from the reference operational cycle.
The Markov transition matrix probabilistically determines the speed and acceleration at each time step. The speed and acceleration profiles determined in this way will be probabilistically similar to the reference operational data. However, as transitions are repeated, the generated operational data may deviate from the reference data, reducing similarity. Therefore, in this study, quantitative similarity was evaluated among the operational data generated based on the Markov transition matrix to determine the final operational data for use.
The similarity of operational data was evaluated based on maximum speed, average speed, root mean square (RMS) speed, maximum acceleration, and average acceleration. The comprehensive similarity evaluation index is defined as follows:
where represents the similarity index and denote the average speed of the newly generated operational data and the reference operational data, respectively. , , , , , , , represent the maximum speed of new operating data, the maximum speed of reference operating data, the speed of new operating data, the speed of reference operating data, the average acceleration of new operating data, the average acceleration of reference operating data, the maximum acceleration of new operating data, and the maximum acceleration of reference operating data, respectively. The operational data generated in this study was designed to probabilistically simulate various operation times while preserving the probabilistic characteristics and major operational patterns of the reference operational data (2000s). In addition, , an index that can evaluate the similarity with the reference operational data, was added to quantitatively evaluate how well each generated operational data point reflects the key statistical characteristics of the original data. By using only data whose index is within the predefined threshold range in the study, it was ensured that the consistency of the periodic operational patterns of the reference operational data were statistically preserved in the newly generated operational data.
If the index () satisfies a predefined threshold range, it is saved as newly generated operational data. Figure 7 is an example of newly generated operational data based on a Markov chain. Since the operational data is probabilistically generated based on the Markov chain matrix, the results vary with each execution. The speed values of the newly generated operational data form a discrete velocity profile as they follow the resolution of the Markov chain matrix bins. To obtain a more continuous speed profile, the number of bins in the Markov chain matrix can be increased.
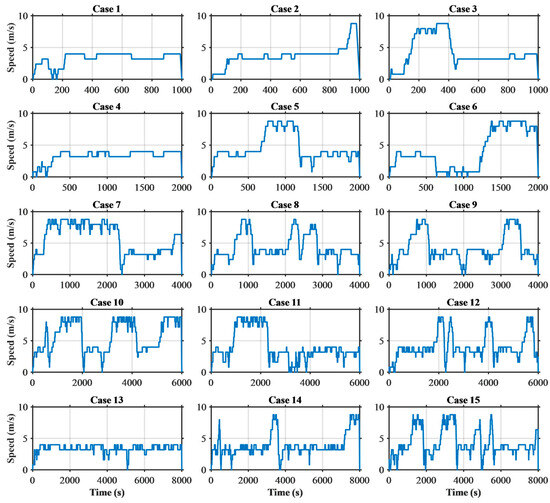
Figure 7.
Newly derived operational cycles from the Markov chain matrix.
In this study, 150 new operational datasets were generated, with 10 datasets for each of 15 different conditions. This study was conducted under quasi-static conditions, and, therefore, dynamic response factors related to passenger comfort were not considered. In future work, operational profiles will be developed based on actual ship operation scenarios by incorporating the frequency of rapid acceleration and deceleration, and subsequent analyses will be carried out under more realistic conditions. The data for each case in Table 1 represents the aggregated values of the 10 newly generated operational datasets under each condition. The total duration of the operational data varies from 1000 to 8000 s, and the cycle similarity was set to range between a minimum of 0.5 and a maximum of 2.0, as shown in the table. Increasing the threshold limit of the similarity results in greater differences between the newly generated operational data and the reference operational data. Conversely, if the threshold limit is set too low, the two datasets become nearly identical, making it difficult to properly reflect variations in operational load.

Table 1.
Detailed specifications of newly derived operational cycles.
The RMS speed of the operational profile is related to the propulsion power required for ship operation. As shown in Table 1, it varies within the minimum and maximum range, reflecting fluctuations in operational demanded power. The RMS speed of the reference operational data is 4.6579. It was observed that cases with a smaller range (when the difference between Max and Min is small, e.g., cases 3, 6, 9, 12, and 15) show an RMS speed range closer to that of the reference operational data compared to cases with a larger range (e.g., cases 1, 4, 7, 10, and 13). This confirms that the operational similarity index in this study was appropriately set.
3. Energy Consumption Model and Optimal Solution Datasets
3.1. Ship Energy Consumption Model
To derive the optimal power control algorithm for the newly generated operational data, the global optimization method, dynamic programming, was applied. The ship power transmission model for applying the optimal power control algorithm was developed based on the efficiency map of the power source to reduce the computational burden. The ship power transmission model calculates the operational load from the operational data and determines the demanded power for the engine and motor through the power control algorithm. It then identifies the operating points of the power sources and computes the final energy consumption. The operational load is calculated by the function of speed [26], and the operating conditions of each power source (rotational speed and torque) are derived based on the following equations:
where is the power distribution control variable between the diesel engine and the electric motor. When approaches 1, the electric motor primarily supplies the propulsion power, and when approaches 0, the diesel engine becomes the main power source. When approaches −1, the motor operates like a shaft generator, utilizing the surplus of the engine load to charge the power. The maximum outputs of the diesel engine and electric motor are 1440 kW and 450 kW, respectively, and the efficiency maps of each power source are shown in Figure 8 and Figure 9. The ship was assumed to be a 71,000 kg recreational boat.
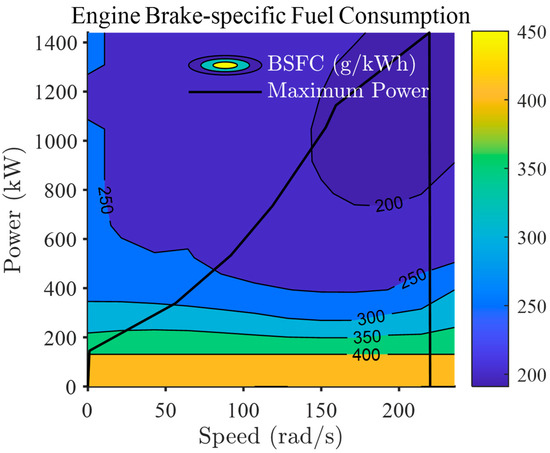
Figure 8.
Diesel engine brake-specific fuel consumption map.
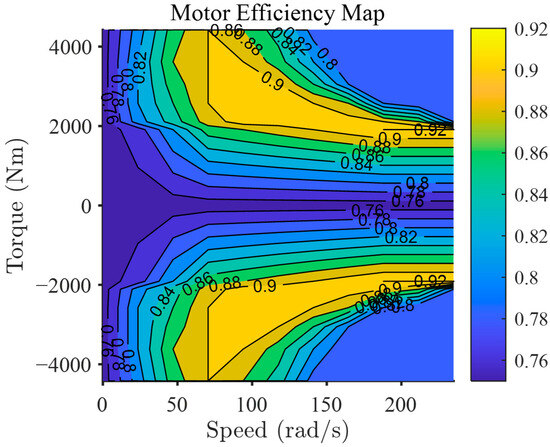
Figure 9.
Electric motor efficiency map.
The battery used to operate the electric motor calculates the current () based on power consumption using an open-circuit model and determines the state of charge (SOC) variation accordingly [27].
The final efficiency is evaluated by accumulating the amount of fuel consumed during operation while maintaining the battery SOC at the same level as the initial level.
3.2. Optimal Control Solutions
To determine the control variable () for each operational condition based on the ship efficiency model, the state variable in dynamic programming was set as the battery SOC. Therefore, at each time step, the state is calculated while constraining its minimum and maximum values within the range defined by Equation (14). Additionally, the final SOC is constrained to be equal to the initial SOC as a boundary condition. The grid of state has 61 elements and a resolution of 0.005.
- -
- State Constraints
The control variable is selected within the range of −1 to 1. The grid of consists of 1000 points, with a resolution of 0.002.
The dynamic programming algorithm was implemented using a code developed by ETH [28]. The boundary method was set to Line, and the tolerance was set to 1 × 10⁻⁸. The optimal control solutions were explored for 150 operational datasets across 15 different conditions. Figure 10 presents the results of the optimal control variable () for a subset of the operational datasets, corresponding to .
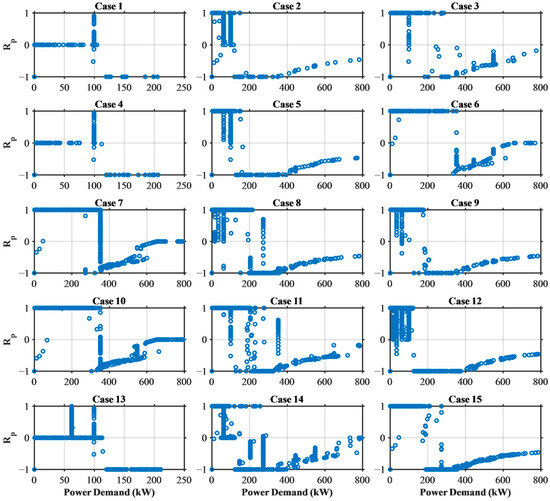
Figure 10.
Optimal control solutions from the dynamic programming algorithm for 150 operational cycles.
Even with deviations in the operational data, the control solution for demanded power shows a slight fluctuation range, but overall, it shows a form similar to Figure 11. Generally, for demanded power between 100 kW and 400 kW, remains at 1, indicating a preference for electric propulsion. For demanded power above 400 kW, increasing the engine power rating to operate at an efficient operating point while using surplus power for charging is more efficient. Specifically, the engine’s optimal efficiency point can be determined by reducing the engine power rating while considering the characteristics of the engine’s efficiency map as the required power increases. However, it can be confirmed that the is not determined in the demanded power of 0~800 kW, but rather, various control options are selected even in the same demanded power, such as the demanded power condition of 350 kW or less. If a single deterministic control strategy is established based on demanded power, the optimal solution may not be selected under various operational conditions. Therefore, in this study, the control solutions for 150 operational conditions were integrated to develop a probabilistic map of control solutions based on demanded power, allowing for selection based on probability.
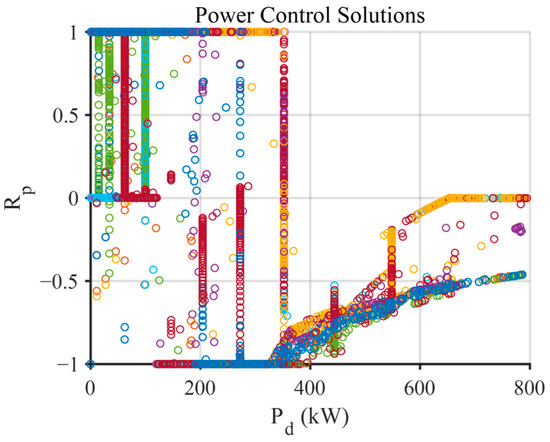
Figure 11.
Total points of optimal control solutions.
4. Stochastic Power Control Strategy
4.1. Main Control Strategy
represents the proportion of electric propulsion power used in the total propulsion power. When the battery SOC is sufficient, electric propulsion is primarily utilized without fuel consumption, resulting in being close to 1. Conversely, when the SOC is low, is reduced to minimize battery discharge. Therefore, after compiling all the optimal control solutions derived from dynamic programming, the control solutions were reorganized into a stochastic map based on the SOC state and demanded power. The SOC state was classified according to its deviation from the final target SOC value. As shown in Table 2, the SOC states were divided into 24 bins. However, since bins 1–8 and 19–24 did not contain any corresponding SOC states, the stochastic map was ultimately established for 10 bins, as illustrated in Figure 12. The color scale represents the probability density of each combination of demanded power and , in a given . Warmer colors indicate more frequently selected control actions under dynamic programming results.

Table 2.
SOC status bins for generating stochastic power control maps.
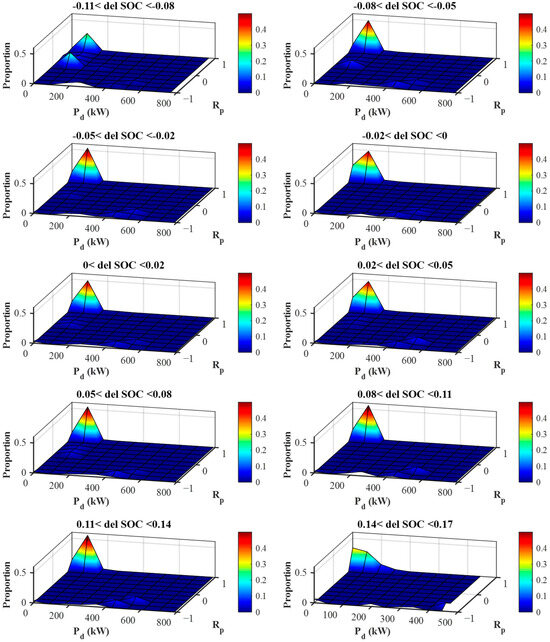
Figure 12.
Power control stochastic map with respect to SOC status. (Color bar: probability of each control state.) (Red color: more frequently selected under dynamic programming results.)
The results in Figure 12 show that the optimal power distribution control solution varies slightly depending on the current SOC state. The stochastic control strategy follows the process outlined in Figure 13. When the ship’s propulsion demanded power is input, the appropriate bin in the stochastic control map is selected based on the current SOC. Then, a set of candidates corresponding to the propulsion demanded power are derived using a probabilistic distribution. Finally, to prevent frequent control fluctuations and avoid battery overcharging or over-discharging, a compensation algorithm is applied to determine the final power distribution control value. The ship’s power system utilizes the final power distribution control value to determine and operate the engine power rating and electric propulsion power. This probabilistic control method can achieve higher average performance compared to a deterministic control approach, especially when there is uncertainty and fluctuation in the demanded power.
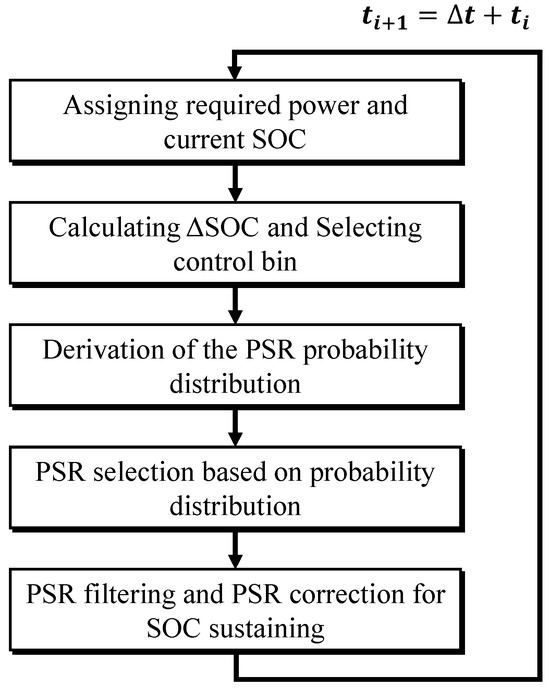
Figure 13.
Flow chart of the stochastic power control strategy.
4.2. Effects of Memory Factor
When applying the main control strategy to the ship efficiency model and reference operational data, frequent fluctuations in power control values occur, as shown in Figure 14. This is a characteristic of the probabilistic control strategy, where selecting a control solution at every time step without restrictions can lead to engine and motor overload, as well as increased fatigue in practical applications. Additionally, for power sources with slower response times, such as diesel engines, the system may fail to track rapid power control commands. To address this, a memory factor was applied to the power control values to limit frequent fluctuations.
where is the power distribution control solution obtained from the stochastic control map, represents the final power distribution control solution from the previous calculation step, and is the final power distribution control solution selected in the current step. α is the memory factor. As the memory factor approaches 1, the variation from the previous power distribution control solution becomes smaller. An excessively high memory factor may degrade the control strategy’s performance. Depending on the memory factor, the variability of was quantified using the average of the derivative of (fluctuating index), and the total fuel consumption was evaluated. As shown in Figure 15, as the memory factor increases and approaches 1, the variability of decreases linearly. However, total fuel consumption rises sharply when the memory factor exceeds 0.95. This indicates that when the memory factor increases beyond a certain threshold, the reflection of the optimal control solution slows down, ultimately degrading performance. Therefore, to minimize fluctuations while keeping the increase in fuel consumption to a minimum, the memory factor was set to 0.95.
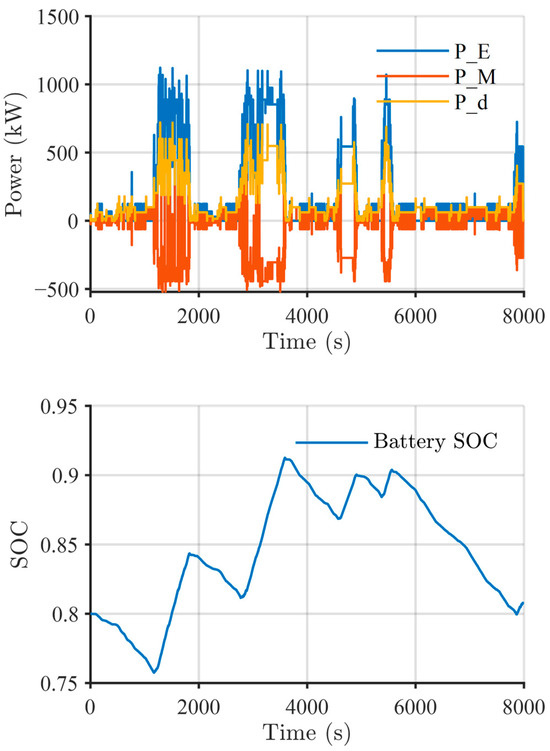
Figure 14.
Frequent power rating changes in the stochastic control strategy (upper: power control results (: engine power, : motor power, : demanded power; lower: battery state of charge during operation).
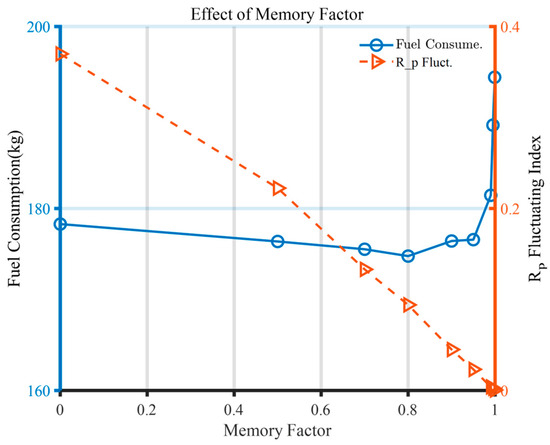
Figure 15.
Effect of the memory factor of the control strategy.
4.3. SOC Correction Factor
Since the stochastic control strategy is a real-time power control algorithm, it operates without prior information about future operational cycles. As a result, at the end of the operation, the battery SOC may become over-discharged. To prevent this problem, a SOC correction factor (β) that can control the SOC was added. The SOC correction reduces the value of based on the decrease in battery SOC from its initial value, thereby lowering the proportion of electric propulsion or enabling charging. This correction is based on the following equation:
The total fuel consumption and SOC after the end of the operation, according to the SOC correction factor, are shown in Figure 16. In this study, various SOC correction factors were applied to analyze their effects on SOC recovery behavior and fuel consumption. As shown in Figure 16, changes in the SOC and fuel consumption were more sensitive when the correction factor was below 10. Therefore, finer intervals were selected in this range to capture these variations more accurately. In contrast, when the correction factor exceeded 10, the final SOC values stabilized around 0.80, and the fuel consumption gradually increased without abrupt changes. To avoid redundancy while maintaining representativeness, selected values such as 30 and 50 were used in the higher range. As the SOC correction factor increases, the battery SOC gradually recovers when the factor is below 5. However, beyond a certain threshold, the battery SOC exhibits excessive recovery. This occurs when excessive charging takes place during the later stages of the operational profile, leading to overcharging instead. When the SOC correction factor exceeds 25, it immediately compensates for SOC differences to sustain the SOC, so it is strongly maintained at a certain SOC. However, this leads to deviations from the optimal control solution, gradually increasing fuel consumption. Since determining the optimal SOC correction factor is challenging, the control system designer must select an appropriate value based on the operation plan and battery charging strategy, ensuring that the remaining battery SOC that must be maintained after the end of the operation.
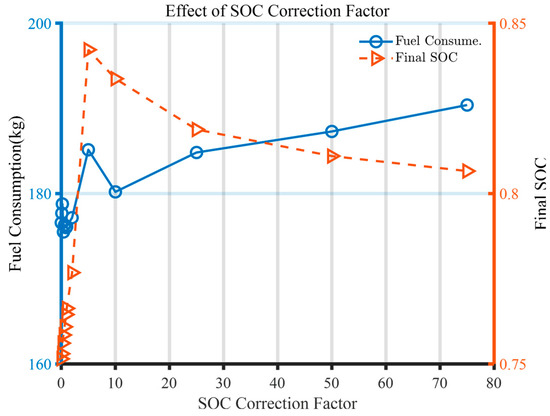
Figure 16.
Effect of the SOC correction factor of the control strategy.
5. Control Strategy Validation
The stochastic power control strategy developed in this study can achieve consistently high performance even under variable load conditions. To validate this, performance was evaluated using a new operational dataset that was not included in the training data from the KT River. The new operational dataset follows the speed profile shown in Figure 17. For relative comparison with the stochastic power control strategy, the commonly used load leveling technique was applied to the same operational profile. Based on the previous dynamic programming (DP) results, the load leveling method sets to −0.5 for demanded powers exceeding 100 kW to increase the engine’s power rating. For demanded power below 100 kW, electric propulsion is considered more efficient, so is set to 1, allowing operation in electric mode. Additionally, to maintain the SOC, the SOC correction factor is applied in the same way as the stochastic power control strategy.
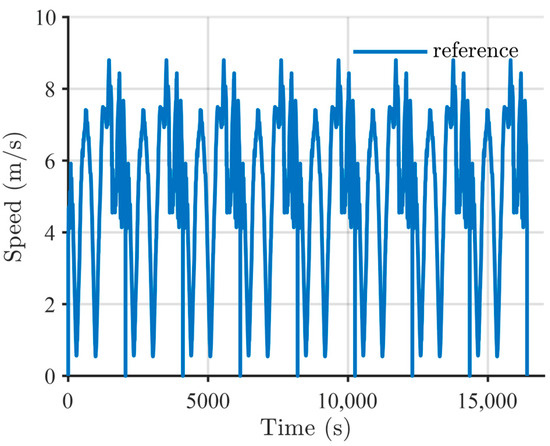
Figure 17.
Operational profile for validating the control strategy.
Table 3 shows the global optimal performance results for new operational data obtained through dynamic programming, the stochastic power control strategy, and the load leveling method. Although the global optimal performance cannot be practically implemented as a real-time controller, it represents the best possible performance assuming full knowledge of the entire operational dataset, making it a suitable reference for relative comparison. From this perspective, both the stochastic power control strategy and the load leveling method show 14–20% higher total fuel consumption compared to the optimal solution.

Table 3.
Fuel consumption results of various control strategies (β: SOC correction factor).
The battery SOC at the final termination point is different depending on each control strategy and the SOC correction factor setting. When the final battery SOC differs, a direct comparison of fuel consumption becomes difficult. Therefore, as shown in Figure 18, the trend of total fuel consumption was analyzed based on battery SOC. By comparing the total fuel consumption with respect to the final SOC, the performance difference between the stochastic control strategy and the load leveling method can be identified. The stochastic control strategy shows about a 3% reduction in fuel consumption compared to the load leveling method. In the case of large-scale systems such as hybrid electric propulsion ships operating over long durations and distances, even a 3% improvement in propulsion efficiency can lead to an annual reduction of tens to hundreds of tons of fuel consumption, accompanied by a corresponding decrease in CO2 and NOx [7]. These findings indicate that even a 3% efficiency improvement yields substantial operational and environmental benefits and serves as a quantitative basis supporting the commercial viability of eco-friendly ship technologies, in alignment with the IMO’s decarbonization objectives [6].
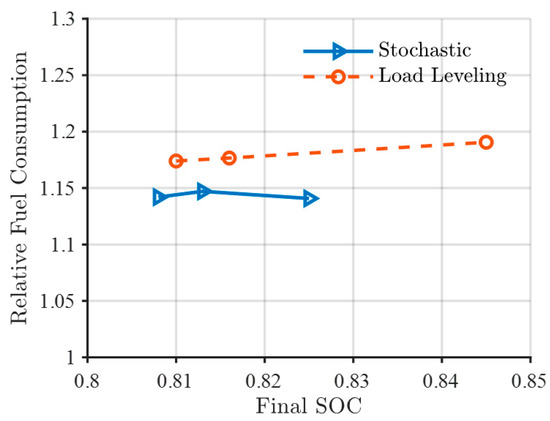
Figure 18.
Performance comparisons between the stochastic method and the load leveling method.
The stochastic power control strategy results in approximately 14% higher fuel consumption compared to the maximum performance achieved by dynamic programming. However, it demonstrates better performance than the load leveling method. Additionally, even when variations occur in the operational data used for training, the strategy remains meaningful and applicable as a power control approach.
The performance results were analyzed from the perspective of power distribution between energy sources. Figure 19 presents the comparison of engine power () and electric propulsion power () relative to the ship demanded power () under both the load leveling control strategy and the stochastic control strategy. Interestingly, in the stochastic control strategy, both engine power and electric charging power are used at a higher level compared to the load leveling control strategy. In contrast, in the case of the load leveling control strategy, electric propulsion is only utilized at powers below 100 kW, so the engine power does not change significantly. The reason why total fuel consumption can be reduced despite increased engine and motor power is shown in Figure 20. Compared to the results of the load leveling control strategy represented by the red points, the operating points of the stochastic control strategy represented by the green points can be seen to be closer to the efficient operating ranges of the engine and motor. In the engine map, the optimal efficiency region is indicated in blue, while in the motor map, it is represented in yellow. As a result, the stochastic control strategy achieves higher efficiency than the load leveling control strategy. However, since the stochastic control strategy establishes control solutions based on a probabilistic model, it may show slight differences in each operational simulation.
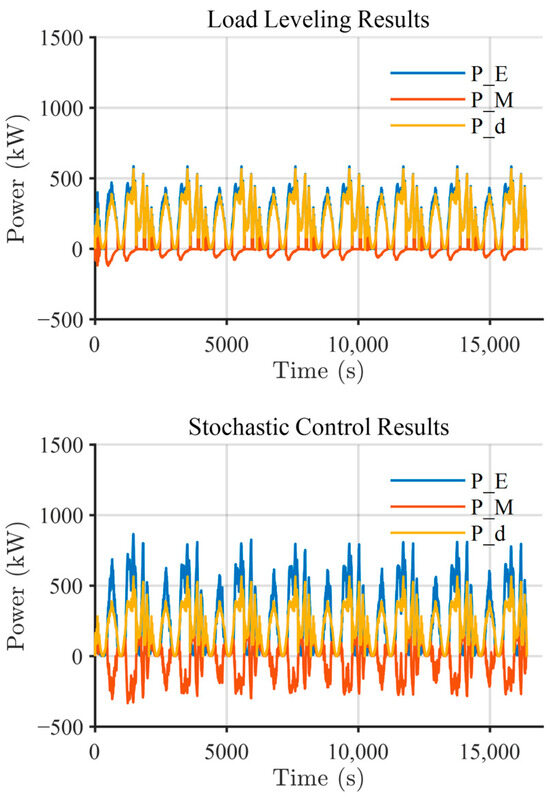
Figure 19.
Power management results from two kinds of control strategies (upper: load leveling control; lower: stochastic control).
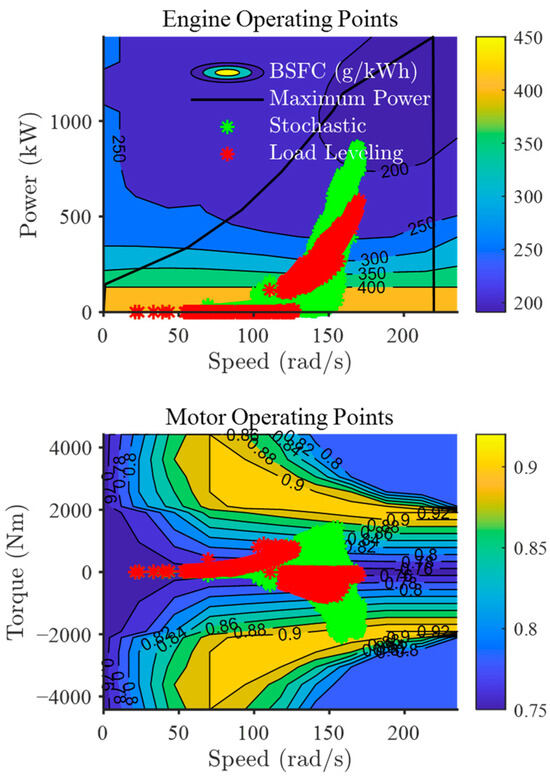
Figure 20.
Engine and motor operating points from two kinds of control strategies (upper: engine operating points; lower: motor operating points) (red: load leveling control; green: stochastic control).
6. Conclusions
This study proposed a stochastic model-based power control algorithm for hybrid electric propulsion ships, designed to maintain high efficiency under variable operational conditions. The proposed power control algorithm implements optimal power control solutions as a stochastic control map, enabling probabilistic control decisions based on operational requirements. To implement this stochastic control strategy, Markov chain-based models were used to generate diverse operational datasets with variations, derived from the reference operational data. By training on these varied operational datasets, the proposed method maintains consistently high performance, even when deviations occur from the reference operational conditions. The existing deterministic power control strategy can obtain the optimal control solution through the global optimization technique when the operating data is accurately identified. However, in reality, such prior information is often unavailable, and performance degradation can occur due to environmental fluctuations and load variations during operation. By comparing the stochastic control strategy proposed in this study with the deterministic load leveling method, it was observed that in non-reference operational conditions, the stochastic control strategy reduced total fuel consumption.
A potential drawback of the stochastic control strategy is its tendency to cause frequent power load fluctuations. To address this, a memory factor was added to prevent frequent power load fluctuations. In addition, the SOC correction factor was applied to satisfy the battery SOC recovery requirement at the end of the operation. The SOC correction factor can be selected by the user according to the requirements at the end of the operation, rather than proposing a fixed optimal value.
The results of this study are suitable for application to ships with basic reference operation plans that may experience some fluctuations in demanded power. Although this study generated 15 new operational datasets and trained the control algorithm on a total of 150 datasets, future research could incorporate a larger dataset to derive an optimal solution and further improve model training. This approach is expected to enhance probabilistic control performance even under larger variations in operational conditions. When the training dataset is expanded to thousands of operating cycles, the computation time required to obtain optimal control solutions for each cycle increases linearly. In this study, it took approximately 101.47 s to derive an optimal control solution for a single operating cycle using dynamic programming. Therefore, if the training dataset were expanded to several thousand cycles, the total offline computation time would proportionally increase to several hours. However, this process is performed only once during the control strategy development stage and does not affect real-time implementation. Once the stochastic control map is generated, the real-time controller only performs a simple table lookup and retrieval of control ratios, which requires minimal computational effort. Therefore, the proposed control strategy can be effectively implemented on embedded shipboard control systems without any real-time performance issues.
Future research will focus on applying the proposed stochastic control strategy to a real hybrid power system, introducing load variations to validate its real-time performance. Based on this study that assumed quasi-static conditions, a more realistic operating cycle that reflects the transient situation of the operating cycle will be constructed, and the stochastic control strategy based on this will be applied to a test-bed that simulates the propulsion structure of a hybrid electric ship. In this case, frequent switching between propulsion modes may lead to overloading or reduced reliability of powertrain components. Therefore, a control strategy that reflects such physical constraints should be established in parallel in the future. Through this, it is expected that the stability and effectiveness of the control strategy can be secured even in an actual operating environment. The stochastic control strategy development framework proposed in this study is expected to serve as a foundation for the advancement of next-generation power control algorithms in eco-friendly ship propulsion systems.
Author Contributions
Conceptualization, S.B.C. and S.J.K.; Methodology, S.B.C., S.H.H. and S.J.K.; Validation, S.B.C., S.H.H. and S.J.K.; Formal analysis, S.H.H.; Investigation, S.B.C., S.H.H. and S.J.K.; Writing—original draft, S.B.C., S.H.H. and S.J.K.; Writing—review & editing, S.B.C. and S.J.K.; Supervision, S.J.K. All authors have read and agreed to the published version of the manuscript.
Funding
This work was supported by a National Research Foundation of Korea (NRF) grant funded by the Korean government (MSIT) (No. NRF-2022R1F1A 1070449) and supported by the Research Fund of Chungnam National University.
Data Availability Statement
The original contributions presented in this study are included in the article. Further inquiries can be directed to the corresponding author.
Conflicts of Interest
The authors declare no conflict of interest.
References
- Jaramillo, P.; Kahn Ribeiro, S.; Newman, P.; Dhar, S.; Diemuodeke, O.E.; Kajino, T.; Lee, D.S.; Nugroho, S.B.; Ou, X.; Strømman, A.H. Transport. In Climate Change 2022: Mitigation of Climate Change. Contribution of Working Group III to the Sixth Assessment Report of the Intergovernmental Panel on Climate Change; Cambridge University Press: Cambridge, UK, 2022. [Google Scholar] [CrossRef]
- International Energy Agency. Net Zero by 2050: A Roadmap for the Global Energy Sector; IEA: Paris, France, 2021; Available online: https://www.iea.org/reports/net-zero-by-2050 (accessed on 28 April 2025).
- International Maritime Organization. IMO Strategy on Reduction of GHG Emissions from Ships; IMO: London, UK, 2023; Available online: https://www.imo.org/en/OurWork/Environment/Pages/2023-IMO-Strategy-on-Reduction-of-GHG-Emissions-from-Ships.aspx (accessed on 28 April 2025).
- Pang, B.; Liu, S.; Zhu, H.; Feng, Y.; Dong, Z. Real-time optimal control of an LNG-fueled hybrid electric ship considering battery degradations. Energy 2024, 296, 131170. [Google Scholar] [CrossRef]
- Jianyun, Z.; Li, C.; Lijuan, X.; Bin, W. Bi-objective optimal design of plug-in hybrid electric propulsion system for ships. Energy 2019, 177, 247–261. [Google Scholar] [CrossRef]
- Dedes, E.K.; Hudson, D.A.; Turnock, S.R. Assessing the potential of hybrid energy technology to reduce exhaust emissions from global shipping. Energy Policy 2012, 40, 204–218. [Google Scholar] [CrossRef]
- Inal, O.B.; Charpentier, J.-F.; Deniz, C. Hybrid power and propulsion systems for ships: Current status and future challenges. Renew. Sustain. Energy Rev. 2022, 156, 111965. [Google Scholar] [CrossRef]
- Ship Technology. Viking Lady. Available online: https://www.ship-technology.com/projects/viking-lady/ (accessed on 28 April 2025).
- Riviera Maritime Media. Color Hybrid: Technology Behind the World’s Largest Plug-in Hybrid Ferry. Available online: https://www.rivieramm.com/news-content-hub/news-content-hub/color-hybrid-technology-behind-the-worldrsquos-largest-plug-in-hybrid-ferry-56251 (accessed on 28 April 2025).
- Ship Technology. Color Hybrid Ferry. Available online: https://www.ship-technology.com/projects/color-hybrid-ferry/ (accessed on 28 April 2025).
- Ehsani, M.; Gao, Y.; Miller, J.M. Hybrid electric vehicles: Architecture and motor drives. Proc. IEEE 2007, 95, 719–728. [Google Scholar] [CrossRef]
- Sun, X.; Yao, C.; Song, E.; Liu, Z.; Ke, Y.; Ding, S. Novel enhancement of energy distribution for marine hybrid propulsion systems by an advanced variable weight decision model predictive control. Energy 2023, 274, 127269. [Google Scholar] [CrossRef]
- Jia, C.; Qiao, W.; Qu, L. Modeling and control of hybrid electric vehicles: A case study for agricultural tractors. In Proceedings of the 2018 IEEE Vehicle Power and Propulsion Conference (VPPC), Chicago, IL, USA, 27–30 August 2018; pp. 1–6. [Google Scholar] [CrossRef]
- Jalil, N.; Kheir, N.A.; Salman, M. A rule-based energy management strategy for a series hybrid vehicle. In Proceedings of the American Control Conference (ACC), IEEE, Albuquerque, NM, USA, 4–6 June 1997; pp. 689–693. [Google Scholar] [CrossRef]
- Koyanagi, F.; Uriu, Y. A strategy of load leveling by charging and discharging time control of electric vehicles. IEEE Trans. Power Syst. 1998, 13, 1179–1184. [Google Scholar] [CrossRef]
- Huang, H.; Xu, Y.; Yang, Z.; Zhang, L. ECMS-based MPC strategy for multi-mode hybrid electric trucks. IEEE Access 2025, 13, 53241–53253. [Google Scholar] [CrossRef]
- Serrao, L. A Comparative Analysis of Energy Management Strategies for Hybrid Electric Vehicles. Ph.D. Thesis, The Ohio State University, Columbus, OH, USA, 2009. [Google Scholar]
- Hong, S.H.; Kim, D.M.; Kim, S.J. Power control strategy optimization to improve energy efficiency of the hybrid electric propulsion ship. IEEE Access 2024, 12, 22534–22545. [Google Scholar] [CrossRef]
- Yang, J.; Xu, X.; Peng, Y.; Deng, P.; Wu, X.; Zhang, J. Hierarchical energy management of a hybrid propulsion system considering speed profile optimization. Energy 2022, 244, 123098. [Google Scholar] [CrossRef]
- Hong, S.H.; Kim, D.M.; Kim, S.J. A back–forward approach-based efficiency performance analysis model for hybrid electric propulsion ships using the Holtrop–Mennen method. J. Mar. Sci. Eng. 2024, 12, 9. [Google Scholar] [CrossRef]
- Qin, F.; Xu, G.; Hu, Y.; Xu, K.; Li, W. Stochastic Optimal Control of Parallel Hybrid Electric Vehicles. Energies 2017, 10, 214. [Google Scholar] [CrossRef]
- Shi, S.; Lin, N.; Zhang, Y.; Cheng, J.; Huang, C.; Liu, L.; Lu, B. Research on Markov property analysis of driving cycles and its application. Transp. Res. Part D 2016, 47, 171–181. [Google Scholar] [CrossRef]
- Bishop, J.D.K.; Axon, C.J. Using natural driving experiments and Markov chains to develop realistic driving cycles. Transp. Res. Part D 2024, 137, 104507. [Google Scholar] [CrossRef]
- Qin, F.; Lin, J.; Zhao, Y.; Ren, B.; Ding, W.; Wang, F. A Markov chain-based method for driving cycle segment prediction of HEVs. In Proceedings of the 2024 Power System and Green Energy Conference (PSGEC), IEEE, Chengdu, China, 22–24 August 2024; pp. 519–523. [Google Scholar] [CrossRef]
- Hong, S.H.; Choi, S.B.; Kim, S.J. Hybrid energy management strategy based on neural networks robust to fluctuations in operational load. Ocean Eng. 2025, 316, 119937. [Google Scholar] [CrossRef]
- Maloberti, L.; Zaccone, R. An environmentally sustainable energy management strategy for marine hybrid propulsion. Energy 2025, 316, 134517. [Google Scholar] [CrossRef]
- Wang, Z.; Chen, L.; Wang, B.; Huang, L.; Wang, K.; Ma, R. Integrated optimization of speed schedule and energy management for a hybrid electric cruise ship considering environmental factors. Energy 2023, 282, 128795. [Google Scholar] [CrossRef]
- Sundström, O.; Guzzella, L. A generic dynamic programming Matlab function. In Proceedings of the 2009 IEEE International Conference on Control Applications (CCA), IEEE, St. Petersburg, Russia, 8–10 July 2009; pp. 1625–1630. [Google Scholar] [CrossRef]
Disclaimer/Publisher’s Note: The statements, opinions and data contained in all publications are solely those of the individual author(s) and contributor(s) and not of MDPI and/or the editor(s). MDPI and/or the editor(s) disclaim responsibility for any injury to people or property resulting from any ideas, methods, instructions or products referred to in the content. |
© 2025 by the authors. Licensee MDPI, Basel, Switzerland. This article is an open access article distributed under the terms and conditions of the Creative Commons Attribution (CC BY) license (https://creativecommons.org/licenses/by/4.0/).