1. Introduction
Boats intended for high-speed operations are usually designed using hard chines to stimulate water’s separation from the hull’s surface and thus improve their hydrodynamic performance. In addition, transverse and longitudinal steps are often implemented on the bottom of planing hulls (
Figure 1). Their main purpose is to minimize frictional drag by ventilating a significant fraction of the hull’s bottom surface with air. Designing and optimizing hulls with a complex bottom geometry and understanding complex multi-phase flow physics pose challenging tasks for naval architects and researchers working on novel high-speed hulls.
Bottom steps are usually utilized on faster and lighter hulls in comparison with stepless configurations. The initial systematic tests using stepped hulls were performed in the last century [
1,
2]. Linearized potential-flow methods have been implemented by several researchers to model stepless and stepped hulls [
3,
4,
5,
6]. In recent years, with a drastic increase in the available computational power, more comprehensive nonlinear viscous solvers have been applied to numerical simulations of planing hulls. For example, De Marco et al. [
7], Dashtimanesh et al. [
8], and Yang et al. [
9] carried out computational fluid dynamics (CFD) simulations using free-to-heave-and-pitch stepped hulls, while Bilandi et al. [
10] applied a 2D + T model to stepped configurations and compared the results using tow-tank tests. Du et al. [
11] explored the scale effect on the resistance of a stepped hull, whereas Zou et al. [
12] investigated the effect of stern flaps on the air-ventilated cavity formed behind a step. Husser and Brizzolara [
13] numerically studied the effects of the step sweep angle on the hydrodynamic characteristics of a planing hull. Park et al. [
14] conducted experiments and a detailed verification and validation (V&V) analysis for stepped hulls using single- and two-phase CFD solvers and discussed the differences between the two numerical approaches. Test data from a new systematic series of stepped hulls can be found in [
15]. Using side walls behind the bottom steps and forced air injection, it is also possible to generate air cavities in stepped hulls that are larger in size (a greater reduction in drag) and produce additional lift for the hull’s support [
16,
17]. Readers interested in a thorough review of studies on the hydrodynamics of planing hulls, including stepped hulls, can refer to an extensive review recently published by Tavakoli et al. [
18]. In most previous studies that have presented comparisons between experimental and computational results, the common metrics have involved hull resistance and attitude. While information about the numerical results for the air cavities formed behind steps was usually provided, no validation of this flow aspect was given, as no accurate test data were obtained for the air cavity features. This represents a knowledge gap that the current study aims to address.
In this work, several CFD simulations are carried out using the Star-CCM+ code, which is popular in the maritime community, to compare the computational results with the experimental data for recent well-controlled, well-documented tests on basic stepped hulls [
19] to understand whether air-ventilated water flow features, such as the dimensions of the cavities behind the steps and the associated hull drag, can be accurately simulated. In addition, several important geometrical changes in simple planing hull forms are numerically explored, including variations in the step sweep angle and the introduction of multiple steps, as well as shallow-water conditions, as these phenomena are insufficiently addressed in the literature. The present study is rather limited in scope and cannot be considered comprehensive, but its novelties, which include the validation of the performance of multi-step hulls and a shallow-water case, should be helpful for CFD users working on high-speed boats.
2. Materials and Methods
The computational fluid dynamics software Star-CCM+ (Siemens, Munich, Germany) version 15.04.008 [
20] was used in this study to model the flow of air and water around stepped planing hulls. A finite-volume viscous solver with a 2nd-order upwind convection scheme and 1st-order implicit time stepping was applied [
21]. The multi-phase treatment of constant-density water and ideal-gas air was realized through the volume-of-fluid (VOF) method and the high-resolution interface capturing (HRIC) technique. The governing equations employed by the solver within the Reynolds-Averaged Navier–Stokes (RANS) approach include continuity, momentum, and volume fraction equations:
where
are the Reynolds-averaged components of the flow velocity;
and
µ are the effective density and viscosity, respectively;
is the time;
are the spatial coordinates;
is the effective density;
is the pressure;
is the body (gravity) force;
represents the Reynolds stresses;
is air’s density; and
stands for the air volume fraction, so that the effective fluid density
and viscosity
µ are computed as
and
, where the subscripts
and
stand for air and water, respectively. The surface tension force is activated in the solver.
The Reynolds stresses are expressed through the Boussinesq hypothesis:
where
is the turbulent eddy’s viscosity, and
is the turbulent kinetic energy. To account for turbulent effects, the realizable
turbulence model [
22] was employed, as it was proven to work well in previous studies of the air-ventilated water flows in marine applications [
23,
24]. The two-layer all-Y+ method [
25] was used with near-wall Y+ values around 30–50 on wetted hull surfaces. The time step was chosen to keep the Courant number below one.
The governing equations for the turbulent kinetic energy
and the turbulent dissipation rate
in the realizable
model can be written as follows:
where
is the production of turbulent kinetic energy by the mean velocity gradients,
is the scalar invariant of the strain rate tensor
,
is the kinematic viscosity,
and
are the model coefficients, and
σk and
σε are the turbulent Prandtl numbers for
and
, respectively. The turbulent eddy’s viscosity is determined as follows:
where
depends on the turbulence properties and the mean flow [
26].
Although only the steady-state results are reported in this study, the unsteady solver was used with a time step of 3·10−4 s and 5 inner iterations at each time step. The simulations were run until the mean flow properties and hull forces stopped evolving.
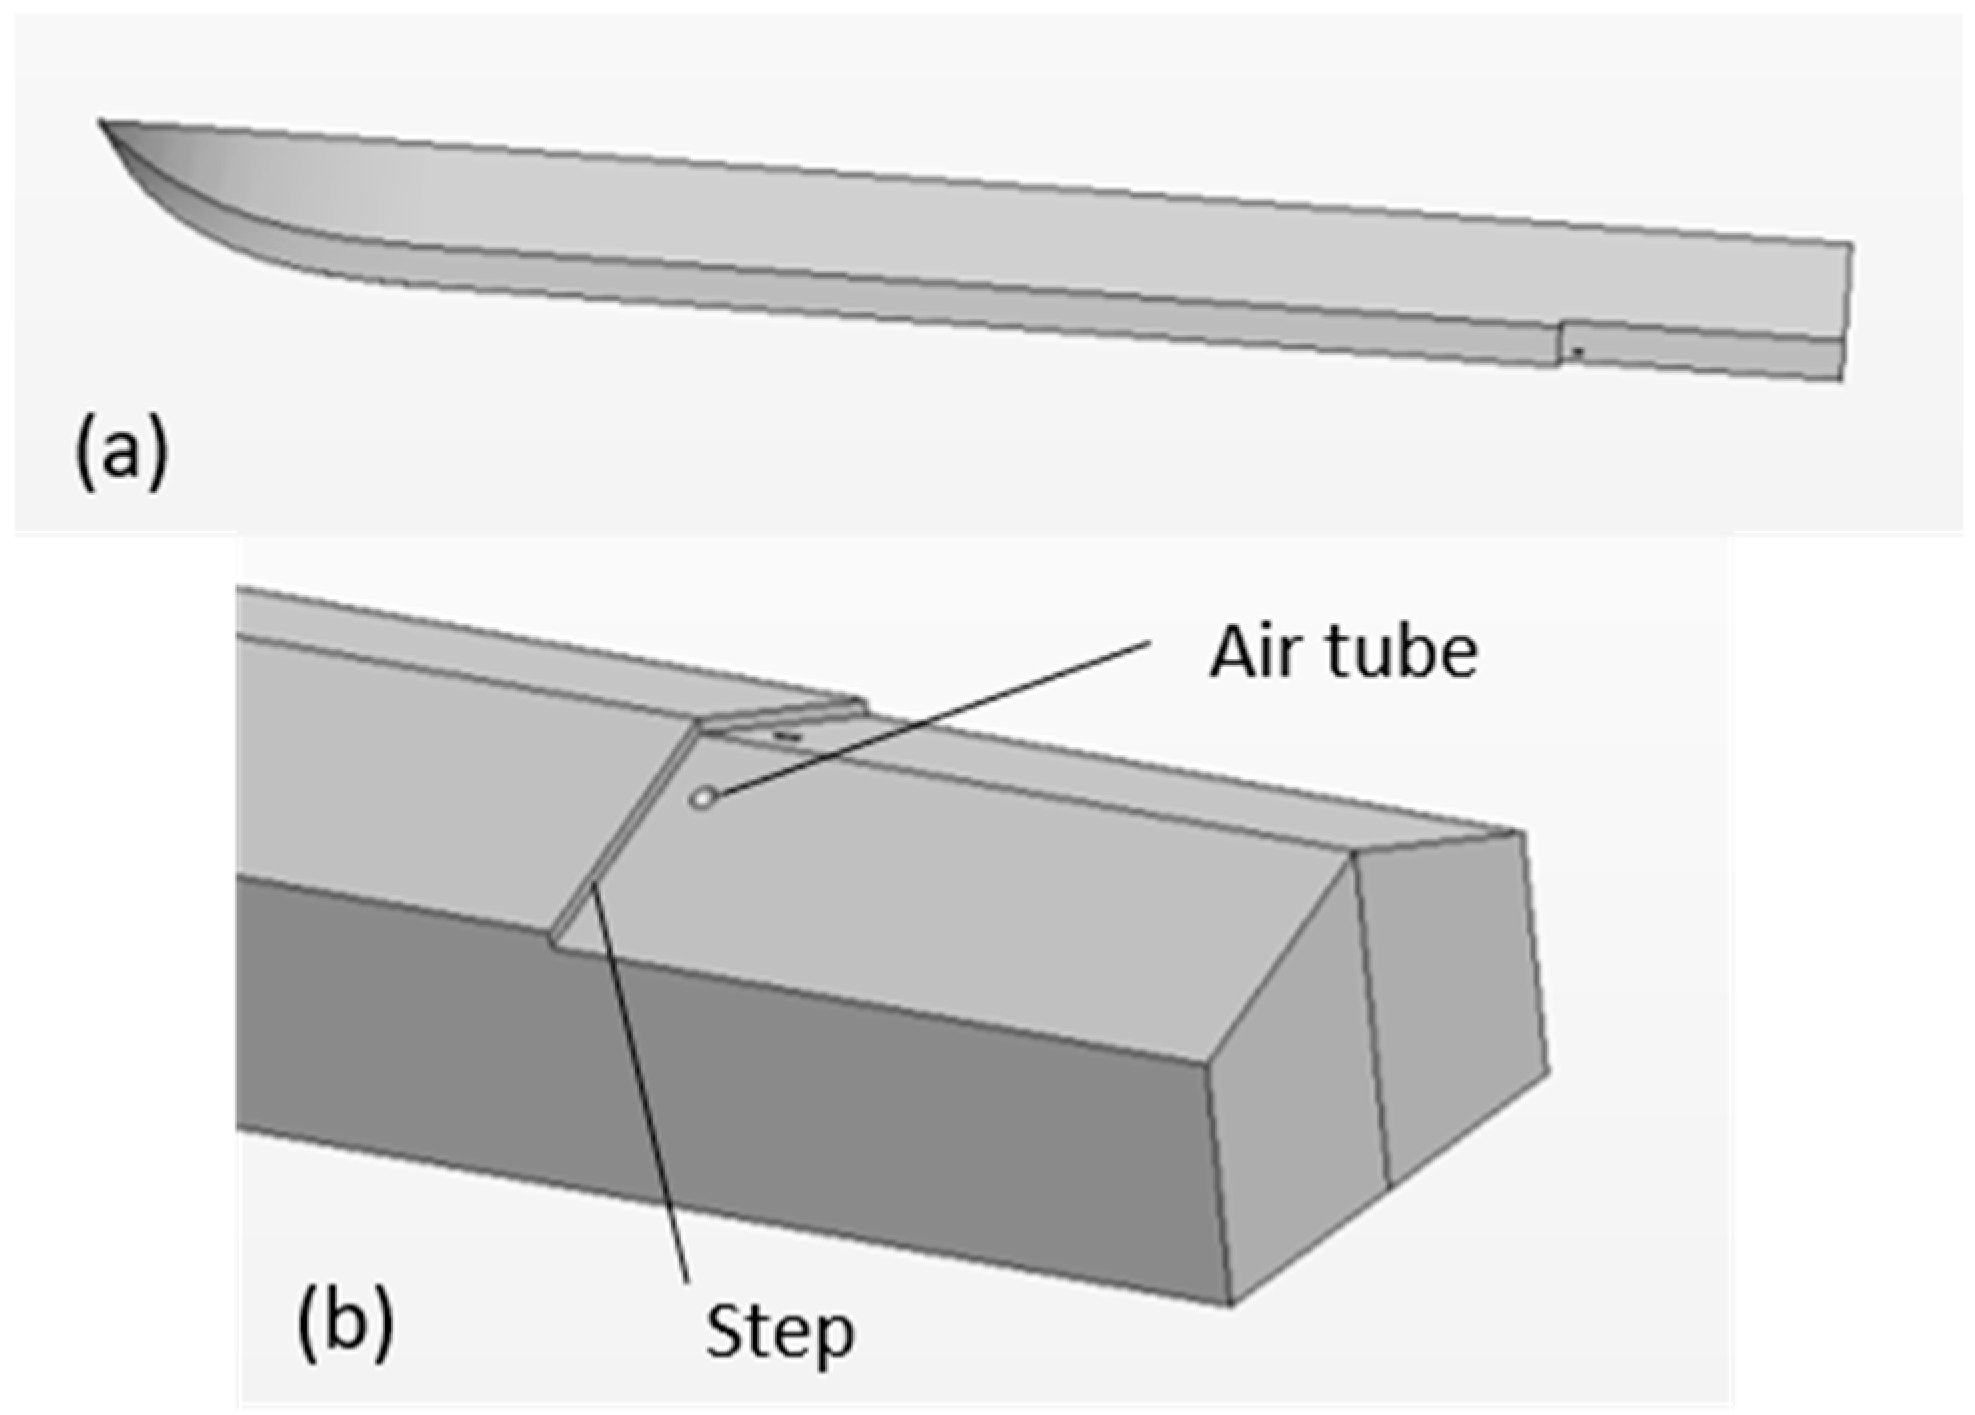
The prismatic 20°-deadrise hull geometry used in this study was taken from [
19] and is illustrated in
Figure 2. Although the aspect ratios of the stepped configurations were larger than the values common for planing boats (due to the attachment of stern blocks to create steps in the experiment), the wetted portions had realistic (smaller) aspect ratios. The overall length and beam of the single-step hull were 1.86 m and 22.9 cm, whereas the bottom steps were 6.3 mm in height. The stepped hull configurations also had tubes connecting the atmospheric air above the hull to the bottom surface behind the steps.
A numerical domain with dimensions of 28
b × 10
b × 6
b, where
b was the hull’s beam, was constructed with the symmetry plane at the hull’s centerline. This domain, together with the implemented boundary conditions, is shown in
Figure 3. The hull’s surface is treated as a non-slip wall, whereas the top, bottom, and starboard boundaries of the domain are represented by slip walls, and the upstream and downstream boundaries are considered as the velocity inlet and the pressure outlet, respectively. A wave damping zone of a 0.5 m length is introduced near the outlet boundary.
A trimmed numerical mesh involving mainly hexahedral cells was constructed in the entire domain, and refinement zones were implemented near the hull and around the free water surface (
Figure 4). An even denser numerical grid was built near and behind the steps where air-ventilated cavities were expected to appear. The default target cell size on the hull’s surface is about 0.8 cm, while on the bottom of the hull in contact with water, it is refined down to 0.4 cm, and in the step region, it decreases to 0.2 cm. Mesh cells expand several times away from the hull toward the domain boundaries. In the free surface region, the longitudinal and vertical cell dimensions are about 3 cm and 0.8 cm, respectively. In addition, 9 prism layers are built in the fluid around the hull’s surface, with a thickness for the near-wall layer of 0.4 mm and an overall prism layer thickness of 1 cm. In one shallow-water case discussed below, an additional extended mesh refinement zone with 0.3 cm cells was added under the hull (
Figure 4c) to capture the more complex flow features in this situation.
To estimate the numerical uncertainties, a mesh dependency study was carried out for the one-step hull configuration, as shown in
Figure 2. Simulations conducted using three numerical grids (coarse, medium, and fine) produced the results listed in
Table 1 for the hull lift–drag ratio and the air cavity length behind a step, which are important metrics of a stepped hull’s performance. The Richardson extrapolation was applied to finding the expected corrections
to the solutions on the fine mesh [
21]:
where
is the solution difference between the fine and medium grids,
is the solution difference between the medium and coarse grids,
is the refinement ratio for the numerical cells, and
is the observed order of accuracy. After this, safety factors are applied to
to calculate the numerical uncertainties [
27], which are given in
Table 1 for the air cavity length and the lift–drag ratio. All subsequent simulations in this study were accomplished using the fine mesh, with approximately 2 million cells for the single-step hull and even higher cell counts in multi-step setups.
In the next section, the simulation results are presented for several modifications to the stepped hulls, including two-, three-, and four-step arrangements, swept steps (with a sweeping angle between −20° and +40° covering the range used in practice), and one shallow-water condition (with the depth of water being 0.75 of the hull’s beam). Schematics of the multi-step hulls are given in
Figure 5. The distances between the steps are 30 cm, 25 cm, and 20 cm for the 2-, 3-, and 4-step hulls, respectively. These spacings are selected to maintain approximately the same wetted hull area in front of the first step and to keep a similar flow pattern around it. The same mesh settings were used for multi-step configurations as those for the single-step setup, while in the shallow-water case, additional refinement was implemented under the hull (
Figure 4c).
3. Results and Discussion
To determine how well CFD simulations could represent the air-ventilated flows under a stepped hull, a sub-set of the cases tested and documented by Ricks et al. [
19] was selected for the present validation study. The three modeled configurations included the following: (1) stepless, (2) single-step, and (3) double-step hulls. The beam-based Froude number was about
, while the beam-based loading coefficient was
, where
is the incident flow velocity,
is the gravitational acceleration,
is the hull’s beam,
is the hull’s weight, and
is the specific weight of water. The distance between steps was 30 cm or 1.31 of the beam’s size. The trim angle was around 4°, and the vertical position of the hull in the simulations was iteratively adjusted to match the lift force to the hull’s weight. As a consequence, the wetted lengths at the keel and submergences are different for the three hulls with a different number of steps.
The main metrics for comparing the test data and numerical results were chosen to be the lift–drag ratio (
LDR) and the air cavity lengths at the keel and chine that were measured in experiments by Ricks et al. [
19]. These data are summarized in
Table 2, while the water volume fractions and the distribution of the pressure coefficients obtained in the CFD simulations are illustrated in
Figure 6 and
Figure 7. Due to the unsteady and multi-phase nature of the cavity boundary near the chine (
Figure 6), a range of lengths is reported for this numerically obtained dimension in
Table 2.
The differences in the lift–drag ratio between the test data and the numerical results are within 8–15%, which are common in modeling planing hulls in high-speed regimes [
28]. This underprediction of drag is likely caused by an insufficiently accurate resolution for water spray and the minor appearance of so-called numerical ventilation when a fraction of air is entrained in the vicinity of wetted hull surfaces [
23]. No artificial suppression of this computational artifact (e.g., by replacing air with water) was attempted in this study. As one can see in
Figure 6, the effective keel wetted lengths increase with an increasing number of steps, and so do the hull submergences. However, the double-step hull has visibly smaller wetted areas (
Figure 6) and thus higher lift–drag ratios
in both the experimental and numerical results (
Table 2). The larger sinkages of the hulls with a higher number of steps also increase the pressure on the deeper portions of the hull, which is reflected in the larger pressure coefficients in the impingement areas behind the steps (
Figure 7).
The lengths of the air cavities behind the steps obtained numerically agree reasonably well with the experimental findings (
Table 2). The average cavity length values are slightly larger in the CFD simulations, which is consistent with the higher numerically predicted
LDRs. The wetted sections behind the steps show the presence of narrow air strips (
Figure 6), which were also visible in experimental photographs [
19]. The pressure coefficients exhibit the maximum values on the wetted surface behind the steps, where the water flow initially separated from the upstream steps impinges on the hull’s surface (
Figure 7). The double-step setup has smaller wetted sections, while the stepless and single-step hulls have larger wetted zones with lower pressure coefficients (
Figure 7), which is consistent with the higher
LDRs for the double-step system.
An illustration of the water surface deformations, as seen from above and below the water’s surface, is shown in
Figure 8 for a single-step hull. Typical for planing hulls, the wave hollow behind the hull transom and pronounced waves on the hull sides are clearly visible. The wetted hull sections noticeable in the underwater view (
Figure 8) are consistent with the image of the water fraction of this hull in
Figure 6.
One of the parametric simulations conducted in this study involved variations in the sweep angle of the step on otherwise the same single-step hull operating in the same conditions (e.g., Froude number, loading coefficient, trim angle) as those in the validation study. The selected sweep angles are −20°, 0°, 20°, and 40°. The water fraction and pressure coefficient distributions on the bottom of these hulls are shown in
Figure 9 and
Figure 10, while the corresponding dependence of the lift–drag ratio on the sweep angle is given in
Figure 11. A positive sweep (i.e., when the step at the chine is shifted forward, while the step at the keel is moved aftward) allows air to more easily ventilate the hull’s surface behind the step, whereas a negative sweep discourages this process (
Figure 9). Also, the wetted area of the hull shows a lower pressure with a decreasing sweep angle. These effects result in a higher lift–drag ratio with a larger forward sweep, as shown in
Figure 11. It can be noted that forward-swept steps have been implemented on the hulls of many hydrofoil boats, allowing them to maximize the hull’s
LDRs during the transition to foilborne mode.
Due to the better hydrodynamic performance demonstrated by the double-step hull in the studied regime in comparison with that of the stepless and single-stepped hulls (
Table 1), additional numerical simulations were carried out using three and four steps. One motivation was to try to reduce the wetted hull’s surface area in front of the steps. The distance between steps was chosen to be 25 cm and 20 cm for the three- and four-step configurations (it was 30 cm in the double-step setup). Again, the same operational conditions were utilized as those in the validation cases (for the Froude number, loading coefficient, and trim angle).
The lift–drag ratio values were found to be substantially higher, 6.53 and 6.61 for the three- and four-step hulls, respectively, in comparison with the
LDR = 6.08 for the double-step setup. The water fraction and pressure coefficient distributions on the bottom of the multi-step hulls are shown in
Figure 12 and
Figure 13, demonstrating further reductions in the wetted areas consistent with higher
LDRs, as well as increasing pressure coefficients in the impingement areas behind the steps due to deeper submergence. The hull sinkages and keel wetted lengths are different (and higher for the four-step hull), as these parameters are determined to keep the loading coefficient the same. One can note that in some cases, the wetted areas behind the steps do not extend to the chines, and these wetted areas generally decrease in size with an increasing number of steps (
Figure 12). The shapes of the wetted sections and the locations of the pressure coefficient maxima (
Figure 13) become complicated, such as the region behind the second step on the four-step hull, showing separate water impingements.
Multi-step hulls are usually used on very fast planing boats, as well as on hydrofoil and wing-in-ground-effect craft to ease the take-off from water for their hulls. The present study, although it is rather limited in terms of the scope of the variable parameters, demonstrated the multi-step hull’s advantage at the speed considered. However, one has to bear in mind that such hulls would experience larger drag at lower speeds, when the hull surfaces behind the steps were not yet ventilated, whereas at higher speeds, some steps would lose contact with water. Thus, the present study is of most relevance to moderate but still planing speeds for fast marine vehicles.
One more simulation was conducted with the water’s finite depth equal to 0.75 of the hull’s beam. In this case, the seafloor was treated as one of the domain boundaries for the velocity inlet condition, ensuring a constant speed of the seafloor relative to the hull. This condition is commonly used to model wings operating in ground effect [
29]. The selected regime corresponds to the supercritical regime with a depth-based Froude number above 4. For greater water depths, e.g., when the depth-based Froude number is around 1 (the so-called critical case), the hydrodynamic effects of the finite depth would be minimal for the given beam-based Froude number. (Lower speeds would be required to observe strong shallow-water effects.) The lift–drag ratio for the hull in this shallow-water situation is 6.51, which is noticeably greater than the value of 6.08 obtained for deep water. This finding is associated with the general increase in the pressure under lifting surfaces moving in the vicinity of a more rigid medium, known as the ground effect [
29]. Illustrations of the water volume fraction and the pressure coefficient on the hull’s surface are given in
Figure 14. To support the same load, the hull settles at a higher elevation, which results in reduced wetted areas in the front part of the hull and behind the first step (
Figure 6 and
Figure 14). The pressure coefficient reaches higher values behind two steps in shallow water (
Figure 7 and
Figure 14), as the hull surfaces are closer to the sea bottom wall, which blocks the downward flow of water and leads to more pronounced flow stagnation under the bottom of the hull.
4. Conclusions
The CFD software Star-CCM+, commonly used for multiphase applications in the maritime industry, was applied in this study to simulating the hydrodynamics of prismatic stepped hulls with an economical mesh density. The agreement with the experimental data is deemed reasonable, with the drag being underpredicted and the air cavity length being overpredicted by roughly 10%. Possible reasons for this discrepancy include using simplified RANS modeling of the turbulence, the use of a mesh density insufficient to resolve small bubbles and droplets, and numerical ventilation, which retains more air along the wetted surface areas of the hull in computational simulations relative to experiments. However, the trends in the variation of the ventilated zones are captured well.
Additionally, configurations with variable step sweep angles, multi-step setups, and a two-step hull in shallow water were investigated numerically. In the conditions studied, it was found that the forward sweep angle and the larger number of steps help increase the sizes of the air-ventilated zones and boost the hull lift–drag ratios. In the shallow-water case, the increased pressure on the rear portions of the hull resulted in a higher hull elevation with lower wetted surfaces and thus greater lift–drag ratios.
For future work in this field, it is suggested to explore other geometrical variations in the hull and different loadings, speeds, sea states, and maneuvering regimes. To achieve better agreement between the test data and the numerical results, one may attempt to use much denser meshes for better resolution of the boundary layer effects and small air bubbles. However, such simulations will be of high computational cost, while the development of models for turbulent multi-phase and surface flows is still an active research area.


