Article

Effects of Nutrients on the Phytoplankton Community Structure in Zhanjiang Bay

1
College of Fisheries, Guangdong Ocean University, Zhanjiang 524088, China
2
College of Ocean and Meteorology, Guangdong Ocean University, Zhanjiang 524088, China
3
Key Laboratory of Marine Ecosystem Dynamics, Second Institute of Oceanography, Ministry of Natural Resources, Hangzhou 310012, China
*
Author to whom correspondence should be addressed.
J. Mar. Sci. Eng. 2025, 13(7), 1202; https://doi.org/10.3390/jmse13071202
Submission received: 17 May 2025 / Revised: 11 June 2025 / Accepted: 19 June 2025 / Published: 20 June 2025
(This article belongs to the Section Chemical Oceanography)

Abstract

:
With rapid economic and social development, eutrophication in coastal areas is currently one of the most severe environmental problems worldwide. However, our understanding of the response of the phytoplankton community structure to the intensification of coastal eutrophication is still relatively limited. Here, seasonal phytoplankton, environmental factors, and nutrients were investigated in 2009 and 2019 in Zhanjiang Bay, where eutrophication has intensified in recent years, to analyze the variation in nutrient structure and its impact on the phytoplankton community. The results revealed that the DIP and DSI concentrations in 2019 were higher than those in 2009. However, dissolved inorganic nitrogen (DIN) has decreased substantially over the past several decades, which is due mainly to the decrease in anthropogenic nitrogen emissions, the substantial increase in the intrusion of high-salinity seawater, and the high-phosphorus wastewater discharged from urban industries. This resulted in a decrease in phytoplankton cell abundance, phytoplankton composition, and species diversity (H′) in 2019 compared with 2009. In addition, the superior N transport, storage, and response strategy to a low N supply of diatoms, especially Skeletonema and Chaetoceros, might benefit the growth of diatoms under low DIN conditions. The lower DIN/DIP ratio in 2019 favored the growth of diatoms, especially Skeletonema and Chaetoceros, leading diatoms to dominate the phytoplankton assemblage. This study demonstrates how changes in nutrient structure alter the community structure of phytoplankton, providing new insights into deepening our understanding of eco-environmental evolution.

1. Introduction

Phytoplankton are crucial for aquatic ecosystem biology, as they are the primary producers of the aquatic food chain, are an oxygen supplier in water, and act as absorbers of atmospheric carbon dioxide [1]. The phytoplankton community is closely related to environmental factors, which directly or indirectly affect the temporal variation characteristics of the plankton community structure [2]. Phytoplankton have a short growth cycle and rapid response to changes in the marine environment [3], thus playing a crucial role in biogeochemical cycles by mediating the cycles of essential nutrients, including nitrogen and phosphorus [4]. Exploring the temporal dynamics of the phytoplankton community structure and its influencing factors is crucial for maintaining the balance of the marine ecosystem.
Increased anthropogenic nutrient inputs in many coastal areas have led to severe eutrophication problems, which have increased the phytoplankton species composition and harmful algal blooms [5]. Under the dual pressures of climate change and human activities, eutrophication in coastal areas has intensified, and the structure of nutrients has changed, which has inevitably altered the phytoplankton community and eco-environment in coastal areas [6,7]. Zhanjiang Bay is located northwest of the South China Sea (SCS), with an area of 264.9 km2. It is a subtropical sea area surrounded by Donghai Island, Nansan Island, and Naozhou Island. The waters have diverse habitats and complex biota. It is a famous mariculture base in South China, a region that produces and exports maricultural products in China [8]. In recent years, affected by intense human activities, the eco-environment of Zhanjiang Bay has gradually deteriorated [9,10,11,12,13], particularly due to eutrophication in the bay [11,13,14]. Additionally, the runoff from rivers around the bay can directly import living and agricultural nutrients into Zhanjiang Bay [10]. However, only a narrow channel (the width of the bay is approximately 2 km in the bay mouth) connects it to the SCS. The hydrodynamic conditions of Zhanjiang Bay are weak, which is not conducive to the diffusion of pollutants [15]. Therefore, the degree of eutrophication in Zhanjiang Bay has increased significantly, and the nutrient structure has changed significantly [13]. In addition to land-based inputs, changes in the hydrodynamics of Zhanjiang Bay are also important factors contributing to this prominent issue. Owing to human activities such as dredging and dam construction, the amount of high-salinity seawater invading Zhanjiang Bay has increased [12]. This, combined with freshwater input from rivers, can form a stronger salinity front. The barrier effect of the oceanic front intensifies the accumulation of pollutants in the bay [16]. Therefore, Zhanjiang Bay is an ideal area for studying the effects of nutrient structure changes on phytoplankton community structure. The main objectives of this study are (1) to analyze the variations in nutrients and phytoplankton in Zhanjiang Bay between the year 2009 and the year 2019 and (2) to reveal the effects of nutrient structure changes on phytoplankton cell abundance, species composition, and phytoplankton community structure. Our study is important for studying long-term changes in the ecological environment and supporting the reasonable protection and utilization of its natural resources.

2. Materials and Methods

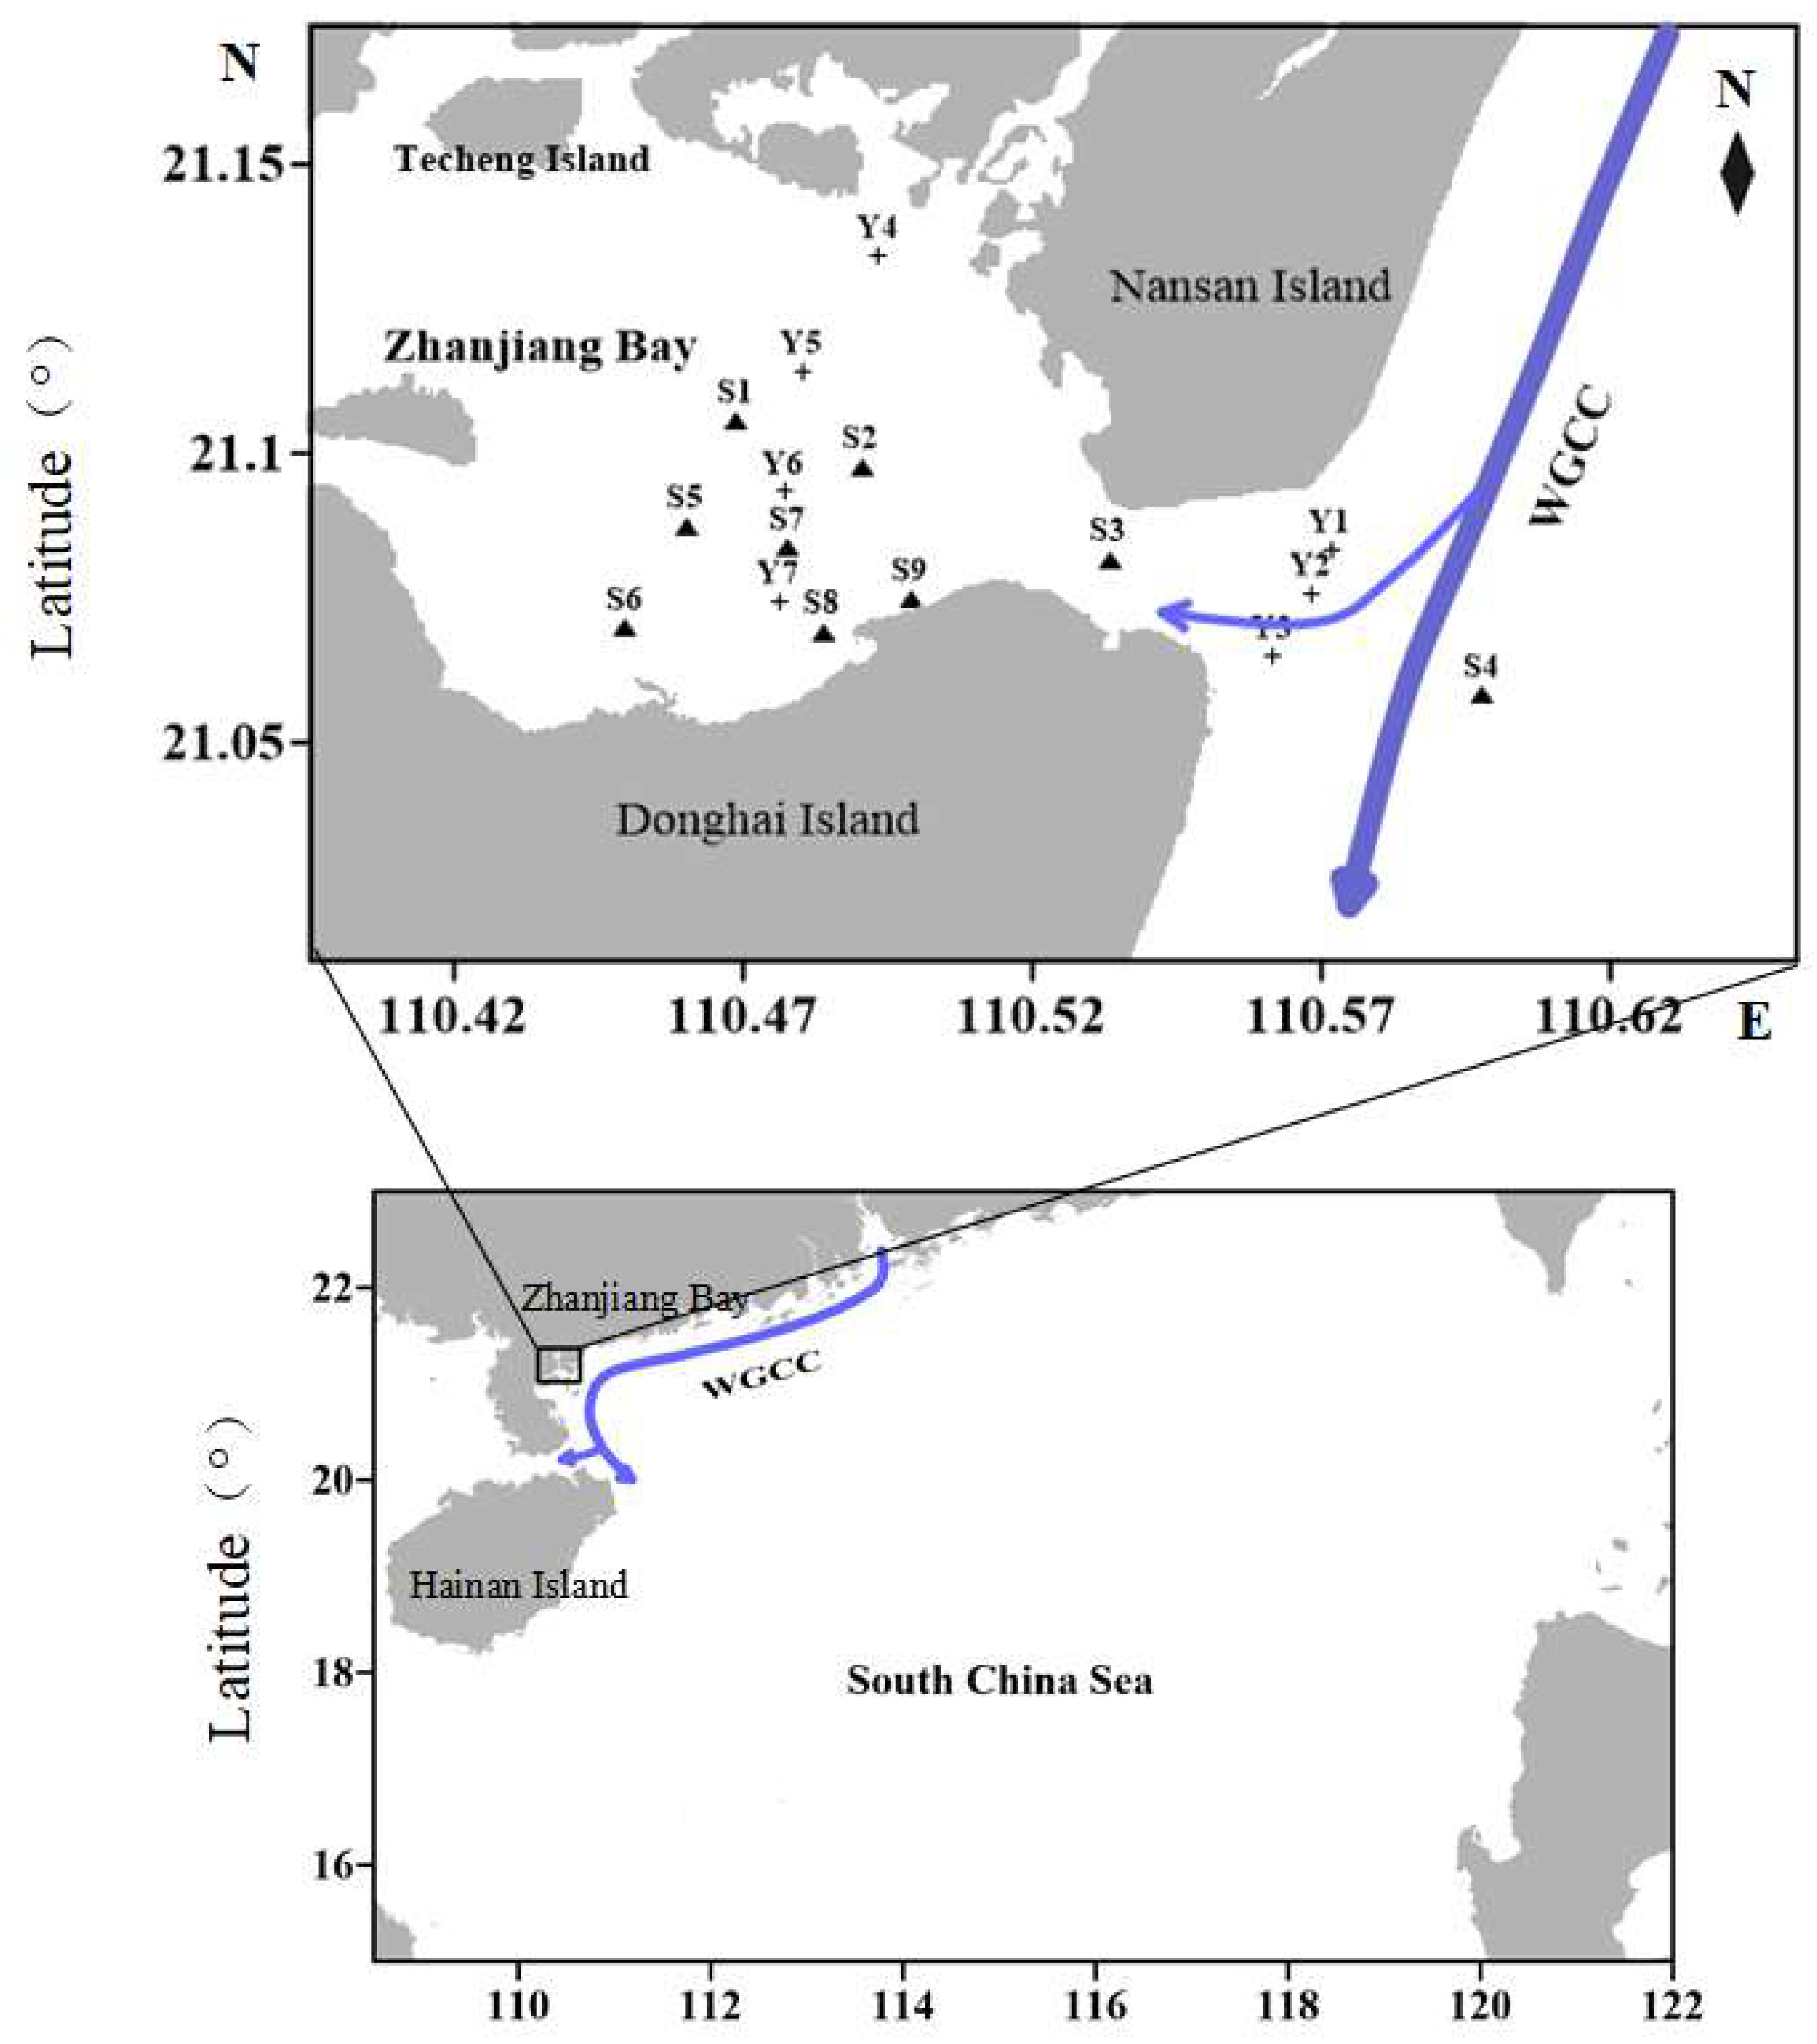
2.1. Study Area and Sample Analysis

The study area is located in the lower bay of Zhanjiang Bay, Guangdong Province. Zhanjiang Bay is a typical semiclosed bay. The West Guangdong Coastal Current (WGCC) affects the seawater in Zhanjiang Bay [12]. The WGCC has higher salinity in the outer bay (the northwestern SCS) and transports these waters into the bay via a narrow channel [12] (Figure 1). The samples were collected in all four seasons. In 2009, surveys were conducted in February (winter), May (spring), August (summer), and November (autumn), and a total of seven survey stations were set up (Figure 1, Y1–Y7). During 2019–2020, the samples were collected in October 2019 (autumn), January 2020 (winter), April 2020 (spring), and July 2020 (summer), with a total of 9 survey stations deployed (Figure 1, S1–S9). In this study, we define the period from October 2019 to July 2020 as 2019.
The samples were collected by a vertical haul from the bottom (0.5 m) to the surface with a shallow water type III net to identify the phytoplankton community at each station. Water samples for phytoplankton analysis were collected in 1 L polyethylene bottles and immediately fixed by adding Lugol’s solution and 5% formaldehyde. The samples for phytoplankton analysis were allowed to settle for 24 h. Then, they were concentrated to 50 mL via gentle aspiration of the supernatant. The abundance of phytoplankton species was then determined in 1 mL samples using a microscope (Olympus Model BX51, Olympus Corporation, Hachioji, Japan). Each sample was counted twice. Phytoplankton abundance was averaged over two chambers, and the total number of organisms per ml of water was calculated.
The temperature and salinity were measured using an RBR maestro multiparameter water quality monitor (RBRmaestro3, RBR, Ottawa, ON, Canada). The pH was measured onsite with a pH meter (Thermo Model 868, Thermo Scientific, Waltham, MA, USA). Chla was extracted with 90% acetone and determined spectrophotometrically. The concentrations of nutrients, including nitrate (NO3), nitrite (NO2), phosphate (PO43−, DIP), and silicate (Si2O3, DSI), were determined via the colorimetric method using a San++ continuous flow analyzer (Skalar, Breda, The Netherlands). The ammonium (NH4+) concentrations were determined by spectrophotometry after treatment with Nessler’s reagent. The NO3 concentrations were determined using the cadmium–copper reduction method. The Si2O3 concentrations were determined using the silicon molybdate blue method. The PO43− concentrations were determined using the phosphomolybdate blue method. The inorganic nitrogen (DIN) concentrations were determined from the sum of the nitrite, nitrate, and ammonium nitrogen concentrations (DIN = NO3 + NO2 + NH4+). The dissolved inorganic phosphorus (DIP) concentration was determined from the phosphate (DIP = PO43−). The dissolved inorganic silicon (DSI) concentration was determined from the silicate (DSI = Si2O3).

2.2. Data Analysis

The Shannon-Wiener index (H′) was used to describe the characteristics of plankton biodiversity [17], and the computational formulas were as follows:
H = i = 1 S P i ( log 2 P i )
P i = n i / N
The dominance indices for each given species were calculated using the following equation [18]:
Y = n i / N × f i
For these equations, Pi is the relative abundance of a species; ni is the number of individual species i; N is the total number of individuals in all the samples; S is the total number of plankton species in the samples; and fi is the frequency of occurrence of species i in the samples.

2.3. Statistical Analysis

The differences between the parameters in the two groups (2009 and 2019) were analyzed by Student’s t-test in SPSS 27.0. Before using Student’s t-test, a one-way ANOVA was conducted to determine whether the data had homogeneous variances (F-test). Correlation analysis was also carried out using SPSS 27.0.
PCA was performed using Origin 2024 software and SPSS 27 software. The number of principal components was determined based on eigenvalues greater than 1.0, which indicate the variance explained by each principal component [19]. The KMO test measures the degree of interrelationships among variables, with values closer to 1 indicating greater adequacy for factor analysis; a minimum value of 0.5 is required to proceed with the analysis. The KMO values for 2009 and 2019 were 0.625 and 0.607, respectively, indicating that the sampled data were suitable for factor analysis.

3. Results

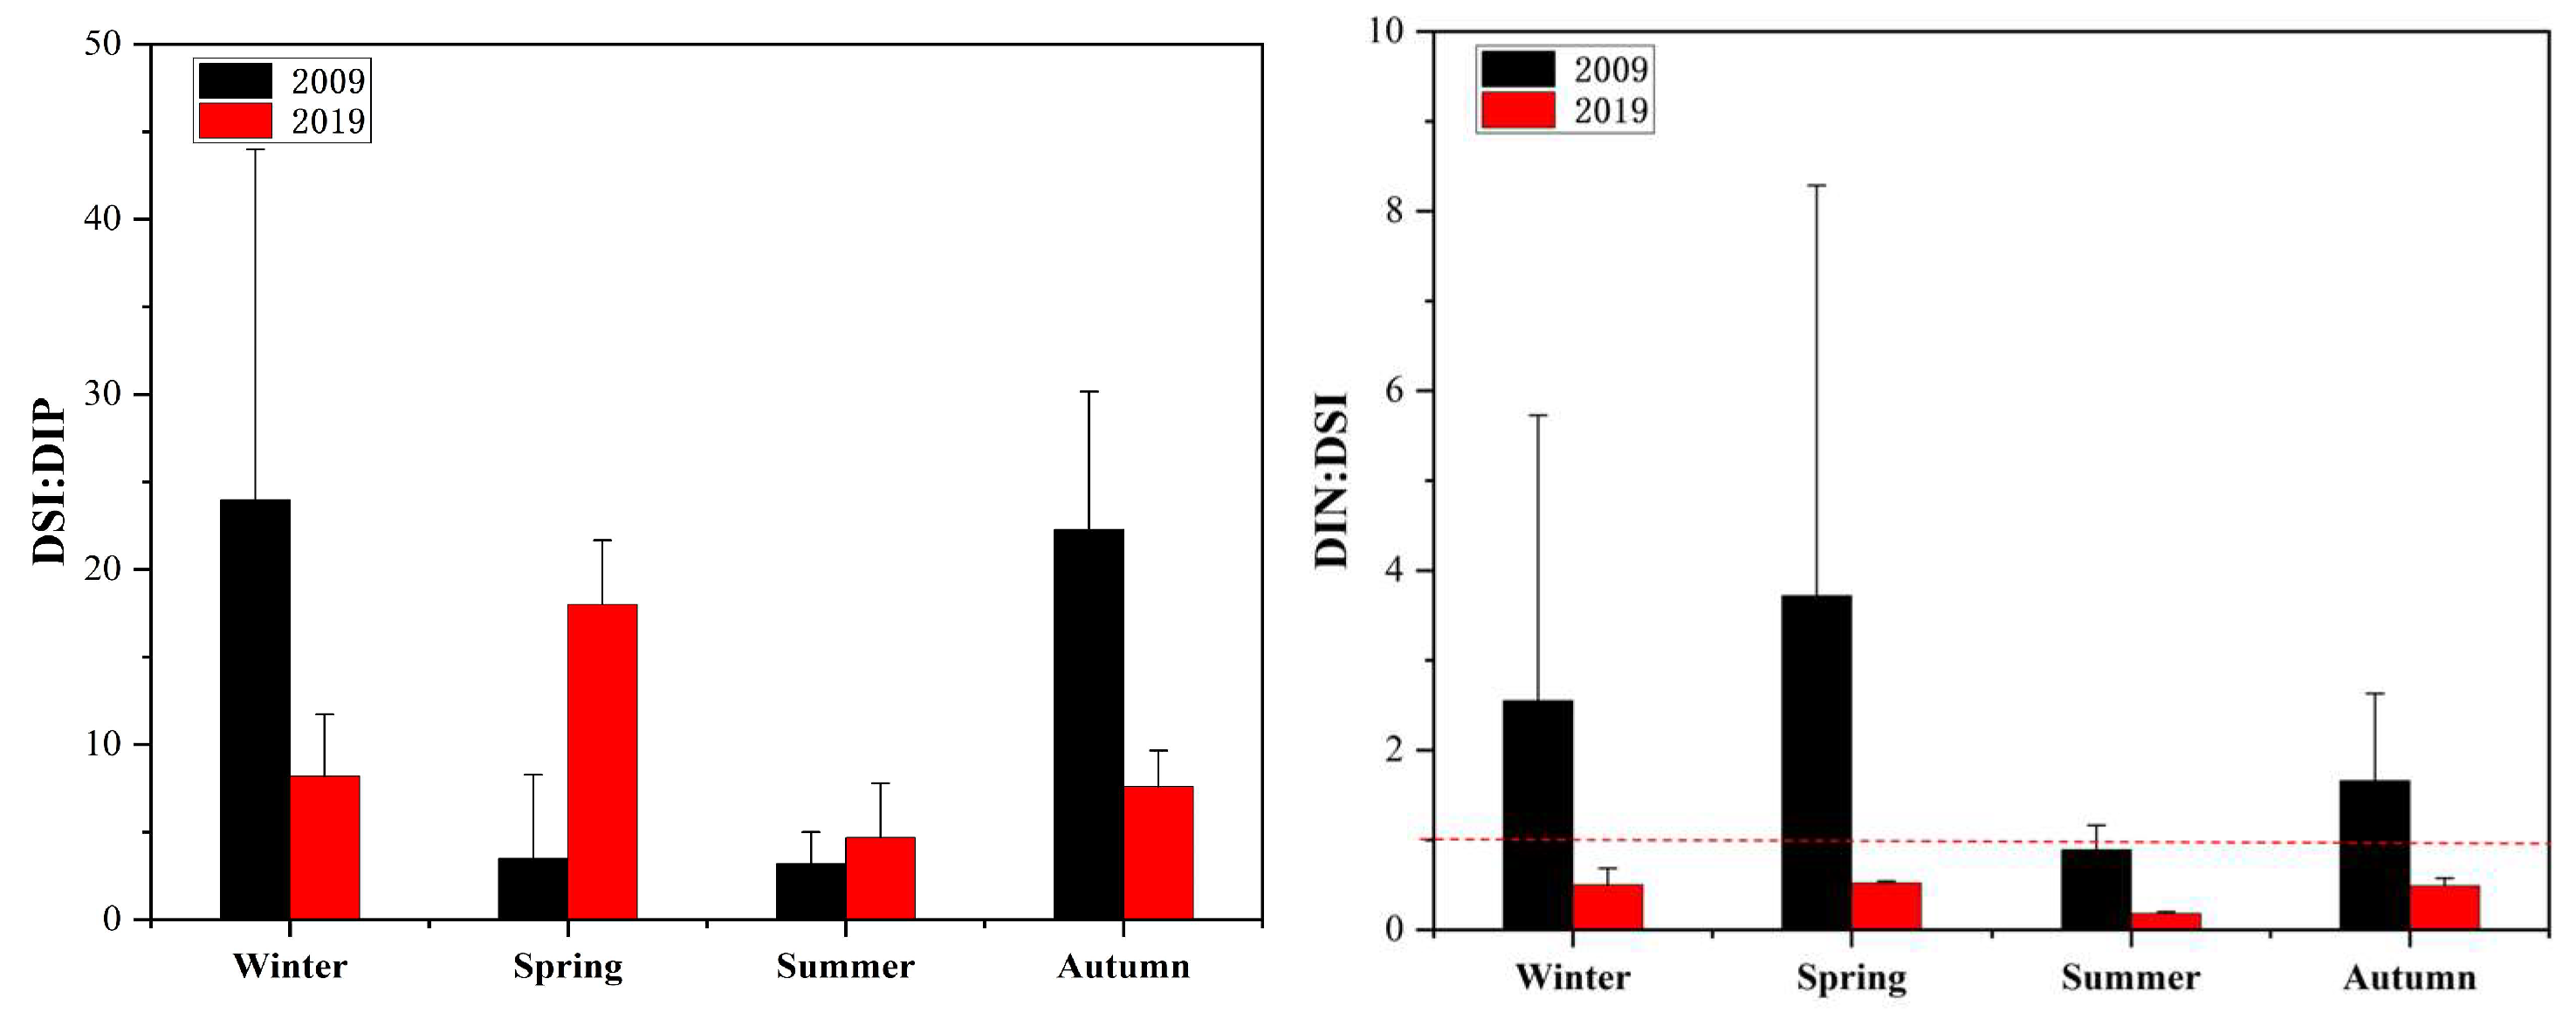
3.1. Variations in Environmental Factors

In 2009, the surface water temperature varied greatly (from 21.7 °C to 30.4 °C, average of 26.1 °C) in Zhanjiang Bay during the sampling period. The salinity was relatively high and uniform (from 27.41 to 28.76, average of 28.34). The pH ranged from 8.07 to 8.25 (average of 8.15), and the chlorophyll a (Chla) concentrations ranged from 6.00 to 9.11 μg/L (average of 7.95 μg/L). The nutrient concentrations ranged from 0.130 to 0.630 mg/L (average of 0.302 mg/L) for DIN, 0.012 to 0.050 mg/L (average of 0.024 mg/L) for DIP, and 0.158 to 0.384 mg/L (average of 0.247 mg/L) for DSI. The DIN/DIP, DSi/DIP, and DIN/DSi ratios ranged from 3.0 to 25.4 (average of 16.9), 3.2 to 24.0 (average of 13.2), and 0.89 to 3.72 (average of 2.21), respectively. The t-test showed a significant difference in DIN between 2009 and 2019 in summer (t = 2.316, p < 0.05).
The variations in temperature and salinity in 2019 were similar to those in 2009. In 2019, the temperature of the surface water varied from 22.2 °C to 30.1 °C, with an average of 25.6 °C. The salinity ranged from 26.9 to 32.8, with an average of 28.52. The pH slightly decreased, ranging from 7.93 to 7.97 (average of 7.96). The Chla concentrations decreased, ranging from 3.21 to 5.20 μg/L (average of 4.08 μg/L). With respect to nutrients, except for a decrease in DIN, the concentrations of the other nutrients increased. The nutrient concentrations ranged from 0.040 to 0.349 mg/L (average of 0.196 mg/L) for DIN, 0.025 to 0.063 mg/L (average of 0.043 mg/L) for DIP, and 0.175 to 0.666 mg/L (average of 0.399 mg/L) for DSI. The DIN/DIP, DSi/DIP, and DIN/DSi ratios decreased, ranging from 1.8 to 9.7 (average of 4.6), 4.7 to 18.0 (average of 9.2), and 0.18 to 0.52 (average of 0.45), respectively. Table 1 shows the variations in environmental factors in 2009 and 2019. Figure 2 shows the seasonal variations in the environmental factors in Zhanjiang Bay.

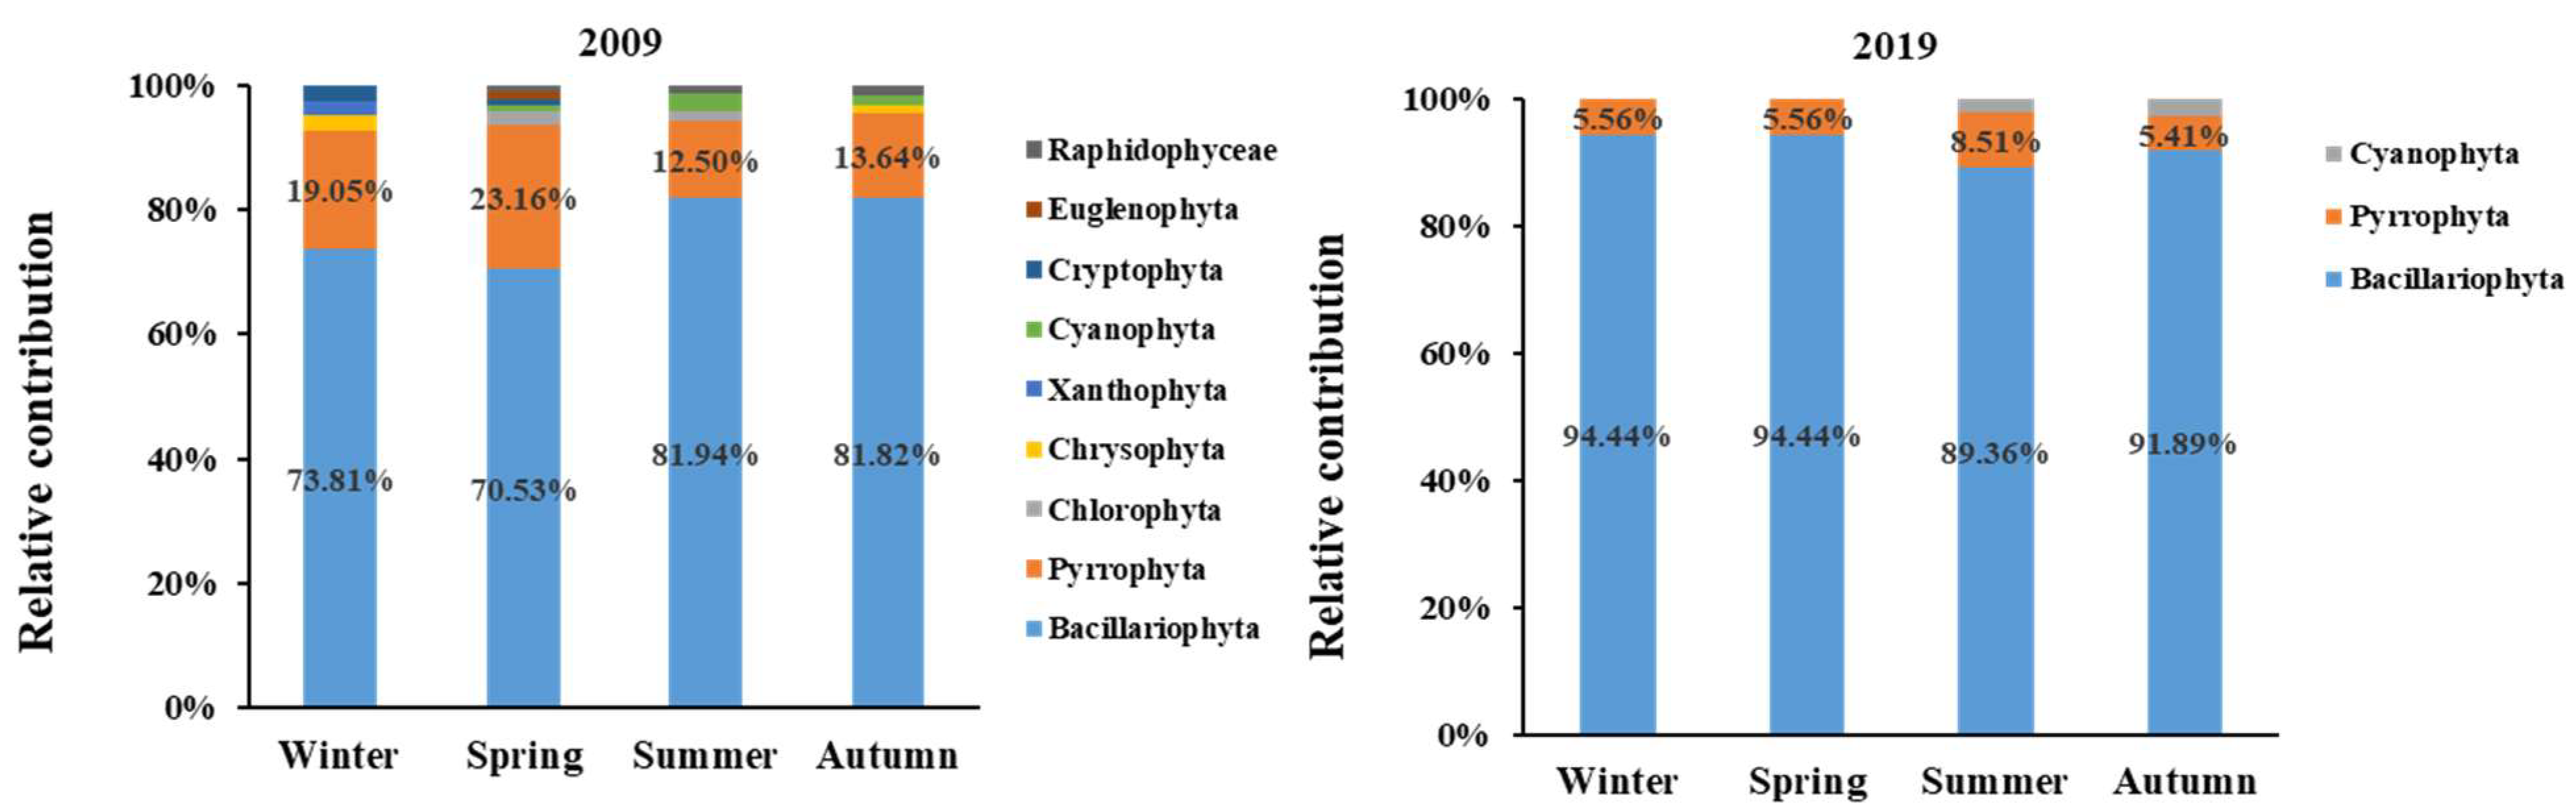
3.2. Variations in the Species Composition of Phytoplankton

From our investigation of the phytoplankton species composition of Zhanjiang Bay from October 2019 to August 2020, a total of 66 phytoplankton taxa belonging to 35 algal genera and three phyla were identified. Among them, 58 species and 29 genera of Bacillariophyta, seven species and five genera of Pyrrophyta, and 1 species and 1 generation of Cyanophyta were identified. Diatom taxa accounted for 87.88% of the total phytoplankton during the research period, followed by Pyrrophyta algae accounting for 10.61% and blue-green algae accounting for 1.51%.
From the investigation of the phytoplankton species composition of Zhanjiang Bay from February 2009 to November 2009, a total of 179 phytoplankton taxa belonging to nine phyla were identified. Among them, 126 species of Bacillariophyta, 40 species of Pyrrophyta, three species of Chlorophyta, four species of Cyanophyta, one species of Euglenophyta, one species of Cryptophyta, one species of Chrysophyta, one species of Raphidophyceae, and one species of Xanthophyta were identified. Diatom taxa accounted for 70.39% of the total phytoplankton during the research period, followed by Pyrrophyta algae accounting for 22.35%, blue-green algae accounting for 2.23%, and green algae accounting for 1.68%. Euglenophyta, Cryptophyta, Chrysophyta, Raphidophyceae, and Xanthophyta accounted for less than 1% of the total.
The phytoplankton species composition and the percentage of each algal group that contributed to phytoplankton in the different seasons are shown in Figure 3. In 2009, the total number of phytoplankton species was highest in spring (95 species) and lowest in winter (42 species), and those in the other two seasons were 72 and 66 in summer and autumn, respectively. However, in 2019, the total number of phytoplankton species was the highest in summer (47 species), followed by autumn (37 species), then spring and winter (18 species). The percentage of diatoms ranged from 70.53% to 81.94% in 2009, and the highest percentage occurred in summer, whereas the lowest percentage occurred in winter. The percentage of diatoms ranged from 89.36% to 94.44% in 2019, and the highest percentage occurred in winter and spring, whereas the lowest percentage occurred in summer. The percentage of Pyrrophyta ranged from 12.50% to 23.16% in 2009 and 5.41% to 8.51% in 2019.

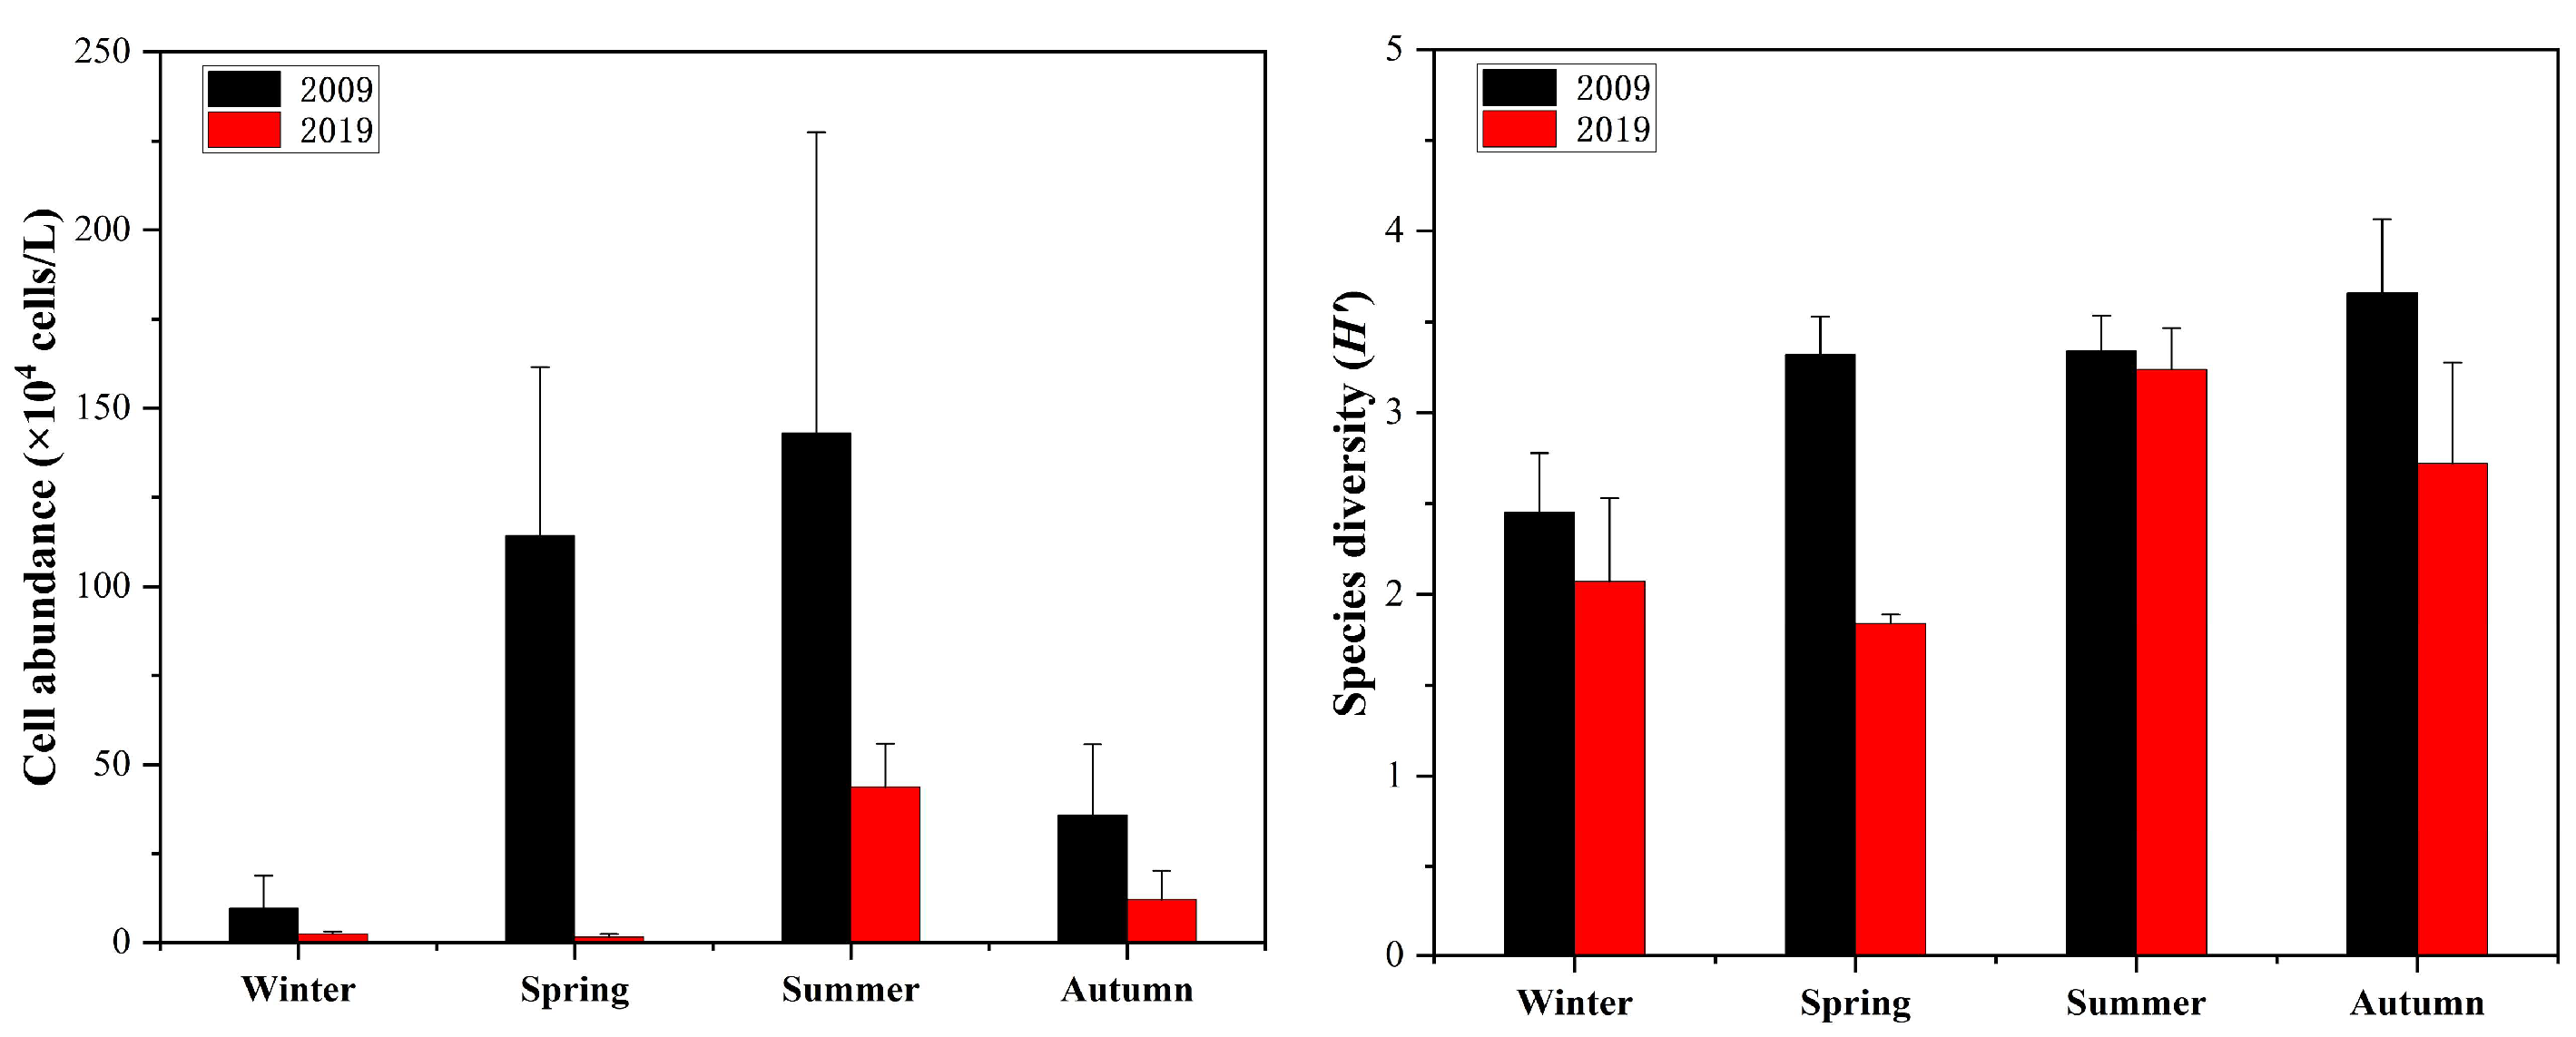
3.3. Variations in Phytoplankton Abundance and Species Diversity

The seasonal variations in the average phytoplankton cell abundance in 2009 and 2019 are shown in Figure 4. The seasonal variation in phytoplankton cell abundance in 2009 decreased in the following order: summer (143.064 × 10⁴ cells/L) > spring (114.285 × 10⁴ cells/L) > autumn (35.821 × 10⁴ cells/L) > winter (9.607 × 10⁴ cells/L). The abundance of phytoplankton cells ranged from 9.61 to 143.06 × 10⁴ cells/L in 2009, with a mean value of 75.69 × 10⁴ cells/L. The seasonal variation in phytoplankton cell abundance in 2019 decreased in the following order: summer (43.788 × 10⁴ cells/L) > autumn (12.124 × 10⁴ cells/L) > winter (2.375 × 10⁴ cells/L) > spring (1.576 × 10⁴ cells/L). The abundance of phytoplankton cells ranged from 2.38 to 43.79 × 10⁴ cells/L in 2019, with a mean value of 14.97 × 10⁴ cells/L. The t-test showed a significant difference in phytoplankton abundance between 2009 and 2019 in summer (t = 5.273, p < 0.001).
The seasonal variations in species diversity (H′) in Zhanjiang Bay in 2009 and 2019 are shown in Figure 4. The species diversity (H′) ranged from 1.84 to 3.24 in 2019, with a mean value of 2.47. The species diversity (H′) in 2009 was significantly greater than that in 2019, ranging from 2.45 to 3.66 in 2009, with a mean value of 3.19. The t-test showed a significant difference in species diversity (H′) between 2009 and 2019 in summer (t = 6.454, p < 0.001).

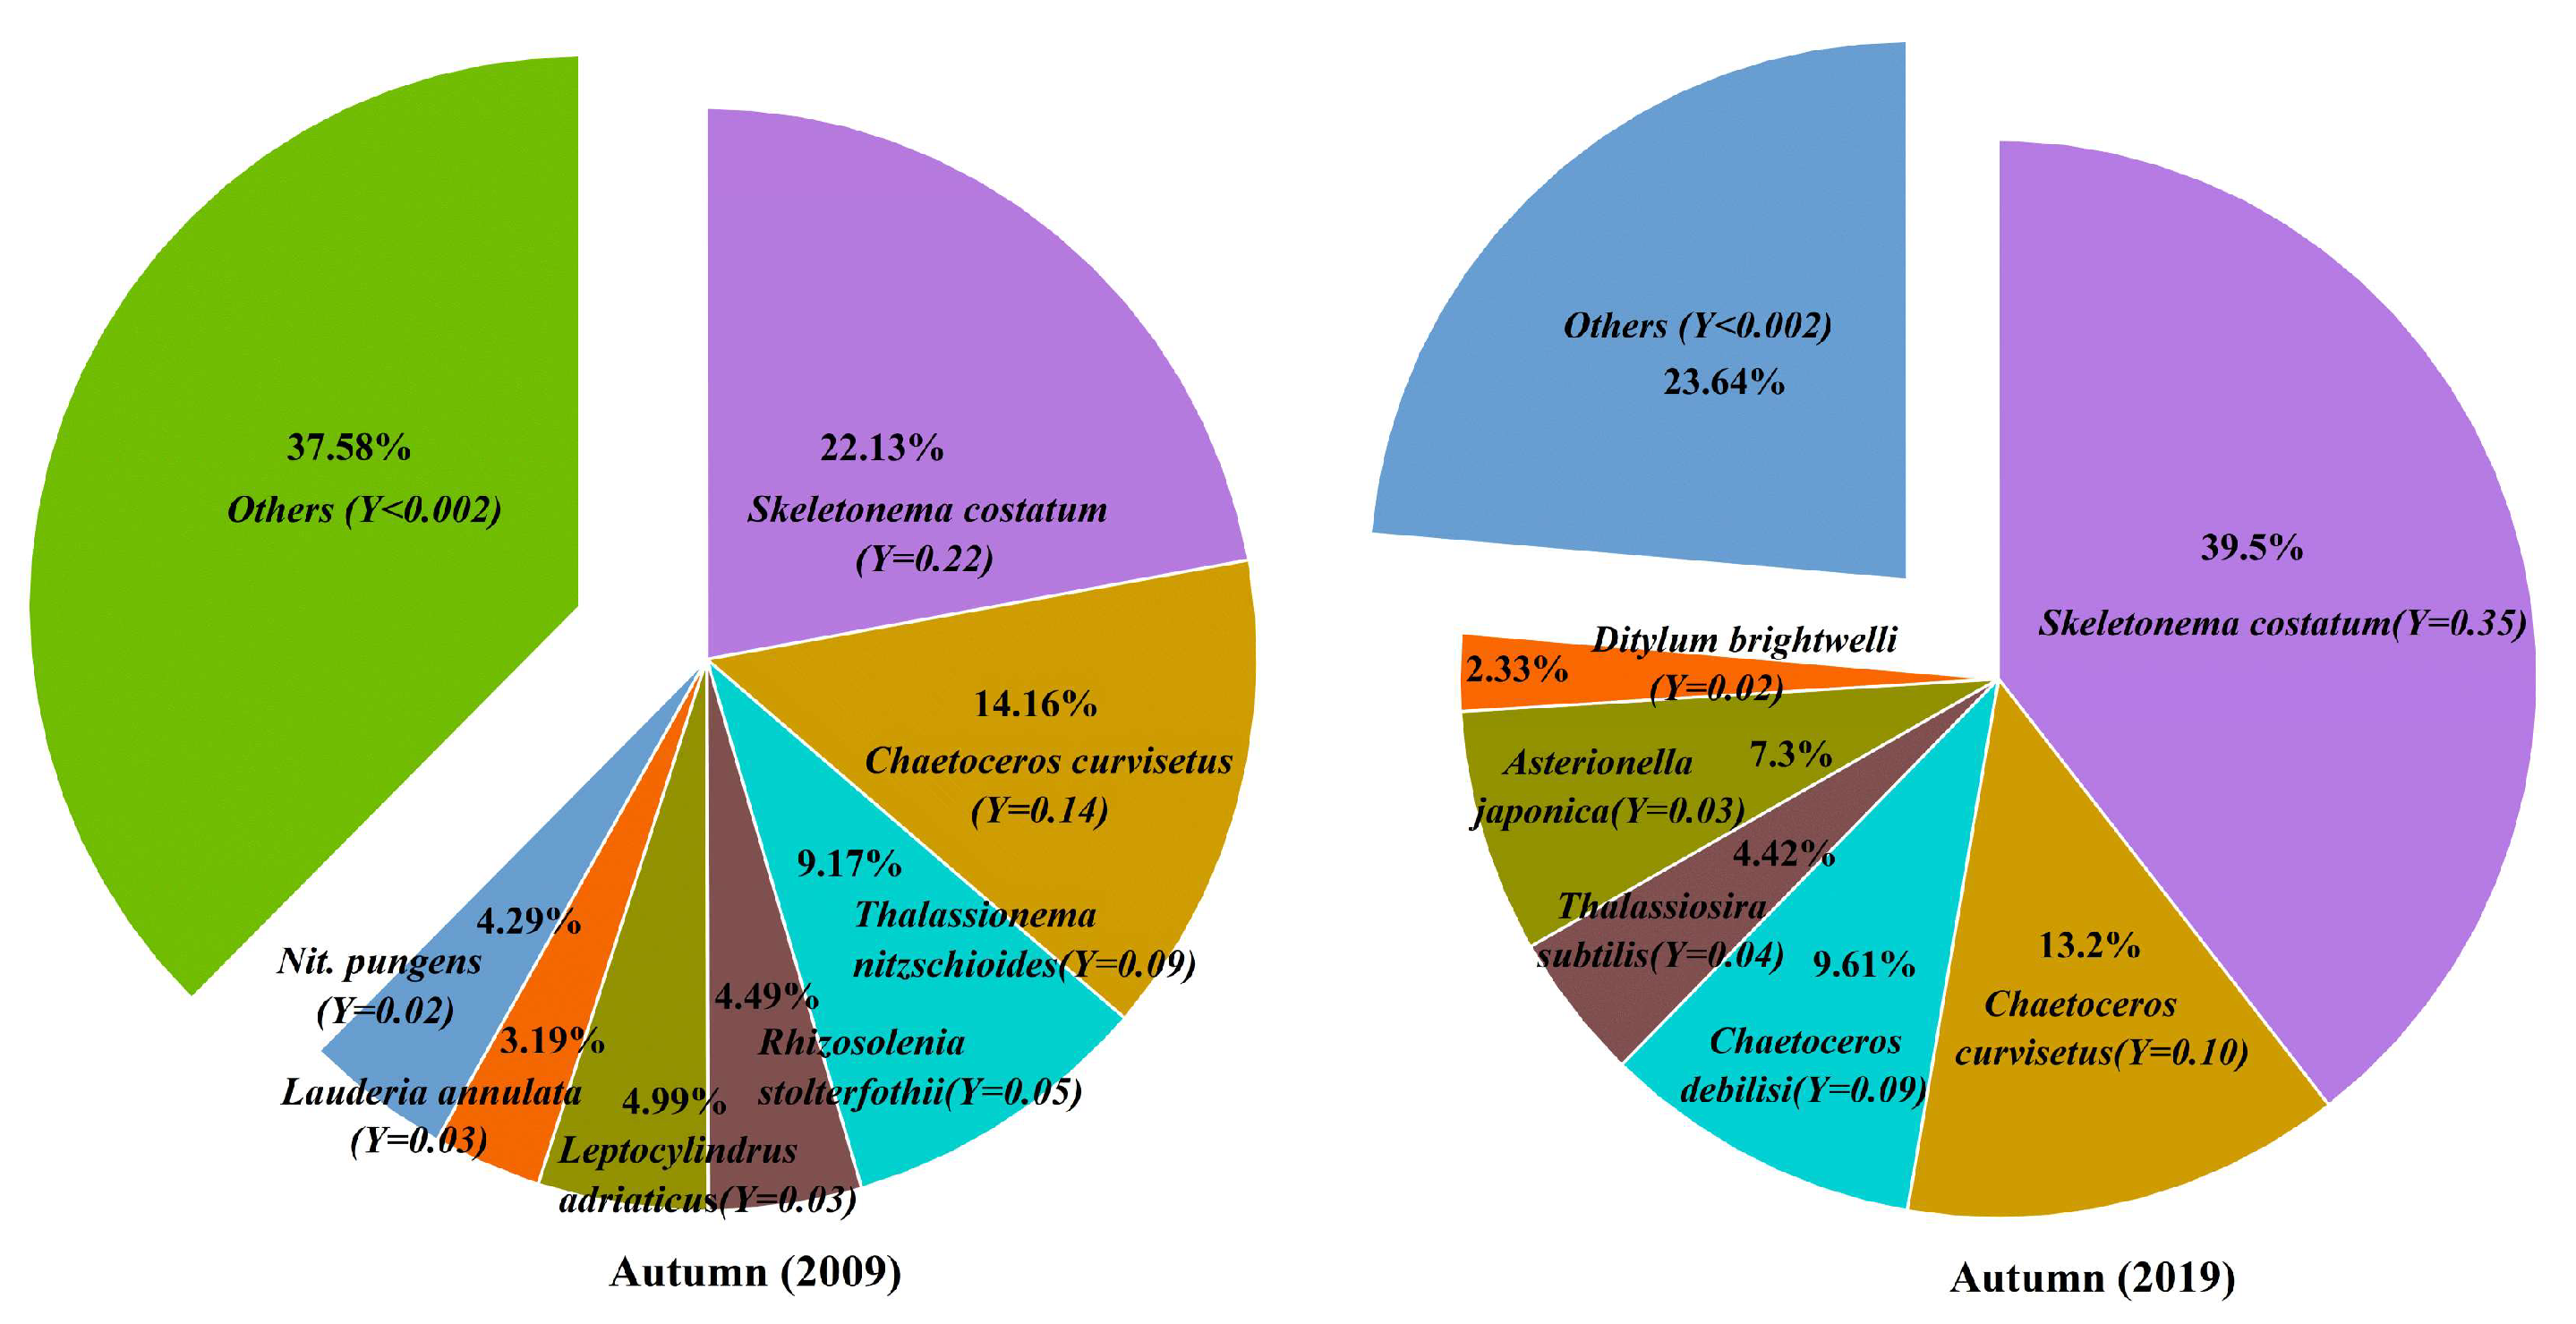
3.4. Dominant Species of Phytoplankton

We compared the seasonal variations in the dominant species (Y ≥ 0.02) in 2009 and 2019 (Figure 5). There was little difference in the number of dominant species in 2009 and 2019, which were 15 and 16, respectively. In 2019, the dominant phytoplankton species were all diatoms, and species with strong adaptability to high temperatures and salinity were dominant. Among them, the dominant species with the most significant number in winter, spring, and autumn was Skeletonema costatum, accounting for 31.10%, 38.9%, and 39.5% of the total cell number, respectively. Skeletonema costatum was the dominant species throughout the year.
The dominant phytoplankton species in 2009 were mainly diatoms. Except for the second dominant species in winter, the dinoflagellate Ceratium furca (10.18%), all other dominant species were diatoms. In 2009, the most dominant species were Eucampia zoodiacus (42.45%), Skeletonema costatum (28.45%), Asterionella japonica (26.7%), and Skeletonema costatum (22.13%) in winter, spring, summer, and autumn, respectively. Skeletonema costatum was the dominant species in the three seasons of 2009.
Diatoms were the most abundant phytoplankton group. The most common diatoms were species typical of warm brackish or eurythermal euryhaline conditions. The species Asterionella japonica, Skeletonema costatum, and Chaetoceros curvisetus were the most dominant taxa in 2009, representing 17.0%, 15.7%, and 13.9% of the total abundance, respectively. However, the species Chaetoceros debilis, Chaetoceros affinis, and Skeletonema costatum were the most dominant taxa in 2019, representing 19.9%, 13.0%, and 12.0% of the total abundance, respectively. There were 19 species of Ceratosoma, accounting for 34.6% of the total cell abundance in 2009. However, the number of Chaetoceros species decreased to 11 in 2019, and the proportion of cell abundance to total cell abundance increased significantly to 49%, with an increase of 14.4% from 2009.

4. Discussion

4.1. Variations in Nutrient Structure

For comparison purposes, the environmental factors in Zhanjiang Bay in 2009 and 2019 are presented in Table 1 and Figure 2. Compared with the nutrient concentrations of seawater from Zhanjiang Bay, the mean annual DIN concentrations in 2019 were lower than those in 2009, but the DIP and DSI concentrations in 2019 were higher than those in 2009. This result conforms to previous findings, and the DIN concentrations have been effectively controlled in Zhanjiang Bay, whereas the phosphate concentration has increased sharply over the past 30 years [13]. Previous studies reported that Zhanjiang began to implement soil testing and formula fertilization in 2006, and the discharge of anthropogenic nitrogen began to decrease in Zhanjiang [20]. Moreover, owing to intensified human activities, such as artificial dams and dredging, the intrusion of high-salinity water from the SCS in the outer bay has increased significantly over the past two decades (by 23%) [12], which has led to an intensification of the salinity front between the upper bay and lower bay. This enhanced salinity front results in the accumulation of a large amount of nutrients in the upper bay, while the nutrients in the lower bay are diluted by the intrusion of high-salinity seawater [21,22,23].
The criteria established by Justić et al. (1995) [24] and Dortch et al. (1992) [25] were used to assess the stoichiometry of nutrients in seawater. When DSi/DIP > 22 and DIN/DIP > 22, it indicates potential P limitation; when DIN/DIP < 10 and DIN/DSi < 1, it indicates potential N limitation; and when DSi/DIP < 10 and DSi/DIN < 1, it indicates potential Si limitation. The results of the present study revealed low nitrate concentrations during a significant part of the year (2019). Additionally, the DIN/DIP ratio in the upper layers was lower in 2019 than in 2009. The average DIN/DIP ratio in 2009 was 16.9, much higher than 10 and lower than 22; however, in 2019, it was 4.7, much lower than 10. In addition, the average DIN/DSi ratio in 2009 was 2.21, which was higher than one, and the average DIN/DSi ratio in 2019 was 0.46, which was lower than one. The average DSi/DIP ratio in 2009 was 13.2, which was greater than 10, and that in 2019 was 9.7, which was close to 10. This indicates that there was no potential nutrient limitation that limited phytoplankton productivity and growth in 2009; in contrast, in 2019, there was potential N limitation.
In summary, owing to the influence of human activities and the intrusion of high-salinity seawater from the South China Sea, the structure of nutrients in the lower area of Zhanjiang Bay has significantly changed.

4.2. Effects of Nutrient Concentration on Phytoplankton Cell Abundance

Substantial evidence supports that in aquatic ecosystems, solar light, water temperature, and nutrients are important environmental factors impacting the rates of the growth and multiplication of algae [26]. Maucha (1942) [27] reported that the light intensity at any water surface on Earth is sufficient for assimilation by algae and that the availability of solar light can meet the needs of phytoplankton. Therefore, light intensity is a less important factor influencing primary production than water temperature and nutrient availability [26]. Our study area is located northwest of the South China Sea (SCS) and the light intensity is sufficient [28]. Hence, this study only discusses the effects of temperature and nutrients on phytoplankton without turbidity and grazing pressure data. The impact of temperature on phytoplankton growth is a long and slow process, and it is relatively less important for marine primary production than the availability of nutrients [26]. If N is lacking, it will result in the reduction in chlorophyll content in the cell and a reduction in both the efficiency and capacity of photosynthesis. A lack of P will cause the photosynthesis of phytoplankton to become weakened [29]. In the case of Si limitation, algae assemblage and metabolism would be seriously harmed. Without Si, the outer crust of the diatom cannot be formed and the cell development cycle cannot be completed [30,31].
In 2009, the cell abundance of phytoplankton was high in summer and spring, whereas it was low in autumn and winter. In 2019, high phytoplankton cell abundance occurred in summer and autumn, whereas low values occurred in spring and winter. This is the same as the trend of temperature and the opposite of the nutrient trend (Figure 2 and Figure 4). To further understand the key environmental factors affecting the seasonal variation in phytoplankton cell abundance in Zhanjiang Bay, PCA was used to analyze the correlations between them. (Figure 6). Three principal components with eigenvalues exceeding 1.0 were identified for both years. The first component accounted for 37.0% and 45.8% of the total variance in 2009 and 2019, respectively, whereas the second to third components explained 28.5% and 23.1% and 14.8% and 16.5% of the total variance in 2009 and 2019, respectively. The phytoplankton cell abundance exhibited significant negative correlations with nutrients (DIN and DSI in 2009, DIN, DIP, and DSI in 2019) but a significantly positive relationship with temperature. These results indicate that the temperature and nutrient concentrations strongly contributed to the seasonal variation in phytoplankton cell abundance.
Previous studies have shown that temperature significantly affects all enzyme-catalyzed reactions. When the temperature favors growth, every 10-degree increase in temperature can increase the phytoplankton cell splitting rate by 1–3 times [32,33]. In our study, there were temperatures that favored the growth of phytoplankton (28 °C~30 °C); a relatively high temperature can increase the phytoplankton cell splitting rate, leading to phytoplankton growth. Therefore, the seasonal variation in phytoplankton cell abundance exhibited a significantly positive relationship with temperature. The growth of phytoplankton quickly reduces nutrient concentrations in local waters, and nutrients are consumed during phytoplankton cell division and proliferation. This will then limit phytoplankton development [26]. Hence, in this study, the seasonal variation in phytoplankton cell abundance exhibited significant negative correlations with nutrients.
In our study, the mean annual temperature in 2019 (26.1 °C) was close to that in 2009 (25.6 °C), and the difference in each season was not significant, indicating that the temperature did not change much between the year 2009 and the year 2019. However, the phytoplankton cell abundance and chlorophyll a concentration in 2019 were markedly lower than those in 2009 (Table 1). These findings indicate that temperature was not a critical factor for phytoplankton growth between the year 2009 and the year 2019. In addition, in our study, the horizontal distributions of nutrient and phytoplankton abundances were similar in most seasons. The distribution gradually decreases from the inside bay to the outside bay (unpublished). This suggests that nutrients have substantial control over the horizontal distribution of phytoplankton abundance. Compared with those in 2009, the mean annual concentrations of DIN in 2019 were markedly lower than those in 2009, which was consistent with the trends of phytoplankton abundance and chlorophyll a. However, the mean annual concentrations of DIP and DSI in 2019 were higher than those in 2009. This suggests that a decrease in DIN concentrations may lead to a decrease in phytoplankton abundance. The nitrogen limitation of phytoplankton growth is standard in coastal systems [26]. Previous studies have shown that when DIN was added, productivity and biomass generally increased, and when all growth-limiting nutrients except N were added, there was generally no change in productivity and biomass [34], indicating that the DIN concentration strongly controlled phytoplankton productivity and biomass accumulation.

4.3. Effects of Nutrient Structure on Phytoplankton Community

N, P, and Si are vital nutrients for marine phytoplankton, affecting not only algae growth but also assemblages. Marine algae blooms quickly reduce nutrient concentrations in local waters, and nutrients are consumed during algal cell division and proliferation. This will then limit algae development and alter algae assemblage. Si limitation can change the phytoplankton assemblage from a diatom assemblage to a non-diatom assemblage [25,35]. In addition, a low DIN/DIP ratio is beneficial for the absorption and utilization of nutrients in diatoms [36]. In our study, DSI concentrations always exceeded 2 μmol/L, and DSi/DIN ratios were always greater than one in 2009 and 2019, indicating that silica was unlikely to have limited diatom growth in Zhanjiang Bay during this study. Furthermore, our study revealed that the mean annual DIN concentration in 2019 was lower than that in 2009, and the DIN/DIP ratio in 2019 was lower than that in 2009, indicating that N limitation potentially limited phytoplankton productivity and growth in 2019. Our investigation of the phytoplankton species composition of Zhanjiang Bay revealed that the phytoplankton species composition decreased, but the proportional contribution of diatom taxa increased significantly from 70.39% in 2009 to 87.88% in 2019. These results suggest that an abundance of DSI in 2019 promoted diatom growth and that a low DIN/DIP ratio (4.7) in 2019 was more beneficial for the absorption and utilization of nutrients in diatoms than it was in 2009. Therefore, diatoms were the most abundant phytoplankton group and increased significantly from 2009 to 2019.
The dominance of diatoms at a low DIN/DIP ratio might be due to their N utilization strategy. NO3 is the preferential inorganic N form for diatoms. Skeletonema contains a high-affinity transporter whose encoding gene increases significantly under N-limiting conditions to increase the transport of NO3 [37]. Some diatoms, including Skeletonema, might take up and store NO3. The intracellular NO3 concentration could exceed ambient conditions by several orders of magnitude [38]. In addition, Skeletonema can decrease the activation energy of photosynthesis and respiration and reduce the temperature dependence of metabolic rates in response to N-limited conditions [39]. The expression levels of genes involved in oxidation resistance and programmed cell death are upregulated in Skeletonema under N starvation conditions [40]. Chaetoceros responded similarly to the DIN/DIP ratio. We hypothesized that the superior N transport, storage, and response strategies to a low N supply might benefit diatoms, especially Skeletonema and Chaetoceros, from dominating the phytoplankton assemblage. In our study, Skeletonema costatum was the most dominant species and increased from 2009 to 2019. Skeletonema costatum was dominant in all seasons of 2019. In addition, the proportional contribution of the phytoplankton cell abundance of Chaetoceros increased significantly from 34.6% in 2009 to 49.0% in 2019. These results suggest that Skeletonema and Chaetoceros dominated the phytoplankton assemblage in 2019 more than they did in 2009. Moreover, in our study, the DIN/DIP ratio significantly declined from 16.9 in 2009 to 4.7 in 2019. In summary, the low DIN/DIP ratio in 2019 encouraged diatoms, especially Skeletonema and Chaetoceros, to dominate the phytoplankton assemblage.

5. Conclusions

(1) Compared with those in 2009, the phytoplankton abundance, phytoplankton groups, and species diversity (H′) in Zhanjiang Bay in 2019 decreased significantly. The number of phytoplankton groups decreased from 179 taxa (nine phyla) to 66 taxa (three phyla), and the contribution rates of the diatom groups increased significantly from 70.39% to 87.88%. In 2009, diatoms were the dominant species of phytoplankton, with some dinoflagellates (Cladocera), whereas in 2019, diatoms were the dominant species of phytoplankton. Skeletonema changed from the three seasonally dominant species (2009) to the annual dominant species (2019), and the contribution ratio of Chaetoceros to phytoplankton cell abundance increased significantly from 34.6% to 49.0%. Skeletonema and Chaetoceros dominated the phytoplankton assemblage more in 2019 than in 2009.
(2) Compared with 2009, the DIN concentrations in the lower area of Zhanjiang Bay decreased significantly in 2019 because of the decrease in anthropogenic nitrogen emissions and the significant increase in the intrusion of high-salinity seawater from the outside Zhanjiang Bay (SCS). In addition, the DIN/DIP, DSi/DIP, and DIN/DSi ratios in 2019 all decreased. Therefore, the nutrient structure in Zhanjiang Bay changed significantly.
(3) In our study, the decrease in phytoplankton cell abundance and species groups may have been caused by the significant decrease in the DIN concentrations in 2019. Diatoms, especially Skeletonema and Chaetoceros, have obvious growth advantages under low DIN/DIP ratios due to their adaptive capacity. In 2019, lower DIN/DIP ratios were more beneficial to the growth of diatoms, especially Skeletonema and Chaetoceros, in terms of phytoplankton composition.
This study investigates the influence of nutrient structure on the phytoplankton community in Zhanjiang Bay. Under the dual pressures of human activities and climate change, increased terrestrial nutrient input has altered nutrient composition, potentially leading to irreversible ecological transformations. This study is significant for further assessing the responses of coastal ecosystems to the impacts of human activities and climate change.

Author Contributions

Conceptualization, Z.Z., Q.Z. and F.C.; methodology and software, Q.Z.; validation, F.C.; formal analysis, Q.L.; resources, Z.Z. and F.C.; data curation, Q.Z.; writing—original draft, Z.Z. and Q.Z.; writing—review and editing, Q.Z., Q.L. and F.C.; visualization, Q.Z.; supervision, F.C.; project administration, Z.Z.; funding acquisition, Z.Z. All authors have read and agreed to the published version of the manuscript.

Funding

This study was supported by the National Natural Science Foundation of China (42276047) and the Open Research Fund of the Key Laboratory of Marine Ecosystem Dynamics, Second Institute of Oceanography, Ministry of Natural Resources (MED202404).

Data Availability Statement

Data are contained within the article.

Conflicts of Interest

The authors declare no conflicts of interest.

References

  1. Hattich, G.S.I.; Listmann, L.; Govaert, L.; Pansch, C.; Reusch, T.B.H.; Matthiessen, B. Experimentally decomposing phytoplankton community change into ecological and evolutionary contributions. Funct. Ecol. 2022, 36, 120–132. [Google Scholar] [CrossRef]
  2. Zhao, K.; Cao, Y.; Pang, W.; Wang, L.; Song, K.; You, Q.; Wang, Q. Long-term plankton community dynamics and influencing factors in a man-made shallow lake, Lake Dishui, China. Aquat. Sci. 2021, 83, 2. [Google Scholar] [CrossRef]
  3. Serra-P, C.; Soudijn, F.; Visser, A.W.; Kiørboe, T.; Andersen, K.H. A general size-and trait-based model of plankton communities. Prog. Oceanogr. 2020, 189, 102473. [Google Scholar] [CrossRef]
  4. Wang, X.; Wu, X.; Sun, J. Seasonal dynamics and key drivers of phytoplankton community structure in the Eastern Indian Ocean. Mar. Pollut. Bull. 2025, 212, 117548. [Google Scholar] [CrossRef]
  5. Lopez-Flores, R.; Garces, E.; Biox, D.; Badosa, A.; Brucet, S.; Maso, M.; Quintana, S.D. Comparative composition and dynamics of harmful dinoflagllates in Mediterranean saltmarshes and nearby external marine waters. Harmful Algae 2006, 5, 637–648. [Google Scholar] [CrossRef]
  6. Spatharis, S.; Tsirtsis, G.; Danielidis, D.B.; Chi, T.D.; Mouillo, D. Effects of pulsed nutrient inputs on phytoplankton assemblage structure and blooms in an enclosed coastal area. Estuar. Coast. Shelf Sci. 2007, 73, 807–815. [Google Scholar] [CrossRef]
  7. Gle, C.; Amo, Y.D.; Sautour, B.; Laborde, P.; Chardy, P. Variability of nutrients and phytoplankton primary productionin a shallow macrotidal coastal ecosystem (Arcachon Bay, France). Estuar. Coast. Shelf Sci. 2008, 76, 642–656. [Google Scholar] [CrossRef]
  8. Wu, X.Y.; Yang, Y.F. Heavy metal (Pb, Co, Cd, Cr, Cu, Fe, Mn and Zn) concentrations in harvest-size white shrimp Litopenaeus vannamei tissues from aquaculture and wild source. J. Food Compos. Anal. 2011, 24, 62–65. [Google Scholar] [CrossRef]
  9. Li, X.Y.; Li, B.; Sun, X.L. Effects of a coastal power plant thermal discharge on phytoplankton community structure in zhanjiang bay, China. Mar. Pollut. Bull. 2014, 81, 210–217. [Google Scholar] [CrossRef]
  10. Liang, H.; Zhang, J.; Zhang, J.; Zhang, P.; Deng, X.; Chen, J.; Wang, Z.; Long, C.; Lu, C.; Wang, D.; et al. Unveiling the eutrophication crisis: 20 years of nutrient development in Zhanjiang Bay, China. Front. Mar. Sci. 2024, 11, 1373716. [Google Scholar] [CrossRef]
  11. Zhang, P.; Xu, J.-L.; Zhang, J.-B.; Li, J.-X.; Zhang, Y.-C.; Li, Y.; Luo, X.-Q. Spatiotemporal dissolved silicate variation, sources, and behavior in the eutrophic zhanjiang bay, China. Water 2020, 12, 3586. [Google Scholar] [CrossRef]
  12. Lao, Q.; Wu, J.; Chen, F.; Zhou, X.; Li, Z.; Chen, C.; Zhu, Q.; Deng, Z.; Li, J. Increasing intrusion of high salinity water alters the mariculture activities in zhanjiang bay during the past two decades identified by dual water isotopes. J. Environ. Manage 2022, 320, 115815. [Google Scholar] [CrossRef] [PubMed]
  13. He, G.; Lao, Q.; Jin, G.; Zhu Q and Chen, F. Increasing eutrophication driven by the increase of phosphate discharge in a subtropical bay in the past 30 years. Front. Mar. Sci. 2023, 10, 1184421. [Google Scholar] [CrossRef]
  14. Lin, X.; Lu, K.; Hardison, A.K.; Liu, Z.; Xu, X.; Gao, D.; Gong, J.; Gardner, W.S. Membrane inlet mass spectrometry method (REOX/MIMS) to measure 15N-nitrate in isotopeenrichment experiments. Ecol. Indic. 2021, 126, 107639. [Google Scholar] [CrossRef]
  15. Wang, S.; Zhou, F.; Chen, F.; Meng, Y.; Zhu, Q. Spatiotemporal Distribution Characteristics of Nutrients in the Drowned Tidal Inlet Under the Influence of Tides: A Case Study of Zhanjiang Bay, China. Int. J. Environ. Res. Public Health. 2021, 18, 2089. [Google Scholar] [CrossRef]
  16. Zhou, X.; Zhang, S.; Liu, S.; Chen, C.; Lao, Q.; Chen, F. Thermal fronts in coastal waters regulate phytoplankton blooms via acting as barriers: A case study from western Guangdong, China. J. Hydrology 2024, 636, 131350. [Google Scholar] [CrossRef]
  17. Shannon, C.E. The mathematical theory of communication. Bell Labs Tech. J. 1950, 3, 31–32. [Google Scholar] [CrossRef]
  18. Pielou, E.C.J. The Measurement of Diversity in Different Types of Biological Collections. J. Theor. Biol. 1966, 13, 131–144. [Google Scholar] [CrossRef]
  19. Soltani, N.; Khodaei, K.; Alnajar, N.; Shahsavari, A.; Ashja Ardalan, A. Cyanobacterial community patterns as water quality bioindicators. Iran. J. Fish. Sci. 2012, 11, 876–891. [Google Scholar]
  20. Meng, Y.; Chen, F.; Zeng, Z. Nitrogen budget evolution in zhanjiang municipal district and its environmental effect during 2002–2013. Trop. Geogr. 2015, 35, 777–784. [Google Scholar] [CrossRef]
  21. Chapman, C.C.; Lea, M.A.; Meyer, A.; Sall’ee, J.B.; Hindell, M. Defining Southern Ocean fronts and their influence on biological and physical processes in a changing climate. Nat. Clim. Chang. 2020, 10, 209–219. [Google Scholar] [CrossRef]
  22. Galarza, J.A.; Carreras-Carbonell, J.; Macpherson, E.; Pascual, M.; Roques, S.; Turner, G.F.; Rico, C. The influence of oceanographic fronts and early-life-history traits on connectivity among littoral fish species. Proc. Natl. Acad. Sci. USA 2009, 106, 1473–1478. [Google Scholar] [CrossRef] [PubMed]
  23. Lao, Q.; Chen, F.; Jin, G.; Lu, X.; Chen, C.; Zhou, X.; Zhu, Q. Characteristics and mechanisms of typhoon-induced decomposition of organic matter and its implication for climate change. J. Geophys. Res. Biogeosci. 2023, 128, e2023JG007518. [Google Scholar] [CrossRef]
  24. Justić, D.; Rabalais, N.N.; Turner, R.E.; Dortch, Q. Changes in nutrient structure of river-dominated coastal waters: Stoichiometric nutrient balance and its consequences. Estuar. Coast. Shelf Sci. 1995, 40, 339–356. [Google Scholar] [CrossRef]
  25. Dortch, Q.; Whitledge, T.E. Does nitrogen or silicon limit phytoplankton production in the Mississippi River plume and nearby regions. Cont. Shelf Res. 1992, 2, 1293–1309. [Google Scholar] [CrossRef]
  26. Miao, Z.; Yang, D. Solar light, seawater temperature, and nutrients, which one is more important in affecting phytoplankton growth. Chin. J. Oceanol. Limnol. 2009, 27, 825–831. [Google Scholar] [CrossRef]
  27. Maucha, R. Das gleichgewicht des limnischen Lebensraumes. Magy. Boil. Kut. Munkái. 1942, 14, 192–230. [Google Scholar]
  28. Zhang, P.; Peng, C.; Zhang, J.; Zhang, J.; Chen, J.; Zhao, H. Long-Term Harmful Algal Blooms and Nutrients Patterns Affected by Climate Change and Anthropogenic Pressures in the Zhanjiang Bay, China. Front. Mar. Sci. 2022, 9, 849819. [Google Scholar] [CrossRef]
  29. Yang, X.; Zhu, M. The new development of phytoplankton metabolism study. J. Oceanogr. Huanghai Bohai Seas. 1990, 3, 65–72. (In Chinese) [Google Scholar]
  30. Brzezinski, M.A.; Olson, R.J.; Chisholm, S.W. Silicon availability and cell-cycle progression in marine diatoms. Mar. Ecol. Prog. Series. 1990, 67, 83–96. [Google Scholar] [CrossRef]
  31. Brzezinski, M.A. Cell-cycle effects on the kinetics of silicic acid uptake and resource competition among diatoms. J. Plankton Res. 1992, 14, 1511–1536. [Google Scholar] [CrossRef]
  32. Fogg, G.E. Algal Cultures and Phytoplantkon Ecology. Madison; The University of Wisconsin Press: Madison, WI, USA, 1965. [Google Scholar]
  33. Sverdrup, H.U.; Johnson, M.W.; Fleming, H. The Oceans. Prentice Hall, New York; Mao, H., Translator; Science Press: Beijing, China, 1959; pp. 665–676; 685–691. (In Chinese) [Google Scholar]
  34. Piehler, M.F.; Twomey, L.J.; Hall, N.S.; Paerl, H.W. Impacts of inorganic nutrient enrichment on phytoplankton community structure and function in Pamlico Sound, NC, USA. Estuar. Coast. Shelf Sci. 2004, 61, 197–209. [Google Scholar] [CrossRef]
  35. Yang, D.F.; Wang, F.; Gao, Z.H.; Cui, W.L.; Huo, S.X. Ecological phenomena of phytoplankton in Jiaozhou Bay. Mar. Sci. 2004, 28, 71–74. (In Chinese) [Google Scholar]
  36. Yin, K.D.; Liu, H.; Harrison, P.J. Sequential nutrient uptake as a potential mechanism for phytoplankton to maintain high primary productivity and balanced nutrient stoichiometry. Biogeosciences 2017, 14, 2469–2480. [Google Scholar] [CrossRef]
  37. Kang, L.K.; Rynearson, T.A. Identification and expression analyses of the nitrate transporter gene (NRT2) family among Skeletonema species (Bacillariophyceae). J. Phycol. 2019, 55, 1115–1125. [Google Scholar] [CrossRef]
  38. Lomas, M.W.; Glibert, P.M. Comparisons of nitrate uptake, storage, and reduction in marine diatoms and flagellates. J. Phycol. 2000, 36, 903–913. [Google Scholar] [CrossRef]
  39. Maranon, E.; Lorenzo, M.P.; Cermeno, P.; Mourino-Carballido, B. Nutrient limitation suppresses the temperature dependence of phytoplankton metabolic rates. ISME J. 2018, 12, 1836–1845. [Google Scholar] [CrossRef]
  40. Wang, H.L.; Chen, F.; Mi, T.Z.; Liu, Q.; Yu, Z.G.; Zhen, Y. Responses of marine diatom Skeletonema marinoi to nutrient deficiency: Programmed cell death. Appl. Environ. Microbiol. 2020, 86, e02460-19. [Google Scholar] [CrossRef]
Figure 1. Sampling stations in the study area (lower bay) and the path of the West Guangdong Coastal Current (blue arrow, WGCC).
Jmse 13 01202 g001
Figure 2. Seasonal variations in the environmental factors in Zhanjiang Bay.
Jmse 13 01202 g002aJmse 13 01202 g002b
Figure 3. Seasonal variations in the phytoplankton composition in Zhanjiang Bay.
Jmse 13 01202 g003
Figure 4. Seasonal variation in phytoplankton cell abundance and species diversity in Zhanjiang Bay.
Jmse 13 01202 g004
Figure 5. Seasonal variations in dominant species (Y ≥ 0.02) in Zhanjiang Bay.
Jmse 13 01202 g005aJmse 13 01202 g005b
Figure 6. PCA results for environmental factors and cell abundance in 2009 and 2019.
Jmse 13 01202 g006
Table 1. Variations in environmental factors in 2009 and 2019.
Tem 1SalinitypHChlaDINDIPDSIDIN/DIPDSI/DIPDIN/DSI
°C--mg/L---
200926.1428.348.157.95 **0.302 *0.024 **0.24716.913.22.21
201925.6228.527.963.97 **0.196 *0.043 **0.3994.69.20.45
1 Temperature, * p < 0.05, ** p < 0.001.
Disclaimer/Publisher’s Note: The statements, opinions and data contained in all publications are solely those of the individual author(s) and contributor(s) and not of MDPI and/or the editor(s). MDPI and/or the editor(s) disclaim responsibility for any injury to people or property resulting from any ideas, methods, instructions or products referred to in the content.

