Article

Hue Angle-Based Remote Sensing of Secchi Disk Depth Using Sentinel-3 OLCI in the Coastal Waters of Qinhuangdao, China

1
Hebei Utilization and Planning Institute of Natural Resources, Shijiazhuang 050051, China
2
National Marine Environmental Monitoring Center, Dalian 116023, China
*
Author to whom correspondence should be addressed.
J. Mar. Sci. Eng. 2025, 13(6), 1149; https://doi.org/10.3390/jmse13061149
Submission received: 15 May 2025 / Revised: 4 June 2025 / Accepted: 9 June 2025 / Published: 10 June 2025
(This article belongs to the Special Issue Remote Sensing for Maritime Monitoring and Ship Surveillance)

Abstract

Seawater transparency provides critical insight into marine ecological dynamics and serves as a foundational indicator for fisheries management, environmental monitoring, and coastal resource development. Among various indicators, the Secchi disk depth (SDD) is widely used to quantify seawater transparency in marine environmental monitoring. This study develops a remote sensing inversion model for estimating the SDD in the coastal waters of Qinhuangdao, utilizing Sentinel-3 OLCI satellite imagery and in situ measurements. The model is based on the CIE hue angle and demonstrates high accuracy (R2 = 0.93, MAPE = 7.88%, RMSE = 0.25 m), outperforming traditional single-band, band-ratio, and multi-band approaches. Using the proposed model, we analyzed the monthly and interannual variations of SDD in Qinhuangdao’s coastal waters from 2018 to 2024. The results reveal a clear seasonal pattern, with SDD values generally increasing and then decreasing throughout the year, primarily driven by the East Asian monsoon and other natural factors. Notably, the average annual SDD in 2018 was significantly lower than in subsequent years (2019–2024), which is closely associated with comprehensive water management and pollution reduction initiatives in the Bohai Sea region. These findings highlight marked improvements in the coastal marine environment and underscore the benefits of China’s ecological civilization strategy, particularly the principle that “lucid waters and lush mountains are invaluable assets.”

1. Introduction

Seawater transparency is a crucial indicator in marine ecological and environmental monitoring, as it directly reflects water turbidity and is influenced by factors such as suspended materials, planktonic algae, and dissolved organic matter. Nearshore waters are particularly affected by land-based runoff, winds, currents, and tides, often exhibiting distinct spatial and temporal variability [1,2,3]. Transparency plays a vital role in phytoplankton photosynthesis, which is essential for their growth and distribution [4,5]. As primary producers in marine ecosystems, phytoplankton abundance shapes the spatial distribution of food resources, thereby impacting the stability and sustainability of offshore fisheries and aquaculture industries [6]. Furthermore, seawater transparency is a key ecological factor in coastal tourism, influencing both the sensory experiences of tourists and the broader industrial development in coastal areas.
In situ observations of water transparency date back to the 19th century, with water temperature, salinity, and water color being among the earliest parameters monitored in water quality assessments [7]. In 1865, Pietro Angelo Secchi invented the Secchi disk, which has since been used for measuring Secchi disk depth (SDD)—a method still in use today [8]. The process involves sunlight penetrating the seawater to illuminate the white disk, with scattering, reflection, and other physical processes determining the visibility of the disk, which serves as a measure of water transparency [9]. While field observations using the Secchi disk are simple and intuitive, they have limitations, such as limited data volume, small spatial coverage, and a lack of continuous measurements, making real-time large-scale monitoring impossible. Additionally, factors such as light intensity on the water surface and the observer’s subjective perception introduce uncertainties that can affect the accuracy of the observations.
Compared to conventional in situ measurement techniques, satellite-based remote sensing offers substantial benefits for monitoring aquatic environments. These include expansive spatial coverage, enhanced temporal resolution, and consistent periodic observation, which collectively overcome many limitations inherent in traditional approaches. Consequently, remote sensing has emerged as an increasingly vital tool for assessing seawater transparency [10]. The successful deployment and ongoing operation of numerous remote sensing satellites in recent years have spurred researchers globally to develop diverse inversion algorithms for deriving water transparency from satellite imagery. These algorithms are broadly categorized into three main types: empirical, semi-analytical, and machine learning-based methods. Empirical algorithms establish statistical correlations between the measured Secchi Disk Depth (SDD) and observed spectral reflectance [11,12,13]. While straightforward in application, their utility is often restricted to specific geographical regions. Semi-analytical algorithms, grounded in radiative transfer theory, leverage optical parameters such as the inherent optical properties (e.g., absorption and backscattering coefficients) or derived quantities like the diffuse attenuation coefficient to model and subsequently estimate SDD [14,15,16]. These methods mitigate the regional dependencies of empirical approaches but typically involve greater complexity in their implementation. More recently, machine learning algorithms have garnered considerable interest and found application in remote sensing studies focused on transparency [17,18,19]. However, models developed using machine learning often exhibit a highly specialized nature, posing challenges for practical deployment and broad applicability.
In recent years, a new research direction has emerged in remote sensing, focusing on the use of waterbody color parameters (including the Forel–Ule Index (FUI), hue angle, and dominant wavelength and chromaticity coordinates) to detect the ecological and environmental conditions of natural waterbodies. Researchers have explored remote sensing inversion of environmental parameters such as turbidity [20], colored dissolved organic matter [21], chlorophyll [22], suspended materials [23,24], and transparency [25,26]. This approach has led to significant findings in identifying ecological hazards, such as lake eutrophication [27,28], coastal phytoplankton blooms [29,30,31], and green tides [32,33]. In early studies on environmental parameter inversion, researchers commonly employed the FUI, a discretized classification of water-color information, as a sensitive parameter. However, for the optically complex coastal waters of China, the discrete nature of the FUI limits its ability to capture intra-class variations in water color, thereby constraining the accuracy of environmental parameter retrieval. In contrast, the hue angle (α), as a continuous variable representing chromatic information, enables more refined and quantitative characterization of water color, making it more suitable for the inversion of environmental variables in such dynamic coastal environments [34].
Qinhuangdao, a renowned coastal tourist city in China, relies heavily on the water transparency of its nearshore waters for the sustainable development of its tourism industry. However, no remote sensing studies on the transparency of Qinhuangdao’s coastal waters have been reported in the literature. The hue angle is a comprehensive indicator of seawater radiometric properties and a key parameter for the quantitative characterization of ocean color. Since water color intuitively reflects water clarity, the use of the hue angle for retrieving seawater transparency is both scientifically grounded and methodologically sound. In this study, we develop a high-precision remote sensing inversion algorithm for estimating the SDD in the coastal waters of Qinhuangdao, based on the CIE hue angle. This approach fills a technical gap in transparency monitoring for this region. The main contributions of this study are as follows: (1) introducing a novel hue angle–based retrieval algorithm that outperforms conventional single-band, band-ratio, and multi-band models; (2) applying the optimized algorithm to Sentinel-3 OLCI imagery to generate monthly SDD estimates from 2018 to 2024; and (3) analyzing the spatiotemporal patterns of SDD and their influencing factors. This study offers a practical and scalable method for monitoring coastal water quality and provides scientific support for marine ecological assessment and environmental management in Qinhuangdao.
The remainder of the paper is organized as follows: Section 2 describes the study area, data sources, hue angle derivation, and evaluation methods. Section 3 presents the development and validation of the SDD retrieval model, followed by its application to spatiotemporal variation analysis. Section 4 discusses the correlation with water-color constituents and contributions of driving forces. Section 5 concludes the paper with key findings and implications.

2. Materials and Methods
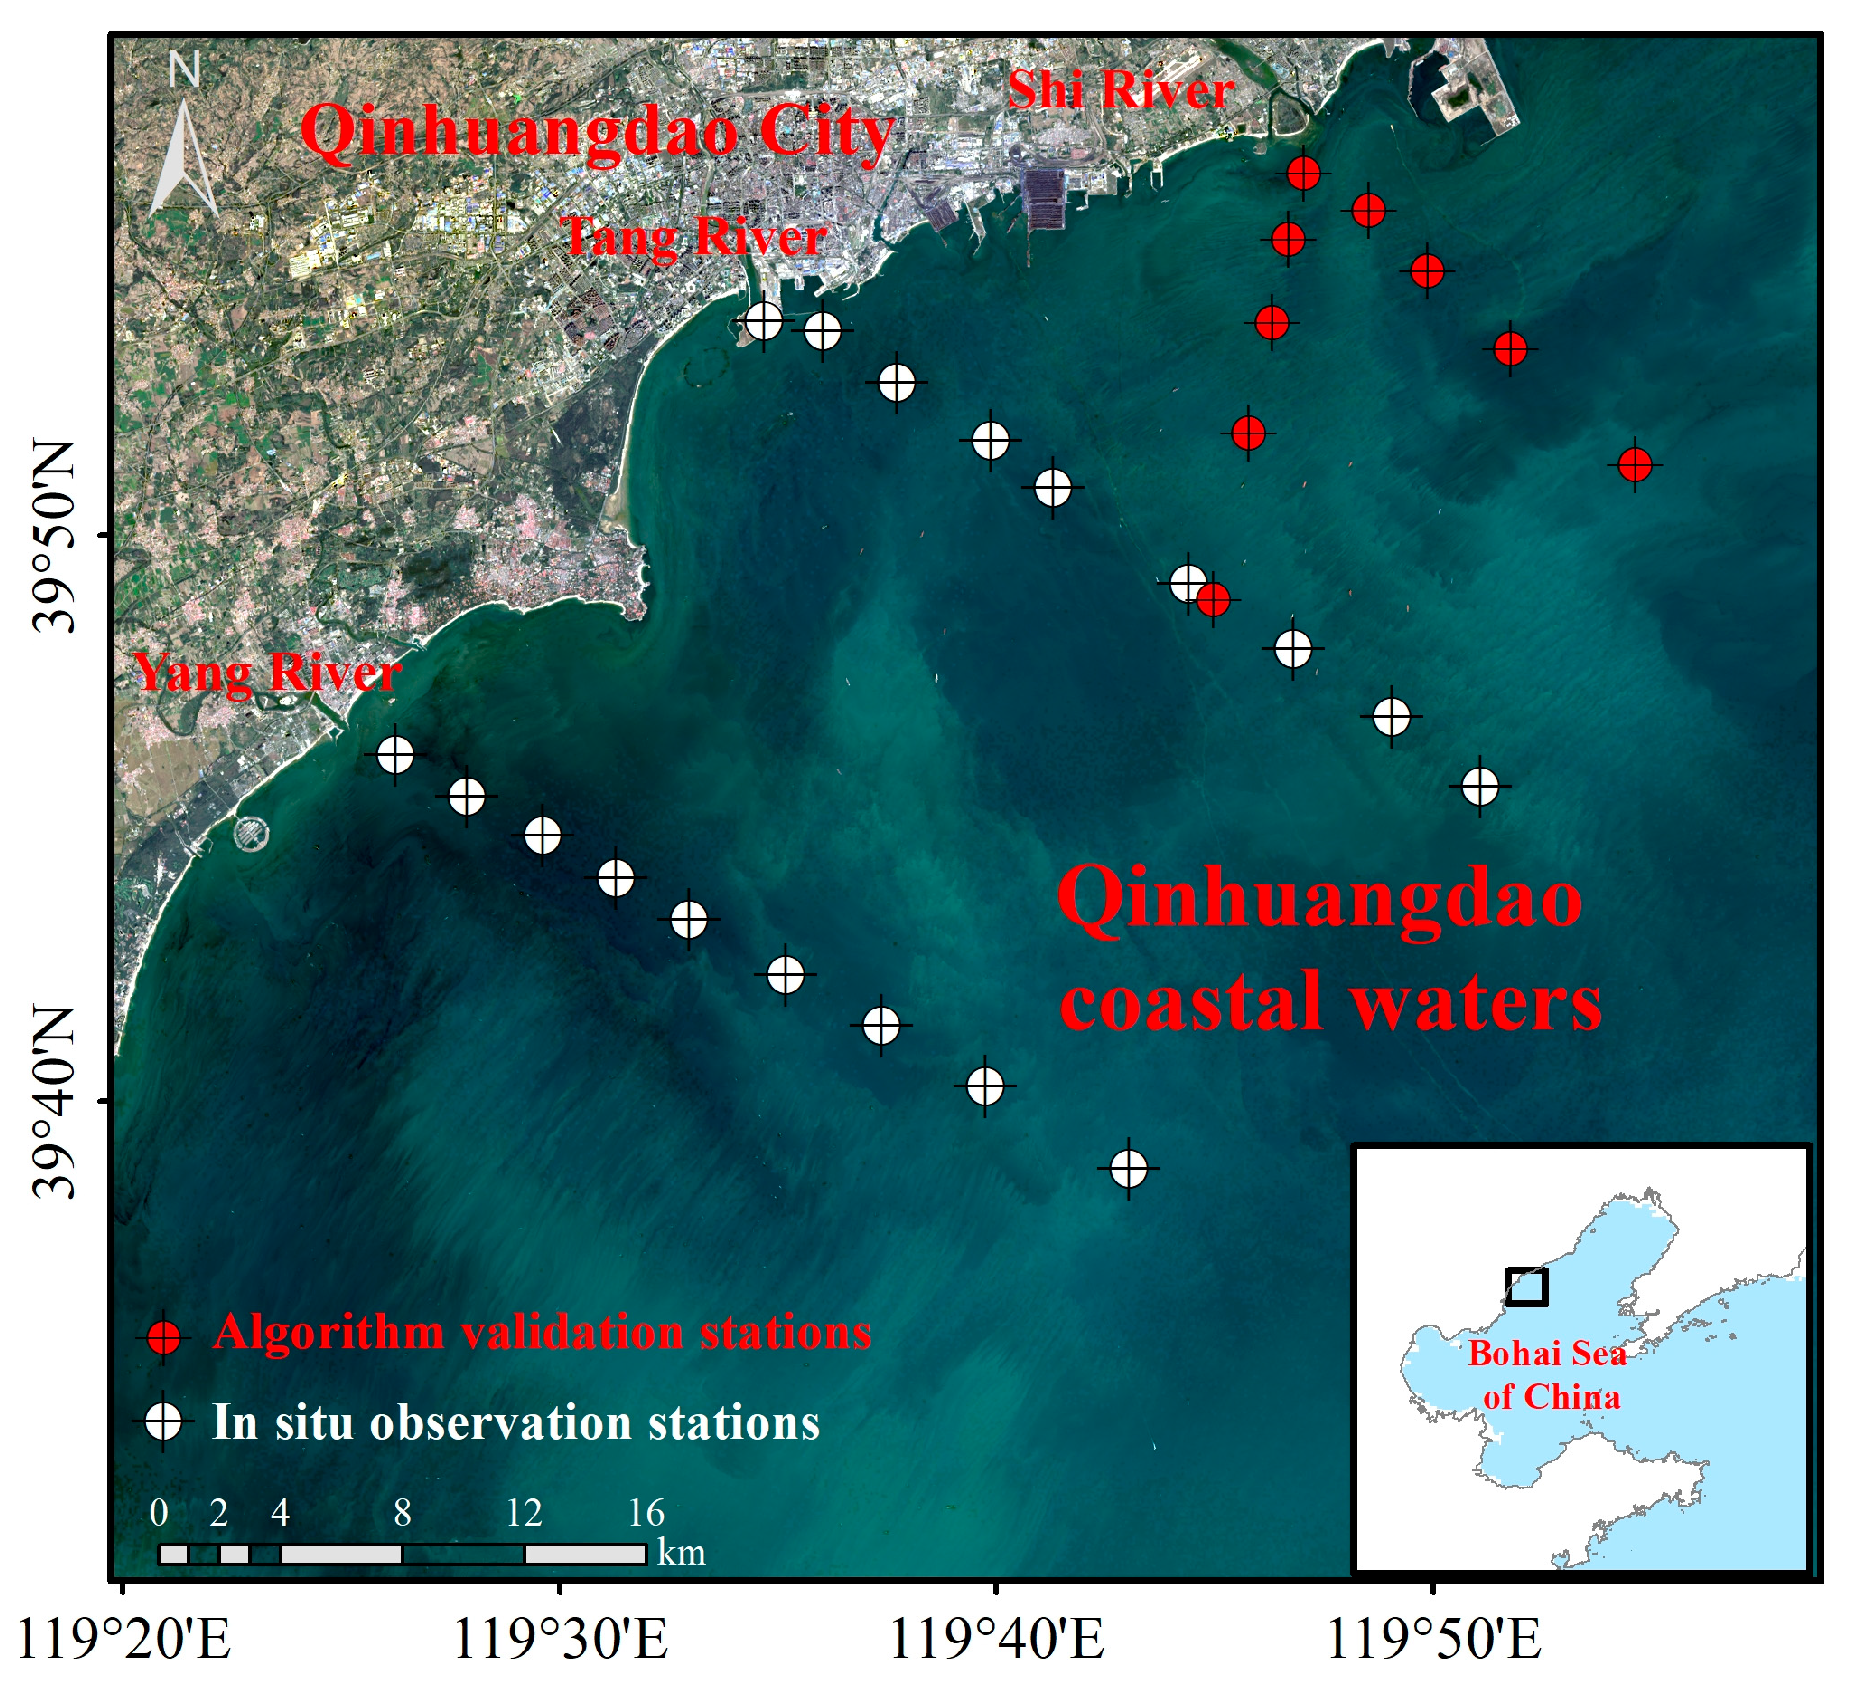
2.1. Research Area

Qinhuangdao, located on the west coast of the Bohai Sea in northeastern China, is an important coastal city known for its tourism and port activities. The hydrodynamic conditions in its coastal waters are relatively weak, resulting in clearer seawater compared to other coastal regions of the Bohai Sea. In this study, three field survey sections were established in the coastal waters, starting from the mouths of the Tang, Yang, and Shi Rivers. To examine the spatial and temporal shifts in regional transparency, a remote sensing inversion model for water SDD was subsequently created using the obtained data (Figure 1).

2.2. Data Sources

2.2.1. In Situ Measured Data

A comprehensive in situ measurement campaign was executed in July and December 2021, yielding 26 data points from the coastal region of Qinhuangdao, China. The parameters collected included the remote sensing reflectance (Rrs), Secchi Disk Depth (SDD), and the concentrations of major water-color constituents: chlorophyll a (Chla), total suspended matter (TSM), and colored dissolved organic matter (CDOM) (Figure 1). Regarding the methodology, the Rrs was obtained using an above-water spectrometer (ASD Inc., Boulder, CO, USA). The SDD values were established by the Secchi disk method. The quantification of the TSM involved the weighing method, Chla levels were ascertained via fluorescence, and the CDOM was evaluated through spectrophotometry.
The in situ hyperspectral Rrs(λ) data were then used to calculate the equivalent multispectral Rrs(λi) based on the Sentinel-3 OLCI spectral response function, as shown in Equation (1):
R rs λ i = 380 1050 R rs λ F s λ f λ i d λ 380 1050 F s λ f λ i d λ
Here, Fs(λ) refers to the mean solar radiative flux at the top of the atmosphere, and f(λi) is the spectral response function at λi.
In this study, the SDD inversion model was developed using 18 in situ samples collected from the Yang River and Tang River estuary areas in July 2021. To further evaluate the model, validation was performed using an independent dataset of 8 samples collected from the Shi River area in December 2021. This approach helped to mitigate overfitting by ensuring that model evaluation was based on data collected at a different time and location than the training set.

2.2.2. Satellite Data

This study employed Level 2 Sentinel-3 OLCI data (300 m spatial resolution) for the inversion of SDD. Subsequently, the spatiotemporal variation of the SDD from 2018 to 2024 was characterized. Access to the Sentinel-3 OLCI satellite data was granted through the Copernicus Data Space Ecosystem (https://browser.dataspace.copernicus.eu, accessed on 25 February 2025).

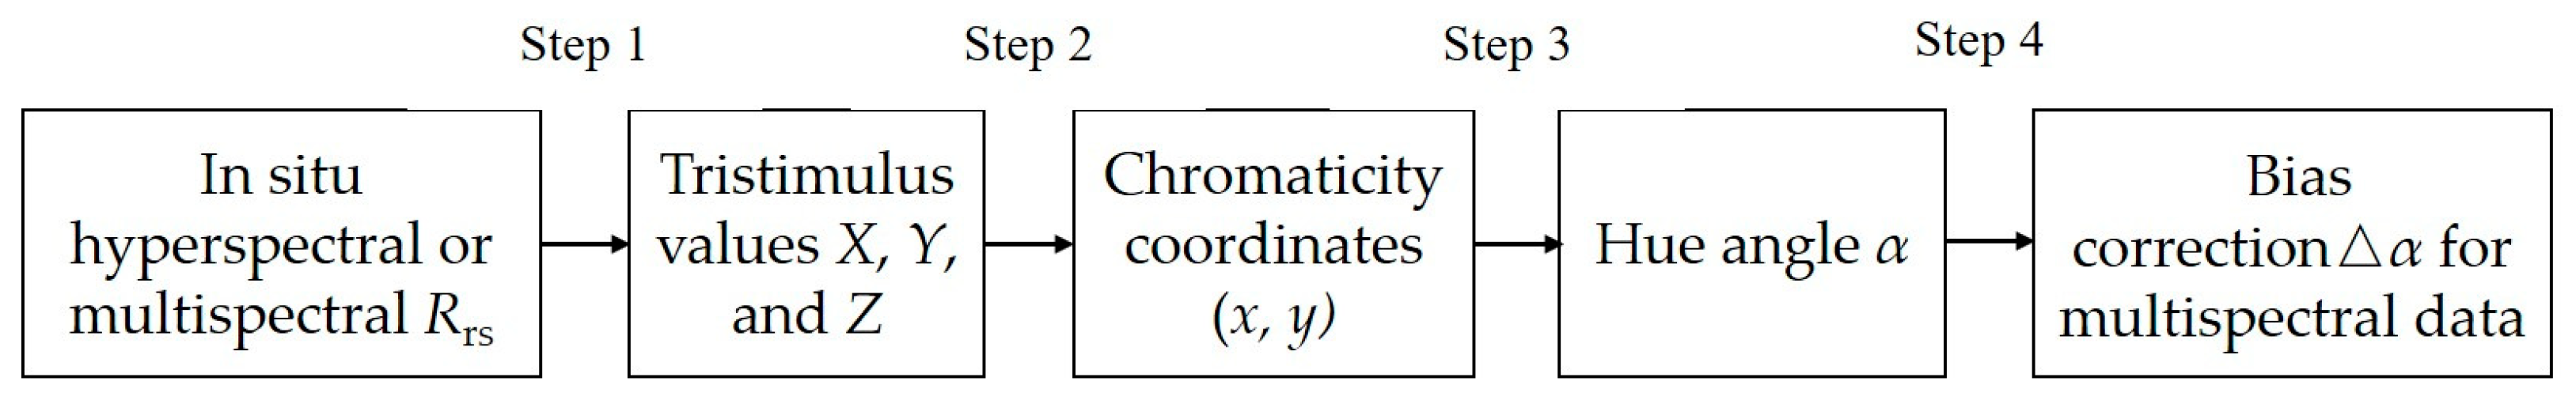
2.3. Derivation of Hue Angle

For this study, in situ hyperspectral measurements and Sentinel-3 OLCI multispectral data were transformed into the hue angle using the CIE 1931 XYZ standard color system, involving a series of computational steps, enabling intuitive visualization and analysis of seawater color characteristics. The derivation process of the hue angle is shown in Figure 2, and the specific steps are as follows.
Initially, the tristimulus values X, Y, and Z of the spectrum are computed to characterize the color. For the observed hyperspectral Rrs(λ), these tristimulus values can be derived directly from Equations (2)–(4) [35].
X = K 380 700 S λ R r s λ x ¯ λ d λ
Y = K 380 700 S λ R r s λ y ¯ λ d λ
Z = K 380 700 S λ R r s λ z ¯ λ d λ
In this context, S(λ) represents the relative spectral energy distribution of the illuminating light source. Additionally, x ¯ λ , y ¯ λ , and z ¯ λ serve as the CIE color matching functions, and K denotes the correction factor.
The tristimulus values X, Y, and Z for the satellite multispectral Rrs(λi) were derived from Sentinel-3 OLCI data. This calculation utilized the eleven visible light bands via a linear interpolation method [36,37]. The governing equations are (5)–(7).
X = i = 1 n x i R rs λ i
Y = i = 1 n y i R rs λ i
Z = i = 1 n z i R rs λ i
The variable n = 11 identifies the number of visible light bands utilized by the Sentinel-3 OLCI. Furthermore, xi, yi, and zi correspond to the band linear summation coefficients [36].
Utilizing Equations (8) and (9), the chromaticity coordinates x and y were computed from X, Y, and Z.
x = X / ( X + Y + Z )
y = Y / ( X + Y + Z )
The hue angle α was then computed from x and y using Equation (10), as defined by Wang S.L. et al. [27], a method commonly adopted in recent years.
α = arctan 2 x 1 / 3 , y 1 / 3 180 π + 180 ,
where the arctan2 function represents the bivariate arctangent.
Hyperspectral sensors (like field spectroradiometers) are often considered highly accurate, much like the human eye, with their observations generally taken as ground truth. However, multispectral sensors (such as ocean color satellite sensors like MODIS and OLCI) have fewer and more discrete spectral bands, which can introduce biases into their observations. Therefore, bias correction for the hue angle is essential.
For the Sentinel-3 OLCI multispectral data used in this study, the bias correction equation [38] derived from Wang S.L. et al.’s hue angle definition was fitted using a dataset primarily composed of lake water. This limits its applicability to ocean waters. In contrast, Woerd and Wernand [36] defined the hue angle earlier, and their bias correction equation was fitted using a dataset that included both ocean and lake water, making it more suitable for our research.
Consequently, we needed to convert the hue angle calculated using Wang S.L. et al.’s definition to the hue angle defined by Woerd and Wernand [36] (the sum of the two hue angle definitions equals 270). Subsequently, we applied bias correction using Equation (11) as fitted by Woerd and Wernand. Finally, after bias correction, the hue angle was converted back to Wang S. et al.’s definition for further model development.
α = 12.5076 α m u l t i 100 5 + 91.6345 α m u l t i 100 4 249.8480 α m u l t i 100 3 + 308.6561 α m u l t i 100 2 165.4818 α m u l t i 100 + 28.5608
It is particularly noteworthy that the hue angle deviation must be corrected using a calibration equation derived under the same definition framework. Otherwise, further errors may be introduced. This is a technical detail that is often overlooked.

2.4. Evaluation Method

To assess the performance of the retrieval model and pinpoint the most precise version, we employed three critical evaluation metrics. These include the coefficient of determination (R2), the mean absolute percentage error (MAPE), and the root mean square error (RMSE), as formally outlined in Equations (12)–(14).
R 2 = i = 1 n S D D retrieval , i S D D measured ¯ 2 i = 1 n S D D measured , i S D D measured ¯ 2
M A P E = i = 1 n S D D measured , i     S D D retrieval , i S D D measured , i n × 100 %
R M S E = i = 1 n S D D measured , i S D D retrieval , i 2 n
S D D retrieval , i signifies the i-th value obtained from the model, and S D D measured , i is the i-th observed measurement. The mean of the measured values is given by S D D measured ¯ , with n representing the total number of samples.
Considering the relatively small number of in situ samples and the strong spatial–temporal heterogeneity of coastal waters, we adopted an independent validation strategy. Specifically, 18 samples collected in July 2021 from the Yang River and Tang River estuary areas were used for model development, while 8 additional samples collected in December 2021 from the Shi River area were used for independent validation. This approach ensured that the training and validation datasets were both spatially and temporally distinct, thereby providing a more realistic assessment of the model’s generalizability and mitigating the risk of overfitting.

3. Results

3.1. Development of the Retrieval Model for the Study Area

For the purpose of modeling and comparative analysis, single-band, band-ratio, multi-band, and CIE hue angle (α) were chosen as sensitivity factors. Table 1 presents only the best-performing results for each algorithm type under different fitting models (A1 to A17), rather than all fitting outcomes, in order to maintain clarity and focus. The comparison reveals that the remotely sensed reflectance and SDD in the red-light bands show strong correlations in the single-band algorithms. Notably, the multiplicative power function fit using Rrs(681.25) as the independent variable yielded the best result (A4, R2 = 0.84, MAPE = 11.00%, RMSE = 0.38 m), followed by Rrs(673.75).
Among the band-ratio algorithms, the exponential function fit using Rrs(510)/Rrs(560) as the independent variable provided the best results (A9, R2 = 0.91, MAPE = 8.44%, RMSE = 0.28 m), with Rrs(490)/Rrs(560) performing second best, surpassing the single-band algorithms.
For the multi-band algorithms, the best performance was achieved by fitting a binary polynomial function using Rrs(442.5)/Rrs(560) and Rrs(510)/Rrs(560) as independent variables (A13, R2 = 0.91, MAPE = 8.40%, RMSE = 0.27 m), slightly outperforming the band-ratio algorithms. However, among all regression models, the SDD inversion algorithm (A16, A17), which incorporates the hue angle as the sensitivity factor, demonstrated the highest accuracy. In particular, the exponential function fit (A16) yielded the best results, with R2 = 0.93, MAPE = 7.88%, and RMSE = 0.25 m.
Further independent validation of the optimal algorithm (A16) was performed, revealing a maximum relative error of 21.04%, a minimum of 0.68%, and an average of 8.55%, indicating the algorithm’s good stability.
Based on these findings, the A16 algorithm was selected as the optimal model for inverting SDD in Qinhuangdao coastal waters. It was applied to the Level 2 Sentinel-3 OLCI data from 2018 to 2024 to further characterize the spatial and temporal distribution of seawater SDD.

3.2. Spatiotemporal Variation of SDD

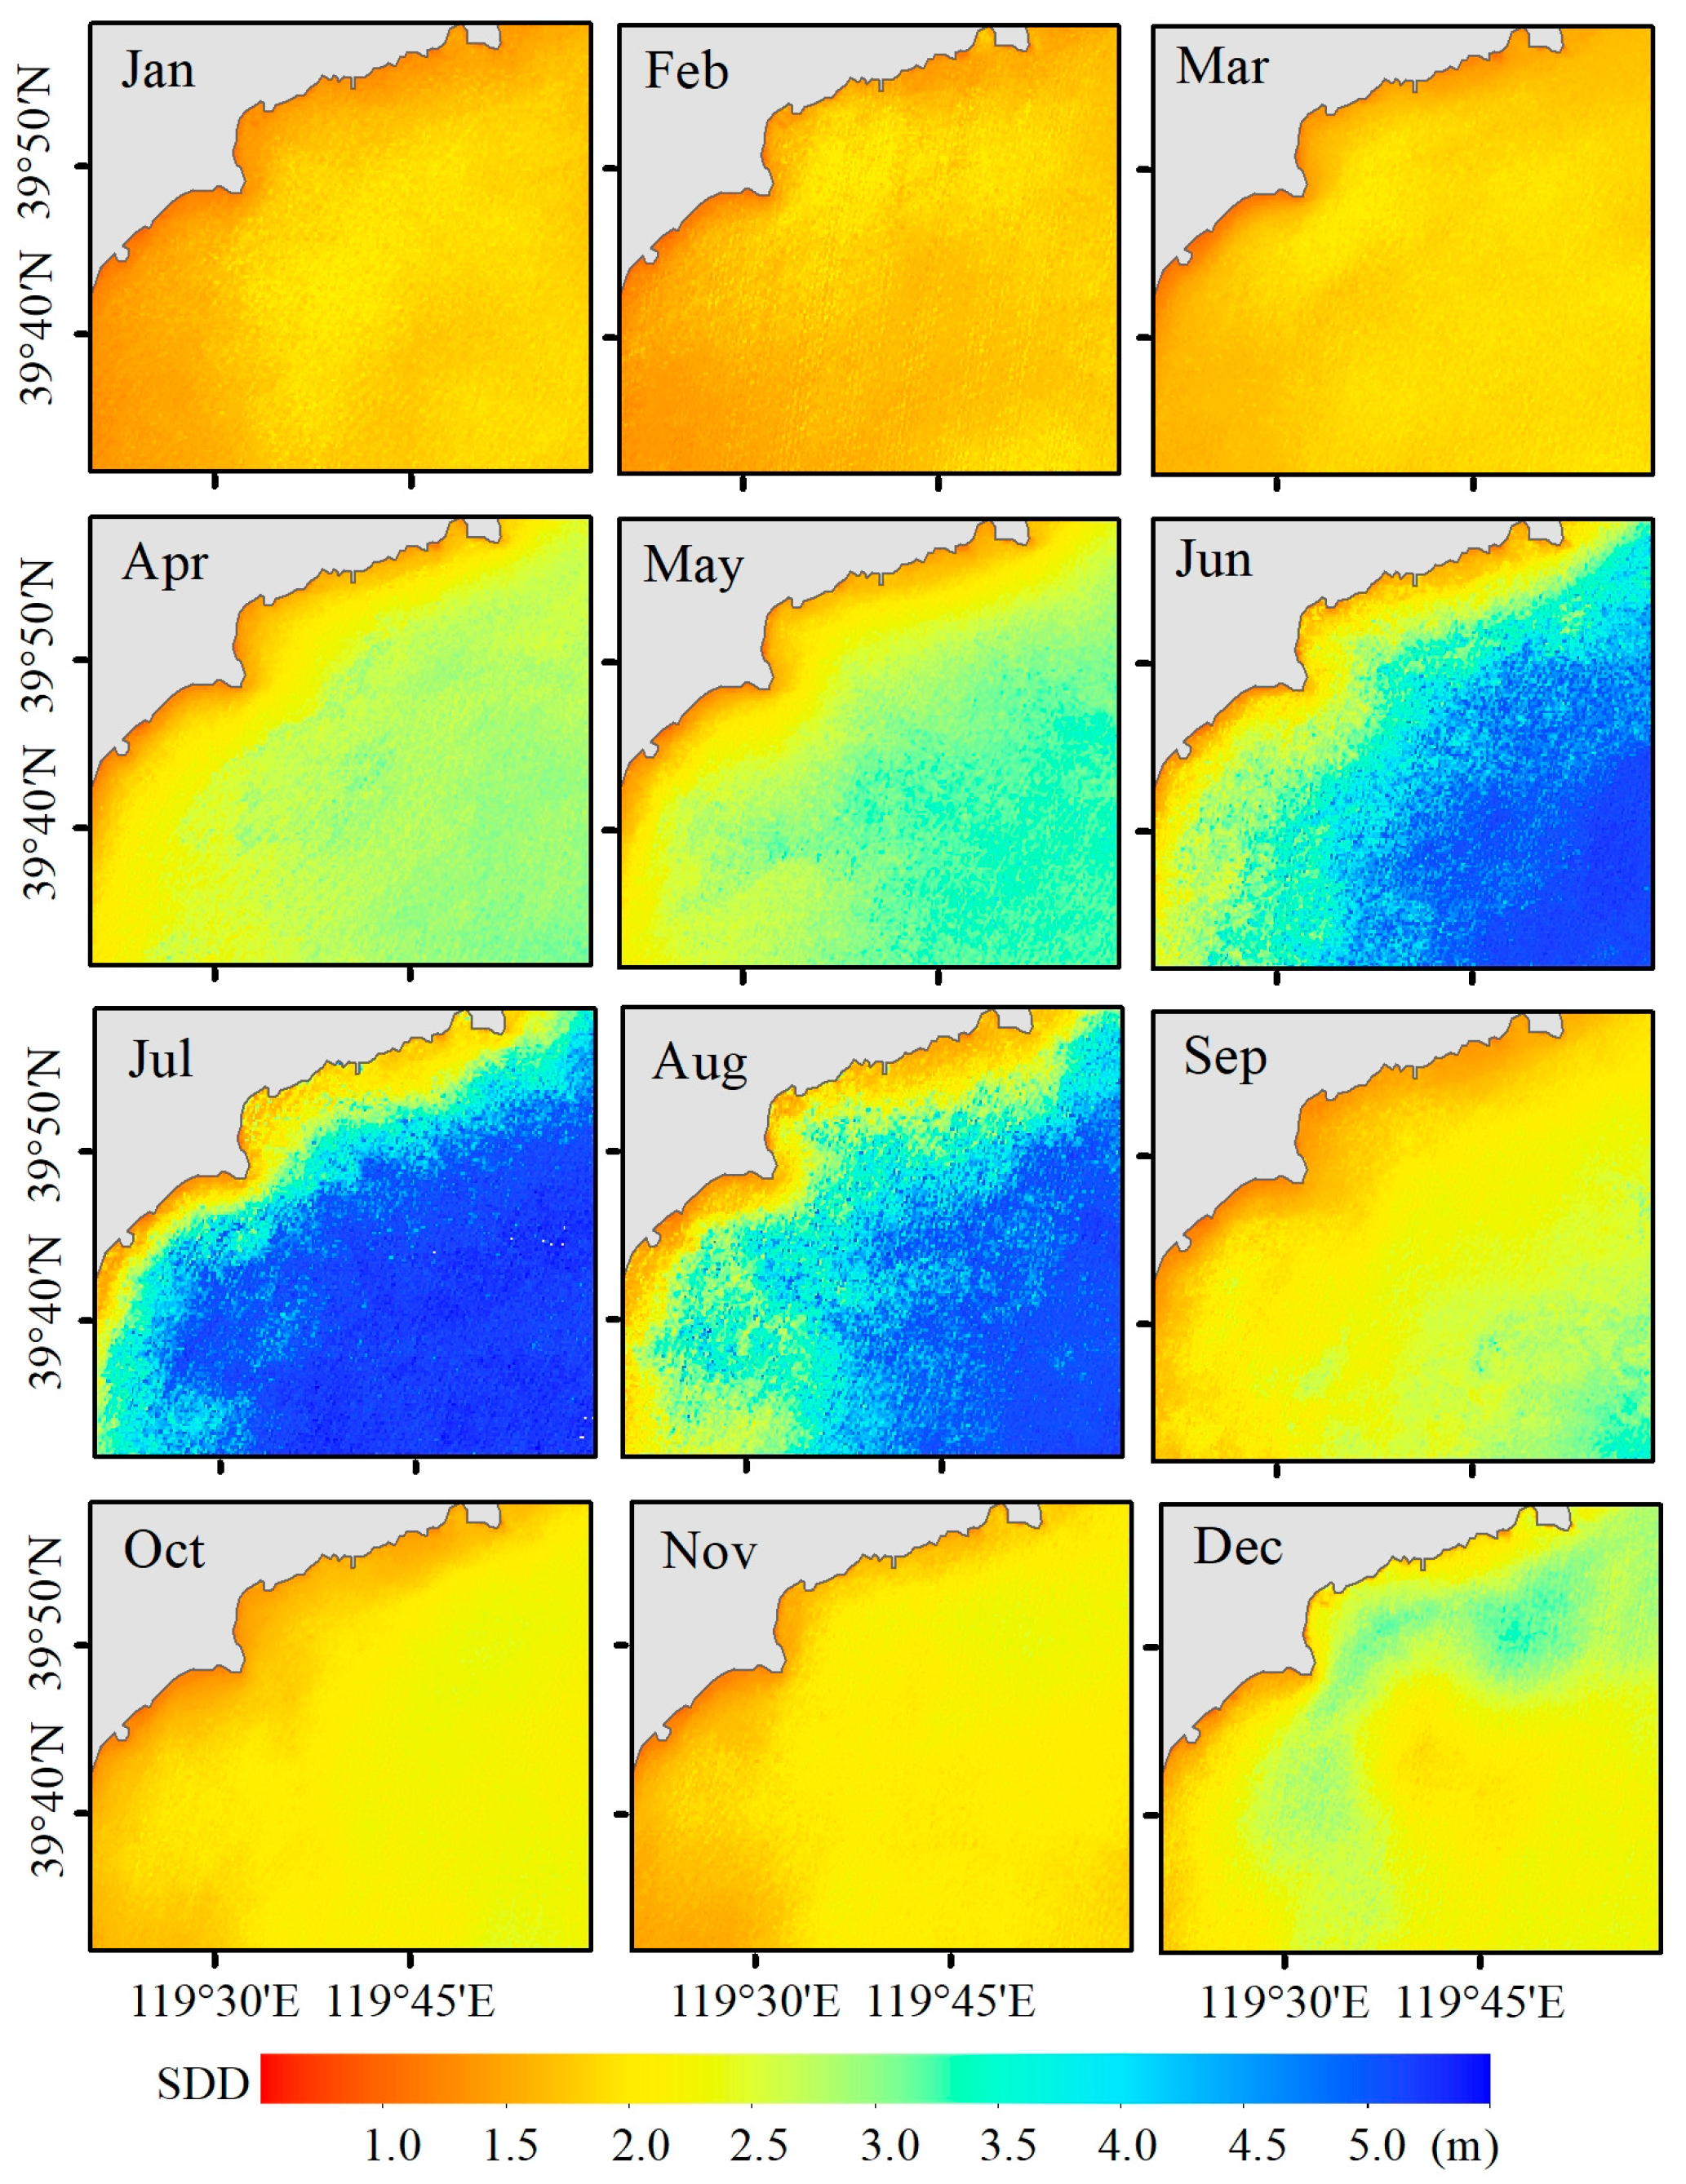
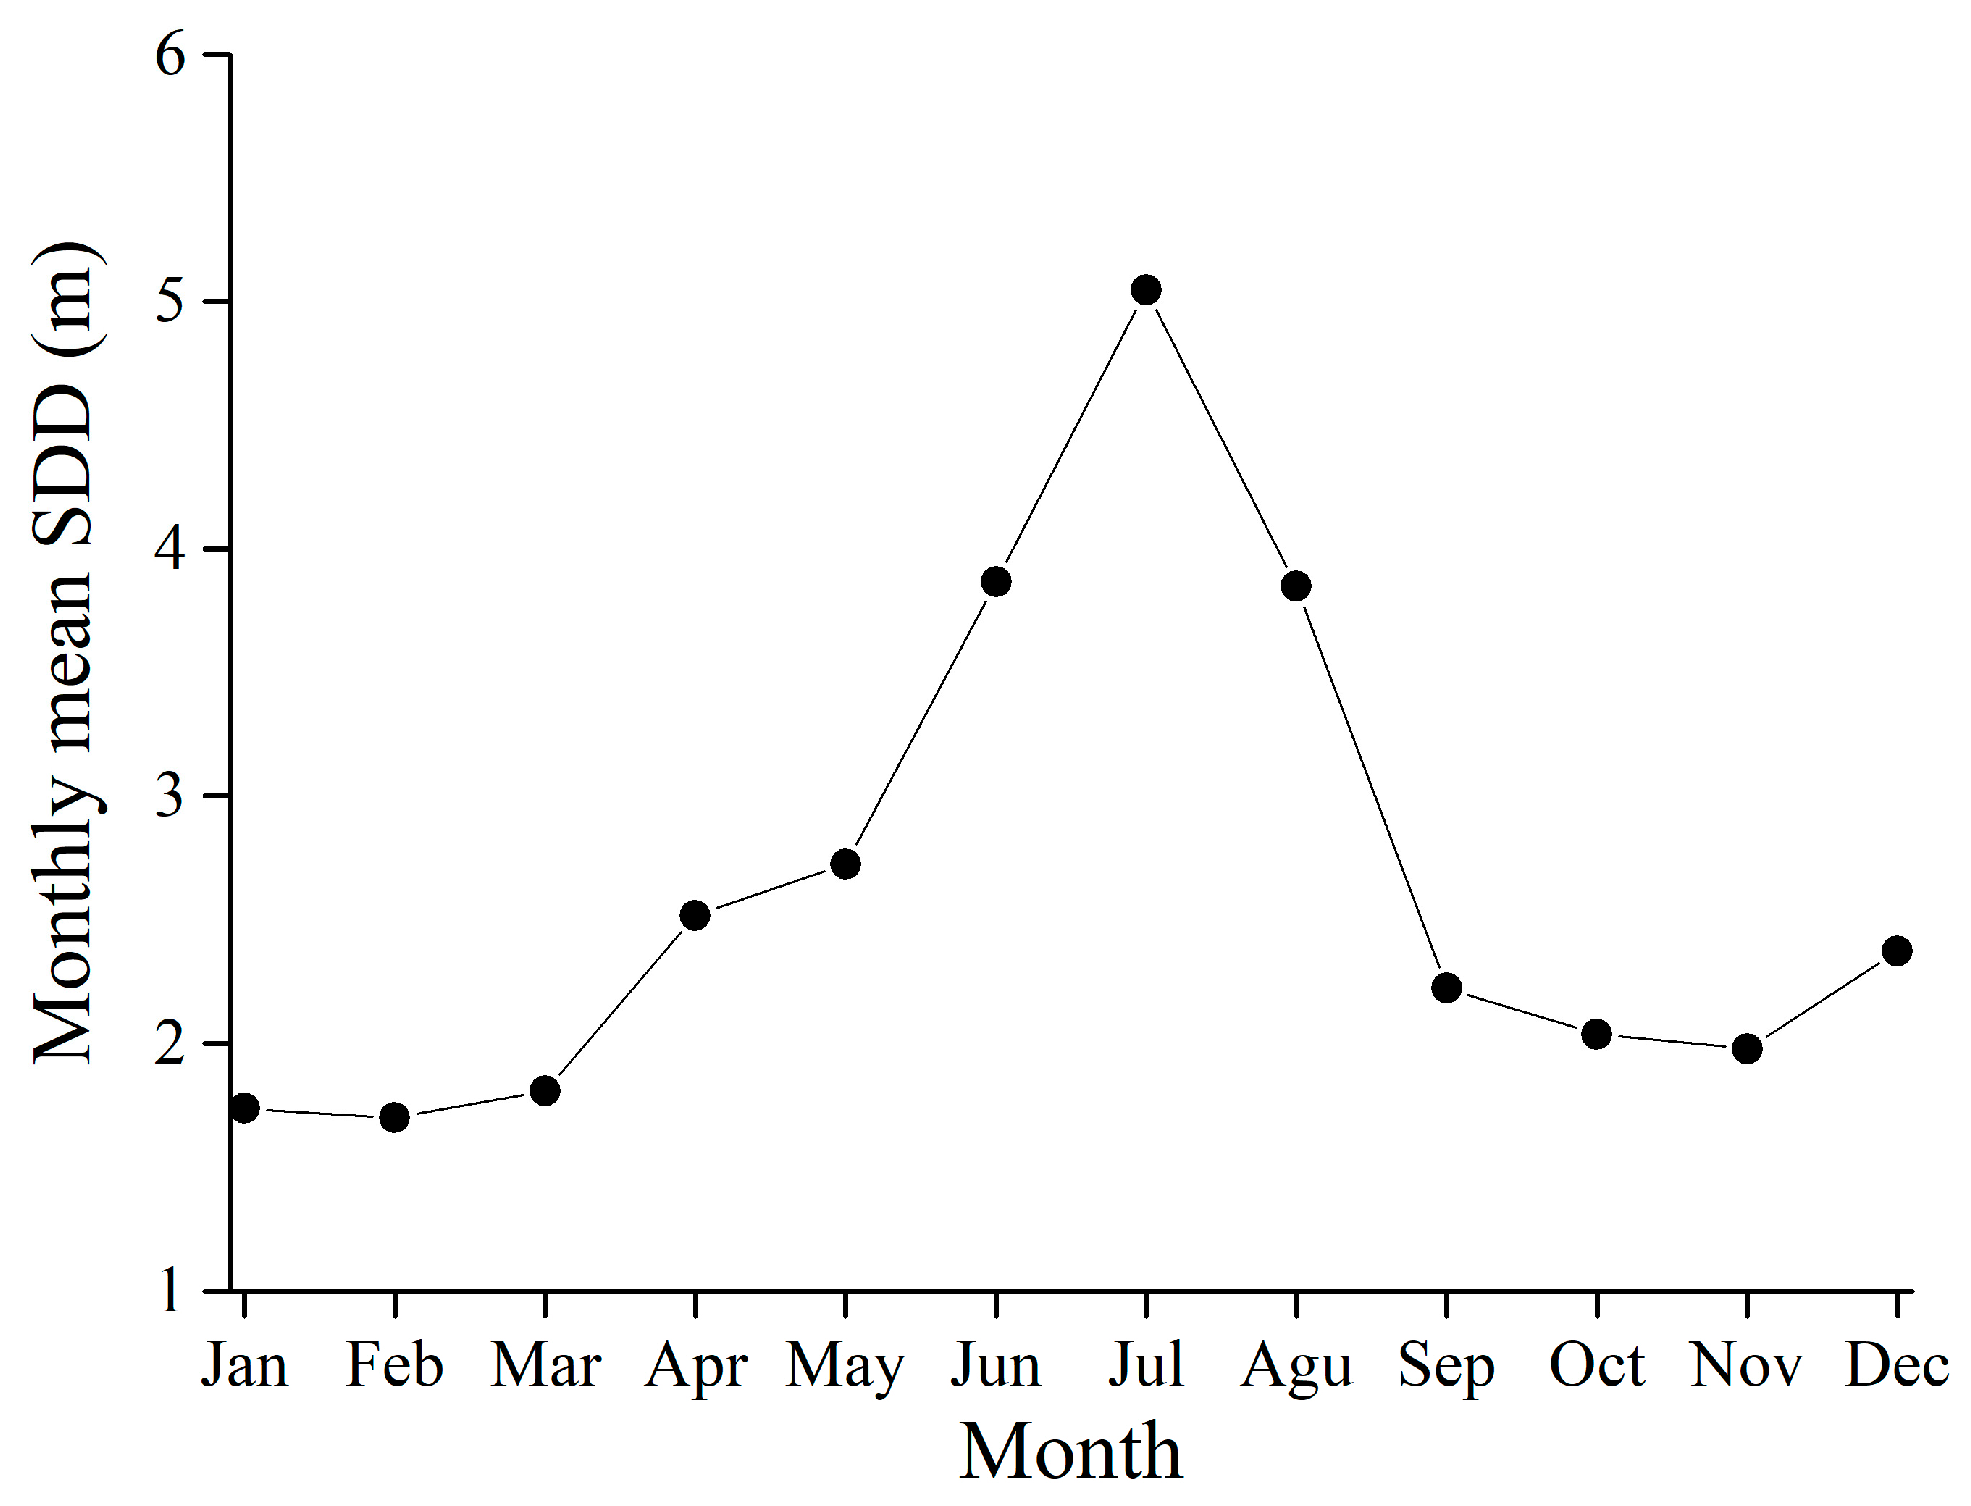
3.2.1. Monthly Spatiotemporal Variation

Distinct spatiotemporal characteristics are evident in the monthly SDD within Qinhuangdao’s coastal region (Figure 3). Spatially, the SDD is generally reduced near the coast and shows a gradual increase further offshore. A significant alteration in the SDD spatial gradient occurs from April through September, with peak changes noted between June and August. Nevertheless, this gradient largely maintains stability across other months.
Temporally, the lowest SDD values in the Qinhuangdao coastal waters are observed from January to March and from September to December, with moderate levels in April and May. The highest SDD occurs from June to August. Further statistical analysis indicates that the monthly mean SDD generally follows a trend of rising and then declining over the year, as depicted in Figure 4. The minimum value of the SDD is observed in February, with a monthly mean of 1.70 m. This gradually increases to a peak in July, reaching a monthly mean of 5.05 m, before decreasing again.

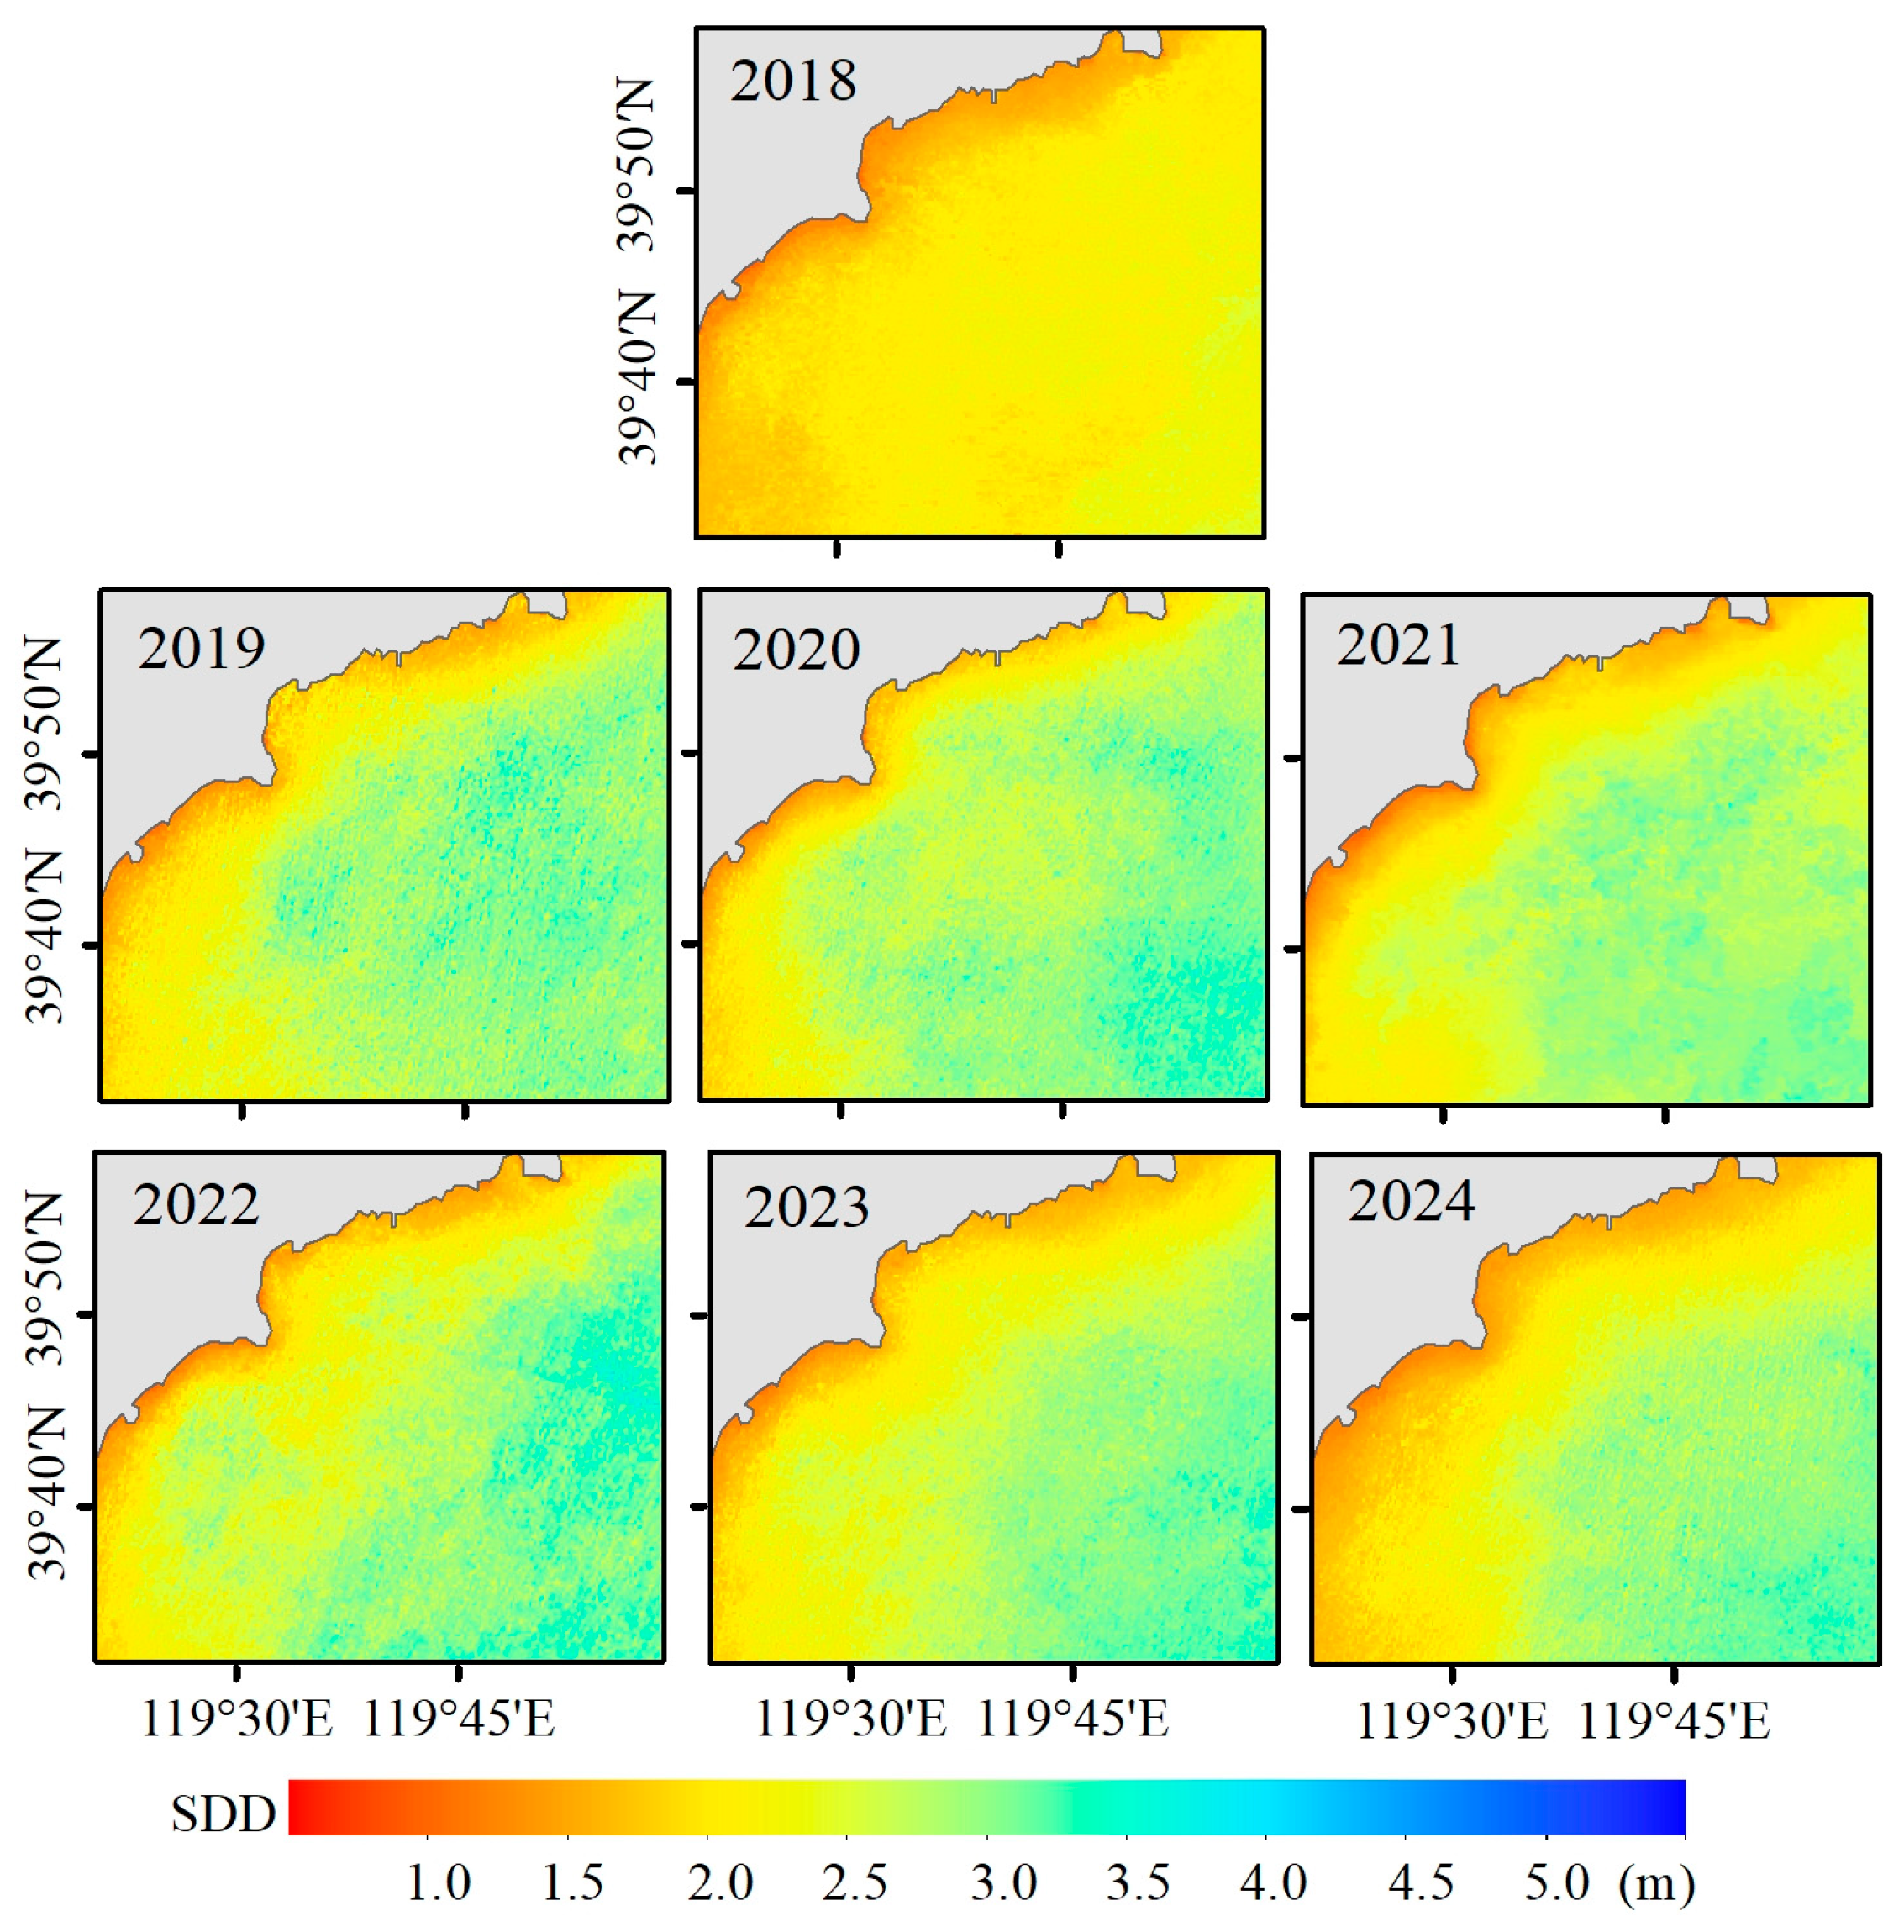
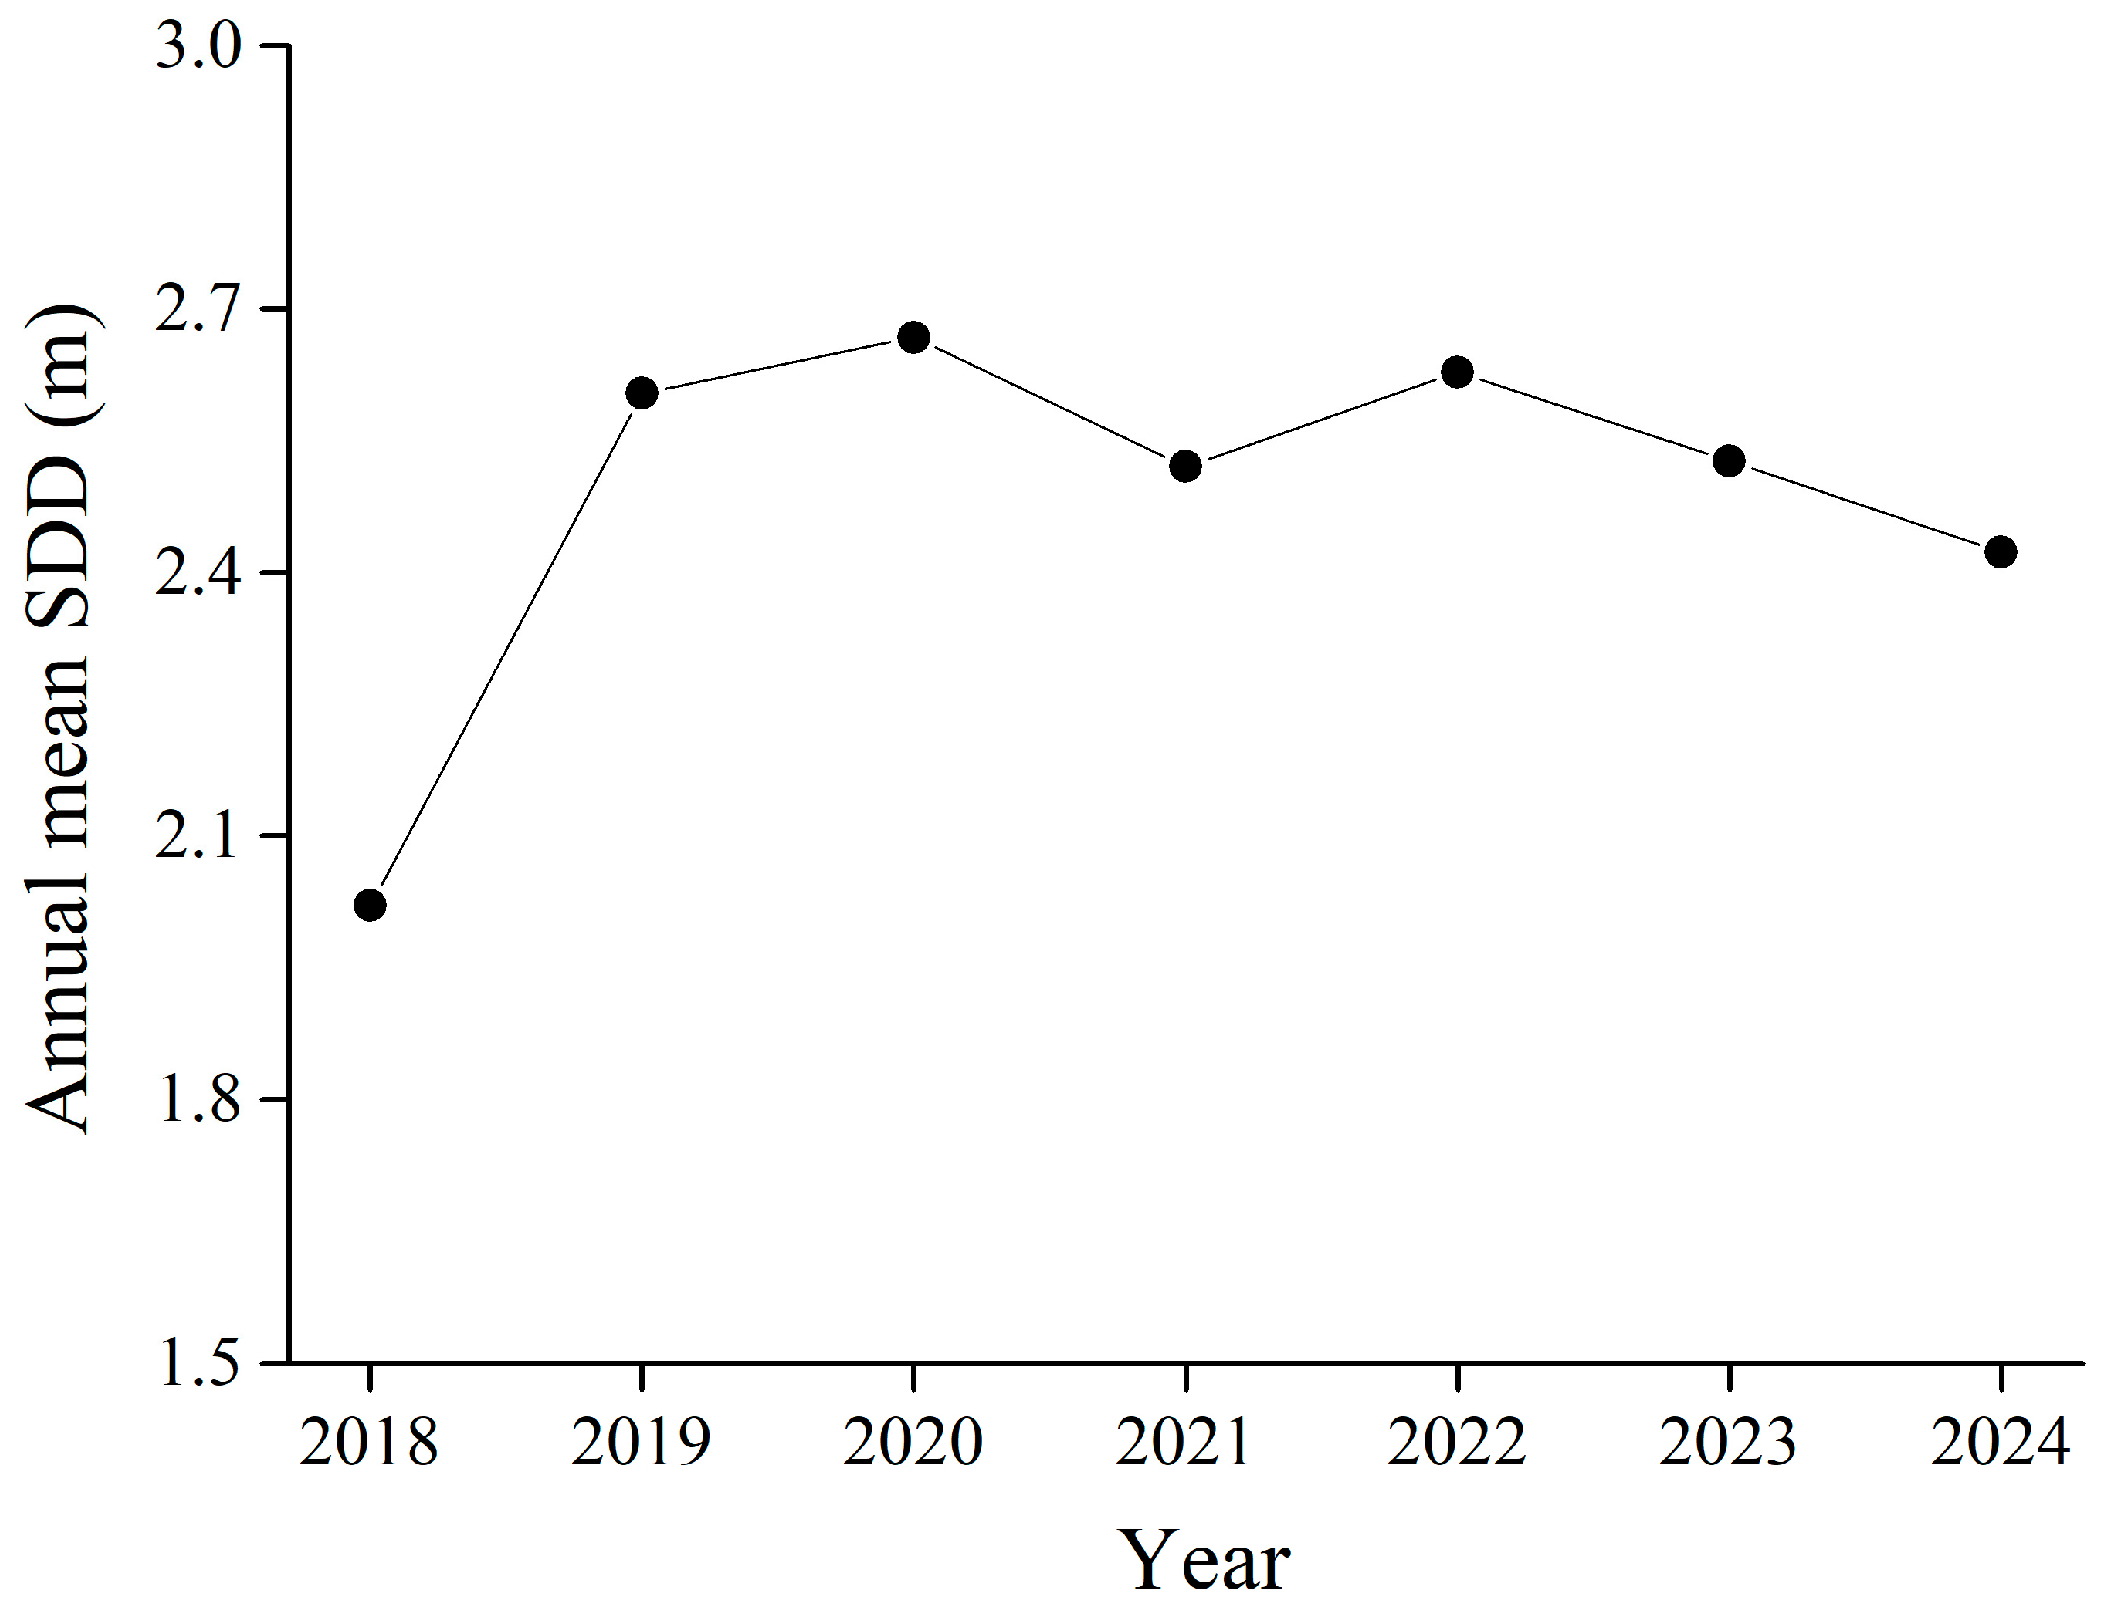
3.2.2. Interannual Spatiotemporal Variation

The interannual spatiotemporal variation of the SDD in the Qinhuangdao coastal waters is notable, as shown in Figure 5. Due to the influence of terrestrial inputs from rivers, nearshore SDD are typically lower than those found offshore. However, from 2019 onward, the SDD in the coastal waters have generally been higher, indicating clearer water.
The annual mean SDD in the Qinhuangdao coastal waters ranged from 2.02 to 2.67 m, as shown in Figure 6. The lowest SDD occurred in 2018, but since 2019, there has been a significant improvement in transparency. In 2020, the SDD reached its highest value. Although slight decreases were observed in individual years (e.g., 2021 and 2024), the SDD remained consistently above 2.4 m, reflecting relatively clear water conditions.

4. Discussion

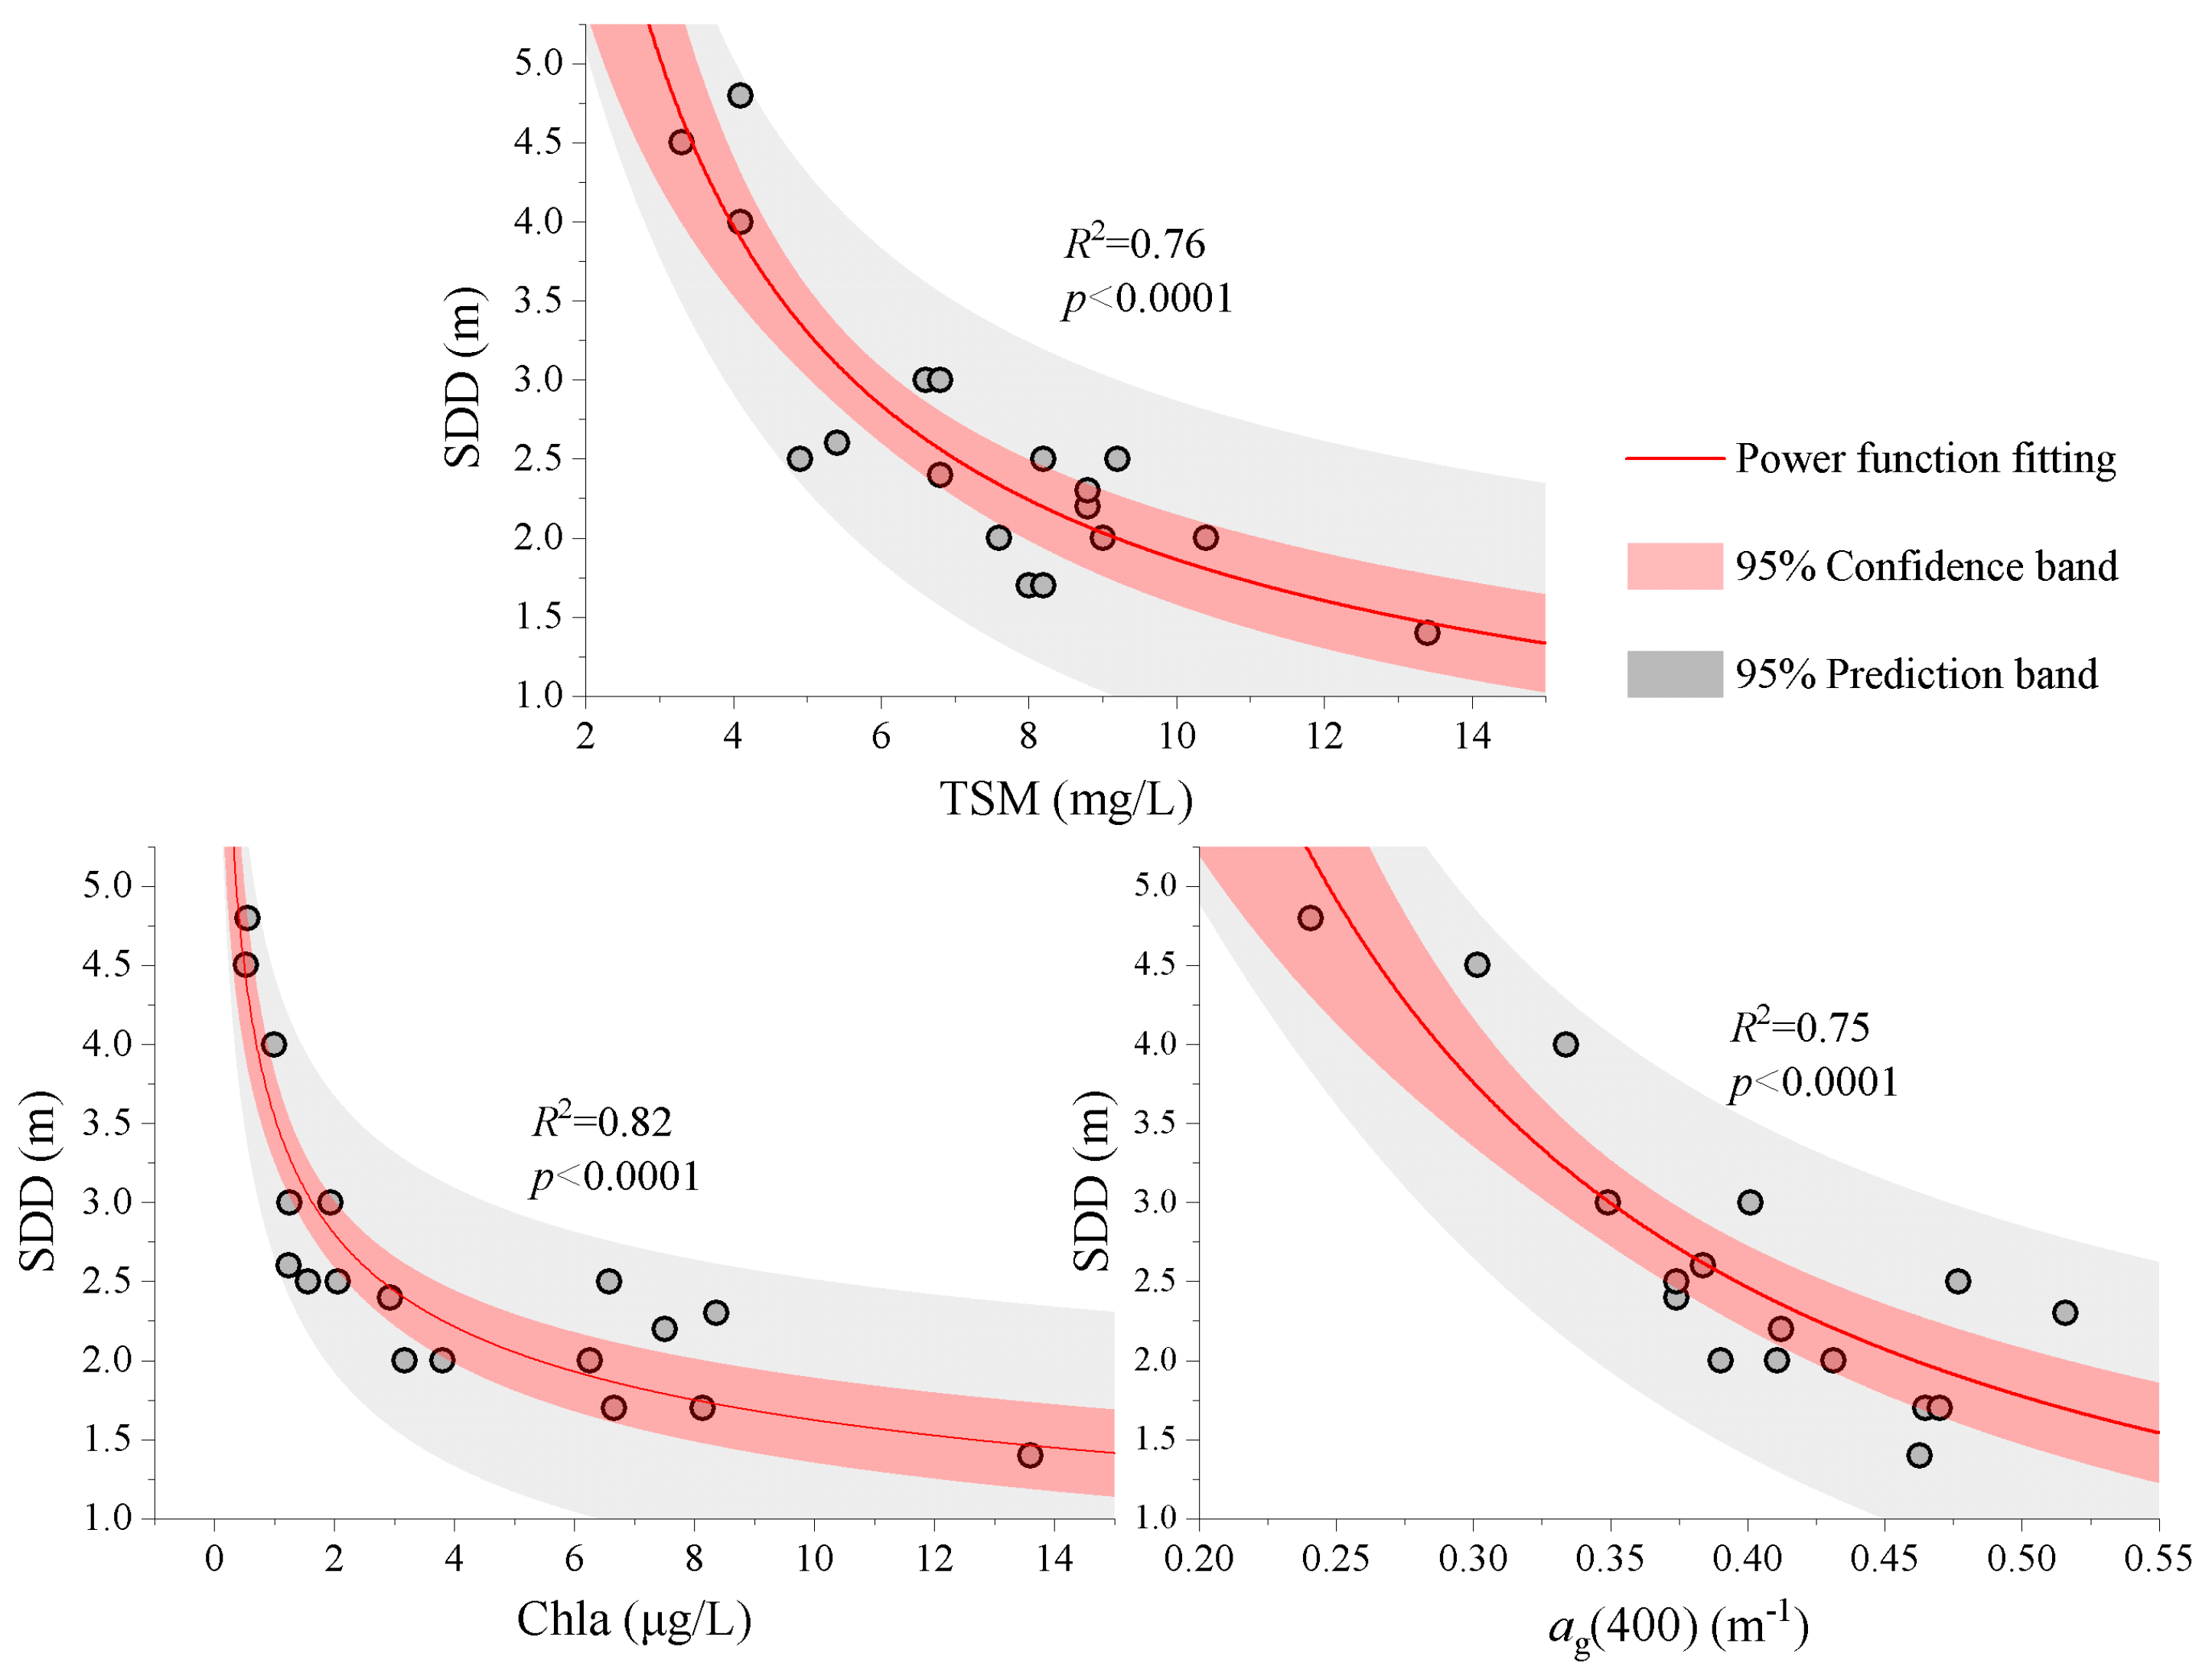
4.1. Correlation Analysis Between SDD and Water-Color Constituents

The field-measured SDD was found to be negatively correlated with the three water-color constituents—TSM, Chla, and CDOM absorption (ag(400))—as shown in Figure 7.
Among these, the strongest negative correlation was observed with Chla (R2 = 0.82), followed by slightly weaker correlations with TSM (R2 = 0.76) and CDOM (R2 = 0.75). All regression relationships were highly significant, with p-values < 0.0001, indicating strong statistical reliability despite the limited sample size. Additionally, the power-function regression models are visually accompanied by 95% confidence bands (shaded in pink) and 95% prediction bands (shaded in gray), which further illustrate the model uncertainty and prediction reliability. These results suggest that high concentrations of planktonic algae are the dominant factor influencing the water color and light attenuation in the coastal waters of Qinhuangdao.

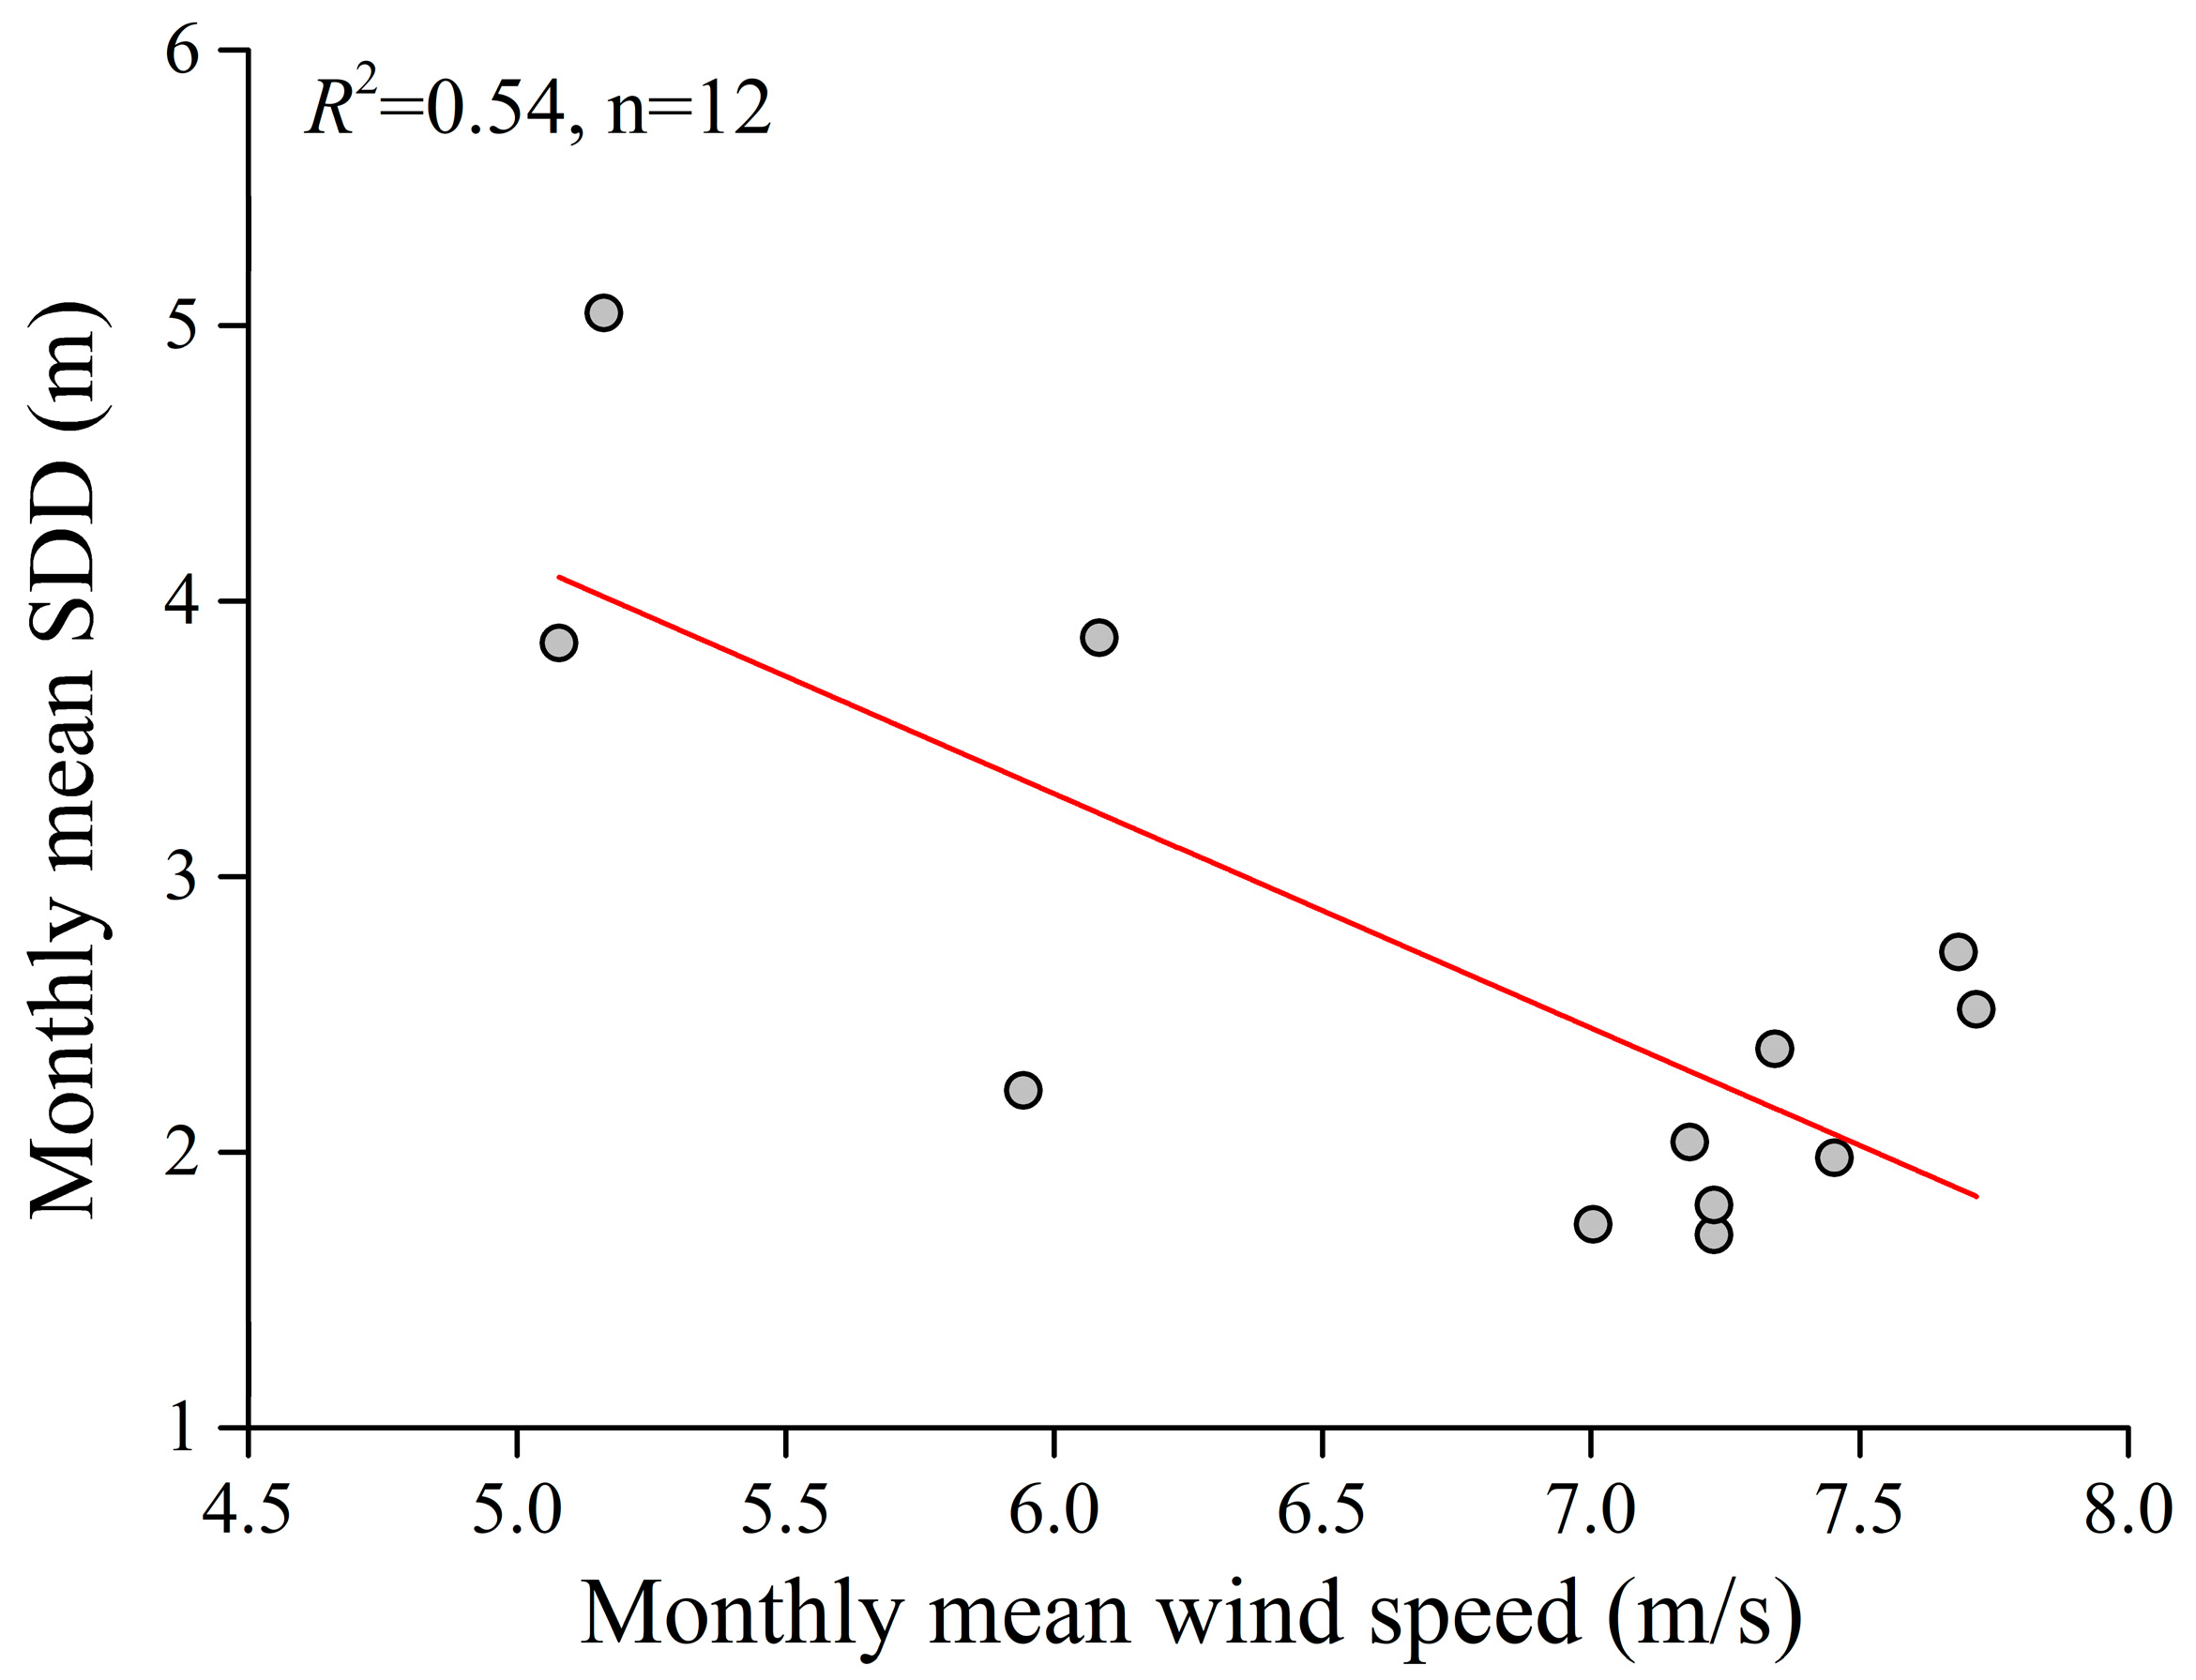
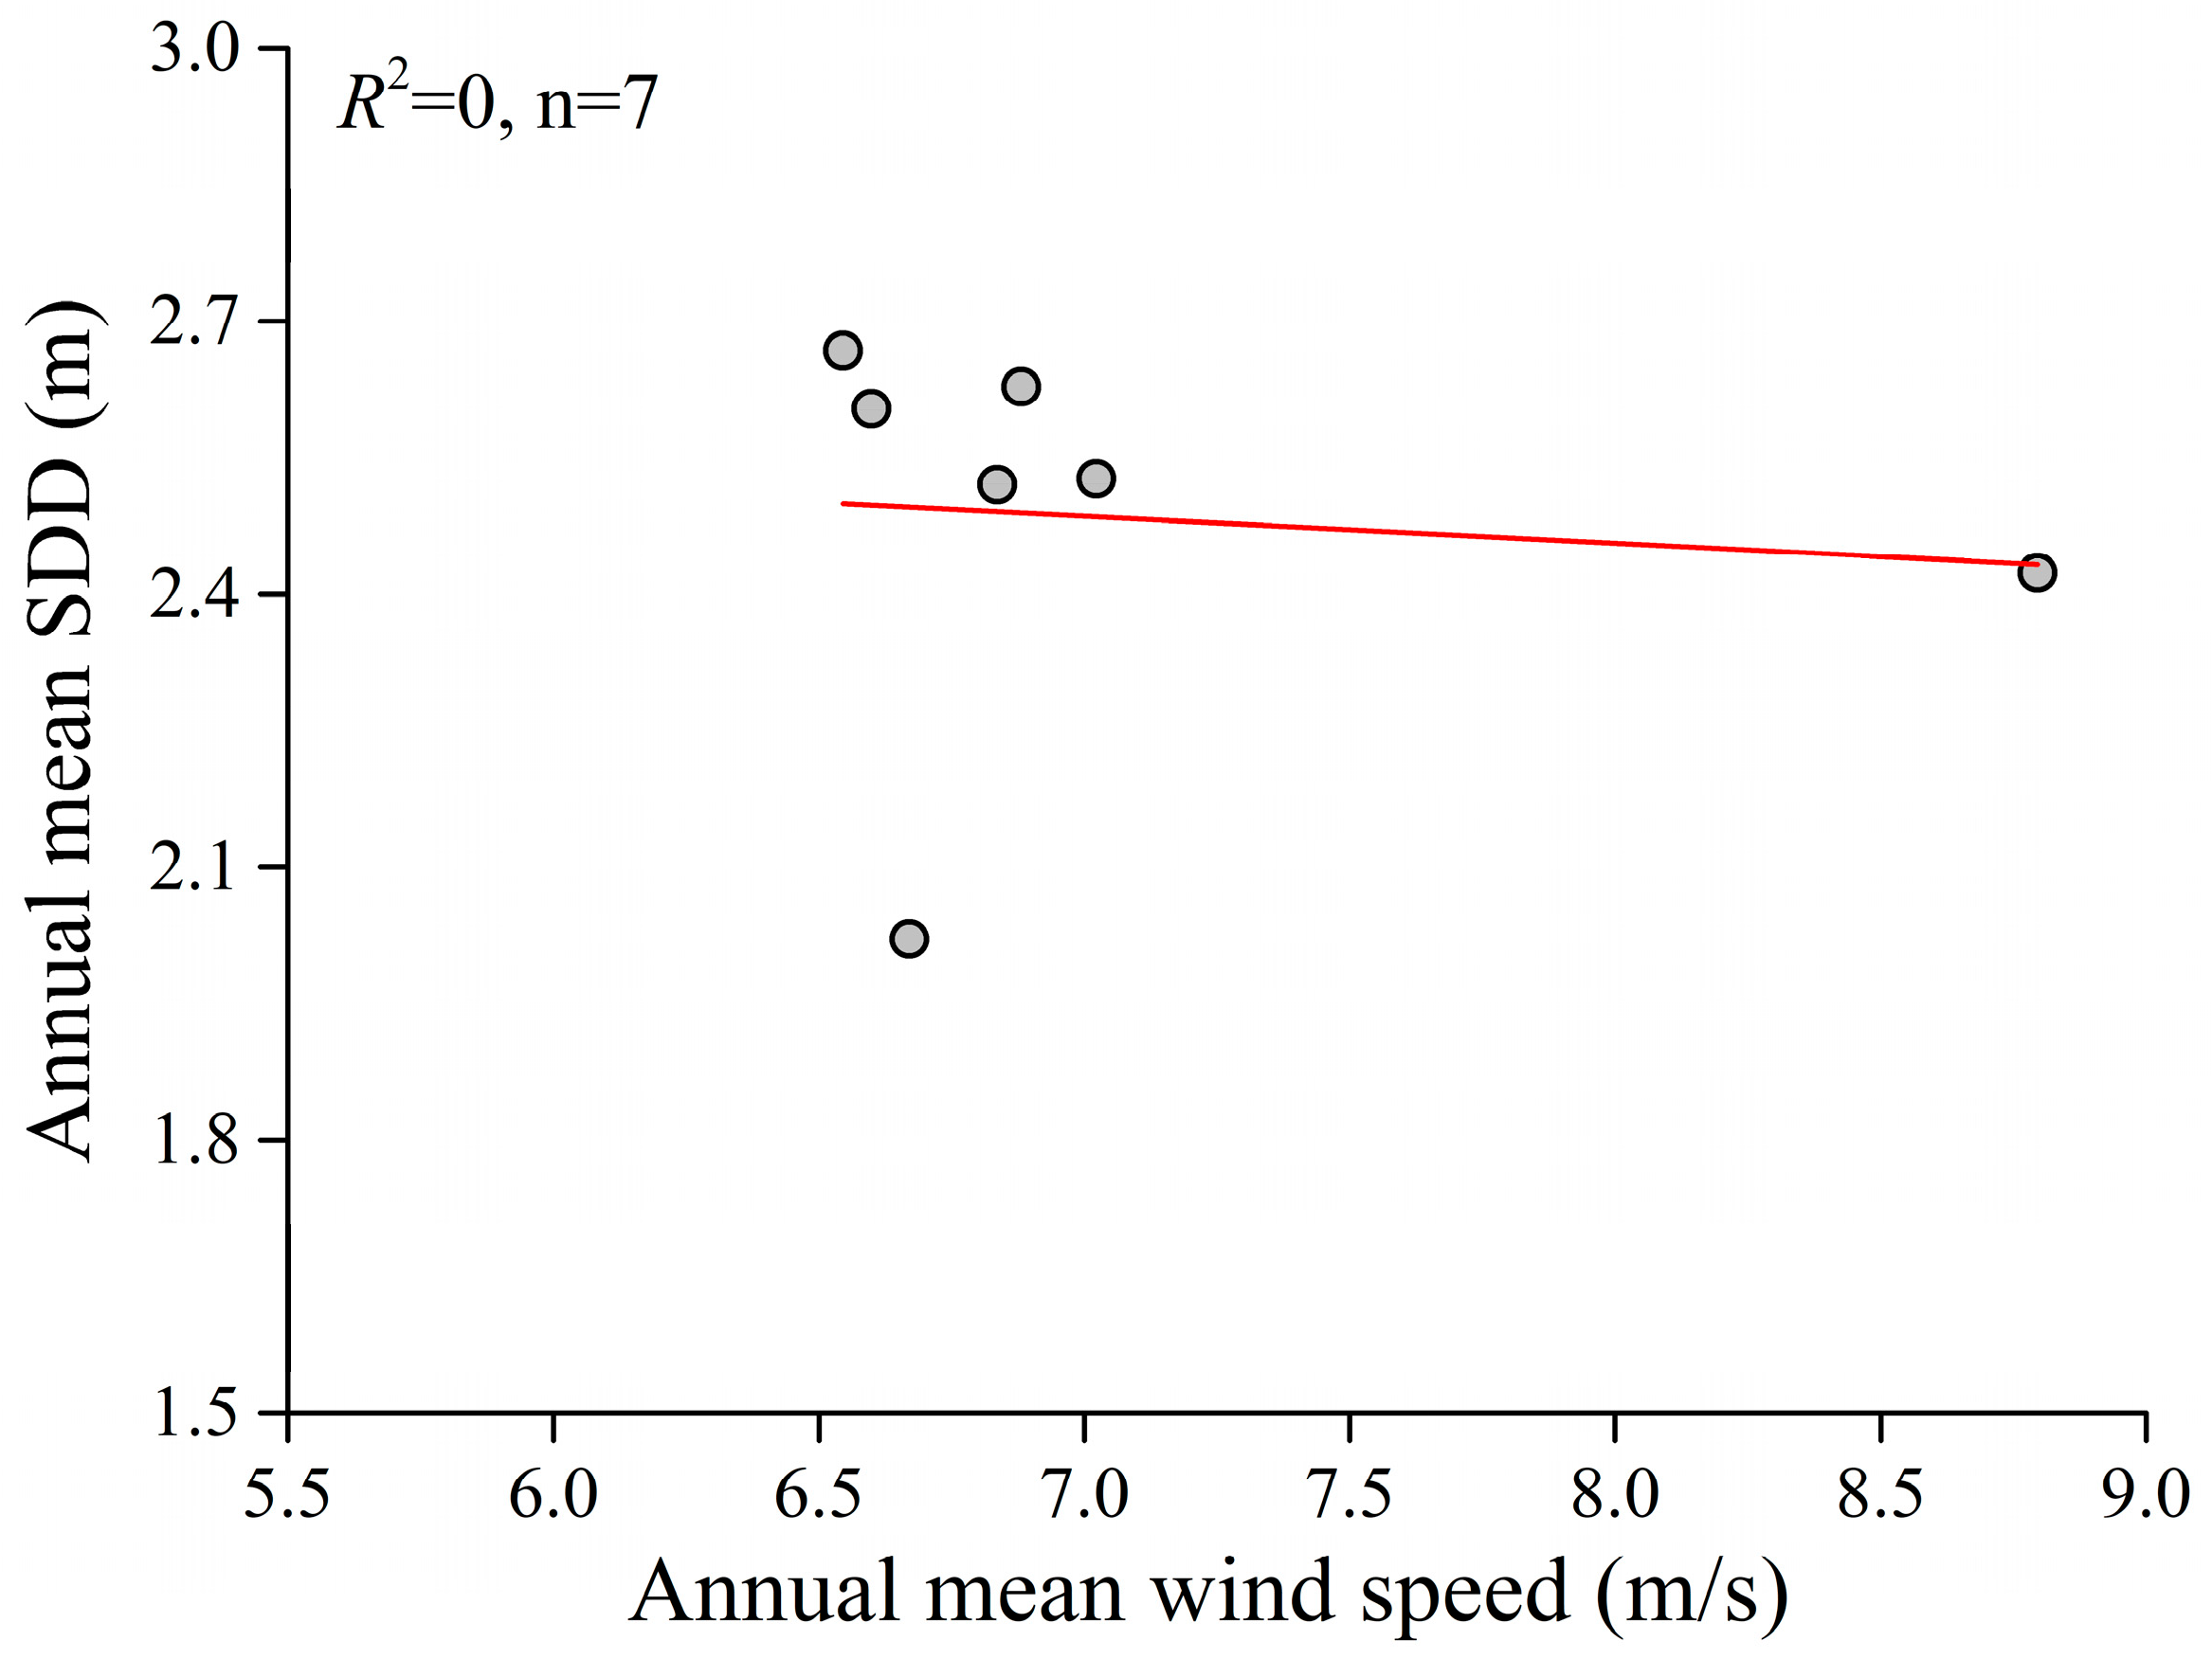
4.2. Analysis of the Influencing Factors of the Spatiotemporal Variation of SDD

The literature indicates that the SDD of coastal waters is influenced by various factors, including sediment resuspension due to high winds, the input of turbid land-based runoff, and the growth and distribution of planktonic algae [39]. The coastal waters of Qinhuangdao are particularly affected by land-derived runoff from several rivers, such as the Tang, Dai, Yang, and Shi Rivers, which transport significant amounts of nutrients and suspended particles. This leads to higher concentrations of planktonic algae and particles in the nearshore waters. Additionally, due to the relatively shallow water depths, sediment resuspension driven by wind, currents, and other dynamic factors is more pronounced. As a result, the SDD in the nearshore waters of Qinhuangdao is notably lower compared to the offshore waters.
Furthermore, Qinhuangdao’s coastal waters are located within the East Asian monsoon zone. This region is characterized by a sea surface wind field displaying prominent seasonal patterns. In winter, northwesterly winds prevail, with stable directions and stronger intensities. In contrast, summer sees southeasterly winds, which are weaker and more variable. Spring and autumn serve as transitional periods, marked by fragmented and unstable wind directions. This seasonal variation corresponds to changes in the SDD of the Qinhuangdao coastal waters from January to December, with stronger winds typically decreasing the SDD and weaker winds leading to higher SDD. A negative correlation exists between the mean monthly wind speed and the mean SDD (Figure 8), reinforcing the idea that the monthly variation in SDD is closely tied to surface wind speed. However, no correlation was found between the mean interannual wind speed and the mean SDD (Figure 9), suggesting that the interannual variation in SDD is not obviously influenced by sea surface winds and is likely driven by other factors.
Moreover, intense rainfall events during summer can lead to a sudden increase in terrestrial runoff, resulting in decreased SDD in the coastal waters near river estuaries. However, the influence of such rainfall events is generally short-lived and spatially limited to areas adjacent to the estuaries. Compared with the resuspension of particulate matter induced by persistent strong winds in winter, the impact of rainfall on the SDD is relatively minor. As a result, the SDD levels in summer remain higher than in other seasons. The effect of rainfall on the interannual variation of SDD can also be considered negligible.
From 2013 onwards, the Chinese government has robustly advocated for ecological civilization, guided by the principle that “lucid waters and lush mountains constitute invaluable assets”, resulting in a significant reduction in pollutant discharge. In late 2018, the Bohai Sea Comprehensive Management Initiative was officially launched, implementing stringent pollution control measures across the provinces and municipalities surrounding the Bohai Sea. These actions substantially reduced land-based sewage inflows, improved overall marine water quality, and by 2019, the area of Class I and II seawater quality had recovered to levels comparable to those observed in 2001. Concurrently, eutrophication levels declined, phytoplankton concentrations decreased, and the frequency of red tide events was significantly reduced.
Qinhuangdao, situated in the western Bohai Sea, is particularly sensitive to phytoplankton dynamics, as planktonic algae are the primary factor affecting SDD in this area. Given the close relationship between algal growth and nutrient concentrations, the implementation of pollution control measures—especially those under the Bohai Sea Initiative—led to a marked reduction in nutrient input. This, in turn, decreased algal abundance and resulted in a notable increase in SDD.
Government-led emission reduction initiatives, particularly the Bohai Sea Comprehensive Management Initiative, have played a crucial role in improving the interannual dynamics of SDD in the coastal waters of Qinhuangdao. Despite these positive outcomes, the slight decline in SDD observed between 2021 and 2024 indicates that ecological restoration is a protracted and multifaceted challenge. This underscores the imperative for ongoing reinforced environmental governance and adaptive management strategies to ensure long-term ecosystem resilience and water quality improvement.

5. Conclusions

This study developed and validated a novel hue angle-based satellite remote sensing algorithm for accurately retrieving SDD in the coastal waters of Qinhuangdao. Compared with traditional empirical models using remote sensing reflectance or band combinations as input variables, the proposed hue angle-based exponential model demonstrated superior performance (SDD = 47.576 × e−1.729*(a/100); R2 = 0.93, MAPE = 7.88%, RMSE = 0.25 m). As a quantitative descriptor of water color, the hue angle effectively captures water transparency and turbidity characteristics, indicating strong potential for high-precision SDD retrieval in optically complex coastal waters.
Despite the promising results, the study acknowledges the limitation of a relatively small sample size for model development. Although the model was independently validated using spatially and temporally distinct in situ samples, future work should focus on collecting a more extensive and representative dataset across seasons and hydrological conditions to further improve model robustness and generalizability.
Spatiotemporal analyses of the SDD revealed clear seasonal and interannual patterns. Seasonally, SDD reached its lowest point in February (mean: 1.70 m), steadily increased to a maximum in July (mean: 5.05 m), and subsequently declined. A moderate positive correlation (R2 = 0.54) was observed between the monthly SDD and sea surface wind speed, suggesting that wind-induced resuspension driven by the East Asian monsoon is a key factor influencing seasonal SDD variability. Interannually, water transparency was lowest in 2018 (annual mean: 2.02 m), followed by consistent improvements between 2019 and 2024, peaking in 2020 (annual mean: 2.67 m). These positive trends likely reflect the cumulative effects of regional environmental governance, especially the Bohai Sea Comprehensive Management Initiative, which has significantly reduced terrestrial pollution inputs.
Furthermore, the hue angle, as a continuous and objective metric for characterizing ocean color, offers advantages that transcend region-specific optical properties. Its value has been recognized in diverse applications such as the inversion of optically active constituents, monitoring of ecological hazards, and assessment of lake eutrophication. However, its potential in marine ecological evaluation—such as ocean water quality classification—remains underexplored. Broader and systematic integration of the hue angle into operational marine environmental monitoring could provide more comprehensive and scalable tools for supporting coastal ecosystem management and policy decisions.

Author Contributions

Conceptualization, Y.H., S.Z., and L.W.; methodology, Y.H., Z.Y., and L.W.; in situ observation, L.W. and X.W.; data curation, S.Z., X.W., and L.W.; supervision, L.W.; validation, Y.H. and L.W.; discussion, Y.H., S.Z., Z.Y., X.W., and L.W.; writing, Y.H., S.Z., Z.Y., X.W., and L.W. All authors have read and agreed to the published version of the manuscript.

Funding

This work was supported in part by the Ministry of Science and Technology of the People’s Republic of China, National Key Research and Development Program of China (2019YFC1407904). The authors would like to thank the European Space Agency (ESA) for the distribution of Sentinel-3 OLCI data and the field investigators at the National Marine Environmental Monitoring Center for making in situ measurements, the results of which were used in this work.

Data Availability Statement

The data presented in this study are available on request from the corresponding author. The data are not publicly available due to privacy.

Conflicts of Interest

The authors declare no conflicts of interest.

References

  1. Zhou, Y.; Yu, D.F.; Yang, Q.; Pan, S.Q.; Gai, Y.Y.; Cheng, W.T.; Liu, X.Y.; Tang, S.L. Variations of water transparency and impact factors in the Bohai and Yellow Seas from satellite observations. Remote Sens. 2021, 13, 514. [Google Scholar] [CrossRef]
  2. Guo, J.T.; Pan, H.D.; Cao, R.C.; Wang, J.F.; Lv, X.Q. Multiple timescale variations in water transparency in the Eastern China Sea over the period 1997–2019. J. Geophys. Res. Oceans. 2023, 128, e2022JC019170. [Google Scholar] [CrossRef]
  3. Sun, Y.; Xu, Y.X.; Liu, D.Z.; Xu, G.J. Analysis of environmental factors impact on water transparency off southeastern Vietnam. Front. Mar. Sci. 2023, 10, 1095663. [Google Scholar] [CrossRef]
  4. Kahru, M.; Lee, Z.P.; Ohman, M.D. Multidecadal changes in ocean transparency: Decrease in a coastal upwelling region and increase offshore. Limnol. Oceanogr. 2023, 68, 1546–1556. [Google Scholar] [CrossRef]
  5. Kirby, R.R.; Beaugrand, G.; Kleparski, L.; Goodall, S.; Lavender, S. Citizens and scientists collect comparable oceanographic data: Measurements of ocean transparency from the Secchi Disk study and science programmes. Sci. Rep. 2021, 11, 15499. [Google Scholar] [CrossRef]
  6. Waya, R.K.; Limbu, S.M.; Ngupula, G.W.; Mwita, C.J.; Mgaya, Y.D. Spatial patterns of zooplankton distribution and abundance in relation to phytoplankton, fish catch and some water quality parameters at Shirati Bay, Lake Victoria-Tanzania. Tanzan. J. Sci. 2014, 40, 20–32. [Google Scholar]
  7. Wernand, M.R.; van der Woerd, H.J. Spectral analysis of the Forel-Ule Ocean color comparator scale. J. Eur. Opt. Soc. Rapid Publ. 2010, 5, 10014s. [Google Scholar] [CrossRef]
  8. Tyler, J.E. The Secchi disc. Limnol. Oceanogr. 1968, 13, 1–6. [Google Scholar] [CrossRef]
  9. Jiang, L.L.; Wang, L.X.; Wang, L.; Gao, S.W.; Yue, J.Q. Research on remote sensing retrieval of Bohai Sea transparency based on Sentinel-3 OLCI image. Spectrosc. Spectr. Anal. 2022, 42, 1209–1216. [Google Scholar] [CrossRef]
  10. He, S.L.; Chen, X.; Li, S.; Yao, X.L.; Xu, Z.P. Small hyperspectral imagers and lidars and their marine applications. Infrared Laser Eng. 2020, 49, 202002003. [Google Scholar] [CrossRef]
  11. Doron, M.; Babin, M.; Hembise, O.; Mangin, A.; Garnesson, P. Ocean transparency from space: Validation of algorithms estimating Secchi depth using MERIS, MODIS and SeaWiFS data. Remote Sens. Environ. 2011, 115, 2986–3001. [Google Scholar] [CrossRef]
  12. Page, B.P.; Olmanson, L.G.; Mishra, D.R. A harmonized image processing workflow using Sentinel-2/MSI and Landsat-8/OLI for mapping water clarity in optically variable lake systems. Remote Sens. Environ. 2019, 231, 111284. [Google Scholar] [CrossRef]
  13. Wang, Q.; Song, K.S.; Xiao, X.M.; Jacinthe, P.A.; Wen, Z.D.; Zhao, F.R.; Tao, H.; Li, S.J.; Shang, Y.X.; Wang, Y.; et al. Mapping water clarity in North American lakes and reservoirs using Landsat images on the GEE platform with the RGRB model. ISPRS J. Photogramm. Remote Sens. 2022, 194, 39–57. [Google Scholar] [CrossRef]
  14. Lee, Z.P.; Shang, S.L.; Qi, L.; Yan, J.; Lin, G. A semi-analytical scheme to estimate Secchi-disk depth from Landsat-8 measurements. Remote Sens. Environ. 2016, 177, 101–106. [Google Scholar] [CrossRef]
  15. Jia, T.X.; Zhang, Y.L.; Weng, C.; Dong, R.C. Improving remote sensing retrieval of global ocean transparency with optical water classification. Ecol. Indic. 2022, 143, 109359. [Google Scholar] [CrossRef]
  16. Xiang, J.Z.; Cui, T.W.; Qing, S.; Liu, R.J.; Chen, Y.L.; Mu, B.; Zhang, X.B.; Zhao, W.J.; Ma, Y.; Zhang, J. Remote sensing retrieval of water clarity in clear oceanic to extremely turbid coastal waters from multiple spaceborne sensors. IEEE Trans. Geosci. Remote Sens. 2023, 61, 4207618. [Google Scholar] [CrossRef]
  17. Wang, Q.; Liu, G.; Song, K.S.; Wen, Z.D.; Shang, Y.X.; Li, S.J.; Fang, C.; Tao, H. Comparison of machine learning algorithms for estimating global lake clarity with Landsat TOA data. IEEE Trans. Geosci. Remote Sens. 2024, 62, 1–14. [Google Scholar] [CrossRef]
  18. Salas, J.; Sepúlveda, R.; Vera, P. Water clarity assessment through satellite imagery and machine learning. Water 2025, 17, 253. [Google Scholar] [CrossRef]
  19. Synan, H.E.; Howes, B.L.; Sampieri, S.; Lohrenz, S.E. Water quality monitoring using Landsat 8 OLI in Pleasant Bay, Massachusetts, USA. Remote Sens. 2025, 17, 638. [Google Scholar] [CrossRef]
  20. Garaba, S.P.; Badewien, T.H.; Braun, A.; Schulz, A.C.; Zielinski, O. Using ocean colour remote sensing products to estimate turbidity at the Wadden Sea time series station Spiekeroog. J. Eur. Opt. Soc. Rapid Publ. 2014, 9, 14020. [Google Scholar] [CrossRef]
  21. Garaba, S.P.; Friedrichs, A.; Voß, D.; Zielinski, O. Classifying natural waters with the Forel-Ule color index system: Results, applications, correlations and crowdsourcing. Int. J. Environ. Res. Public Health 2015, 12, 16096–16109. [Google Scholar] [CrossRef] [PubMed]
  22. Wernand, M.R.; van der Woerd, H.J.; Gieskes, W.W.C. Trends in ocean colour and chlorophyll concentration from 1889 to 2000, worldwide. PLoS ONE 2013, 8, e63766. [Google Scholar] [CrossRef] [PubMed]
  23. Wang, L.; Wang, X.; Meng, Q.H.; Chen, Y.L.; Wang, X.X.; Jiang, L.L.; Shang, Y.H. Retrieval and spatiotemporal variation of total suspended matter concentration using a MODIS-derived hue angle in the coastal waters of Qinhuangdao, China. Front. Mar. Sci. 2024, 11, 1434225. [Google Scholar] [CrossRef]
  24. Wang, S.L.; Li, J.S.; Shen, Q.; Zhang, B.; Zhang, F.F.; Lu, Z.Y. MODIS-based radiometric color extraction and classification of inland water with the Forel-Ule scale: A case study of Lake Taihu. IEEE J. Sel. Top. Appl. Earth Obs. Remote Sens. 2014, 8, 907–918. [Google Scholar] [CrossRef]
  25. Pitarch, J.; van der Woerd, H.J.; Brewin, R.J.W.; Zielinski, O. Optical properties of Forel-Ule water types deduced from 15 years of global satellite ocean color observations. Remote Sens. Environ. 2019, 231, 111249. [Google Scholar] [CrossRef]
  26. Zhan, J.; Zhang, D.J.; Zhou, G.Q.; Zhang, G.Y.; Cao, L.J.; Guo, Q. MODIS-based research on Secchi disk depth using an improved semianalytical algorithm in the Yellow Sea. IEEE J. Sel. Top. Appl. Earth Obs. Remote Sens. 2021, 14, 5964–5972. [Google Scholar] [CrossRef]
  27. Wang, S.L.; Li, J.S.; Zhang, B.; Spyrakos, E.; Tyler, A.N.; Shen, Q.; Zhang, F.F.; Kuster, T.; Lehmann, M.K.; Wu, Y.H.; et al. Trophic state assessment of global inland waters using a MODIS-derived Forel-Ule index. Remote Sens. Environ. 2018, 217, 444–460. [Google Scholar] [CrossRef]
  28. Chen, Q.; Huang, M.T.; Tang, X.D. Eutrophication assessment of seasonal urban lakes in China Yangtze River Basin using Landsat 8-derived Forel-Ule index: A six-year (2013–2018) observation. Sci. Total Environ. 2020, 745, 135392. [Google Scholar] [CrossRef] [PubMed]
  29. Liu, R.J.; Xiao, Y.F.; Ma, Y.; Cui, T.W.; An, J.B. Red tide detection based on high spatial resolution broad band optical satellite data. ISPRS J. Photogramm. Remote Sens. 2022, 184, 131–147. [Google Scholar] [CrossRef]
  30. Hou, X.J.; Feng, L.; Dai, Y.H.; Hu, C.M.; Gibson, L.; Tang, J.; Lee, Z.P.; Wang, Y.; Cai, X.B.; Liu, J.G.; et al. Global mapping reveals increase in lacustrine algal blooms over the past decade. Nat. Geosci. 2022, 15, 130–134. [Google Scholar] [CrossRef]
  31. Dai, Y.H.; Yang, S.B.; Zhao, D.; Hu, C.M.; Xu, W.; Anderson, D.M.; Li, Y.; Song, X.P.; Boyce, D.G.; Gibson, L.; et al. Coastal phytoplankton blooms expand and intensify in the 21st century. Nature 2023, 615, 280–284. [Google Scholar] [CrossRef] [PubMed]
  32. Wang, L.; Meng, Q.H.; Wang, X.; Chen, Y.L.; Wang, X.X.; Han, J.; Wang, B.Q. Identification of floating green tide in high-turbidity water from Sentinel-2 MSI images employing NDVI and CIE hue angle thresholds. J. Mar. Sci. Eng. 2024, 12, 1640. [Google Scholar] [CrossRef]
  33. Shang, Y.H.; Jiang, L.L.; Wang, L.; Ye, Z.X.; Gao, S.W.; Tang, X.H. Methods for detecting green tide in the Yellow Sea using Google Earth Engine platform. Reg. Stud. Mar. Sci. 2024, 77, 103666. [Google Scholar] [CrossRef]
  34. Ma, B.C.; Sun, D.Y.; Li, Z.H.; Kong, D.Y.; Pan, X.S.; Wang, S.Q.; Zhang, H.L.; He, Y.J. Marine water quality environmental monitoring method based on hue-angle in CIE system. Adv. Mar. Sci. 2023, 41, 135–147. [Google Scholar]
  35. Bukata, R.P.; Pozdnyakov, D.V.; Jerome, J.H.; Tanis, F.J. Validation of a radiometric color model applicable to optically complex water bodies. Remote Sens. Environ. 2001, 77, 165–172. [Google Scholar] [CrossRef]
  36. van der Woerd, H.J.; Wernand, M.R. True colour classification of natural waters with medium-spectral resolution satellites: SeaWiFS, MODIS, MERIS and OLCI. Sensors 2015, 15, 25663–25680. [Google Scholar] [CrossRef]
  37. van der Woerd, H.J.; Wernand, M.R. Hue-angle product for low to medium spatial resolution optical satellite sensors. Remote Sens. 2018, 10, 180. [Google Scholar] [CrossRef]
  38. Wang, S.L. Large-Scale and Long-Time Water Quality Remote Sensing Monitoring over Lakes Based on Water Color Index. Ph.D. Thesis, University of Chinese Academy of Sciences, Beijing, China, 2018. [Google Scholar]
  39. Wang, L.; Meng, Q.H.; Wang, X.; Chen, Y.L.; Zhao, S.F.; Wang, X.X. Forel-Ule index extraction and spatiotemporal variation from MODIS imagery in the Bohai Sea of China. Opt. Express 2023, 31, 17861–17877. [Google Scholar] [CrossRef]
  40. Global Modeling and Assimilation Office (GMAO). MERRA-2 tavgU_2d_flx_Nx: 2d, Diurnal, Time-Averaged, Single-Level, Assimilation, Surface Flux Diagnostics V5.12.4; Goddard Earth Sciences Data and Information Services Center (GES DISC): Greenbelt, MD, USA, 2015. [CrossRef]
Figure 1. Geographic layout of in situ monitoring stations within the research region.
Jmse 13 01149 g001
Figure 2. Calculation Procedure for Hue Angle.
Jmse 13 01149 g002
Figure 3. Monthly mean SDD in Qinhuangdao coastal waters from January to December (2018–2024). (Note: Each monthly value is the average SDD calculated from all measurements taken in that month during the 7-year period from 2018 to 2024.).
Jmse 13 01149 g003
Figure 4. Monthly mean SDD in the Qinhuangdao coastal waters from January to December (2018–2024).
Jmse 13 01149 g004
Figure 5. Spatiotemporal variation in the annual SDD in the Qinhuangdao coastal waters (2018–2024).
Jmse 13 01149 g005
Figure 6. Annual mean SDD in the Qinhuangdao coastal waters (2018–2024).
Jmse 13 01149 g006
Figure 7. Scatterplots of SDD vs. TSM, Chla, and ag(400). The red solid lines represent the fitted relationships.
Jmse 13 01149 g007
Figure 8. Linear relationship between the monthly mean SDD derived from Sentinel-3 OLCI and wind speed from M2IMNXLFO [40]. The red line shows the linear fit to the data points.
Jmse 13 01149 g008
Figure 9. Linear regression of annual mean SDD (from Sentinel-3 OLCI) against wind speed (from M2IMNXLFO [40]). The red line illustrates the fitted relationship to the data points.
Jmse 13 01149 g009
Table 1. Accuracy evaluation of SDD retrieval algorithms in the Qinhuangdao coastal waters.
NumberAlgorithm TypeAlgorithm ExpressionR2MAPE (%)RMSE (m)
A1Single-bandSDD = 0.0634 × Rrs(620)−0.5520.6915.360.53
A2SDD = 0.0478 × Rrs(665)−0.5630.7115.050.51
A3SDD = 0.0332 × Rrs(673.75)−0.6240.8112.040.41
A4SDD = 0.0404 × Rrs(681.25)−0.6020.8411.000.38
A5SDD = 0.1261 × Rrs(708.75)−0.380.6914.500.52
A6Band-ratioSDD = 1.1763 × e2.4777×(Rrs(412.5)/Rrs(560))0.6815.170.53
A7SDD = 0.9155 × e2.5848×(Rrs(442.5)/Rrs(560))0.7912.110.43
A8SDD = 0.5505 × e2.2983×(Rrs(490)/Rrs(560))0.908.750.29
A9SDD = 0.3305 × e2.6096×(Rrs(510)/Rrs(560))0.918.440.28
A10SDD = 0.7425 × (Rrs(673.75)/Rrs(560))−0.8610.6916.570.52
A11SDD = 0.8055 × (Rrs(681.25)/Rrs(560))−0.8480.7614.550.45
A12Multi-bandSDD = 10−0.3378−0.5551×(Rrs(442.5)/Rrs(560))+1.4450×(Rrs(490)/Rrs(560))0.908.600.28
A13SDD = 10−0.5667−0.2837×(Rrs(442.5)/Rrs(560))+1.3862×(Rrs(510)/Rrs(560))0.918.400.27
A14SDD = 10−0.5736−0.4414×(Rrs(490)/Rrs(560))+1.6278×(Rrs(510)/Rrs(560))0.918.520.28
A15SDD = 10−0.5832+1.5717×(Rrs(442.5)/Rrs(560))−0.4049×(Rrs(490)/Rrs(560))+1.6006×(Rrs(510)/Rrs(560))0.918.440.27
A16Hue angle47.576 × e−1.729×(α/100)0.937.880.25
A1711.02 × (α/100)−2.8160.928.360.26
Disclaimer/Publisher’s Note: The statements, opinions and data contained in all publications are solely those of the individual author(s) and contributor(s) and not of MDPI and/or the editor(s). MDPI and/or the editor(s) disclaim responsibility for any injury to people or property resulting from any ideas, methods, instructions or products referred to in the content.

