Article

Characterizing Post-Storm Beach Recovery Modes: A Field-Based Morphodynamic Study from Dongdao Beach, China

1
College of Electronic and Information Engineering, Guangdong Ocean University, Zhanjiang 524088, China
2
College of Chemistry and Environment, Guangdong Ocean University, Zhanjiang 524088, China
*
Author to whom correspondence should be addressed.
J. Mar. Sci. Eng. 2025, 13(6), 1117; https://doi.org/10.3390/jmse13061117
Submission received: 25 April 2025 / Revised: 30 May 2025 / Accepted: 1 June 2025 / Published: 3 June 2025

Abstract

:
The post-storm beach recovery process exhibits variability. Understanding its mechanisms is crucial for advancing the study of beach morphodynamics. This study involved a 25-day continuous field observation on Dongdao Beach, Hailing Island, Yangjiang City, Guangdong Province, following the passage of Typhoon Cempaka. The evolution of beach morphology and the spatiotemporal variations in erosion and accretion were analyzed to explore the key influencing factors, response mechanisms, and recovery modes during the short-term recovery process. The post-storm evolution of beach profile structures is predominantly influenced by major geomorphic units such as berms and sandbars, whereas localized responses are characterized by adjustments of fine-scale features like micro-troughs. The width of the supratidal zone and the position of the berm crest continuously fluctuate, while the slope of the intertidal zone increases or decreases as the berm crest migrates landward or seaward. The erosion–accretion process was complex and occurred in distinct stages, with marked spatial heterogeneity. In some areas, the beach experienced multiple short-term cycles of alternating erosion and accretion. Beach slope plays a significant role in short-term recovery. Three types of response relationships between beach unit-width volume and changes in slope were observed, with flatter beaches being more sensitive to changes in unit-width volume. Based on this, four recovery modes in the post-storm short-term recovery process were explored from the perspective of beach slope. This study provides theoretical support for managing beaches after storms and recommends the implementation of zoned and phased management strategies based on different recovery modes to enhance the efficiency and resilience of coastal recovery.

1. Introduction

Storms are a potential threat to coastal areas. Storm surges, giant waves, and other related events not only cause coastal flooding and significant shoreline retreat but also damage infrastructure and even pose a threat to human life [1,2]. The increasing exceedance probability of high-intensity tropical cyclones over the past four decades, particularly in the Northwest Pacific, has heightened the risk of coastal erosion in many regions [3].
Storms and storm surges, as major drivers of coastal morphodynamic changes and sediment transport, are key factors in the rapid response of coastal areas on short timescales [4]. The response of beaches to storms in their natural state varies significantly [5,6,7,8,9], which mainly depends on factors such as the storm’s intensity, frequency, and the beach’s geomorphological characteristics [10,11,12,13]. Beach profiles can exhibit rapid responses to intense storm events, often undergoing substantial morphological changes and severe erosion [10]. Comparative studies have shown that storm clusters exert significantly greater impacts on beach morphology than isolated storms [8,9], with the effects being inherently nonlinear and dependent on storm sequence; earlier events can modify beach morphology and hydrodynamic conditions, thereby altering the system’s susceptibility to subsequent storms [14]. The morphological response of beaches to storms is highly variable and is influenced by factors such as beach slope, shoreline orientation, and the presence of headland features [6,12,13]. Burvingt et al. categorized storm-induced beach responses into four types using cluster analysis based on cross-shore volumetric change and a longshore variation index (LVI), identifying wave exposure and normalized beach length as primary controls [15]. Under calm, accretive conditions, sandbars typically migrate slowly landward, whereas during stormy, erosive conditions, they tend to shift rapidly offshore [16,17]. These distinct storm response types influence sediment transport patterns and near-shore hydrodynamics, ultimately playing a critical role in determining the rate and trajectory of post-storm beach recovery [18].
In addition to storm response types, post-storm beach recovery probability and recovery time are usually the main focus, as they are influenced by various factors, including energy characteristics, beach conditions, and wind conditions [19,20,21,22,23,24]. Most beaches are able to recover after a storm [25], but some may experience permanent loss and changes in profile morphology [26]. Short-term beach recovery typically begins immediately after the storm [27,28], with significant recovery occurring within a few days [29]. However, recovery to pre-storm conditions usually takes anywhere from a few days to several decades [30]. Moreover, the more erosive the storm, the longer the recovery period for the beach [19]. It is worth noting that, for sandy beaches, recovery does not necessarily occur only during calm periods; high-energy wave conditions are often more favorable for sediment redistribution and morphological adjustment [18]. In such energetic environments, waves can rapidly transport sediment onshore, accelerating profile recovery. Therefore, post-storm sandy beaches under high-energy conditions tend to recover more quickly than those in low-energy settings [31,32]. Wind energy blows fine sediments closer to the shore, leading to weaker erosion in the nearshore areas, so wind direction and wind speed also influence beach recovery [33]. Aagaard et al. used the Argus imaging system combined with field hydrological observations and found that dissipative beaches recover faster than reflective beaches [21]. Furthermore, the recovery process of different beaches after a storm varies. Recovery on the coast of New Jersey, USA, was divided into two stages: the first stage, where the beach rapidly recovered, restoring half of the eroded sediment within two days after the storm, and the second stage, where the recovery rate slowed down [34]. After ten years of monitoring, the recovery of severely eroded beaches on the southeastern coast of Texas was divided into four stages: rapid accretion of the foredune, accumulation in the backshore, dune formation, and dune expansion with vegetation regrowth [27]. The recovery of Narrabeen Beach in Australia was divided into two periods based on changes in backshore sediment volume: a rapid recovery period and a stable recovery period [35]. Compared to sandy beaches, mixed sand-gravel beaches recover more quickly in moderate-energy conditions [32]. Sheltered beaches, such as Palm Beach, have shown greater sensitivity to changes in wave direction and wave height during the recovery phase and exhibit significant spatial variability across different sections of the same beach [36]. In conclusion, post-storm beach recovery is highly complex and random [18,37], and the recovery of morphological features is limited by the timescale of observation [38].
Although post-storm beach recovery is a complex and variable process, decades of studies have improved our understanding of general recovery mechanisms and temporal trends. However, high-resolution, short-term studies focusing on beach recovery immediately following storm events remain relatively limited. This study utilizes continuous field observations collected after Typhoon Cempaka to analyze morphological changes and short-term recovery rates at Dongdao Beach. By incorporating the beach slope factor, it explores different recovery modes and provides new insights into post-storm beach adjustment mechanisms. These findings enhance the understanding of coastal morphodynamic processes after storms and offer valuable implications for improving coastal management strategies.

2. Material and Methods

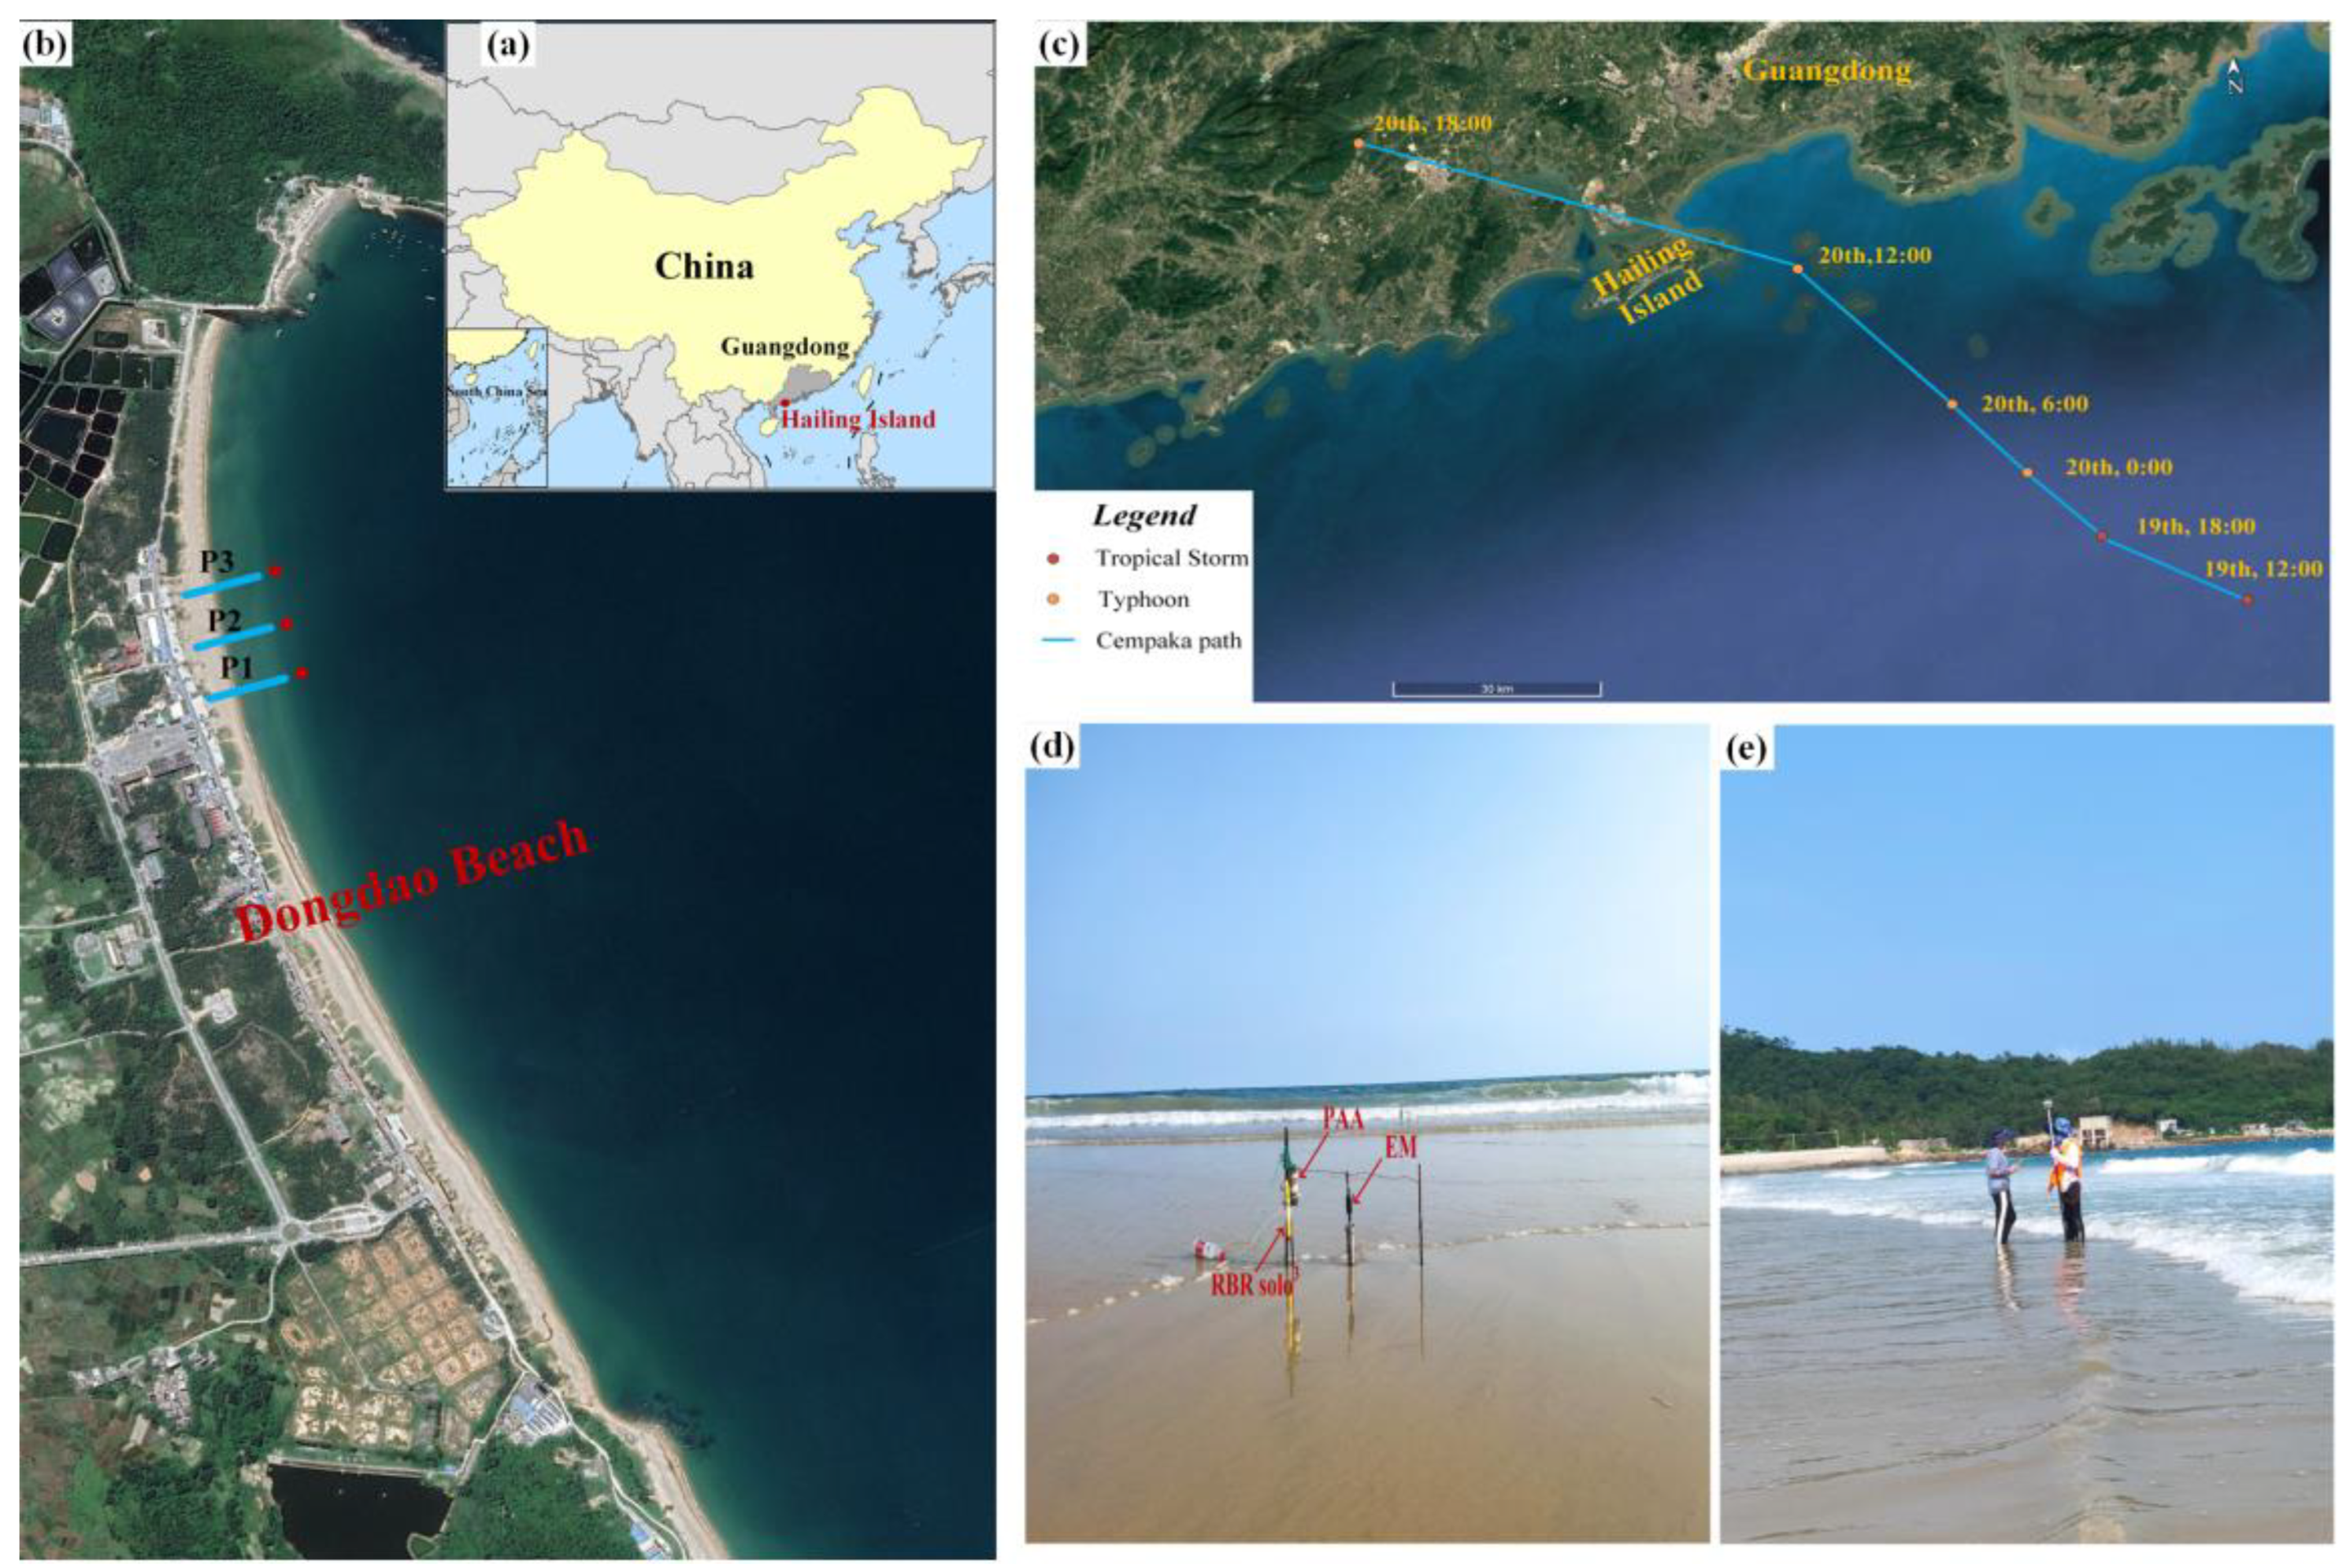
2.1. Study Area and Storm

China is one of the countries most frequently affected by tropical cyclones, with over 87% of those making landfall in southern China occurring in Guangdong and Hainan provinces [39], and the sea area around Hailing Island is among the areas in Guangdong Province most frequently impacted by typhoons [40].
Hailing Island is located on the southwestern coast of Yangjiang City, Guangdong Province, China, and is the fourth largest island in Guangdong. Dongdao Beach is located on the southeastern side of Hailing Island, facing the South China Sea. It is a headland bay arc-shaped beach, approximately 2 km in length, with a width ranging from 80 to 120 m. On the eastern side of the beach, there is a natural cape about 550 m long (as shown in Figure 1a). According to long-term tide data from Zhapo Ocean Station (21°35′ N, 111°50′ E), the tidal type in the waters near Dongdao Beach is an irregular semi-diurnal tide, with an average tidal range of 1.57 m and a maximum tidal range of 3.92 m [40]. Waves are primarily a mix of wind waves and swell waves, with strong waves coming from the south (S direction) [41]. The frequency of waves with heights greater than 1 m is 35.8%, and the wave periods mainly range from 2 to 6 s [41]. Sediments are predominantly medium sand, with a grain size range of 0.2 to 0.4 mm.
Typhoon Cempaka (No. 2107) made landfall on the coastal area of Jiangcheng District, Yangjiang City, Guangdong Province, at 21:50 on July 20, 2021. The maximum wind speed near the center was 33 m/s, with a maximum wind force of 12, and the minimum central pressure was 978 hPa. The typhoon path is shown in Figure 1c.

2.2. Data Gathering and Processing

2.2.1. Profile Data

Beach profiles were measured using the RTK-GPS method, with measurements taken during each low-tide period. The RTK-GPS system provided a planimetric accuracy of ±0.03 m and a vertical accuracy of ±0.05 m under open-sky conditions. Beach profile is measured manually step by step, with the distance between measurement points not exceeding 5 m in principle, in order to obtain the latitude, longitude, and elevation data of the place. Beach profile measurement starts from the beach backshore dune, along the direction perpendicular to the shoreline until the beach at low tide near the waterline. Encrypted measurements were conducted at beach berm and scarp locations where there are significant changes in beach topography. The locations of the repeated measurements were as close as possible to the same position, and by setting up stable relative datums on the embankment, it was ensured that each monitoring point was on the same profile every time [42]. A total of 75 beach profile topography datasets were obtained from August 6 to 30, 2021, with all raw data corrected to the 1985 Yellow Sea vertical datum to ensure consistency and reliability.

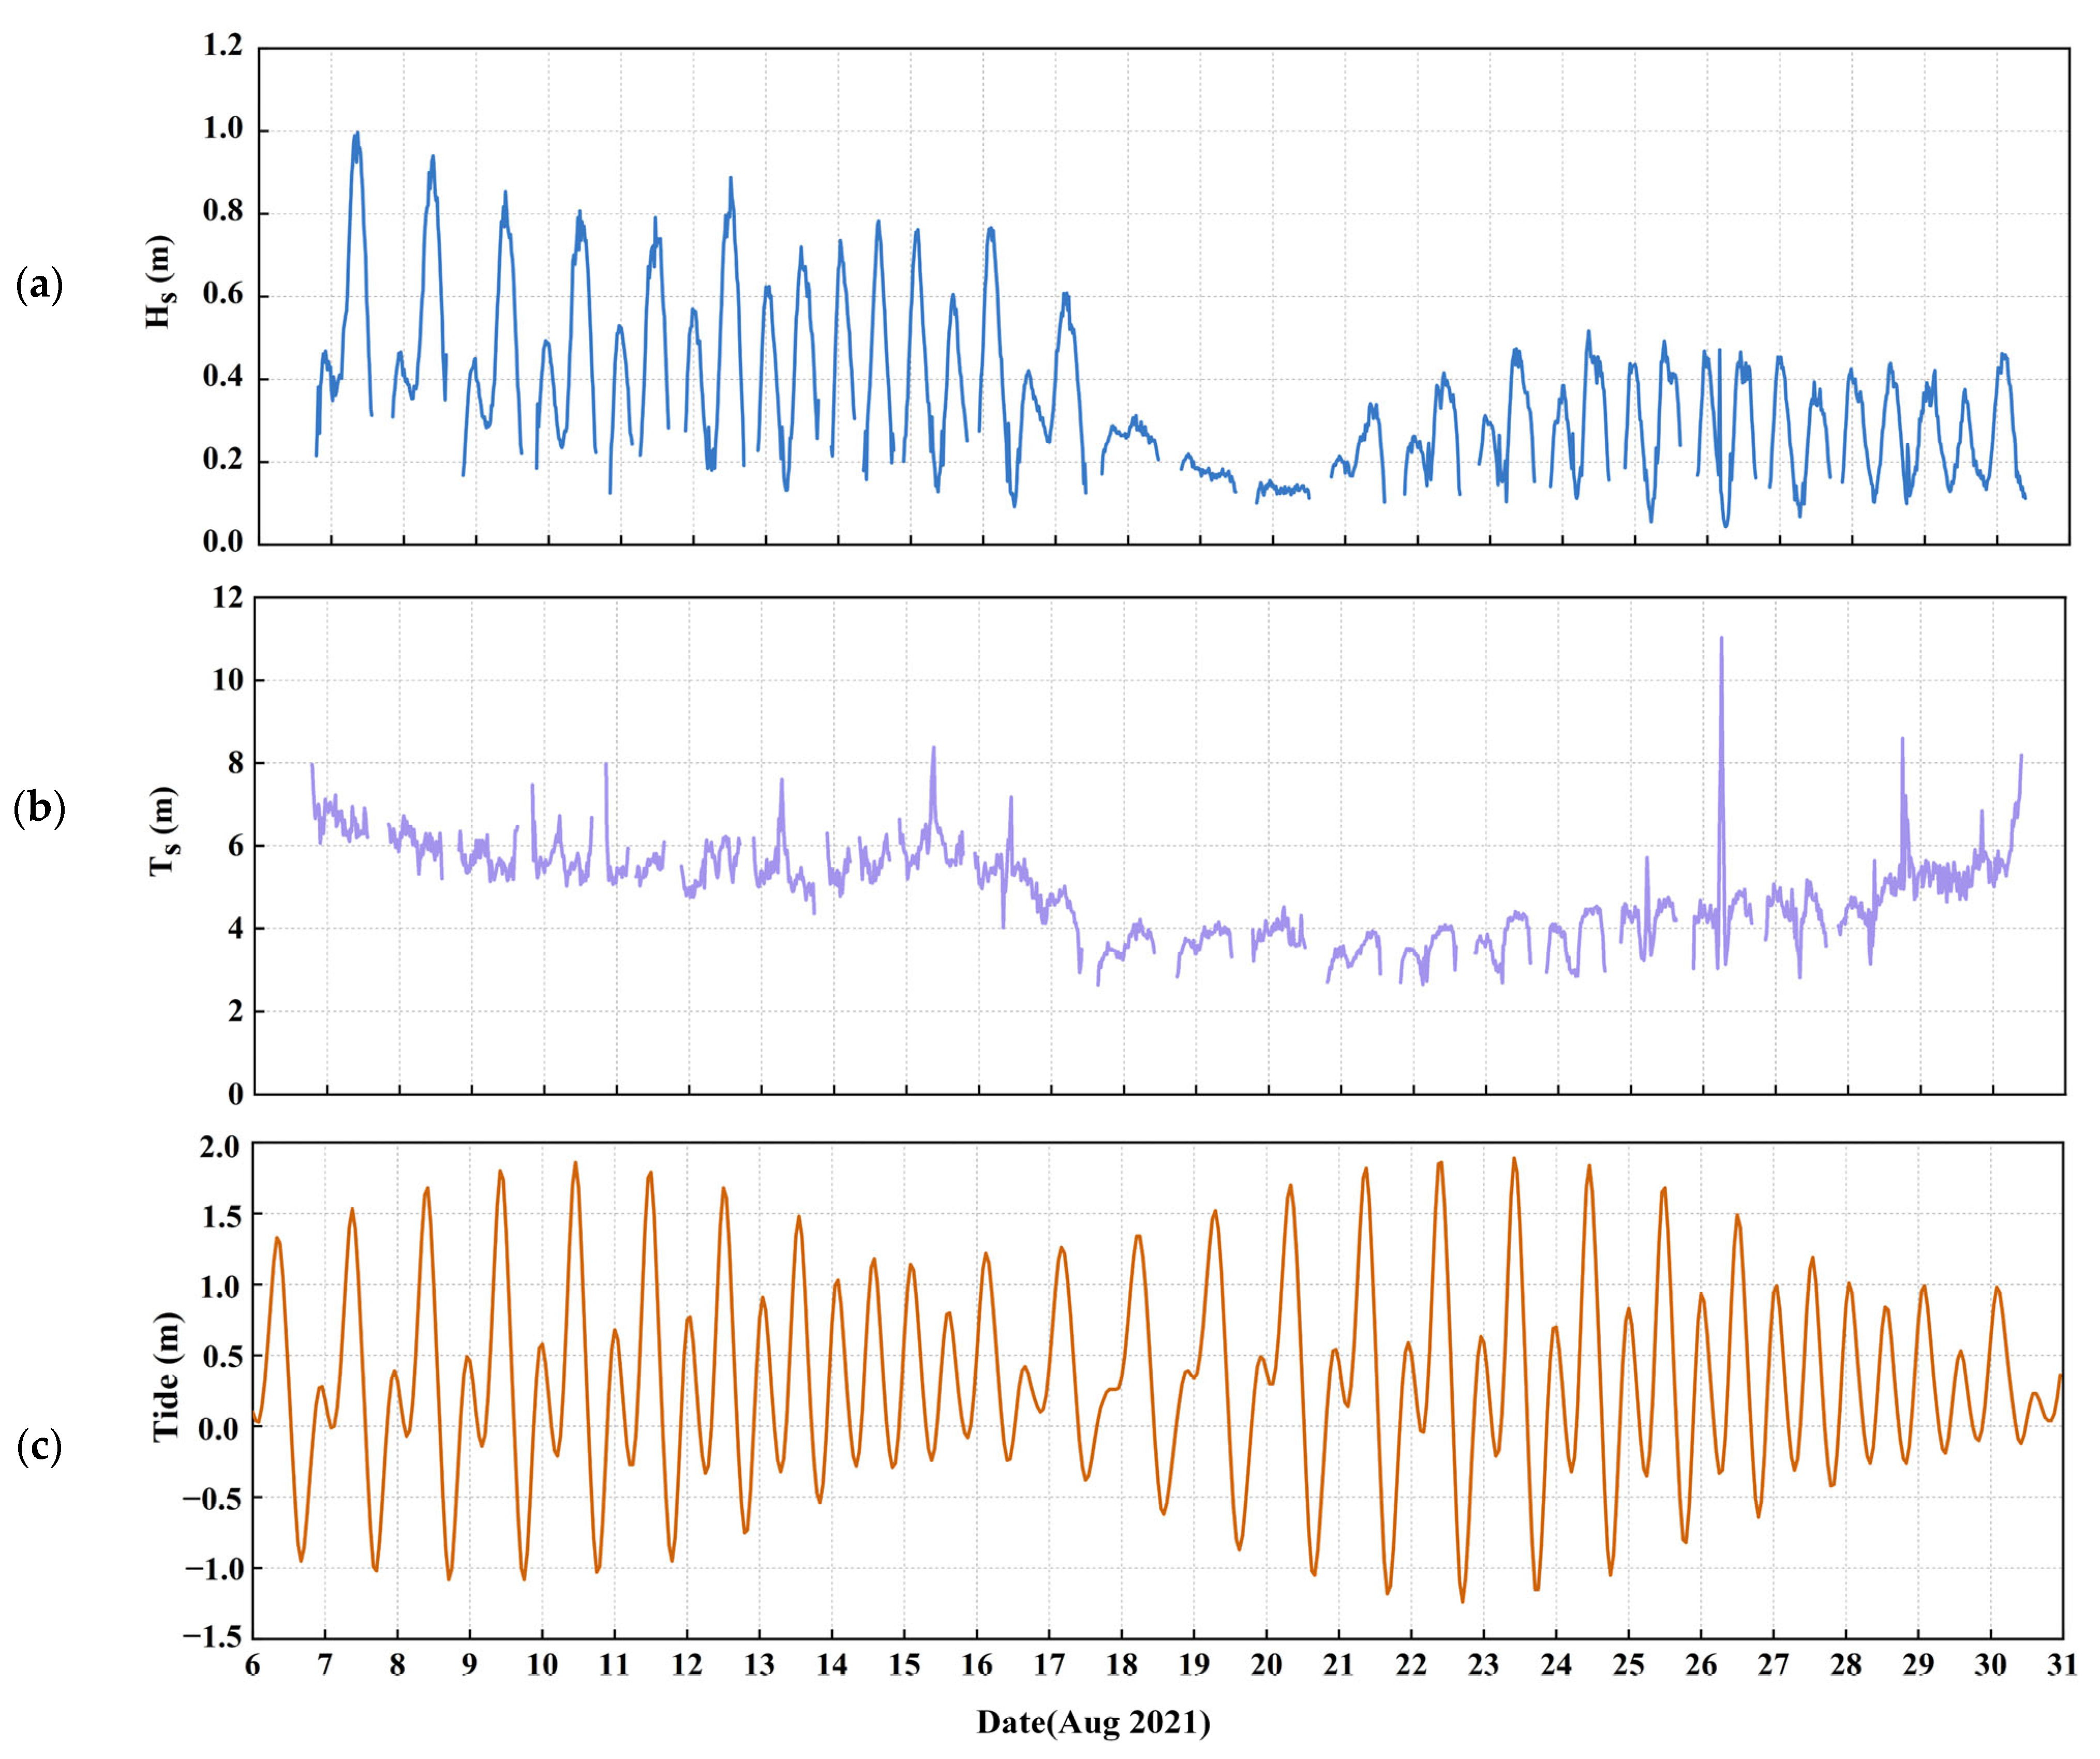
2.2.2. Wave and Sediment Data

Wave data collected using the RBR Solo3 were used to calculate the wave parameters and water levels in the surf zone. The data collection period was from August 6 to August 30, 2021, and the significant wave height (Hs), wave period (Ts), and tidal characteristics in the surf zone are shown in Figure 2. Deep-water wave data were obtained from the European Centre for Medium-Range Weather Forecasts (ECMWF) (https://cds.climate.copernicus.eu/), including deep-water wave height, mean wave period, etc. This dataset is a fifth-generation reanalysis dataset of global climate and weather over the past 40–70 years, with real-time updates since 1979, and it has a spatial resolution of 0.5°. During the profile elevation measurements, surface sediment samples were collected from the supratidal zone, intertidal zone, and subtidal zone. These sediment samples were then processed using a vibratory sieve [43], with particle size intervals of 0.25φ. Finally, the median grain size (D50) [44] was calculated using the moment method proposed by Friedman [45].

2.3. Study Methodology

This study aims to investigate the short-term beach morphological response and recovery process following Typhoon Cempaka. The research focuses on Dongdao Beach, where intensive field observations were conducted over a 25-day period. The methodological approach integrates daily beach profile surveys, sediment sampling, and hydrodynamic data analysis to identify distinct recovery modes. Specifically, we quantify changes in beach morphology using unit-width volume change and slope change rate, which are further analyzed to classify the recovery patterns and understand the controlling mechanisms during the post-storm period.

2.3.1. Wave Height at the Breaking Point

The wave height at the breaking point ( H b ) is calculated using the semi-empirical formula by Kormar and Gauhan [46]:
H b H 0 = 0.563 H 0 L 0 1 5
In the equation, H 0 is the deep-water wave height; L 0 = g T 2 / 2 π is the deep-water wavelength.

2.3.2. Intertidal Zone Slope Change Rate

The calculation method for the beach slope change rate ds/dt is as follows [38]:
d s d t = S i + 1 S i T i + 1 T i
where S is the slope of the beach profile in the selected area of the intertidal zone, T is the number of continuous observation days (with 6 August 2021, as Day 1, in days), and i is the observation serial number, where i 1 .

2.3.3. Unit-Width Volume and Its Change Rate

The unit-width volume is calculated using the formula proposed by Bruvingt et al. [47]:
V p r o f i l e = z m i n z m a x z d z
The calculation method for the beach volume change rate dv/dt (m3/m/day) is as follows [38]:
d v d t = V i + 1 V i T i + 1 T i
where z refers to the terrain value interpolated every meter along the profile, and z m a x and z m i n   represent the highest and lowest terrain values along the profile, respectively. V is the unit-width volume of the beach, and the meanings of other symbols are as previously defined.

2.3.4. Pearson Correlation Analysis

This study explores the correlation between environmental factors and the dynamic beach recovery process using Pearson’s product–moment correlation [48].
r = i = 1 n x i x ¯ y i y ¯ i = 1 n ( x i x ¯ ) 2 i = 1 n ( y i y ¯ ) 2
where r   is the Pearson correlation coefficient, with a range of [−1, 1]; x i and y i   are the
i-th observation values; x ¯ and y ¯ are the means of variables x and y , respectively; and n is the number of observations.

2.3.5. Kriging Interpolation

In this study, ordinary Kriging interpolation is used for terrain interpolation, with the formula as follows:
Z * x 0 = i = 1 n λ i Z x i
In this equation, Z * ( x 0 ) is the predicted value at the target location x 0 ; Z ( x i ) is the observed value at the known location x i ; λ i   are the weights to be determined, subject to the unbiasedness constraint i = 1 n λ i =1; and n is the number of known points used for interpolation.

2.3.6. Classification of Beach Recovery Modes

Based on the observed relationship between beach slope and unit-width volume changes, we developed a framework to classify daily beach recovery into four distinct modes. Slope change rate (ds/dt) reflects steepening or flattening of the beach profile, while volume change rate (dv/dt) indicates accretion or erosion.
By combining the sign (positive or negative) of these two indicators, we identified four modes: Mode I: beach accretion with beachface steepening (dv/dt > 0, ds/dt > 0), Mode II: beach erosion with beachface steepening (dv/dt < 0, ds/dt > 0); Mode III: beach erosion with beachface flattening (dv/dt < 0, ds/dt < 0); and Mode IV: beach accretion with beachface flattening (dv/dt > 0, ds/dt < 0). This classification allows a clearer interpretation of how morphological adjustment processes manifest in different recovery patterns.

3. Results

3.1. Profile Characteristics and Morphological Succession

In this study, the width of the supratidal zone is defined as the distance from the shoreline to the intersection of the mean high water line (MHWL) and the beach profile, while the beach slope is defined as the slope of the profile segment between the intersection of the MHWL and the beach profile and the intersection of the mean low water line (MLWL) and the beach profile, as shown in Figure 3.

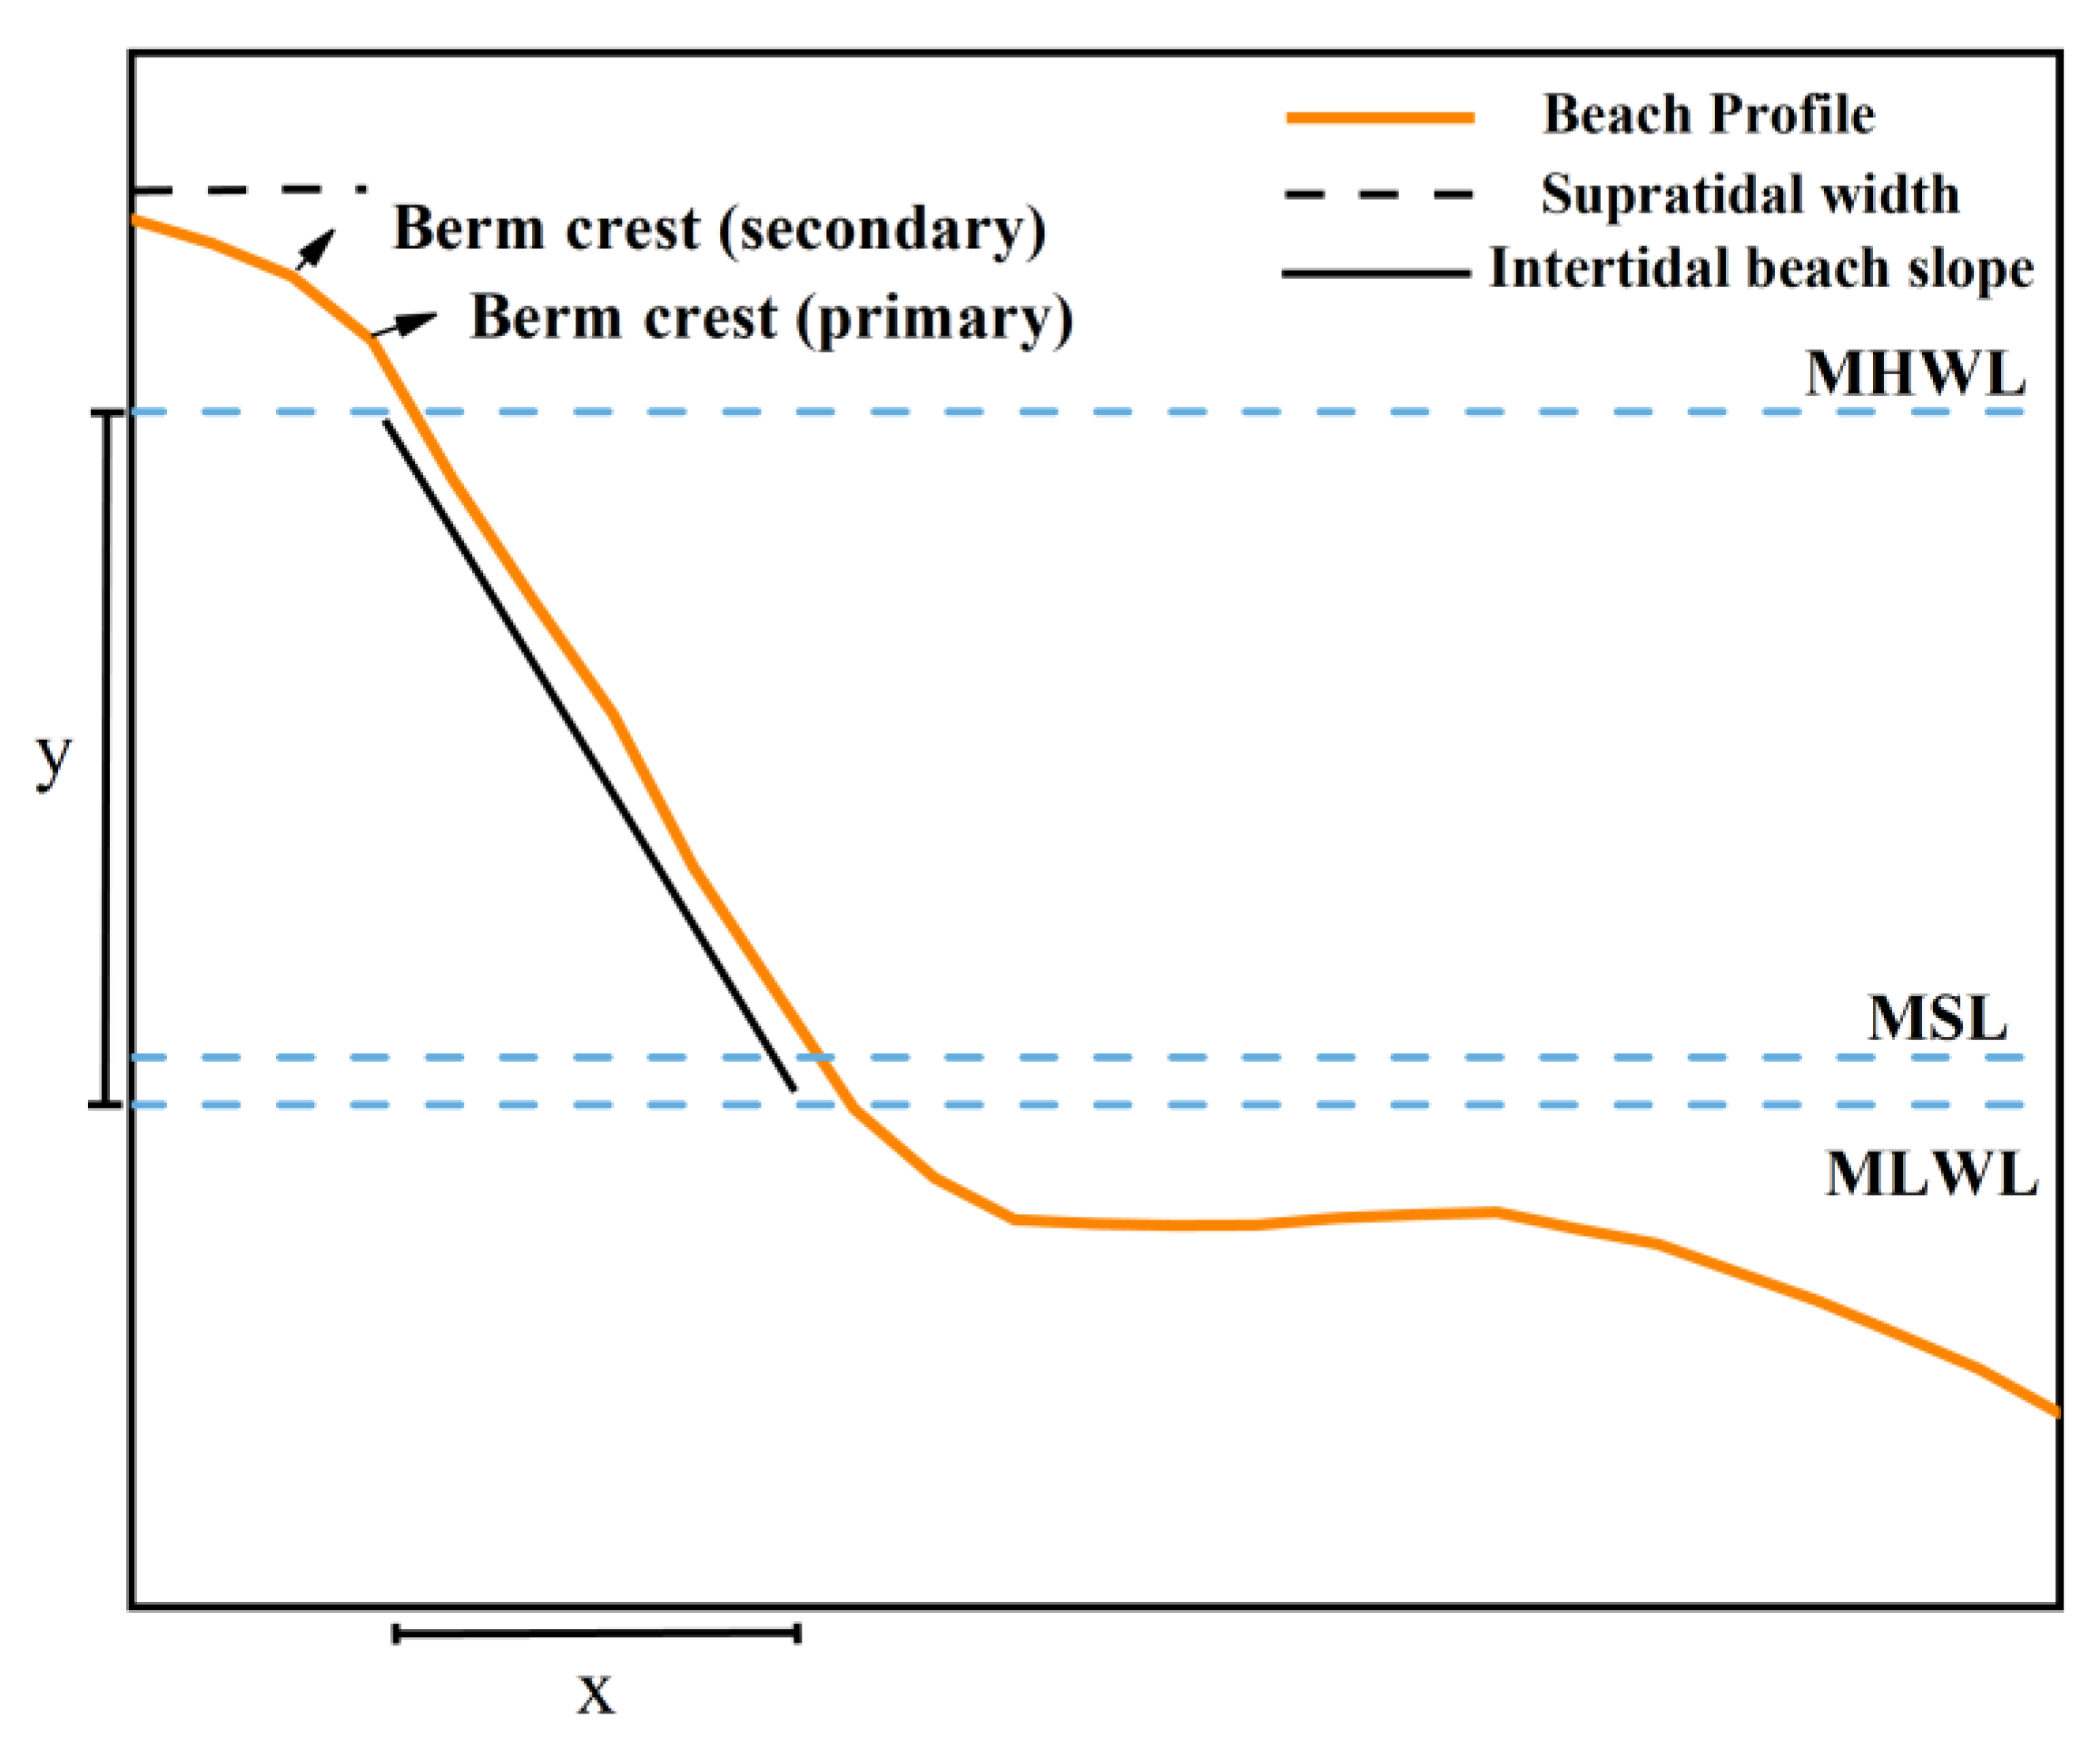
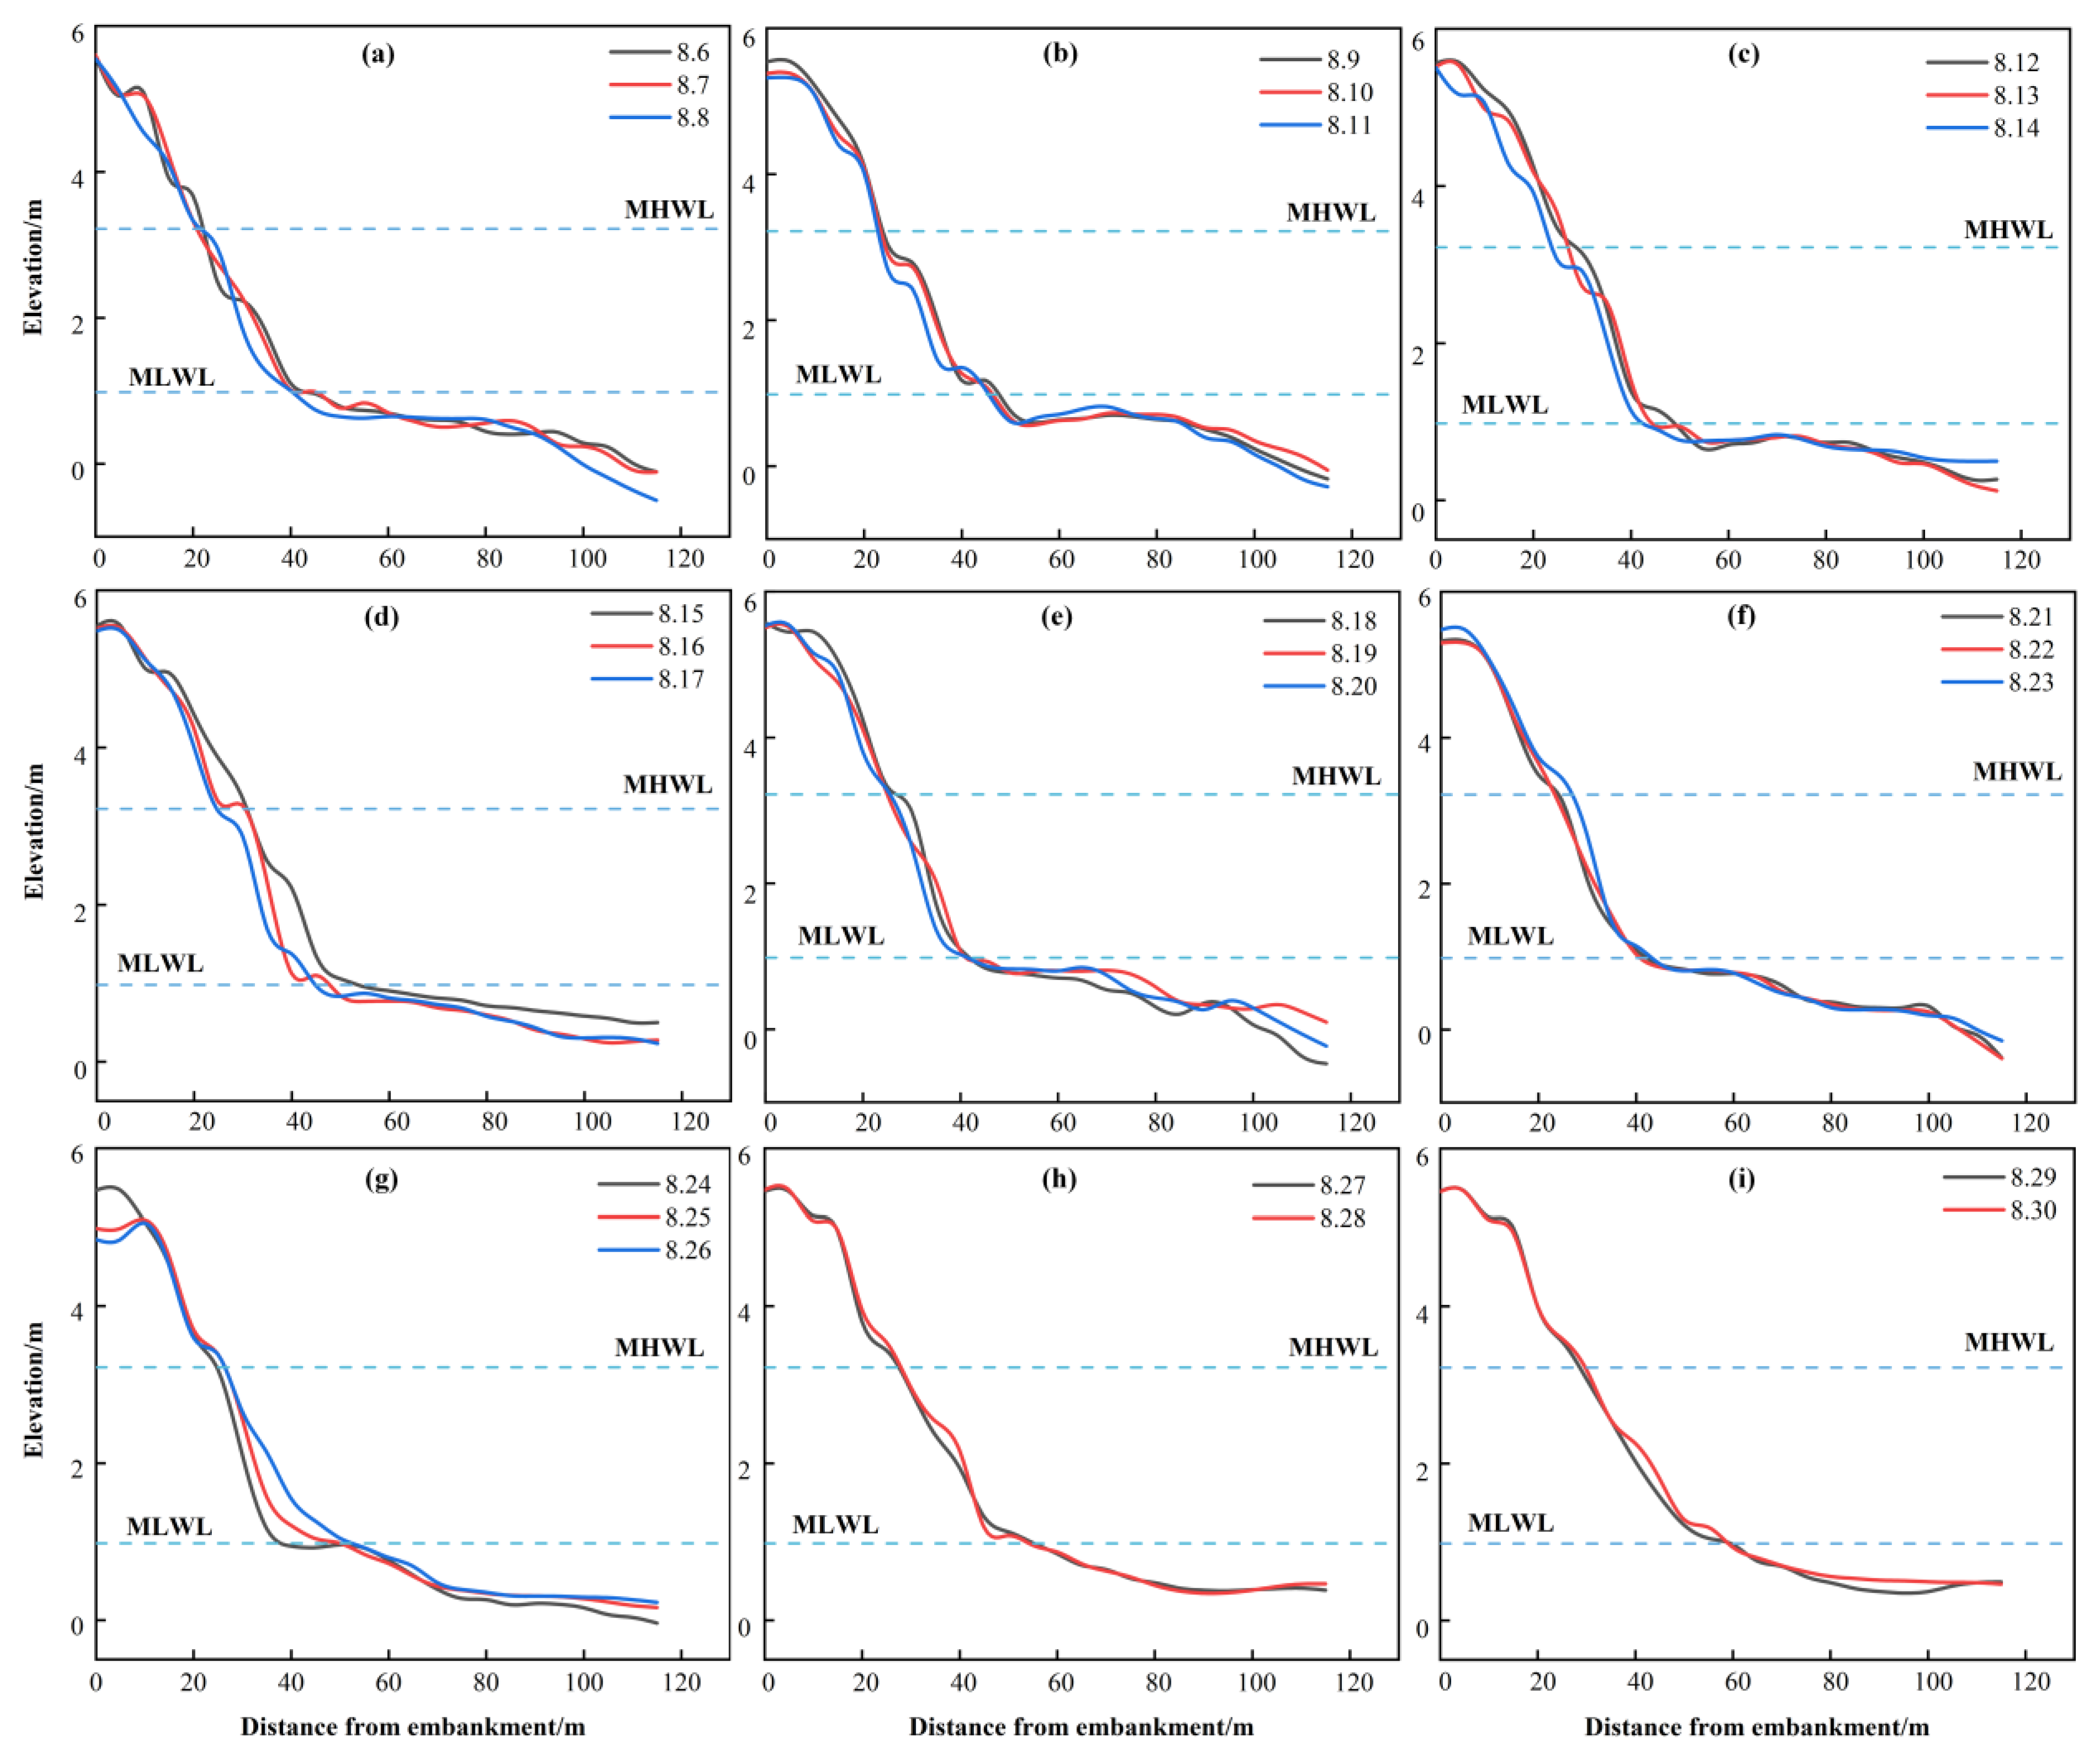
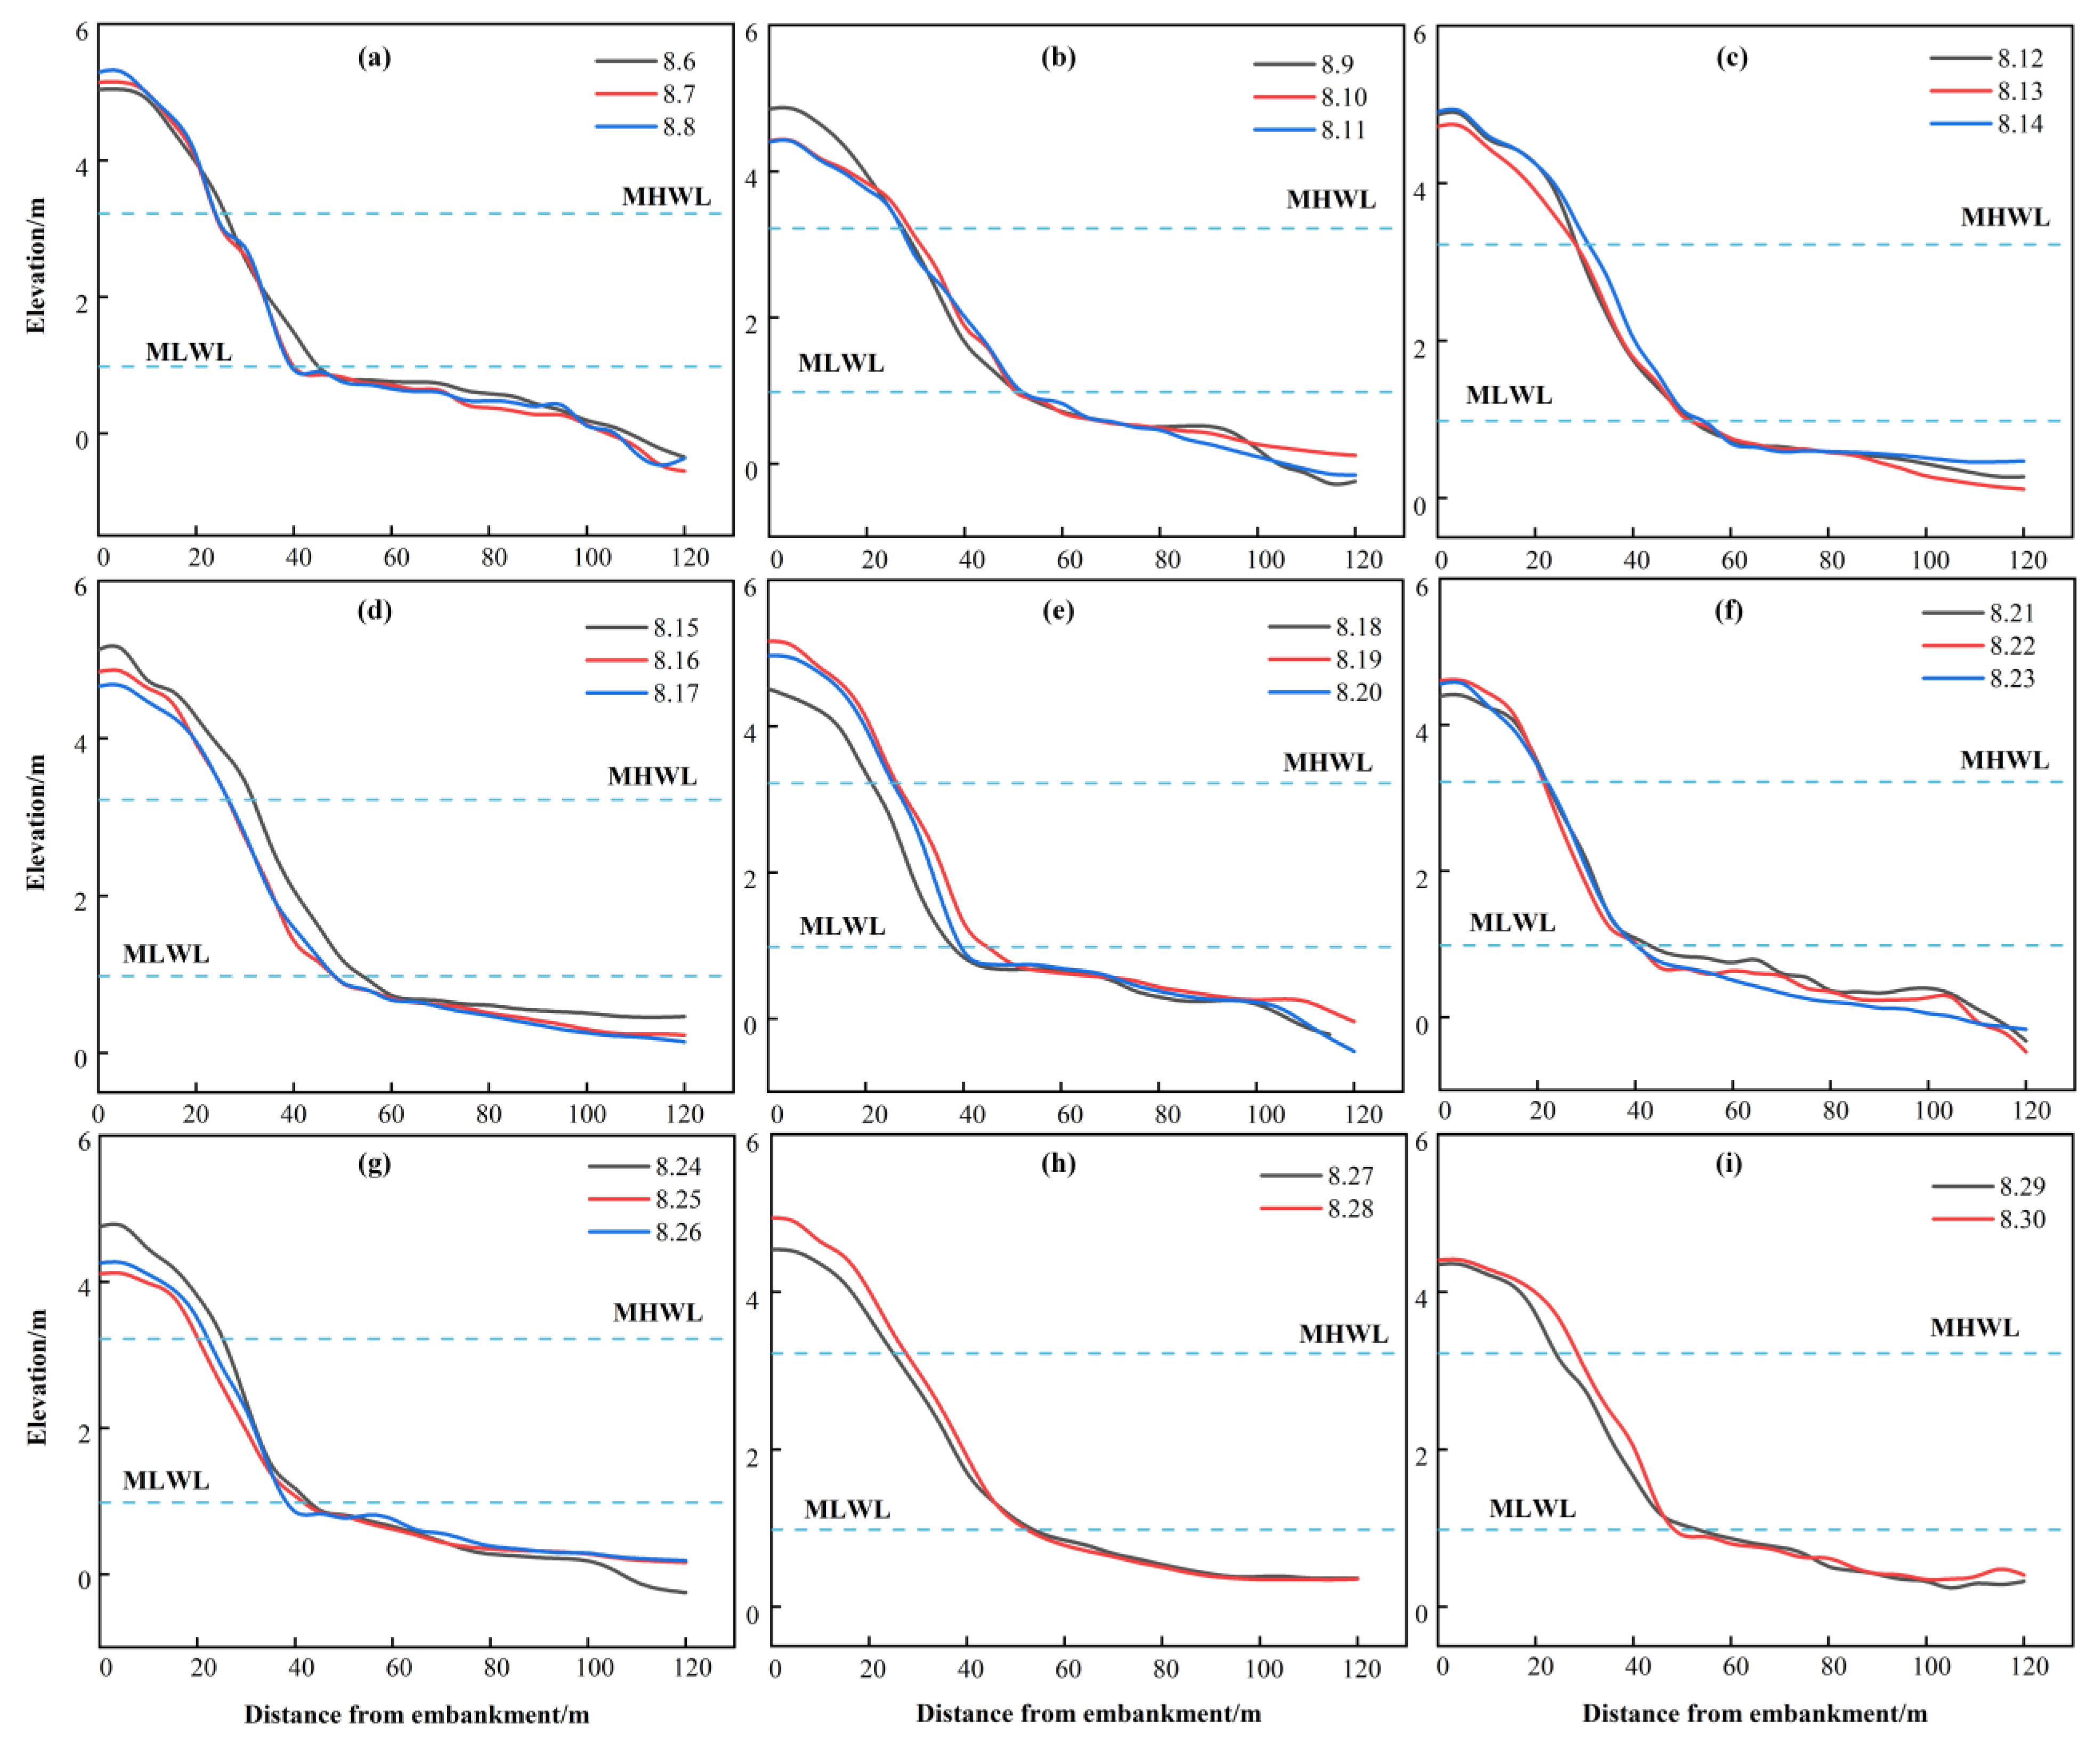
3.1.1. Profile Characteristics

During the post-storm beach recovery period, the changes in profile morphology are shown in Figure 4, Figure 5 and Figure 6. Overall, when the beach experiences erosion, the berm height increases, the profile slope becomes steeper, and the amplitude of the concave increases. When the berm height decreases, the profile becomes flatter. The changes in the three profiles exhibit varying degrees of difference.
The P1 profile underwent dynamic changes (Figure 4). The initial profile structure was “berm-steep slope-micro sand ridge.” From August 6 to 7 (Figure 4a), the berm height significantly increased, and a noticeable micro sand ridge appeared at a distance of 60 to 80 m offshore. From August 9 to 12 (Figure 4b,c), the upper part of the supratidal zone accreted to form the berm crest, and the beach profile developed a concave shape. The lower part of the subtidal zone was eroded, causing an increase in the slope of the escarpment. After August 12 (Figure 4c), the upper part of the supratidal zone was eroded, and the subtidal zone accreted. The berm slope decreased. On August 19 (Figure 4e), sediment accumulation in the lower part of the intertidal zone formed an underwater sandbar. From August 19 to 24 (Figure 4e–g), the profile changes were consistent with those from August 9 to 12, with the underwater sandbar moving shoreward. From August 24 to 30 (Figure 4g–i), the profile changes became more consistent, with the berm slope becoming gentler, the subtidal zone starting to accrete, and the escarpment disappearing, forming a flat platform. Notably, from August 27 to 29 (Figure 4h,i), the berm height significantly decreased, and the profile became flatter.
The P2 profile change process is shown in Figure 5. The initial profile structure is “berm-steep slope-terrace.” From August 6 to 7 (Figure 5a), the berm moved landward with some sediment accumulation, and the scarp slope became gentler. In the following 3 days (Figure 5b), the micro sand ridge disappeared, the berm moved seaward, and significant erosion occurred on the seaward side, which caused the scarp slope to increase. After August 17 (Figure 5d), the berm moved seaward, the slope on the landward side of the berm crest decreased, and discontinuous micro sand ridges reappeared. This dual sand ridge structure remained until August 24 (Figure 5g), when the top of the sandbar was eroded, changing the structure. After August 24, the berm crest moved landward, dunes accreted, micro sand ridges disappeared, and no significant morphological changes occurred over the following 4 days. This “dune-berm-gentle slope” structure continued until August 30 (Figure 5i).
The initial profile structure of P3 was characterized by a “berm-steep slope-gentle slope” configuration, as shown in Figure 6. From August 6 (Figure 6a), over the following three days, the berm crest migrated landward, accompanied by accretion near the dune area, and the scarp slope increased. By August 9, micro sand ridges appeared, and the profile structure remained relatively stable. Between August 10 and 19 (Figure 6b–e), no distinct morphological features developed, and the “berm-scarp-gentle slope” structure was largely maintained. On August 20 (Figure 6e), the profile experienced significant changes. The height difference between the top and bottom of the scarp increased substantially, forming an almost vertical scarp. This was primarily due to pronounced accretion on the seaward side of the berm crest. Below the intertidal zone, micro-troughs and sand ridges appeared, forming a dual ridge structure. Although accretion occurred at the top of the sandbar, the local slope remained unchanged, while noticeable erosion took place on the seaward side of the sandbar crest. The profile remained relatively stable until August 23 (Figure 6f). On August 24 (Figure 6g), significant erosion occurred at the sandbar crest, resulting in a marked decrease in the slope on its landward side. From that point until August 30 (Figure 6i), no distinct morphological features were observed, and the profile maintained a gentle slope without a clearly defined berm.

3.1.2. Variation in Berm, Beach Width, and Slope

The variation in berm height is shown in Figure 7a. Overall, the berm height increased on P1 and P3 profiles, while it decreased on the P2 profile. During the early stage of short-term recovery (August 6–August 15), the berm height on the P1 profile remained relatively stable, while on the P2 profile, the berm height first increased and then decreased. The berm height on the P3 profile also remained stable (except for August 9). After the 15th, all three profiles exhibited a sawtooth pattern, with varying degrees of oscillation. Among them, the oscillation amplitude was greatest on the P1 profile.
Beach width varied significantly across different stages of beach recovery (Figure 7b). Overall, the beach width increased along all three profiles, with P1 and P3 showing similar trends, although the P1 profile exhibited greater fluctuations. Throughout the observation period, the beach width increased by 5.29 m on the P1 profile, 7.52 m on the P2 profile, and 2.38 m on the P3 profile. These results indicate that the supratidal zone along all three profiles experienced varying degrees of accretion.
The changes in intertidal zone slope for the three profiles from August 6 to 30 are shown in Figure 7c. Overall, the slope values remained below 1:5. All three profiles exhibited an increase in slope over time, indicating that the beachface became steeper. Specifically, for the P1 profile, the slope reached a maximum of 0.16 on August 8 and a minimum of 0.06 on August 15. For the P2 profile, the maximum slope was 0.20 on August 23 and the minimum was 0.07 on August 29. For the P3 profile, the slope peaked at 0.18 on August 24 and dropped to a minimum of 0.10 on August 11.

3.2. Spatiotemporal Characteristics of Beach Erosion and Accretion

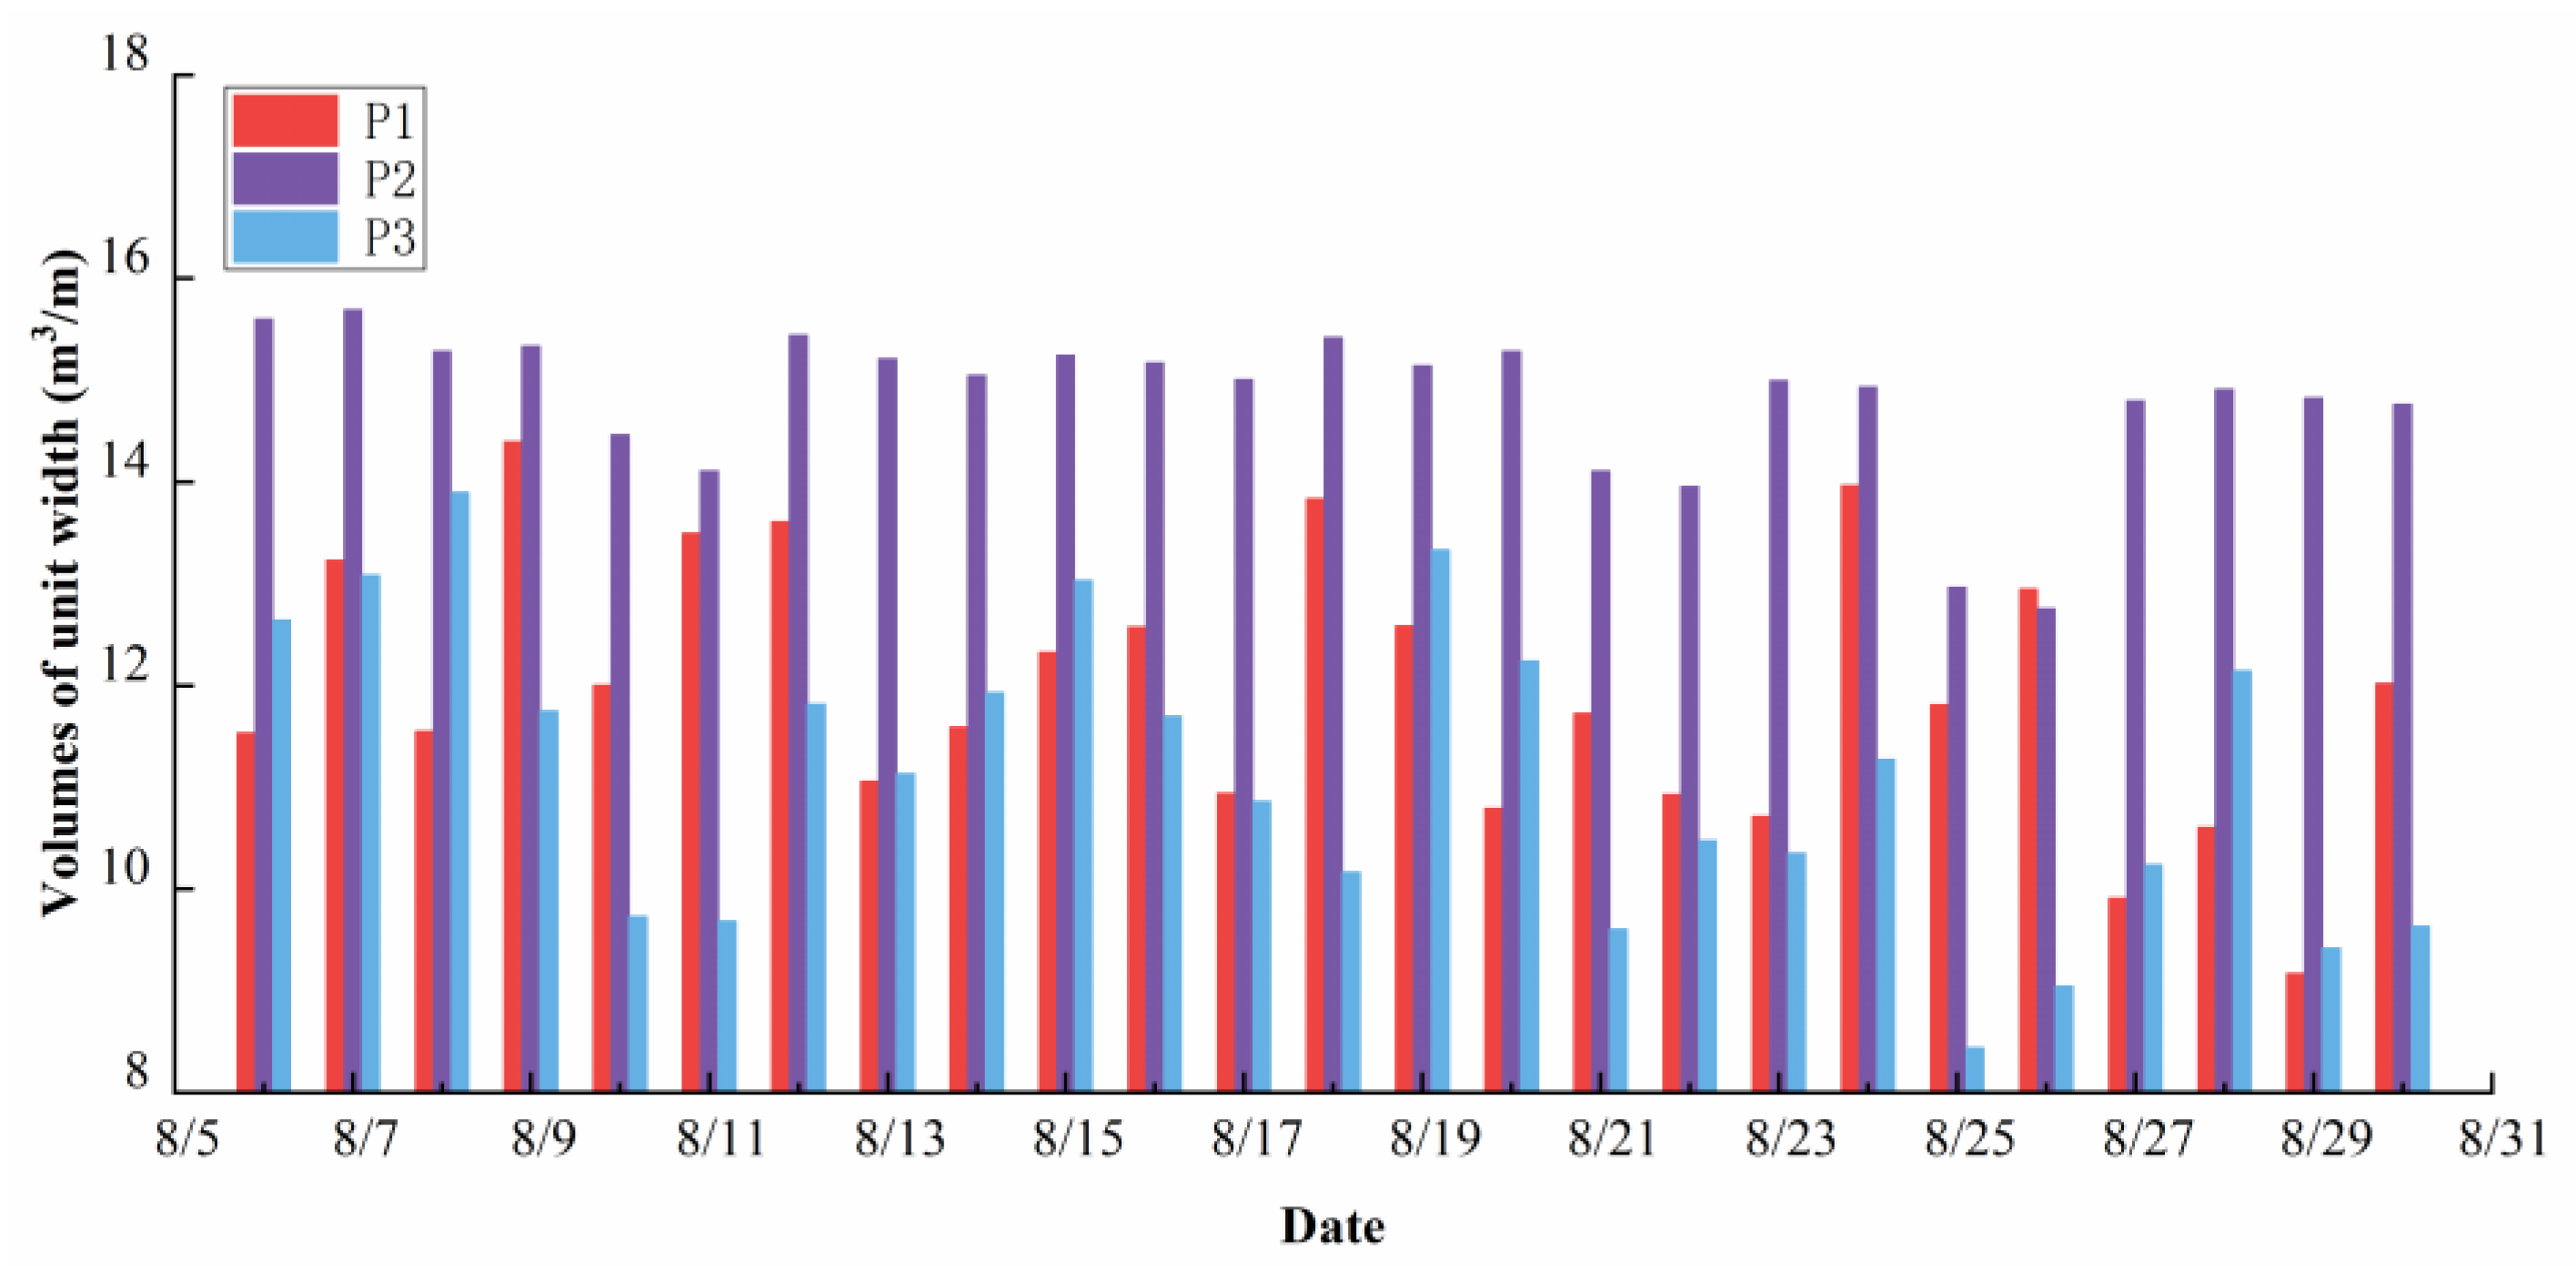
3.2.1. Variation in Unit-Width Volume

During the post-storm recovery period, the mean unit-width volumes of the three profiles were 11.97 m3/m (P1), 14.82 m3/m (P2), and 11.10 m3/m (P3), respectively. Overall, the unit-width volume of the P2 profile was greater than those of the P1 and P3 profiles. In terms of variation trends (Figure 8), the P3 profile exhibited the greatest fluctuation, followed by P1, while P2 showed the smallest fluctuation. The overall variation trends of the P1 and P3 profiles were generally similar. The unit-width volume on the P1 profile ranged from 9.17 to 14.40 m3/m, with a maximum single change of 3.26 m3/m and a minimum of 0.11 m3/m. For the P2 profile, the maximum and minimum volumes were 15.69 m3/m and 12.75 m3/m, respectively, with a maximum change of 2.05 m3/m and a minimum of 0.05 m3/m. The P3 profile ranged from 8.44 to 13.90 m3/m, with a maximum change of 3.16 m3/m and a minimum of 0.04 m3/m.

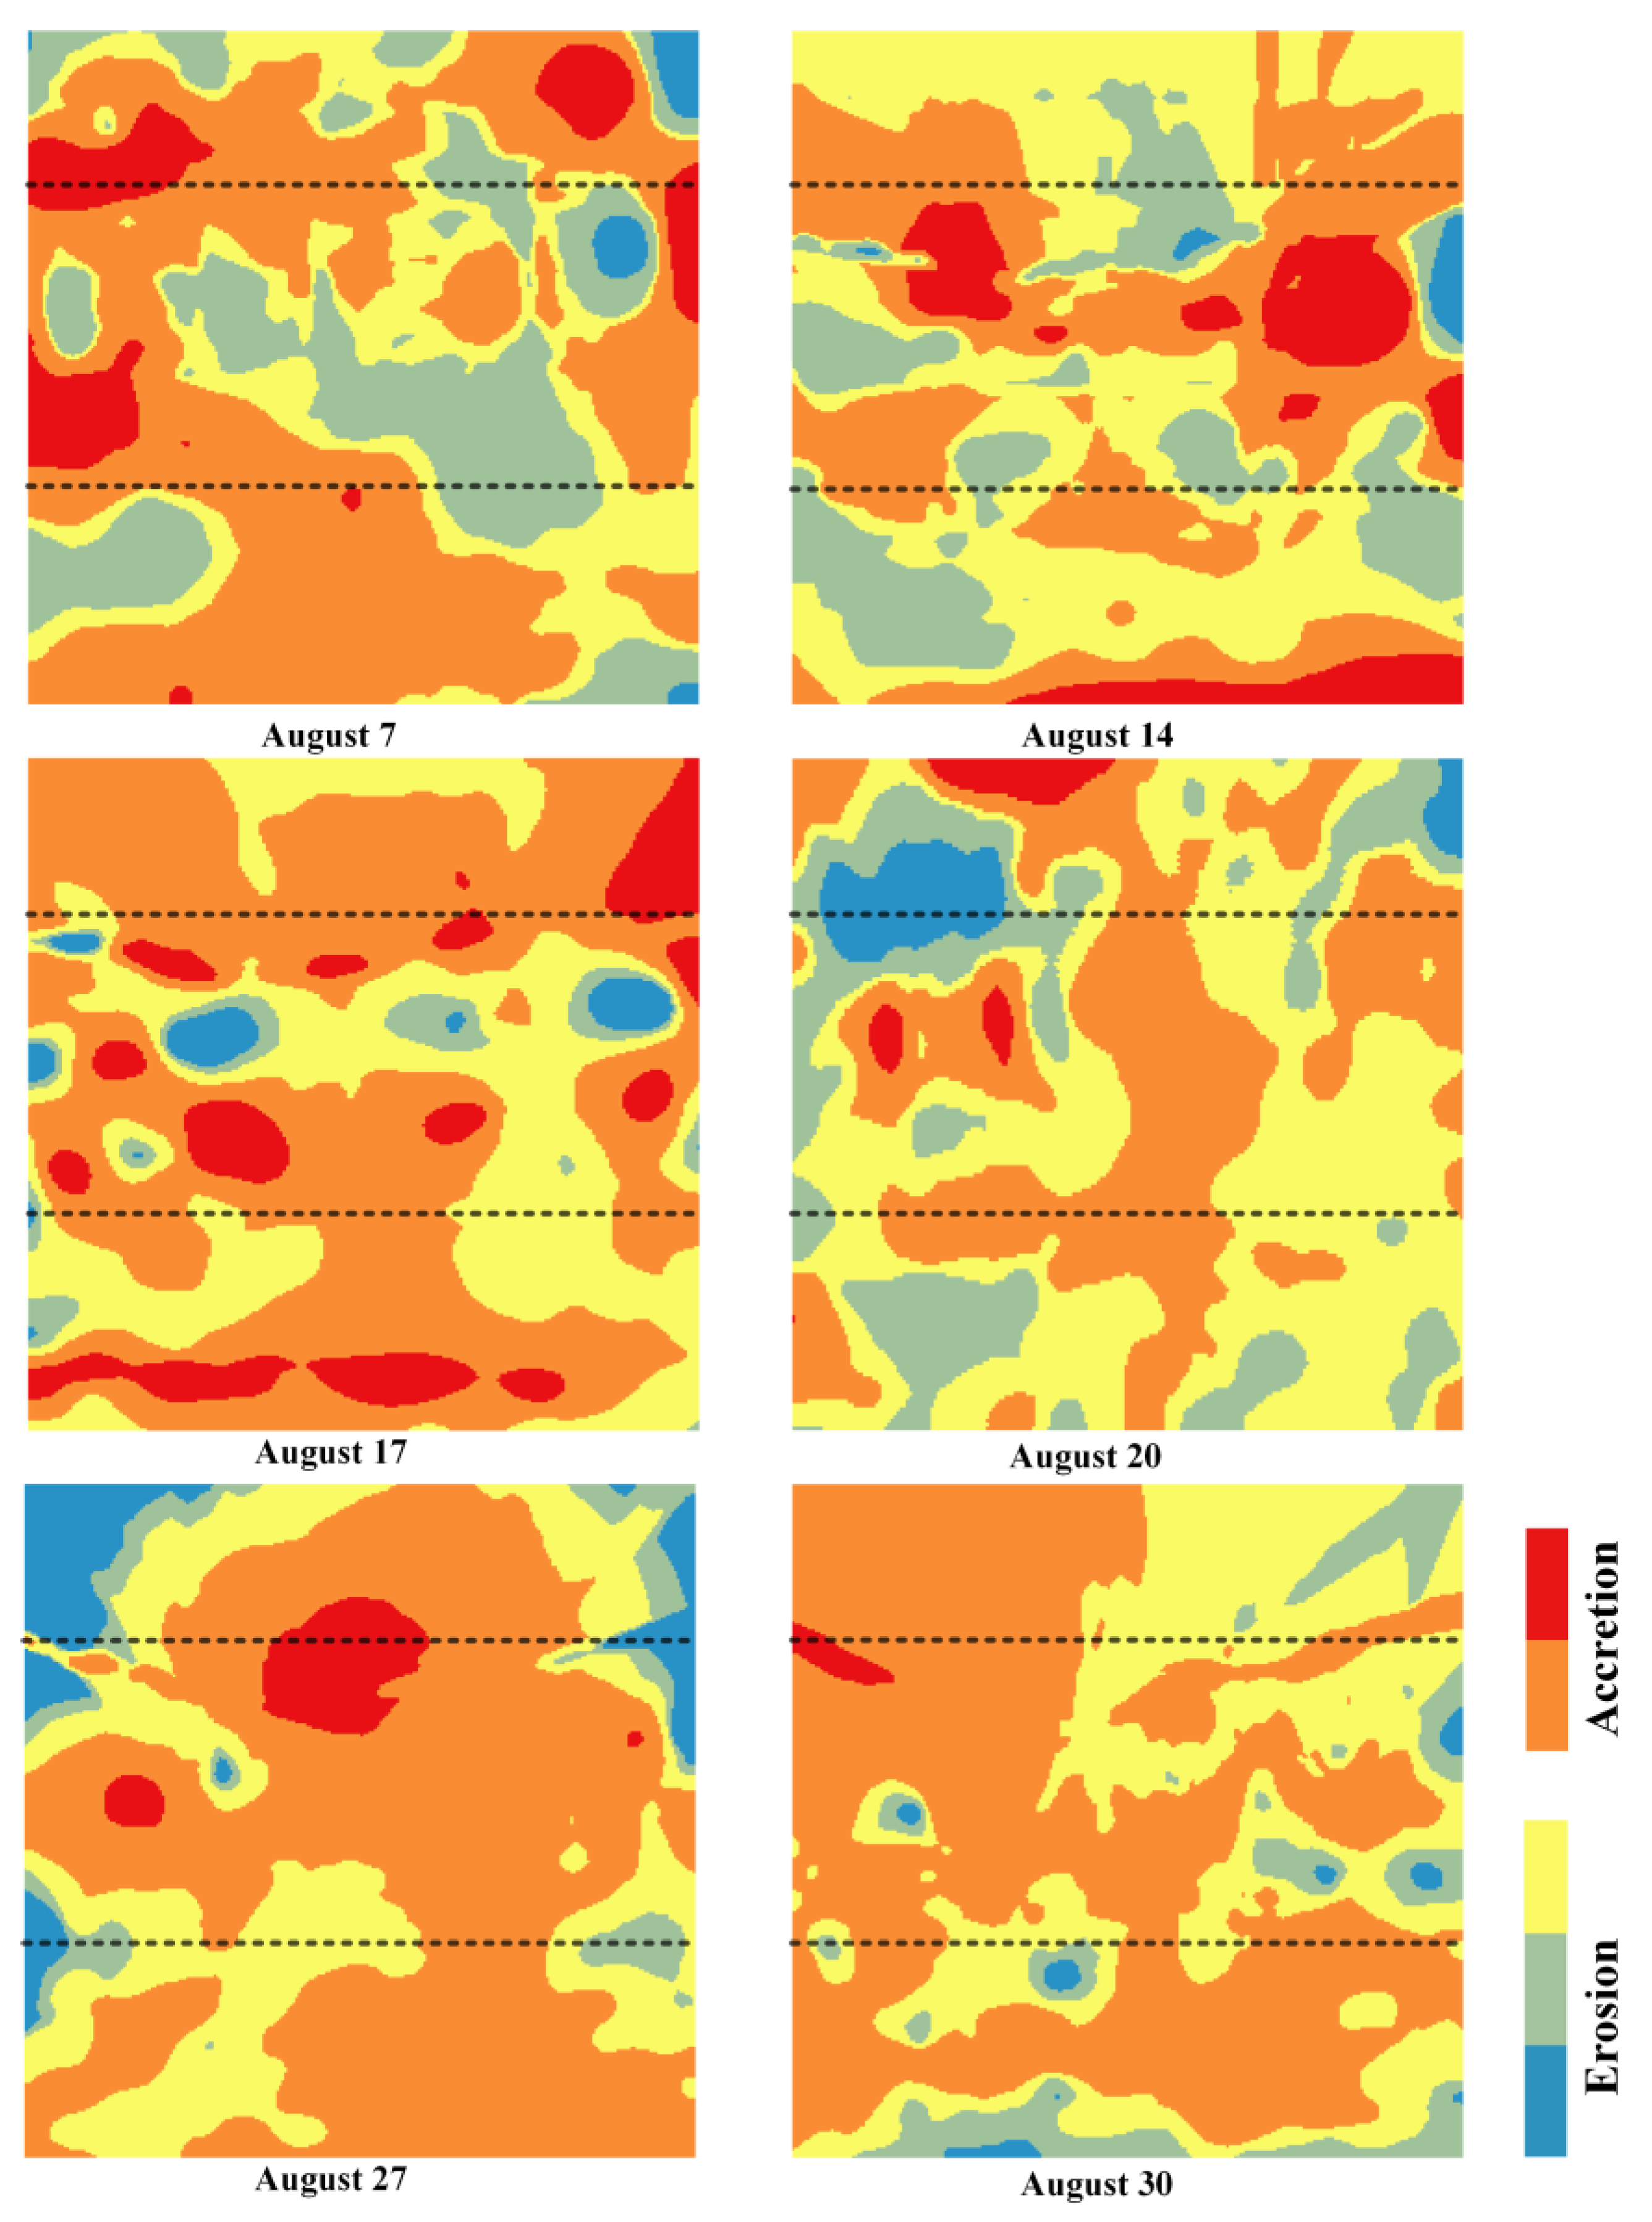
3.2.2. Spatial Variation in Beach Erosion and Accretion

The post-storm beach erosion and accretion process exhibited a phased pattern [49]. In the early stage following the storm, erosion areas were extensive and widely distributed, while accretion was limited and confined to localized zones. Subsequently, erosion areas gradually concentrated in the subtidal zone, and accretion zones expanded from the supratidal zone toward the subtidal zone. Overall, the spatial extent of erosion decreased, while that of accretion increased. Localized areas displayed spatial heterogeneity in erosion and accretion, with some zones undergoing repeated alternations between erosion and accretion over short periods, indicating that the beach response after a storm is highly complex.
During the observation period, the beach underwent a dynamic process consisting of an “erosion phase (early period), alternating erosion and accretion phase (middle period), and accretion phase (late period),” with erosion dominating the early period and accretion gradually prevailing in the middle and late stages (Figure 9). This phase division was based on the dominant erosion–accretion patterns observed in daily beach profiles in order to better reflect the actual morphological response of the beach during the post-storm recovery. From August 7 to August 14, erosion was predominant, with a high proportion of erosion area primarily concentrated in the intertidal zone. Although some localized accretion occurred in the supratidal zone, the overall erosion area remained larger. The middle period was characterized by alternating erosion and accretion, during which erosion and accretion zones were interlaced and spatially variable. For example, on August 17, accretion was dominant, with erosion mainly occurring in the intertidal zone, while accretion was extensive and spatially concentrated. In contrast, on August 20, erosion became dominant again, with an uneven spatial distribution of erosion and accretion; accretion was scattered and mainly confined to the intertidal zone, whereas erosion was more spatially concentrated. In the late period, accretion gradually became dominant, especially in the supratidal and intertidal zones, where accretional areas expanded significantly and covered a larger surface. Meanwhile, erosion zones shrank and were mainly distributed in the subtidal zone, indicating that the beach gradually moved toward equilibrium during the later stages of post-storm recovery.

3.3. Characteristics of Beach Recovery Rate

During the storm, the berm profile was eroded, and sediment from the backshore was transported offshore, forming a submerged sandbar in the foreshore area. As a result, the profile transitioned from a berm profile to a sandbar profile. Subsequently, under the influence of regular wave conditions, the sandbar profile gradually recovered to the pre-storm berm profile configuration [35,50,51]. In this study, the frequency distribution of daily changes in unit-width volume along post-storm beach profiles is used as an indicator to quantify the beach recovery rate.
Changes in unit-width volume reflect the erosion and accretion processes of the beach, and post-storm erosion–accretion dynamics are indicative of the beach recovery state [12,52]. During the observation period, most erosion–accretion events fell within the range of −3.6 to 3.6 m3/m, with weak erosion–accretion events being dominant and strong events occurring infrequently (Figure 10). As shown in Figure 10, the frequency distribution of unit-width volume change is concentrated around 0 m3/m. Therefore, changes within −1.2 to 1.2 m3/m are considered weak erosion–accretion events, defined here as the slow recovery phase. In the histograms of unit-width volume change for all profiles, the frequency values near the intervals of 3 to 3.6 m3/m and −3.6 to −3 m3/m are nearly zero, indicating that erosion–accretion events are rare within these ranges. These are considered strong erosion–accretion events, where values between 3 and 3.6 m3/m are defined as the rapid recovery phase and those between −3.6 and −3 m3/m are the slow degradation phase. Events with changes between −3 and −1.2 m3/m or between 1.2 and 3 m3/m are classified as moderate erosion–accretion events, defined as the moderate recovery phase, and typically occur on both sides of the frequency peaks.

4. Discussion

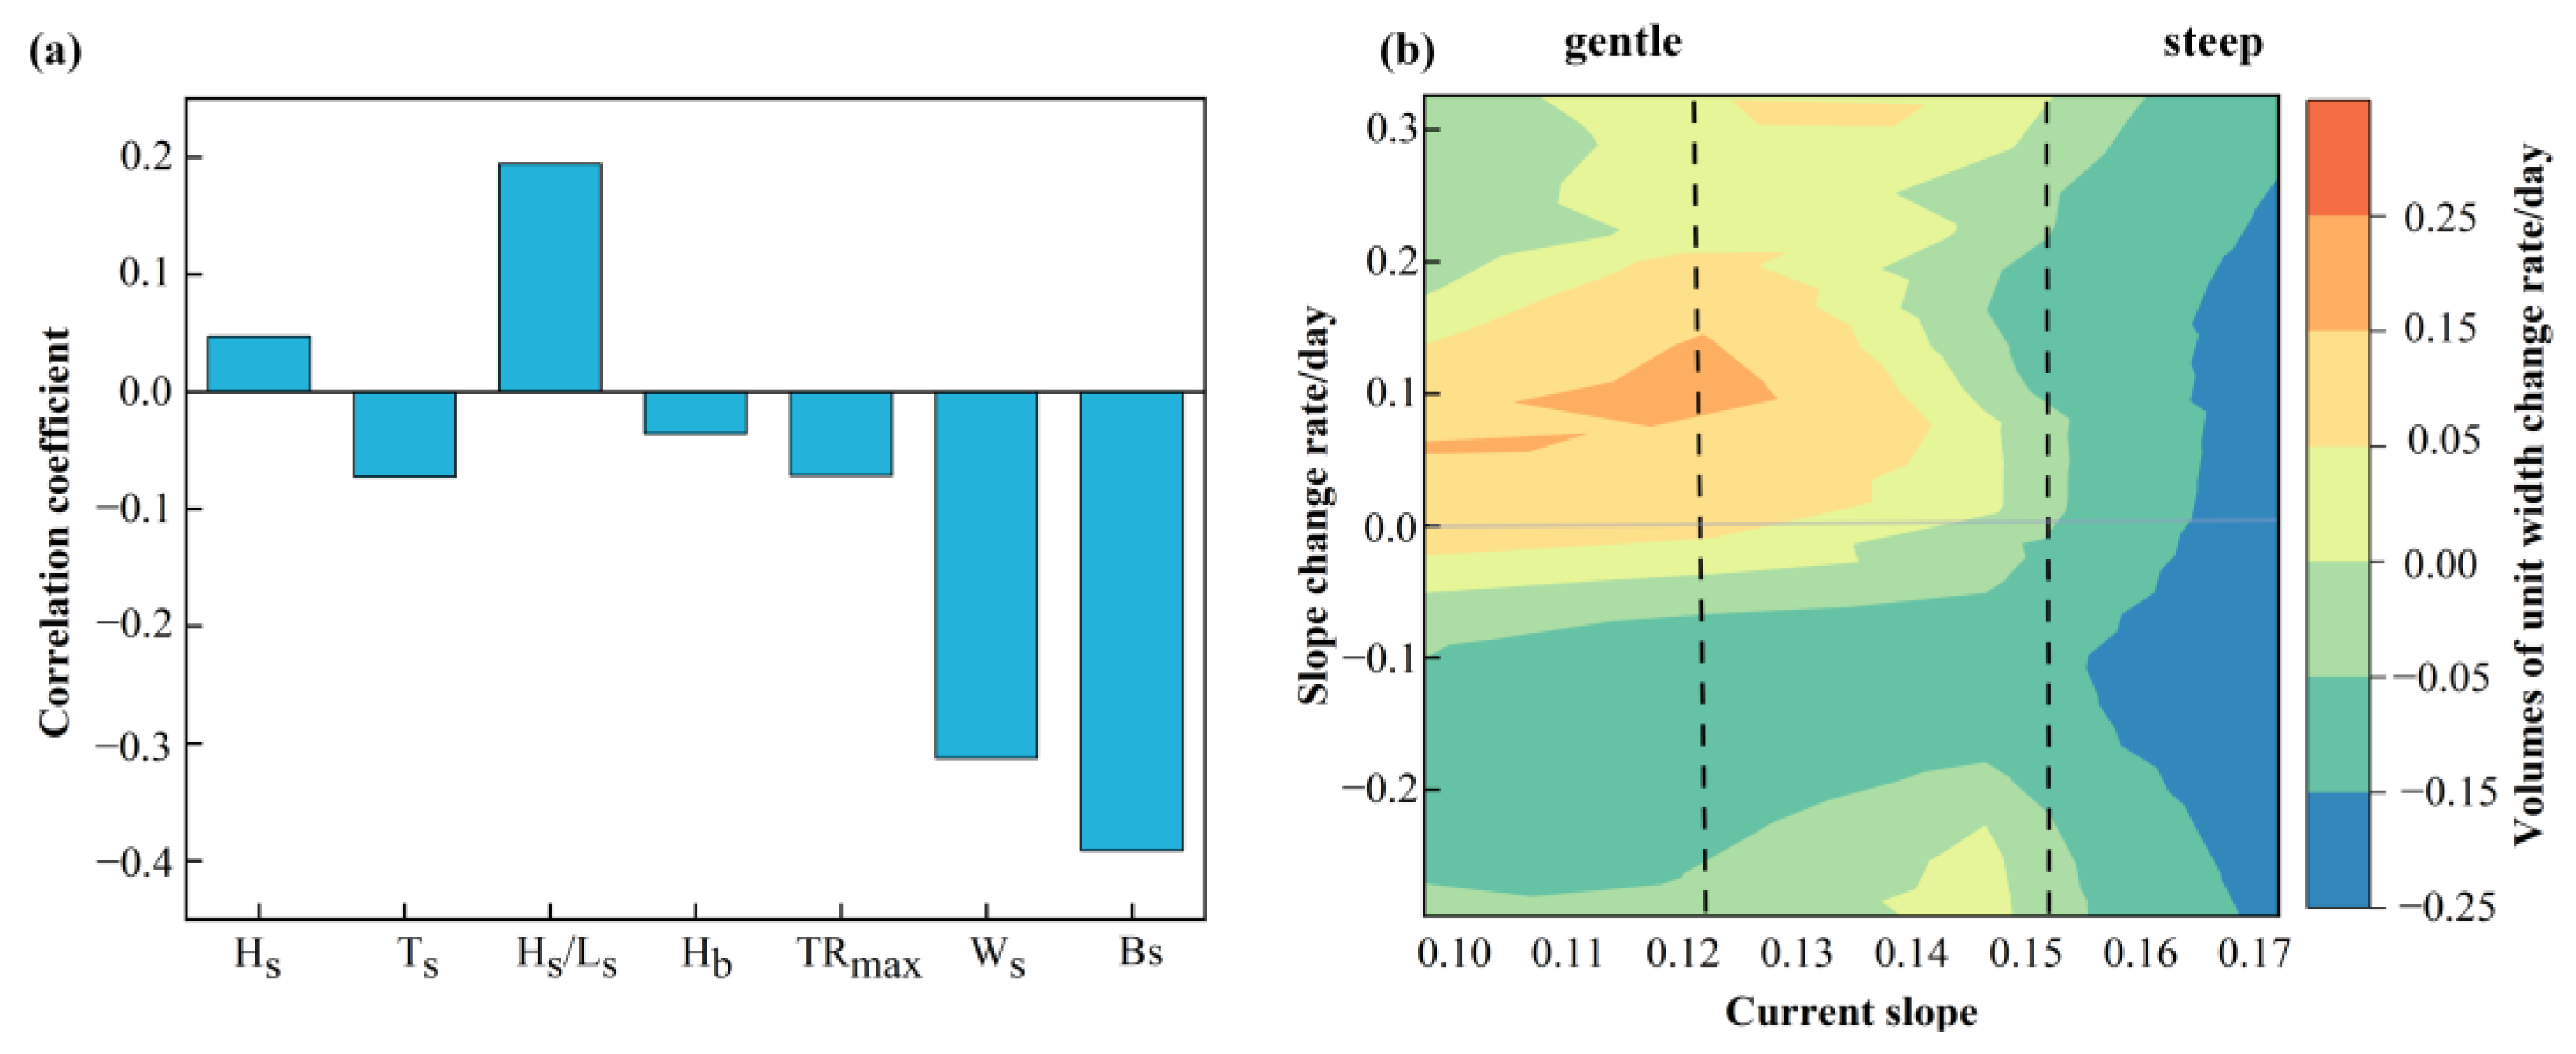
4.1. Factors Influencing Beach Recovery

Although wave dynamics and tidal conditions are the primary drivers of beach morphology, the geomorphological response of the beach is also influenced by local geological settings [53,54,55]. In the early stage of a storm, the initial beach morphology serves as the main controlling factor for the beach response. In the later stage, hydrodynamic conditions become more important, particularly tidal level and swell height [13]. The extent of beach response, in turn, influences the post-storm recovery process [12]. During the recovery phase, the beach morphology gradually readjusts to prevailing wave conditions and topographic settings and progressively returns to a more stable state [56].
Since the analytical procedures for P1, P2, and P3 profiles are similar, this section focuses on the P3 profile as a representative example. To identify the main driving factors in the beach recovery process, this study comprehensively considered dynamic, sedimentary, and morphological factors. Pearson’s product–moment correlation analysis was used to examine the relationships between daily unit-width volume change on the P3 profile and the following variables: significant wave height (Hs), wave period (Ts), wave steepness (Hs/Ls), breaking wave height (Hb), maximum tidal range (TRmax), sediment settling velocity (Ws), and beach slope (Bs), as shown in Figure 11a. The results show that unit-width volume change is positively correlated with significant wave height and wave steepness, with a stronger correlation observed for wave steepness. In contrast, negative correlations were found with wave period, breaking wave height, maximum tidal range, sediment settling velocity, and beach slope. Among all environmental factors, beach slope exhibited the strongest correlation (R = −0.39), highlighting its critical role in beach profile recovery.

4.2. Response of Unit-Width Beach Volume to Slope Change

To better understand the characteristics of beach recovery, the influence of slope change on unit-width beach volume was examined based on the strength of correlations between various environmental factors and unit-width volume change (Figure 11b). The results reveal three types of response patterns between slope change and unit-width volume. When the slope increases, unit-width volume increases on flatter beaches but decreases on steeper ones. When the slope decreases, unit-width volume decreases on both flatter and steeper beaches. These results indicate that flatter beaches are more sensitive to changes in unit-width volume and tend to evolve toward a state of equilibrium, making them more likely to recover to their pre-storm conditions. In contrast, steeper beaches are less responsive to slope change, and their unit-width volume is less affected by variations in slope.

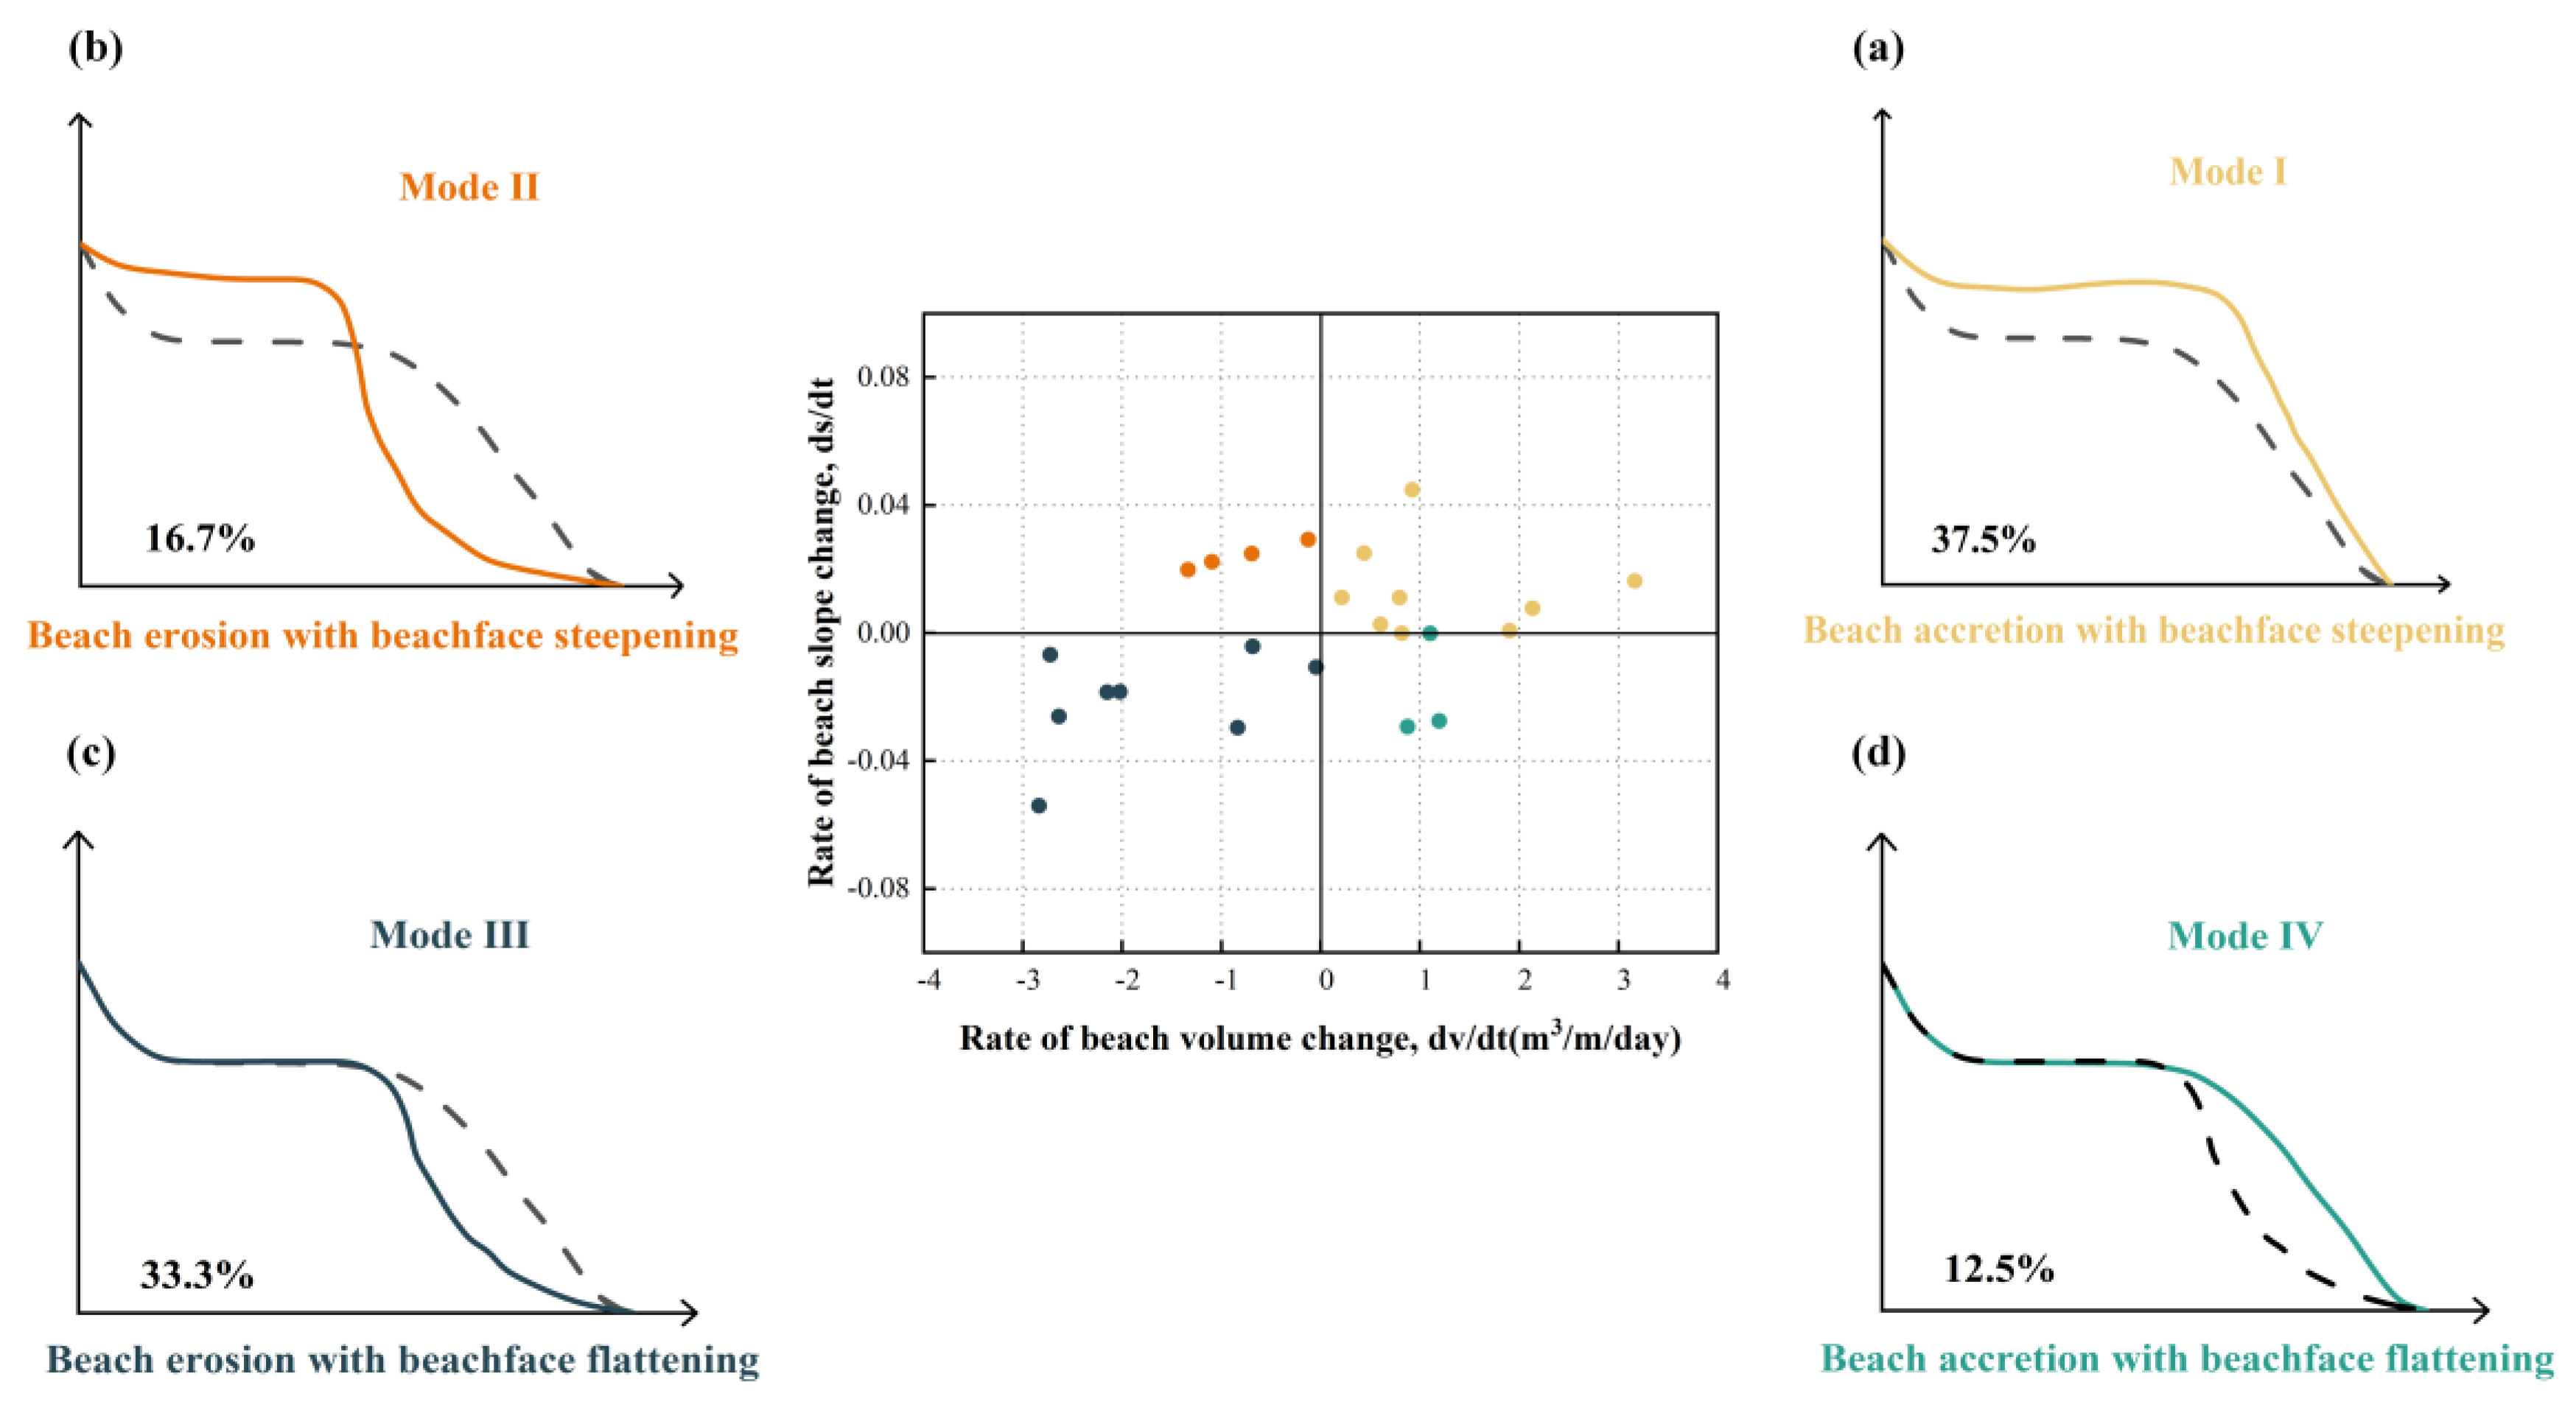
4.3. Four Recovery Modes of the Beach

Beach recovery is a complex, continuous, and phased process. Egense [57] divided beach recovery into two stages based on the amount of sediment restored, emphasizing that the second stage generally lasts longer than the first. Based on the correlation of elevation frequency distribution curves before and after a typhoon, erosion–accretion patterns, and dominant slope variations, short-term beach recovery has also been classified into three stages [58]. According to differences in post-storm responses of the beachface and berm, Dubois [59] proposed two recovery modes: one characterized by seaward accretion on the beachface and the other by deposition on the upper beachface and berm accretion. Building on this, Phillips et al. [38] further classified short-term beach recovery into four distinct modes by analyzing long-term variations in beachface and berm volume change rates.
As noted above, beach slope plays a significant role in beach recovery and exhibits a complex response relationship with the recovery process. To further explore the influence of slope on beach recovery, this study classifies the recovery process into four modes based on the combination of slope change rate and daily unit-width volume change rate (Figure 12).

4.3.1. Mode I: Beach Accretion with Beachface Steepening

Mode 1 is the most common recovery pattern, accounting for 37.5% of the observation days, with 9 days during the monitoring period falling into this category. In this mode, the beach undergoes accretion while the beachface becomes steeper (Figure 12a). This suggests that onshore sediment transport exceeds offshore transport, resulting in landward growth of the beachface. The vertical elevation of the berm initially decreases and then gradually increases; for example, on August 28, the berm height dropped by approximately 0.54 m but quickly returned to its original level. Similarly, the beach width first decreased and then increased, becoming wider overall. On August 24, the slope reached its maximum value, and the intertidal zone gradually steepened throughout the process, enhancing wave scouring. During this morphological evolution, the unit-width volume change rate first increased and then decreased, peaking at 3.16 m3/m/day on August 19. A distinct scarp structure formed during this period, accompanied by a rapid increase in slope, which intensified wave-induced erosion. Under such conditions, the beach may be unable to form a sandbar throughout the recovery period.

4.3.2. Mode II: Beach Erosion with Beachface Steepening

Mode II occurred less frequently, accounting for 16.7% of the observation days, with only 4 days matching this pattern during the observation period. In this mode, the beach undergoes erosion, while the beachface becomes steeper (Figure 12b). This indicates that offshore sediment transport exceeds onshore transport, resulting in a net loss of beach volume. The average daily unit-width volume change rate was –0.81 m3/m, with a maximum change rate of −1.33 m3/m. During the sediment transport process, the vertical elevation of the berm initially increased and then decreased, showing overall berm accumulation. Meanwhile, beach width gradually decreased. Morphologically, the beach exhibited upper profile accretion and lower profile erosion.

4.3.3. Mode III: Beach Erosion with Beachface Flattening

Mode III is a relatively common recovery pattern, occurring on 33.3% of the observation days, second only to Mode I. As shown in Figure 12c, the beach continues to experience volume loss in this mode, but the slope of the intertidal zone becomes gentler. This indicates that during Mode III, wave energy remains relatively strong, leading to persistent scouring of the beach. Coarser sediments are transported offshore, leaving finer materials on the beach surface. These finer sediments are more easily mobilized and subject to re-sorting, resulting in a more gently sloping beachface [60,61]. In this mode, the vertical variation in berm height is similar to that in Mode II. Beach width also gradually decreases, reaching its minimum value of 19.86 m on August 25. Beach slope initially decreased and then increased, but the overall trend was a net decrease, with the minimum slope observed on August 11, the lowest recorded during the short-term recovery period. Sediment transport was clearly directed offshore, with a mean daily unit-width volume change rate of −1.74 m3/m and a maximum of −2.84 m3/m. Additionally, micro sand ridges were observed.

4.3.4. Mode IV: Beach Accretion with Beachface Flattening

Mode IV was the least frequent pattern during the observation period, occurring on only 3 days, accounting for just 12.5% of the total. As shown in Figure 12d, this mode corresponds to a slow recovery phase of the beach. The vertical elevation of the berm crest exhibited the greatest variation, with its height decreasing from the maximum to the minimum between August 22 and August 27. During this mode, beach width reached its maximum value of 30.77 m, while the slope of the intertidal zone gradually decreased. The mean daily unit-width volume change rate was 1.05 m3/m. Sediment was transported from the inner surf zone to the subtidal zone, resulting in net accretion. On August 22, sediment deposited in the subtidal zone was observed to connect with micro sand ridges, forming a submerged sandbar.

5. Conclusions

This study focused on the Dongdao Beach of Hailing Island, Yangjiang City, Guangdong Province, and utilized 25 consecutive days of field observations following Typhoon Cempaka (6–30 August 2021). The dataset included daily beach profile surveys, surf zone wave measurements, and surface sediment sampling. Based on this dataset, we analyzed the characteristics of profile changes, geomorphic evolution, spatiotemporal patterns of erosion and accretion, and recovery rates. We further investigated the environmental factors influencing post-storm beach recovery and, on this basis, identified four typical recovery modes.
Post-storm changes in beach profile structures are primarily governed by geomorphic units such as berms and sandbars, while localized areas exhibit dynamic responses of fine-scale features like micro-troughs. Once significant profile adjustments occurred, the newly formed morphological features generally remained stable for a period of time, reflecting the discontinuous nature and slow pace of beach recovery. During the recovery process, the width of the supratidal zone and the position of the berm crest changed continuously, while the intertidal slope increased (or decreased) as the berm crest migrated landward (or seaward), making it difficult for the beach to return to its pre-storm state in the short term. The erosion–accretion process exhibited clear phasing and complexity, along with spatial heterogeneity across different areas. Some localized regions experienced alternating erosion and accretion events within short time intervals. The unit-width volume changes in the three surveyed profiles were 0.49 m3/m, −0.84 m3/m, and −3.01 m3/m, respectively, indicating distinct recovery responses among the profiles. Short-term beach recovery was closely related to a range of environmental factors, among which beach slope showed the strongest correlation. Other influential factors included wave parameters in the surf zone, such as significant wave height, wave period, wave steepness, and breaking wave height, as well as maximum tidal range and sediment settling velocity. Based on the relationship between slope variation and unit-width volume change, three response types were identified. When slope increased, flatter beaches tended to gain sediment while steeper beaches experienced volume loss; when slope decreased, both beach types exhibited volume loss. This indicates that flatter beaches are more sensitive to morphological adjustments and tend to evolve toward a dynamic equilibrium state. Furthermore, by combining slope variation rates with volume change rates, four distinct short-term post-storm recovery modes were identified: (1) beach accretion with beachface steepening, (2) beach erosion with beachface steepening, (3) beach erosion with beachface flattening, and (4) beach accretion with beachface flattening.

Author Contributions

Conceptualization, L.L., Y.S., R.L. and Z.L.; writing—original draft, L.L.; visualization, L.L.; validation, L.L.; methodology, L.L., Y.S., R.L. and Z.L.; investigation, L.L., Y.S., R.L., D.Z., Z.C. and Z.L.; formal analysis, L.L. and Z.L.; data curation, L.L., R.L. and Z.L.; project administration, Y.S. and Z.L.; writing—review and editing, Z.L.; supervision, Z.L.; resources, Z.L.; funding acquisition, Z.L. All authors have read and agreed to the published version of the manuscript.

Funding

This research was funded by the National Natural Science Foundation of China (Grant No.42176167) and the Guangdong Basic and Applied Basic Research Foundation (Grant No.2024A1515011427).

Data Availability Statement

The deep-water wave data are available through the European Centre for Medium-Range Weather Forecasts: https://cds.climate.copernicus.eu/ (accessed on 10 October 2024). The original contributions presented in the study are included in the article. Further inquiries can be directed to the corresponding author.

Acknowledgments

The authors would like to thank the other students and teachers in the group for their contributions to the collection of data.

Conflicts of Interest

The authors declare no conflicts of interest.

References

  1. Forbes, D.L.; Parkes, G.S.; Manson, G.K.; Ketch, L.A. Storms and shoreline retreat in the southern Gulf of St. Lawrence. Mar. Geol. 2004, 210, 169–204. [Google Scholar] [CrossRef]
  2. Seymour, R.; Guza, R.T.; O’Reilly, W.; Elgar, S. Rapid erosion of a small southern California beach fill. Coast. Eng. 2005, 52, 151–158. [Google Scholar]
  3. Kossin, J.P.; Knapp, K.R.; Olander, T.L.; Velden, C.S. Global increase in major tropical cyclone exceedance probability over the past four decades. Proc. Natl. Acad. Sci. 2020, 117, 11975–11980. [Google Scholar] [CrossRef] [PubMed]
  4. Dolan, R.; Davis, R.E. An intensity scale for Atlantic coast Northeast storms. J. Coast. Res. 1992, 8, 978–983. [Google Scholar]
  5. Guo, J. Research of Embayed Beach Morphodynamics Under the Impacts of Storm Events with Different Intensity Scales; East China Normal University: Shanghai, China, 2022. [Google Scholar]
  6. Wright, L.D.; Guza, R.T.; Short, A.D. Dynamics of a high-energy dissipative surf zone. Mar. Geol. 1982, 45, 41–62. [Google Scholar] [CrossRef]
  7. Hwang, B.H.; Do, K.D.; Chang, S.Y. Morphological response of Storm Hinnamnor at Songjeong Beach using UAV-derived data. J. Coast. Res. 2024, 116, 126–130. [Google Scholar] [CrossRef]
  8. Karunarathna, H.; Pender, D.; Ranasinghe, R.; Short, A.D.; Reeve, D.E. The effects of storm clustering on beach profile variability. Mar. Geol. 2014, 348, 103–112. [Google Scholar] [CrossRef]
  9. Senechal, N.; Coco, G.; Castelle, B.; Marieu, V. Storm impact on the seasonal shoreline dynamics of a meso- to macrotidal open sandy beach (Biscarrosse, France). Geomorphology 2015, 228, 448–461. [Google Scholar] [CrossRef]
  10. Cai, F.; Su, X.; Yang, S.; Gao, Z. rapid response to 9914 typhoon-induced storm wave force made by the beach profiles of Xiamen Island. Ocean Eng. 2002, 2, 85–90. [Google Scholar] [CrossRef]
  11. Sallenger, A.H. Storm impact scale for barrier islands. J. Coast. Res. 2000, 16, 890–895. [Google Scholar]
  12. Gong, H. Complicated Response of Beach Erosion and Restoration to Consecutive Typhoons-Based on Beaches along Northern and Northeastern Coast in Hainan; East China Normal University: Shanghai, China, 2017. [Google Scholar]
  13. Vousdoukas, M.I.; Almeida LP, M.; Ferreira, Ó. Beach erosion and recovery during consecutive storms at a steep--slope, meso-tidal beach. Earth Surf. Process. Landf. 2012, 37, 583–593. [Google Scholar] [CrossRef]
  14. Coco, G.; Senechal, N.; Rejas, A.; Bryan, K.R.; Capo, S.; Parisot, J.P.; Brown, J.A.; MacMahan, J.H. Beach response to a sequence of extreme storms. Geomorphology 2014, 204, 493–501. [Google Scholar] [CrossRef]
  15. Burvingt, O.; Masselink, G.; Russell, P.; Scott, T. Classification of beach response to extreme storms. Geomorphology 2017, 295, 722–737. [Google Scholar] [CrossRef]
  16. Gallagher, E.L.; Elgar, S.; Guza, R.T. Observations of sand bar evolution on a natural beach. J. Geophys. Res. Ocean. 1998, 103, 3203–3215. [Google Scholar] [CrossRef]
  17. Plant, N.G.; Todd Holland, K.; Holman, R.A. A dynamical attractor governs beach response to storms. Geophys. Res. Lett. 2006, 33. [Google Scholar] [CrossRef]
  18. Scott, T.; Masselink, G.; O’Hare, T.; Saulter, A.; Poate, T.; Russell, P.; Davidson, M.; Conley, D. The extreme 2013/2014 winter storms: Beach recovery along the southwest coast of England. Mar. Geol. 2016, 382, 224–241. [Google Scholar] [CrossRef]
  19. Yu, F.; Switzer, A.D.; Lau, A.Y.A.; Yeung, H.Y.E.; Chik, S.W.; Chiu, H.C.; Huang, Z.; Pile, J. A comparison of the post-storm recovery of two sandy beaches on Hong Kong Island, southern China. Quat. Int. 2013, 304, 163–175. [Google Scholar] [CrossRef]
  20. Gallego-Fernández, J.B.; Morales-Sánchez, J.A.; Martínez, M.L.; García-Franco, J.G.; Zunzunegui, M. Recovery of beach-foredune vegetation after disturbance by storms. J. Coast. Res. 2020, 95, 34–38. [Google Scholar] [CrossRef]
  21. Aagaard, T.; Kroon, A.; Andersen, S.; Sørensen, R.M.; Quartel, S.; Vinther, N. Intertidal beach change during storm conditions; Egmond, The Netherlands. Mar. Geol. 2005, 218, 65–80. [Google Scholar] [CrossRef]
  22. Houser, C.; Mathew, S. Alongshore variation in foredune height in response to transport potential and sediment supply: South Padre Island, Texas. Geomorphology 2011, 125, 62–72. [Google Scholar] [CrossRef]
  23. Houser, C.; Hapke, C.; Hamilton, S. Controls on coastal dune morphology, shoreline erosion and barrier island response to extreme storms. Geomorphology 2008, 100, 223–240. [Google Scholar] [CrossRef]
  24. Priestas, A.M.; Fagherazzi, S. Morphological barrier island changes and recovery of dunes after Hurricane Dennis, St. George Island, Florida. Geomorphology 2010, 114, 614–626. [Google Scholar] [CrossRef]
  25. Zhang, K.; Douglas, B.; Leatherman, S. Do storms cause long-term beach erosion along the US East Barrier Coast? J. Geol. 2002, 110, 493–502. [Google Scholar] [CrossRef]
  26. Cheng, J.; Wang, P. Unusual beach changes induced by Hurricane Irma with a negative storm surge and post storm recovery. J. Coast. Res. 2019, 35, 1185–1199. [Google Scholar] [CrossRef]
  27. Morton, R.A.; Paine, J.G.; Gibeaut, J.C. Stages and durations of post-storm beach recovery, southeastern Texas coast, USA. J. Coast. Res. 1994, 10, 884–908. [Google Scholar]
  28. Qi, H.; Cai, F.; Lei, G.; Cao, H.; Shi, F. The response of three main beach types to tropical storms in South China. Mar. Geol. 2010, 275, 244–254. [Google Scholar] [CrossRef]
  29. Poate, T.; Masselink, G.; McCall, R.; Russell, P.; Davidson, M. UK storms 2014: Gravel beach response. In The Proceedings Coastal Sediments; ASCE: San Diego, CA, USA, 2015. [Google Scholar]
  30. Lee, G.H.; Nicholls, R.J.; Birkemeier, W.A. Storm-driven variability of the beach-nearshore profile at Duck, North Carolina, USA, 1981–1991. Mar. Geol. 1988, 148, 163–177. [Google Scholar] [CrossRef]
  31. Suanez, S.; Cariolet, J.M.; Cancouët, R.; Ardhuin, F.; Delacourt, C. Dune recovery after storm erosion on a high-energy beach: Vougot Beach, Brittany (France). Geomorphology 2012, 139, 16–33. [Google Scholar] [CrossRef]
  32. Bramato, S.; Ortega-Sánchez, M.; Mans, C.; Losada, M.A. Natural recovery of a mixed sand and gravel beach after a sequence of a short duration storm and moderate sea states. J. Coast. Res. 2012, 28, 89–101. [Google Scholar] [CrossRef]
  33. Haerens, P.; Bolle, A.; Trouw, K.; Houthuys, R. Definition of storm thresholds for significant morphological change of the sandy beaches along the Belgian coastline. Geomorphology 2012, 143, 104–117. [Google Scholar] [CrossRef]
  34. Birkemeier, W.A. The Effects of the 19 December 1977 Coastal Storm on Beaches in North Carolina and New Jersey; Florida Shore and Beach Preservation Association: Tallahassee, FL, USA, 1979. [Google Scholar]
  35. Feng, X.; Mao, S.; Zhou, Y. Study on the recovery process and the main controlling factors for post-storm beach profiles of a headland bay: Taking the Narrabeen Beach in Australia as an example. Haiyang Xuebao 2023, 45, 80–91. [Google Scholar] [CrossRef]
  36. Splinter, K.D.; Strauss, D.R.; Tomlinson, R.B. Assessment of post-storm recovery of beaches using video imaging techniques: A case study at Gold Coast, Australia. IEEE Trans. Geosci. Remote Sens. 2011, 49, 4704–4716. [Google Scholar] [CrossRef]
  37. Jiang, Z.; Shi, L.; Guo, J.; Zhang, M. Storm Response and Recovery Process after Nourishment of Dongsha Beach, Zhujiajian Island, Zhejiang Province. J. Coast. Res. 2020, 95, 231–236. [Google Scholar] [CrossRef]
  38. Phillips, M.S.; Blenkinsopp, C.E.; Splinter, K.D.; Harley, M.D.; Turner, I.L. Modes of berm and beachface recovery following storm reset: Observations using a continuously scanning lidar. J. Geophys. Res. Earth Surf. 2019, 124, 720–736. [Google Scholar] [CrossRef]
  39. Zeng, C.; Zhu, S.; Li, Z.; Chen, D.; Zhang, H. High-frequency in situ measurements of beach responses to Tropical Storm Bebinca at Qing’an Bay, Guangdong Province, China. In Proceedings of the 19th Chinese Conference on Ocean (Coastal) Engineering. Ocean (Coastal) Engineering Proceedings, Chongqing, China, 11–13 October 2019; Ocean Press: Beijing, China, 2019; pp. 655–660. [Google Scholar]
  40. Yangjiang Municipal People’s Government. Yangjiang Municipal People’s Government Gazette. 2019. Available online: http://www.yangjiang.gov.cn (accessed on 20 October 2024).
  41. Hu, P.; Li, Z.; Zeng, C.; Zhu, D.; Liu, R.; Su, Q.; Tang, J.; Zhu, Y. Bed level changes in the surf zone during post-storm beach recovery. Front. Mar. Sci. 2023, 10, 1233068. [Google Scholar] [CrossRef]
  42. Liu, L.; Sun, Y.; Liu, R.; Wei, X.; Li, Z. Evaluation of the applicability of beach erosion and accretion index in Qiongzhou Strait of China. Front. Mar. Sci. 2024, 11, 1453439. [Google Scholar] [CrossRef]
  43. Kumar, V.S.; Anand, N.M.; Chandramohan, P.; Naik, G.N. Longshore sediment transport rate—Measurement and estimation, central west coast of India. Coast. Eng. 2003, 48, 95–109. [Google Scholar] [CrossRef]
  44. Li, G.; Li, Z.; Zhu, S.; Zhang, H.; Zeng, C. Comparative Study on Grain-size Parameters of Marine Sediment Derived from Graphic and Moment Methods. J. Guangdong Ocean Univ. 2020, 40, 96–101. [Google Scholar] [CrossRef]
  45. Friedman, G.M. Comparison of moment measures for sieving and thin-section data in sedimentary petrological studies. J. Sediment. Res. 1962, 32, 15–25. [Google Scholar] [CrossRef]
  46. Komar, P.D.; Gaughan, M.K. Airy wave theory and breaker height prediction. In Coastal Engineering 1972. Coastal Engineering Proceedings, Reston, VA, USA; American Society of Civil Engineers: Reston, VA, USA, 1972; pp. 405–418. [Google Scholar]
  47. Burvingt, O.; Masselink, G.; Scott, T.; Davidson, M.; Russell, P. Climate forcing of regionally-coherent extreme storm impact and recovery on embayed beaches. Mar. Geol. 2018, 401, 112–128. [Google Scholar] [CrossRef]
  48. Pearson, K. Mathematical contributions to the theory of evolution. III. Regression, heredity, and panmixia. Philos. Trans. R. Soc. A 1896, 187, 253–318. [Google Scholar] [CrossRef]
  49. Zeng, C.; Hu, T.; Zhang, H.; Li, Z.; Li, G.; Tian, Y. Wave Motion Response Characteristics of Swash Zone to Typhoon Wipha at Qing’an Bay in Xuwen, Guangdong Province, China. J. Guangdong Ocean Univ. 2021, 41, 74–83. [Google Scholar] [CrossRef]
  50. Li, Z.; Cai, F.; Lei, G.; Qi, H.; Liu, J. Morphodynamic Analysis of Coastal Evolution Differences on the Sandy Coast of Pinghai, Putian, Fujian. In China Ocean (Coastal) Engineering, Proceedings of the 15th Academic Symposium on China Ocean (Coastal) Engineering, Taiyuan, China, 3–6 August 2011; Part II; Chinese Society of Ocean Engineering: Beijing, China, 2011; pp. 338–343. [Google Scholar]
  51. Li, Z.; Chen, Z. Progress in the Studies on Beach Profile Shapes. Mar. Sci. Bull. 2002, 5, 82–89. [Google Scholar]
  52. Cao, C.; Mao, Z.; Cai, F.; Qi, H.; Liu, J.; Lei, G.; Zhao, S.; Liu, G. Dynamic geomorphology and storm response characteristics of the promontory-straight beach—A case of Gulei Beach, Fujian. Acta Oceanol. Sin. 2023, 42, 64–78. [Google Scholar] [CrossRef]
  53. Short, A.D. Handbook of Beach and Shoreface Morphodynamics [M]; Wiley: Chichester, UK, 1999. [Google Scholar]
  54. Castelle, B.; Coco, G. The morphodynamics of rip channels on embayed beaches. Cont. Shelf Res. 2012, 43, 10–23. [Google Scholar] [CrossRef]
  55. Daly, C.J.; Bryan, K.R.; Winter, C. Wave energy distribution and morphological development in and around the shadow zone of an embayed beach. Coast. Eng. 2014, 93, 40–54. [Google Scholar] [CrossRef]
  56. Ge, Z.; Dai, Z.; Pang, W.; Li, S.; Wei, W.; Mei, X.; Huang, H.; Gu, J. LIDAR-based detection of the post-typhoon recovery of a meso-macro-tidal beach in the Beibu Gulf, China. Mar. Geol. 2017, 391, 127–143. [Google Scholar] [CrossRef]
  57. Egense, A.K. Southern California beach changes in response to extraordinary storm. Shore Beach 1989, 57, 14–17. [Google Scholar]
  58. Ge, Z. Meso-Macro-Tidal Beach Morphodynamics of Beibu Gulf-a Case Study of Yintan Beach in Beihai City; East China Normal University: Shanghai, China, 2019. [Google Scholar]
  59. Dubois, R.N. Seasonal changes in beach topography and beach volume in Delaware. Mar. Geol. 1988, 81, 79–96. [Google Scholar] [CrossRef]
  60. Aagaard, T.; Hughes, M.; Baldock, T.; Greenwood, B.; Kroon, A.; Power, H. Sediment transport processes and morphodynamics on a reflective beach under storm and non-storm conditions. Mar. Geol. 2012, 326, 154–165. [Google Scholar] [CrossRef]
  61. Zhang, D.; Guo, J.; Shi, L.; Chen, W.; Kuang, C.; Xia, X. Non-uniform cumulative responses of beach sedimentary geomorphology to consecutive storms around a meso-macro tidal island. Front. Mar. Sci. 2024, 11. [Google Scholar] [CrossRef]
Figure 1. Study area: (a) location of Hailing Island; (b) satellite image of Dongdao Beach, Hailing Island. The blue solid line indicates the profile location, and the red dots represent the wave measurement locations. (c) Satellite image of Hailing Island. The blue solid line indicates the path of Typhoon Cempaka in July 2021, with colored dots along the path representing the storm centers at different times. (d) Instrument deployment setup. (e) RTK measurement in progress.
Jmse 13 01117 g001
Figure 2. Time series of (a) significant wave height (Hs) in the surf zone; (b) significant wave period (Ts) in the surf zone; and (c) tidal conditions during the observation period.
Jmse 13 01117 g002
Figure 3. Schematic diagram of the berm and intertidal zone slope in the study area. The blue dashed lines represent MHWL, MLWL, and mean sea level (MSL); intertidal zone slope = y/x.
Jmse 13 01117 g003
Figure 4. Changes in the P1 beach profile in the study area during the post-storm recovery period. The numbers “8.6”, “8.7”, ..., “8.30” represent observation dates from August 6 to 30 August 2021 (formatted as month.day). Each color line corresponds to a beach profile measured on a specific day. Subfigures (ai) show the beach profile changes at 2–3 day intervals: (a) Aug 6–8; (b) Aug 9–11; (c) Aug 12–14; (d) Aug 15–17; (e) Aug 18–20; (f) Aug 21–23; (g) Aug 24–26; (h) Aug 27–28; (i) Aug 29–30.
Jmse 13 01117 g004
Figure 5. Changes in the P2 beach profile. Observation dates and color coding are consistent with Figure 4. Subfigures (ai) show the beach profile changes at 2–3 day intervals: (a) Aug 6–8; (b) Aug 9–11; (c) Aug 12–14; (d) Aug 15–17; (e) Aug 18–20; (f) Aug 21–23; (g) Aug 24–26; (h) Aug 27–28; (i) Aug 29–30.
Jmse 13 01117 g005
Figure 6. Changes in the P3 beach profile. Observation dates and color coding are consistent with Figure 4. Subfigures (ai) show the beach profile changes at 2–3 day intervals: (a) Aug 6–8; (b) Aug 9–11; (c) Aug 12–14; (d) Aug 15–17; (e) Aug 18–20; (f) Aug 21–23; (g) Aug 24–26; (h) Aug 27–28; (i) Aug 29–30.
Jmse 13 01117 g006
Figure 7. Temporal variations in berm height, beach width, and intertidal slope during the post-storm short-term recovery period. Daily variations in berm height (a), beach width (b), and intertidal slope (c) for profiles P1, P2, and P3 from August 6 to August 30, 2021. P1, P2, and P3 represent different beach profiles along Dongdao Beach.
Jmse 13 01117 g007
Figure 8. Temporal variation in unit-width volume.
Jmse 13 01117 g008
Figure 9. Spatial variation in beach erosion and accretion. The upper dashed line represents the boundary between the supratidal and intertidal zones; the lower dashed line represents the boundary between the intertidal and subtidal zones.
Jmse 13 01117 g009
Figure 10. Beach recovery intensity. Different background colors represent different recovery rates.
Jmse 13 01117 g010
Figure 11. (a) Correlations between environmental factors and unit-width volume change: Hs, Ts, and Hs/Ls represent wave conditions in the surf zone; TRmax is the difference between the daily highest and lowest tidal levels. (b) Response relationship between beach slope and unit-width volume; the contour plot shows the variation in unit-width volume under different daily rates of slope change. The area above the gray solid line represents increasing slope, and the area below indicates decreasing slope. The region between the two black dashed lines represents intermediate slope conditions. Values to the right of the dashed line at 0.15 indicate steeper beaches, while values to the left of the dashed line at 0.12 indicate flatter beaches.
Jmse 13 01117 g011
Figure 12. Beach recovery modes. The central diagram illustrates the distribution of different recovery modes during the observation period. Panels (ad) show schematic representations of profile morphology for Modes I, II, III, and IV, respectively. The black dashed line represents the initial profile morphology, while the colored solid lines indicate the profile morphologies under different recovery modes.
Jmse 13 01117 g012
Disclaimer/Publisher’s Note: The statements, opinions and data contained in all publications are solely those of the individual author(s) and contributor(s) and not of MDPI and/or the editor(s). MDPI and/or the editor(s) disclaim responsibility for any injury to people or property resulting from any ideas, methods, instructions or products referred to in the content.

