


Influence of Surging and Pitching Behaviors on the Power Output and Wake Characteristics of a 15 MW Floating Wind Turbine

Abstract
1. Introduction
2. Numerical Methods
2.1. Governing Equations
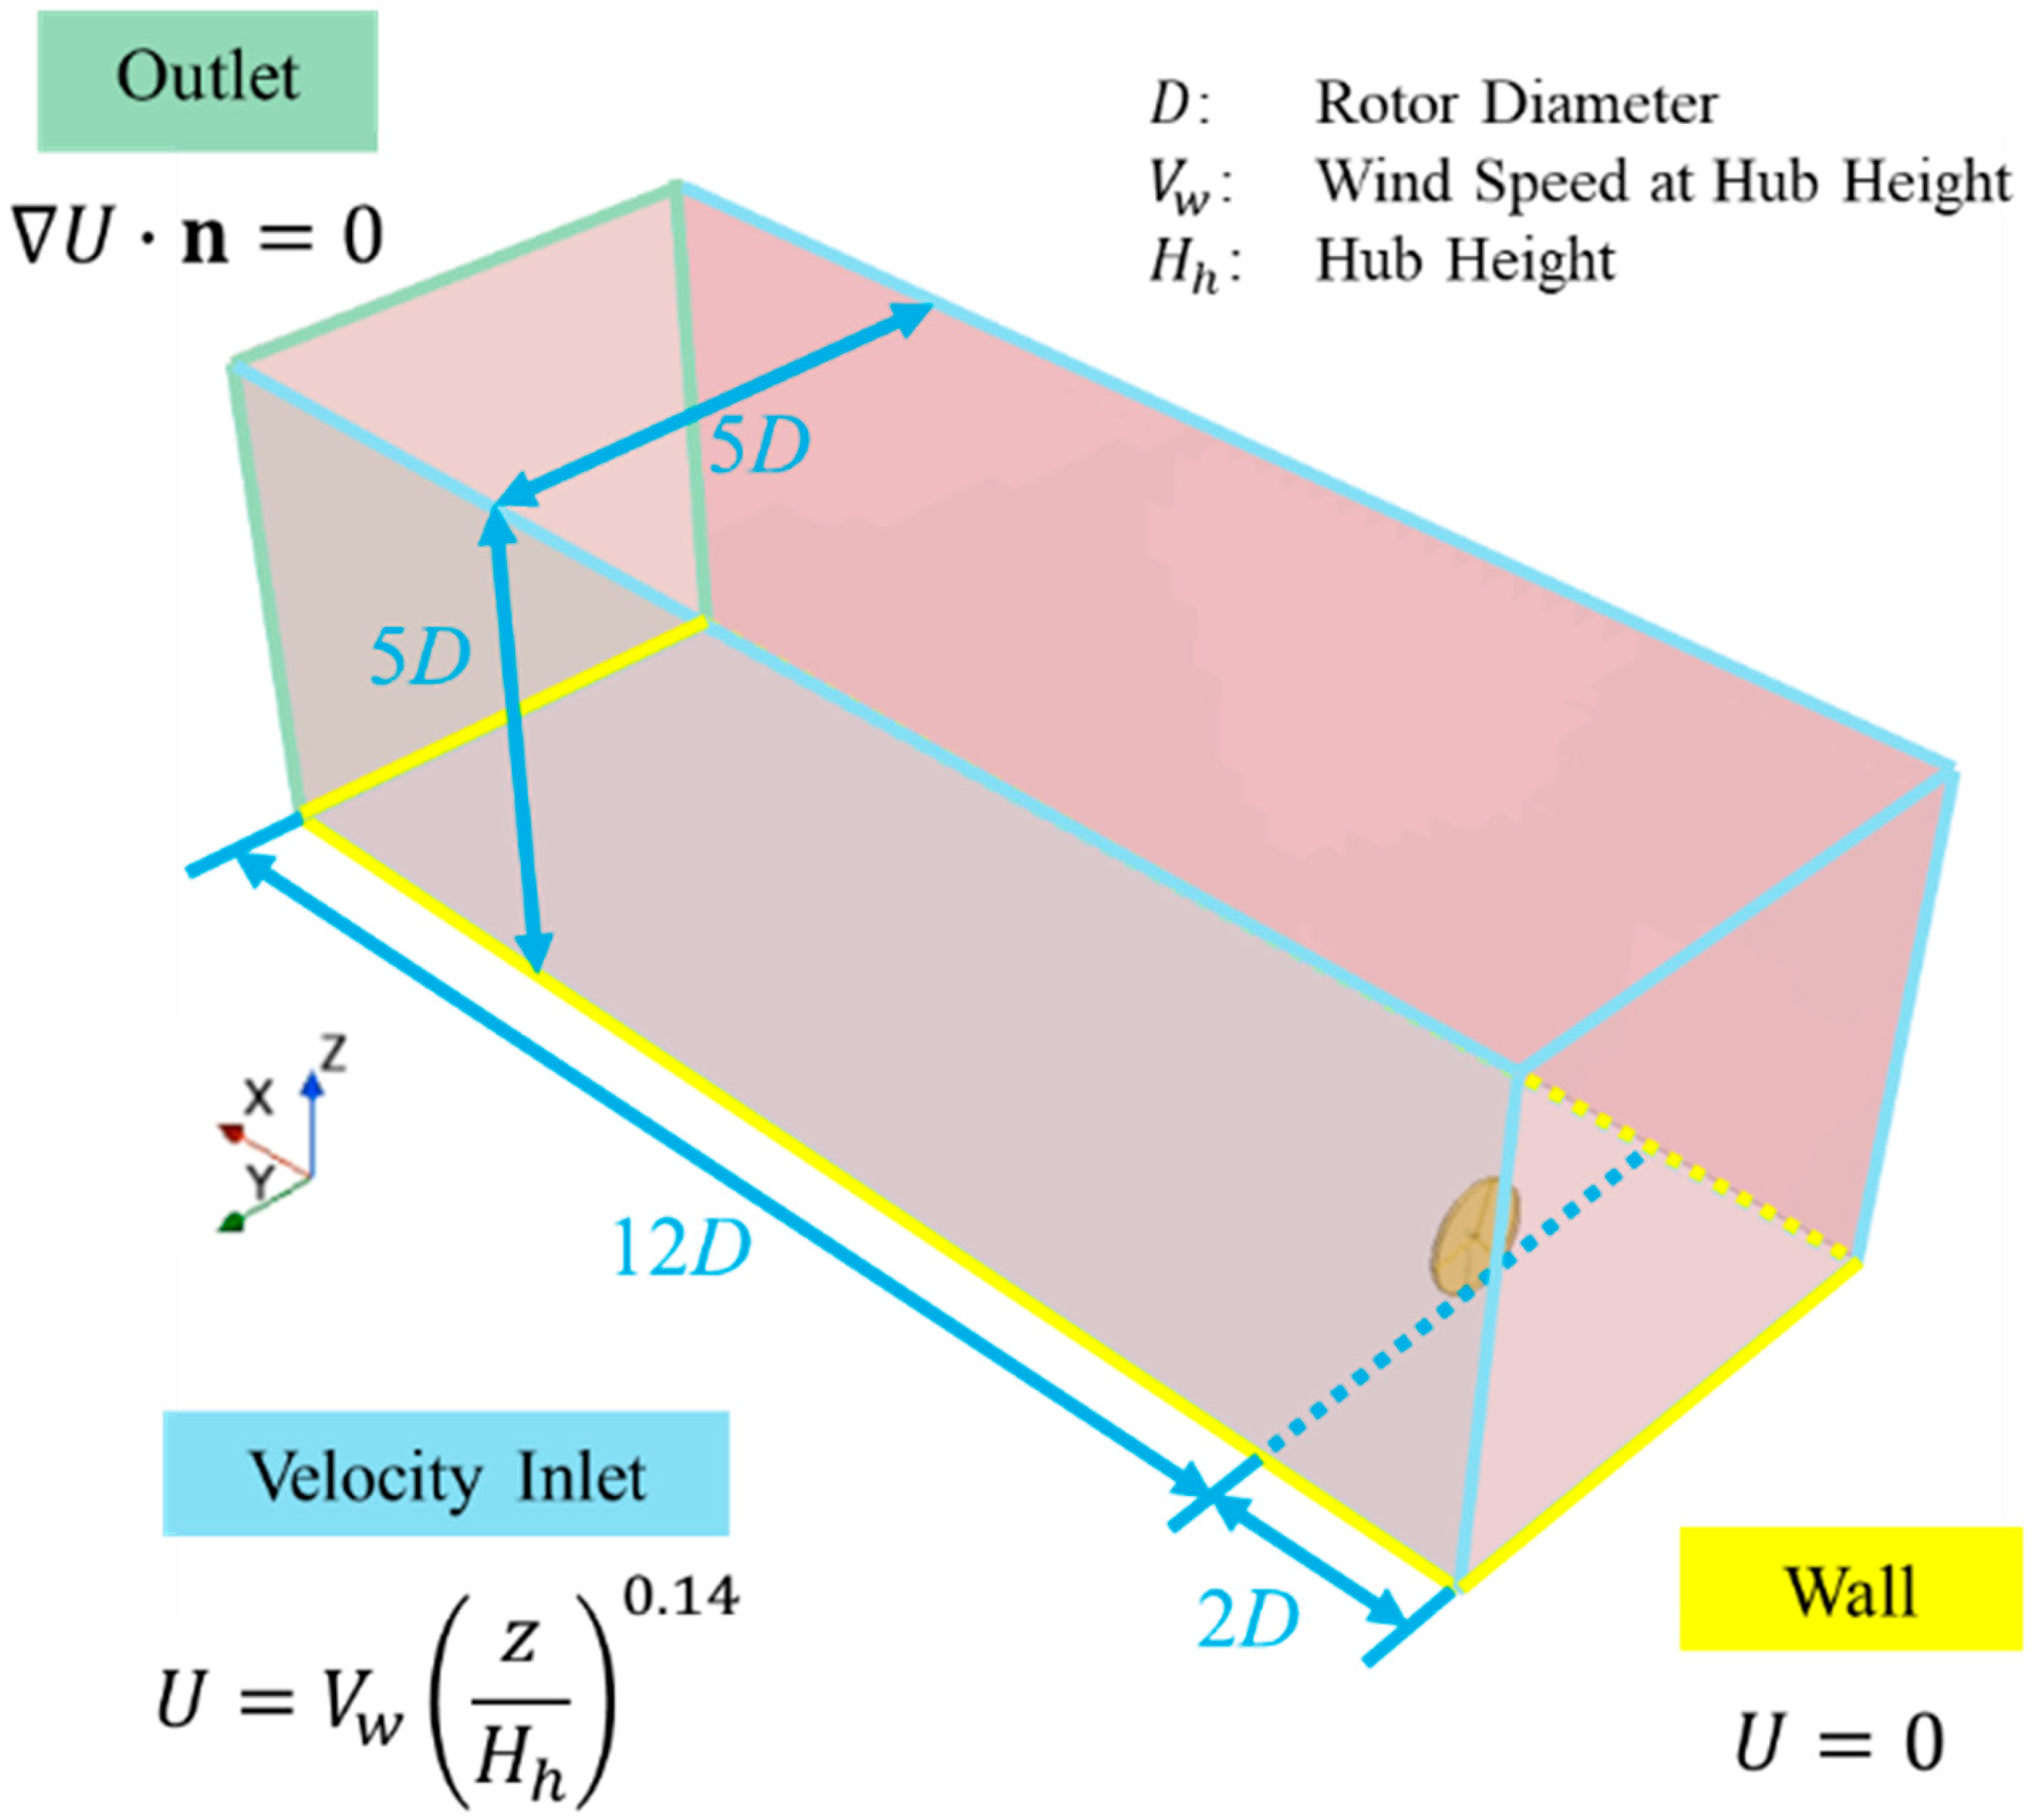
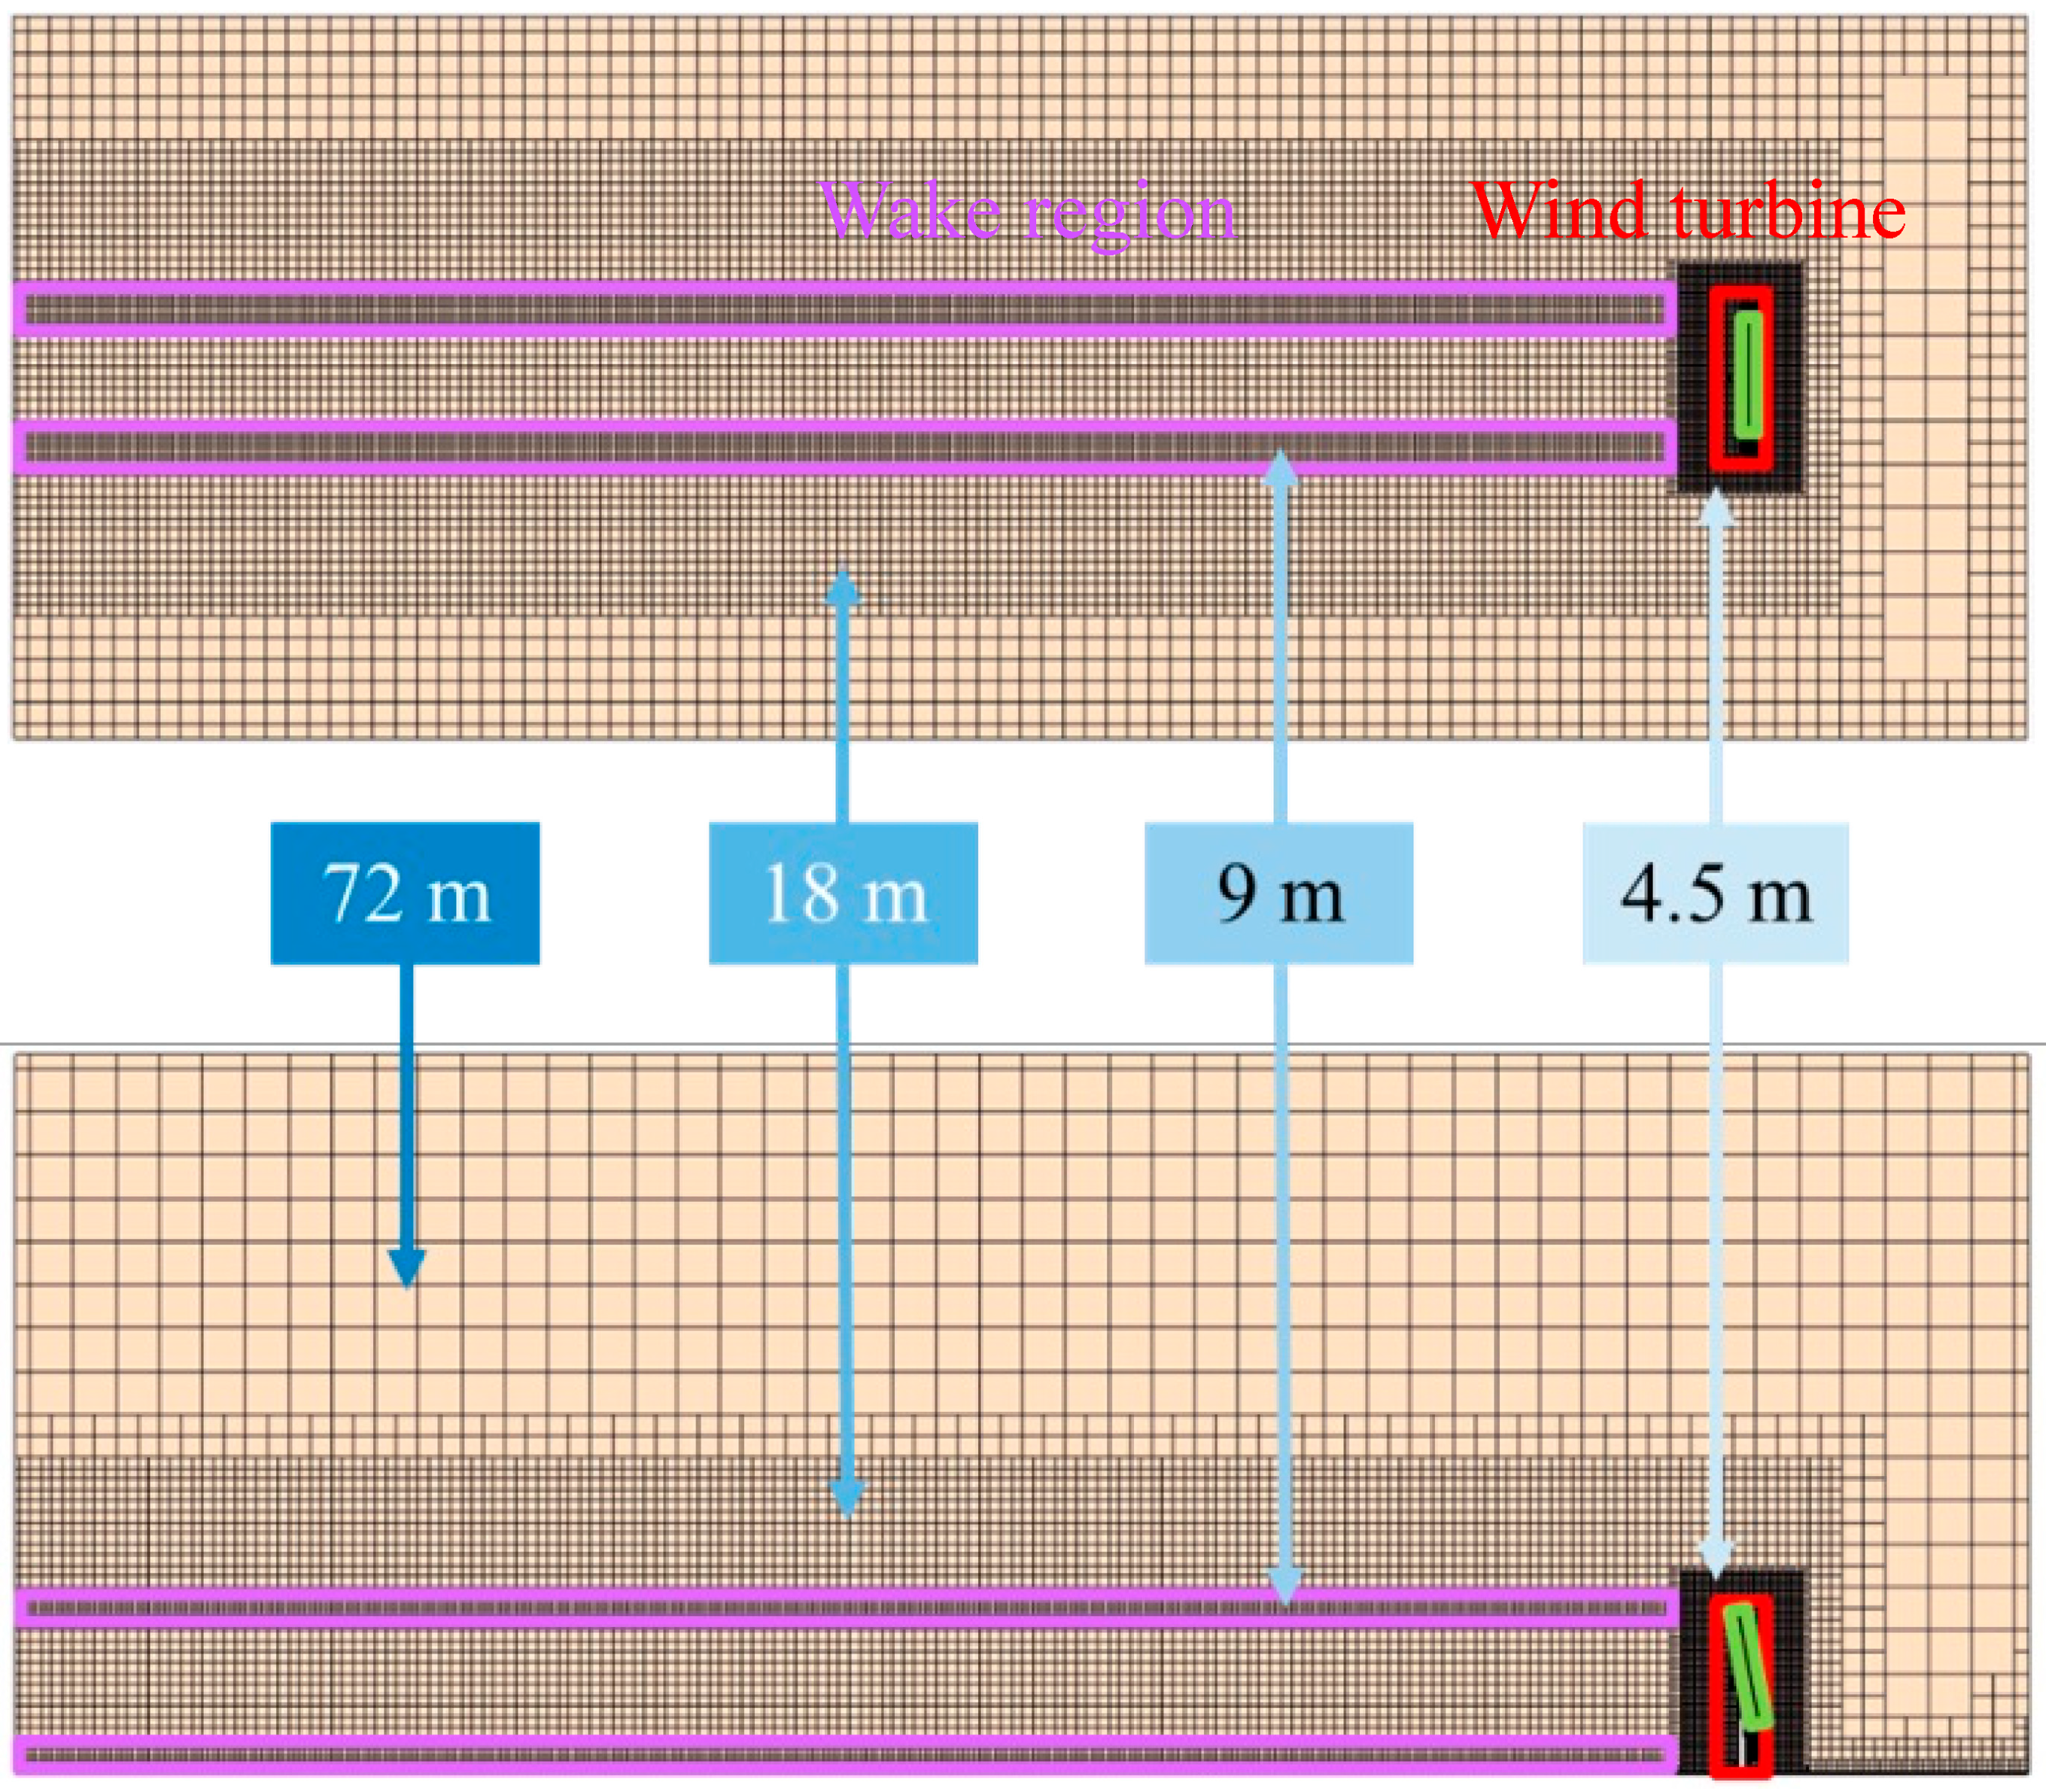
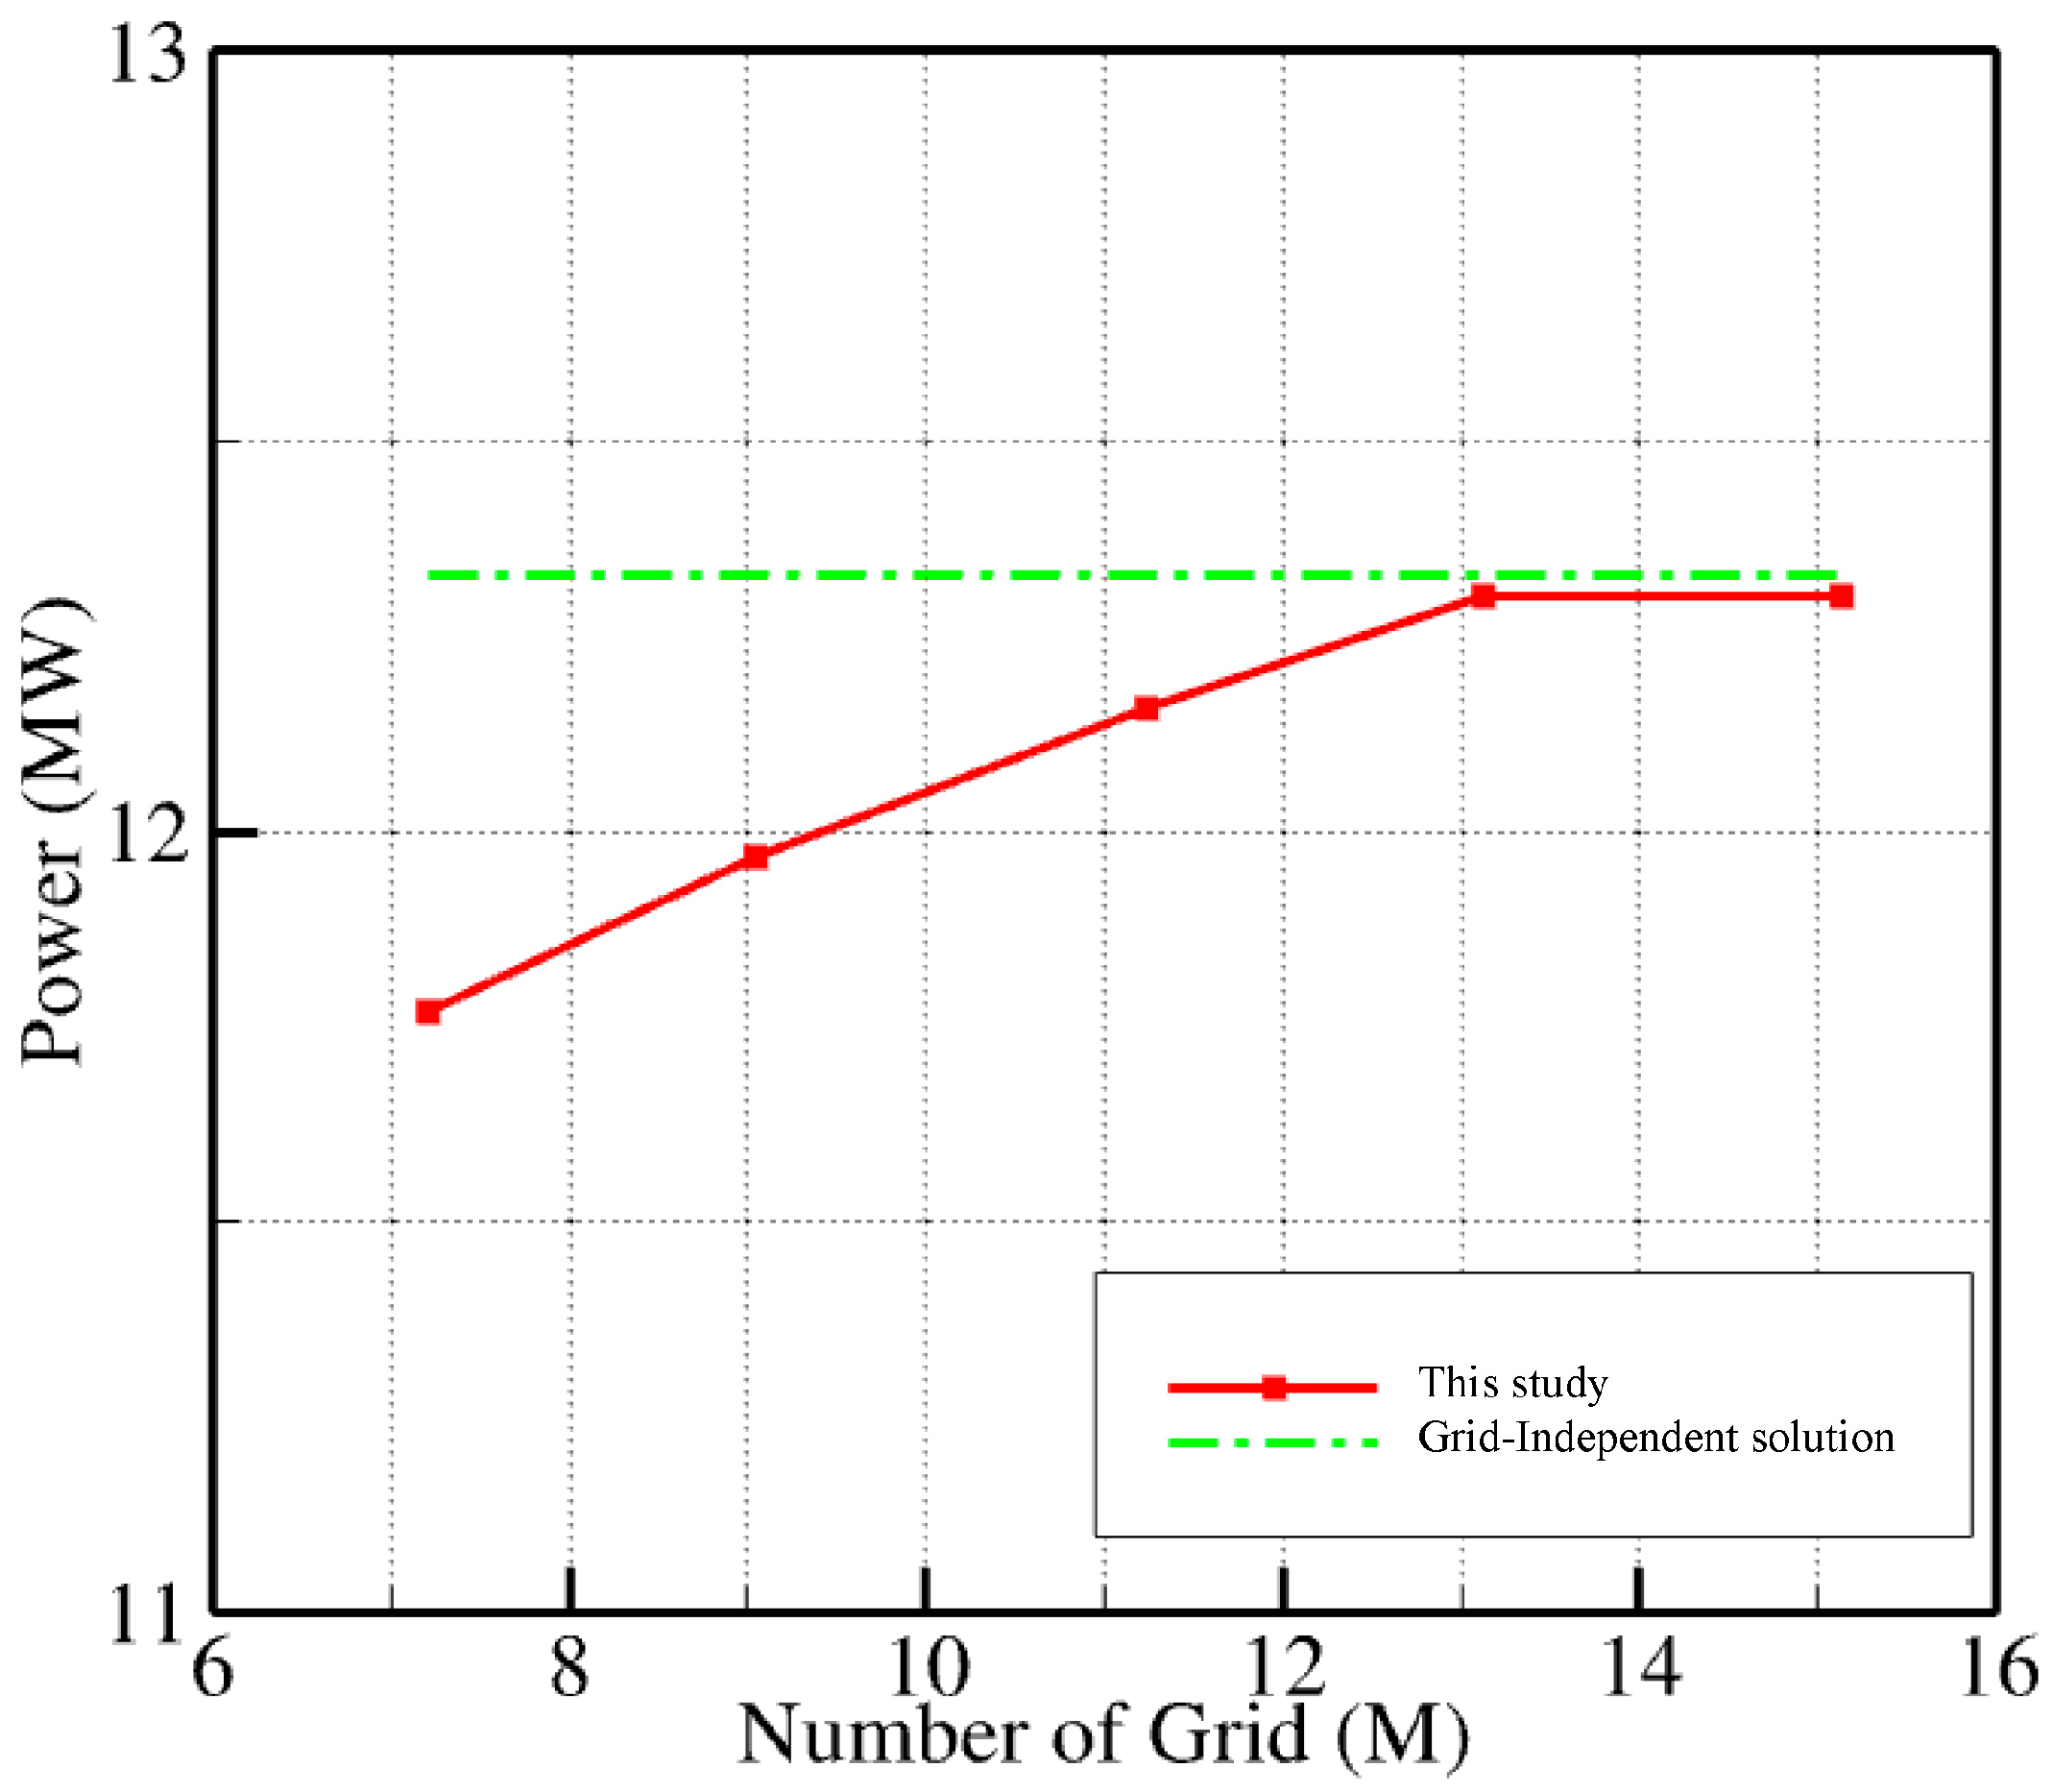
2.2. Model Setup
3. Simulating Conditions
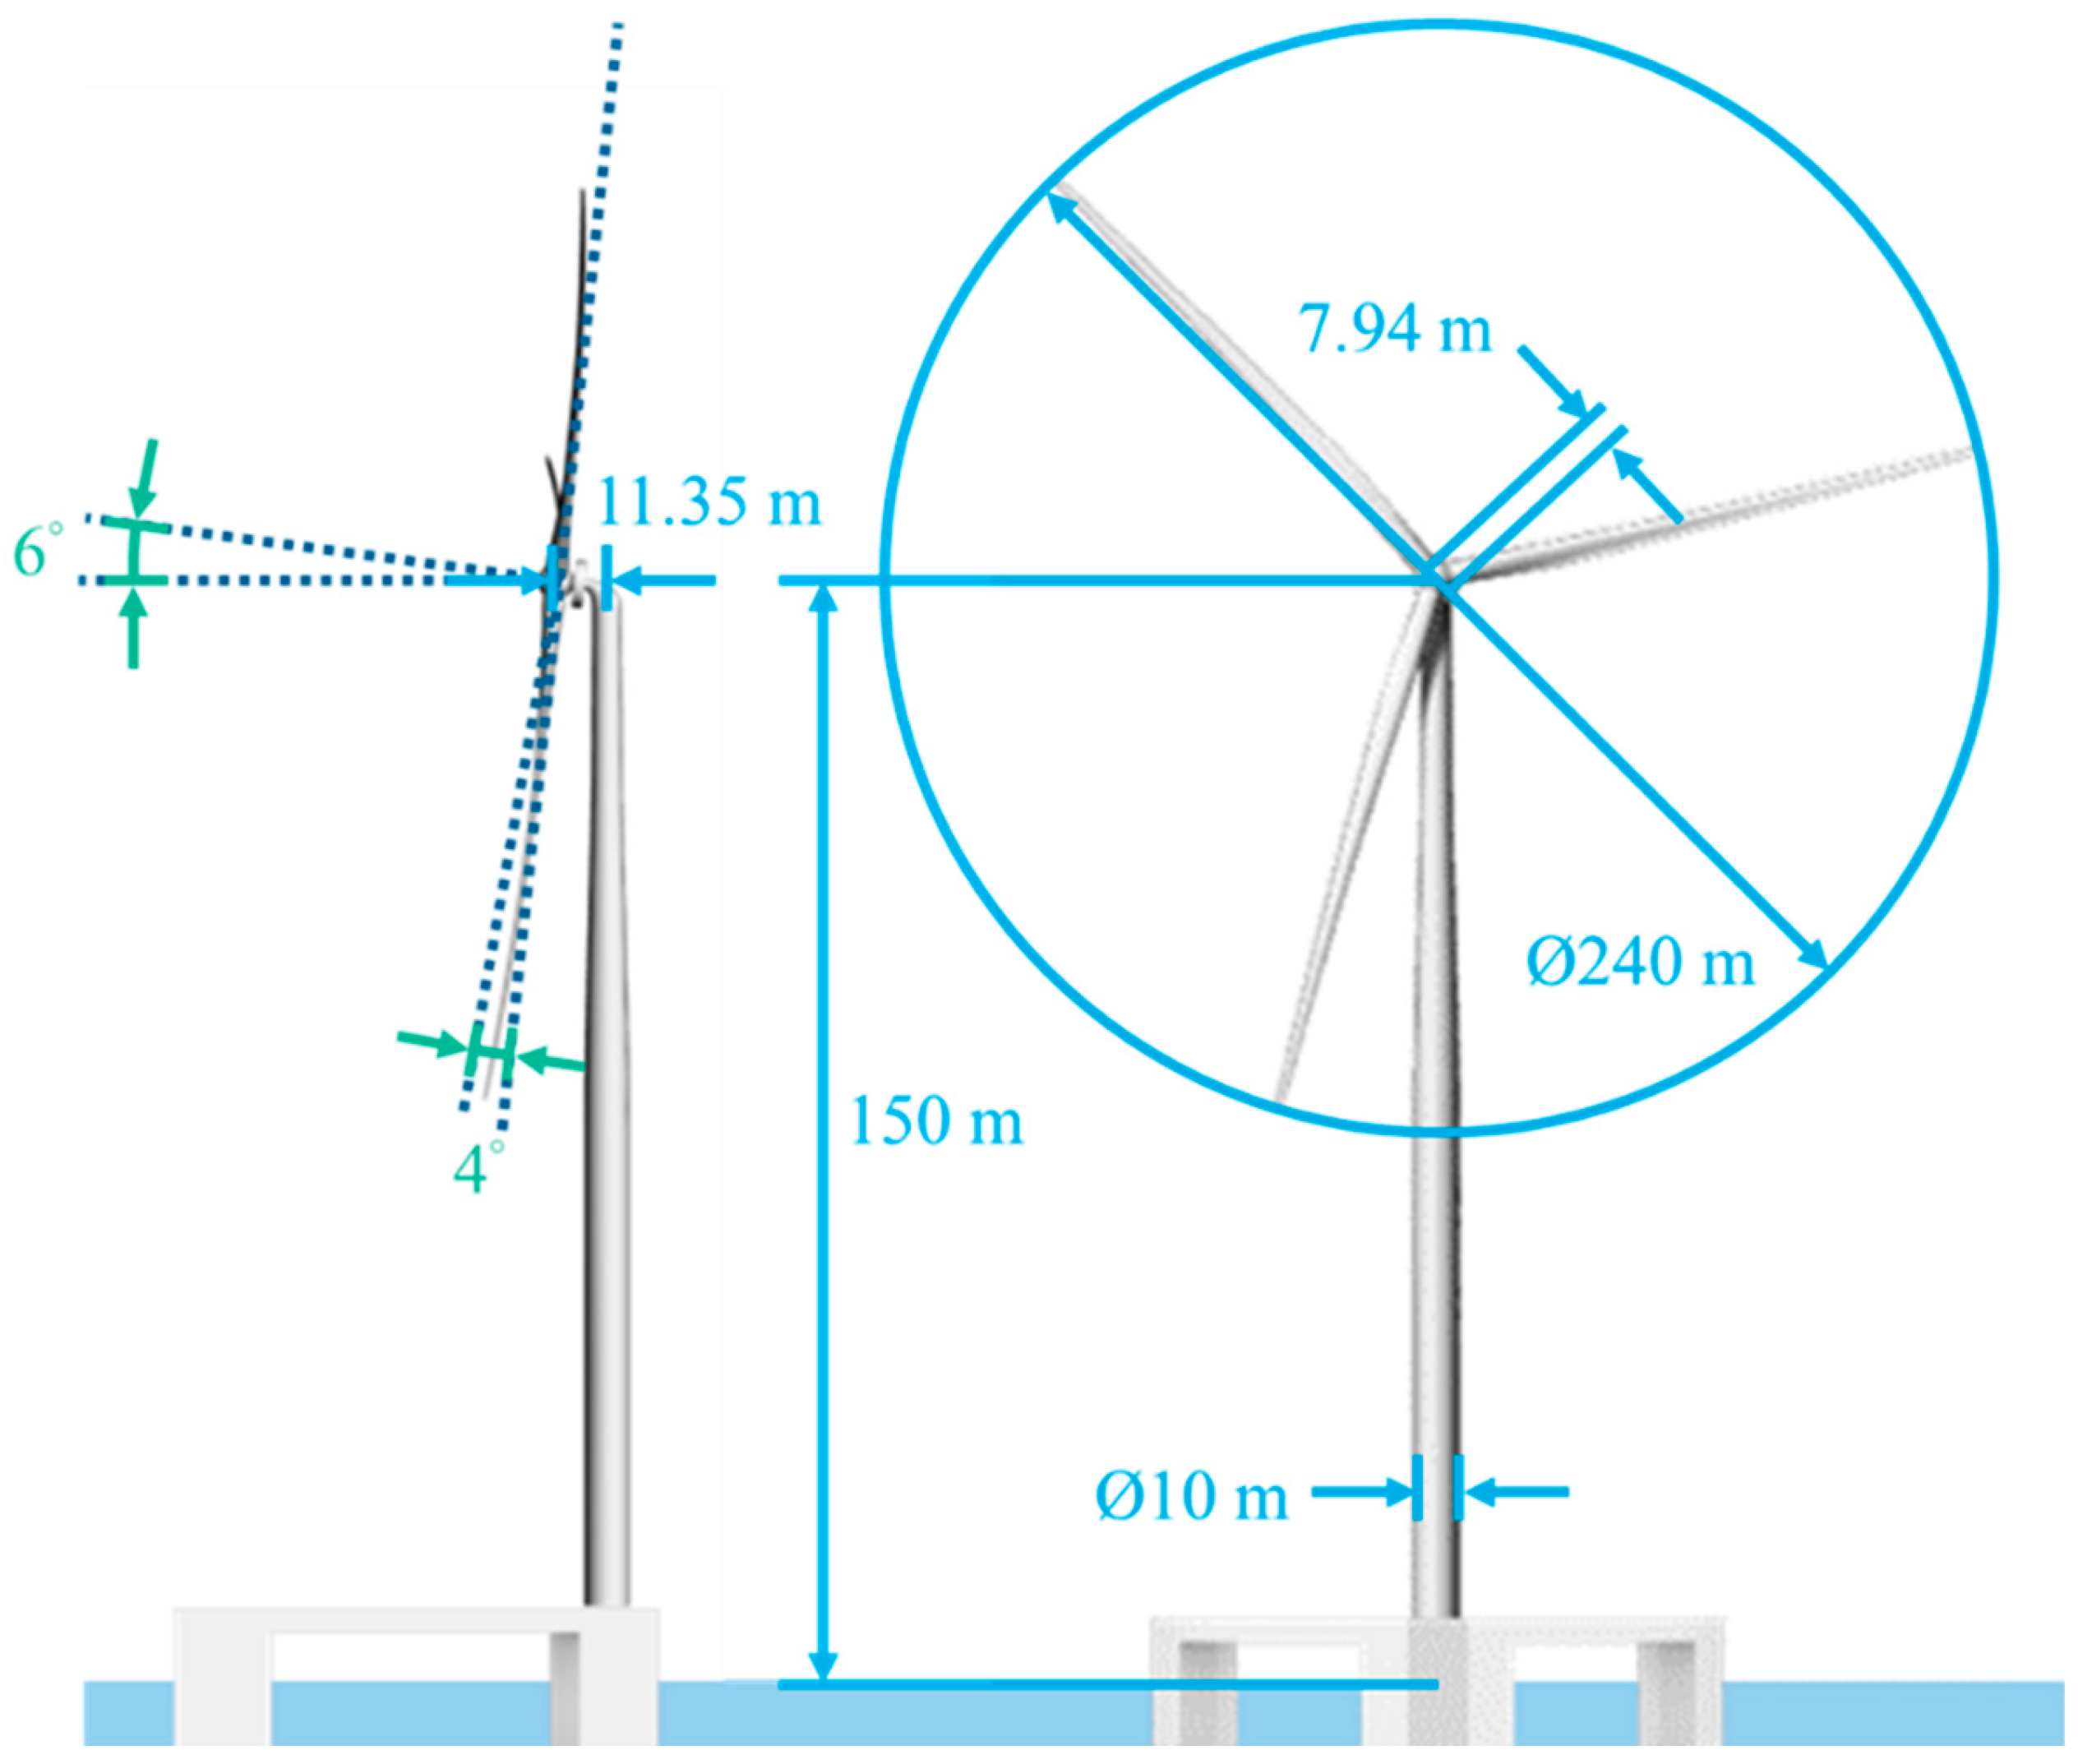
3.1. Wind Turbine
3.2. Case Description
4. Result and Discussion
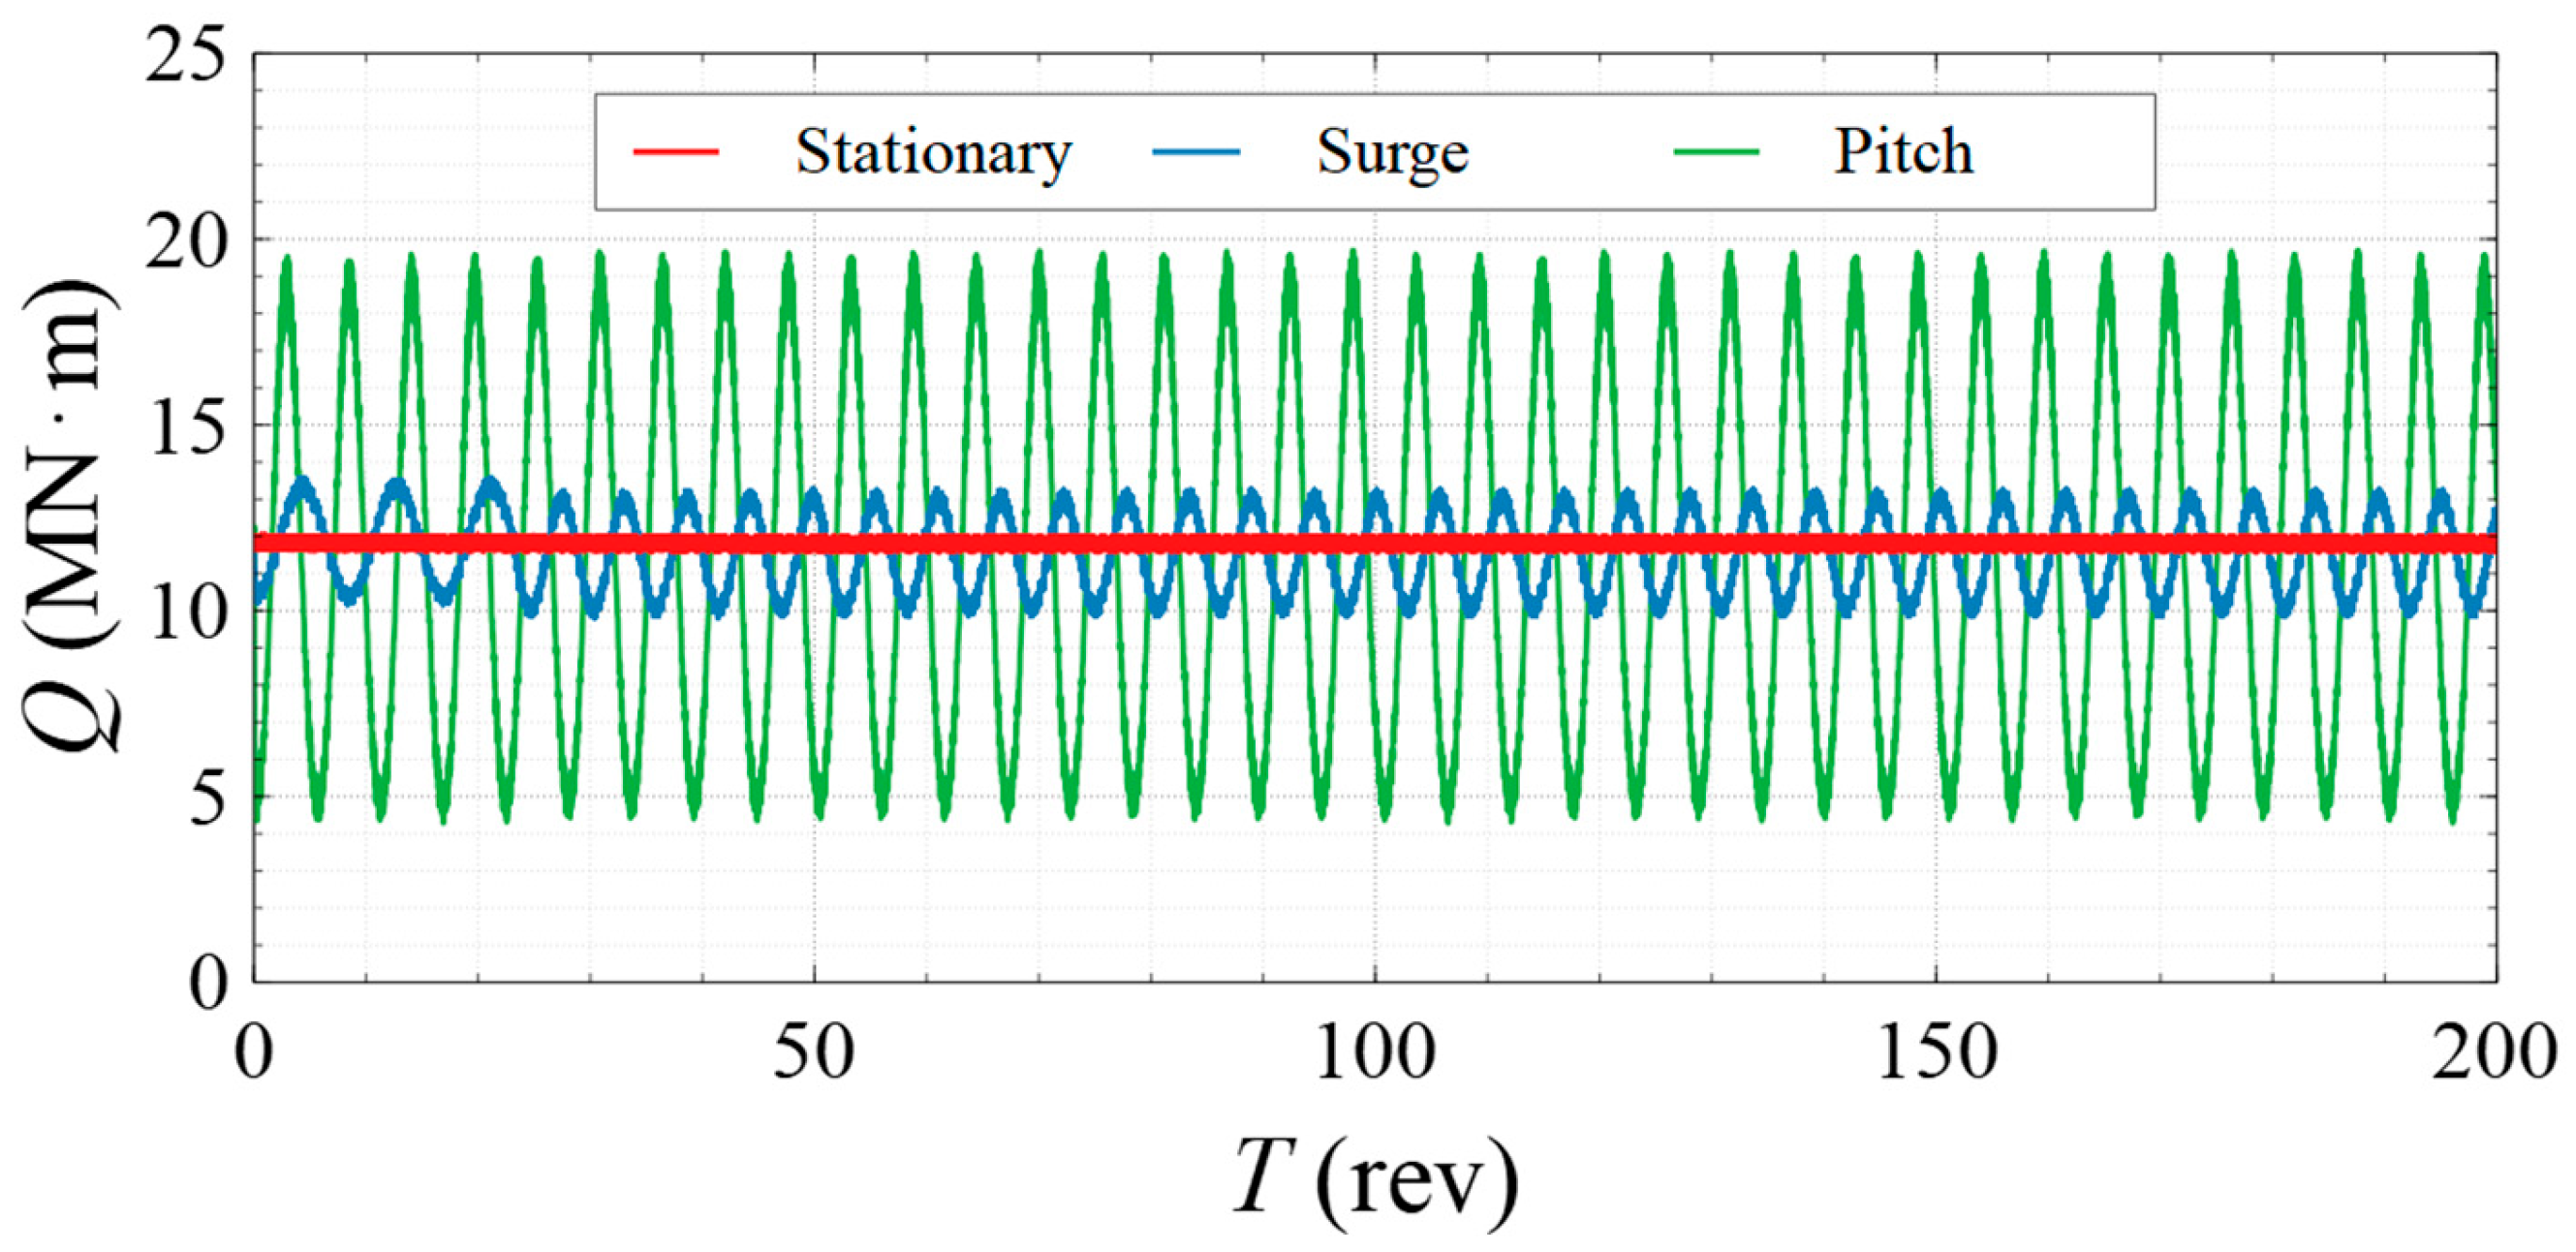
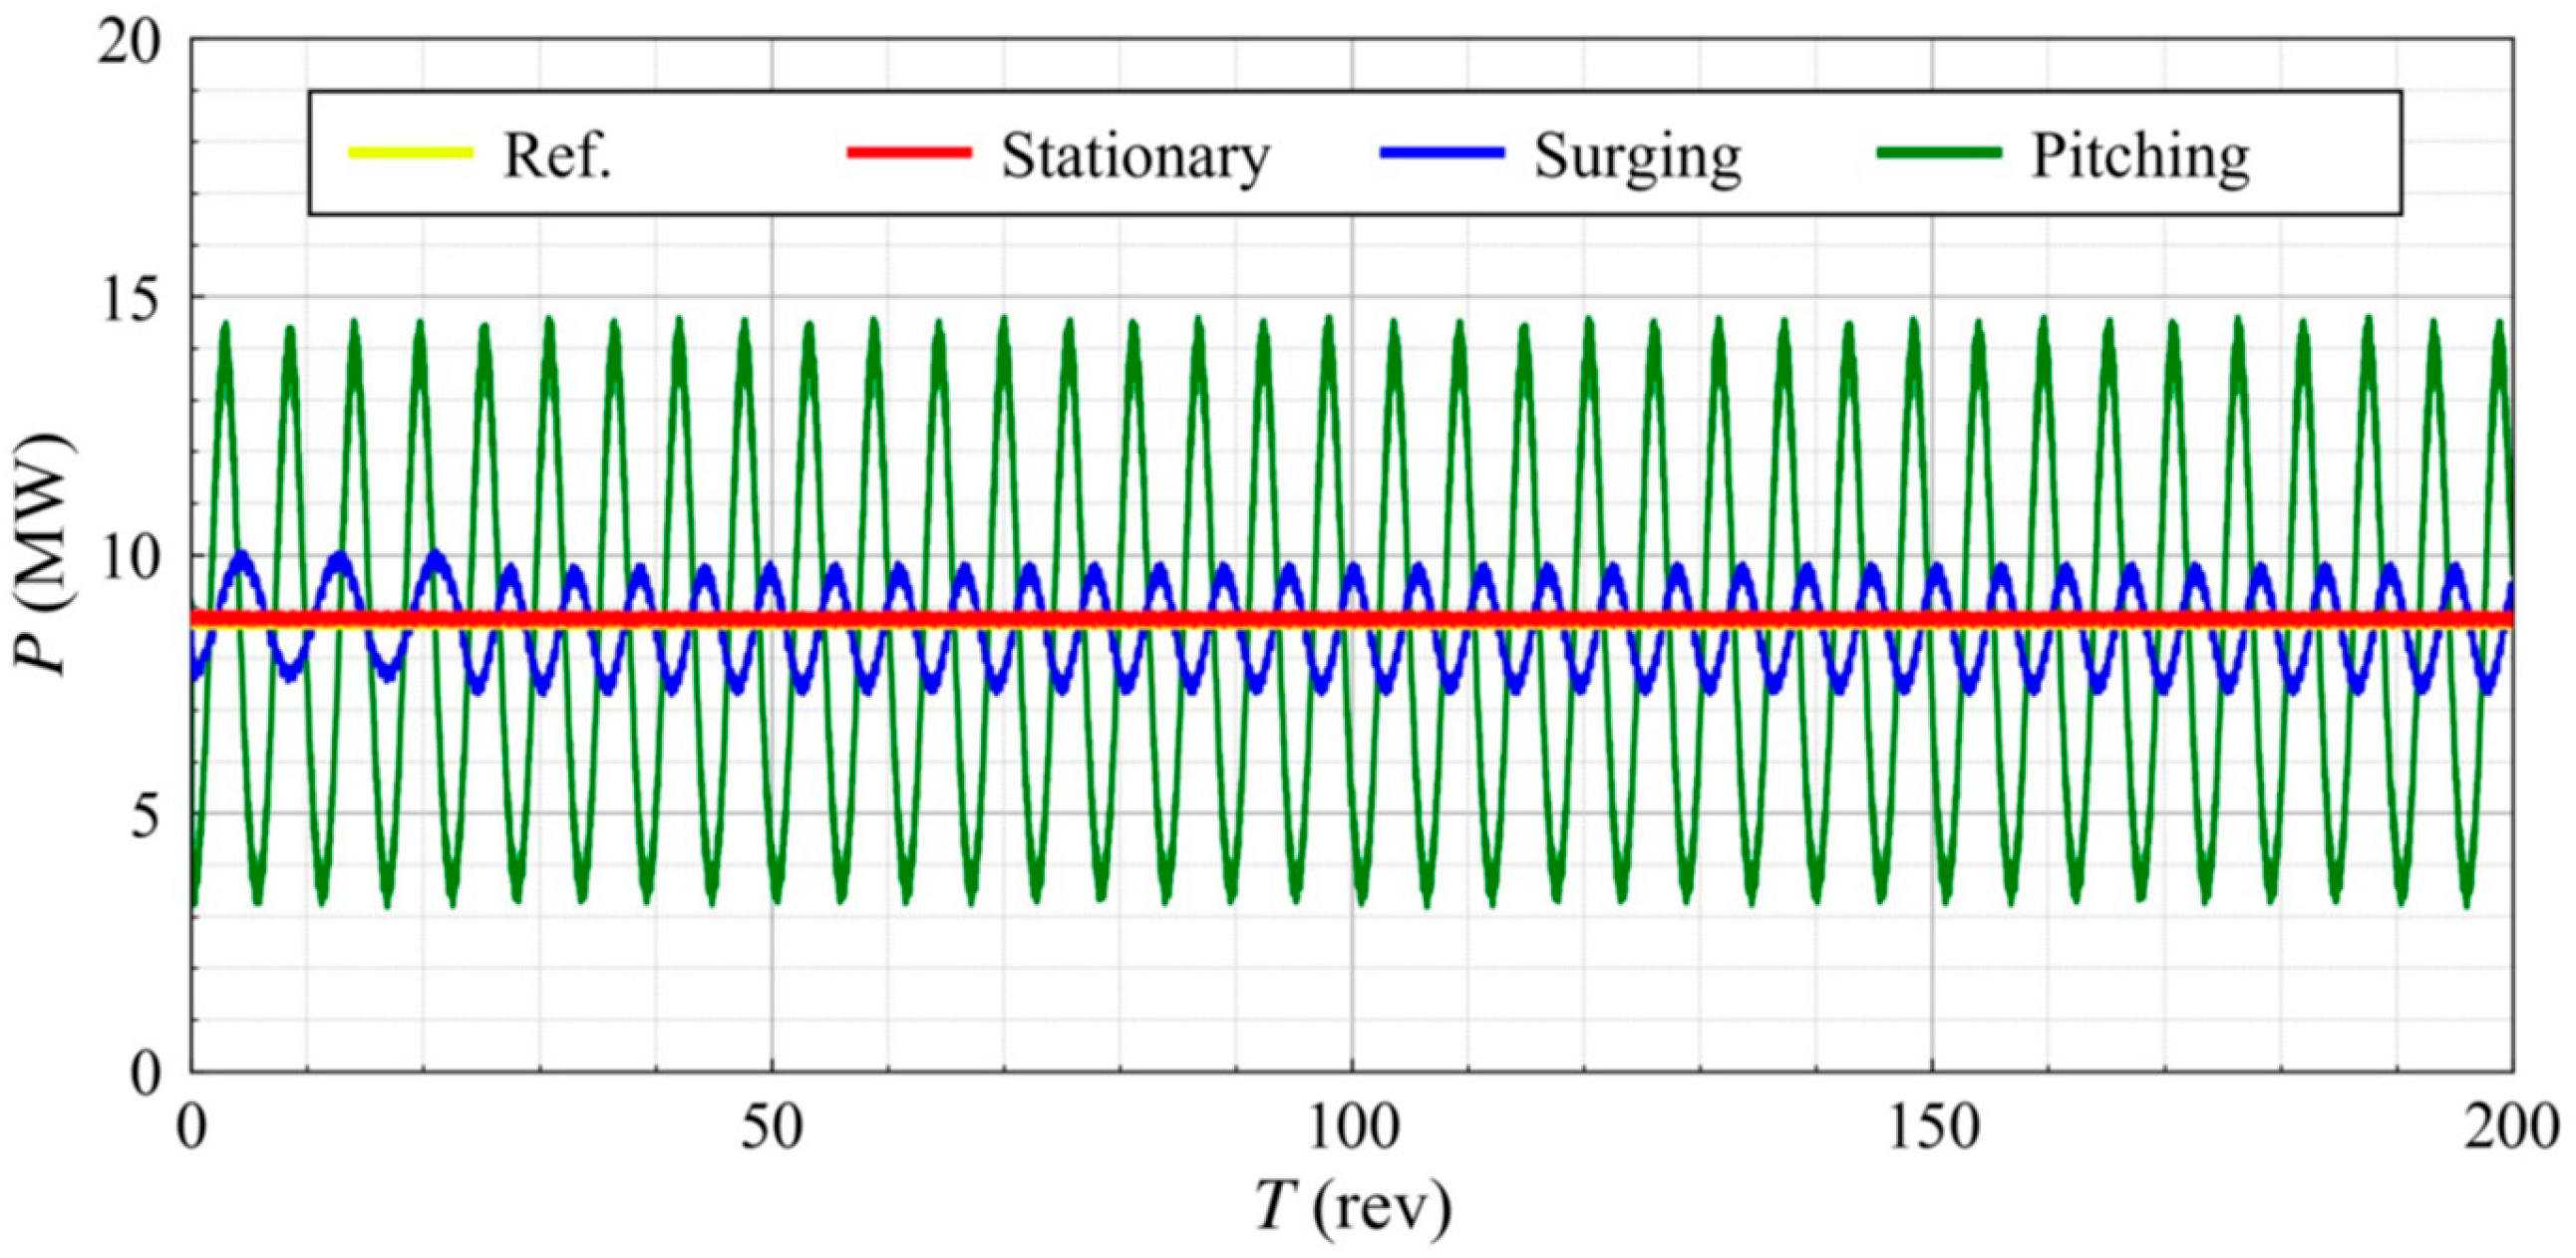
4.1. Power Output
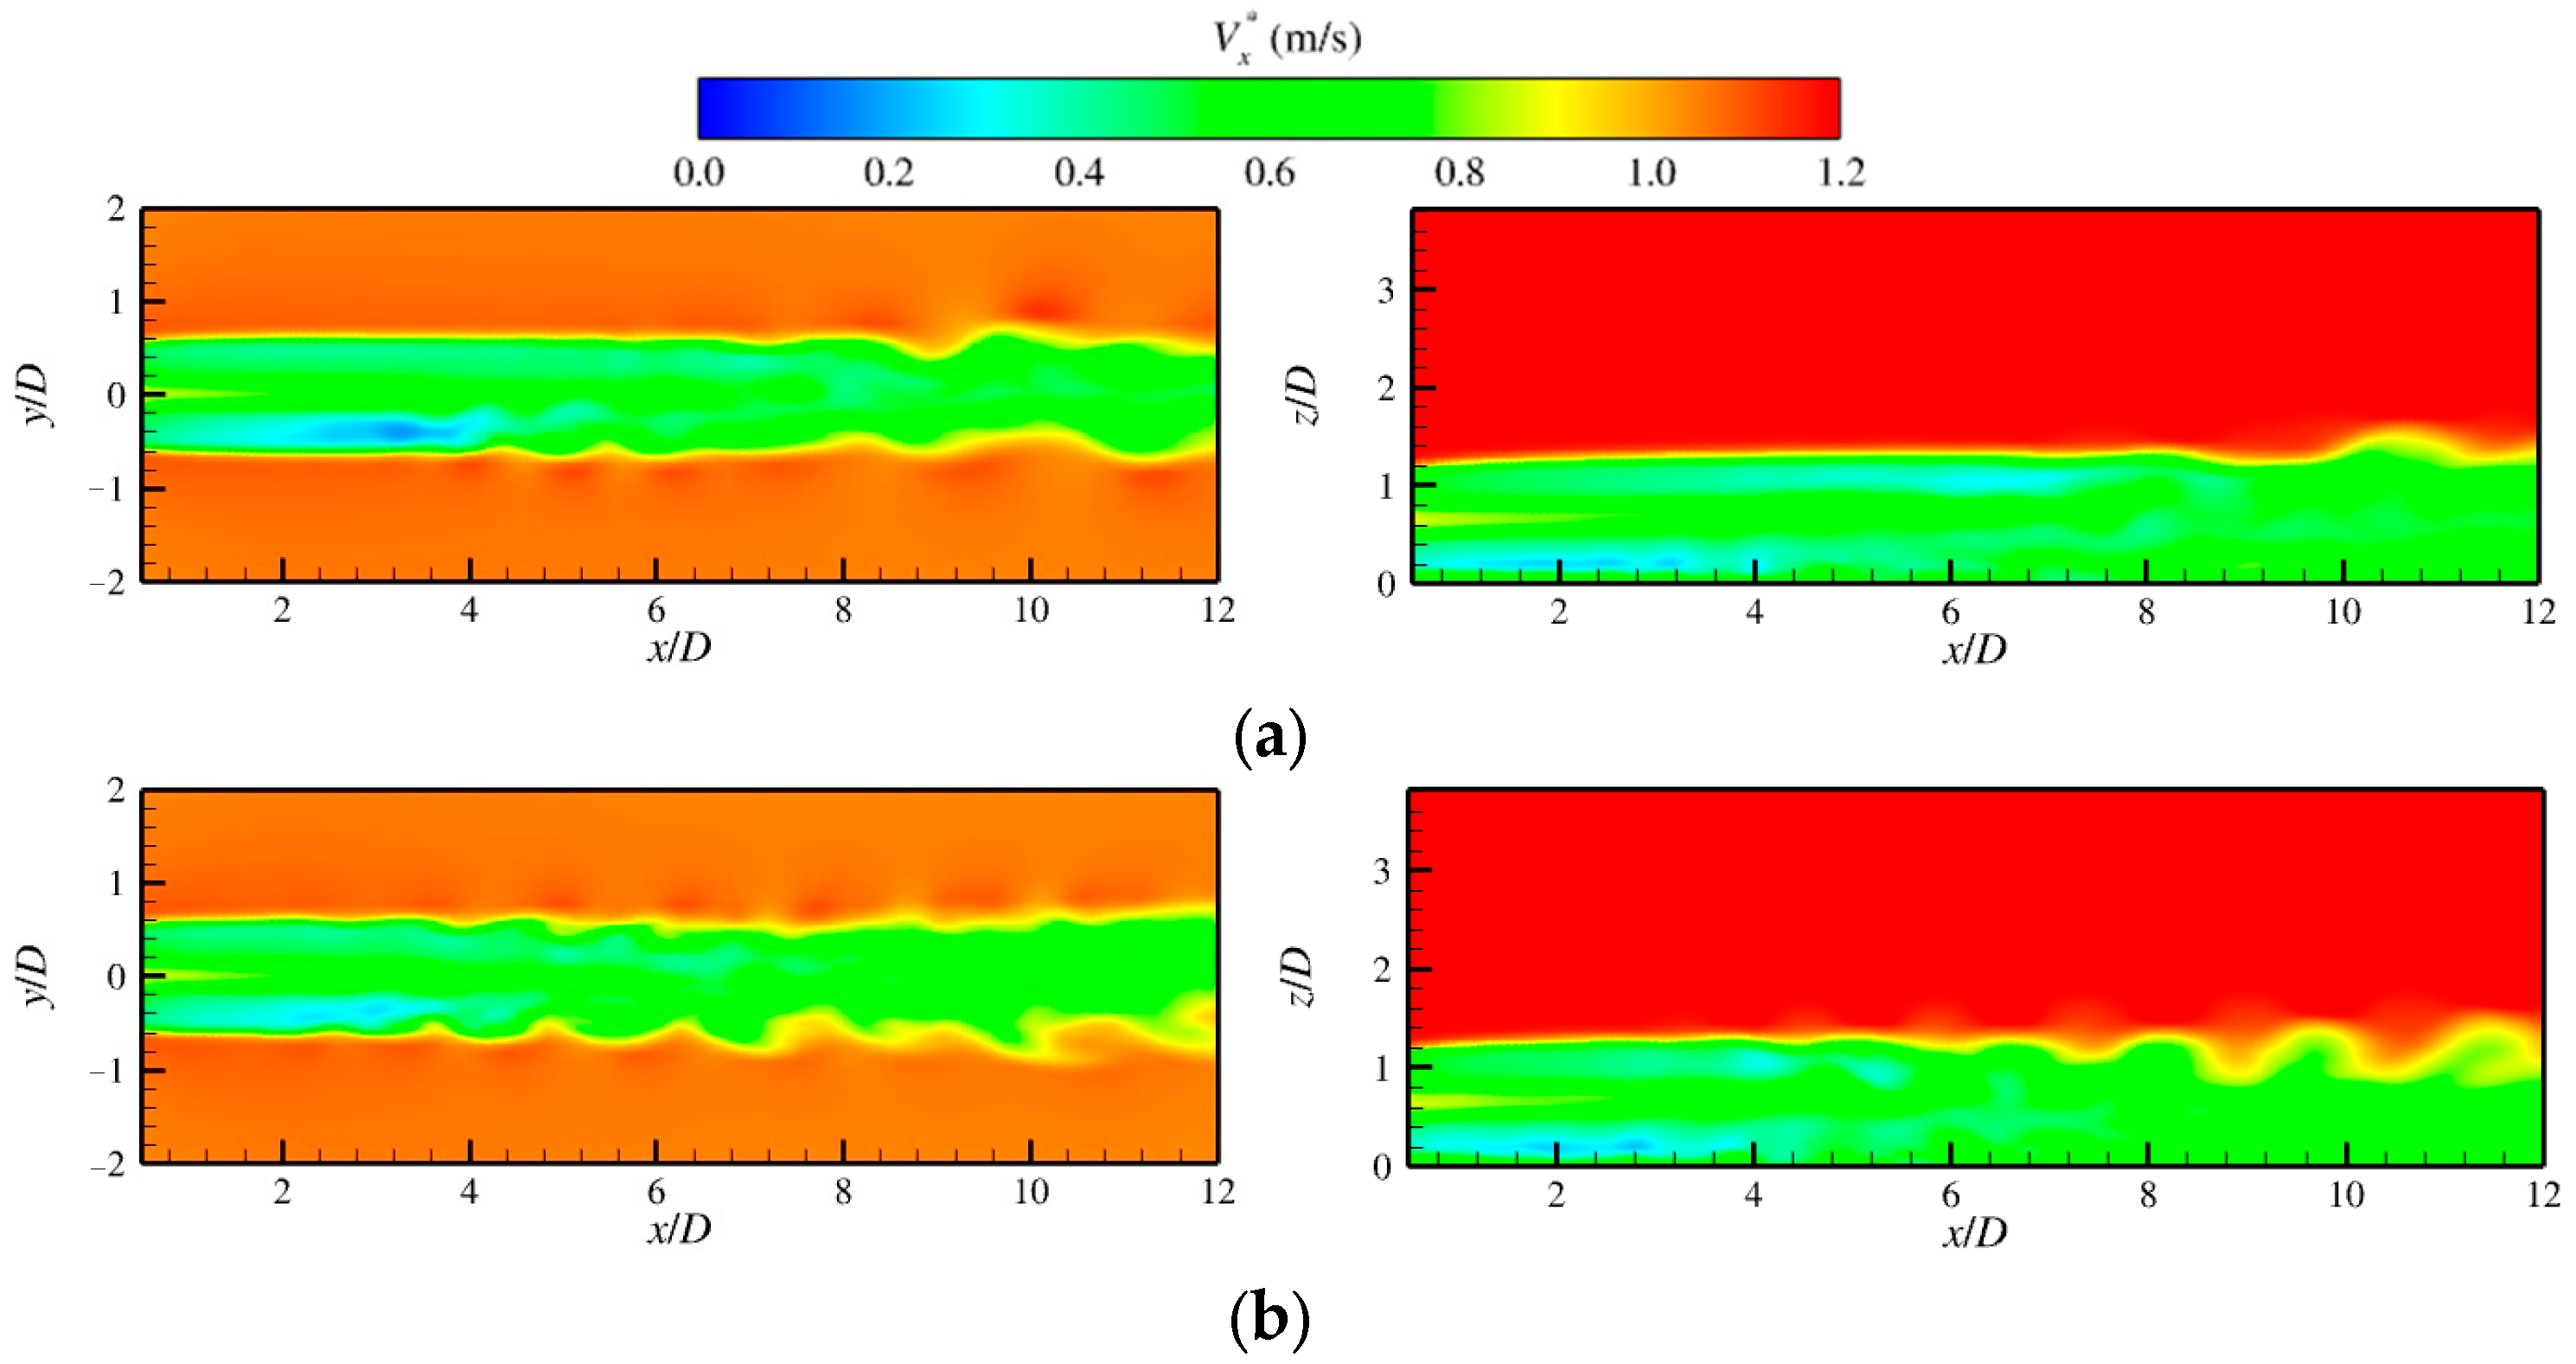
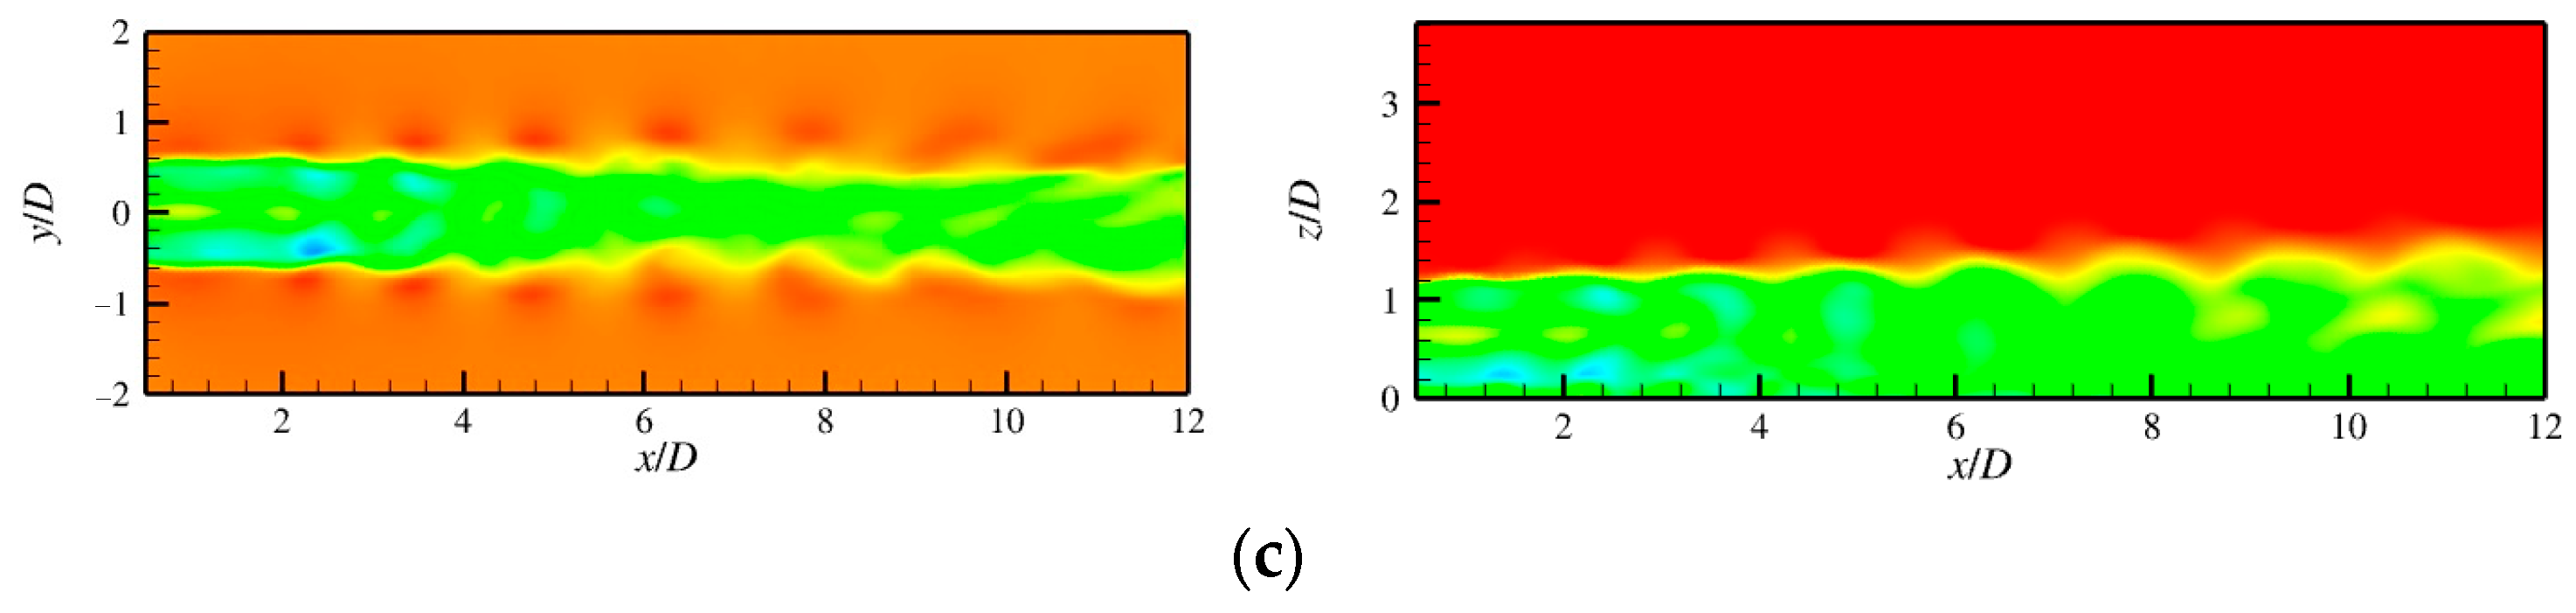
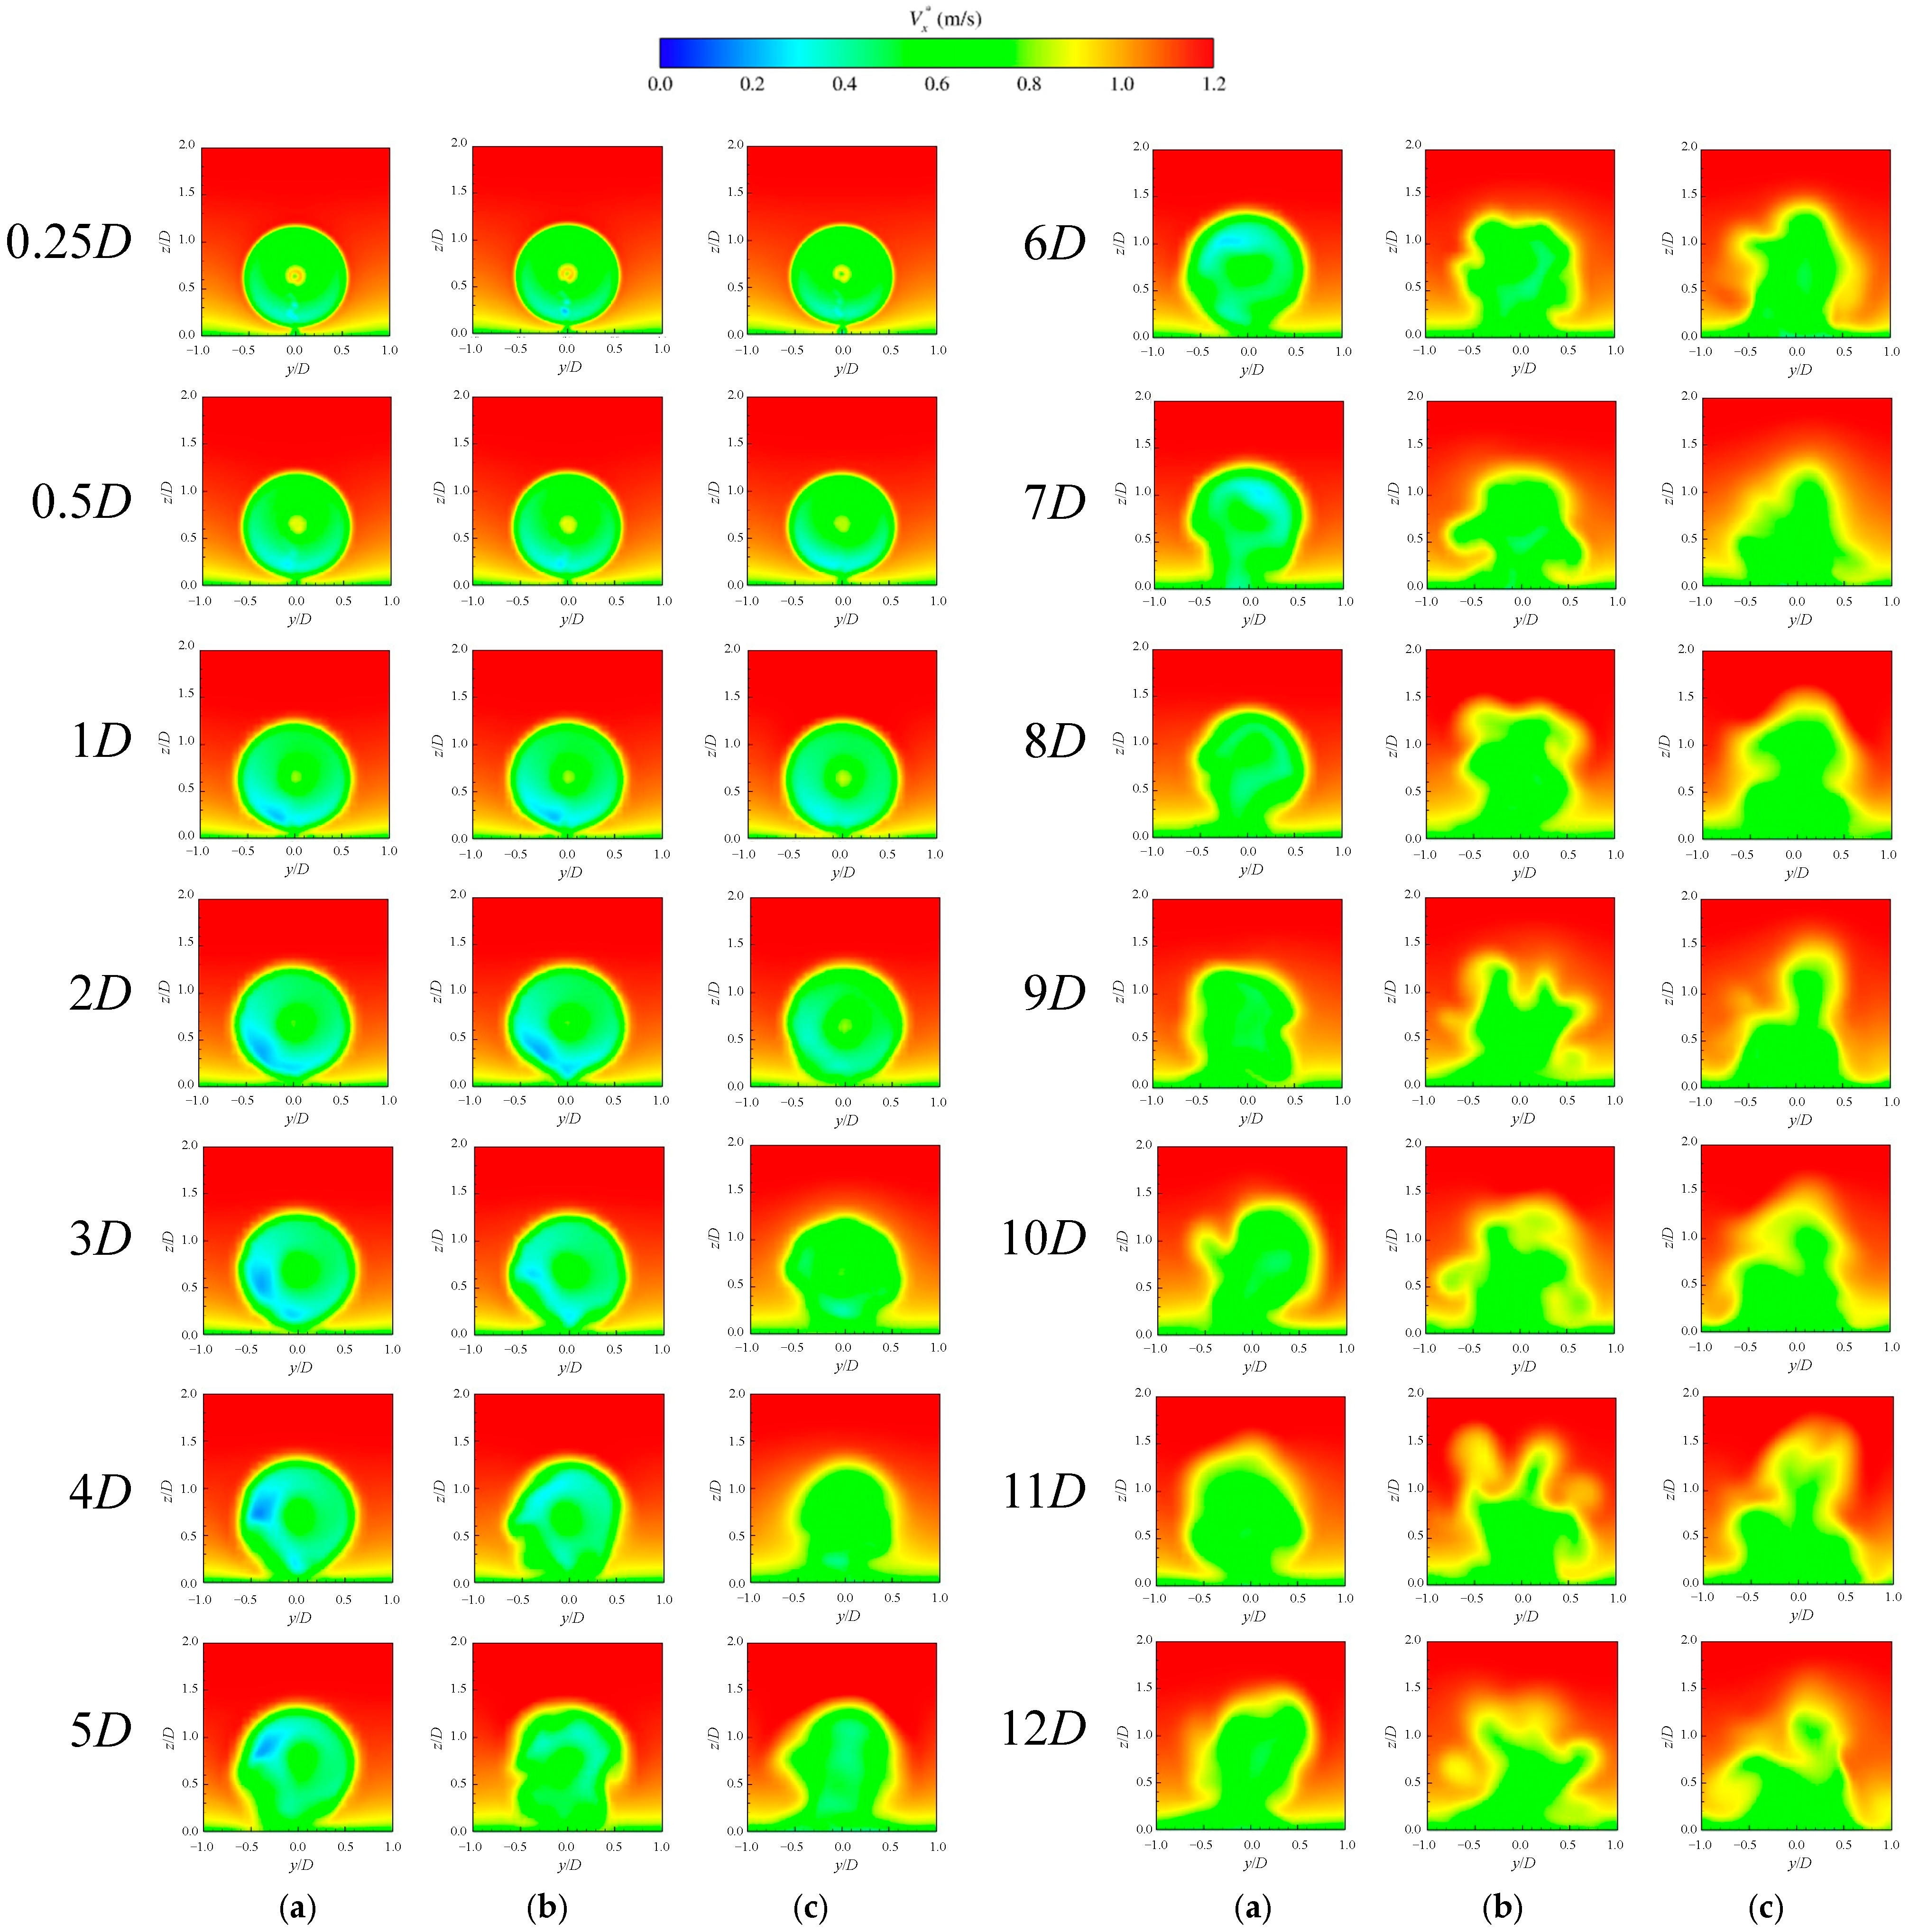
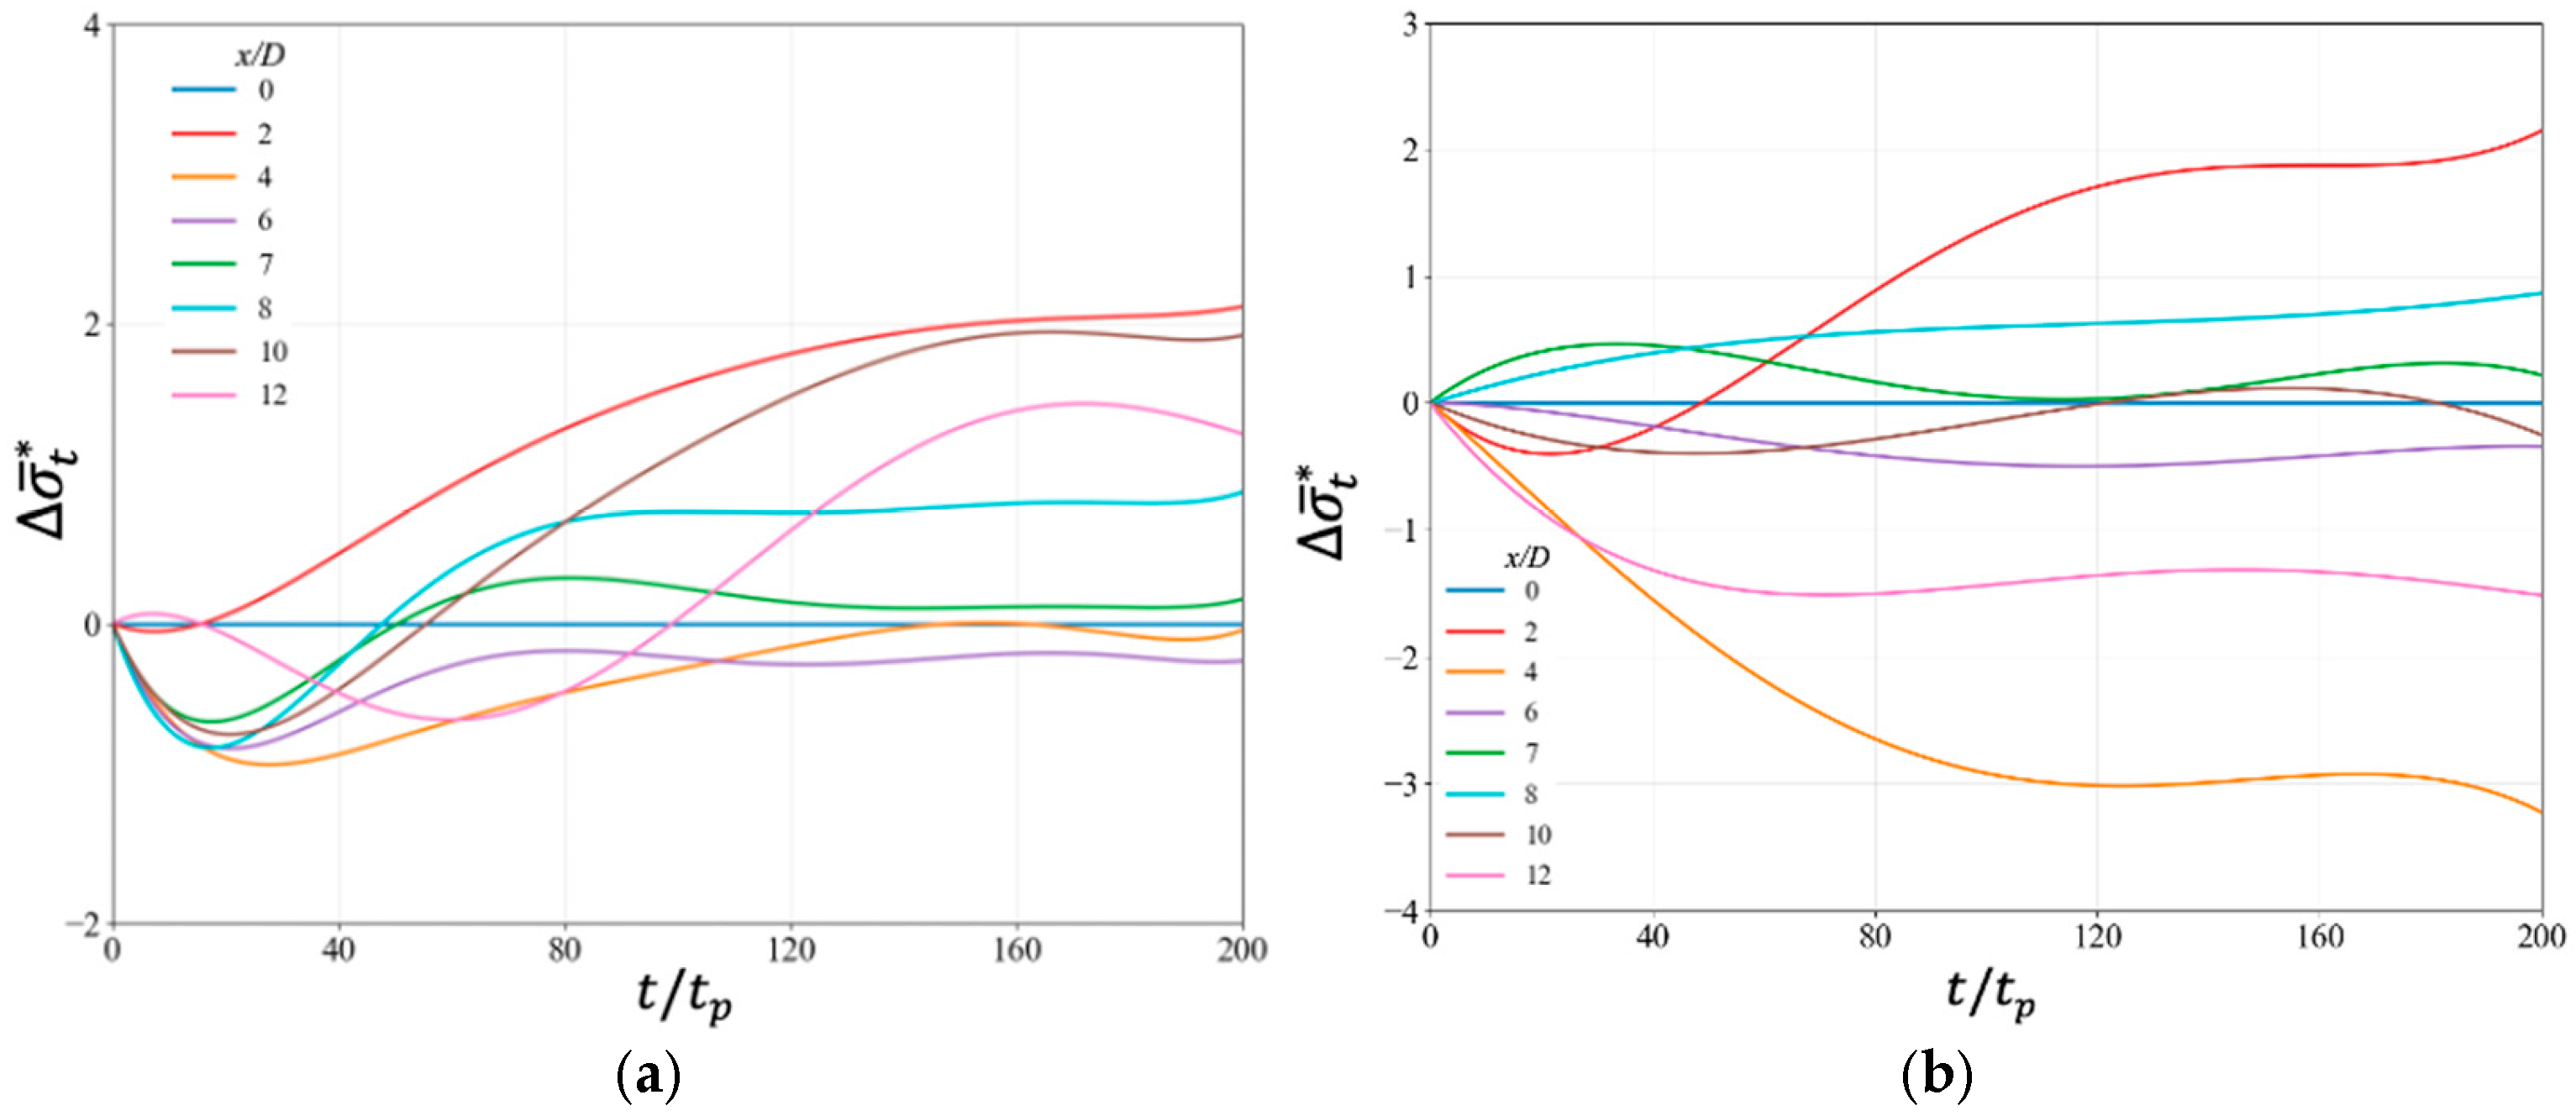
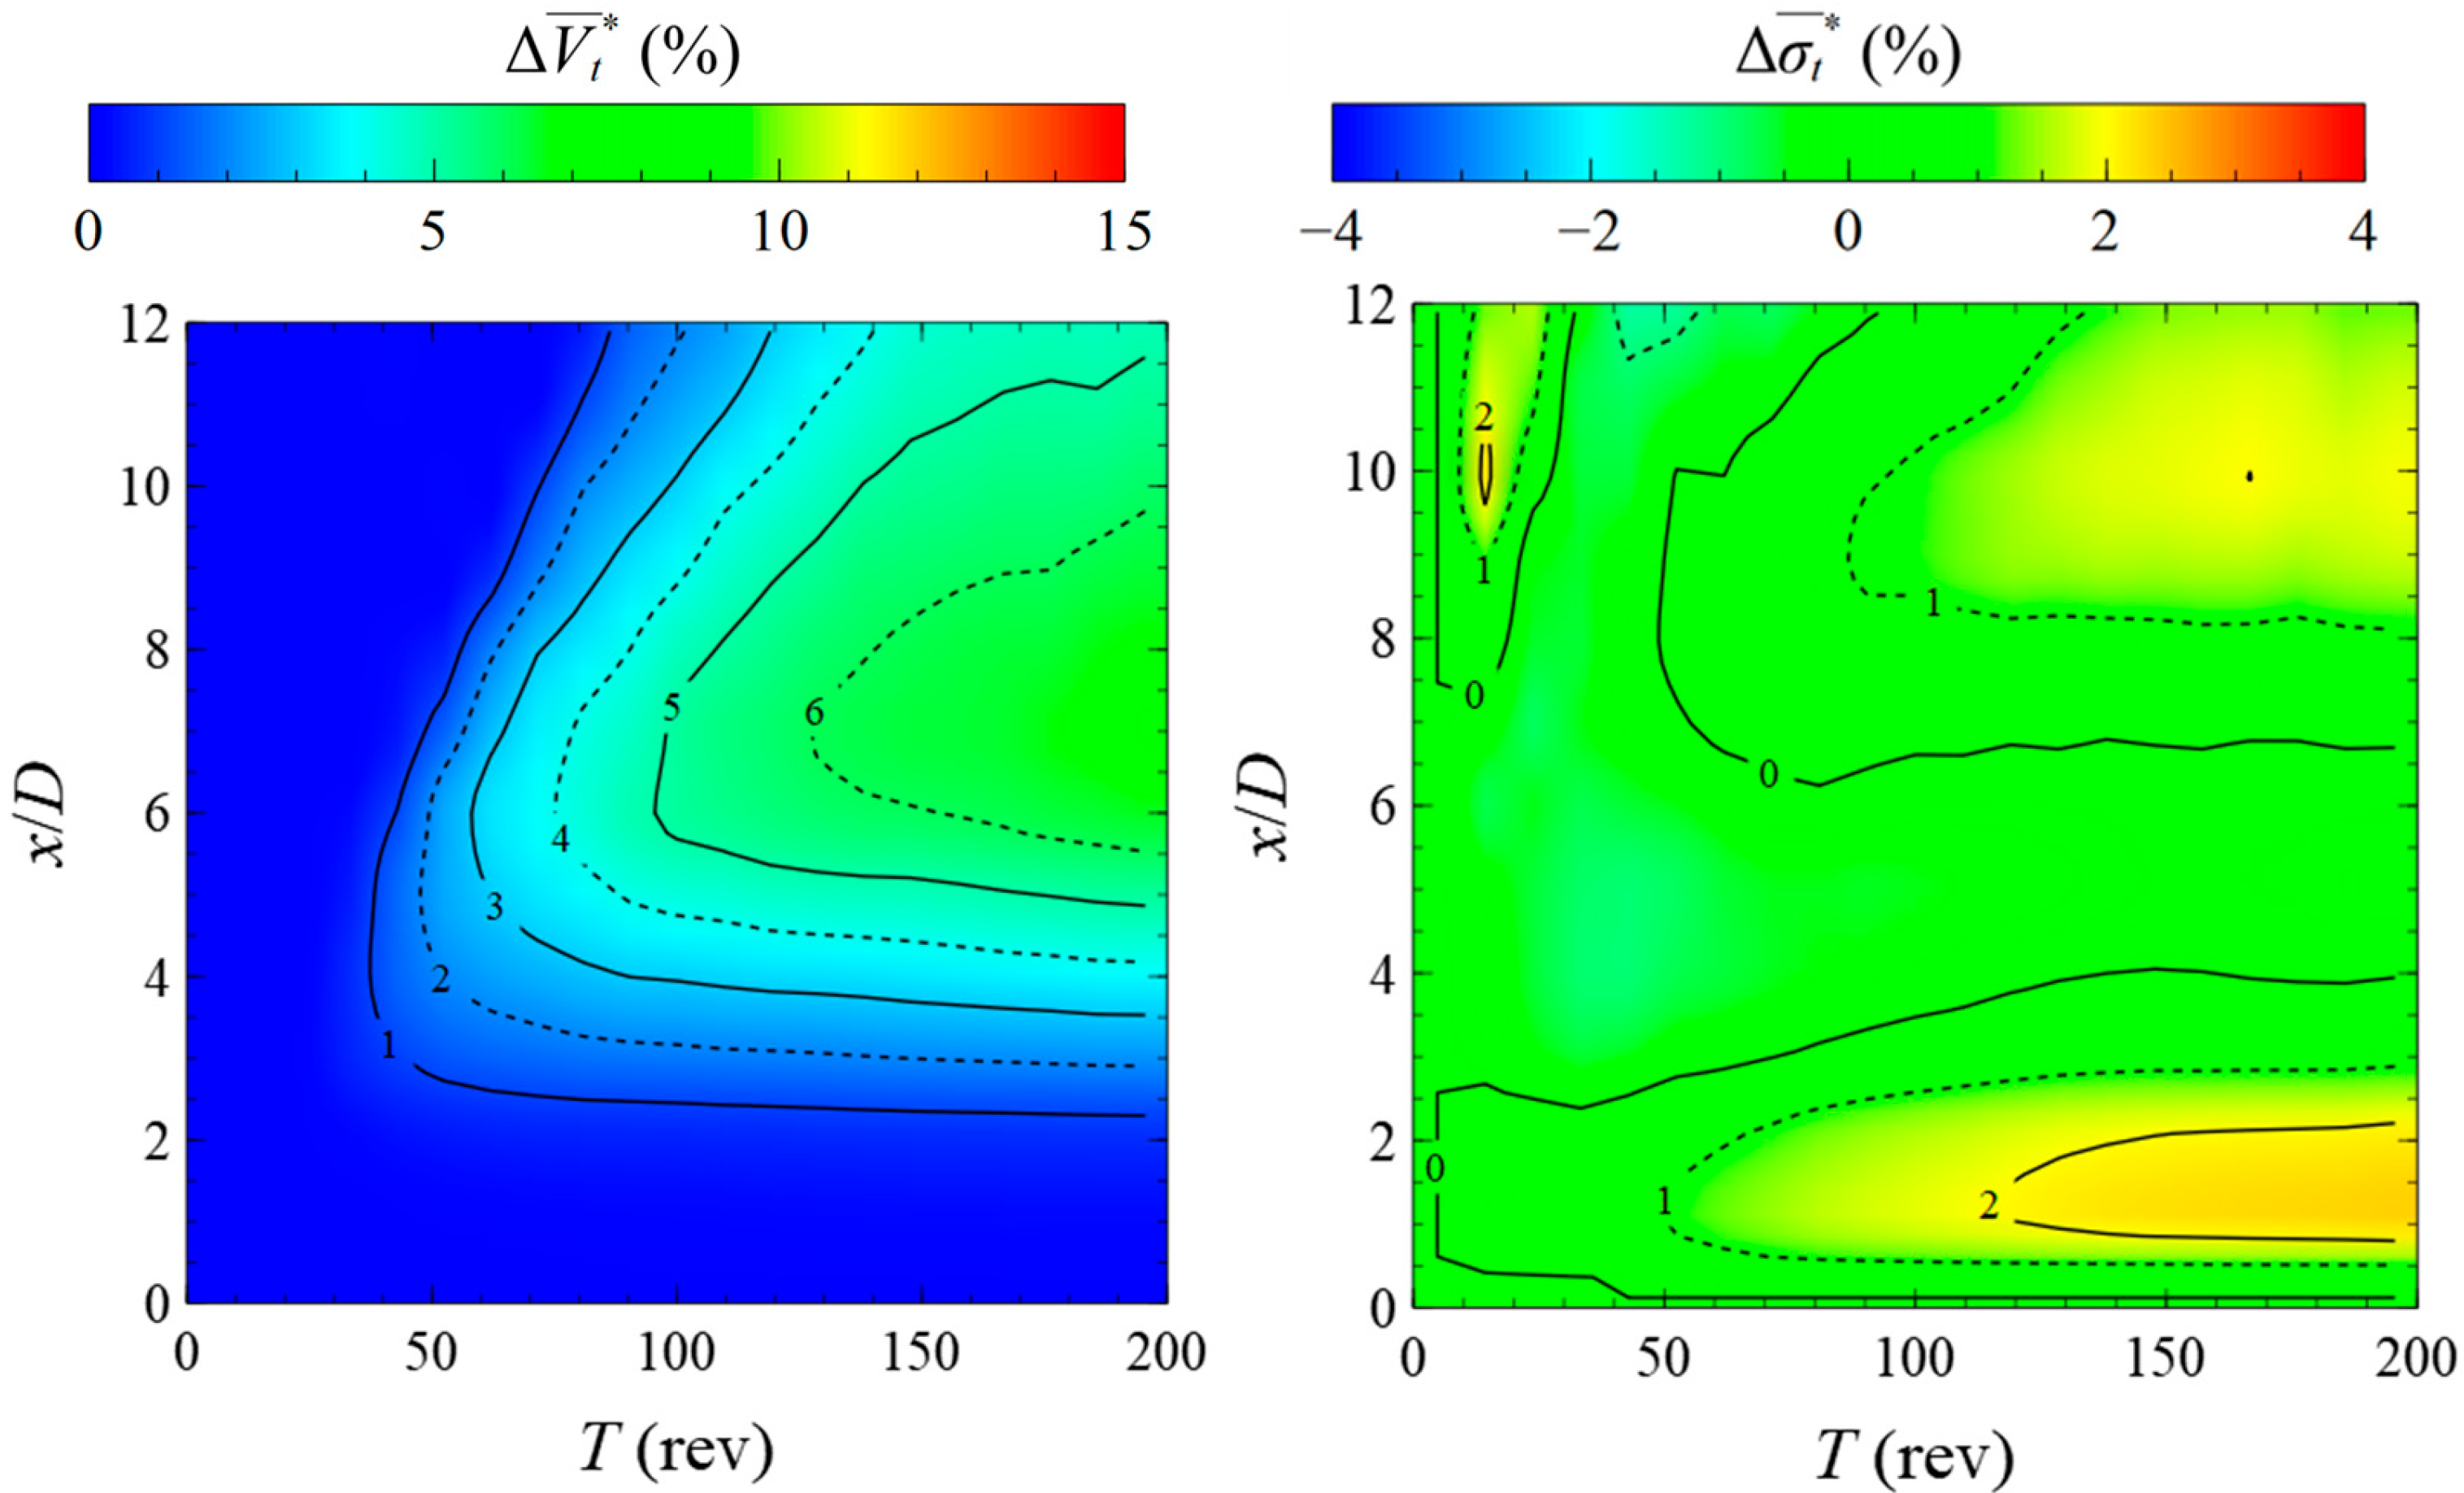
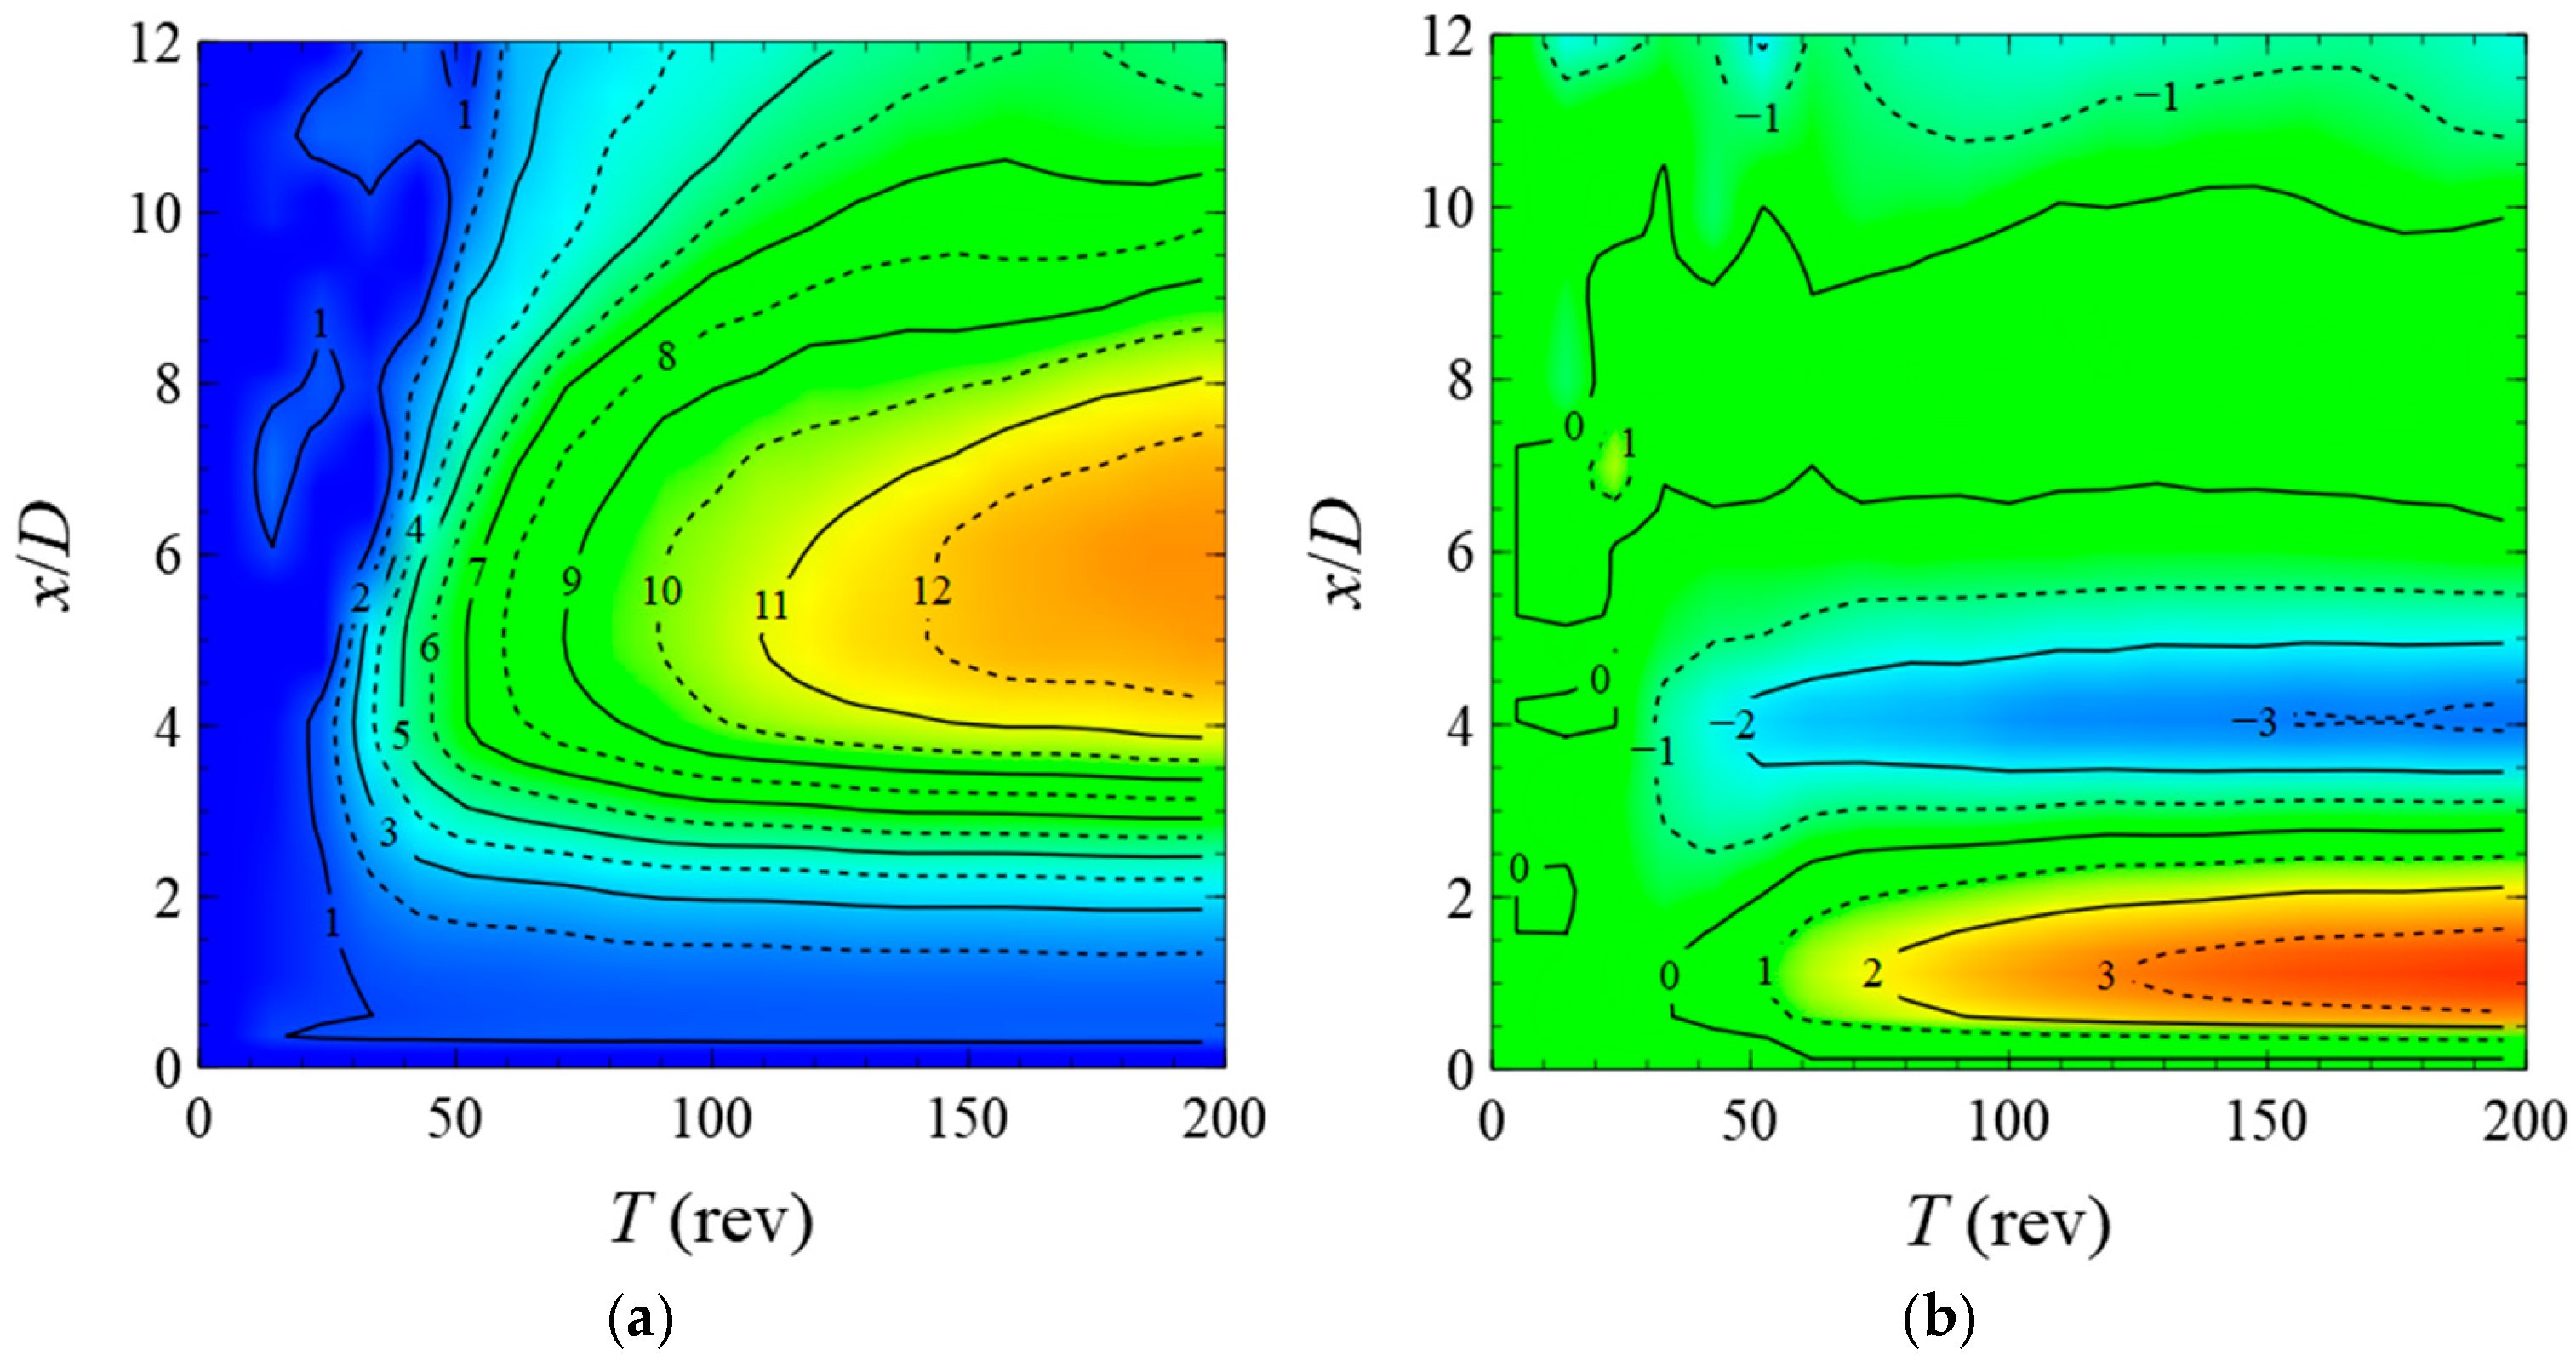
4.2. Wake Field
5. Conclusions
Author Contributions
Funding
Data Availability Statement
Conflicts of Interest
References
- Global Wind Energy Council. Global Wind Report 2023. Brussels, Brussels Hoofdstedelijk Gewest, Belgium, 2023. [Online]. Available online: https://gwec.net/globalwindreport2023/ (accessed on 5 December 2023).
- Bureau of Energy. Four-Year Plan of Promotion for Wind Power; Ministry of Economic Affairs: Taipei, Taiwan, 2019.
- Industrial Technology Research Institute. Wind Resource Assessment Handbook; Industrial Technology Research Institute: Hsinchu, Taiwan, 2011. [Google Scholar]
- Sebastian, T.; Lackner, M.A. Characterization of the Unsteady Aerodynamics of Offshore Floating Wind Turbines. Wind Energy 2013, 16, 339–352. [Google Scholar] [CrossRef]
- Lee, H.; Lee, D.J. Effects of Platform Motions on Aerodynamic Performance and Unsteady Wake Evolution of a Floating Offshore Wind Turbine. Renew. Energy 2019, 143, 9–23. [Google Scholar] [CrossRef]
- Qiu, Y.X.; Wang, X.D.; Kang, S.; Zhao, M.; Liang, J.Y. Predictions of Unsteady HAWT Aerodynamics in Yawing and Pitching Using the Free Vortex Method. Renew. Energy 2014, 70, 93–106. [Google Scholar] [CrossRef]
- Ma, Z.; Zeng, P.; Lei, L. Analysis of the Coupled Aeroelastic Wake Behavior of Wind Turbine. J. Fluids Struct. 2019, 84, 466–484. [Google Scholar] [CrossRef]
- Rodriguez, S.N.; Jaworski, J.W. Strongly-Coupled Aeroelastic Free-Vortex Wake Framework for Floating Offshore Wind Turbine Rotors. Part 1: Numerical Framework. Renew. Energy 2019, 141, 1127–1145. [Google Scholar] [CrossRef]
- Rodriguez, S.N.; Jaworski, J.W. Strongly-Coupled Aeroelastic Free-Vortex Wake Framework for Floating Offshore Wind Turbine Rotors. Part 2: Application. Renew. Energy 2020, 149, 1018–1031. [Google Scholar] [CrossRef]
- Lee, H.; Lee, D.J. Numerical Investigation of the Aerodynamics and Wake Structures of Horizontal Axis Wind Turbines by Using Nonlinear Vortex Lattice Method. Renew. Energy 2019, 132, 1121–1133. [Google Scholar] [CrossRef]
- Tran, T.T.; Kim, D.H. The Platform Pitching Motion of Floating Offshore Wind Turbine: A Preliminary Unsteady Aerodynamic Analysis. J. Wind Eng. Ind. Aerodyn. 2015, 142, 65–81. [Google Scholar] [CrossRef]
- Tran, T.T.; Kim, D.H. A CFD Study into the Influence of Unsteady Aerodynamic Interference on Wind Turbine Surge Motion. Renew. Energy 2016, 90, 204–288. [Google Scholar] [CrossRef]
- Cai, X.; Gu, R.; Pan, P.; Zhu, J. Unsteady Aerodynamics Simulation of a Full-Scale Horizontal Axis Wind Turbine Using CFD Methodology. Energy Convers. Manag. 2016, 112, 146–156. [Google Scholar] [CrossRef]
- Wong, S.K.; Chau, S.W. A Preliminary Study on the Influence of Motion of Floating Wind Turbines on Wake Characteristics. In Proceedings of the 34th SNAME, Keelung, Taiwan, 27–28 August 2022. [Google Scholar]
- Gaertner, E.; Rinker, J.; Sethuraman, L.; Zahle, F.; Anderson, B.; Barter, G.; Abbas, N.; Meng, F.; Bortolotti, P.; Skrzypinski, W.; et al. Definition of the IEA Wind 15-Megawatt Offshore Reference Wind Turbine; National Renewable Energy Lab: Golden, CO, USA, 2020; NREL/TP-5000-75698. [Google Scholar]
- Boussinesq, J. Essai sur la Théorie des Eaux Courantes. Mémoires Présentés Par Divers Savants À L’académie Des Sci. 1877, 23, 1–680. [Google Scholar]
- Simcenter STAR-CCM+ User Guide, version 2206; Siemens: Berlin, Germany, 2022.
- Tong, H.Y. Normal Operating Performance Study of a 15 MW Floating Wind Turbine System Using Semi-Submersible TaidaFloat Platform in the Hsinchu Offshore Area. Master’s Thesis, Department of Engineering Science and Ocean Engineering, National Taiwan University, Taipei, Taiwan, 2022. [Google Scholar]
- Cai, Y.S. Normal Operating and Extreme Condition Performance Study of 15MW Floating Wind Turbine System Using Semi-Submersible Taida Floating Platform with 3 × 2 and 3 × 3 Mooring Design in the Hsinchu Offshore Area. Master’s Thesis, Dept. Engineering Science and Ocean Engineering, National Taiwan University, Taipei, Taiwan, 2023. [Google Scholar]
- Coupled Analysis of Floating Wind Turbines; DNVGL-RP-0286; DNV: Singapore, 2019.


| Parameter | Units | Value |
|---|---|---|
| Rated Power | MW | 15 |
| Rotor Orientation | - | Upwind |
| Blade configuration | - | 3 |
| Blade Length | m | 120 |
| Hub Height | m | 150 |
| Hub/Rotor Diameter | m | 7.94/240 |
| Tower Base Diameter | m | 10 |
| Hub Overhang | m | 11.35 |
| Rated Wind Speed | m/s | 10.59 |
| Rated Rotor Speed | RPM | 7.56 |
| Shaft Tilt/Pre-Cone Angle | ° | 6/4 |
| Parameter | Value | ||
|---|---|---|---|
| Turbine Rotor Speed | 7.457 RPM | ||
| Wind Speed at Hub Height | 9 m/s | ||
| Turbine Condition | Stationary | Harmonic Surge | Harmonic Pitch |
| Solution Time | 200 Rotor Rev. | 200 Rotor Rev. after Stationary | 200 Rotor Rev. after Stationary |
| Motion Period | - | 45 s | 45 s |
| Motion Amplitude | - | 2.75 m | 5° |
| Turbine Condition | Ref. [15] | Stationary | Surging | Pitching |
|---|---|---|---|---|
| (MN∙m) | - | 11.874 | 11.613 | 11.452 |
| (MW) | 8.603 | 8.808 | 8.616 | 8.496 |
Disclaimer/Publisher’s Note: The statements, opinions and data contained in all publications are solely those of the individual author(s) and contributor(s) and not of MDPI and/or the editor(s). MDPI and/or the editor(s) disclaim responsibility for any injury to people or property resulting from any ideas, methods, instructions or products referred to in the content. |
© 2025 by the authors. Licensee MDPI, Basel, Switzerland. This article is an open access article distributed under the terms and conditions of the Creative Commons Attribution (CC BY) license (https://creativecommons.org/licenses/by/4.0/).
Share and Cite
Lin, T.-Y.; Tong, H.-Y.; Wong, S.-K.; Chau, S.-W. Influence of Surging and Pitching Behaviors on the Power Output and Wake Characteristics of a 15 MW Floating Wind Turbine. J. Mar. Sci. Eng. 2025, 13, 1059. https://doi.org/10.3390/jmse13061059
Lin T-Y, Tong H-Y, Wong S-K, Chau S-W. Influence of Surging and Pitching Behaviors on the Power Output and Wake Characteristics of a 15 MW Floating Wind Turbine. Journal of Marine Science and Engineering. 2025; 13(6):1059. https://doi.org/10.3390/jmse13061059
Chicago/Turabian StyleLin, Tsung-Yueh, Hoi-Yi Tong, Sai-Kiu Wong, and Shiu-Wu Chau. 2025. "Influence of Surging and Pitching Behaviors on the Power Output and Wake Characteristics of a 15 MW Floating Wind Turbine" Journal of Marine Science and Engineering 13, no. 6: 1059. https://doi.org/10.3390/jmse13061059
APA StyleLin, T.-Y., Tong, H.-Y., Wong, S.-K., & Chau, S.-W. (2025). Influence of Surging and Pitching Behaviors on the Power Output and Wake Characteristics of a 15 MW Floating Wind Turbine. Journal of Marine Science and Engineering, 13(6), 1059. https://doi.org/10.3390/jmse13061059