1. Introduction
Ship collisions remain one of the most critical risks in maritime navigation, often resulting in significant property damage, human casualties, and environmental harm. Despite the establishment of the International Regulations for Preventing Collisions at Sea (COLREGs), numerous accidents still occur due to inconsistent interpretation and application by navigators [
1,
2]. In particular, borderline situations—such as the distinction between head-on and crossing, or overtaking and crossing—pose challenges for precise rule classification and tend to induce interpretive variability [
3,
4]. While COLREGs offer a rule-based framework, their real-world application often involves perceptual judgment, risk estimation, and cognitive inference, especially under uncertain or ambiguous conditions. Previous studies have shown substantial variability in navigator interpretations, even among experienced mariners facing similar encounter scenarios [
5,
6]. These findings indicate that the issue lies not merely in rule availability, but in how navigators perceive and interpret encounter situations probabilistically.
The recent emergence of Maritime Autonomous Surface Ships (MASS) has introduced further complexity into maritime navigation [
7]. Unlike human operators who rely on experience, visual cues, and intuitive judgment, MASS systems make decisions based on deterministic algorithms and structured rule hierarchies [
8,
9,
10]. This divergence in cognitive processing may result in mismatches during mixed operation encounters—cases in which manned and autonomous vessels interact—despite both parties complying with COLREGs. For instance, human navigators tend to infer intent and anticipate action, whereas autonomous systems respond to rule triggers in real time without intermediate cognitive interpretation [
11,
12]. The International Maritime Organization (IMO)’s regulatory scoping exercise on MASS [
13,
14], along with related reports from the International Organization for Marine Aids to Navigation (IALA) [
15], have highlighted these interpretational inconsistencies as a key concern for future COLREGs integration in autonomous contexts. These developments emphasize the importance of not only understanding the rules themselves, but also how navigators actually perceive and apply them. To address this gap, this study proposes a probabilistic model of navigator awareness based on encounter angle. Using a survey of licensed navigators, the study captures responses to a set of encounter scenarios exhibiting geometric ambiguity. The model applies curve fitting techniques to visualize awareness trends, identify unstable interpretation zones, and provide insights into the cognitive tendencies underlying COLREGs interpretation. This awareness-based framework contributes to understanding human autonomy interaction and offers guidance for MASS behavior modeling, Vessel Traffic Service (VTS) decision support, and rule refinement efforts.
Several studies have analyzed navigator compliance with COLREGs, often relying on rule-based simulations or deterministic behavior models [
16,
17,
18]. None of these approaches offer a structured, probabilistic representation of navigator awareness across spatial encounter angles.
This study introduces a novel approach by modeling navigators’ interpretive awareness as a continuous probability distribution using Gaussian curve fitting. Unlike prior work, we focus on capturing not only the central judgmental tendency, but also the cognitive variability across angular sectors. This probabilistic awareness model offers a structured and quantifiable representation of interpretation patterns, which can be used to improve decision-making support in MASS and VTS systems.
This study builds on the survey-based analysis presented in Kim and Park [
19] but advances the approach by providing a more structured and theory driven modeling of navigator interpretation. While the previous work focused on statistical summaries such as means and standard deviations across encounter angles, this research develops a probabilistic awareness model by fitting navigator response data to continuous functions and analyzing the resulting awareness center (
μ) and cognitive variability (
σ).
This study addresses the following research question: how do licensed navigators interpret COLREGs-defined encounter situations under ambiguity, and how can this awareness be modeled probabilistically? The main objective is to develop a structured awareness model that captures both the central judgmental tendencies and cognitive variability across angular scenarios. While prior studies have relied on rule-based or statistical descriptions, none have modeled awareness as a continuous probabilistic function informed by cognitive theory. To bridge this gap, we conducted a survey targeting licensed navigators, using geometric encounter scenarios with ambiguous COLREGs classification. Responses were analyzed using Gaussian curve fitting to extract awareness functions that can be interpreted in terms of mean tendencies (μ) and cognitive variability (σ).
Importantly, the study adopts Endsley’s [
20] model of situation awareness as a conceptual framework, recognizing that COLREGs interpretation involves not only discrete decisions, but also structured cognitive processes involving central tendencies and dispersion. By embedding this cognitive dimension, the research moves beyond surface-level statistics to develop a structural awareness-based model grounded in cognitive science. Unlike prior statistical summaries that treat responses as isolated data points, our model embeds the awareness process within a cognitive architecture. This study breaks from these conventions by introducing a cognitive–scientific approach grounded in probabilistic modeling. By mapping navigator judgments to Gaussian distributions across angular transitions, it not only quantifies interpretive centrality, but also captures cognitive dispersion, enabling applications in autonomous navigation logic that were previously unaddressed.
The remainder of this paper is structured as follows:
Section 2 describes the data collection and modeling methodology.
Section 3 presents the Gaussian fitting results.
Section 4 discusses implications for MASS and VTS.
Section 5 concludes with key findings, limitations, and directions for future research.
2. Methodology
Figure 1 illustrates the conceptual mismatch between human and autonomous navigators in interpreting COLREGs-defined situations. Although both adhere to the same regulatory framework, their underlying cognitive processes differ fundamentally: human operators rely on perception, experience, and intent estimation, whereas autonomous systems function through deterministic logic and fixed rule hierarchies [
16]. This mismatch in cognition can lead to mutually unanticipated maneuvers, even when both parties formally comply with COLREGs, thus increasing the risk of collision in mixed-operational environments [
17,
18].
2.1. Survey Design and Data Collection
To quantitatively model navigators’ awareness patterns of COLREGs rule interpretation, a structured survey was conducted. The scenarios presented schematic radar-style visualizations for 11 specific relative bearings (006°, 008°, 010°, 012°, 100°, 110°, 120°, 130°, 140°, 150°, 160°). These were designed to reflect angular perspectives from the viewpoint of the own ship, consistent with real-world bridge observation. Relative bearings were chosen over true bearings, as they are directly used by navigators in perceptual classification and real-time decision making. The selected angles span two interpretational transition sectors—head-on to crossing (HC) and overtaking to crossing (OC)—where previous studies have reported high cognitive ambiguity [
19]. The angular intervals were set at 2° in these zones to detect subtle shifts in awareness and response. While distance was not varied in this study, the design deliberately isolated angle as a singular variable to capture awareness shifts without the added complexity of multi-dimensional variables. This approach allowed the identification of cognitive thresholds in interpretation under controlled visual input, assuming a fixed range context.
Participants were all licensed navigators with operational experience on vessels exceeding 5000 GT. A total of 101 valid responses were collected. The scenario structure was adapted from Kim and Park [
19], but responses were repurposed here to construct awareness functions. Each participant rated how likely the situation represented a specific COLREGs category (e.g., head-on, crossing) using a 5-point Likert scale. Response options included: “certainly head-on”, “likely head-on”, “uncertain”, “likely crossing”, and “certainly crossing”. This design enabled the capture of both dominant judgment and degrees of interpretational uncertainty. The collected data were then used to derive probabilistic awareness functions for each angle.
Figure 1, adapted from Endsley’s situation awareness framework [
20], illustrates the cognitive divergence between human and autonomous navigators and provides the conceptual basis for the modeling approach used in this study.
2.2. Data Preprocessing and Normalization
Survey responses were organized by relative bearing angle. For each angle, the mean (
μ) and standard deviation (
σ) were calculated to quantify the central tendency and the degree of cognitive dispersion. A high standard deviation at a given angle indicates greater inconsistency or uncertainty in navigator judgment [
19], often reflecting interpretational ambiguity in the boundary zones between head-on and crossing, or overtaking and crossing situations.
To address this ambiguity, a probabilistic redistribution method was applied. Specifically, responses labeled as “3” (i.e., “I am unsure”) were split evenly between values 2 and 4 to capture the bidirectional uncertainty of transitional interpretation. Additionally, responses labeled as “4” and “5” were adjusted down by one point to preserve continuity and support probabilistic modeling across a four point scale. This preprocessing approach is grounded in fuzzy decision theory and has been applied in previous studies on rule interpretation under ambiguity [
6,
21]. By transforming discrete Likert data into a continuous distribution, the resulting dataset becomes suitable for probabilistic curve fitting and structural awareness modeling.
2.3. Navigator Awareness Modeling Approach
Rather than focusing on average responses or frequency counts, this study aims to model how navigators perceive and interpret collision situations as structured awareness functions. To support this, Endsley’s [
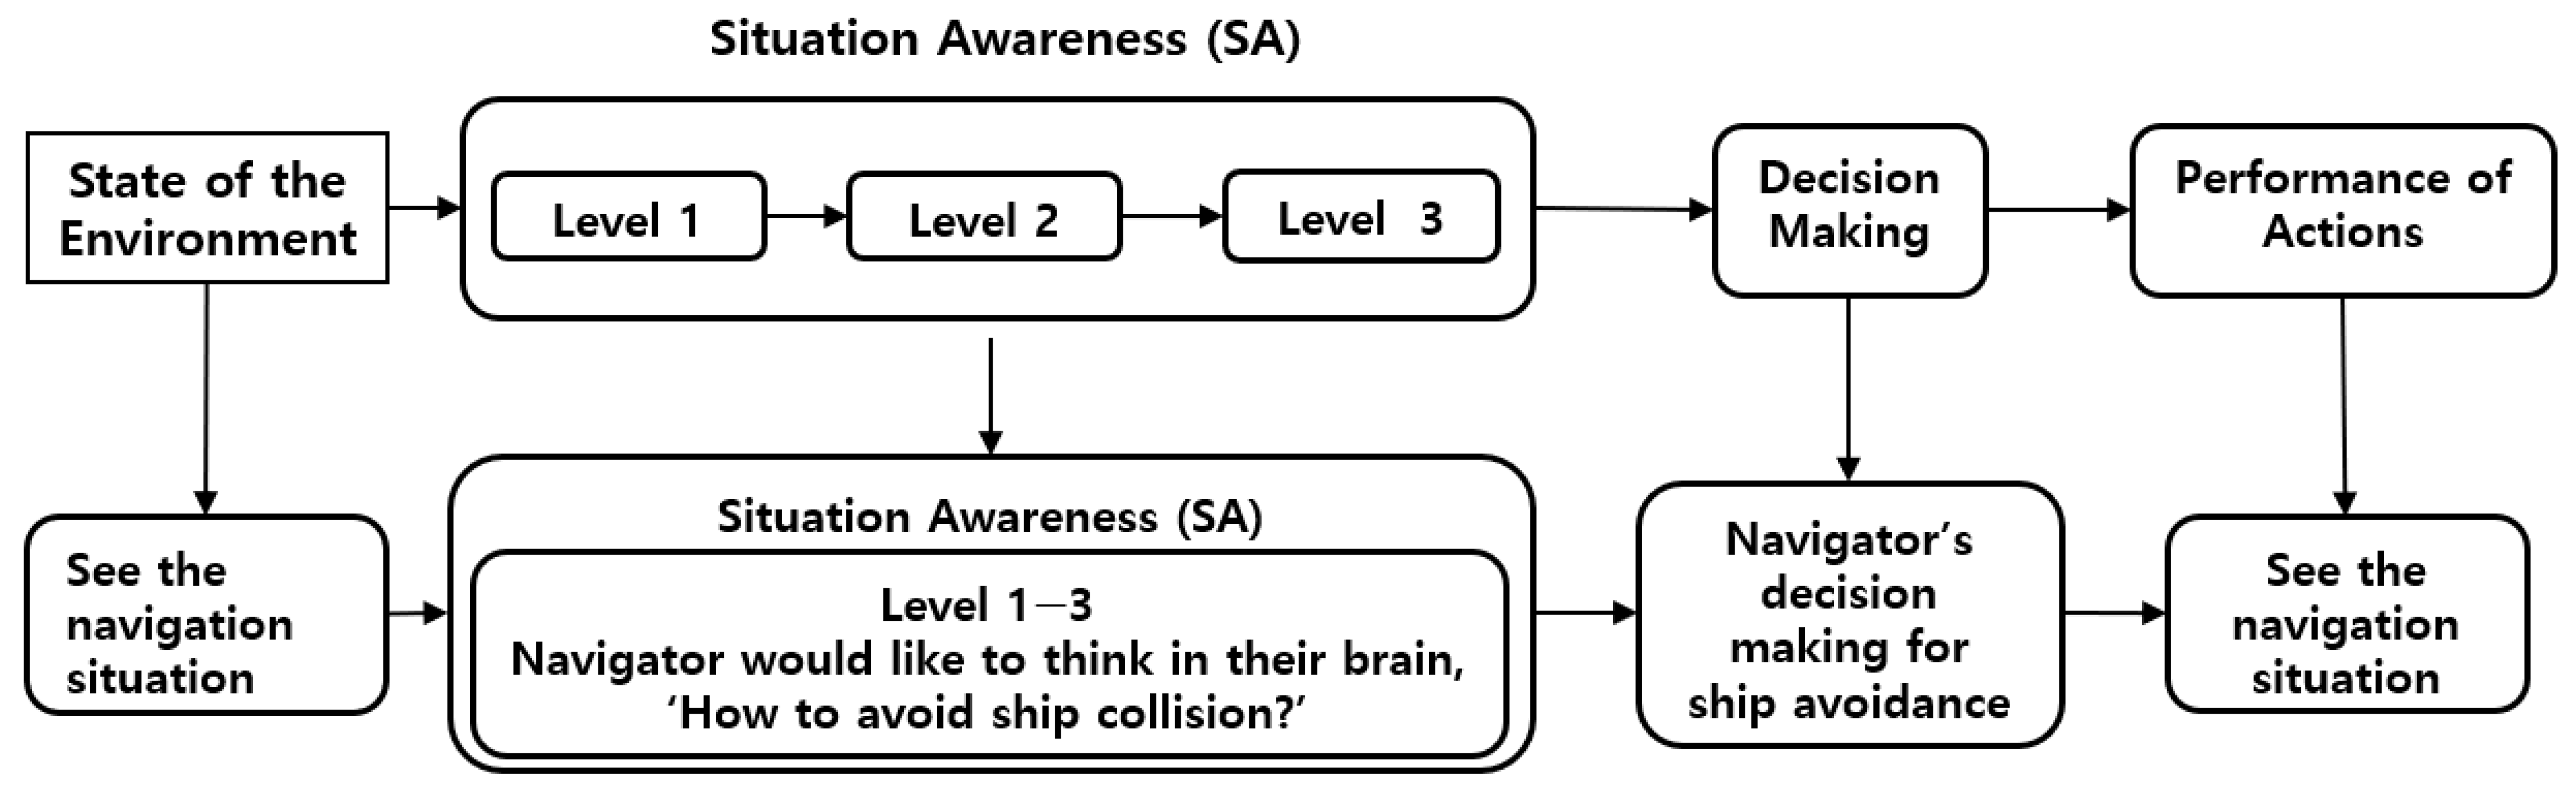
20] model of situation awareness (SA) is used as the conceptual foundation. This model describes navigator cognition as a sequential process involving perception (Level 1), comprehension (Level 2), and projection (Level 3), which ultimately informs decision making.
Figure 2 illustrates this process. Navigators perceive environmental cues, interpret their meaning, and anticipate future developments before initiating action. This study focuses specifically on Level 2, where situational meaning is constructed, and models navigator responses at this level using Gaussian-based awareness curves.
Figure 2 shows the hierarchical structure of navigator situation awareness and decision making (Level 1: perception → Level 2: comprehension → Level 3: projection), adapted from Endsley (1995).
The awareness curves model navigator responses as probability distributions. The Gaussian distribution was chosen for its ability to describe the convergence of judgment around a central interpretation while accounting for surrounding uncertainty. This approach has a strong foundation in cognitive psychology and allows for simultaneous quantification of awareness center value (
μ) and cognitive variability (
σ) [
22]. The model takes the following equation:
Here, x represents the redefined Likert response, μ denotes the awareness center, and σ captures cognitive variability. The function is fitted for each encounter angle, and the resulting μ and σ values are later approximated using second-order polynomials to reveal the structural pattern of awareness transitions.
In Equation (1), the random variable x represents the transformed Likert scale response indicating the navigator’s perceived applicability of a specific COLREGs rule (e.g., overtaking, crossing) at a given encounter angle. We model this perceptual response as a probability density function. The Gaussian distribution was selected for this modeling because it effectively captures the central tendency and spread of subjective judgment, consistent with findings in cognitive psychology and decision modeling. It reflects how human interpretations tend to cluster around a typical value (awareness center) with surrounding uncertainty (cognitive variability), and is mathematically tractable for curve fitting and parameter estimation.
Fitting was performed using MATLAB R2022a [
23], and parameter estimation employed Maximum Likelihood Estimation (MLE), a statistically robust method widely used in cognitive and behavioral modeling [
24,
25]. Model quality was assessed using three core statistical criteria. The coefficient of determination (R
2) measures the proportion of variance explained by the model, indicating how well it captures the observed response trend. The sum of squared errors (SSE) quantifies the total residual magnitude by aggregating squared differences between the predicted and actual values. Lastly, the root mean square error (RMSE) expresses the average deviation from the fitted curve, providing an intuitive measure of overall model accuracy [
26]. Together, these metrics support a structured evaluation of judgment centrality, transitional sharpness, and cognitive ambiguity across encounter angles.
2.4. Interpretation Framework
This study does not aim to classify navigator responses as rule-compliant or non-compliant. Rather, it interprets responses in terms of how awareness is structured, using curve-based modeling as a lens for understanding navigator perception under uncertainty.
The fitted Gaussian curves go beyond basic response distributions to reveal structural insights about judgment centrality, instability, and bias.
First, angles where the awareness center (μ) changes rapidly are interpreted as structural transition zones. These areas reflect high disagreement among navigators and suggest unstable interpretation boundaries.
Second, when the cognitive variability (σ) is high at a given angle, this indicates cognitive ambiguity, meaning that navigators lack a shared dominant interpretation. These zones represent low certainty and increased risk of disagreement or hesitation.
Third, asymmetric curve shapes may reveal conservative projection tendencies, where navigators under uncertainty tend to choose safer interpretations—classifying ambiguous encounters as head-on or overtaking to reduce perceived collision risk or liability. Such patterns reflect risk-averse decision strategies that are common in real-world maritime behavior.
Rather than assessing correctness, this interpretive framework quantifies probabilistic structures of awareness, making it directly relevant to the development of Maritime Autonomous Surface Ships. By understanding how human navigators tend to respond in zones of transition and ambiguity, MASS algorithms can be designed to anticipate such variability and align their own behaviors accordingly. The awareness curves offer a practical interface between empirical human data and structured, anticipatory autonomous systems.
3. Results
3.1. Summary of Response Distributions by Angle
To understand how navigators perceive and interpret encounter situations defined under COLREGs, survey responses were first organized by encounter angle. The data were collected across eleven discrete angles, with 2° intervals, spanning two ambiguous sectors: head-on to crossing and overtaking to crossing. The HC sector included the angles 006°, 008°, 010°, and 012°, while the OC sector ranged from 160° to 100°, including 100°, 110°, 120°, 130°, 140°, 150°, and 160°.
Each response was previously redefined on a four-point scale to reflect interpretation tendencies, with intermediate uncertainty redistributed (see
Section 2.2). Based on these processed values, awareness center (
μ) and cognitive variability (
σ) were computed for each angle to quantify the central tendency and the degree of interpretational spread. The resulting statistics are summarized in
Table 1.
The data reveal a consistent cognitive pattern across both sectors. In the HC sector, the mean values increase steadily from 1.88 at 006° to 2.71 at 012°, indicating a clear shift in interpretation from head-on to crossing. This gradient suggests a structural transition zone, where navigators gradually revise their perception as the bearing angle increases. Concurrently, standard deviation also increases between 006° and 010°, peaking at 010° (σ = 0.74), which reflects a zone of interpretational instability and disagreement. In contrast, the OC sector exhibits a relatively stable high mean near 3.0 to 3.3 between 100° and 130°, suggesting a strong consensus that these scenarios are perceived as crossing situations. However, as the angle moves toward 160°, the mean decreases to 2.68 and standard deviation increases to 0.70, indicating growing ambiguity near the boundary with overtaking scenarios. These statistical features provide a preliminary foundation for curve-based awareness modeling, revealing both stable and unstable zones in navigator interpretation. They highlight the cognitive complexity embedded within geometrically simple encounters and justify the need for probabilistic, structured models that go beyond binary classification.
3.2. Gaussian Curve Fitting for Each Encounter Angle
Gaussian curve fitting was applied to the navigator responses at each encounter angle to model the probabilistic structure of awareness. This approach enabled the identification of dominant interpretations and the degree of cognitive variability across both the head-on to crossing and overtaking to crossing sectors. For each angle, the shape, peak location, and standard deviation of the fitted curve provided insight into how consistently navigators interpreted the scenario.
Figure 3 presents the fitted Gaussian curves alongside the response histograms for each angle. These plots illustrate how navigator interpretations were distributed across the redefined Likert scale, revealing zones of consensus, uncertainty, and transitional instability. In the HC sector (006–012°), the results indicate a rapid shift in awareness. At 006°, the fitted curve is sharply peaked near the lower Likert values, with a low standard deviation, indicating strong agreement that the situation resembles a head-on encounter. As the bearing increases to 008° and 010°, the peak shifts upward and the standard deviation increases, reflecting greater judgment variability. By 012°, the distribution centers closer to crossing, and the curve remains relatively wide, suggesting that navigator interpretations have largely transitioned but still vary in confidence. In the OC sector (100–160°), responses are generally more stable. From 100° to 130°, the curves are narrow and consistently centered near the upper Likert values, showing strong consensus that these scenarios are perceived as crossing. However, as the angle approaches 150° and 160°, the fitted curves begin to broaden and shift slightly toward lower Likert values, accompanied by an increase in standard deviation. This pattern suggests growing interpretational ambiguity near the boundary between crossing and overtaking.
These results demonstrate that navigator awareness is not binary or deterministic, but instead structured around probabilistic tendencies. Some angles exhibit high interpretational consistency (e.g., 120°), while others reveal cognitive transition zones characterized by increased standard deviation and shifting awareness centers. These patterns form the basis for modeling navigator interpretation as a continuous function, which is further elaborated in the
Section 3.3.
To further quantify the structural characteristics of navigator awareness, the parameters estimated from each Gaussian fit—namely the awareness center (μ) and cognitive variability (σ)—were plotted across encounter angles. These parameters provide a high-level summary of how navigator interpretation changes in direction and stability across both the HC and OC sectors.
Figure 4a shows how the awareness center (
μ) evolves by angle. In the HC sector,
μ increases rapidly from 1.88 at 006° to 2.71 at 012°, indicating a sharp perceptual transition from head-on to crossing. This suggests that even small variations in relative bearing in this region can lead to markedly different rule interpretations among navigators. In contrast,
μ values in the OC sector remain relatively stable between 100° and 130°, consistently above 3.0, reflecting high agreement that the situation is a crossing. However,
μ gradually decreases as the angle increases to 160°, signaling growing interpretational uncertainty near the overtaking boundary.
Figure 4b presents the cognitive variability (
σ) of each fitted curve, which reflects the variability of navigator judgments at each angle. Peaks in
σ occur around 010° in the HC sector and 160° in the OC sector, both of which coincide with regions previously identified as ambiguous or transitional. These peaks indicate that navigator responses were more dispersed and less consistent in these regions. Conversely, minimum
σ values around 120° in the OC sector suggest high confidence and consensus among navigators.
Together, these two structural patterns—center shift and dispersion—highlight that navigator awareness evolves continuously and non-linearly across angle ranges, forming a probabilistic map of interpretation behavior. These findings support the development of awareness models that incorporate both perceptual stability and cognitive uncertainty in collision avoidance scenarios.
3.3. Modeling Structural Trends in Awareness
Building on the Gaussian curve fitting performed for each individual encounter angle, this section models the broader trends in navigator awareness across angular sectors. By fitting second order polynomial functions to the extracted awareness parameters—namely the awareness center (μ) and cognitive variability (σ)—we approximate how cognitive interpretations evolve across angular space. These structural representations allow for the continuous modeling of perceptual transitions and instability, providing a macro-level view of navigator judgment tendencies.
In the HC sector, the fitted polynomial curve for
μ increases steeply from 006° to 012°, clearly reflecting a sharp perceptual shift. The corresponding
σ curve peaks around 010°, highlighting a cognitive transition zone where navigator interpretations are most inconsistent. This pattern indicates that small changes in relative bearing in this range can produce large differences in rule classification, leading to potential interpretational conflict. In contrast, the OC sector demonstrates greater stability in
μ from 100° to 130°, followed by a gradual decrease as the bearing approaches 160°. This downward curvature reflects increasing uncertainty about whether the situation qualifies as overtaking or crossing. Concurrently, the
σ curve shows low dispersion in the central OC angles but increases toward 160°, identifying the angular boundary where interpretation becomes ambiguous.
Figure 5 summarizes these structural trends through four subplots:
Figure 5a,b visualize the
μ and
σ trends for the HC sector, while
Figure 5c,d do the same for the OC sector. These curves, fitted using polynomial models, were evaluated using standard statistical criteria—R
2 and RMSE—as summarized in
Table 2.
In
Figure 4a, the awareness center (
μ) curve in the HC sector displays a steep upward slope between 006° and 012°, indicating a rapid cognitive transition from head-on to crossing perception. Concurrently,
Figure 4b shows a
σ peak near 010°, signifying interpretational instability. In contrast, the OC sector (
Figure 5) shows relatively stable
μ values between 100° and 130°, followed by a gradual decline toward 160°, reflecting increasing uncertainty near the overtaking threshold. The corresponding
σ plot rises toward 160°, indicating a widening cognitive dispersion. These findings confirm that angular zones such as 010° (HC) and 160° (OC) serve as cognitive transition boundaries where navigator judgment becomes more variable and less predictable—insights which are critical for probabilistic modeling and risk-aware automation in MASS.
These results provide strong evidence that navigator awareness is neither uniform nor deterministic, but rather probabilistically structured and sector-dependent. The fitted μ and σ curves effectively identify zones of perceptual stability, cognitive transition, and ambiguity, which are crucial for understanding both human behavior and the potential mismatches that may arise when applying COLREGs in mixed human autonomous navigation environments.
4. Discussion
This section presents the modeling results in structured subsections, each focusing on a different aspect of navigator awareness and its structural patterns across encounter angles. The subsections proceed from raw distribution summaries to fitted curves, followed by polynomial trend modeling and applied implications.
4.1. Interpretation of Awareness Transitions Across Encounter Angles
The Gaussian curve fitting results show that navigator awareness varies probabilistically across encounter angles, rather than conforming strictly to COLREGs-defined categories. In the HC sector (006–012°), the awareness center (
μ) increases sharply, and the cognitive variability (
σ) peaks at 010°, indicating a cognitive transition zone with low consensus and interpretive instability. Similarly, in the OC sector (100–160°),
μ remains stable until 130°, but declines thereafter, while
σ increases near 160°, reflecting growing ambiguity as interpretations shift from crossing to overtaking. These transition patterns are clearly visualized in the polynomial fits in
Figure 5 and are supported by high R
2 values across fitted functions (
Table 2).
4.2. Angle Implications for Mixed Human–Autonomous Navigation Environments
The increasing presence of MASS raises challenges for shared navigation environments. Human navigators form situational awareness through perception, experience, and flexible judgment, while autonomous systems rely on deterministic rules. This creates cognitive asymmetry in mixed operations. The awareness curves modeled in this study offer a probabilistic middle layer between rule definitions and behavioral responses. Recognizing such a layer is essential for reducing misalignment, especially in transition zones like 006–012° (HC) and 150–160° (OC). By integrating these probabilistic models into MASS decision logic, autonomous ships can better anticipate human behavior and coordinate actions accordingly.
4.3. Cognitive Ambiguity and Safety-Oriented Judgments
In angles where
σ is high—particularly around 010° in HC and 160° in the OC navigator—responses suggest cognitive ambiguity. Rather than following strict rule interpretations, many navigators appear to choose conservative judgments, such as interpreting ambiguous OC situations as overtaking to minimize perceived risk. This reflects a risk-averse strategy under uncertainty [
2,
27]. By identifying such behavior patterns, awareness modeling can support training programs and system designs that align with real decision tendencies.
4.4. Towards Awareness-Based Collision Avoidance Frameworks
The findings support three key applications. First, the observed drift of OC interpretations beyond 135° suggests a disconnect between formal COLREGs boundaries and real navigator understanding, supporting calls for updated rule frameworks [
28,
29]. Second, awareness-based indicators, such as elevated
σ values, can assist VTS operators in identifying ambiguous situations and applying supplementary caution [
30,
31]. Third, MASS systems can incorporate awareness functions to emulate human interpretive behavior, particularly near category boundaries. As shown in
Figure 6, the extended awareness zones identified in this study reflect how navigators perceive situations in practice—not just how regulations define them.
For practical integration, MASS systems could embed the awareness functions as a soft constraint layer within their COLREGs compliance modules, enabling them to anticipate human behavior near category boundaries. For example, if awareness variability is detected around 160° (OC), the autonomous ship may delay maneuvers or request clarification via VHF. Likewise, VTS centers can use awareness-based heatmaps to monitor cognitive ambiguity zones in real time, allocating more oversight to encounters occurring in angular ranges with high navigator disagreement (e.g., σ > 0.7). These implementation pathways offer a pragmatic bridge between probabilistic human modeling and operational maritime safety systems.
5. Conclusions
This study proposed a probabilistic awareness modeling framework to analyze how human navigators interpret ambiguous encounter situations under COLREGs. By applying Gaussian curve fitting and structural modeling to survey data collected from licensed navigators, the study identified angular regions where situational awareness transitions occur gradually, with varying degrees of uncertainty and disagreement. The results showed that in both the HC and OC sectors, navigator awareness is not strictly aligned with COLREGs-defined thresholds. Instead, awareness transitions were found near 010° and 160°, accompanied by increased standard deviations indicating zones of cognitive instability. These findings emphasize that rule interpretation is shaped not only by regulation, but also by context, perception, and individual experience. The awareness-based modeling approach offers practical implications for autonomous ship design, human navigator training, and the enhancement of real time maritime traffic support systems. In particular, incorporating probabilistic awareness functions into MASS algorithms can help predict human behavior more accurately in shared environments, reducing the likelihood of misaligned intentions and potential collisions. The interpretation of COLREGs may vary across regions due to differences in training, language, and navigational practices. While the model is based on controlled scenario data, future research should explore its application to real time data sources, such as AIS or simulator experiments, to further validate and refine its applicability. Extending the approach to more diverse encounter geometries and navigational contexts will also improve generalizability. This study is limited by its use of subjective survey data and a discrete set of angles. Future work should include real-time validation, more diverse encounter geometries, and cross-regional comparison. Ultimately, this research contributes to a better understanding of how navigators perceive rule-based situations and demonstrates the value of awareness modeling as a bridge between regulation and real-world operational behavior.


