Article

Acoustic Measurements and Simulations on Yachts: An Evaluation of Airborne Sound Insulation

1
Department of Energy, Systems, Territory and Constructions Engineering (DESTeC), University of Pisa, 56126 Pisa, Italy
2
Department of Industrial and Civil Engineering (DICI), University of Pisa, 56126 Pisa, Italy
3
Department of Physics “Enrico Fermi” (DF), University of Pisa, 56127 Pisa, Italy
*
Author to whom correspondence should be addressed.
J. Mar. Sci. Eng. 2025, 13(5), 988; https://doi.org/10.3390/jmse13050988
Submission received: 1 April 2025 / Revised: 8 May 2025 / Accepted: 16 May 2025 / Published: 20 May 2025
(This article belongs to the Section Ocean Engineering)

Abstract

:
The perceived acoustic comfort on board modern yachts has recently been the subject of specific attention by the most important classification societies, which have issued new guidelines and regulations for the evaluation of noise and vibrations. The evaluation of the acoustic insulation performance of the internal partitions of yachts is, therefore, a very current topic. The estimation of the acoustic performance of internal partitions can be very complex; on the one hand, on-board measurements can be extremely difficult, but on the other hand, manual or software calculation is extremely complex or potentially affected by non-negligible errors, which is also due to the high amount of highly detailed information required. This paper explores the possibility of using simplified models, commonly used in building construction, to determine the acoustic insulation of the internal partitions of yachts in the design phase, without having to resort, even from the beginning, to very advanced calculation tools such as those based on the Finite Elements Method or Statistical Energy Analysis. Using a 44 m yacht as a case study, this paper presents the results of a series of acoustic simulations of single partitions and compares them with the results of an on-board measurement campaign. From the comparison of the obtained results, it was possible to state that the simulations of single partitions (therefore, those not of the whole vessel) can be useful in the design phase to verify compliance with the acoustic requirements requested by the classification societies. Considering that the propagation of sound and vibrations through the structures is a determining factor for the correct acoustic design of the vessel and therefore for the achievement of adequate levels of acoustic comfort, the analysis with simplified models (which consider the single partition) can be extremely useful in the preliminary phase of the design process. Subsequently, starting from the data acquired in the first simulation phase, it is possible to proceed with more complex simulations of specific situations and of the whole vessel.

1. Introduction

A yacht can be defined as a multifunctional vehicle, as well as a living space. Consequently, yacht design is often defined as a careful blend of art and science [1]. This architectural artifact fulfills different tasks and it must be evaluated from different points of view, not only in terms of performance, but also in terms of the design and quality of indoor environments. This approach is even more relevant in the case of superyachts longer than 30 m, where performance is no longer a primary objective and the efforts of the design offices are more focused on on-board comfort and on the esthetic impact of the project [2].
The assessment of comfort on boats concerns aspects of seaworthiness (especially in rough sea conditions) [3], the perception of the environment in terms of exposure to environmental factors [1] similarly to how it occurs in building environments [4,5], and esthetics [6]. Liu et al., 2024 [7] studied the comfort perceived in ship cabins, and they proposed a comprehensive comfort indicator that considered the simultaneous effects of the thermal, sound, vibration, and lighting environments. Among the miscellaneous criteria of global comfort (lighting, ergonomics, temperature, etc.), Goujard et al., 2005 [8] stated that acoustics appeared to be the most significant criterion. Furthermore, the influence of acoustic discomfort can produce sleep disturbance and irritation. Another relevant aspect relating to acoustic performance, and, in particular, to acoustic insulation, concerns privacy, which is an important indicator of the quality of the yacht due to its very close and small living spaces. Neither guests or owners do not want someone hear their conversations, other noises, or vibrations inside the cabins [9]. It is important to remember that noise on board ships is an issue not only for passengers but also for crew [10].
The study of noise propagation in boats is very complicated and is still a subject of research and development. Prato et al., 2023 [11] studied a new procedure to determine, in the laboratory, the transmission loss of airborne sound from ship bulkheads, where a low frequency (50–80 Hz) modal approach was used. Bocanegra et al., 2023, analyzed an extensive number of noise records from the literature and on-board measurements and identified the main characteristics of shipborne noises [12]. Borelli et al. [13] conducted acoustic measurements on a Ro-Pax ferry in navigation and maneuvering in order to evaluate the perceived acoustic climates in various areas of the vessel and the influence of ventilation systems on the perceived acoustic comfort in the cabins. Liu et al., 2023 [14] investigated the relationship between noise and vibrations and the acoustic comfort perceived by the crew and guests of a yacht using measurements and the administration of questionnaires, paying particular attention to the passenger cabin, the crew cabin, and the dining cabin.
The comfort level perceived on board modern yachts has recently been the object of specific attention by the more important classification societies, which issued new rules and regulations for the evaluation of noise and vibration [15]. Furthermore, it should be considered that, in luxury yachts, the expectations regarding acoustic quality can be even higher than the criteria established by the classification societies [16]. Due to the classification schemes introduced by the classification societies, the evaluation of the acoustic insulation performance of a yacht’s internal partitions represents a very topical issue [17]. Estimating the acoustic performance of interior partitions is not easy; if, on the one hand, the measurements on board can be extremely difficult, on the other hand, the calculation by hand or by using software is extremely complex and is potentially affected by non-negligible errors. The complexity of the measurements is due to the characteristics of the internal environments of the boats (dimensions, definition of the boundary walls between two environments, etc.). Acoustic simulations of the structure performance can concern the behavior of the boat as a whole or the performance of individual partitions. The first (boat as a whole) are certainly more complex and allow for a greater level of detail; however, they require high computing power and a very accurate knowledge of all of the boat’s details. The latter (single partitions) are mostly used in other sectors, such as in building construction, and they allow us, in a more rapid way, to determine the acoustic performance indicators using only the information related to stratigraphy and to the materials used in the single partition and not to the propagation of noise through the structures. As stated in [18], since it is always very complex to correctly identify and model the sources due to their deterministic and random nature, during the early design phases, the focus is generally on isolation rather than on reducing the noise levels of the sources themselves.
The results from the single partition, although not exhaustive of the actual acoustic performance of the boat, also may be particularly useful in the design phase for the purpose of determining specific performance indicators (e.g., weighted airborne sound insulation) and verifying the fulfillment of the requirements imposed by the classification societies’ guidelines. In any case, it is important to highlight that the evaluation of the sound insulation of the partitions represents a first step in the acoustic design of the vessel, but is not sufficient to guarantee adequate levels of acoustic comfort. In fact, it is necessary to consider the mechanisms of propagation of the borne noise structures that, in vessels, represent a very important aspect, since the structures are typically light and are composed—at least in part—of materials with low damping (e.g., steel, aluminum, or fiberglass).
The aim of this paper is to evaluate the possibility of determining the acoustic insulation characteristics of the internal partitions of yachts (bulkheads) in the design stage by means of acoustic simulations without resorting to very advanced calculation tools such as those based on the Finite Element Method. The presented activity, therefore, concerns a comparison between the results of acoustic simulations and on-board measurements of the sound insulation of the internal partitions of the yacht used here as a case study. The results obtained are compared and discussed to highlight their strengths and weaknesses.

2. Materials and Methods

2.1. Comfort Classes for Yachts

At the international level of the nautical sector, a group of associations called classification societies, which belong to the International Association of the Classification Societies (IACS), have recently published the updated of the guidelines “Comfort Class Rules” for the assessment of acoustic and vibratory comfort in ships [19,20,21,22,23]. These guidelines introduce criteria that make it possible to evaluate the comfort level in a yacht in relation to its environmental aspects and vibrations and noise on board, both during navigation and at harbor.
The IACS Comfort Rules guidelines considered in this paper are those published by the American Bureau of Shipping (ABS, Houston, TX, USA), the Bureau Veritas (BV, Neuilly-sur-Seine, France), the Det Norske Veritas (DGN GL, Oslo, Norway), the Lloyd’s Register (LR, London, UK), and the Registro Italiano Navale (RINA, Genoa, Italy). Although the IACS “Comfort Class Rules” guidelines specify requirements for different types of vessels, this article reports and discusses the requirements for yachts only. All of these guidelines introduce limit values of the weighted equivalent sound level of continuous exposure (LAeq) for various interiors of the yacht, as well as indications of the acoustic insulation performance of internal partitions.
The American Bureau of Shipping (ABS) published, in 2019, the last version of the “Guide for Comfort on Yacht” [19]. This guide provides instructions for the evaluation of the perceived comfort of passengers (owner and guests) in cabins, dining rooms, lounges, cocktail bars, and other indoor or outdoor spaces by establishing two levels of comfort called Comfort-Yacht (COMF(Y)) and Comfort Plus-Yacht (COMF+(Y)). The criteria for evaluating comfort are divided into vessels of shorter length and vessels longer than 50 m. The guide also provides the limit values of the weighted airborne sound insulation index (Rw) that must be satisfied by bulkheads and decks (Table 1).
In 2025, the Bureau Veritas (BV) released the last version of “NR 467—Rules for classification of steel ships” [20], in which Chapter 6, “Comfort on board and Habitability”, of Part F, “Additional Class Notations”, is specifically focused on the acoustic comfort on ships. The comfort criteria are indicated in relation to noise (COMF-NOISE) and vibration (COMF-VIB). In this document, three levels of comfort, from 1 (highest) to 3 (lowest), are defined. The acoustic requirements are indicated in relation to three categories of boats specified in the guide: ships of less than 1600 GT, such as fishing boats, tugs, and small passenger ships; ships greater than or equal to 1600 GT, such as oil tankers, container ships, large fishing vessels, cruise ships, and ferries; and yachts. The limit values of the apparent weighted sound insulation indexes (Rw) for bulkheads that separate rooms and areas for both passenger and crew areas are shown in Table 2. Finally, in the latest version, a new section has been added (Part F, Chapter 6, Section 6) which indicates the requirements for crew accommodation and recreational facilities with regard to accommodation design, vibrations, noise, internal climate, and lighting.
The DNV GL 2021 “Rules for classification-Ships” [21] provides a guide to the acoustic class notation (COMF (V)), which includes requirements for the noise levels, vibration levels, and performance of the on-board HVAC system for passenger or cargo ships, yachts, high-speed vessels, and vessels of lightweight craftsmanship. For these different categories of ships, three different comfort levels are introduced in two conditions of use: yachts in harbor and yachts at sea. Each of the three comfort levels are identified with a comfort rating number (crn). Unlike the other rules, the insulation requirements of the inner partitions are provided in relation to the room typology (rooms for crew and passenger areas) and not in relation to the boat type. The required values of the apparent weighted airborne sound insulation indexes are reported in Table 2.
In 2021, the Lloyd’s Register of Shipping (LR) published the “Rules and regulations for the Classification of Special Service Crafts” [22]. Chapter 6 of Part 3 of this document is centered on the “Comfort of passenger and crew accommodation”, and, in Section 2, acoustic requirements are provided. These rules provide distinct application to two different groups of vessels: high-speed vessels (e.g., surface effect vessels, catamarans, hydrofoils) and yachts (e.g., sailing yachts, motor pleasure craft). Furthermore, they allow for two alternative classification systems:
  • Class annotations, which serve to certify that the vessel complies with noise and vibration criteria and are subject to a periodic inspection regime.
  • Compliance certificates, which serve to certify that the vessel complies with the noise and vibration criteria.
The LR rules introduced three different comfort class notations according to the type of occupants of the analyzed area. In more detail, the three class notations are as follows: “Passenger Accommodation Comfort” (PAC), “Crew Accommodation Comfort” (CAC), and “Passenger and Crew Accommodation Comfort” (PCAC). If a space is occupied by both the passengers and the crew, the most restrictive provisions are applied, unless otherwise agreed between the manufacturer and the owner and communicated to LR.
All of the acoustic requirements are indicated for three different classes called “acceptance numbers” from 1 to 3. The guide indicates the minimum values of Rw for the partitions between the occupied areas (e.g., cabins, public places, stairs, corridors, etc.) that are shown in Table 2.
In 2025, RINA published the last update of the “Rules for the Classification of Yacht” [23]. The acoustic requirements for the comfort of passengers and crew on yachts are given in Chapters 4 (Comfort on Board—COMF(Y)) and 10 (Comfort Large Yacht—COMF(LY)) in Part E, “Additional Class Notations”. Furthermore, for yachts longer than 60 m, similarly to the LR rules, the RINA rules introduce three class notations for the passengers’ area (COMF LY PAX), crew areas (COMF LY CREW), and for areas used by both passengers and crew (COMPLY PACR) with acoustic requirements in terms of both noise exposure and acoustic insulation. On the contrary, for yachts no longer than 60 m, the RINA rules introduced the COMF (Y) class notation, which is simpler and provides only some limitations on airborne sound insulation limit values. The RINA acoustic requirements establish the acceptance limits of noise exposure on board, the acceptance criteria, and the compliance evaluation methods. Unlike the other guidelines described in this paper, the RINA rules classify the acoustic performance according to two levels: A and B. In Table 2, the limit values for yacht with a length equal or greater to 60 m are provided, because such limits are more exhaustive than those for smaller yachts.

2.2. Procedure

To evaluate the possibility of determining the weighted sound reduction of the inner bulkheads of the boats by means of simulations, the following procedure was followed.
1.
Selection of a boat to be used as a case study. It was necessary to have a boat already set up, for which the distribution diagrams and technical specifications of the internal structures were available and on which it was possible to carry out measurements on board.
2.
Analysis of the layout of the decks, identification of the most important (from the acoustic comfort point of view) spaces and, consequently, the stratigraphy of the related bulkheads and the properties of the used materials.
3.
Calculation of the weighted sound reduction index with the use of simulation software by modeling the stratigraphy provided by the manufacturer and the related materials.
4.
On-board measurements of the weighted sound reduction index of the boat’s internal bulkheads using the measurement procedures typically used in construction.
5.
Analysis and comparison of the results obtained using the simulations and measurements on board.
6.
Identification of any critical and problematic aspects encountered in the comparison between the simulations and measurements on board and the performance of the acoustic measurements obtained using an acoustic camera.

3. Case Study

The vessel under study is a four-deck yacht with a length of 44 m. The maximum height of the hull is 9 m and the maximum draft is 2.30 m. The hull is made of fiberglass and has a gross tonnage of 469 tons. Overall, the yacht has five cabins for ten guests and five cabins for a crew of eight people plus the captain. On the main deck (Figure 1, left), there is the owner’s cabin/suite (MC—master cabin), which includes the toilet and an accessory room for a fitness and yoga area or study or meeting area, the galley (G), and a large living area (MS—main saloon). On the lower deck (Figure 1, right), there are the crew cabins (CC), two VIP cabins (C1, C2), and two standard cabins (C3, C4) for guests, the engine room (EG), the garage for tender and jet ski, and a large solarium area. On the upper deck, starting from the bow, there is a solarium area, the control room, the captain’s cabin, and a covered seating area (lounge). On the sun deck, there is a solarium area and an indoor seating area (lounge).
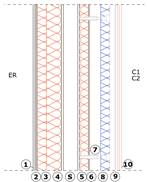
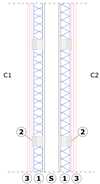
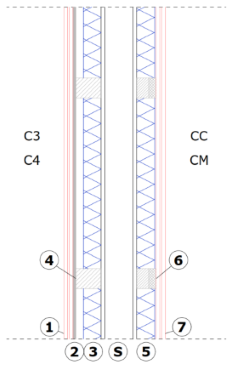
The internal partitions (bulkheads) are all composed of a supporting structure in fiberglass reinforced with PVC (GRP with PVC core) with a thickness of 44 mm; then, depending on the type of environments they separate, different types of insulation and surface finishes are used. In more detail, the cladding layer facing the cabins is made of composite panels wood–rubber cork–wood with a total thickness of 22 mm, the cladding layer facing the galley is a simple wood panel, and the cladding layer facing the engine room is composed of a sheet in aluminum and polyethylene. The use of a metallic layer is due to the need to guarantee fire safety; for the same purpose, all of the used insulation materials (both mineral wool and fiberglass) are fireproof. The connection systems of the various layers are different depending on the expected acoustic insulation performance. The stratigraphy is represented and comprehensively described in Table 3.

4. Application of the Proposed Procedure to the Case Study

4.1. Determination of Apparent Weighted Sound Reduction Index (R′w)

The weighted sound reduction of the internal partitions of the yacht used as a case study were obtained with the use a simulation software, and then the contribution of flanking was considered by using table data as a function of the surface mass of the partitions that divide the spaces and the type of connection between the partitions. The software used for calculating the weighted sound reduction index of the yacht’s internal partitions was INSUL v.9.0, developed and commercialized by “MARSHALL DAY Acoustics”. This software allows for the calculation of the weighted sound reduction indexes for both single panels and double panels composed of several layers. INSUL v.9.0 is based on the theoretical framework reported in [24,25,26,27], and it represents a compromise solution between the overly simplified manual calculation (especially for light multilayer partitions, such as those analyzed in this activity) and the calculation with Finite Element softwares that potentially allows for high-precision analyses but requires, for reliable results, the detailed knowledge of all elements that make up each single structure, as well as much higher computing power.
In this case, as we did not have enough information to model all or part of the boat, a software that would allow for detailed modeling of the single internal partition was preferred, making it possible to determine the acoustic insulation performance of the bulkheads and potentially identify improvements. This modeling is in accordance with the planned research activity aimed at obtaining the sound reduction requirements of the boat’s internal structures. INSUL v.9.0 is equipped with a “material editor” that allows us to manually insert materials with specific technical characteristics starting from existing material types (i.e., insulation materials) or creating new materials by inserting the physical characteristics, such as thermal behavior (isotropic or orthotropic, with elastic core or inelastic), density, Young modulus, damping or loss factor, and anisotropic ratio.
This software allows us to determine the weighted sound reduction index of the vertical partitions; however, in order to compare these results with those obtained using on-board measurements, it was necessary to calculate the apparent weighted sound reduction indexes and then determine the flanking contributions.
In order to determine the flanking (K′), several simplified methods are proposed in the literature. The most common simplified methods are collected in the Technical Standard UNI/TR 11175 [28,29]. Such methods are based on the assumption that the overall transmission of sound power between two environments is the result of the sum of the power transmissions through different independent transmission paths. Furthermore, the sound and vibratory fields that are established, respectively, in the environments and in the structures for each path are diffuse. These methods derive from experience mainly achieved in the construction sector; however, the application of the principle of superimposition of effects is applicable with reasonable approximation to most situations encountered in practice. It should be noted that the calculation models and technical solutions proposed in UNI/TR 11175 [28,29] have been developed on the basis of experimental data and defined for buildings, and these models can also be applied in other conditions as long as the construction systems and the dimensions of the elements that compose them are not very different from those typical of residential buildings. Even in the case of the early design stage, in which the evaluations may therefore present uncertainty, application to the marine sector can therefore present some critical issues. If, on the one hand, the internal structures of the boats can be assimilated as light multilayer structures, on the other hand, great attention must be paid to the materials and the technical solutions used. Table 4 shows the characteristics of the materials used in the analyzed stratigraphies necessary for the simulations with the INSUL v.9.0 software. The reported data were obtained partly from the technical datasheets of the materials used in the construction of the yacht and partly from the literature data [30,31], as well as from the INSUL v.9.0 software manual.
For the evaluation of the contribution of the flanking, and, therefore, for the determination of Rw for the partitions of the yacht, method B of the UNI/TR 11175 [28,29] standard was chosen. This method assumes that all of the lateral structures and the partition object of analysis are homogeneous and that all of the quantities used to determine Rw can be calculated according to the surface masses (masses per unit of area) M′ only. The apparent weighted sound reduction index (Rw) is obtained by subtracting the flanking contribution (K′) from the weighted sound reduction index (Rw); see Equation (1):
Rw = RwK
The values of K′ are obtained from the tables provided in the standard according to the type of joint between the partition and the lateral structures and the average surface mass of both. In this paper, Table A8 of UNI/TR 11175 [28,29] was used. Such a Table refers to homogeneous rigidly connected structures and T-joints.
In the case of boat partitions, the surface masses are generally around 50 kg/m2 for both vertical and horizontal partitions. In this condition, the overall contribution of flanking transmission can be considered equal to 3 dB, similar to what is indicated in [28,29] for all the different combinations with partition and lateral structures with the same surface mass.

4.2. Measurement of Apparent Weighted Sound Reduction Index (R′w)

The measurements for evaluating the acoustic insulation of internal partitions were carried out according to the Technical Standard EN ISO 16283-1 [32], which indicates that the airborne sound insulation of the internal partitions must be determined by means of sound pressure level measurements. It is important to highlight that the Technical Standard ISO 16283-1 [32] specifically concerns field measurements of sound insulation in buildings and building elements. The procedures introduced in [32] are intended for room volumes in the range from 10 m3 to 250 m3, and the results can be used to quantify, assess and compare the airborne sound insulation in unfurnished or furnished rooms where the sound field may or may not approximate to a diffuse field. In the marine environment, however, it is necessary to consider the greater complexity of the layout of the rooms, the technical solutions employed and, therefore, the methods of sound transmission. During the measurement activities, for example, great attention was paid to the choice of the partitions to be assessed, analyzing, from time-to-time, which rooms the partition bordered, its regularity, which volumes were involved, and which were the adjacent rooms, as shown in [33].
The EN ISO 16283-1 [32] states that the measurements are used to determine the average sound pressure level in the central area of the emitting room and in the receiving room and the background noise level in the receiving room. Sound must be generated in the source room using sound sources (speakers) operated simultaneously in at least two positions or a single source placed in at least two positions. The sound source must be placed at no less than 0.5 m from the walls of the room and no less than 1.0 m from the separation partition being evaluated.
Regarding microphone positions, when using a single speaker, at least five of them must be used in each room and for each speaker position (the additional sets of microphone positions may differ from the first set of positions). Each set of microphone positions must be distributed within the maximum space allowed in each room. There must not be any microphone positions on the same plane with respect to the edges of the room.
Procedurally, it is necessary to measure the sound pressure level in both the source and the receiving room for the first position of the loudspeaker, after which, it is necessary to calculate the average sound pressure level in the two rooms (emitter and receiver) and make the necessary corrections for the background noise.
For each sound source position, it is necessary to calculate the difference in sound level normalized using Equations (2) and (3).
D = L1L2
DnT = D + 10log (T/T0)
where:
  • D is the difference in the sound pressure level (dB).
  • L1 and L2 are sound pressure levels (dB) in the emitting room and in the receiving room, respectively.
  • T is the reverberation time in the receiving room (s).
  • T0 is the reference reverberation time (s) which, for the lived enclosed environment, is equal to 0.5 s.
Then, the procedure must be repeated for all positions of the sound source; then, it is necessary to calculate the standardized difference level using Equation (4)
D n T = 10   l o g 1 m j = 1 m 10 D n T , j / 10
where DnT,j is the standardized difference level for the j-th position of the sound source (dB) and m is the sound source position number.
The DnT values obtained for the bulkhead must be converted in apparent weighted sound reduction indexes. As indicated in the Technical Standard EN ISO 16283-1 [23], that can be obtained with Equation (5), considering the dimensions of the common surfaces and volumes of the rooms. The associated uncertainties are in the order of mm and are, therefore, much lower than the other uncertainties involved.
R w = D n T , w + 10 × log S T o 0.16 V
According to the ISO 16283-1:2014 [32], the differences in the measured sound pressure levels (Equation (3)) have been standardized with the reverberation time of the receiving room. The measurements of the reverberation times were carried out according to the procedure introduced by the Technical Standard ISO 3382-2:2008 [34]. Given the small size of the rooms and the rapid decay in the noise saturation level, T20 measurements were always carried out. This was performed by placing the omnidirectional sound source in one or more points of the room and measuring the sound pressure at different points. Interrupted noise was used as the noise type. Particular attention was paid to not following a standard pattern in the arrangement of the sound level meter microphone. In Table 5, the number of the source positions and the respective number of sound level meter positions for measuring the reverberation time of the analyzed environments is shown. For completeness, in Table 6, for each measurement activity of the difference in sound pressure levels, the number of sound level meter microphone positions, the number of source positions, and the number of background noise measurements are reported.
Further information on the measurement setup and on the specific measurement conditions in each analyzed environment can be found in [33].

Measurement Instruments

The measurement instruments made available by the Department of Physics of the University of Pisa and used to measure the acoustic performance of the yacht used as a case study included the following:
  • A sound meter 01dB Fusion, model 11021 (Acoem, Limonest, France), and certificate of calibration LAT 068 47704-A, with microphone preamp 01dB Pre22, model 1605118, and microphone 01dB, model 226229.
  • An omnidirectional sound source with Norsonic power amplifier 260 (23364) and speaker 229 (Norsonic, Tramby, Norway).
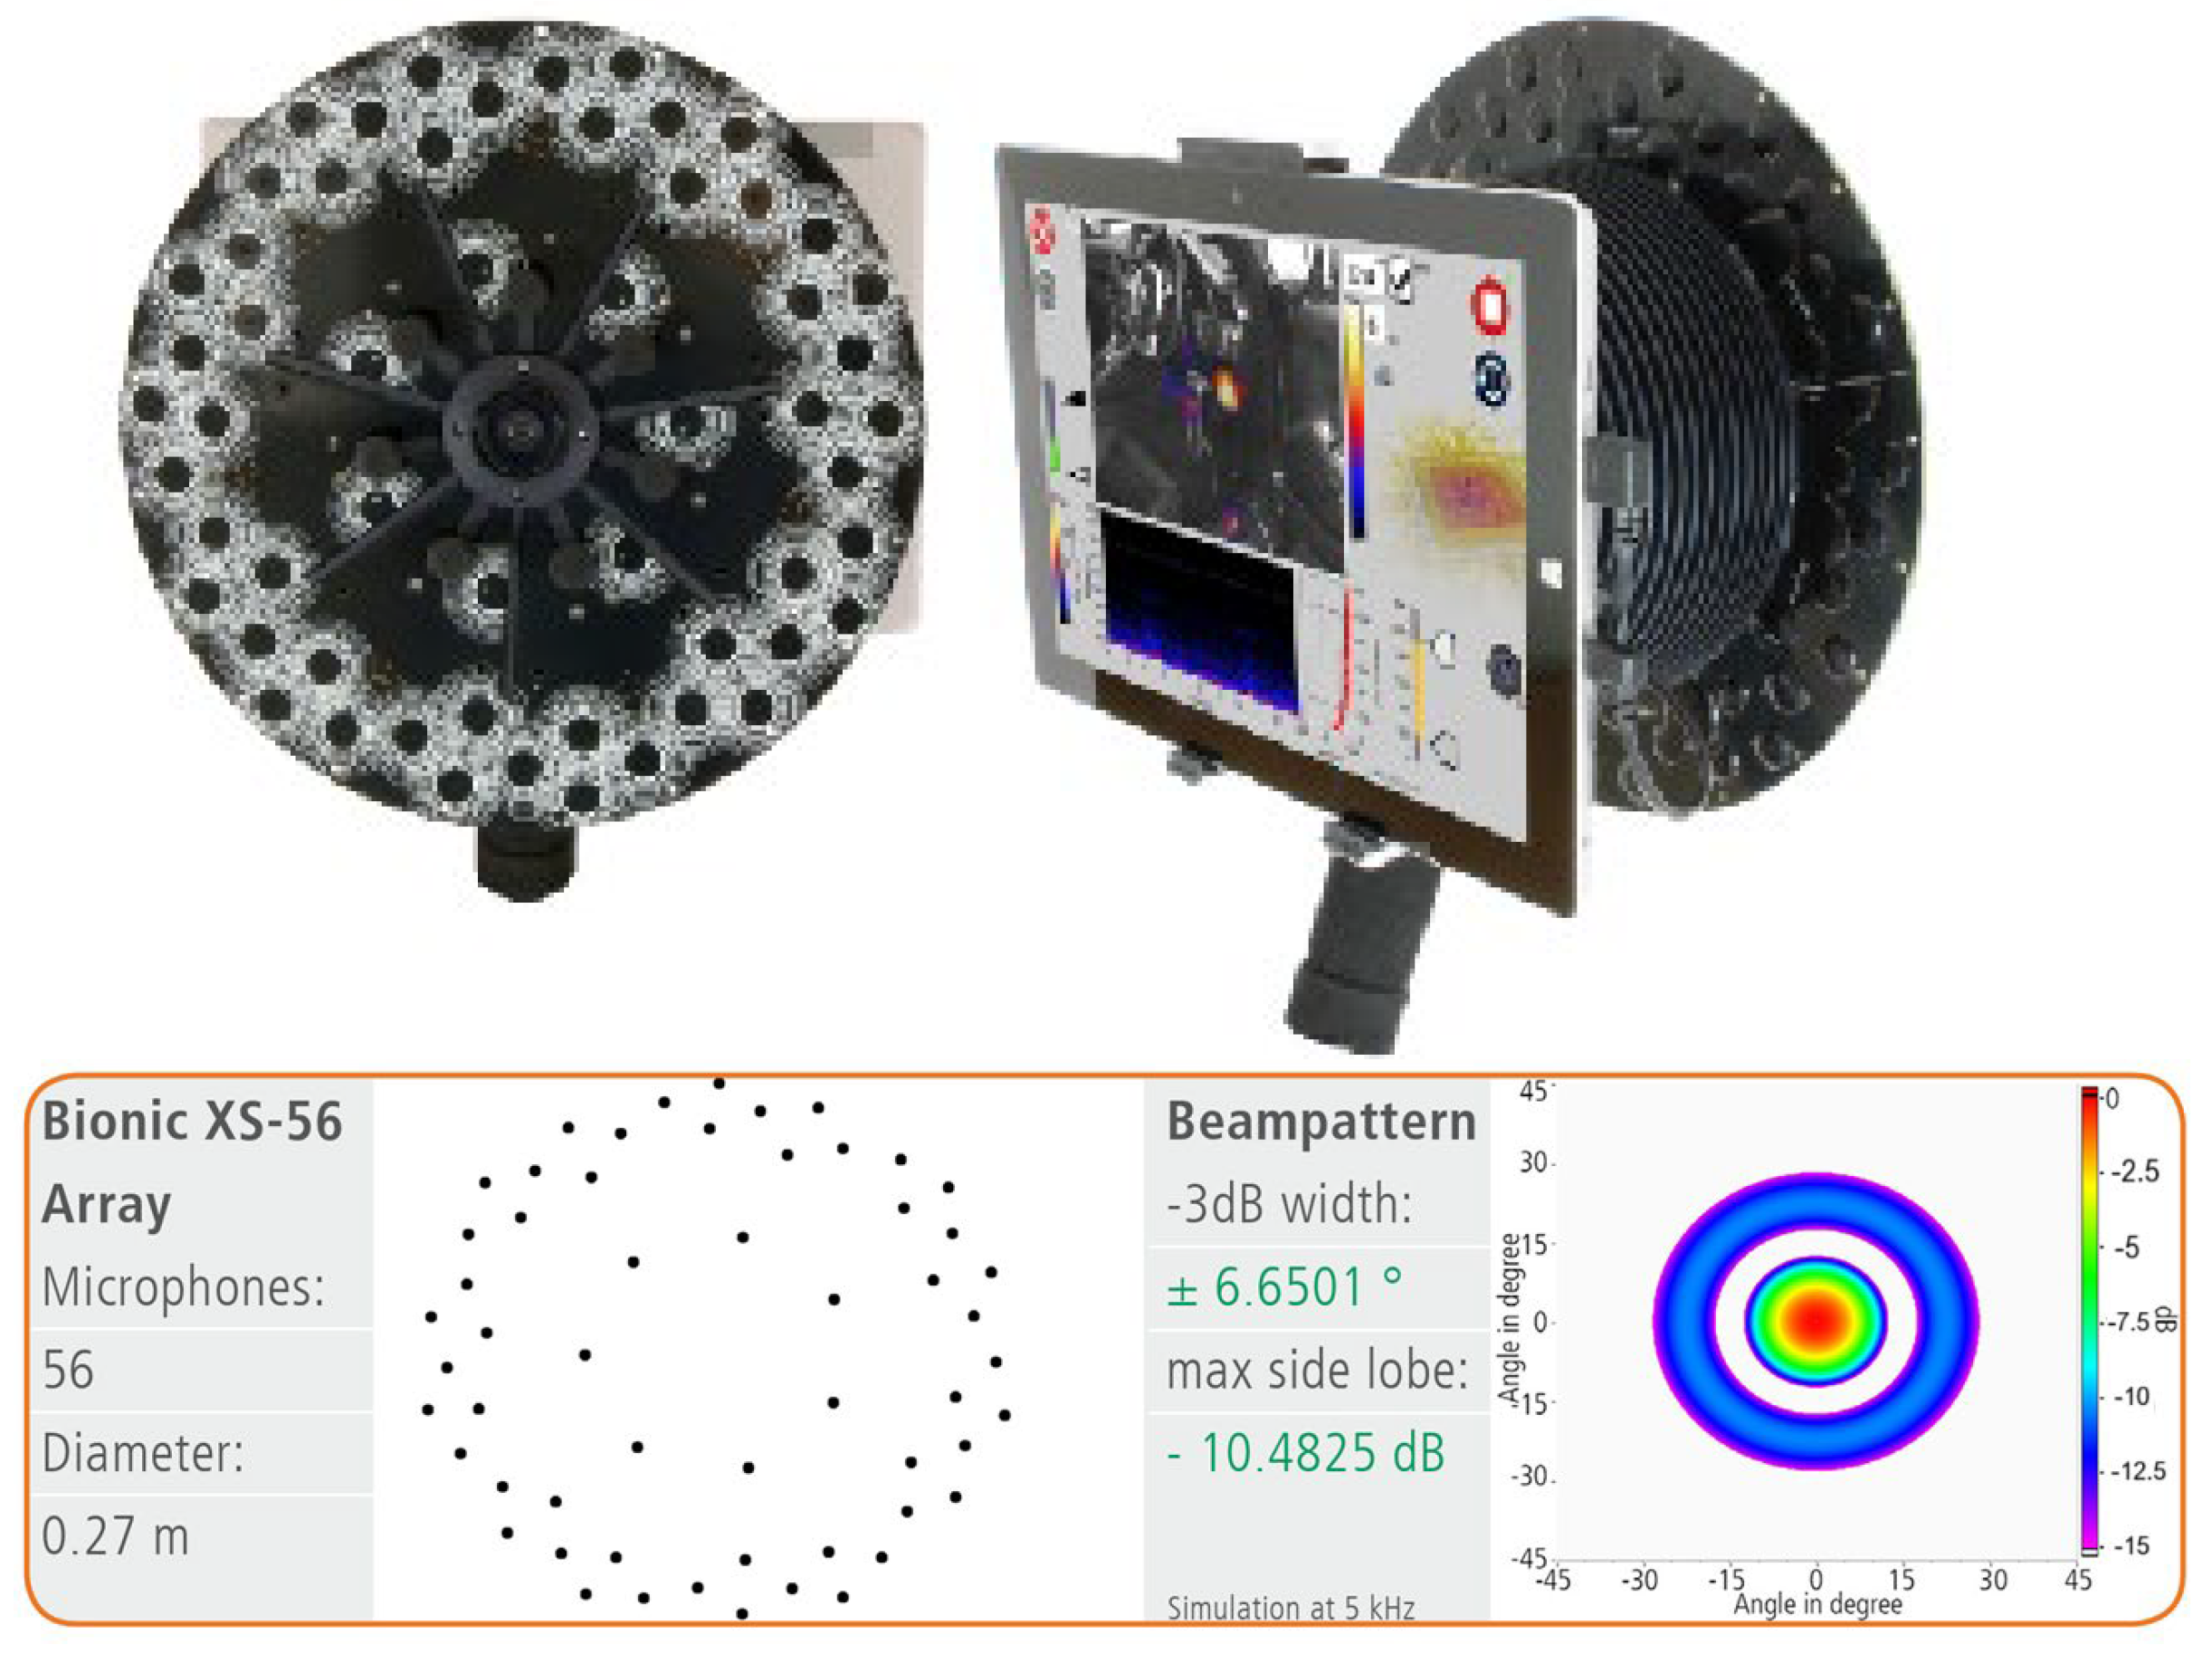
In order to analyze any critical aspects highlighted by the comparison between simulations and on-board measurements, an acoustic camera was used. This measurement instrument was used to identify any “noise leaks” due to possible defects in the construction of the dividing surface or to specific design requirements (for example, in terms of safety). The acoustic camera is an instrument consisting of a central body and an array of microphones arranged on removable arms, the length of which can be variable depending on the application. In this paper, the acoustic camera from CAE-Systems (CAE Software und Systems GmbH, Gütersloh, Germany.) shown in Figure 1, was used with the arms model XS installed, the dimensions of which are particularly suitable for this specific application (maneuverability within narrow environments). Such an instrument is equipped with 54 microphones arranged on a circular surface with a diameter of 27 cm, and it can be considered effective in locating possible noise sources on the screen with emission frequencies between 1000 and 4000 Hz. The properties of the XS model are reported in Figure 2.
Each acoustic camera measure consists of the acquisition of the signal coming from each microphone and from the camera for a set time duration (generally 5 s). The acoustic signals acquired by each microphone are post-processed using proprietary software that allows for the choice of different signal processing algorithms [35,36,37,38,39,40]. The EigenValue-Optimized Beamforming (EVOB) algorithm was used because, on past experiences, it represents the best solution for this type of application. This algorithm was designed by the company that produces the acoustic cameras. The algorithm was designed starting from functional beamforming with the addition of original coherent components. Further information about the algorithm is not made available by the owner company, neither from a theoretical nor experimental point of view, and, also for this reason, its applications are not available and its use is not widespread in the scientific community [41].

5. Results

5.1. Results of Acoustic Simulations

In this section, all of the results of the simulations are collected. For each analyzed bulkhead, in Table 7, the following characteristics are reported: the thickness of the bulkhead, the mass surface, the values of the weighted sound insulation index, the terms of spectrum adaptation (C, Ctr), the flanking contribution, and the apparent weighted sound insulation index. The terms C and Ctr are useful to correct the values of weighted sound insulation index when it is referred to a specific practical situation. The term C is used when the typical noise source is pink noise and, therefore, it is used to describe noises in indoor environments (living activities such as speech, music, etc.). The term Ctr is used when the noise generally refers to traffic noise; however, in marine environments, it can be considered for noise characterized by higher emissions at low and medium frequencies, such as those that could be produced by some on board technological equipment.
In Figure 3 the sound insulation curves for the analyzed bulkhead is reported.

5.2. Results of On-Board Measurements

The measurements were carried out on the nearly completed yacht and, therefore, had most of the furnishings already installed. In Table 8, the results of the measurements and apparent weighted sound reduction indexes are reported.

6. Discussion

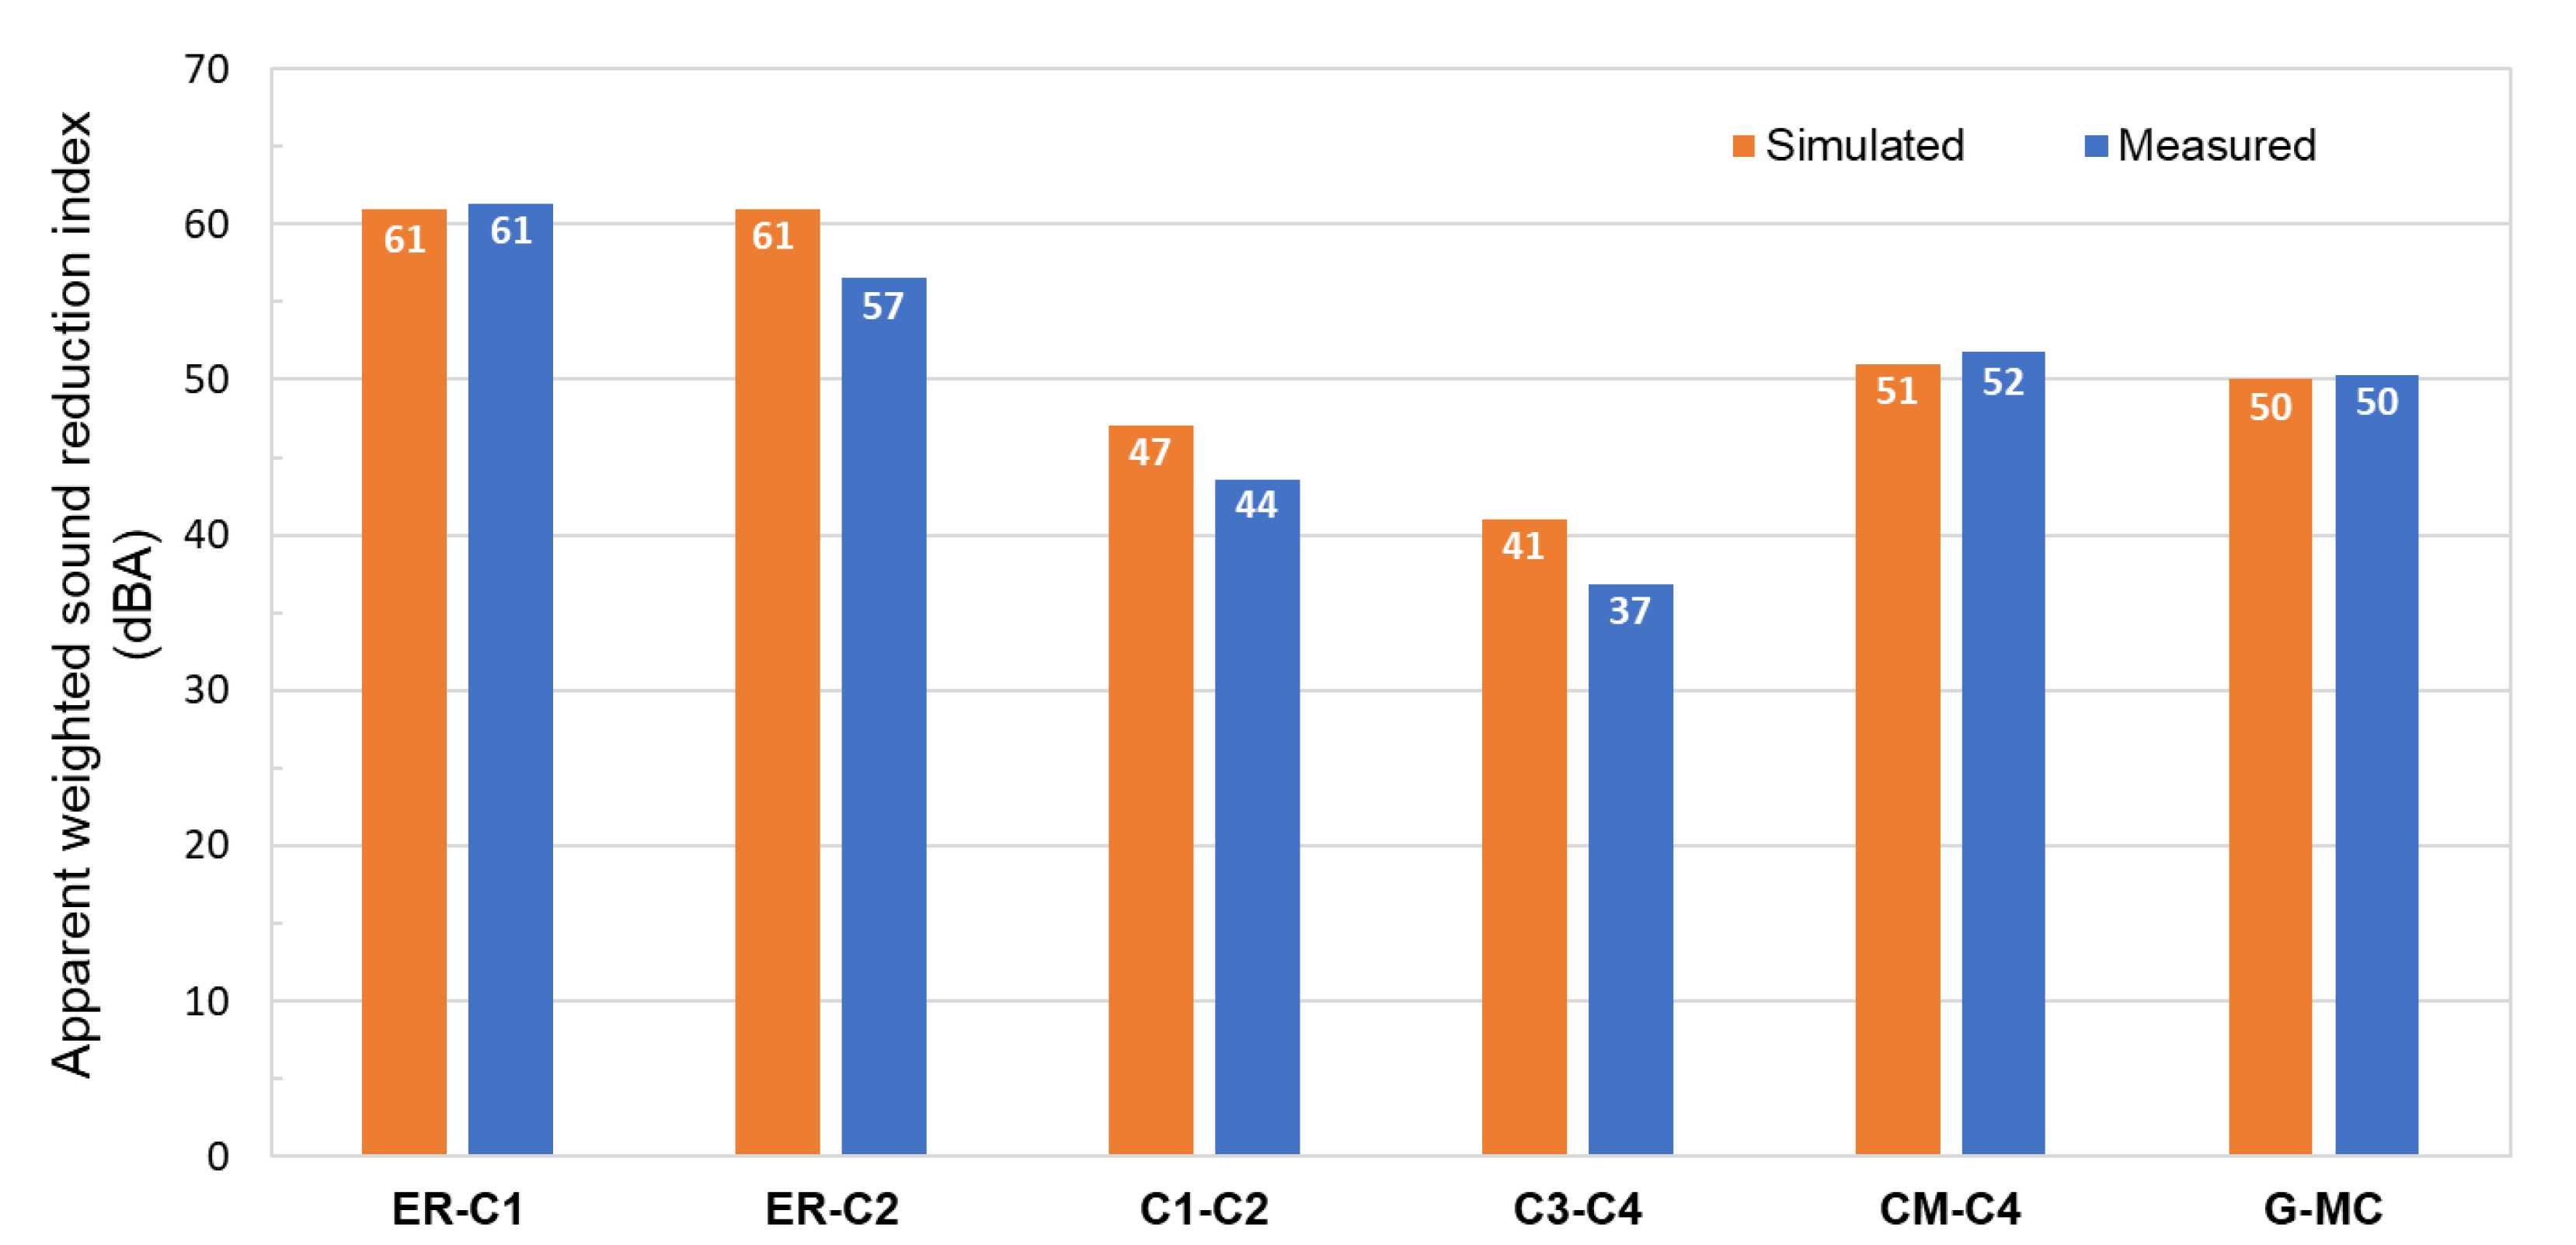
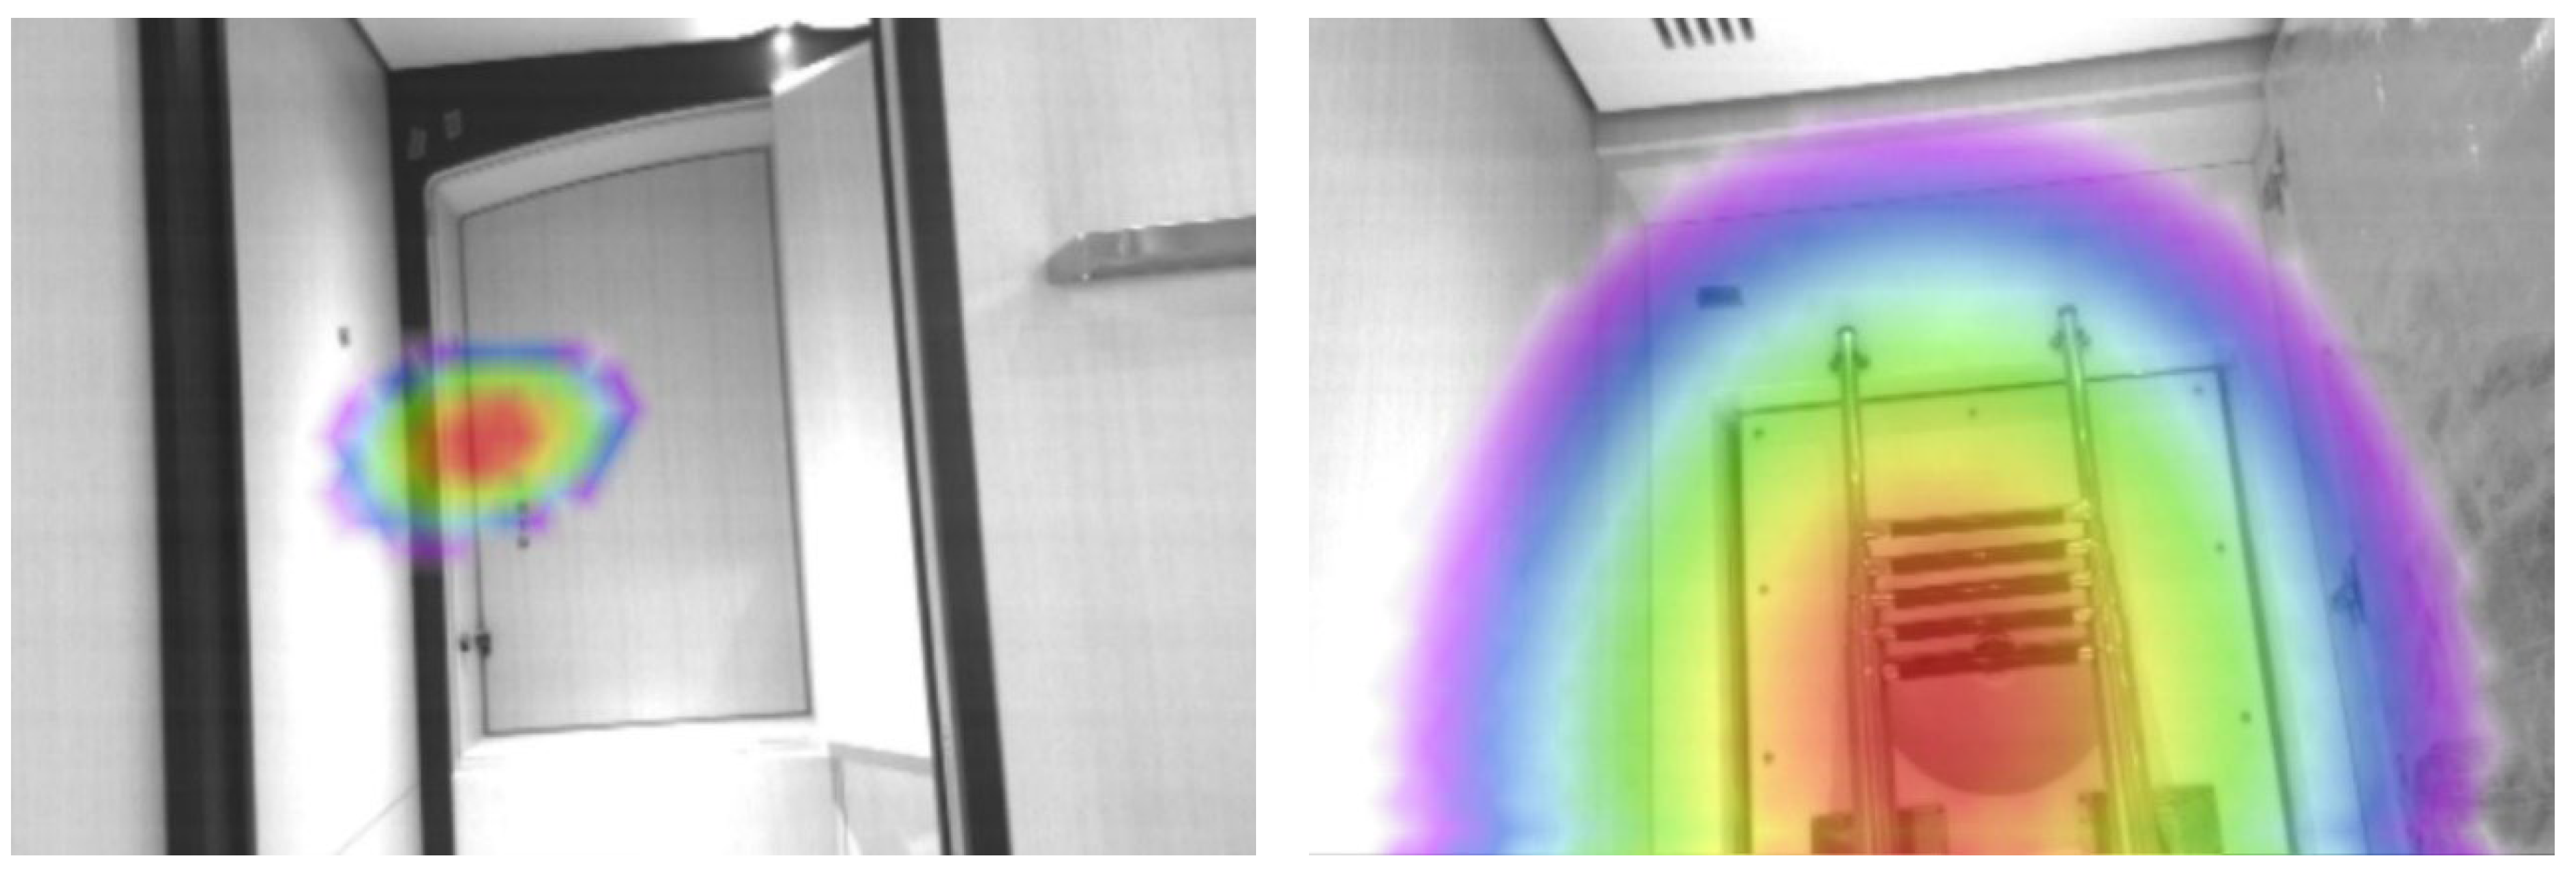
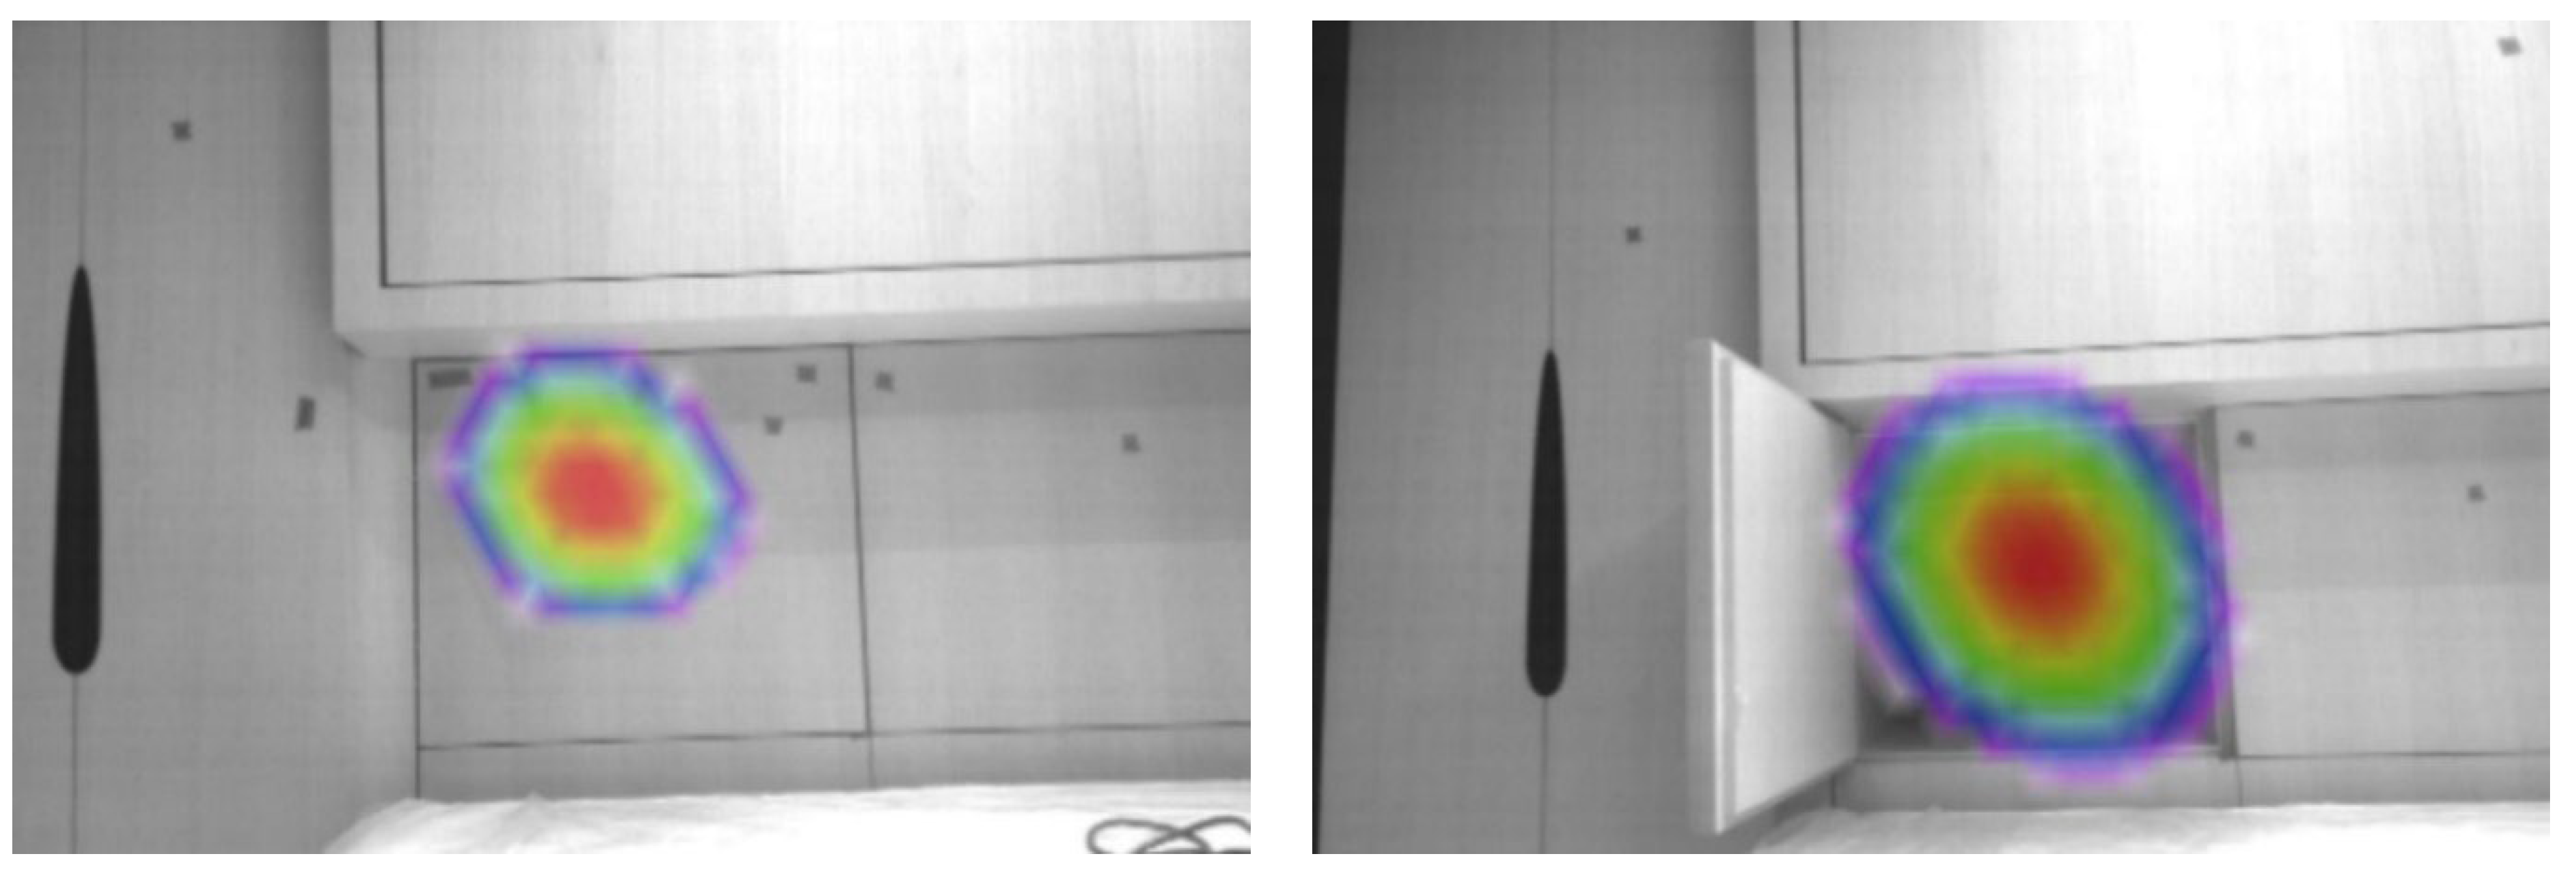
In this section, the results of simulations and on-board measurements are compared and discussed. Figure 4 presents the comparison between measurements and simulations; in particular, it reports the values obtained from on-board measurements and the values calculated or obtained from the simulations and corrected on the reverberation time of the receiving environment. Figure 4 indicates that, in most of the analyzed bulkheads, the difference between the measured and calculated values is less than 2 dB, while greater differences were obtained in the cases of partition walls between the ER and C2 VIP cabin, between the C2 VIP cabin and the C1 VIP cabin, and between the C3 guest cabin and the C4 guest cabin. The analyses of these three cases, supported by the measurements carried out with the acoustic chamber, are reported below.
In the case of a bulkhead between ER and C2, the difference could be due to the presence of a discontinuity element in the portion of the partition between the engine room and the VIP cabin (Figure 5). In fact, there is an emergency hatch that connects the engine room with the bathroom of the C2 VIP cabin. This consideration is confirmed by the fact that the acoustic performance of the same bulkhead in the portion between the ER and C1 VIP cabin resulted in a very small difference between the measured and calculated values.
In the case of bulkheads between the C1 VIP cabin and C2 VIP cabin, it is possible to assume that the overestimation of the values obtained from the simulations are at least partly also due to the measurement conditions. In fact, during the measurements, it was not possible to perfectly seal the transmission paths due to the doors, and this could lead to a reduction in the measured performance. This consideration can also be found in Figure 6, which highlights a preferential acoustic path between the door and the floor covering surface.
In the case of the bulkhead between the C3 and C4 cabins, it should be noted that it is essentially composed of a wardrobe with two integrated bunk beds. In the simulation, the modeling of such an element is particularly difficult. In particular, the bulkhead has a discontinuity of about 40 × 40 cm that represents a sound bridge between the two rooms. This discontinuity is not generally visible because it is covered by the two cabinets integrated with the bulkhead on both sides. This condition is clearly shown in Figure 7.
Finally, the values obtained for the partitions between the VIP cabins (C1–C2) and between the guest cabins (C3–C4) were compared with the reference values of the classification societies’ classifications. From these data, it is possible to observe that, in all cases, there is the loss of at least one class between the calculated value and the measured value (except for the RINA classification for the C1–C2 partition). In fact, all of the apparent weighted sound insulation indexes obtained from the calculation fall into class 1 in all the classification schemes, while the values measured on board fall into class 2 and 3 and, in the case of the partition between the standard cabins (C3–C4), according to the LR classification, the value obtained is lower than that required for class 3. For a better comparison of the simulation and measurements results with the comfort classes, the classifications of the partitions between the VIP cabins (C1–C2) and between the guest cabins (C3–C4) are reported in Figure 8 and Figure 9, respectively.

7. Conclusive Remarks

The comparison between the results of the on-board measurements and the simulations showed how the two survey activities can lead to very close values. The differences obtained highlight how the evaluations carried out with INSUL v.9.0 can be used for a preliminary investigation, but cannot completely replace more detailed investigations/simulations. The acoustic simulation of the stratigraphy of the single bulkhead can be very useful for evaluating the acoustic performance in relation to airborne noise. It is important to consider that this type of simulation does not allow for accounting any discontinuities, nor the transmission through the structures. In a correct acoustic design, after analyzing the acoustic insulation of the bulkheads, it is necessary to consider all of the possible particular cases, such as the discontinuities shown, for example, in the Section 6 Discussion, and elements with behaviors that cannot be assimilated to simplified models. An example of the latter is shown in [42] for windows and glass that have been glued onto recessed metal frames and which, due to the low elastic modulus of the glue, can act as harmonic loudspeakers, creating dangerous phenomena. For these types of evaluation, it is necessary to use more complex models based on the Finite Element Method (FEM) and Statistical Energy Analysis (SEA). Although it should be kept in mind that the propagation of sound and vibrations through structures is a determining factor for the correct acoustic design of the vessel and, therefore, for achieving adequate levels of acoustic comfort, analyses using simplified models (which take into account the behavior of the single partition) can be extremely useful in a preliminary phase of the design process. Afterward, more complex simulations can follow, starting from the data acquired in the first simulation step. The combined use of different models can reduce computational time and cost, focusing the more expensive simulations on specific cases only. This approach can also be preparatory to the subsequent simulation of the complete model of the boat by providing useful information and solving, in advance, some critical situations that could be more difficult to evaluate in very complex models, such as those of the whole vessel.
Future developments of the presented activity will concern the investigation and improvements in the definition of the boundaries between the different calculation models. In other words, a set of typical situations will be defined in which a simplified calculation is sufficient and in which others the use of the different advanced calculation models becomes necessary.

Author Contributions

Conceptualization, M.R., F.D.P., P.F. and F.L.; methodology, M.R.; software, M.R.; investigation, M.R., F.D.P., P.F., F.A. and S.K.; data curation, M.R.; writing—original draft preparation, M.R. and F.L.; writing—review and editing, M.R., F.D.P., P.F., F.F., F.A., S.K. and F.L.; visualization, M.R.; supervision, F.D.P., P.F., F.F. and F.L.; project administration, F.D.P. and F.L.; funding acquisition, F.D.P. and F.L. All authors have read and agreed to the published version of the manuscript.

Funding

This research was funded by CNR-INM within the project “Tecnologia e Ricerca Industriale per la Mobilità Marina” (TRIM), funding number CTN01_00176_163601, funded by the Italian Ministry of Education, University and Research.

Data Availability Statement

The original contributions presented in this study are included in the article; further inquiries can be directly directed to the corresponding author.

Conflicts of Interest

The authors declare no conflicts of interest.

Nomenclature

CSpectrum adaptation term for pink noise
CtrSpectrum adaptation term for low and medium frequencies noise
DDifference in the sound pressure level (dB)
DnTStandardized difference in the sound pressure level (dB)
L1Sound pressure levels (dB) in the emitting room
L2Sound pressure levels (dB) in the receiving room
KFlanking contribution factor
MSurface mass
RwAirborne sound insulation (dBA)
RwApparent weighted airborne sound insulation index (dBA)
SSurface (m2)
TReverberation time in the receiving room (s)
T0Reference reverberation time (s) for the lived enclosed environment (0.5 s)
VVolume (m3)

Abbreviations

ABSAmerican Bureau of Shipping
BVBureau Veritas
CACCrew Accommodation Comfort
CCCrew cabin
CMCrew mess
C1, C2VIP cabins
C3, C4Guest cabins
DNV-GLDet Norske Veritas and Germanischer Lloyd
EREngine Room
EVOBEigen Value-Optimized Beamforming algorithm
GGalley
LRLloyd’s Register
MSMain saloon
MCMaster cabin
PACPassenger Accommodation Comfort
PCACPassenger and Crew Accommodation Comfort
RINARegistro Italiano Navale

References

  1. Duman, I.I. Human Comfort in Yacht Spaces. Br. J. Arts Soc. Sci. 2015, 19, 68–75. [Google Scholar]
  2. Pais, T.; Moro, L.; Boote, D.; Biot, M. Vibration Analysis for the Comfort Assessment of Superyachts. J. Mar. Sci. Appl. 2017, 16, 323–333. [Google Scholar] [CrossRef]
  3. Cakici, F.; Sukas, O.F.; Alkan, A.D. An Investigation of Comfort on Board Calculations for a Passenger Catamaran and a Yacht. In Proceedings of the INT-NAM Conference at Yildiz Technical University, Istanbul, Turkey, 23–24 October 2014. [Google Scholar]
  4. Fantozzi, F.; Rocca, M. An extensive collection of evaluation indicators to assess occupants’ health and comfort in indoor environment. Atmosphere 2020, 11, 90. [Google Scholar] [CrossRef]
  5. Leccese, F.; Rocca, M.; Salvadori, G.; Belloni, E.; Buratti, C. A multicriteria method to identify and rank IEQ criticalities: Measurements and applications for existing school buildings. Energy Built Environ. 2025, 6, 387–401. [Google Scholar] [CrossRef]
  6. Duman, I.I.; Zengel, R. Effects of Physical Design features to human comfort on floating spaces. Open House Int. 2016, 41, 93–100. [Google Scholar] [CrossRef]
  7. Liu, H.; Zhan, L.; Lin, X.; Gong, Z. Study of comprehensive comfort evaluation based on fuzzy method in the ship’s cabins. Therm. Sci. Eng. Prog. 2024, 53, 102738. [Google Scholar] [CrossRef]
  8. Goujard, B.; Sakout, A.; Valeau, V. Acoustic comfort on board ships: An evaluation based on a questionnaire. Appl. Acoust. 2005, 66, 1063–1073. [Google Scholar] [CrossRef]
  9. Aydin, M.; Yilmaz Aydin, T.; Guntekin, E. Noise and Vibration damping for yacht interior. Mugla J. Sci. Technol. 2016, 2, 166–170. [Google Scholar] [CrossRef]
  10. Borelli, D.; Gaggero, T.; Rizzuto, E.; Schenone, C. Onboard ship noise: Acoustic comfort in cabins. Appl. Acoust. 2021, 177, 107912. [Google Scholar] [CrossRef]
  11. Prato, A.; Silvestri, P.; Pais, T.; Gaggero, F.; Schiavi, A. Airborne sound transmission loss of ship bulkheads: A new methodological approach for in-laboratory assessment by including low frequencies. Ocean Eng. 2023, 285, 115428. [Google Scholar] [CrossRef]
  12. Bocanegra, J.A.; Borelli, D.; Gaggero, T.; Rizzuto, E.; Schenone, C. Characterizing onboard noise in ships: Insights from statistical, machine learning and advanced noise index analyses. Ocean Eng. 2023, 285, 115273. [Google Scholar] [CrossRef]
  13. Borelli, D.; Gaggero, T.; Rizzuto, E.; Schenone, C. Analysis of noise on board a ship during navigation and manoeuvres. Ocean Eng. 2015, 105, 256–269. [Google Scholar] [CrossRef]
  14. Liu, H.; Lin, X.; Gong, Z.; Shi, J. Combined Annoyance Assessment of Ship Structural Vibration and Ambient Noise. Buildings 2023, 13, 363. [Google Scholar] [CrossRef]
  15. Boote, D.; Pais, T.; Dellepiane, S. Vibrations of Superyacht Structures: Comfort Rules and Predictive Calculations. In Analysis and Design of Marine Structure 2013, 1st ed.; CRC Press: Boca Raton, FL, USA, 2013; ISBN 9780429212550. [Google Scholar]
  16. Seiler, R.D.; Holdbach, G. Acoustic quality on board ships. Proceeding Meet. Acoust. 2013, 19, 040132. [Google Scholar] [CrossRef]
  17. Rocca, M.; Di Puccio, F.; Forte, P.; Leccese, F. Acoustic comfort requirements and classifications: Buildings vs. yachts. Ocean Eng. 2022, 255, 111374. [Google Scholar] [CrossRef]
  18. Silvestri, P.; Pais, T.; Vergassola, G. The role of structural and insulating material in the structure-borne noise propagation of superyachts. Mech. Based Des. Struct. Mach. 2024, 53, 3349–3368. [Google Scholar] [CrossRef]
  19. American Bureau of Shipping (ABS). Guide for Comfort on Yacht; American Bureau of Shipping: Spring, TX, USA, 2019. [Google Scholar]
  20. Bureau Veritas (BV). Rules for the Classification of Steel Ships—Part F: Additional Class Notations; NR 467.F1 DT R18 E; Marine & Offshore: Paris, France, 2025. [Google Scholar]
  21. Det Norske Veritas and Germanischer Lloyd (DNV GL). Rules for Classification—Ships; Det Norske Veritas and Germanischer Lloyd (DNV GL): Oslo, Norway, 2021. [Google Scholar]
  22. Lloyd’s Register of Shipping (LR). Rules and Regulations for the Classification of Special Service Crafts; Lloyd’s Register of Shipping (LR): London, UK, 2020. [Google Scholar]
  23. Registro Italiano Navale (RINA). Rules for the Classification of Yacht—Part E: Additional Class Notations; Registro Italiano Navale (RINA): Genova, Italy, 2025. [Google Scholar]
  24. Sharp, B. Prediction Methods for the Sound Transmission of Building Elements. Noise Control Eng. 1978, 11, 53–63. [Google Scholar] [CrossRef]
  25. Cremer, L.; Heckl, M.; Petersson, B.A.T. Structure-Borne Sound. In Structural Vibrations and Sound Radiation at Audio Frequencies, 3rd ed.; Springer: Berlin/Heidelberg, Germany, 2005. [Google Scholar] [CrossRef]
  26. Fahy, F.; Gardonio, P. Sound and Structural Vibration. In Radiation, Transmission and Response, 2nd ed.; Academic Press: Cambridge, MA, USA, 2007. [Google Scholar] [CrossRef]
  27. Rindel, J.H. Sound Radiation form Building Structures and Acoustical Properties of Thick Plates. In Proceedings of the COMETT-SAVOIR Course, Noise Control in Buildings—Up-to-Date Practice CSTB, Grenoble, France, 16–18 March 1995. [Google Scholar]
  28. UNI/TR 11175-1:2024; Acustica in Edilizia—Linee Guida Per la Previsione Delle Prestazioni Acustiche Degli Edifici—Applicazione Delle Norme Tecniche Alla Tipologia Costruttiva Nazionale—Parte 1: Metodo di Calcolo Semplificato Basato su Grandezze a Numero Unico. Ente Nazionale Italiano di Unificazione: Milano, Italy, 2024.
  29. UNI/TR 11175-2:2024; Acustica in Edilizia—Linee Guida Per la Previsione Delle Prestazioni Acustiche Degli Edifici—Applicazione Delle Norme Tecniche Alla Tipologia Costruttiva Nazionale—Parte 2: Dati di Ingresso per il Modello di Calcolo. Ente Nazionale Italiano di Unificazione: Milano, Italy, 2024.
  30. Marinò, A. Costruzioni Navali in Composito. Università Degli Studi di Trieste. 2016. Available online: https://moodle2.units.it/pluginfile.php/187366/mod_resource/content/0/Alberto%20Marin%C3%B2%20-%20Costruzioni%20Navali%20in%20Composito%20%282016%29.pdf (accessed on 29 April 2025).
  31. Tang, X.; Yan, X. Airflow resistance of acoustical fibrous materials: Measurements, calculations and applications. J. Ind. Text. 2020, 49, 981–1010. [Google Scholar] [CrossRef]
  32. ISO 16283; Acoustics—Field Measurement of Sound Insulation in Buildings and of Building Elements. Part 1: Airborne Sound Insulation. International Organization for Standardization: Geneva, Switzerland, 2014.
  33. Kanka, S.; Fredianelli, L.; Artuso, F.; Fidecaro, F.; Licitra, G. Evaluation of Acoustic Comfort and Sound Energy Transmission in a Yacht. Energies 2023, 16, 808. [Google Scholar] [CrossRef]
  34. ISO 3382-2; Acoustics—Acoustics. Measurement of Room Acoustic Parameters. Part 2: Reverberation Time in Ordinary Rooms. International Organization for Standardization: Geneva, Switzerland, 2008.
  35. Sijtsma, P. Experimental Techniques for Identification and Characterization of Noise Sources; Technical Report NLR-TP-2004-165; National Aerospace Laboratory NLR: Amsterdam, The Netherlands, 2004; pp. 1–47. [Google Scholar]
  36. Hald, J. Basic theory and properties of statistically optimized near-field acoustical holography. J. Acoust. Soc. Am. 2009, 125, 2105–2120. [Google Scholar] [CrossRef]
  37. Sijtsma, P. CLEAN Based on Spatial Source Coherence. Int. J. Aeroacoust. 2007, 6, 357–374. [Google Scholar] [CrossRef]
  38. Schmidt, R.O. Multiple Emitter Location and signal Parameter Estimation. IEEE Trans. Antennas Propag. 1986, 34, 276–280. [Google Scholar] [CrossRef]
  39. Capon, J. High-resolution frequency-wavenumber spectrum analysis. Proc. IEEE 1969, 57, 1408–1418. [Google Scholar] [CrossRef]
  40. Brooks, T.F.; Humphreys, W.M. A Deconvolution Approach for the Mapping of Acoustic Sources (DAMAS) Determined from Phased Microphone Arrays. J. Sound Vib. 2006, 294, 856–879. [Google Scholar] [CrossRef]
  41. Licitra, G.; Artuso, F.; Bernardini, M.; Moro, A.; Fidecaro, F.; Fredianelli, L. Acoustic Beamforming Algorithms and Their Applications in Environmental Noise. Curr. Pollut. Rep. 2023, 9, 486–509. [Google Scholar] [CrossRef]
  42. Vergassola, G. The prediction of noise propagation onboard pleasure crafts in the early design stage. J. Ocean Eng. Mar. Energy 2020, 6, 15–30. [Google Scholar] [CrossRef]
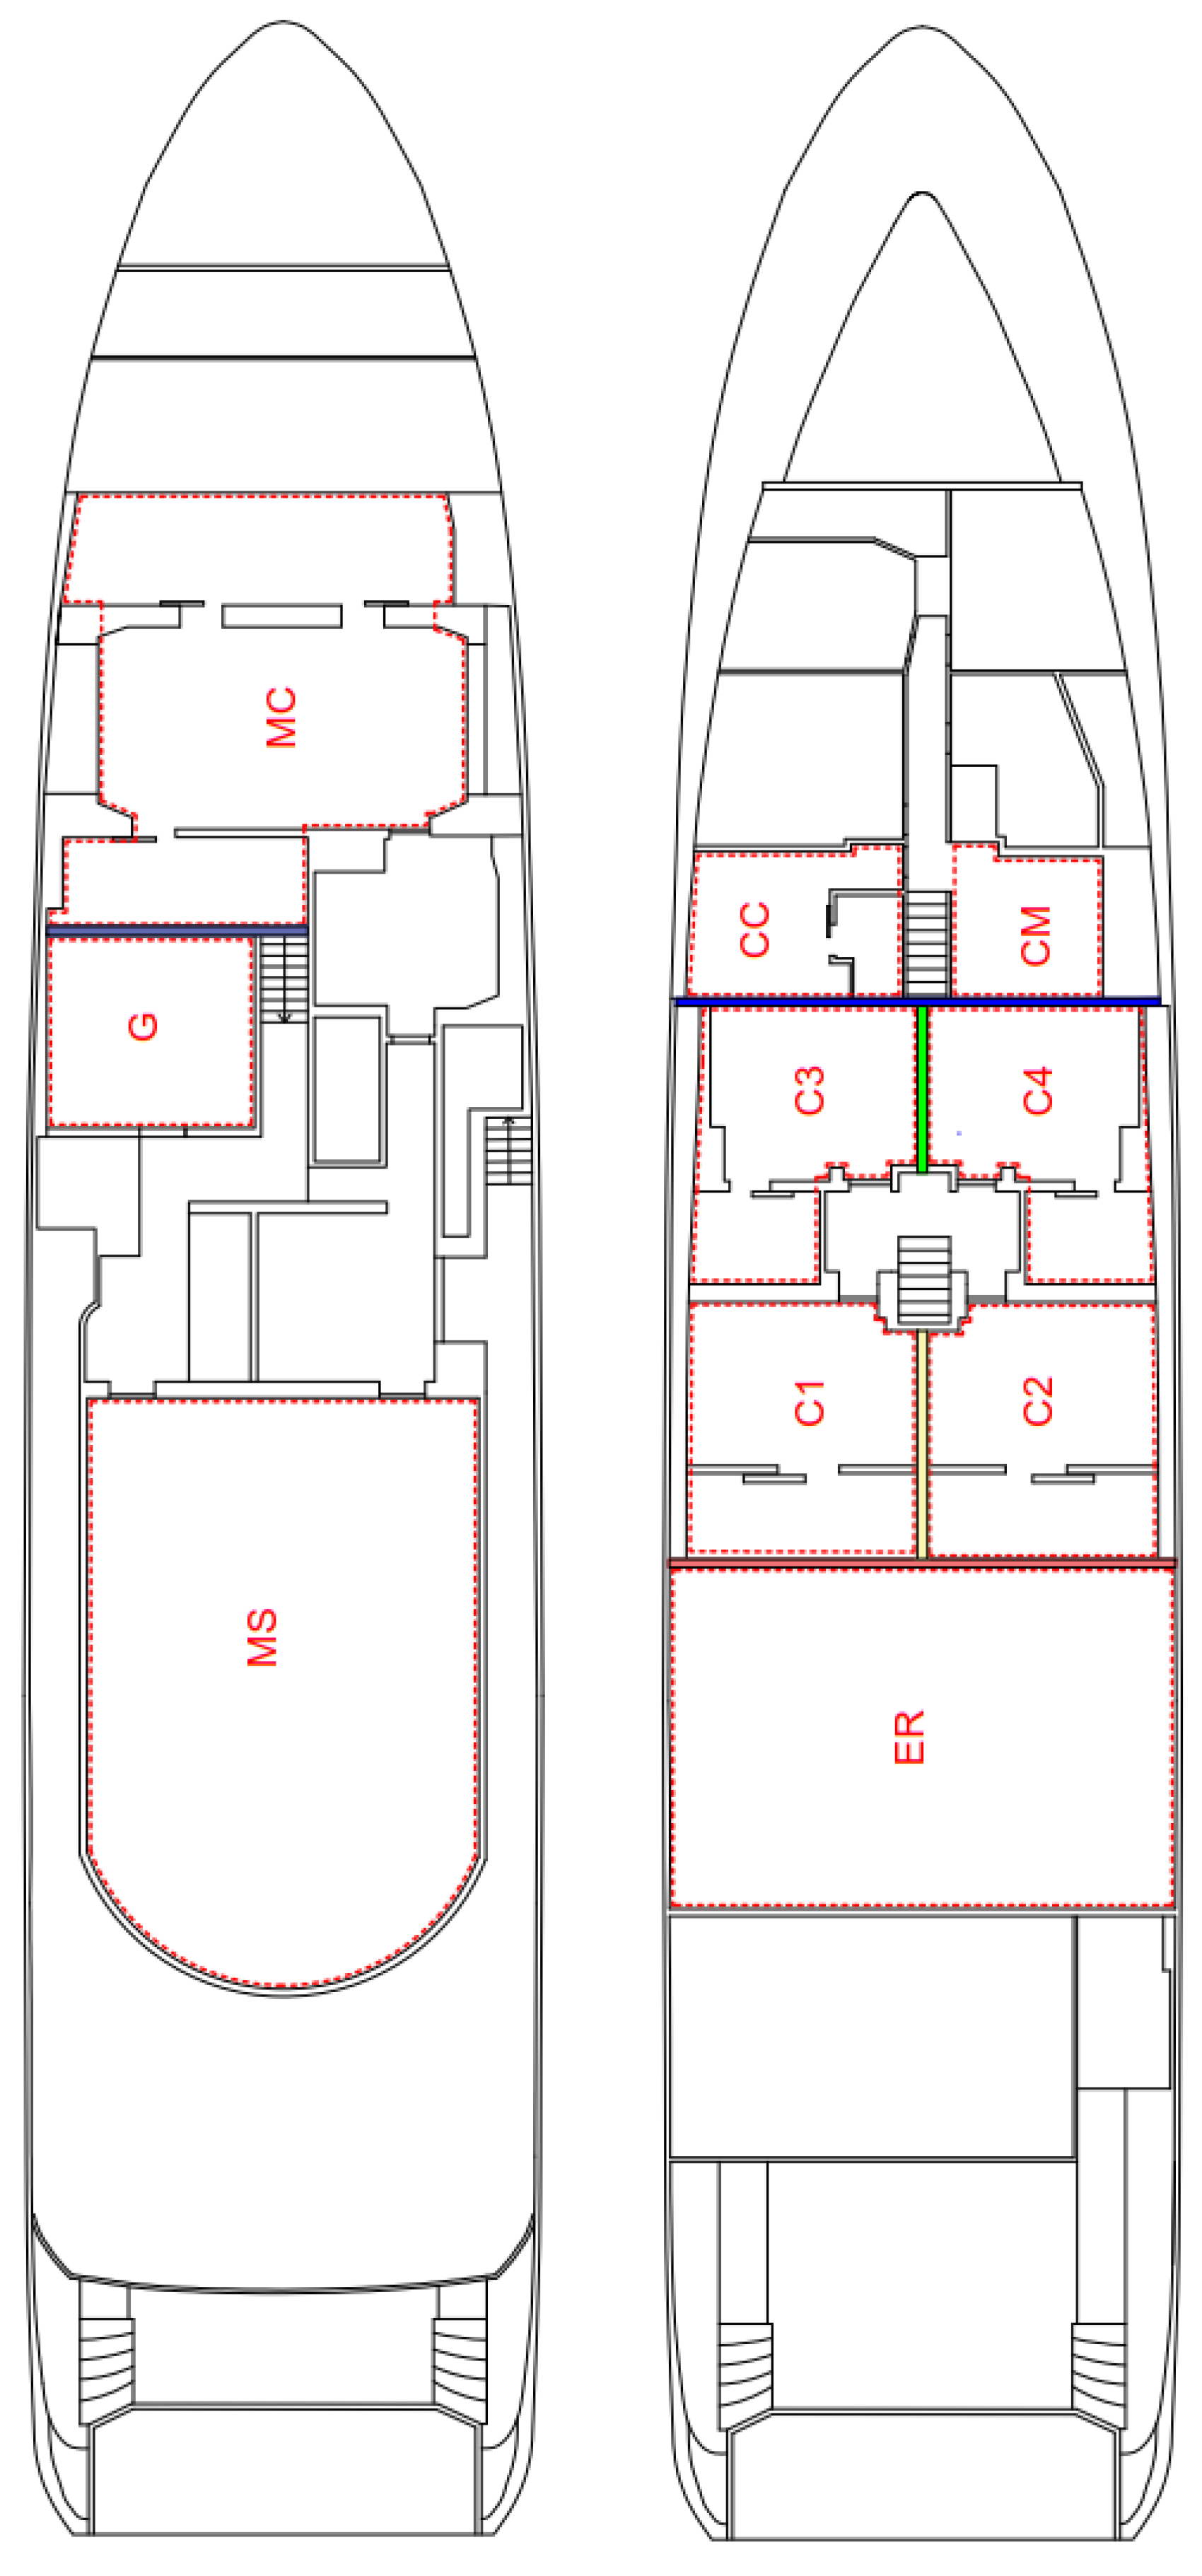
Figure 1. General arrangements of the yacht used as a case study: main deck (left); lower deck (right). The abbreviations have the following meaning: ER = engine room; C1 and C2 = VIP cabins, C3 and C4 = guest cabins; CC = crew cabin; CM = crew mess; MS = main saloon; G = galley; MC = master cabin.
Jmse 13 00988 g001
Figure 2. Acoustic camera CAE-Systems.
Jmse 13 00988 g002
Figure 3. Sound insulation curves for the analyzed bulkhead: (a) ER–C1; (b) ER–C2; (c) C2–C1; (d) C3–C4; (e) CM–C4; (f) G–MC. The dots represent the sound insulation at different frequencies, while the blue dotted line represents the translated line for determining the sound insulation index Rw.
Jmse 13 00988 g003
Figure 4. Apparent weighted sound insulation indexes: comparison between the simulated and measured values.
Jmse 13 00988 g004
Figure 5. Airborne sound transmission through the tailgate between the ER and the bathroom of the C2 VIP cabin when the tailgate is completely closed (left) and when the tailgate is partially open (right).
Jmse 13 00988 g005
Figure 6. Airborne sound transmission through the door of C1 cabin.
Jmse 13 00988 g006
Figure 7. Airborne sound transmission through the partition between the two guest cabins when the wardrobe door is closed (left) and open (right).
Jmse 13 00988 g007
Figure 8. Comparison of comfort classes related to calculated and measured apparent weighted airborne sound insulation indexes for cabin-to-cabin top grade partitions. The numbers (1, 2, 3) and the letters (A, B) are referred to the comfort acoustic classes according to the different class societies classifications.
Jmse 13 00988 g008
Figure 9. Comparison of comfort classes related to the calculated and measured apparent weighted airborne sound insulation indexes for cabin-to-cabin standard grade partitions. The numbers (1, 2, 3) and the letters (A, B) are referred to the comfort acoustic classes according to the different class societies classifications.
Jmse 13 00988 g009
Table 1. ABS weighted airborne sound insulation index requirements.
Airborne Sound InsulationRw (dBA)
Cabin to cabin38
Messrooms, recreation rooms, public spaces and entertainment areas, to cabins and hospitals48
Corridor to cabin33
Cabin to cabin with a communicating door33
Table 2. Apparent weighted airborne sound insulation index (Rw) requirements for BV, DNG GL, LR, and RINA guidelines.
Apparent Weighted Airborne Sound Insulation Index Rw (dBA)
Class SocietyBVDNV GLLRRINA
Comfort Class123123123AB
Passengers areas
Top grade Cabin—Top grade cabin Cabin4542404643404542404335
Standard Cabin—Standard Cabin4138364138354139384035
Top grade Cabin—Corridor or communicating cabin4240374139374240374035
Standard Cabin—Corridor or communicating cabin4240373835333836354035
Top grade Cabin—Stairs484545---5047454845
Standard Cabin—Stairs484545---4745434845
Top grade Cabin—Mess rooms, recreation rooms, public spaces5553505653505550505348
Standard Cabin—Mess rooms, recreation rooms, public spaces5553505148455248485348
Cabin—Public spaces designed for loud music646260---6060606555
Crew areas
Cabin—Cabin 373532383532---3535
Cabin—Corridor or communicating cabin353230373228---3327
Top grade Cabin—Stairs353230--------
Cabin—Mess rooms, recreation rooms, public spaces454545504742 3530
Table 3. Main properties of the analyzed inner partitions.
PartitionLayerMaterialsDensity
(kg/m3)
Thickness
(mm)
Bulkhead between Engine room and VIP cabins
Jmse 13 00988 i0011Sheet in aluminum and polyethylene29002
2Plastic polymer and mineral filler sound insulation20002 × 2.5
3Mineral wool13030
4Mineral wool15050
SGlass-reinforced plastic (GRP) with PVC core60044
5Mineral Wool13030
6Plastic polymers and mineral fillers sound insulation20002 × 2.5
7Dampign system-100
8Fiberglass6630
9Aluminum frame--
10Composite panel wood–rubber cork–wood (8/6/8)61522
Bulkhead between VIP cabins
Jmse 13 00988 i0021Fiberglass6630
2Elastic sandwich spacer-15
3Composite panel wood–rubber cork–wood (8/6/8)61515
SGlass-reinforced plastic (GRP) with PVC core60044
Bulkhead between VIP cabins and Standard cabins
Jmse 13 00988 i0031Composite panel wood–rubber cork–wood (8/6/8)61515
2Plastic polymers and mineral fillers sound insulation20002.5
3Fiberglass6630
4Rigid spacer-40
SGlass-reinforced plastic (GRP) with PVC core60044
5Fiberglass6630
6Elastic sandwich spacer-15
7Composite panel wood–rubber cork–wood (8/6/8)61515
Table 4. Main properties of materials for INSUL v.9.0 simulation model.
MaterialsLayerDensity
(kg/m3)
Thickness
(mm)
Flow Resistivity
(Rayl/m)
Young Modulus
(Gpa)
Damping
Fiberglass 663029,200--
Mineral wool 13030/5077,500--
Plastic polymers and mineral fillers sound insulation 20002.5-6.000.010
Composite panel wood–rubber cork–wood (8/6/8)Okumè wood5306.0-1.820.020
Rubber Cork9508.0-7.00.100
Okumè wood5306-1.820.020
Glass-reinforced plastic (GRP) with PVC coreGRP16001.6-4.70.010
PVC core50040-0.260.100
GRP16001.6-4.70.010
Table 5. Number of reverberation time measurements.
RoomNr. of Microphone PositionsNr. of Sound Source Positions
C191
C2
C361
C4
MC52
Table 6. Number of sound pressure levels measurements.
Room 1Room 2Nr. of Microphone PositionsNr. of Sound Source PositionsNr. of Background Positions
ERC16-5
ERC26-5
C2C1555
C3C4555
CMC4555
GMC555
Table 7. Summary of sound insulation performance of the analyzed bulkheads.
Room 1Room 2Thickness
(mm)
Bulkhead Surface
(m2)
M
(kg/m2)
Rw
(dB)
C
(dB)
Ctr
(dB)
K
(dB)
Rw
(dB)
ER C12209.48064−2−7361
ERC22209.48064−2−7361
C2C11556.85050−5−13347
C3C4457.02644−3−5341
CMC41857.05354−6−14351
GMC2008.75753−6−14350
Table 8. Measurement results and the obtained values of the apparent weighted sound reduction indexes.
Room 1Room 2DnT (dB)Rw (dB)
ERC161.561.3
ERC256.756.5
C2C1 43.743.5
C3C438.936.8
CMC453.851.8
GMC53.050.3
Disclaimer/Publisher’s Note: The statements, opinions and data contained in all publications are solely those of the individual author(s) and contributor(s) and not of MDPI and/or the editor(s). MDPI and/or the editor(s) disclaim responsibility for any injury to people or property resulting from any ideas, methods, instructions or products referred to in the content.