Article

First Application of a New Rapid Method of Age Determination in European Anchovy (Engraulis encrasicolus) by Fourier Transform Near-Infrared Spectroscopy

by
Gualtiero Basilone
1,2,*,
Miryam Fortuna
1,2,*,
Gabriella Lo Cicero
1,2,3,
Simona Genovese
1,2,
Giovanni Giacalone
1,2,
Ignazio Fontana
1,2,
Angelo Bonanno
1,2,
Salvatore Aronica
1,2 and
Rosalia Ferreri
1,2
1
National Research Council (CNR), Institute of Anthropic Impacts and Sustainability in Marine Environment (IAS), Branch of Capo Granitola, 91021 Campobello di Mazara, Italy
2
NBFC, National Biodiversity Future Center, 90133 Palermo, Italy
3
Department of Earth and Marine Sciences (DiSTeM), University of Palermo, Via Archirafi 20, 90123 Palermo, Italy
*
Authors to whom correspondence should be addressed.
J. Mar. Sci. Eng. 2025, 13(5), 961; https://doi.org/10.3390/jmse13050961
Submission received: 7 March 2025 / Revised: 9 May 2025 / Accepted: 12 May 2025 / Published: 15 May 2025
(This article belongs to the Section Marine Biology)

Abstract

:
Age determination through reading annual rings in whole otoliths is a complicated, time-consuming task that can lead to errors in population age structure, negatively affecting marine fish management plans. Recently, Fourier transform near-infrared spectroscopy (FT-NIRS) has been successfully used to evaluate annual age, at least in several long-life fish species. European anchovy (Engraulis encrasicolus) is an important pelagic species for its ecological role and socioeconomic value. In the Mediterranean Sea, anchovy stocks are regularly monitored for assessment purposes, and fish age is calculated by traditional otolith reading. In the present study, anchovies, caught over a decade (2012 to 2023) during on-board surveys in four different areas (i.e., North Tyrrhenian, South Tyrrhenian, North of Sicily, and Strait of Sicily), provided an otolith collection used to acquire absorption spectra by FT-NIRS. These spectra were processed to optimize calibration models, and the best linear models obtained revealed a good predictability for anchovy annual age (coefficient of determination of 0.90, mean squared error 0.3 years, bias < 0.001 years). The calibration model developed for all regions combined proved more robust than the models for each area, demonstrating its efficacy for the entire study area. FT-NIRS analyses proved suitable for predicting age, when applied to E. encrasicolus individuals within the age range of 0 to 3, also when compared to traditional aging methods. Moreover, this methodology improved the standardization of age estimates. Finally, this preliminary study encourages the further application of FT-NIRS also to short-life pelagic species involved in stock assessment plans.

1. Introduction

Age estimates in marine fish, used in stock assessment models, are determined by local and national laboratories, applying rules internationally agreed upon by scientific advisory bodies, such as the General Fisheries Commission for the Mediterranean (GFCM) and the Scientific, Technical and Economic Committee for Fisheries (STECF). Sampling, otolith analysis, and the age determination protocol are tasks known to be difficult and time-consuming for operators involved in the entire procedure [1]. Moreover, the data obtained may be prejudiced by subjectivity and different experience levels of readers, although European countries have made efforts to update methodologies according to international recommendations [2].
European anchovy, Engraulis encrasicolus (Linneus, 1758), belonging to the Engraulidae family, lives from the North Sea to South Africa in the eastern Atlantic waters, and its distribution reaches the Mediterranean and Black Seas. E. encrasicolus is one of the most highly exploited resources [3], being one of the most abundant species in the Mediterranean Sea, supporting the proper functioning of the pelagic ecosystem [4,5], due to its essential intermediate trophic level in food webs [6]. E. encrasicolus is assessed within the EU data collection framework [7], to produce management plans for sustainable stock exploitation. These plans are based on predictive models that include several biological parameters, such as population age structure, growth, and size at first maturity [1,8]. The protocols adopted for data collection required long-time sampling as well scientific surveys conducted on-board dedicated research vessels [9], which provided extensive collections of otoliths to be analyzed annually [1,10].
E. encrasicolus can reach about 20 cm in total length, but the 10–16 cm size range is the most common in Mediterranean Sea. They grow rapidly during the first two years of life (i.e., age 0 and age 1) but more slowly thereafter [11]. The typical age range for E. encrasicolus is 0 to 3 years, but some individuals have been found to be 5 years old, although aging methods are controversial in some observations [10]. Even if the relevance of growth data in stock assessment programs is recognized, a considerable uncertainty remains in the variability of age assignment. Growth evaluation can be affected by sampling procedures or reader skills; indeed, operator subjectivity may generate more variability among areas than environmental conditions. Similarly, not all laboratories may follow internationally approved rules for age estimates [1,2]. Thus, estimating annual age using an automated analytic system may provide more accurate and reliable data.
Fourier transform near-infrared spectroscopy (FT-NIRS) utilizes light from the near-infrared spectrum to estimate organic chemical bonds within the sample being examined [12]. These bonds produce an absorbance pattern characteristic of the sample composition, as a result of the absorption of light at selected frequencies [13,14]. Each absorbance pattern is correlated with the presence and quantity of organic chemical bonds contained within the sample, namely -CH, -OH, -NH, and -SH [13], which serve as proxies for known biological variables. In particular, age-related changes to the otolith protein or organic matrix appear to be suitable as drivers of FT-NIRS age prediction [15]. Therefore, the absorbance data, in association with a multivariate statistical analysis, allow us to distinguish the variable of interest from the overall spectral data [16]. This technique has long been applied in food science and aquaculture research, but its use has only recently been extended to fishery sciences. Particularly, the literature has shown that this technology provides an efficient, labor- and cost-saving way for evaluating fish age by scanning hard structures, such as otoliths (Table 1). Although the accuracy of the estimates could be enhanced by FT-NIRS, which produces quantitative measures from otoliths [17], the efficiency may vary by species, due to the extent and visibility of growth zones and/or the otolith preparation method [18].
FT-NIRS analyses were successfully applied for age estimation in fish species inhabiting American and Australian waters, and only once in European waters (Table 1), also detecting possible environmental or regional specificity for otolith spectra [18,27]. Some studies demonstrated the potential applicability of otolith aging for several long-life fish species [17,18,19,21], and other hard structures, such as vertebrae, dorsal fin spines, and fin clips, have also been analyzed by FT-NIR spectroscopy for aging determination purposes [20,22,25].
This study aims to validate the applicability of FT-NIR spectrometry analysis for annual age estimates, applied for the first time to a short-lived species such as E. encrasicolus. For this purpose, two otolith collections, both including samples from four different areas in the Mediterranean Sea, were used to calibrate and to test the aging estimates by spectrometry. Moreover, to account for possible differences between FT-NIRS and traditional age estimates, von Bertallanfy growth (VBGF) models were applied to test the feasibility for stock assessment purposes. This work represents the second experiment on otoliths of fish species inhabiting European waters, following an initial study on horse mackerel (Trachurus trachurus; [26]).

2. Materials and Methods

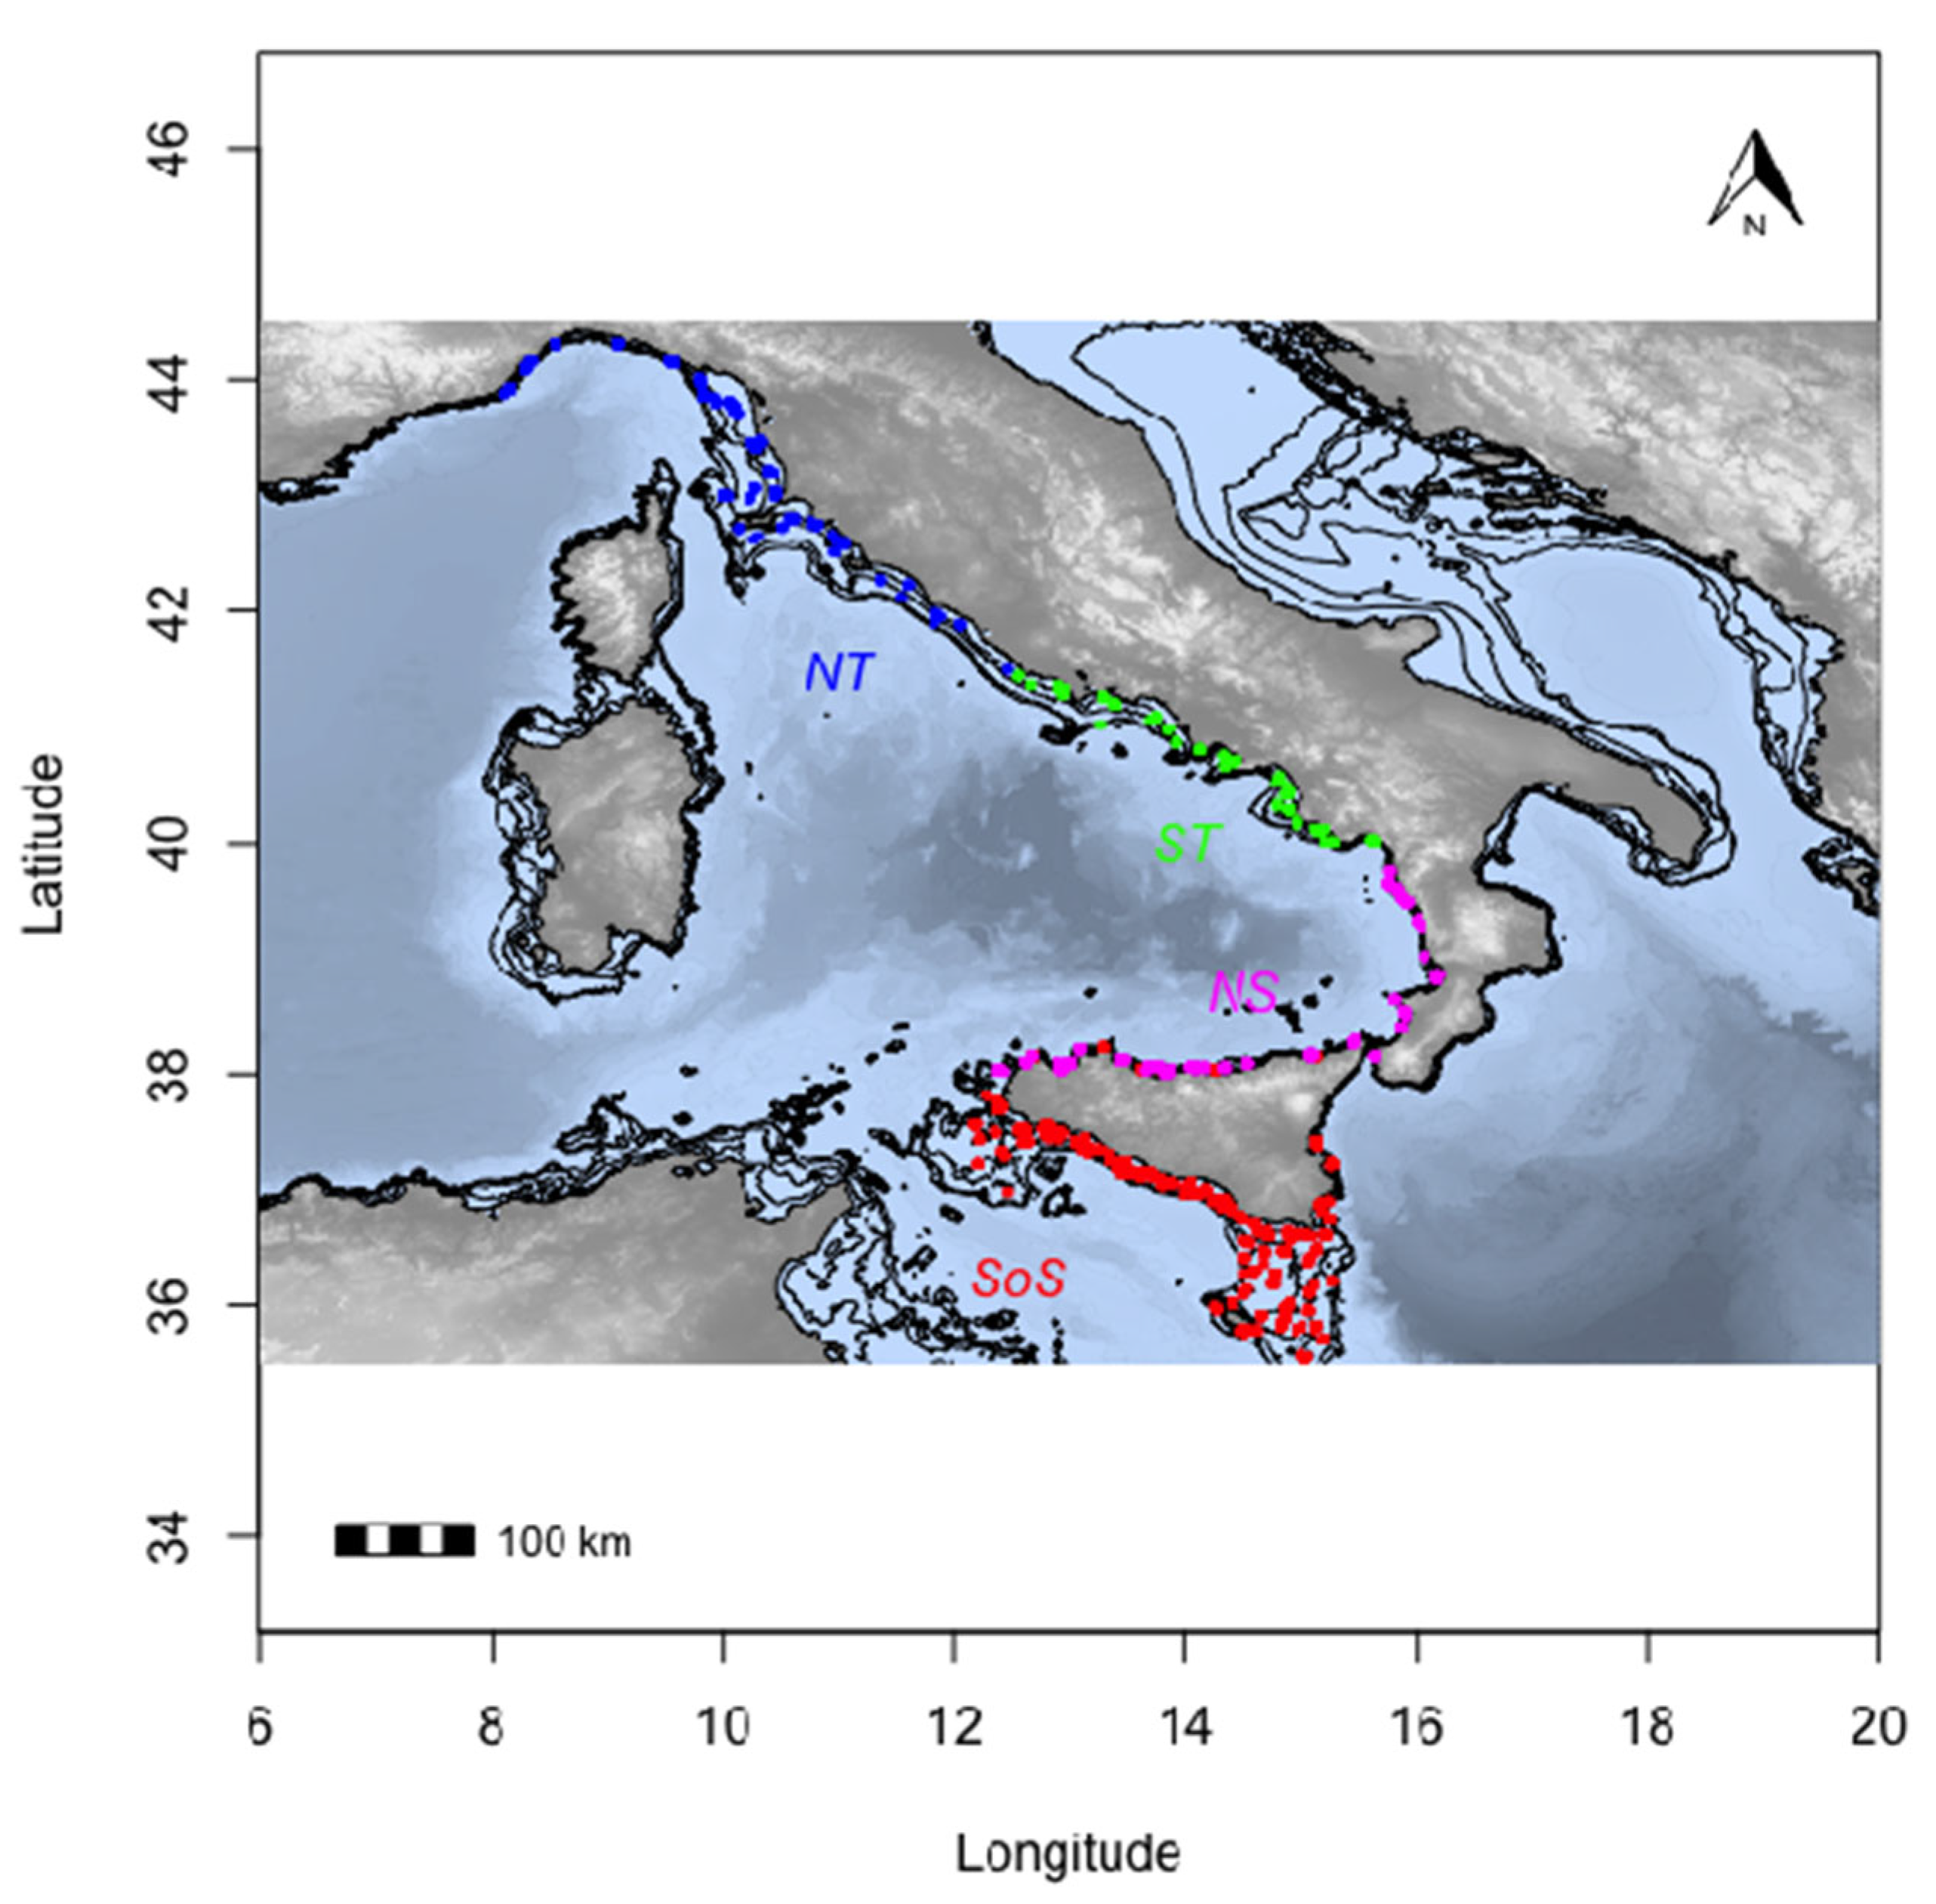
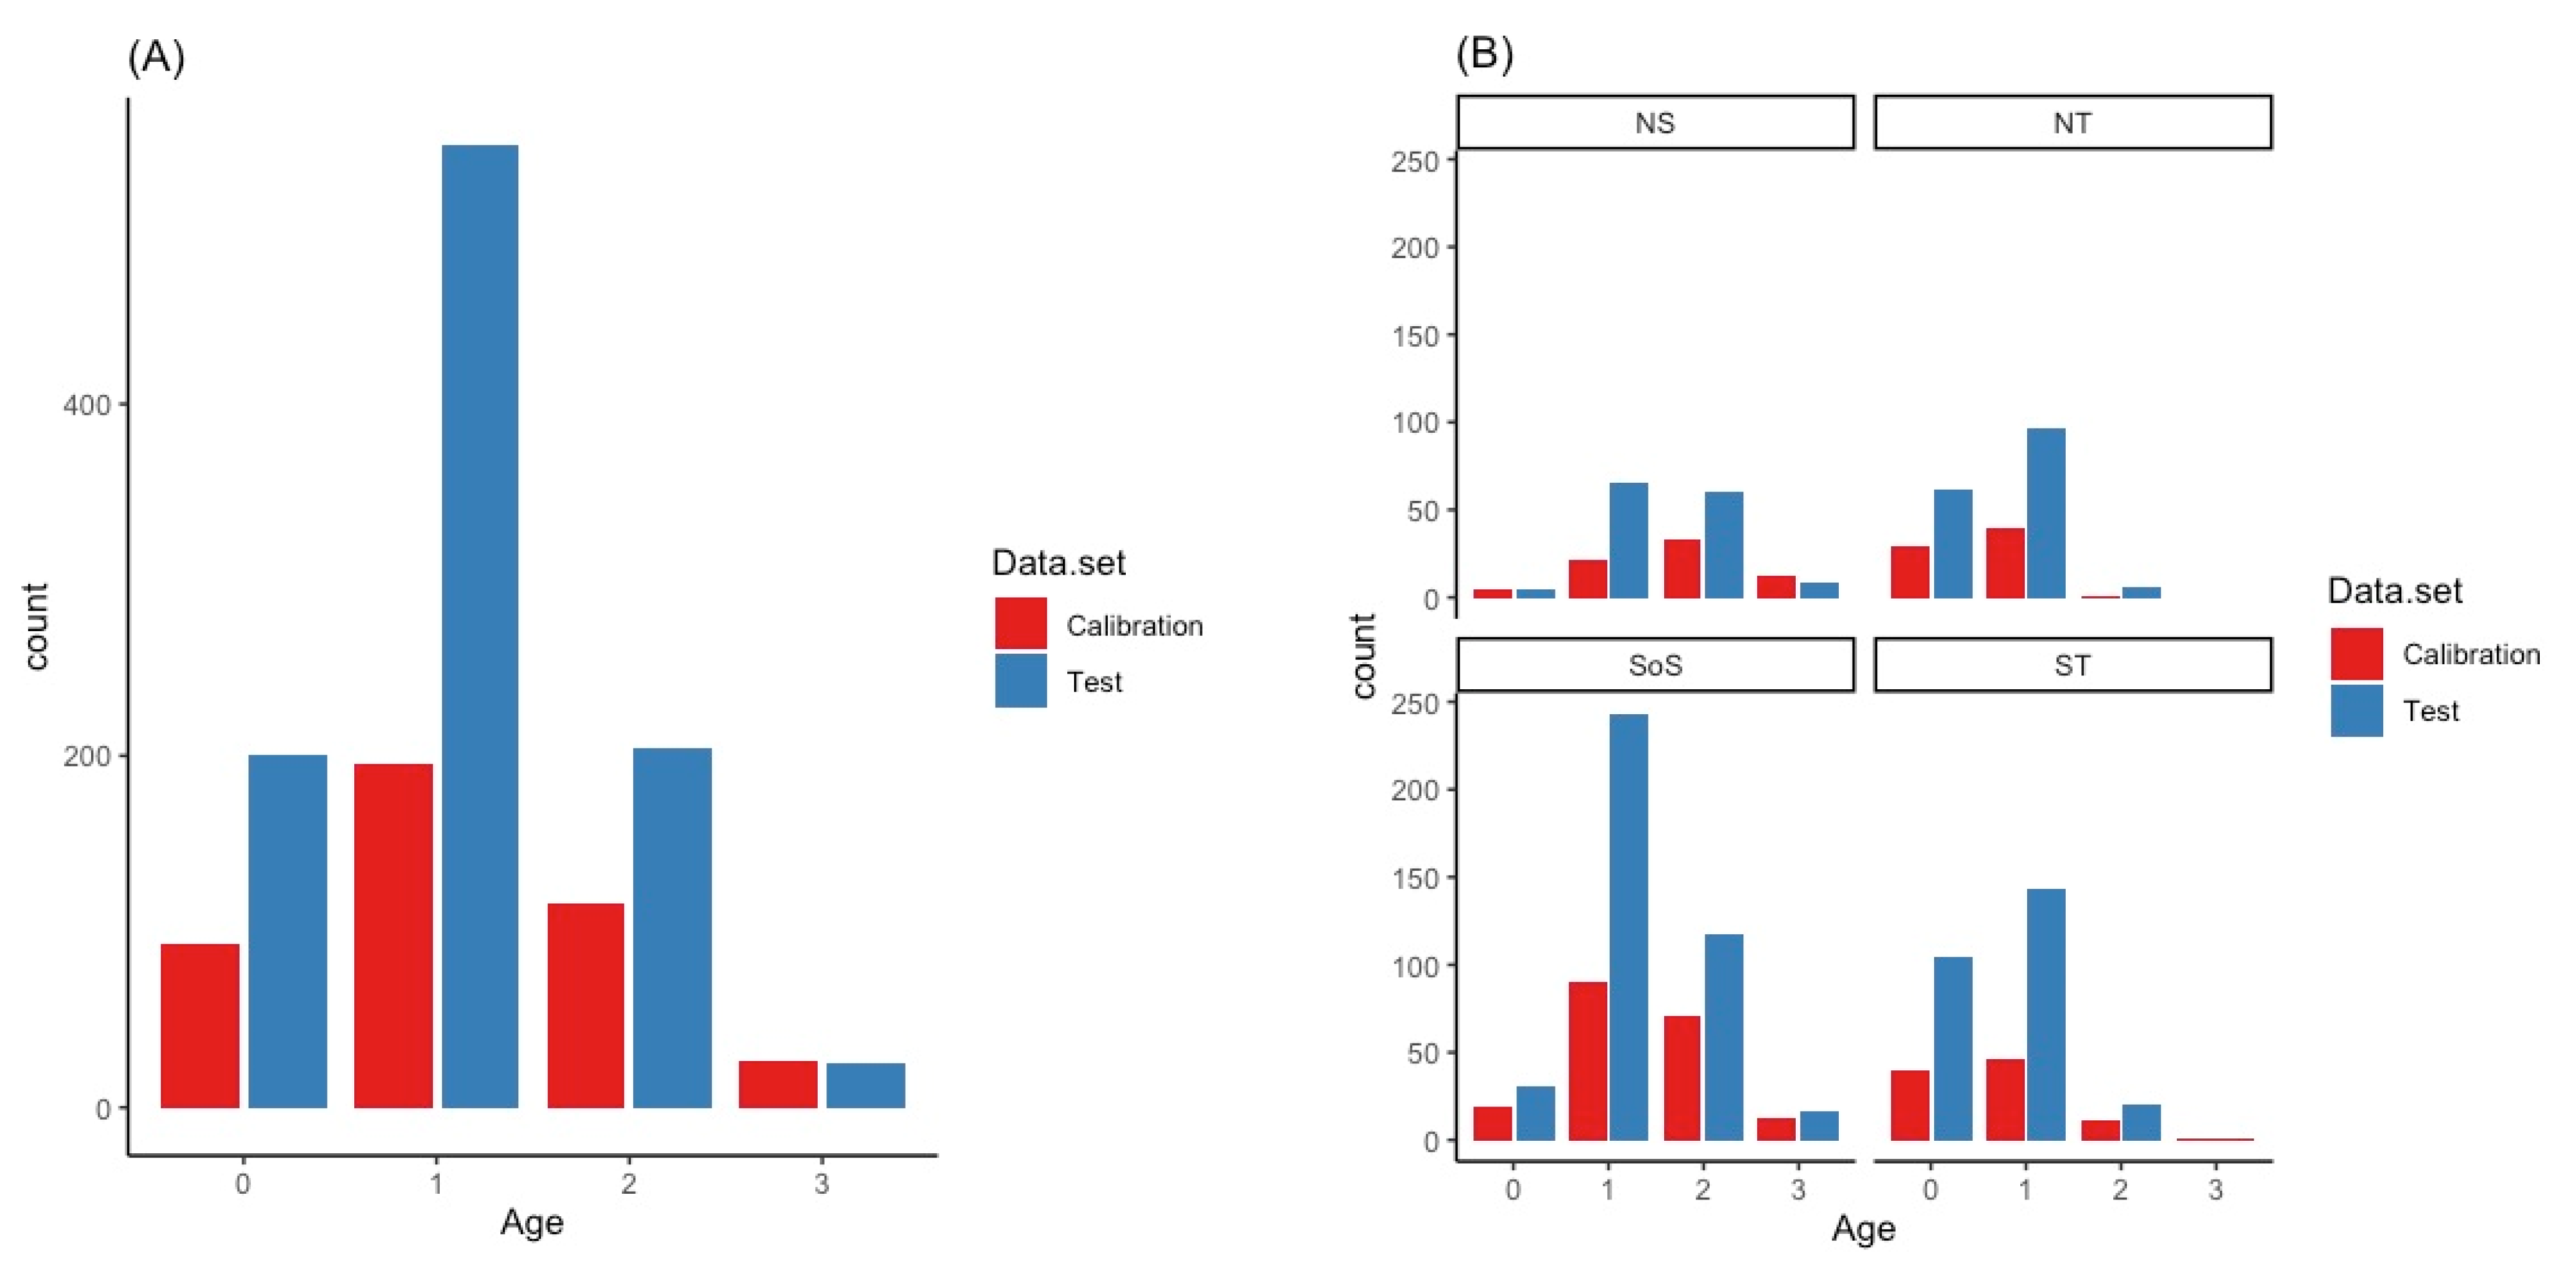
2.1. Sample Collection and Estimate of Age

The sagittal otoliths of E. encrasicolus were collected during the acoustic biomass assessment surveys of small pelagic fish carried out in summer within the framework of the European Data collection [Mediterranean International Acoustic Surveys, MEDIAS; https://www.medias-project.eu/index.php (accessed on 11 May 2025)]. These surveys are routinely performed with the aim of monitoring the populations of small pelagic fish species, including E. encrasicolus [9]. For the present study, no live animals were required, and no particular authorization was required for sampling, since the target species is fished in the study area for commercial purposes (it is neither endangered nor protected) and, during surveys, was caught in these areas, where fishing is permitted.
Otoliths, collected and stored without any clearing treatment according to Basilone et al. [28], were gathered mainly from the 2022–2023 surveys conducted over the continental shelf (depth < 200 m) in four areas: North Tyrrhenian (NT), South Tyrrhenian (ST), North of Sicily and Calabria (NS), and Strait of Sicily (SoS) (Figure 1). These areas are characterized by distinct continental shelf extension, coastline complexity, presence of upwelling or river runoff, and levels of the primary productivity [29]. Since temporal variability was beyond the scope of the present work, to overcome the limited representativeness of age classes across subareas, otoliths from previous surveys (2012–2021) were randomly selected for older age classes (age 2 and age 3) (Table 2).
Two datasets of whole otoliths were selected for the calibration and testing phases of the analysis procedures, both with a similar sample distribution per year and area. The calibrations set included otoliths already aged by the traditional method, applying the most recent international agreed protocol for E. encrasicolus age estimation [1], and these data were included for the development of the calibration model. The otoliths for the calibration set were chosen to obtain a distribution that was as comparable as possible across areas. The otoliths for test sets were randomly selected for each area, and no aging data were included for modeling by FT-NIRS (Figure 2).

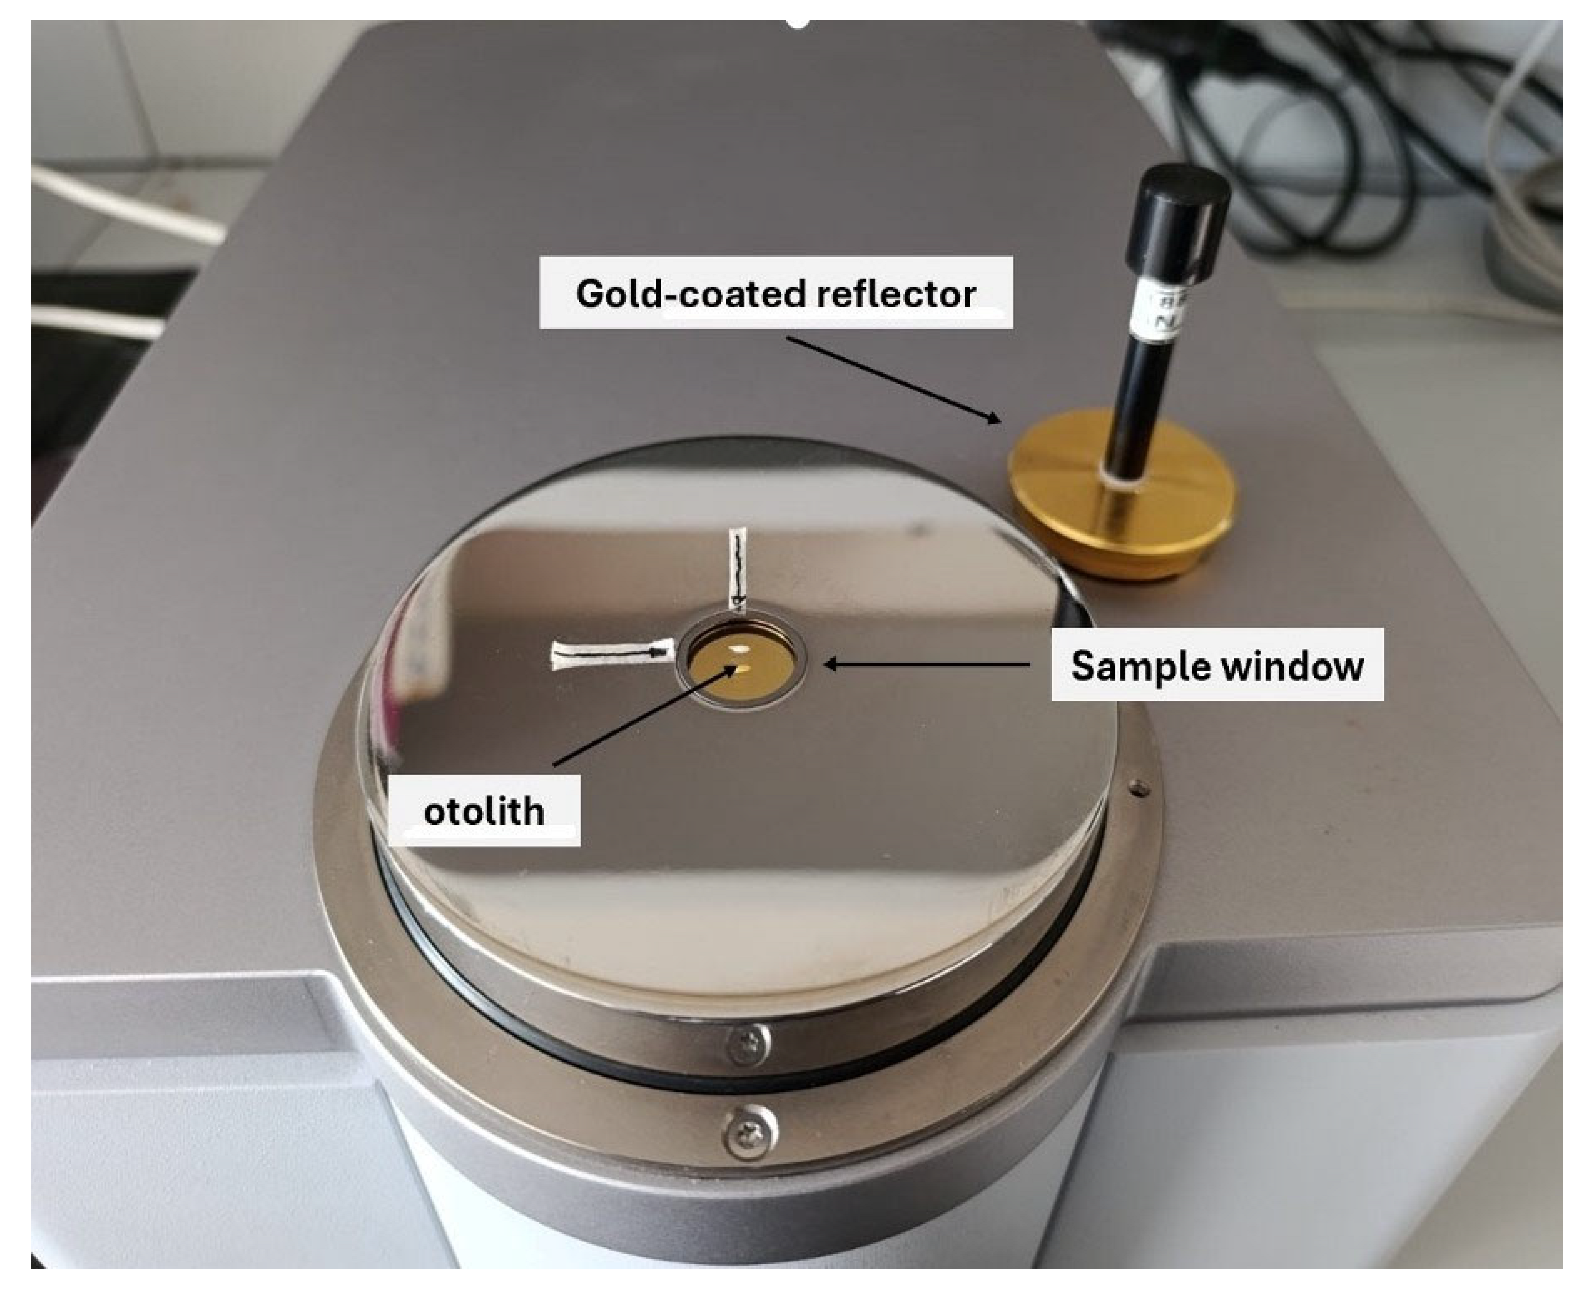
2.2. Acquisition of Spectral Data

A Bruker TANGO-R Near-Infrared Spectrometer, equipped with a 22 mm diameter sample window and OPUSTM software (Ver. 8.5; Bruker Optics GmbH & Co. KG, Ettlingen, Germany), was used to acquire FT-NIRS spectral absorbance data. Dry, clean otoliths were scanned putting the sample in the center of the window for scan, without any kind of housing support. The convex side of the otoliths was placed face down, with the rostral axis oriented horizontally using the window reference marks. A gold-coated cover, included among the spectrometer’s tools for this purpose, was used to cover each otolith to focus the path length of the incident NIR light (Figure 3); unlike procedures for larger otoliths, a metal collar was not necessary [27]. For each otolith, 64 spectral scans were performed at a frequency of 16 cm−1 along the entire NIR spectrum (11,500–4000 cm−1) with a resolution higher than 4 cm−1. The same right otoliths were initially analyzed for age determination, according to the traditional reading protocol [1], and subsequently scanned for FT-NIRS spectral absorbance. In agreement with the available literature (see Table 1), principal component analysis (PCA) was chosen for the visualization of data and the identification of possible outliers of the spectrograms, for all samples. Samples that could not be corrected with a repeat scan were excluded from further analysis.

2.3. Choice of the Model
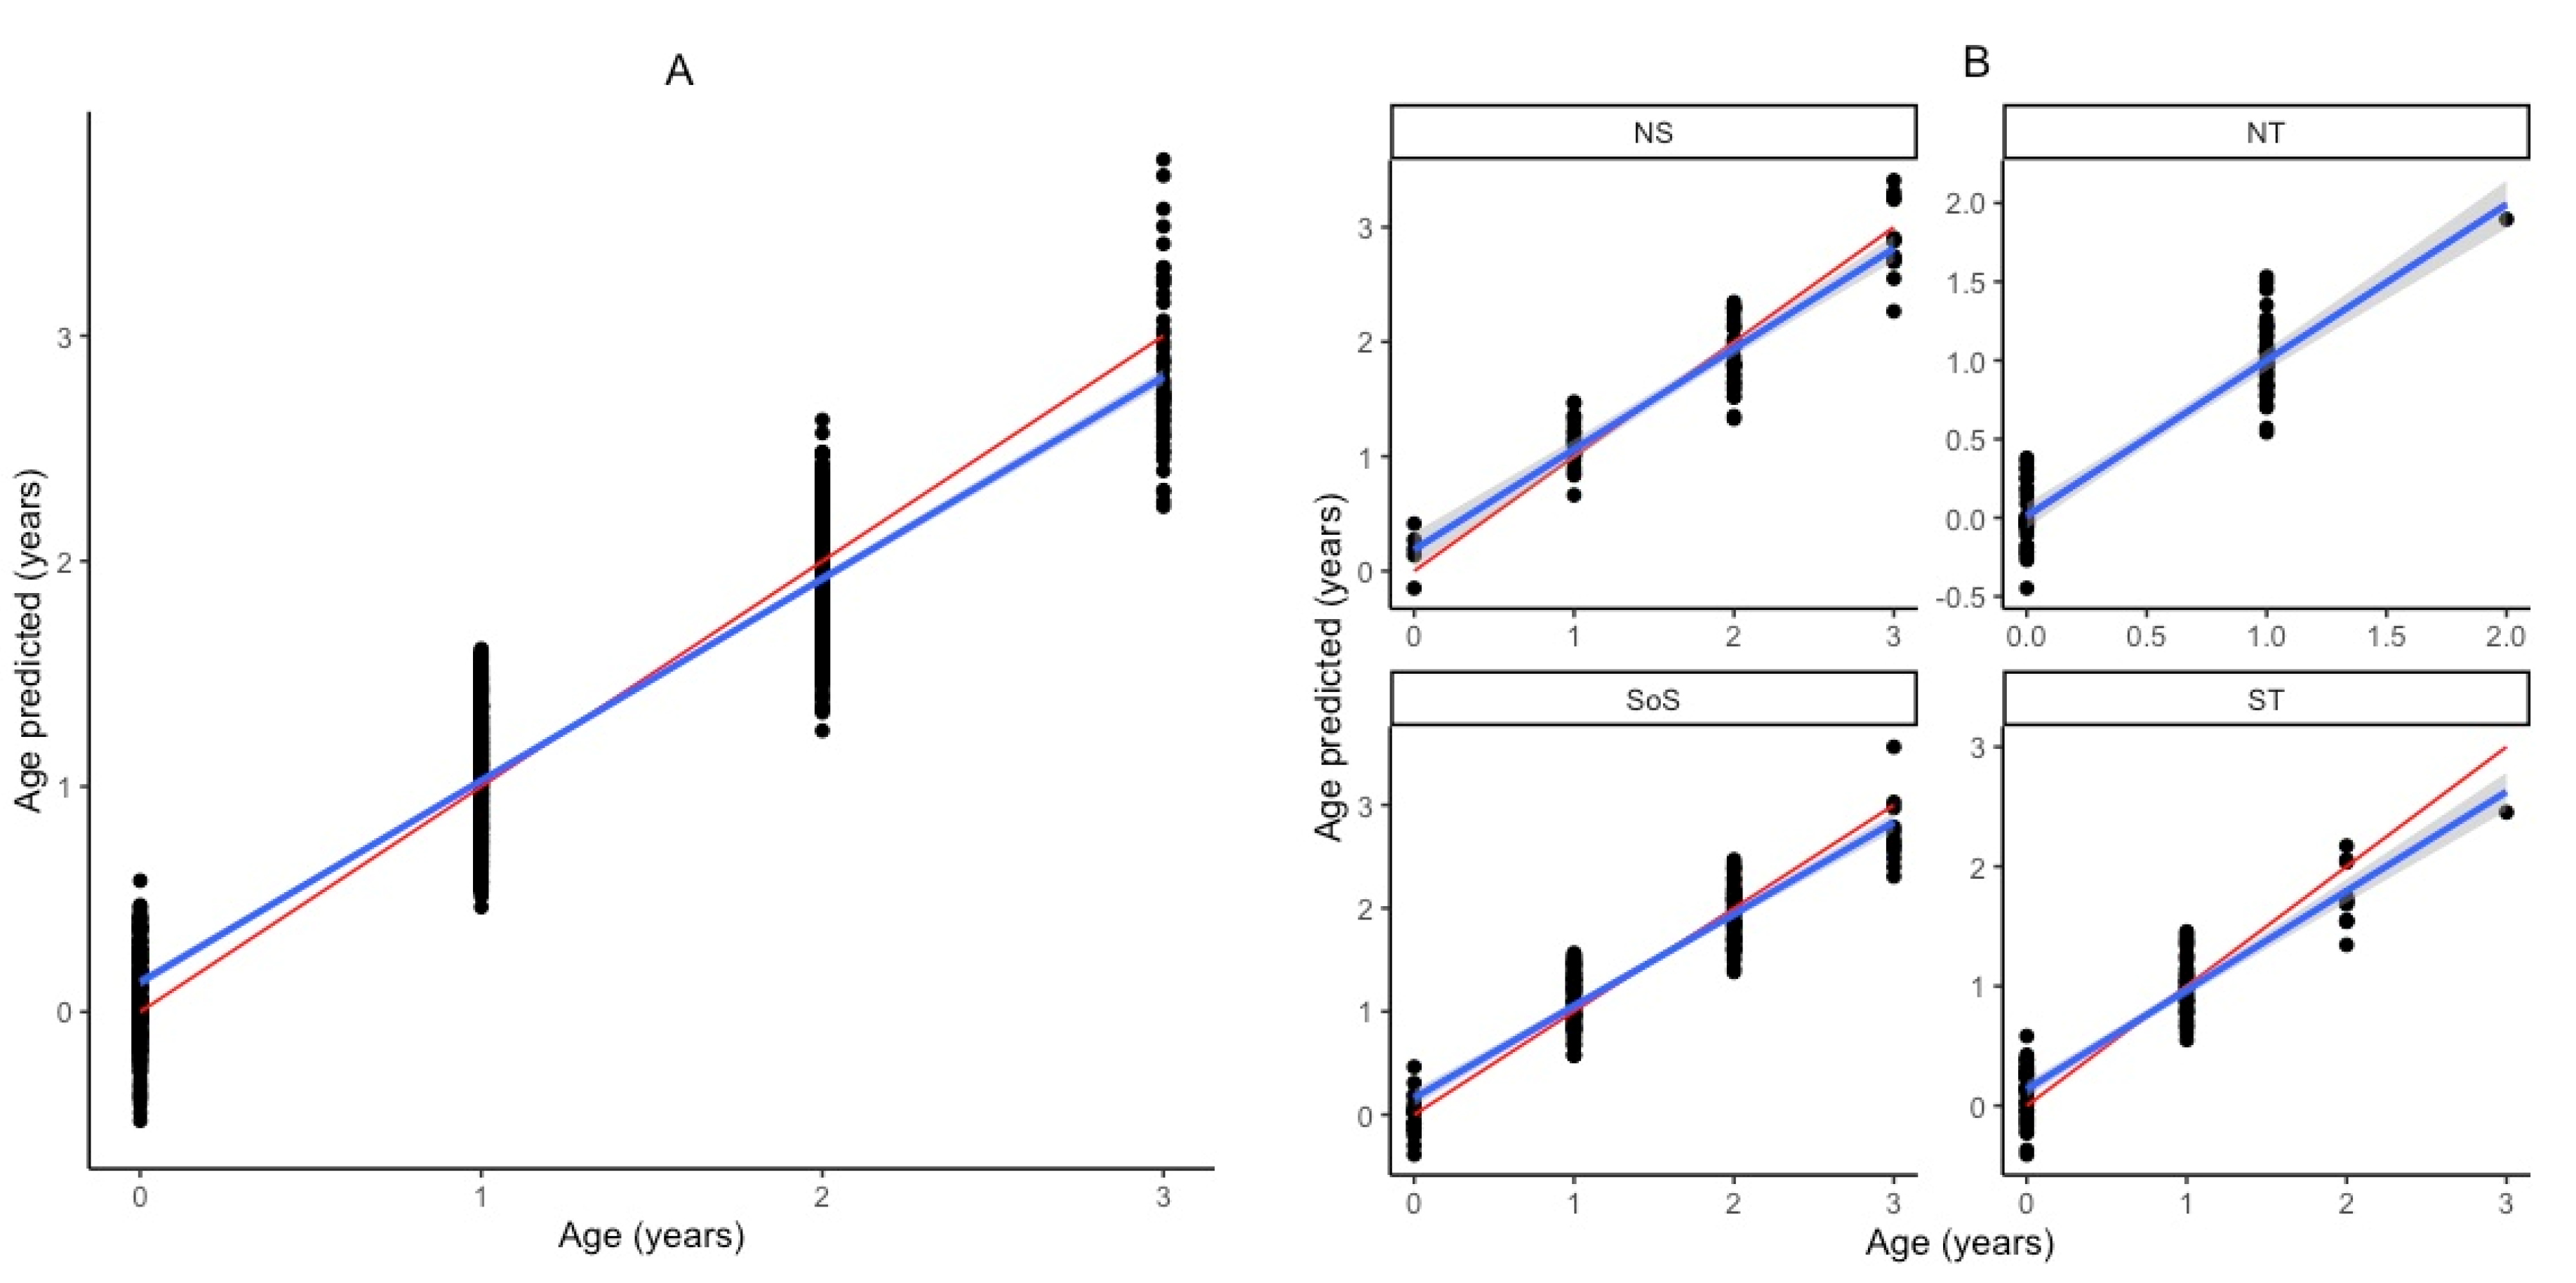
A multivariate calibration method—i.e., Partial Least Squares (PLS) regression—was employed to develop a predictive model using the FT-NIRS spectral data. In PLS regression, the dataset is first decomposed into its principal components and then fitted to the score vectors of spectral and age data [30]. The calibration model was constructed using a set of otoliths with known ages as the training set. PLS regression was employed to correlate spectral signatures with age, generating a linear correlation model capable of predicting the age of individual specimens.
For a high-quality PLS model, the selection of an appropriate frequency range is essential. Consequently, a frequency range of the spectra showing a good correlation (i.e., higher coefficient of determination R2 [30]) between the changes in the spectral and the concentration data should be selected. More details on the robustness and functioning of the PLS model for age assignment purposes have been described by Basilone et al. [26].
An internal cross-validation procedure was applied by the instruments to create the calibration model, testing its agreement with traditional age data. In a second step, an external validation employing a separate test set of otoliths was used to evaluate the predictive capability of the model [12]. The cross-validated model obtained by 30% of the whole spectra acquired (calibration set) was used to predict a new separate set of representative unknown samples, randomly selecting 70% of the whole dataset (test set). Multivariate spectral data fitted by the PLS procedure were then cross-validated [31] by employing the “leave one out” method, which performs validation by repeatedly excluding and adding back samples [26]. The model’s accuracy was evaluated by the coefficient of determination (R2), the root mean square error of cross-validation (RMSECV), and the residual prediction deviation (RPD) values. R2 gives the percentage of variance (explained variance) present in the component values, which is reproduced in the prediction. RMSECV is a quantitative measure of the accuracy with which the samples are predicted during validation; the smaller this error, the better the quality of the model. The background and details for the statistical analysis of FT-NIR spectral data related to otolith annual age are well described in the literature [15,19,26].
The root mean square error of prediction (RMSEP), a quantitative measure of the predictive accuracy of the model, was obtained by comparing the FT-NIRS results with the traditional age data of the test set. The RPD is obtained by the ratio between the standard deviation of the reference data and the standard deviation of the predictions of the calibration model (RMSECV). According to the literature, an RPD value close to or higher than 3 is acceptable [30]. In order to take into account the age range when comparing the model errors, the RMSEP% was also obtained as the ratio between RMSEP and the maximum age [32].
Calibration models were developed both overall, by combining the areas together, and separately for each area, since variability in FT-NIRS-predicted age may be linked to differences in water chemistry, body condition, or growth rate experienced by the fish [15,19,21].
For each test/calibration set pair, a two-sided Kolmogorov–Smirnov (K–S) test was applied in order to check for differences in age distributions derived from FT-NIRS-predicted and traditional age reading [18] and to support FT-NIRS’s predictive capabilities. According to Passerotti et al. [18], the bias between estimation methods was obtained as the difference between predicted ages and traditional ages. The FSA package in R [33] was used to estimate the percentage of agreement (PA) between methods and average percent of error (APE; [34]).
Finally, to account for differences in the application of predicted age data—rather than traditionally determined age—to stock assessment, a von Bertallanfy growth (VBGF) model was fitted according to Basilone et al. [11] on both FT-NIRS and traditional reading age, and respective parameter estimates were compared. The obtained parameters should be considered only for comparison purposes and not for stock assessment, since other aspects, such as the sample representativeness of the study population, were out of the scope of the present work.
The OPUSTM software suite (version 8.5, Bruker Optics GmbH & Co. KG, Ettlingen, Germany) was used for data treatment and spectral data analysis; PCA and statistical tests were performed in R statistical computing software version 4.3.2 [35].

3. Results

FT-NIRS age prediction analyses were performed on 1412 whole otoliths of E. encrasicolus (calibration set, n = 435; test set, n = 977) distributed across four regions (SoS, n = 599; ST, n = 371; NS, n = 210; NT, n = 232) (Figure 3). PCA of the non-pre-processed spectral data for all otoliths showed that the first and second PC axes explained nearly all spectral variation (94.3% and 5.1%, respectively). One-way ANOVA for the second PC axis between the continuous variables (i.e., absorbance of spectra) and the categorical ones (i.e., area and age) showed a positive relationship with age (R2 = 0.51, p < 0.001), while regional differences were less pronounced (R2 = 0.15, p < 0.001). As shown in Figure 4a, there was considerable overlap among regions, whereas age groups appeared more distinctly separated along the second PC axis (Figure 4b).
Most models were optimized using only wavelength selection with no data pre-processing, as this optimization process yielded better model results than any pre-processing regime, in which spectral data were transformed (i.e., no pre-processing, Subtraction of a Constant Offset, Vector Normalization, Min–Max Normalization, Subtraction of a Straight Line, Multiplicative Scatter Correction, and Second Derivative). Only the all-regions-combined (AR) model showed better optimization by first-derivative transformation.
To achieve optimal predictive power for the regional dataset (Table 3), FT-NIRS age calibration models required 6–9 PCs (model rank), indicating that spectral differences accounting for <3% of the total variance were crucial for correct age estimation.
Comparisons between FT-NIRS results with the traditional method showed good agreement between the calibration models and the traditional age estimates, as highlighted by an R2 between 0.83 and 0.90, RMSECV ≤ 0.5 years, bias < 0.005, and RPD > 2.5 (Table 3; Figure 5). Some dissimilarity was detectable in prediction among the regional calibrations, but the combined model for all regions (AR) demonstrated better predictive power, with very low bias and a higher RPD. Also, the RMSE% for the AR was lower than that of the separate regions, except in the case of NT, allowing greater spatial variability to be incorporated in the combined model.
Despite the limited regional variability, pairwise validation was conducted between AR and each regional test set/calibration model combination, showing good predictive performance by the AR model: R2 = 0.93, RMSEP ~ 0.3, and mean bias <0.02 years (Table 4). However, FT-NIRS tended to slightly underestimate the age of older individuals (age > 2 years), in both the AR and regional models. Due to the relatively weak performance of individual regional models, Figure 6 presents only the Partial Least Squares regression results for the AR model.
The mean bias between traditional and predicted age was close to 0 for most of the age classes (0 to 2) and around 0.25 years at age 3. This slight underestimation at age 3 was likely due to the small number of samples in that class (Figure 7). Across the 977 observations from the test set, the PA for annuli counting was 96.52%, APE was 1.12, and the mean CV was 1.58.
The results of the K-S test, applied to the calibration model (i.e., AR) obtained from data by two age estimates, highlighted insignificant differences (D = 0.01, p-value = 1) between the two age distributions (traditional and FT-NIRS). Similarly, the VBGF models showed comparable values in both FT-NIRS-predicted and traditional age estimates (Table 5).
At wavenumbers from 9500 to 4500 cm−1, PCA attributed the largest contribution to spectral variance in all regional models (Table 3). The areas of the light spectrum with the highest importance to the model, represented by the loadings plot, showed an overall similar range of loadings across areas, despite the higher absorbance variation of the NS model (Figure 8). Among the regional models, NS had the highest Rank and Bias and a narrower wavenumber range (Table 3). Indeed, the optimization process selected a narrower range for the NS model (7504–4600 cm−1), compared to other regions (generally 9400–4248 cm−1). This narrower range may amplify the differences within the limited spectral window, thereby increasing absorbance variation [3].

4. Discussion

Accurate recognition of both the first annulus and false rings, interpretation and identification of the edge characteristics, and otolith preparation techniques are all recognized as major sources of error in E. encrasicolus age determination [1]. These factors contribute to the uncertainty in age estimates and reduces the reliability of age structure models provided within the stock assessment programs. FT-NIR spectra, by contrast, capture the full variability of the complex otolith growth history, including spawning and ontogenetic checks laid down, particularly during the first year. Unlike traditional visual methods, which are challenged by features such as false rings, microincrements, and fuzzy edge zones, FT-NIRS offers a more objective, chemistry-based approach.
FT-NIRS has been successfully applied to age estimation in various fish species over the last decade (Table 1), but most studies have focused on long-lived species with age ranges exceeding 10 years and up to 40 years. This study represents the first application of FT-NIRS to a short-lived species with an age span limited to four years. The spectral analyses confirmed the feasibility of using FT-NIRS analyses on otoliths for age estimation, with a calibration model demonstrating strong predictive power. A slight underestimation was noted for age 3 in the test set (Figure 7a), likely due to the limited number of samples from older individuals (Figure 6). Similar trends have been reported in the literature, where reduced prediction accuracy was observed in underrepresented age classes, and studies revealed greater uncertainty in FT-NIRS analyses for poorly represented age classes [26]. Even in traditional aging, estimates are less reliable when certain age groups are poorly represented [28]. While not fully encompassing the complexity of growth models currently used for stock assessment purposes, this study showed no weaknesses of using FT-NIRS age estimates for growth models such as VBGF, supporting the feasibility of the FT-NIRS model for E. encrasicolus aging.
Fish growth, including that of anchovy, is known to vary with habitat conditions and density-dependent effects [36,37,38]. A previous study demonstrated the ability of FT-NIRS to discriminate among species and habitats (e.g., [27]) using the differences in spectral regions and absorbance; however, the present results reveal a negligible variability among areas. Previous observations on E. encrasicolus growth have already revealed no significant differentiation in otoliths among Mediterranean regions [11], despite differences in environmental features [29]. Although the present and previous studies have confirmed the potential and efficiency of FT-NIRS spectra compared to traditional age estimates, some limitations still hinder the widespread adoption of this technique. These limitations are primarily due to otolith composition, which is species-specific and influenced by environmental parameters [39,40]. Therefore, the different biological and ecological histories of fish may compromise the ability of FT-NIRS to accurately predict age, with the consequence that this method may be not suitable for all fish species. For broader and more accurate FT-NIRS application, greater spatial and temporal variability should be incorporated into the calibration model to allow further improvement, accounting for variability in environmental conditions and in fish growth.
The superior performance of the AR model—reflected in optimized R2, RMSEP, and RPD values in most test sets (Table 4)—highlights the benefits of a larger sample size and broader spatial coverage. Previous studies have shown that reduced predictive accuracy may result from the unbalanced representation of age classes or sampling gear selectivity. However, they also found that model performance improved significantly when the otolith collection was expanded and spectral acquisition increased [19]. These findings are consistent with our results for E. encrasicolus in the Mediterranean (Table 3).
FT-NIRS operates within the wavenumber range covering specific chemical bonds (i.e., N-H, O-H, and C-H), their stretching vibrations, and their combinations [22]. The statistics of the prediction models and the selected wavenumber regions of the spectrum in the present study were similar to those reported in previous studies, whether analyzing otoliths or other hard structures (e.g., vertebrae) (Table 1 and Table 3). Indeed, although the whole interrogated spectrum ranged between 11,500 cm−1 and 4000 cm−1, the otolith prediction models relied on the range between 9000 cm−1 and 4000 cm−1 across different fish species, including E. encrasicolus (Table 1 and Table 3). In the case of the present samples, the use of raw spectra proved more predictive than derivatives or other transformations performed; however, some experiments on other species obtained better results from first and second derivatives (Table 1).
Although the establishment of new techniques usually implicates initial difficulties, including choosing the best-performing data type and/or samples for each species, the OPUSTM software, which works in conjunction with the spectrometer, proved to be a useful aid in launching the routine operations and identifying the calibration model. Once the calibration model is approved and validated, the software facilitates the age estimation of new otoliths, as in the case of regularly monitored stocks, reducing the analysis time and improving the data accuracy. Increasing otolith collections allows the inclusion of a wider range of spectral variability, which enhances the accuracy of models, when previously underrepresented age classes are adequately incorporated. Although the introduction of the FT-NIRS method for routine use required an initial effort for model creation and selection based on a reference collection for the investigated species, a historical series of otolith samples may create a checkpoint for quality control [18], particularly for species like E. encrasicolus that are monitored each year for sustainable exploitation [3,41].

Author Contributions

Conceptualization, G.B.; software, G.G. and I.F.; validation, A.B. and S.A.; formal analysis, M.F. and G.L.C.; investigation, S.G.; data curation, G.B.; writing—original draft, G.B., M.F. and G.L.C.; writing—review and editing, S.G., A.B., S.A. and R.F.; supervision, R.F. All authors have read and agreed to the published version of the manuscript.

Funding

This research received no external funding.

Data Availability Statement

The raw data supporting the conclusions of this article will be made available by the authors on request.

Acknowledgments

The authors extend special thanks to the technicians of the CNR-IAS laboratory; to the people involved in the research project “MEDiterranean International Acoustic Survey” and who took part in the sampling at sea; and, finally, to the personnel of the research vessel “G. Dallaporta”.

Conflicts of Interest

The authors declare no conflict of interest.

References

  1. ICES. Workshop 3 on Age Estimation of European Anchovy (Engraulis encrasicolus) (WKARA3; Outputs from 2021 Meeting); ICES Scientific Reports; ICES: Copenhagen, Denmark, 2023; p. 59. [Google Scholar]
  2. ICES. Report of Otolith Exchange Analysis for Anchovy. Coordinated by Begoña Villamor, Andres Uriarte and Gualtiero Basilone; ICES: Copenhagen, Denmark, 2018; p. 95. [Google Scholar]
  3. FAO. The State of Mediterranean and Black Sea Fisheries 2023; FAO: Rome, Italy, 2023; ISBN 978-92-5-138411-4. [Google Scholar]
  4. Cury, P. Small Pelagics in Upwelling Systems: Patterns of Interaction and Structural Changes in “Wasp-Waist” Ecosystems. ICES J. Mar. Sci. 2000, 57, 603–618. [Google Scholar] [CrossRef]
  5. Basilone, G.; Ferreri, R.; Barra, M.; Bonanno, A.; Pulizzi, M.; Gargano, A.; Fontana, I.; Giacalone, G.; Rumolo, P.; Mazzola, S.; et al. Spawning Ecology of the European Anchovy (Engraulis encrasicolus) in the Strait of Sicily: Linking Variations of Zooplankton Prey, Fish Density, Growth, and Reproduction in an Upwelling System. Prog. Oceanogr. 2020, 184, 102330. [Google Scholar] [CrossRef]
  6. Fanelli, E.; Da Ros, Z.; Menicucci, S.; Malavolti, S.; Biagiotti, I.; Canduci, G.; De Felice, A.; Leonori, I. The Pelagic Food Web of the Western Adriatic Sea: A Focus on the Role of Small Pelagics. Sci. Rep. 2023, 13, 14554. [Google Scholar] [CrossRef] [PubMed]
  7. European Union. Regulation (EU) Regulation (EU) 2017/1004 of the European Parliament and of the Council of 17 May 2017 on the Establishment of a Union Framework for the Collection, Management and Use of Data in the Fisheries Sector and Support for Scientific Advice Regarding the Common Fisheries Policy and Repealing Council Regulation (EC) No 199/2008 (Recast). 2017. Available online: https://eur-lex.europa.eu/legal-content/EN/ALL/?uri=CELEX:32017R1004 (accessed on 11 May 2025).
  8. Lleonart, J.; Maynou, F. Fish Stock Assessments in the Mediterranean: State of the Art. Sci. Mar. 2003, 67, 37–49. [Google Scholar] [CrossRef]
  9. Leonori, I.; Tičina, V.; Giannoulaki, M.; Hattab, T.; Iglesias, M.; Bonanno, A.; Costantini, I.; Canduci, G.; Machias, A.; Ventero, A.; et al. History of Hydroacoustic Surveys of Small Pelagic Fish Species in the European Mediterranean Sea. Medit. Mar. Sci. 2021, 22, 751. [Google Scholar] [CrossRef]
  10. ICES. Report of the Workshop on Age Estimation of European Anchovy (Engraulis encrasicolus). WKARA2 2016 Report 28 November–2 December 2016. Pasaia, Spain; ICES: Copenhagen, Denmark, 2017; p. 223. [Google Scholar]
  11. Basilone, G.; Mangano, S.; Pulizzi, M.; Fontana, I.; Giacalone, G.; Ferreri, R.; Gargano, A.; Aronica, S.; Barra, M.; Genovese, S.; et al. European Anchovy (Engraulis encrasicolus) Age Structure and Growth Rate in Two Contrasted Areas of the Mediterranean Sea: The Paradox of Faster Growth in Oligotrophic Seas. Medit. Mar. Sci. 2017, 18, 504. [Google Scholar] [CrossRef]
  12. Williams, P. Near Infrared Technology: Getting the Best Out of Light, 1st ed.; African Sun Media: Stellenbosch, South Africa, 2019; ISBN 978-1-928480-31-0. [Google Scholar]
  13. Williams, P.; Norris, K.H.; American Association of Cereal Chemists (Eds.) Near-Infrared Technology in the Agricultural and Food Industries; American Association of Cereal Chemists: St. Paul, MN, USA, 1987; ISBN 978-0-913250-49-5. [Google Scholar]
  14. Siesler, H.W.; Ozaki, Y.; Kawata, S.; Heise, H.M. (Eds.) Near-Infrared Spectroscopy: Principles, Instruments, Applications, 1st ed.; Wiley: Hoboken, NJ, USA, 2001; ISBN 978-3-527-30149-2. [Google Scholar]
  15. Helser, T.E.; Benson, I.; Erickson, J.; Healy, J.; Kastelle, C.; Short, J.A. A Transformative Approach to Ageing Fish Otoliths Using Fourier Transform near Infrared Spectroscopy: A Case Study of Eastern Bering Sea Walleye Pollock (Gadus chalcogrammus). Can. J. Fish. Aquat. Sci. 2019, 76, 780–789. [Google Scholar] [CrossRef]
  16. Vance, C.K.; Tolleson, D.R.; Kinoshita, K.; Rodriguez, J.; Foley, W.J. Near Infrared Spectroscopy in Wildlife and Biodiversity. J. Near Infrared Spectrosc. 2016, 24, 1–25. [Google Scholar] [CrossRef]
  17. Helser, T.E.; Benson, I.M.; Barnett, B.K. (Eds.) Proceedings of the Research Workshop on the Rapid Estimation of Fish Age Using Fourier Transform Near Infrared Spectroscopy (FT-NIRS); AFSC Processed Report 2019-06; NOAA: Seattle, WA, USA, 2019; 195p. [Google Scholar] [CrossRef]
  18. Passerotti, M.S.; Helser, T.E.; Benson, I.M.; Barnett, B.K.; Ballenger, J.C.; Bubley, W.J.; Reichert, M.J.M.; Quattro, J.M. Age Estimation of Red Snapper (Lutjanus campechanus) Using FT-NIR Spectroscopy: Feasibility of Application to Production Ageing for Management. ICES J. Mar. Sci. 2020, 77, 2144–2156. [Google Scholar] [CrossRef]
  19. Wedding, B.B.; Forrest, A.J.; Wright, C.; Grauf, S.; Exley, P.; Poole, S.E. A Novel Method for the Age Estimation of Saddletail Snapper (Lutjanus malabaricus) Using Fourier Transform-near Infrared (FT-NIR) Spectroscopy. Mar. Freshwater Res. 2014, 65, 894. [Google Scholar] [CrossRef]
  20. Rigby, C.L.; Wedding, B.B.; Grauf, S.; Simpfendorfer, C.A. The Utility of near Infrared Spectroscopy for Age Estimation of Deepwater Sharks. Deep. Sea Res. Part I Oceanogr. Res. Pap. 2014, 94, 184–194. [Google Scholar] [CrossRef]
  21. Robins, J.B.; Wedding, B.B.; Wright, C.; Grauf, S.; Sellin, M.; Fowler, A.; Saunders, T.; Newman, S. Revolutionising Fish Ageing: Using Near Infrared Spectroscopy to Age Fish; Department of Agriculture and Fisheries: Brisbane, Australia, 2015. [Google Scholar]
  22. Rigby, C.L.; Wedding, B.B.; Grauf, S.; Simpfendorfer, C.A. Novel Method for Shark Age Estimation Using near Infrared Spectroscopy. Mar. Freshwater Res. 2016, 67, 537. [Google Scholar] [CrossRef]
  23. Wright, C.; Wedding, B.B.; Grauf, S.; Whybird, O.J. Age Estimation of Barramundi (Lates calcarifer) over Multiple Seasons from the Southern Gulf of Carpentaria Using FT-NIR Spectroscopy. Mar. Freshwater Res. 2021, 72, 1268–1279. [Google Scholar] [CrossRef]
  24. Healy, J.; Helser, T.E.; Benson, I.M.; Tornabene, L. Aging Pacific Cod (Gadus macrocephalus) from Otoliths Using Fourier-transformed Near-infrared Spectroscopy. Ecosphere 2021, 12, e03697. [Google Scholar] [CrossRef]
  25. Arrington, M.B.; Helser, T.E.; Benson, I.M.; Essington, T.E.; Matta, M.E.; Punt, A.E. Rapid Age Estimation of Longnose Skate (Raja Rhina) Vertebrae Using Nearinfrared Spectroscopy. Mar. Freshwater Res. 2021, 73, 71–80. [Google Scholar] [CrossRef]
  26. Basilone, G.; Lo Cicero, G.; Fortuna, M.; Luviner, A.; Ferreri, R.; Aronica, S.; Genovese, S.; Giacalone, G.; Fontana, I.; Bonanno, A. Fourier-Transform near-Infrared Spectroscopy First Application to Age Determination in European Fish Species: The Case of the Atlantic Horse Mackerel from the Central Mediterranean Sea. Front. Mar. Sci. 2024, 11, 1429150. [Google Scholar] [CrossRef]
  27. Benson, I.M.; Barnett, B.K.; Helser, T.E. Classification of Fish Species from Different Ecosystems Using the near Infrared Diffuse Reflectance Spectra of Otoliths. J. Near Infrared Spectrosc. 2020, 28, 224–235. [Google Scholar] [CrossRef]
  28. Basilone, G.; Ferreri, R.; Bonanno, A.; Genovese, S.; Barra, M.; Aronica, S. Age and Growth of European Sardine (Sardina Pilchardus) in the Central Mediterranean Sea: Implication for Stock Assessment. Fishes 2023, 8, 202. [Google Scholar] [CrossRef]
  29. Pinardi, N.; Zavatarelli, M.; Adani, M.; Coppini, G.; Fratianni, C.; Oddo, P.; Simoncelli, S.; Tonani, M.; Lyubartsev, V.; Dobricic, S.; et al. Mediterranean Sea Large-Scale Low-Frequency Ocean Variability and Water Mass Formation Rates from 1987 to 2007: A Retrospective Analysis. Prog. Oceanogr. 2015, 132, 318–332. [Google Scholar] [CrossRef]
  30. Conzen, J.P. Multivariate Calibration. A Practical Guide for Developing Methods in the Quantitative Analytical Chemistry, 3rd English ed.; Bruker Optik GmbH: Ettlingen, Germany, 2014; ISBN 3-929431-13-3. [Google Scholar]
  31. Chen, J.; Wang, X.Z. A New Approach to Near-Infrared Spectral Data Analysis Using Independent Component Analysis. J. Chem. Inf. Comput. Sci. 2001, 41, 992–1001. [Google Scholar] [CrossRef]
  32. Couture, J.J.; Singh, A.; Rubert-Nason, K.F.; Serbin, S.P.; Lindroth, R.L.; Townsend, P.A. Spectroscopic Determination of Ecologically Relevant Plant Secondary Metabolites. Methods Ecol. Evol. 2016, 7, 1402–1412. [Google Scholar] [CrossRef]
  33. Ogle, D.H. Introductory Fisheries Analyses with R, 1st ed.; Chapman and Hall/CRC: Boca Raton, FL, USA, 2016; ISBN 978-1-315-37198-6. [Google Scholar]
  34. Beamish, R.J.; Fournier, D.A. A Method for Comparing the Precision of a Set of Age Determinations. Can. J. Fish. Aquat. Sci. 1981, 38, 982–983. [Google Scholar] [CrossRef]
  35. R Core Team. R: A Language and Environment for Statistical Computing; R Foundation for Statistical Computing: Vienna, Austria, 2023. [Google Scholar]
  36. Aldanondo, N.; Cotano, U.; Etxebeste, E. Growth of Young-of-the-Year European Anchovy (Engraulis encrasicolus L.) in the Bay of Biscay. Sci. Mar. 2010, 75, 227–235. [Google Scholar] [CrossRef]
  37. Brunel, T.; Dickey-Collas, M. Effects of Temperature and Population Density on von Bertalanffy Growth Parameters in Atlantic Herring: A Macro-Ecological Analysis. Mar. Ecol. Prog. Ser. 2010, 405, 15–28. [Google Scholar] [CrossRef]
  38. Bacha, M.; Amara, R. Inter-Cohort Differences in Growth, Condition and Feeding of Juvenile Anchovy (Engraulis encrasicolus) in the Gulf of Béjaia (Algerian Coast, SW Mediterranean): Implications for Recruitment Success. Fish. Res. 2012, 129–130, 73–81. [Google Scholar] [CrossRef]
  39. Radtke, R.; Shafer, D. Environmental Sensitivity of Fish Otolith Microchemistry. Mar. Freshwater Res. 1992, 43, 935. [Google Scholar] [CrossRef]
  40. Tabouret, H.; Lord, C.; Bareille, G.; Pécheyran, C.; Monti, D.; Keith, P. Otolith Microchemistry in Sicydium Punctatum: Indices of Environmental Condition Changes after Recruitment. Aquat. Living Resour. 2011, 24, 369–378. [Google Scholar] [CrossRef]
  41. ICES. Working Group on Biological Parameters (WGBIOP); ICES Scientific Reports; ICES: Copenhagen, Denmark, 2024; p. 372. [Google Scholar]
Figure 1. Sampling area with separate survey regions: Strait of Sicily (SoS) in red, North of Sicily and Calabria (NS) in magenta, South Tyrrhenian Sea (ST) in green, and North Tyrrhenian Sea (NT) in blue. The black line represents the 200 m isobath.
Jmse 13 00961 g001
Figure 2. E. encrasicolus age distributions for the calibration set and the test set for (A) all regions combined; and (B) each region: North of Sicily and Calabria (NS), North Tyrrhenian (NT), Strait of Sicily (SoS), and South Tyrrhenian (ST).
Jmse 13 00961 g002
Figure 3. View of an otolith placed on the integrating sphere with a 90° compass orientation and an upward concave position. The gold-coated reflector covered the specimen during scanning to reduce stray light infiltration. To standardize measurements, reference marks were placed on the top, positioning the otolith in the center of the sample window.
Jmse 13 00961 g003
Figure 4. PCA of non-pre-processed spectral data for all the analyzed otoliths (a) by region [Strait of Sicily (SoS), North of Sicily and Calabria (NS), South Tyrrhenian Sea (ST), and North Tyrrhenian Sea (NT)] and (b) by age group (0 to 3).
Jmse 13 00961 g004
Figure 5. Linear regression plots of calibration set of E. encrasicolus age predicted by FT-NIRS: (A) all regions (AR) and (B) single region: North of Sicily and Calabria (NS), North Tyrrhenian (NT), Strait of Sicily (SoS), and South Tyrrhenian (ST). The blue line is the linear regression with confidence limits (gray shadow), and the red line represents the 1:1 ideal regression line.
Jmse 13 00961 g005
Figure 6. Plots of test set regression models for E. encrasicolus age predicted by FT-NIRS. (A): All regions (AR); (B): single region: North of Sicily and Calabria (NS), North Tyrrhenian (NT), Strait of Sicily (SoS), and South Tyrrhenian (ST). The blue line is the linear regression with confidence limits (gray shadow), and the red line represents the 1:1 ideal regression line.
Jmse 13 00961 g006
Figure 7. (a) Plot of mean bias (circles) ± confidence intervals (red, positive; black, negative) and variability range (gray) for E. encrasicolus predicted and traditional ages for all test sets combined, as predicted by the combined calibration model for all regions (AR). Frequency distribution across age (top) and age class (right side) are also plotted. (b) Frequency distribution of differences in reading between traditional and predicted ages.
Jmse 13 00961 g007
Figure 8. Loadings plot of regression coefficients for each regional age calibration model: North Tyrrhenian (NT), South Tyrrhenian (ST), North of Sicily and Calabria (NS), and Strait of Sicily (SoS).
Jmse 13 00961 g008
Table 1. Calibration models for fish age predicted by FT-NIRS, by analyses of different kinds of hard structures (Structure), in several Species and Area. Coefficient of determination (R2); root mean square error of cross-validation (RMSECV); the RMSECV/maximum age included in cross-validation model in percentage (RMSE%); number of PC factors in the final model (Rank). AU = Australia; US = United States; EU = Europe.
StudySpeciesAreaAge Range (Years)StructurenR2RMSECVRMSE%BiasRankWavenumber Range
Wedding et al. [19]Lutjanus malabaricusAU1–23Otolith1690.941.355.87−0.00547400–4000
Rigby et al. [20]Squalus megalopsAU5–25Vertebrae970.891.857.4−0.00449300–8200
7800–6800
4600–4000
5–25Dorsal fin spine970.822.419.64−0.00839300–8200
7800–6800
4600–4000
Squalus montalbaniAU5–25Fin clip970.762.6710.7−0.05879300–8200
7800–6800
4600–4000
3–31Dorsal fin spine950.732.969.540.05249300–8200
7800–6800
4600–4000
Robins et al. [21]Lates calcariferAU2–12Otolith2980.860.756.250.334832–4327
Pagrus auratusAU3–25Otolith3060.881.536.12−0.06026160–4580
Rigby et al. [22]Sphyrna mokarranAU0–10Vertebrae760.890.878.520.01259200–4000
Carcharhinus sorrahAU0–10Vertebrae990.840.888.97−0.00759200–4000
Wright et al. [23]Lates calcariferAU1–10Otolith3970.867.11-−0.005-7255–4140
Helser et al. [15]Gadus chalcogrammusUS1–16Otolith2020.950.784.870.002-6821–5269
-5022–4171
Passerotti et al. [18]Lutjanus campechanusUS0–38Otolith5100.941.584.160.00197600–4100
Healy et al. [24]Gadus macrocephalusUS1–11Otolith4980.840.588-−0.070107464–3952
Arrington et al. [25]Raja rhinaUS0–14Vertebrae6330.861.389.87--12,000–4000
Basilone et al. [26]Trachurus trachurusEU0–14Otolith10840.950.413.420.002107504–4248
Table 2. Sampling overview of E.encrasicolus individuals used for obtaining the two analyzed subsets (calibration and test sets). Sampling date: year and month sampling; n: number of otoliths; fish size range: total length; age range: age class; area: Strait of Sicily (SoS), North of Sicily and Calabria (NS), South Tyrrhenian Sea (ST), and North Tyrrhenian Sea (NT).
Sampling DateAreanFish Size Range (cm)Age Range
2023 (July)SoS28811–161–3
NS1109–160–2
ST1688–150–2
2022 (August–September)SoS2286–150–2
NS4212–151–2
NT2325–130–2
ST2037–150–3
2021 (July–August)SoS215–162–3
NS1515–162–3
2020 (August)SoS215–162–3
NS315–162–3
2019 (August)SoS1415–162–3
2018 (August)SoS1415–162–3
NS715–162–3
2017 (July–August)SoS715–162–3
NS2415–172–3
2015 (July–August)SoS715–162–3
NS215–162–3
2014 (June–July)SoS515–162–3
NS315–162–3
2013 (May–June)SoS1315–162–3
NS314–153
2012 (June–July)SoS2013–162–3
Table 3. Calibration model results for E. encrasicolus obtained by FT-NIRS age prediction, calculated for each region (NT: North Tyrrhenian; ST: South Tyrrhenian; NS: North of Sicily and Calabria; SoS: Strait of Sicily) and for all regions combined (AR). Coefficient of determination (R2); root mean square error of cross-validation (RMSECV); the RMSECV/maximum age included in cross-validation model in percentage (RMSE%); number of PC factors in the final model (Rank). The list is top-down-ordered according to the RMSECV (lower), R2 (higher), and RPD (higher) values.
Calibration
Model
nMaxRankR2RMSECVRMSE%BiasRPDSlopeOffsetWavenumber
Range
Pre-Processing
AR4363989.70.2719−0.0013.120.9060.1119400–4248First Derivative
SoS1953684.220.30310.10.0012.520.8550.2049400–4248None
NT693688.830.1745.8−0.0012.990.8920.0659400–4248None
ST1003683.640.2829.40.0052.470.8550.0989400–4600None
NS723888.190.2859.50.0112.910.8910.187504–4600None
Table 4. Validation results for the age prediction of test sets for each region (NT: North Tyrrhenian; ST: South Tyrrhenian; NS: North of Sicily and Calabria; SoS: Strait of Sicily) and all regions combined (AR), relative to the corresponding calibration model used for testing (in parentheses). The slope and offset correction sets the values of a regression line to the values of the origin by subtracting the offset (i.e., the ordinate) from the respective points. The spectral regions selected by the optimization process are also shown. The list is top-down-ordered according to the coefficient of determination (R2); root mean square error of cross-validation (RMSECV); the RMSECV/maximum age included in cross-validation model in percentage (RMSE%); and residual prediction deviation (RPD).
Test Set vs. Calibration TestnMax. AgeR2RMSEPRMSE%BiasRPDSlopeOffset
ST vs. (AR)27130.910.2465.92−0.04112.50.8570.137
ST vs. (ST)27130.910.2568.53−0.03592.390.9060.099
AR vs. (AR)97730.930.2638.76−0.02362.740.8880.141
NS vs. (AR)13830.90.2859.5−0.01282.320.8560.234
NS vs. (NS)13830.860.33711.23−0.02431.960.8120.313
NT vs. (AR)16330.910.2257.55−0.01612.430.950.049
NT vs. (NT)16330.90.2357.830.02592.330.8020.106
SoS vs. (AR)40530.90.2819.36−0.01872.360.840.225
SoS vs. (SoS)40530.880.31410.46−0.0022.110.7770.29
Table 5. Parameters of VBGF (von Bertallanfy growth) obtained from the model with traditional age reading (Obs.) and the model with FT-NIRS prediction (Pred.). Significance probability: *** p < 0.001.
ParametersEstimateStd. Errort ValuePr(>|t|)
Obs.Linf1651.9350685.30<2 × 10⁻¹⁶ ***
K0.760.0368620.75<2 × 10⁻¹⁶ ***
t0−0.980.03711−26.43<2 × 10⁻¹⁶ ***
Pred.Linf1641.9340984.69<2 × 10⁻¹⁶ ***
K0.780.0388920.14<2 × 10⁻¹⁶ ***
t0−0.970.03807−25.51<2 × 10⁻¹⁶ ***
Disclaimer/Publisher’s Note: The statements, opinions and data contained in all publications are solely those of the individual author(s) and contributor(s) and not of MDPI and/or the editor(s). MDPI and/or the editor(s) disclaim responsibility for any injury to people or property resulting from any ideas, methods, instructions or products referred to in the content.

