Article

Reservoir Characterization Based on Bayesian Amplitude Versus Offset Inversion of Marine Seismic Data

1
National Engineering Research Center of Offshore Oil and Gas Exploration, Beijing 100028, China
2
CNOOC Research Institute Ltd., Beijing 100028, China
3
School of Geoscience and Info-Physics, Central South University, Changsha 410083, China
4
CNOOC (China) Limited Beijing New Energy Branch, Beijing 102200, China
*
Author to whom correspondence should be addressed.
J. Mar. Sci. Eng. 2025, 13(5), 948; https://doi.org/10.3390/jmse13050948
Submission received: 26 March 2025 / Revised: 8 May 2025 / Accepted: 8 May 2025 / Published: 13 May 2025
(This article belongs to the Special Issue Modeling and Waveform Inversion of Marine Seismic Data)

Abstract

:
Young’s modulus and Poisson’s ratio are critical parameters for reservoir characterization using marine seismic data. Conventional amplitude versus offset (AVO) inversion methods often assume a constant S-to-P wave velocity ratio to simplify the inversion, leading to significant errors, particularly in heterogeneous reservoirs. To address this, we derive a novel four-term PP-wave reflection coefficient by reparameterizing Poisson’s ratio, effectively reducing the nonlinearity associated with the velocity ratio and enhancing the stability of Poisson’s ratio estimation. Building on this, we propose a Bayesian AVO inversion framework incorporating Cauchy prior and low-frequency model regularizations. The elastic parameters are estimated using a maximum a posteriori (MAP) approach by minimizing the negative log-posterior function. Numerical simulations and seismic gather data from East China demonstrate that the proposed inversion method yields more accurate estimates of Young’s modulus and Poisson’s ratio compared to conventional approaches. This improved AVO approximation offers a more reliable tool for delineating reservoir heterogeneity in complex geological settings using marine seismic data.

1. Introduction

Young’s modulus and Poisson’s ratio, two fundamental elastic parameters used to describe the isotropic and linearly elastic stress–strain behavior, have been widely used for comprehensive seismic reservoir characterizations1 [1,2,3,4]. Moreover, because Poisson’s ratio usually decreases with the increasing fluid compressibility and compressible fluid saturation, Poisson’s ratio is generally regarded as a “fluid factor” or “direct hydrocarbon indicator (DHI)” [5,6,7]. In addition, rocks with high Young’s modulus and low Poisson’s ratio have more potentials for quartz-rich and brittle failure, so several novel definitions of brittleness index combining Young’s modulus and Poisson’s ratio have been proposed to depict the brittle properties of rocks, especially for the unconventional shale rocks [8,9,10,11]. Furthermore, Young’s modulus and Poisson’s ratio estimated from 3D surface seismic data, along with static moduli for calibration, can be applied to geomechanical model building, stress analysis, and other engineering applications [12,13,14,15,16,17]. Hence, it is necessary to develop techniques for accurately estimating Young’s modulus and Poisson’s ratio of subsurface rocks using the surface seismic data.
Amplitude variation with offset (AVO) inversion based on the linearized Zoeppritz approximations has been commonly used for estimating elastic parameters and reservoir properties during the past few decades [18,19,20,21,22]. Most commonly, AVO inversion is used to estimate elastic properties such as P-wave and S-wave impedances (also known as acoustic and shear impedances), as well as density, using approximations like Fatti’s [23] approximation equation [24]. According to the relationships between different elastic parameters in an isotropic medium, Young’s modulus and Poisson’s ratio can be calculated indirectly from the inverted data volumes of P- and S-wave impedances and density [13]. However, seismically derived P- and S-wave impedances have inherent estimation errors and uncertainties, which especially exist in the inverted density at some cases when the offset of seismic data is not long enough [25]. Furthermore, the indirect calculation involves multiplication, division, and square operations, all of which inevitably enlarge the inversion error and compromise the result reliability [26,27,28].
Direct inversion for Young’s modulus and Poisson’s ratio can reduce the uncertainty of estimation results [29]. To that end, Zong et al. [29] derive a novel approximate AVO equation for PP-wave reflection coefficients (known as the YPD approximation) in terms of Young’s modulus, Poisson’s ratio, and density, and use that equation to estimate Young’s modulus and Poisson’s ratio directly. Pan et al. [27] extend this YPD-type parameterization to the PP-wave azimuthal AVO equation for predicting brittleness and fracture parameters in a horizontal transversely isotropic (HTI) medium. Sharifi et al. [30] demonstrate that the extended elastic impedance (EEI) can be applied to extraction of geomechanical parameters, based on that the intercept–gradient coordinate rotation angle χ is appropriately chosen. In contrast to the approximate AVO equations, Zhou et al. [31], and Ma and Sun [32] provide the exact Zoeppritz equation in terms of Young’s modulus, Poisson’s ratio, and density, and utilize the generalized linear inversion strategy to iteratively solve the nonlinear cost function using the first-order approximation.
Using the linearized AVO approximations, AVO inversion of seismic data can provide useful information about the reservoir characteristics for the oil and gas exploration and development [33,34,35,36,37]. The linearized AVO approximations mentioned above contain the square of S-to-P wave velocity ratio ( k ) in the weighting coefficients for the reflectivities of model parameters, which are actually weak nonlinear equations due to the presence of the unknown wave velocity ratio. The conventional AVO inversion method, however, takes the square of S-to-P wave velocity ratio ( k ) as a constant to linearize the nonlinear AVO inverse problem to obtain a more stable estimate of inverted model parameters [20,27,29]. Therefore, the simultaneous inversion for elastic parameters is limited to the choice of background value of the square of S-to-P wave velocity ratio ( k ) [22]. Meanwhile, the estimation of Poisson’s ratio is highly sensitive to the choice of k [38]. Usually, it is obtained by a prior low-frequency model built from well log interpolation, processed velocity volume, and statistical rock physics relationship, e.g., 0.25 or a “mudrock line” given by Smith and Gidlow [39] and Fatti et al. [23]. Also, the k value controls the modeling error accumulation from data space to model space [40]. As a result, the inversion robustness is damaged if the modeling operator is highly sensitive to k , especially for the reservoirs with strong heterogeneity.
In this paper, we first derive a linearized approximate AVO equation of the PP-wave reflection coefficient in terms of Young’s modulus, Poisson’s ratio, and density via a novel reparameterization for Poisson’s ratio. The conventional forward operator of the convolution equation is a function of k , and AVO inversion is performed on the assumption that k is a known quantity, which is biased. If the nonlinearity of k in the approximate equation is too strong for direct parameterization, the error is bound to be amplified. Here, the direct parameterization and the reduction in the nonlinearity of k are taken into account, and the compromise is decomposed into two parameters. The derived approximate equation has a lower level of intrinsic nonlinearity of k , while its accuracy matches that of the linearized approximation using the direct YPD parameterization. Numerical examples of a two-layer model are then performed to demonstrate a better robustness of the proposed approximate AVO equation, at the presence of perturbations in the background values of k at reflection interface that not only reduces the degree of nonlinearity for k but also suppresses the errors caused by recalculation of Poisson’s ratio. Next, a linearized AVO inversion method in a Bayesian framework is developed for Young’s modulus and Poisson’s ratio using the novel reparameterization for the AVO approximation, in which (1) the regularizations of Cauchy prior distribution and the low-frequency model are introduced into the Bayesian framework prior, and (2) the maximum a posteriori (MAP) solution is obtained by solving the cost function derived by the negative of the log-posterior distribution. As a result, tests on a seismic gather at the well location acquired from the Haynesvile shale area [41] show that inversion results of the method in this paper yield more accurate Young’s modulus and Poisson’s ratio than that of the direct YPD–AVO parameterization. Last but not the least, the proposed inversion method is also tested on a 3D real data set acquired from East China. The inversion result exhibits good consistency at three drilled wells, thus providing a detailed delineation for the target distributary channels using marine seismic data.

2. Novel Four-Term Reparameterization for the AVO Approximation

The direct YPD parameterization for reflection coefficient using Young’s modulus E , Poisson’s ratio υ , and density ρ (that is, the conventional YPD equation) can be derived as follows [29]:
R P P θ = R E θ + R υ θ + R ρ θ
where θ is the average value of the incidence and transmission angles, and each angle-weighted reflectivity term, respectively, for Young’s modulus E , Poisson’s ratio υ , and density ρ , is given by the following:
R E θ = 1 4 sec 2 θ 2 k sin 2 θ Δ E E ¯
R υ θ = 1 4 2 k 3 2 k 1 2 k 4 k 3 sec 2 θ + 2 k 1 2 k 3 4 k sin 2 θ Δ υ υ ¯
R ρ θ = 1 2 1 4 sec 2 θ Δ ρ ρ ¯
where the symbol Δ represents the small perturbation; the bar ¯ represents the background value of elastic parameters across the reflection boundary; and k V S ¯ 2 / V P ¯ 2 is the background value of the square of S-to-P-wave velocity ratio.
As shown, Equation (3) has a very complicated expression for the angle-weighted reflectivity term of Poisson’s ratio v, and the quadratic component of the square of S-to-P-wave velocity ratio k V S ¯ 2 / V P ¯ 2 adds the complexity and nonlinearity for the PP-wave reflection coefficient Equation (1) in terms of Poisson’s ratio υ . Therefore, the accuracy of the inversion for Poisson’s ratio υ is highly sensitive to the k value.
To reduce the degree of nonlinearity for k in Equation (3), we decompose Poisson’s ratio υ as two new defined Poisson’s ratio-related parameters
υ 1 = 1 υ
υ 2 = 1 1 2 υ
For common materials, Poisson’s ratio υ ranges between 0 and 0.5; thus υ 1 ranges between 0.5 and 1, and υ 2 ranges between 1 and infinity.
Combining Equations (5) and (6), and after a series of mathematical derivations (see Appendix A.1 for details), we can derive the novel four-term reparameterization for the AVO approximation as follows:
R P P θ = R E θ + R υ 1 θ + R υ 2 θ + R ρ θ
where the angle-weighted reflectivity terms for Young’s modulus E , two new Poisson’s ratio variables υ 1 , υ 2 , and density ρ can be derived as follows:
R E = sec 2 θ 4 2 k sin 2 θ Δ E E ¯
R υ 1 = sec 2 θ 4 Δ υ 1 υ ¯ 1
R υ 2 = 3 5 k 4 3 4 k sec 2 θ + 2 k 2 3 4 k sin 2 θ Δ υ 2 υ ¯ 2
R ρ = 1 2 1 4 sec 2 θ Δ ρ ρ ¯
Equation (7) is a novel reparameterized four-term approximate AVO equation in terms of Young’s modulus, Poisson’s ratio, and density. Meanwhile, the reflectivities of Young’s modulus and density have the same formulation in above Equations (1) and (7).
To analyze the effects of perturbations in k value on the approximate AVO Equations (1), (7), and (A1), we calculate the reflection coefficients of these three equations with perturbations in k  for a two-layer model, respectively. The elastic parameters extracted from organic-rich shale layers are used to build a two-layer model, as shown in Table 1. The top layer 1 is the target shale play, and the underlying layer 2 is high-impedance carbonates. E and υ have the largest relative changes (RCs) of 27.4%, and it partly means that their contrasts have the best detectability. In our analysis, the incident angle ranges from 0° to 45°. The exact value of k across the interface is 0.385, and k values ranging from 0.2 to 0.45 are selected to perform the robustness test.
Figure 1 shows the analysis of parameterization for Aki–Richards’s AVO approximation Equation (A1) and the angle-weighted reflectivities of P-wave velocity, S-wave velocity, and density, resulting from Equations (A2)–(A4) with different k for a two-layer model given by Table 1. Similarly, Figure 2 and Figure 3 show the analysis of parameterization for the YPD–AVO approximation Equation (1) and the AVO approximation Equation (7) proposed in this paper. Here, the background color represents the values of k .
From the analysis of three PP-wave reflection coefficients, we find that all AVO curves computed from Equations (1), (7), and (A1) are highly close to the curves computed from the Zoeppritz equation when k approaches 0.385. However, the analysis results of these three equations with k perturbations are quite different from one another. It shows that for all three reflection coefficients with inaccurate k values, the proposed novel reparameterization for four-term AVO Equation (7) retains the same accuracy as the Aki–Richards-type three-term AVO equation shown in Figure 1a and Figure 3a but is less affected by the k perturbations than the YPD-type AVO Equation (1) shown in Figure 2a. In addition, the PP-wave reflection coefficient calculated by Equation (1) greatly deviates from the exact solution due to the strong dependence of R υ on the k values shown in Figure 2a,c. In contrast, the new reflectivity term of Poisson’s ratio R υ 1 in the novel reparameterized four-term AVO Equation (7) is not affected by k perturbations shown in Figure 3c, and the other reflectivity term of Poisson’s ratio R υ 2 has also weak dependency on the k perturbations shown in Figure 3d. Therefore, we can achieve a higher-accuracy inversion result of the reflectivity term of Poisson’s ratio R υ just using the inversion results of either R υ 1 or R υ 2 . Of course, the accuracy of estimated Poisson’s ratio using the reflectivity term of Poisson’s ratio R υ 1 is superior to that of the other reflectivity term of Poisson’s ratio R υ 2 due to the smaller dependence on the k values demonstrated by the contrast between Figure 3c,d.

3. Bayesian AVO Inversion for Young’s Modulus and Poisson’s Ratio

The seismic angle gather d θ with N temporal samples and M angles of incidence is linearly related to the model parameters m and the noise n :
d θ N M × 1 = L θ N M × 4 N m 4 N × 1 + n N M × 1
where the seismic angle gather vector d θ , the kernel matrix L θ , and the model parameter vector m can be found in Appendix A.2.
Based on the Bayesian framework, the cost function of parameters estimation is derived from the posterior probability distribution conditioned on the chosen prior probability distribution and likelihood function. The key is to choose an appropriate prior probability distribution to give the available prior information of model parameters [42]. In the AVO inversion generally, the model parameters are assumed to be distributed according to the Gaussian prior [20]. However, such an assumption is not promoting sparse solutions. In our formulation, we introduce the heavy-tailed Cauchy distribution as the Bayesian prior to promote the sparse and high-resolution inversion results [43,44]. In our case, combining a Cauchy distribution for prior probability with Gaussian distribution for likelihood function, the posterior probability for the estimated model parameters is expressed as follows:
P m d 1 2 π σ n exp d L m T d L m 2 σ n 2 1 π σ i 4 i = 1 4 1 1 + m i 2 / σ i 2 K 1 K 2 exp d L m T d L m 2 σ n 2 exp i = 1 4 ln 1 + m i 2 / σ i 2 ,
where σ n 2 and σ i 2 are the variances of measured noise and model parameters, respectively, and the weighting coefficients can be written as follows:
K 1 K 2 = 1 2 π σ n 1 π σ i 4 .
Here, we assume the noises are uncorrelated, and the covariance matrix of estimated model parameters can be treated as a function of noise variances. By taking the logarithm of Equation (13), we can reformulate this into the log-posterior term by estimating the maximum a posteriori (MAP) solution. The MAP solution is a bridge between the Bayesian and optimization frameworks, and thus we can obtain the solution by minimizing the following negative log-posterior term (i.e., the equivalence of cost function) as follows:
min J m = J G m + J C a u c h y m = d L m T d L m + λ i = 1 4 ln 1 + m i 2 / σ i 2 ,
where J C a u c h y m is the Cauchy-sparse constraint term, and the Cauchy-sparse regularization coefficient λ = 2 σ n 2 .
Furthermore, we consider extending our formulation by introducing the low-frequency model (LFM) prior information distributed according to the Gaussian distribution —it is equivalent to constraining the problem with L2 norm regularization. Therefore, the cost function expressed in Equation (15) can be further formulated by introducing the LFM prior information as follows:
min J m = J G m + J C a u c h y m + J L F M m = d L m T d L m + λ i = 1 4 ln 1 + m i 2 / σ i 2 + i = 1 4 η i ξ i C m i 2 2 ,
where the regularization coefficient η i represents weighting coefficients for LFM constraints of model parameters, and ξ i refers to the relative logarithmic values of LFMs for Young’s modulus E , Poisson’s ratio υ 1 , υ 2 , and density ρ .
The minimum cost function (16) is found by taking the gradient as follows:
L T L + i = 1 4 η i C T C   + λ Q m m = L T d + i = 1 4 η i C T ξ i
where the diagonal matrix Q m is defined as follows:
Q j j m i = i = 1 4 1 1 + m i 2 / σ i 2 ,   j = 1 , 2 , , 4 N
Q m is dependent on the model m , and the integral matrix C can be found in Appendix A.2. The solution of Equation (17) is given by a nonlinear equation, and we use the iteratively reweighted least-squares (IRLS) method [42] to solve Equation (17), shown in Algorithm 1.
For clarity, a comprehensive list of symbols used in the study is provided in Nomenclature section.
Algorithm 1. Process of IRLS method to solve Equation (17)
1:Input data d , ξ i .
2:Construct the operator, L , C .
3:Select λ , η i , and set maximum iteration number K and tolerance ε .
4:Initialize the solution, m .
5:Calculate L T L + i = 1 4 η i C T C   + λ Q m k .
6:Solve the m k + 1 = L T L + i = 1 4 η i C T C   + λ Q m k 1 L T d + i = 1 4 η i C T ξ i
7:If m k + 1 m k / m k ε , output m k + 1 , else m k + 1 = m k , k = k + 1
8:Repeat step 5–7, until the maximum iteration is reached k = K .
The final inversion results of E , υ 1 , υ 2 , and ρ are thus obtained base on the following trace integration:
E = E t 0 exp C R E ,  
υ 1 = υ 1 t 0 exp C R υ 1 ,
υ 2 = υ 2 t 0 exp C R υ 2 ,
ρ = ρ t 0 exp C R ρ .
Using the linear relationship υ = 1 υ 1 , only one step of subtraction can retrieve the Poisson’s ratio υ from υ 1 , without any additional parameters. On the contrary, if the υ 2 is chosen for calculating υ , the accumulated errors caused by multiplication and division will be significant, thus inversion stability and reliability cannot be guaranteed.

4. Results of Reservoir Characterization

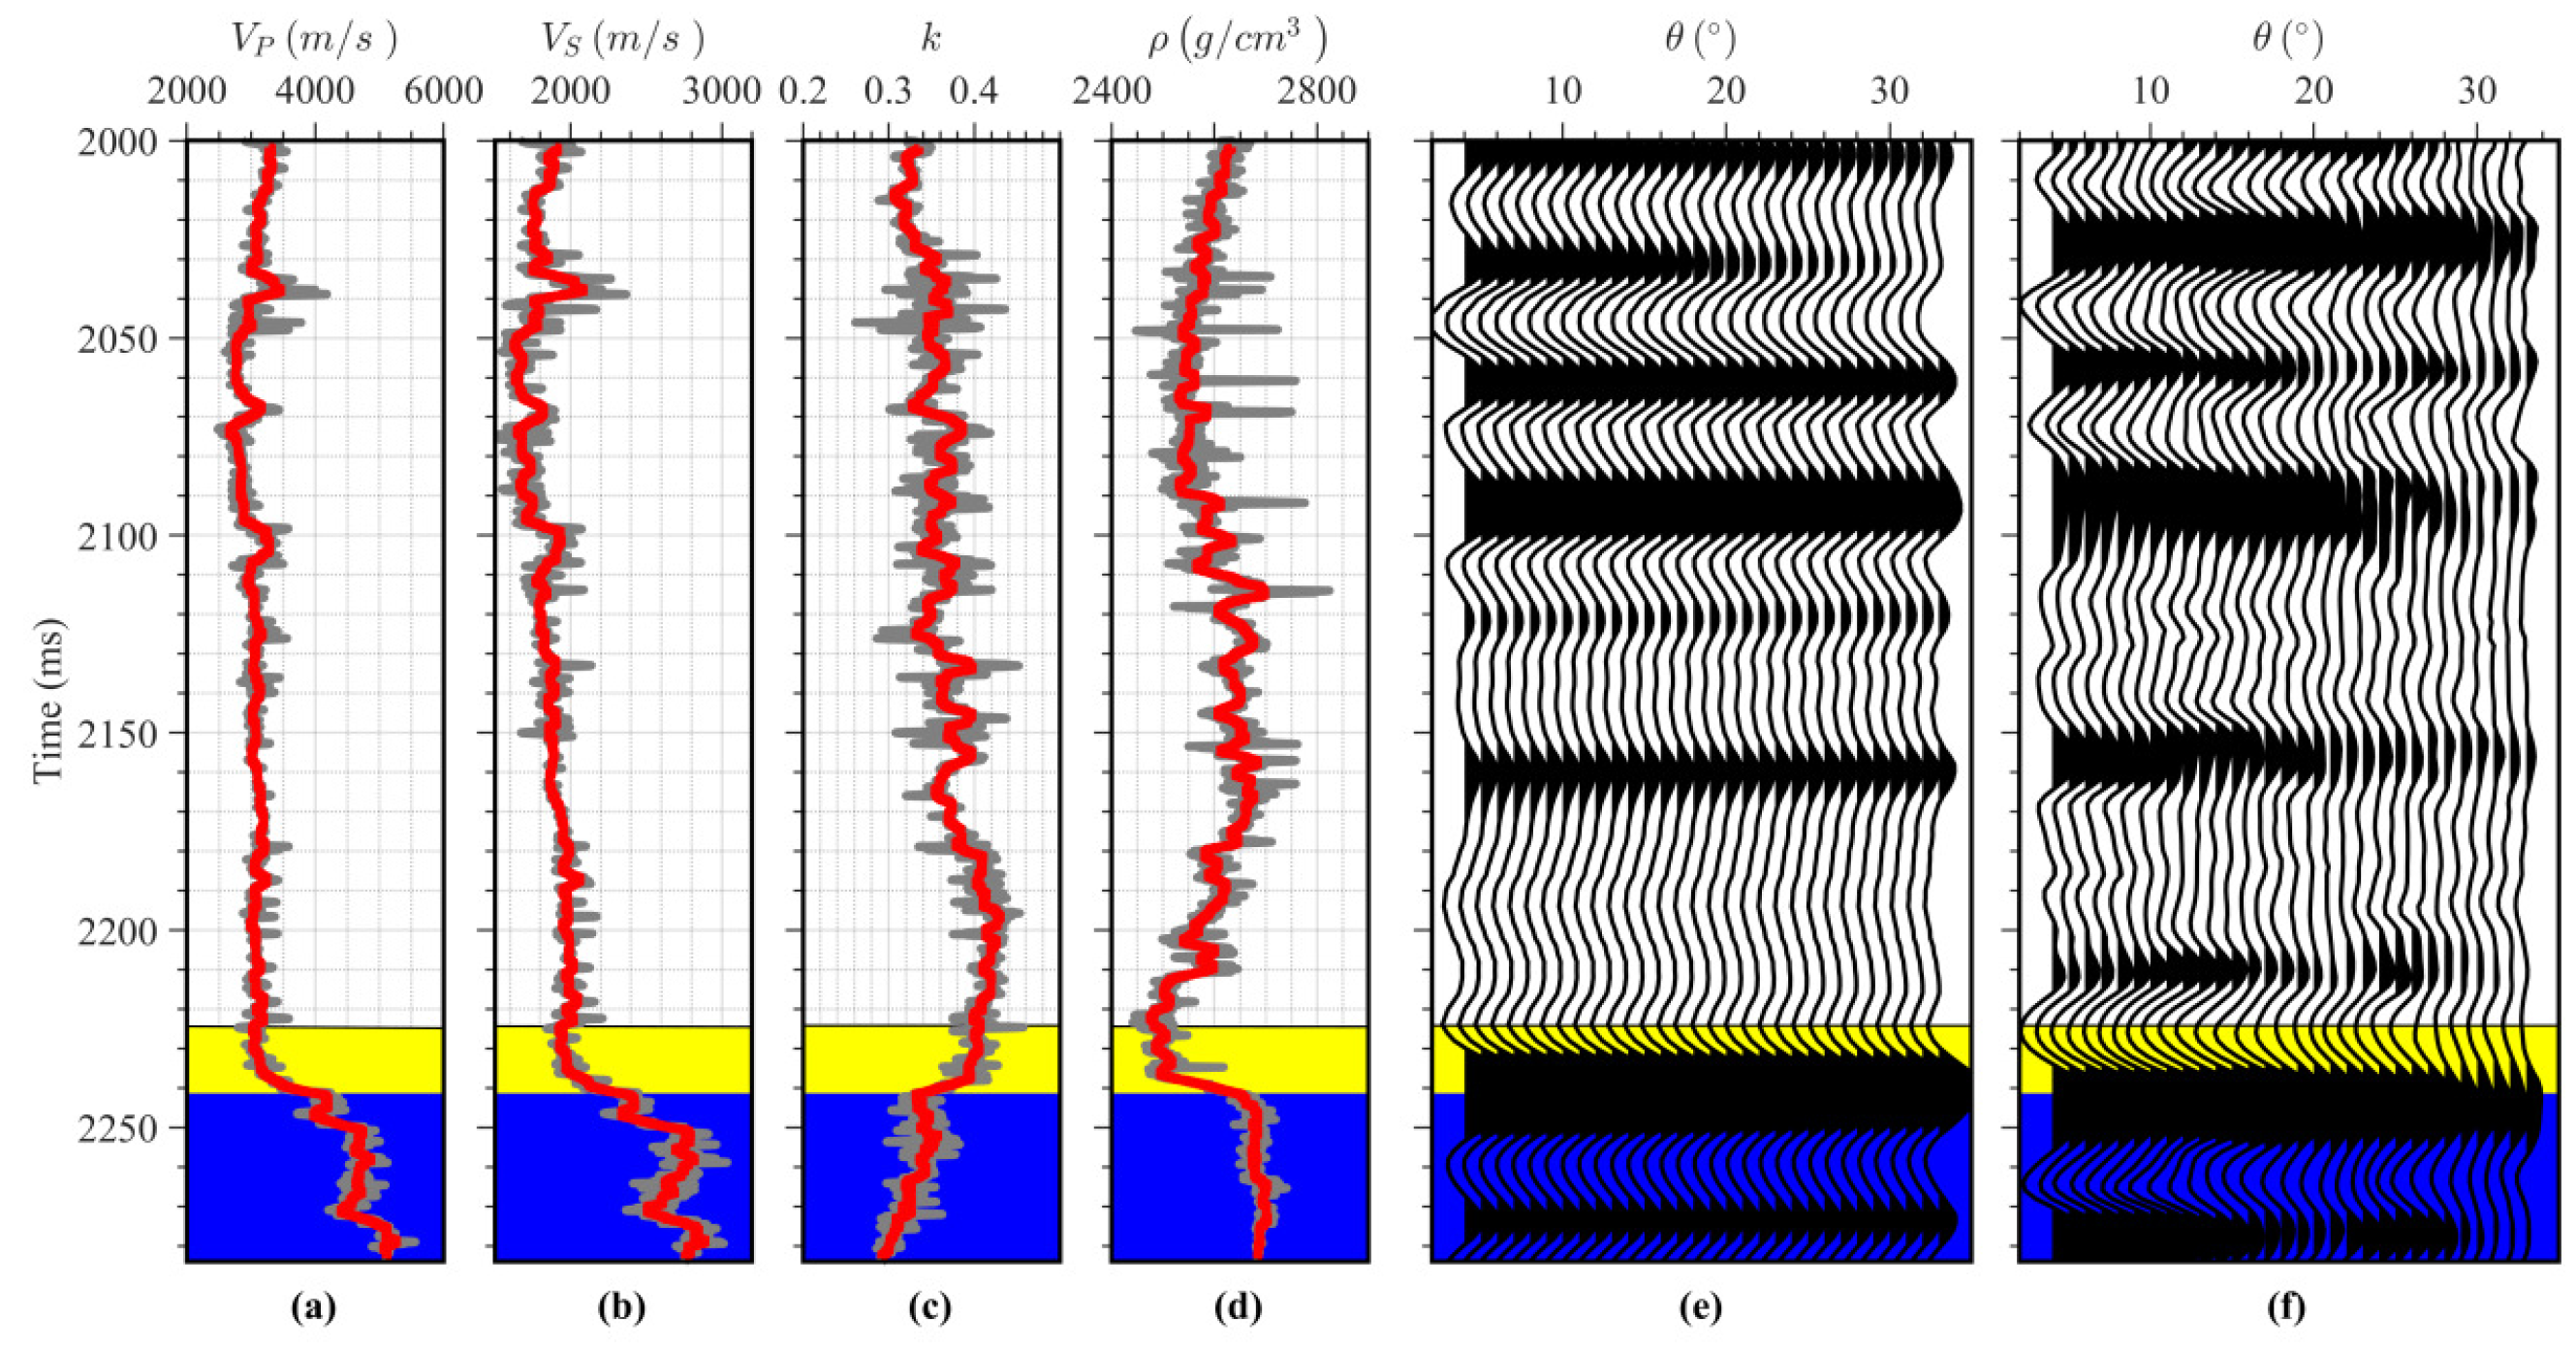
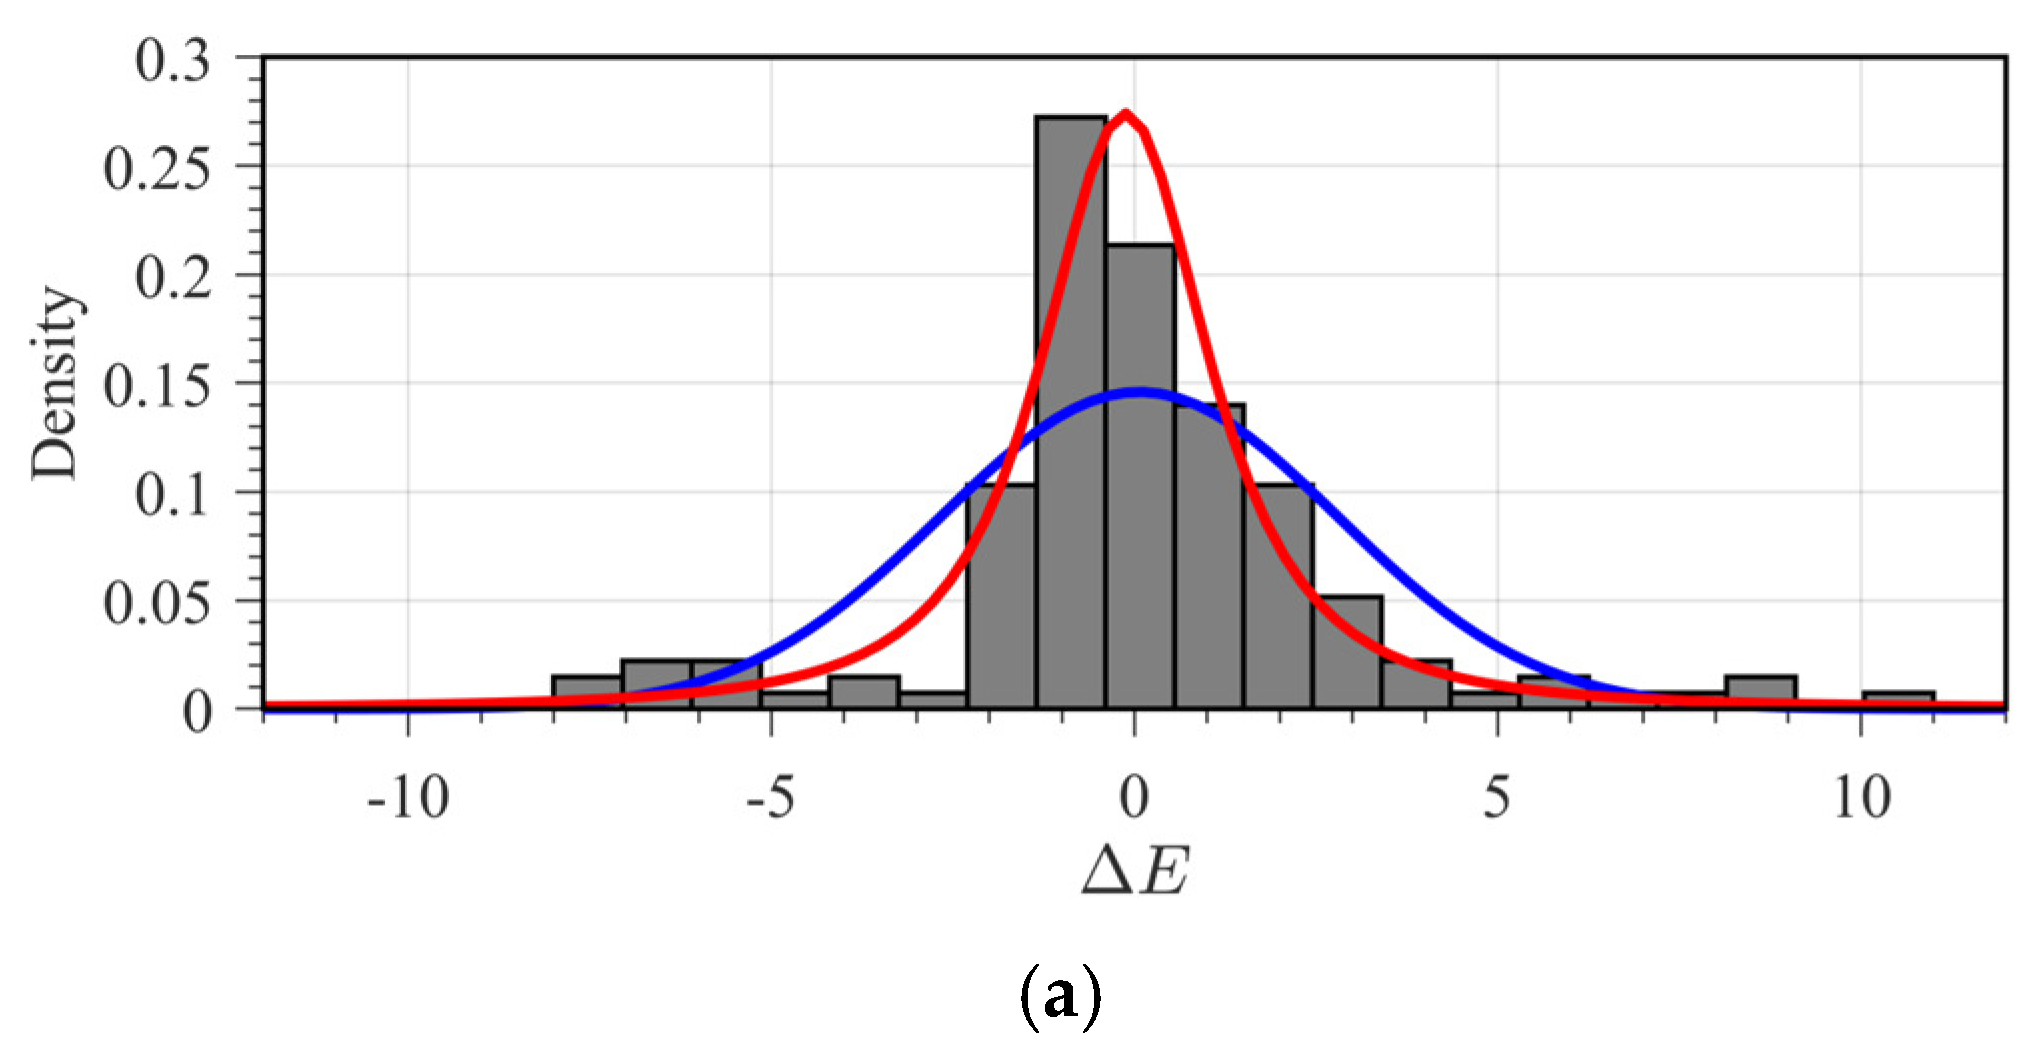
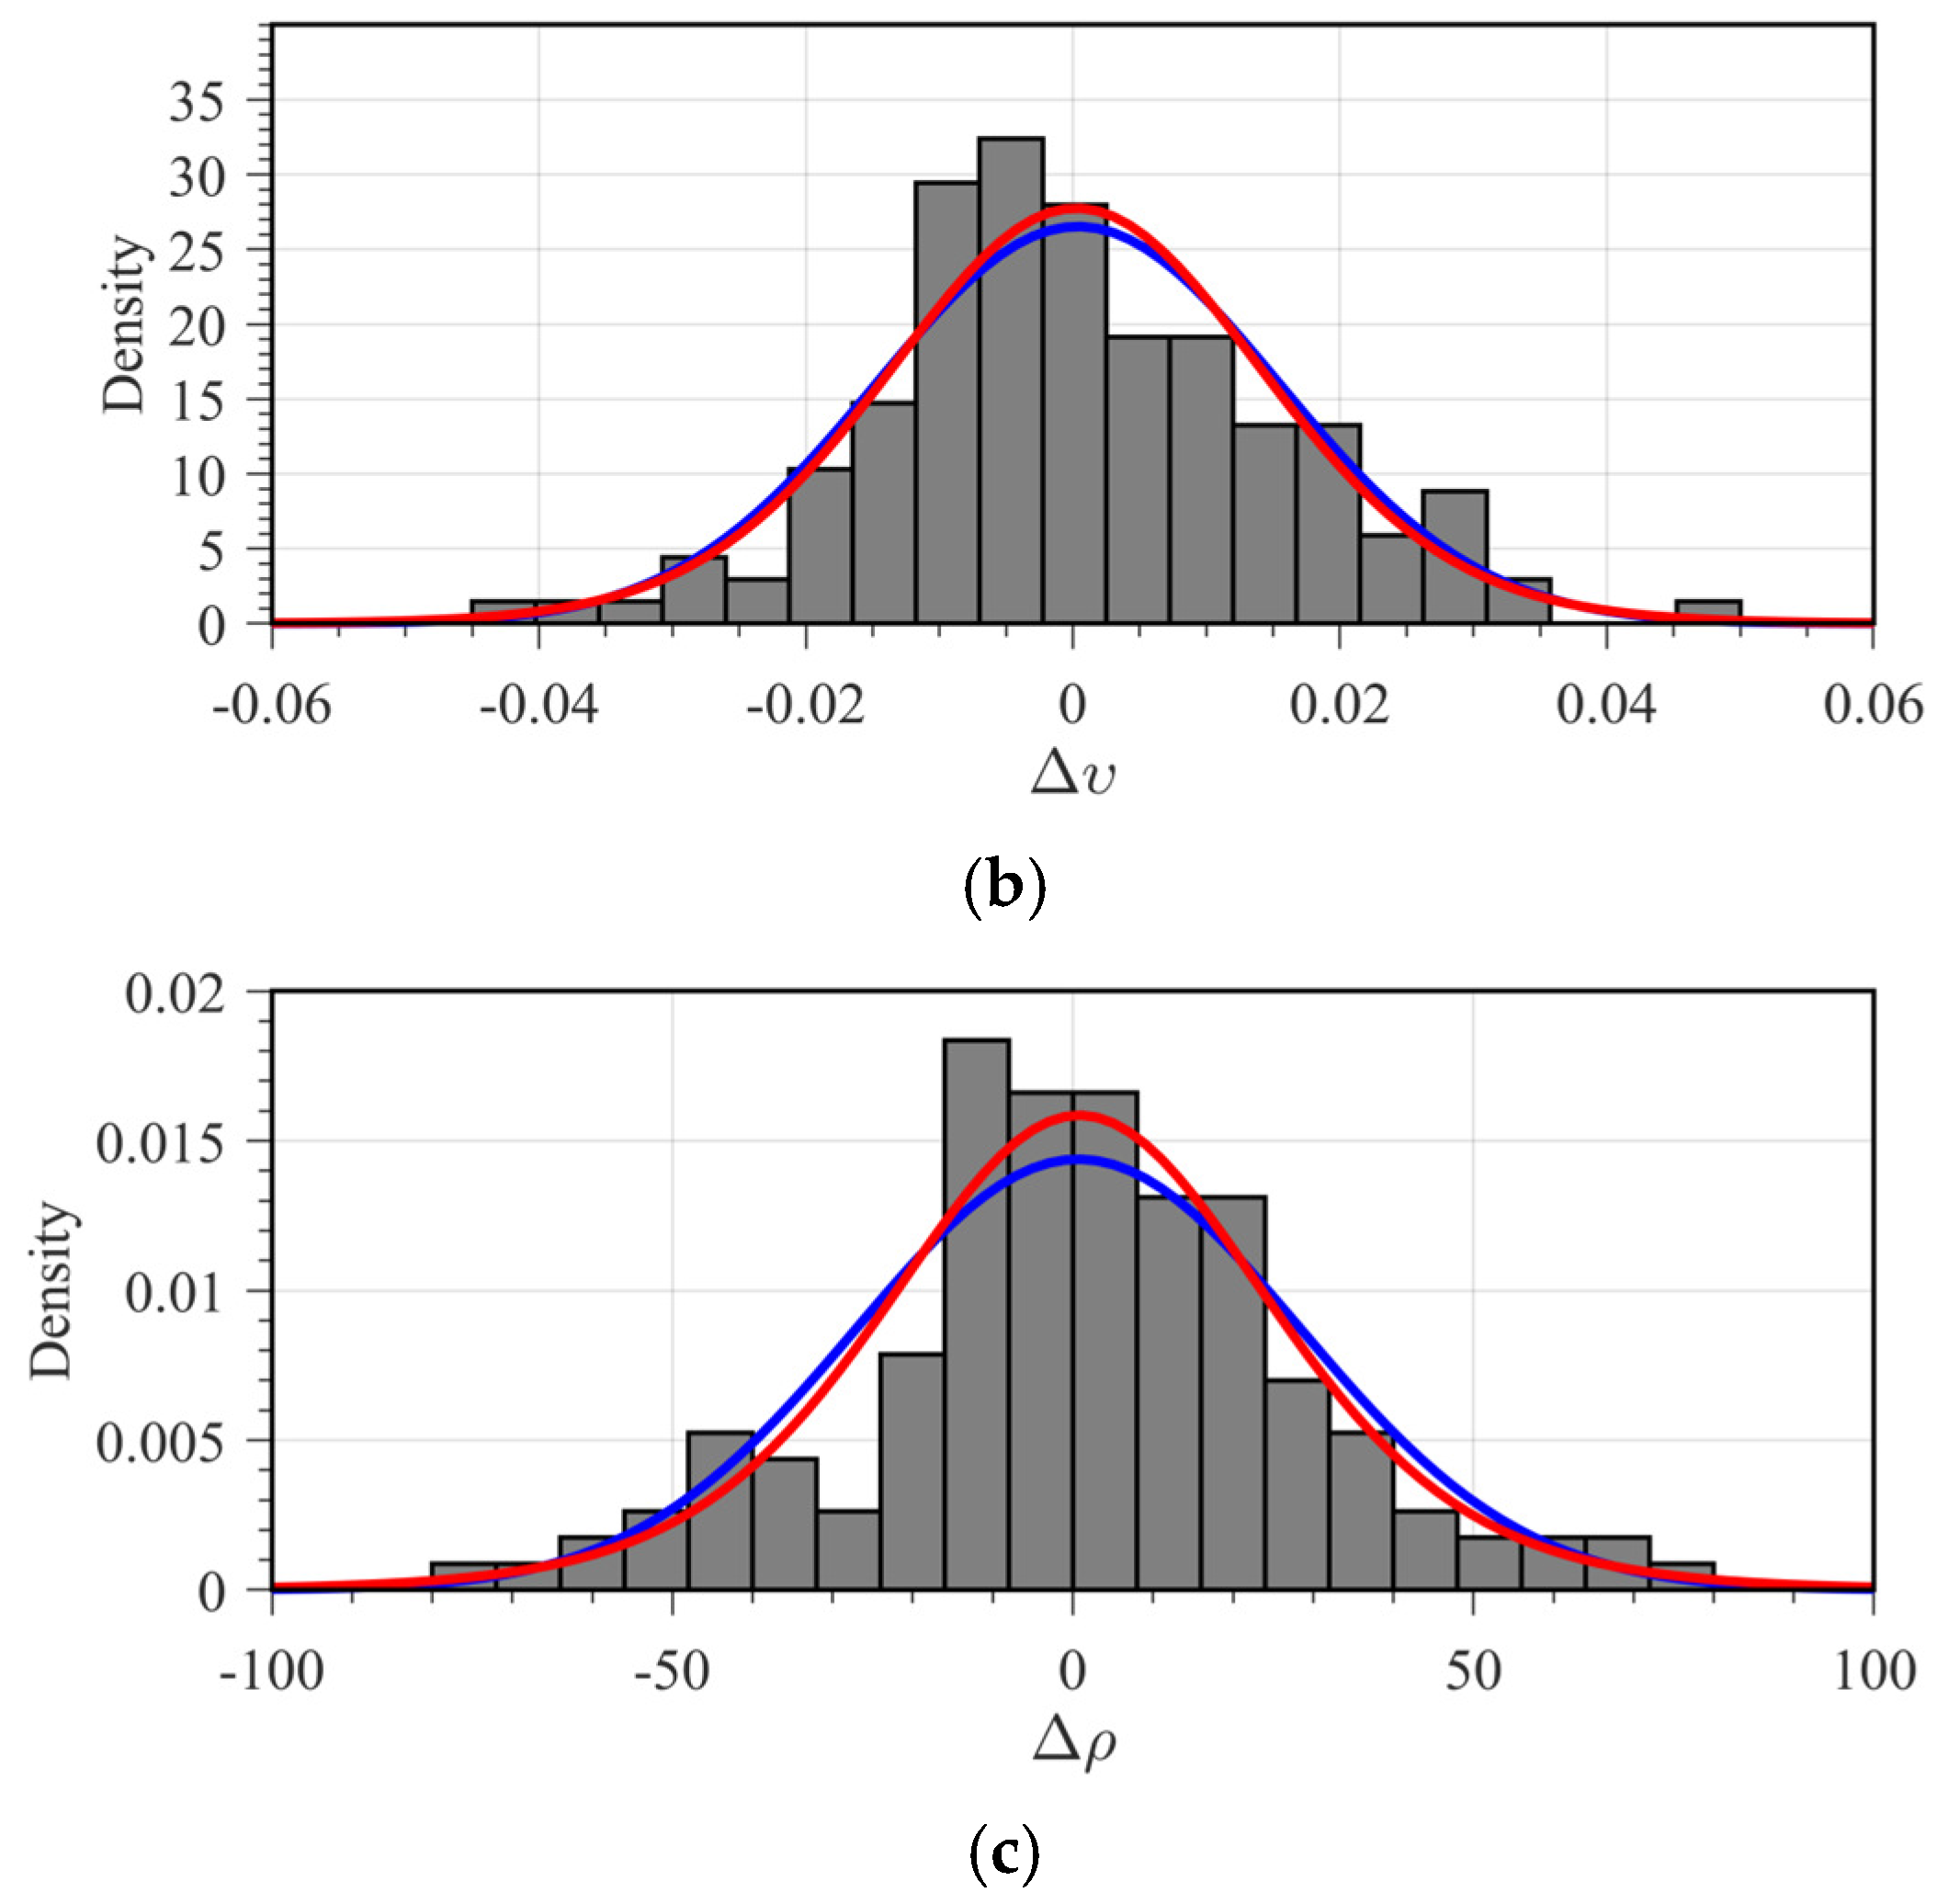
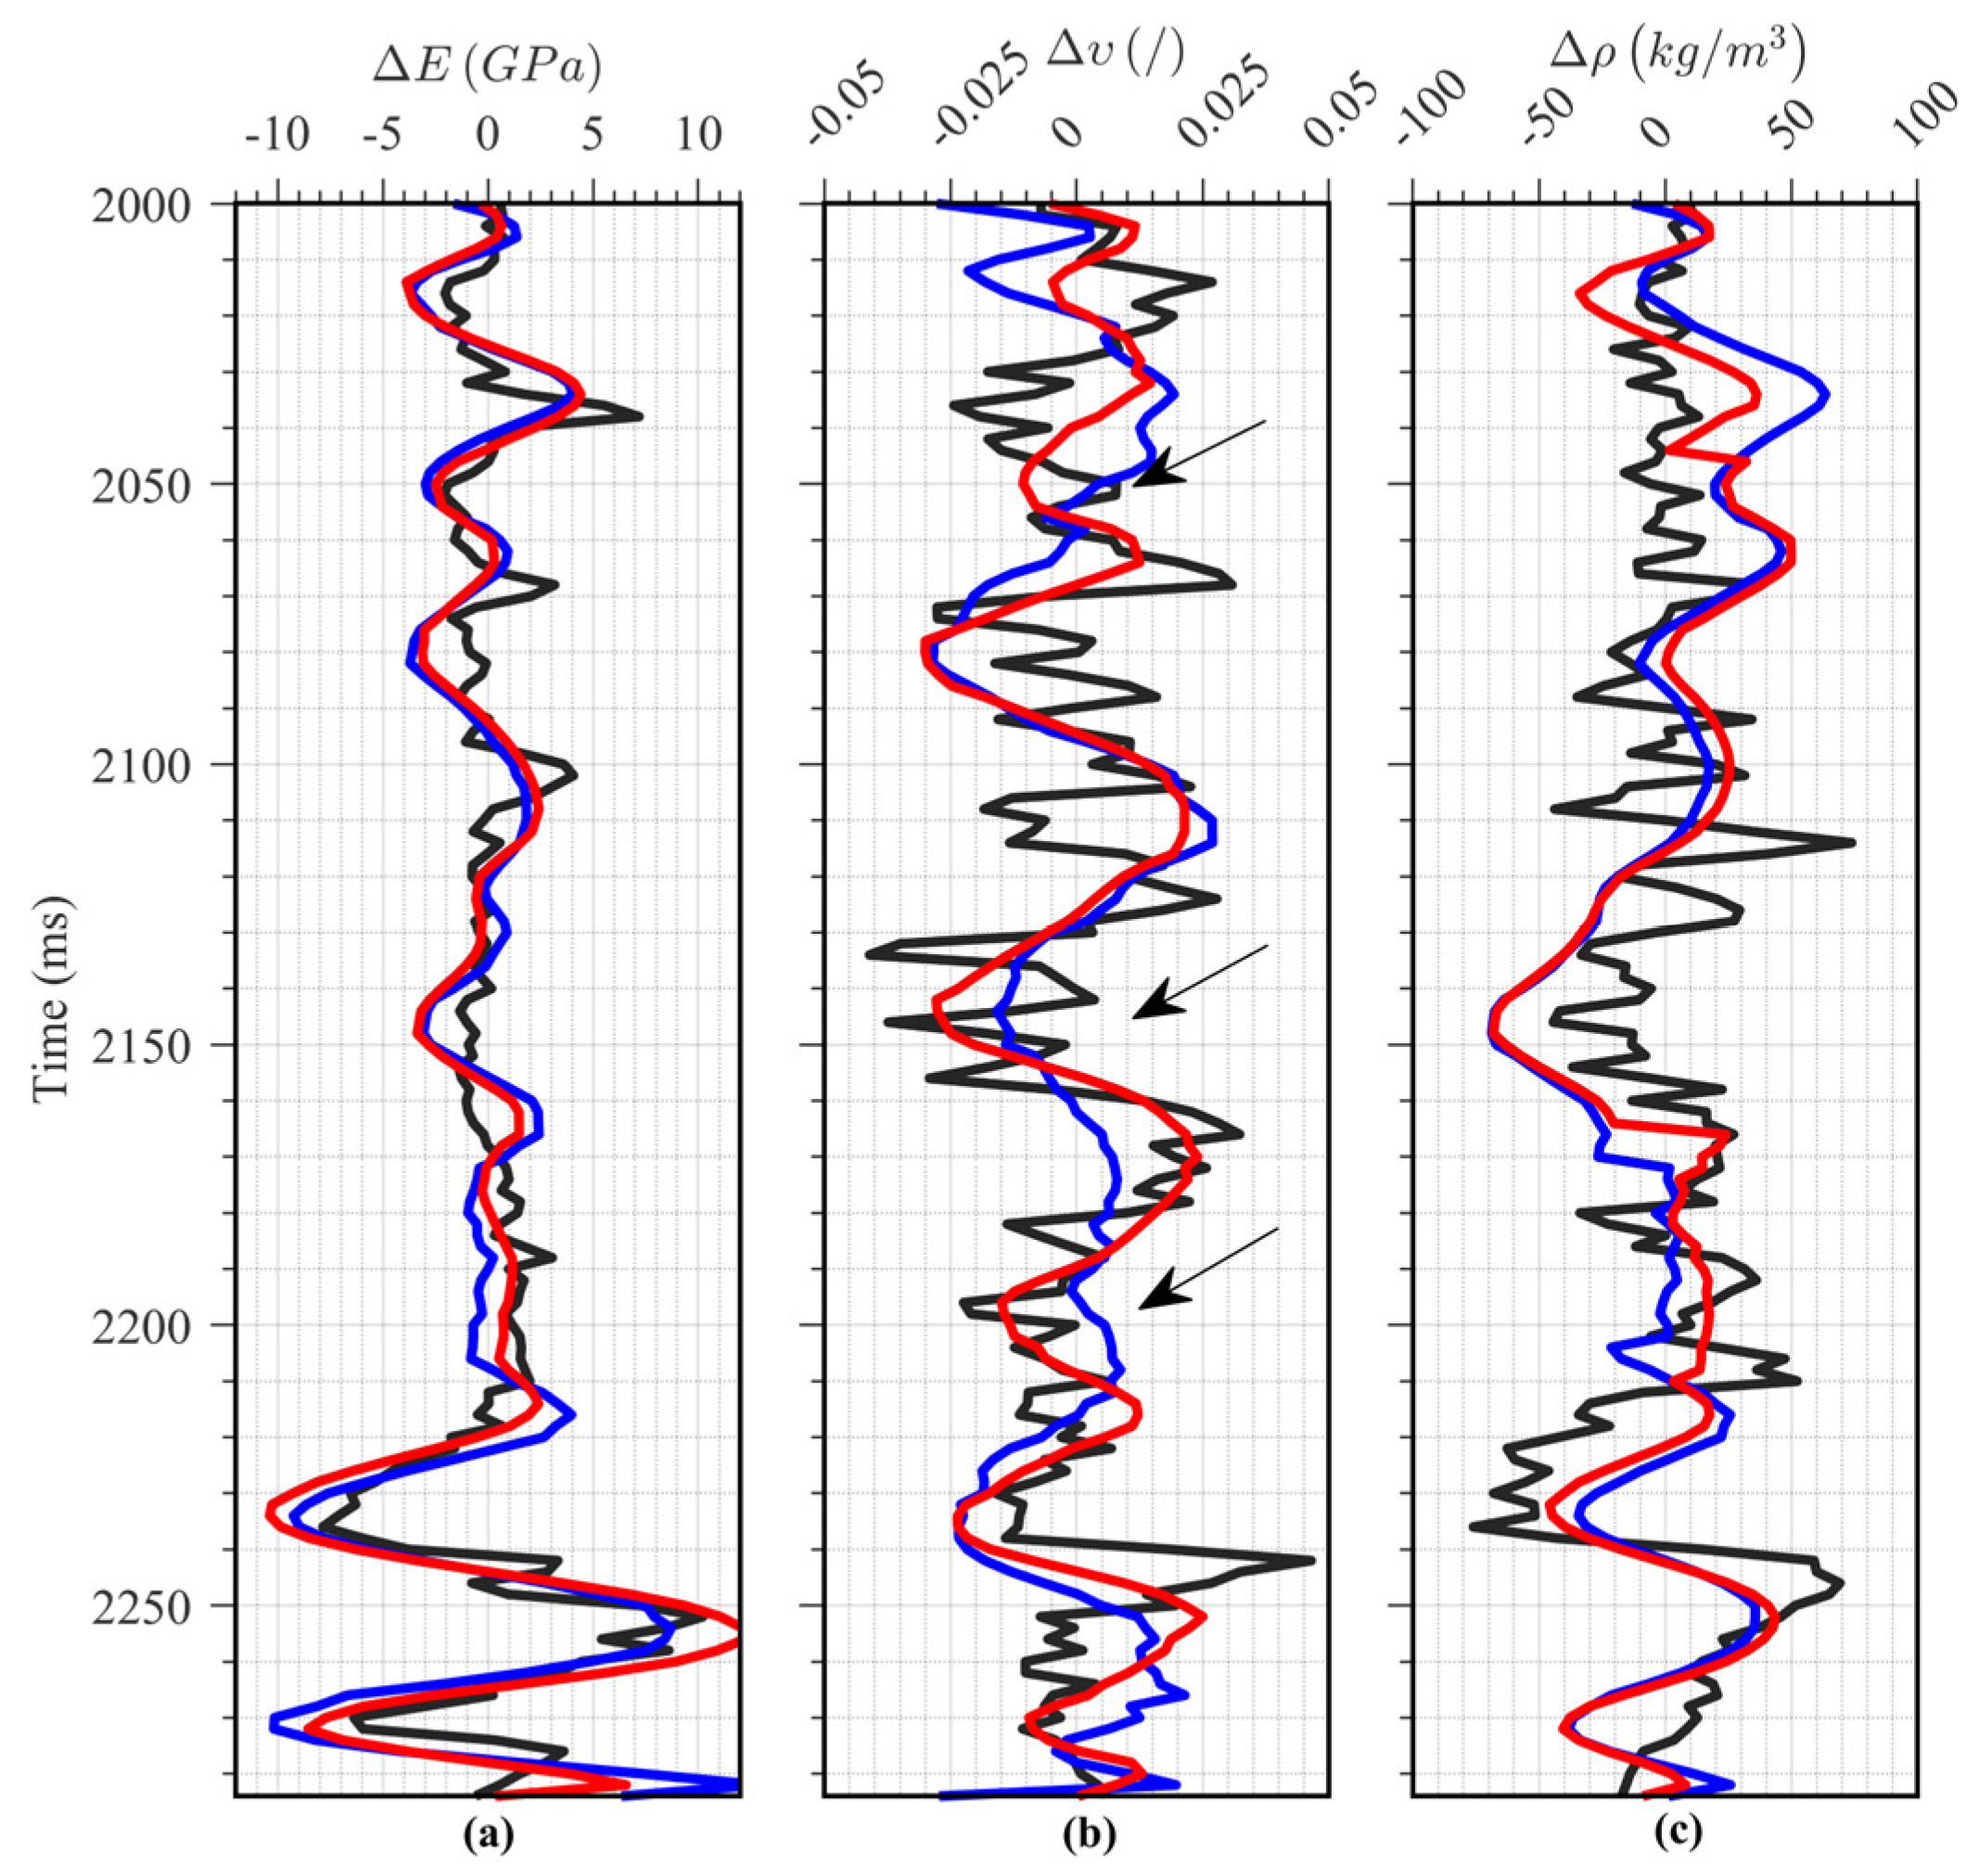
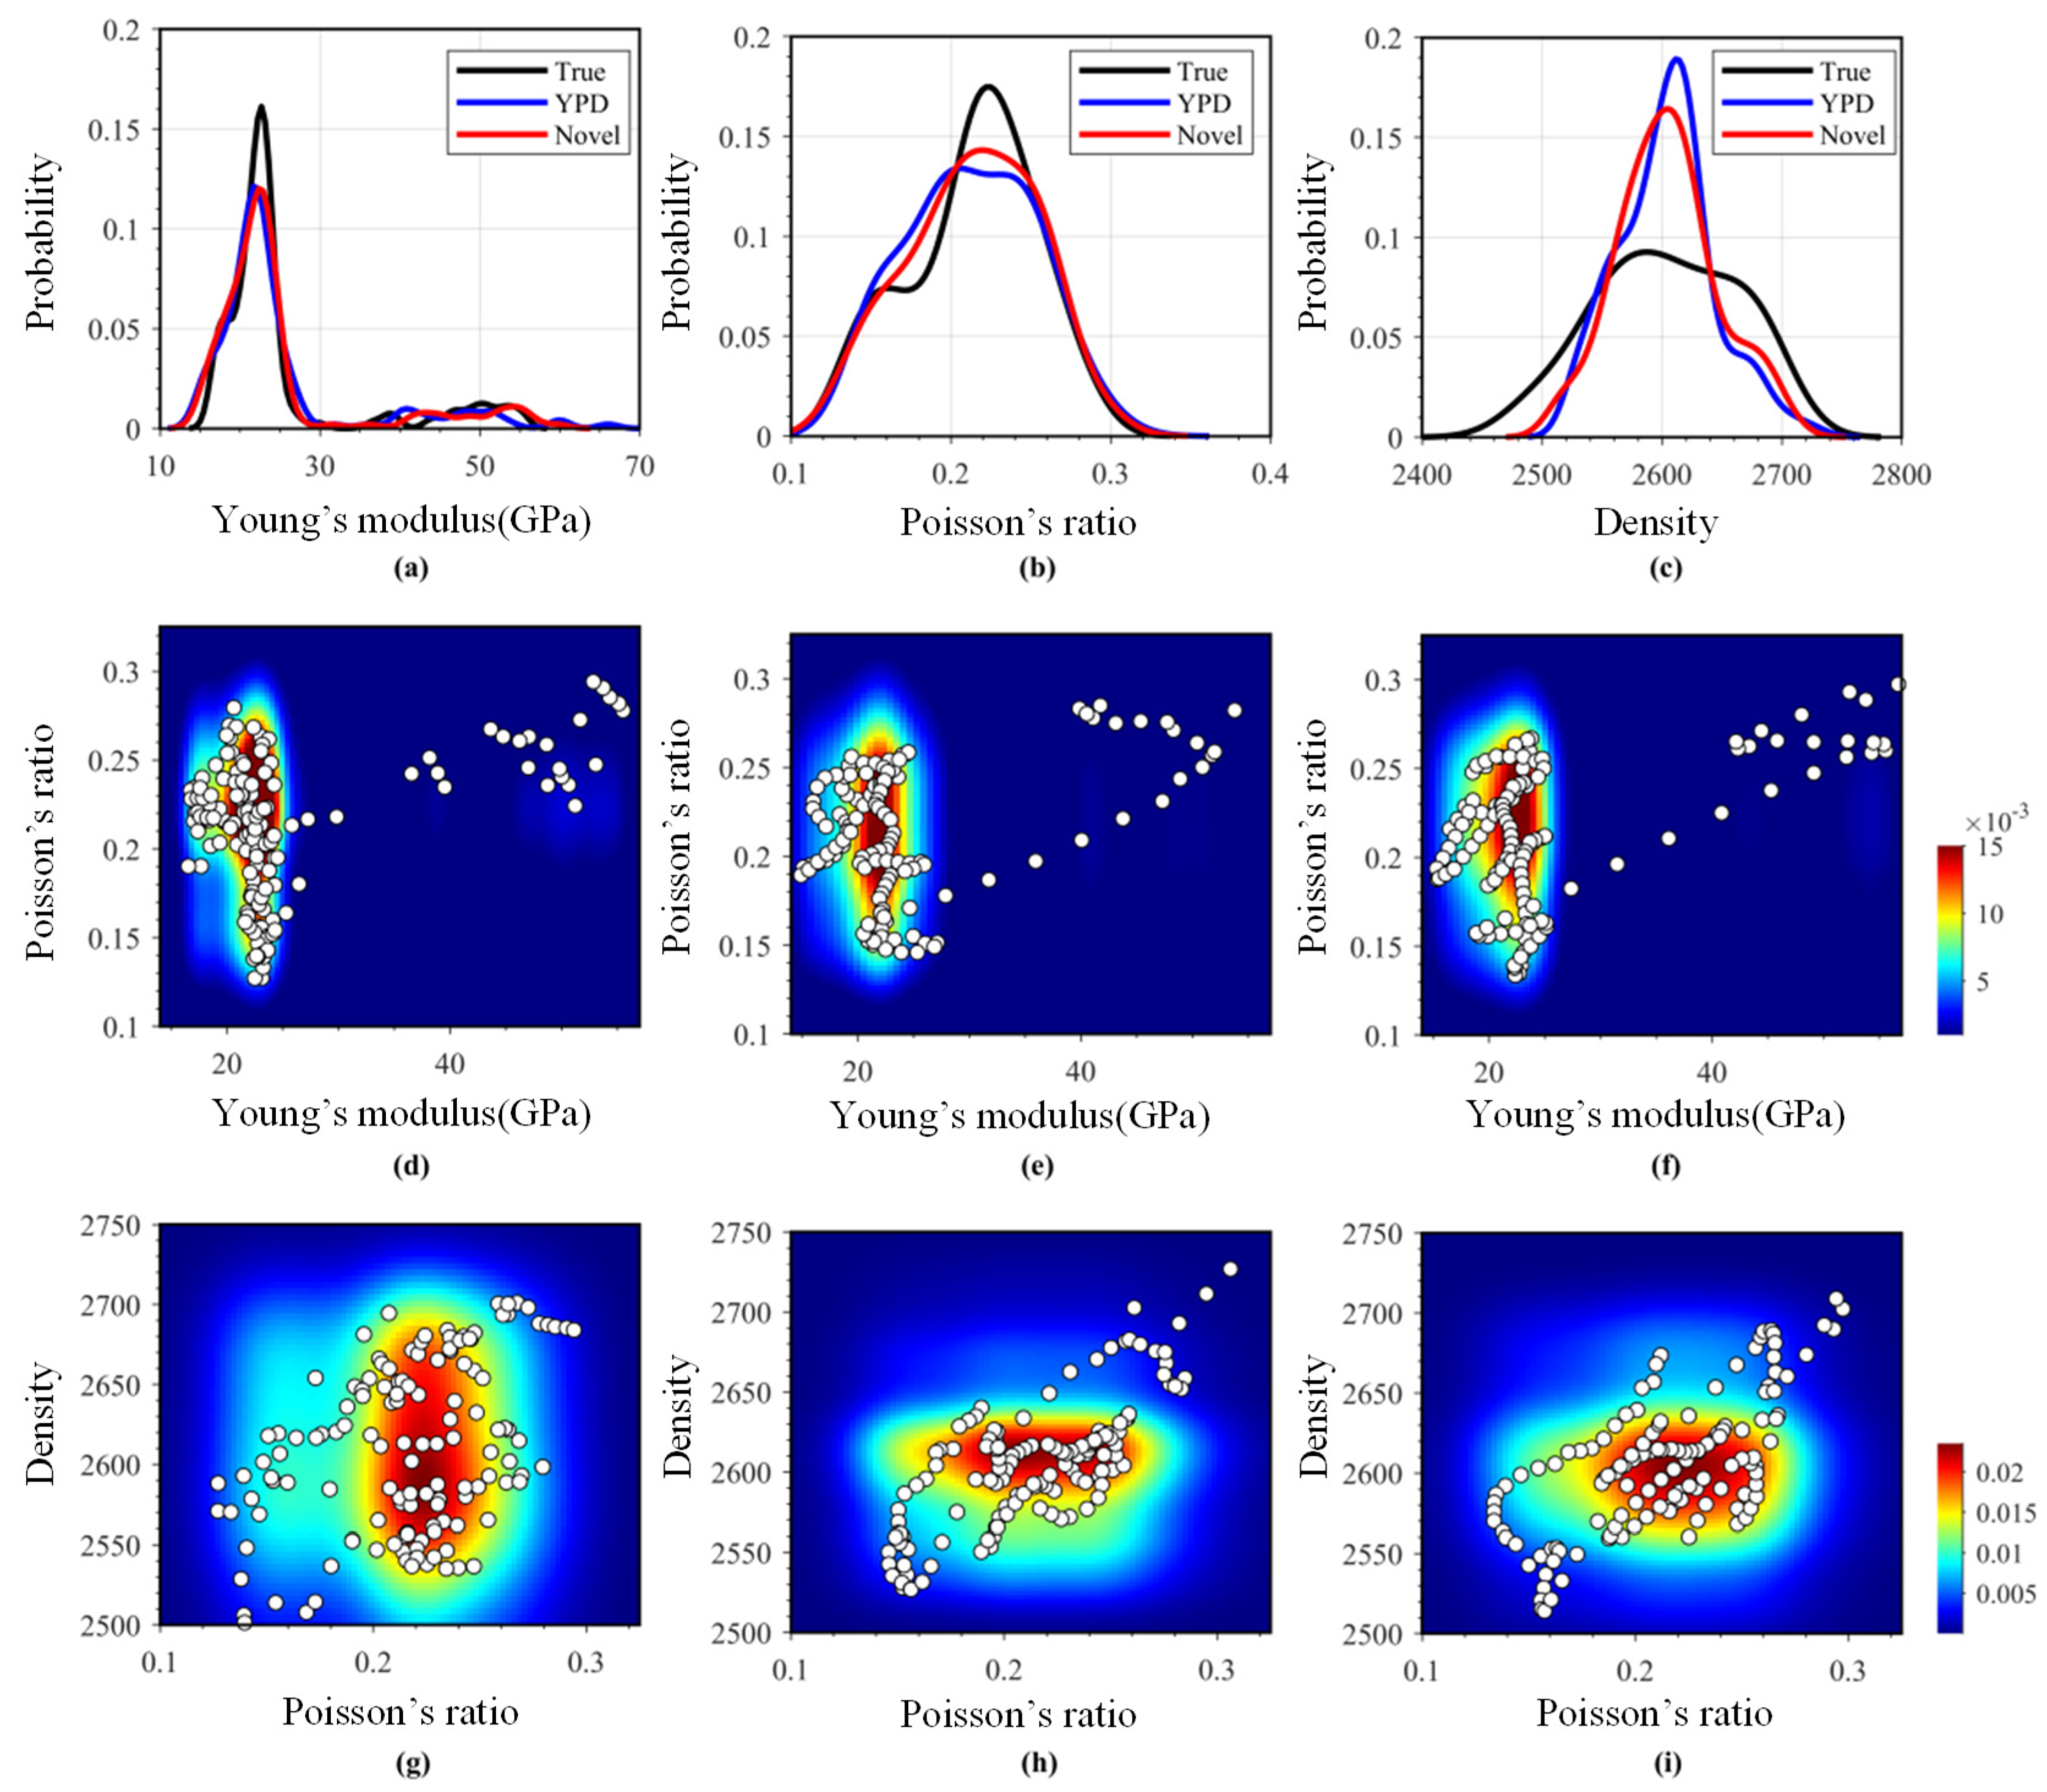
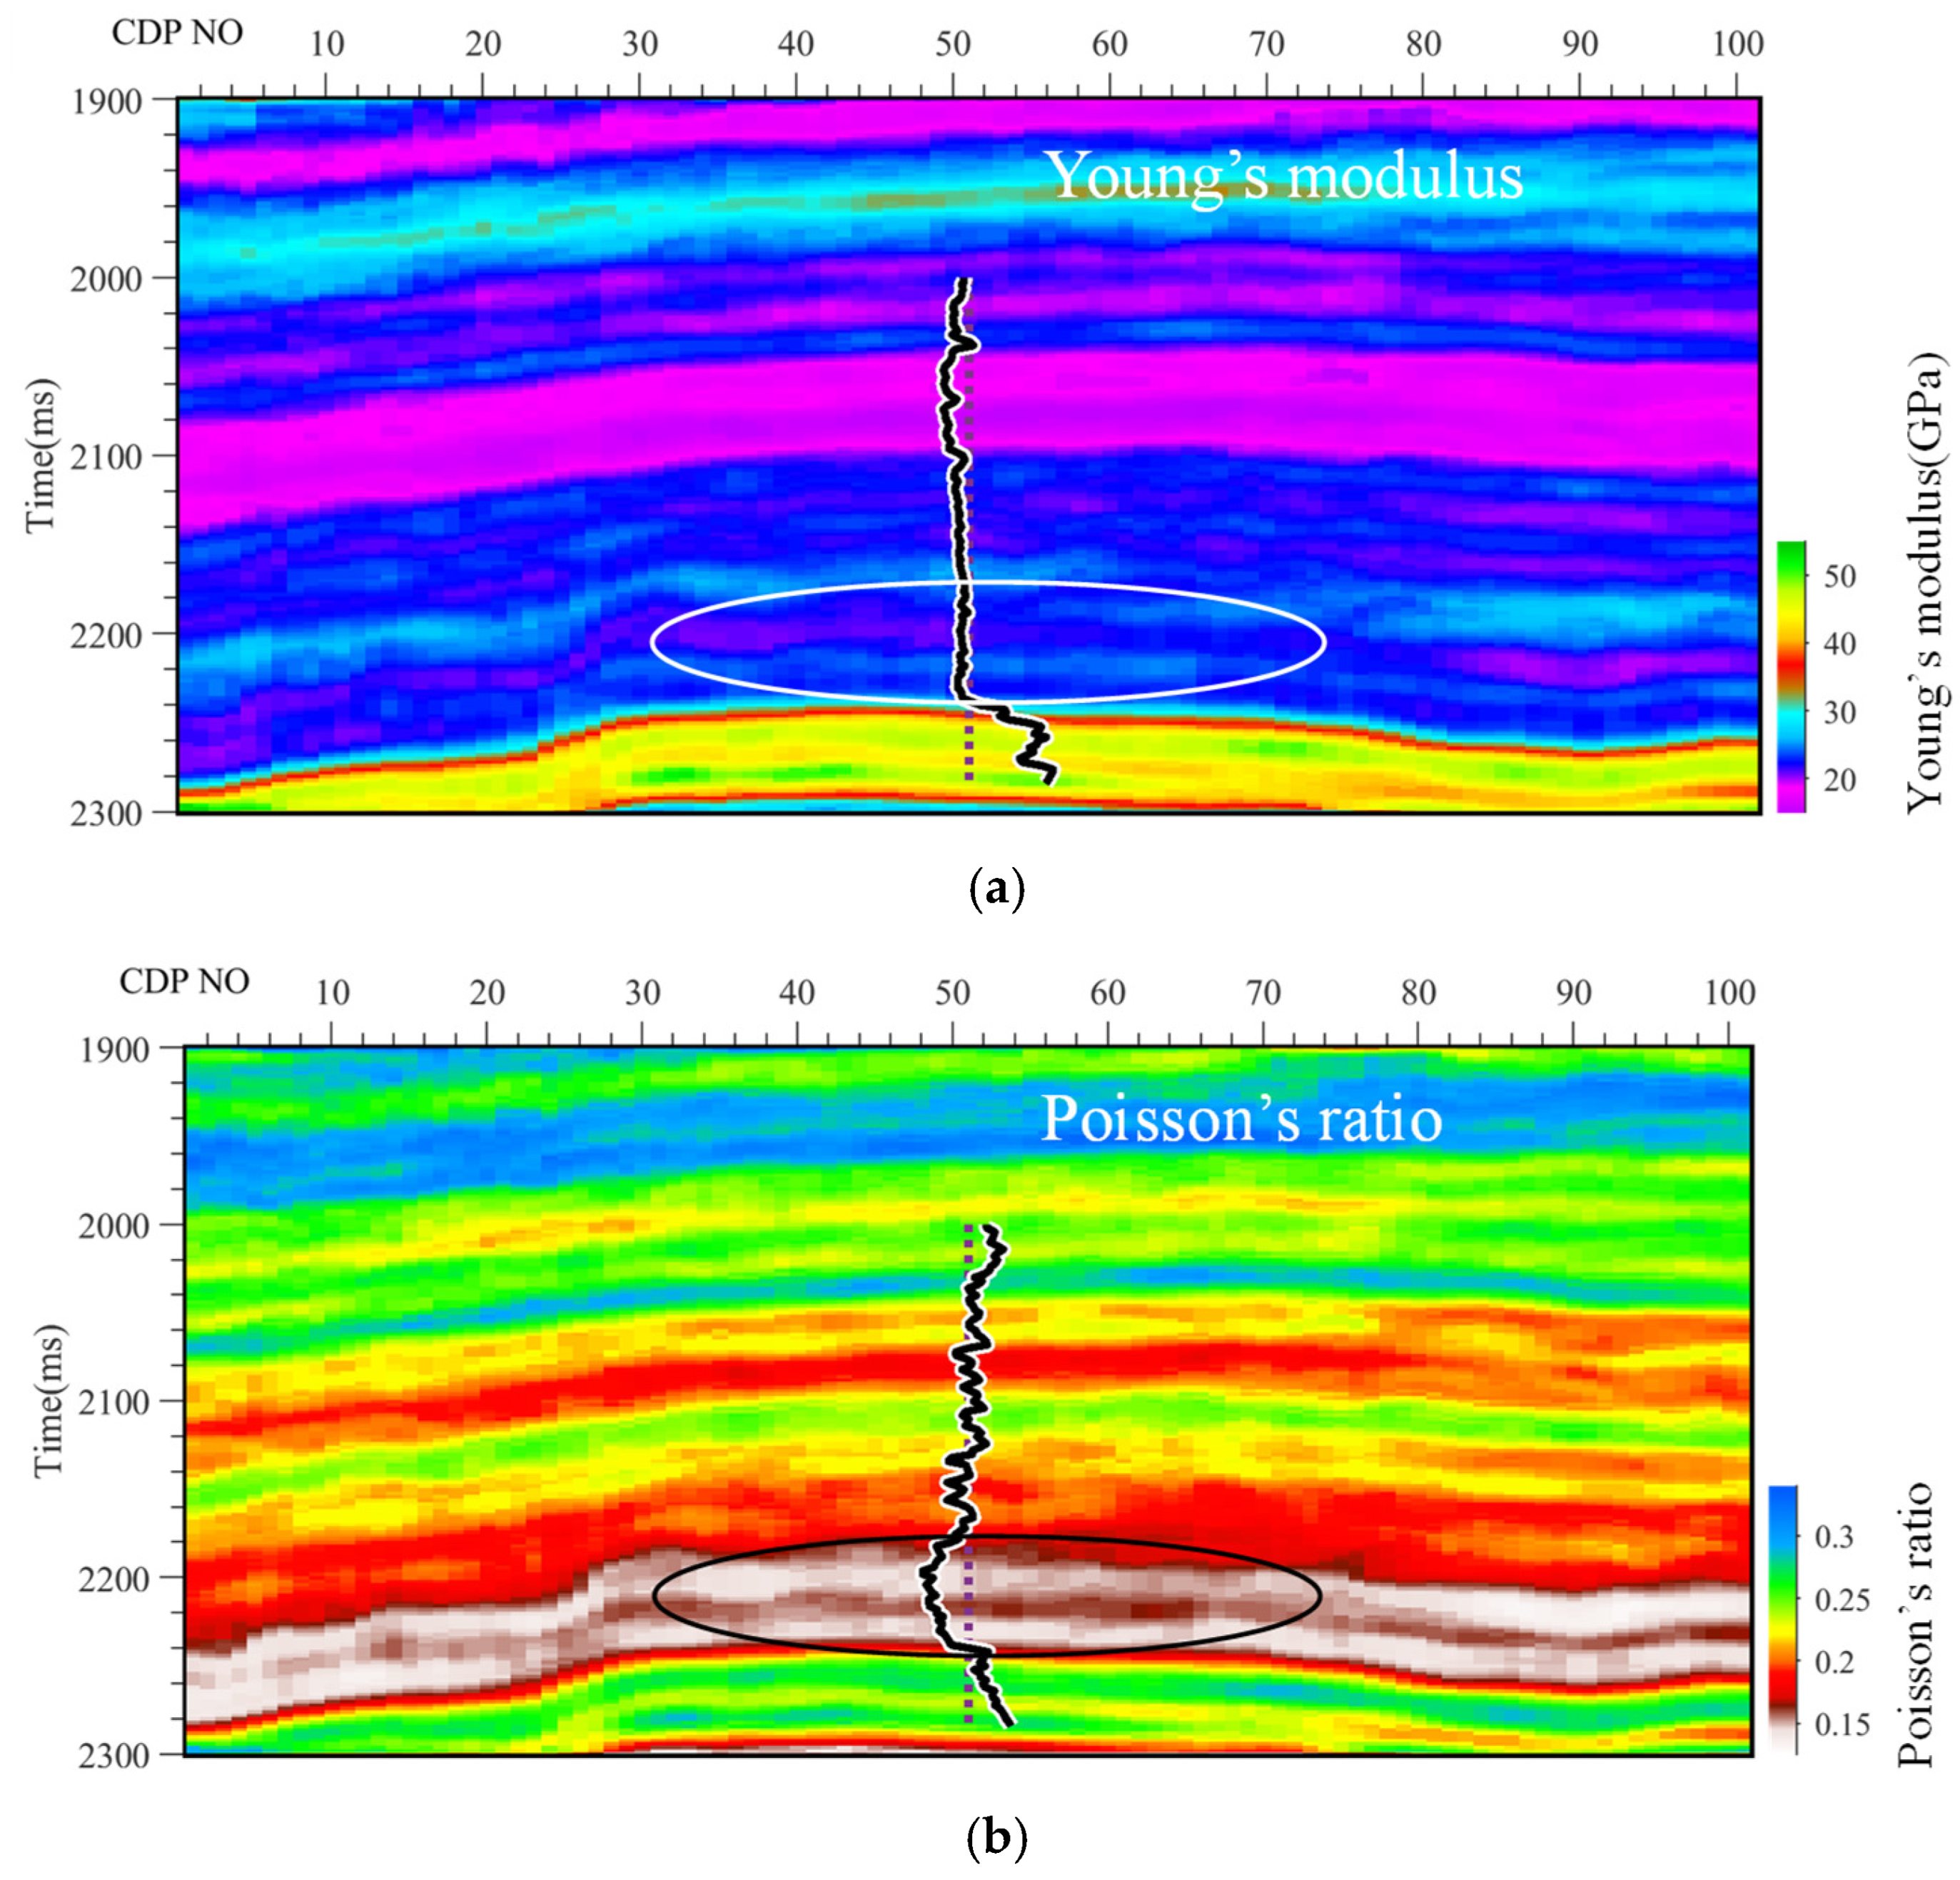
4.1. Two-Dimensional Real Data Example for Reservoir Characterization

In this section, one line of real near wellbore seismic gathers acquired from the Haynesvile shale area [45] is first used to show the workflow and demonstrate the effectiveness of the proposed inversion method. Before performing the Bayesian AVO inversion, it is necessary to pre-process the well log data through the curve environment correction, Backus averaging, and gather conditioning, for example through Radon denoise, Radon demultiple, residual moveout correction, etc. [46,47].
Figure 4a–d show P- and S-wave velocity logs in tandem with k and density logs, in which the processed well log (red) curves reflect more stable variations on a seismic scale. In addition, the yellow zone illustrates the target reservoir, while the underburden carbonate-rich layer has the highest values of velocity and density, as well as the lowest k values. The obvious contrast results in a strong reflection event at 2224 ms, and the values of k change dramatically with lithology-dependent variability. Furthermore, the range of incident angles is from 4° to 33° with a step of 1°. Although the observed correlation between the synthetic gather shown in Figure 4e and the real gather shown in Figure 4f is considerably enhanced using gather conditioning, amplitude discrepancy still exists in large angles.
Next, the seismic gathers at the well location shown in Figure 4f has been used to compare the results of these two AVO inversion methods based on the conventional YDP equation and the novel reparameterization for Young’s modulus and Poisson’s ratio, respectively. Figure 5 shows the fitting results of probability density distribution of the well log data, and we find that the prior information of Young’s modulus, Poisson’s ratio, and density is distributed as Cauchy distribution rather than Gaussian distribution, especially for Young’s modulus. We thus choose Cauchy distribution to provide sparse and higher-resolution inversion results. Figure 6 shows the relative inversion results from the above two methods, in which all the used low-frequency models, seismic wavelets, and inversion trade-off parameters are exactly the same. Figure 7 shows the final inversion results from the above two methods. From the comparison between the inverted results with two parameterized AVO approximate equations, we can see that these two inversion methods give similar estimates of Young’s modulus, that both show satisfactory agreement with the true well log curves. Further, the inverted results for Poisson’s ratio of our proposed method enjoy better stability than that of the conventional YPD equation (at times 2030 ms, 2150 ms, 2200 ms, marked with black arrows).
Figure 8 shows analysis of relative inversion results demonstrated by Figure 6 at well the location obtained by the conventional parameterization for the YPD–AVO approximation and the novel reparameterization for the AVO approximation proposed in this paper, respectively. It is obvious that the inversion results obtained by the novel reparameterization for the AVO approximation proposed in this paper matches the true well log data better than that of the conventional parameterization for the YPD–AVO approximation. As expected, our proposed inversion method based on the novel reparameterized AVO approximation can reliably estimate Young’s modulus and Poisson’s ratio, especially when the contrast in k value between the two media is large.
Furthermore, we show the comparison of inverted results at the well location described by the trend fitting surfaces shown in Figure 9a–c, in which the dots present the well log data. Compared with the trend fitting surface of inverted results obtained by the conventional parameterization for the YPD–AVO approximation shown in Figure 9b, we find that the trend fitting surface of inverted results obtained by the novel reparameterization for the AVO approximation shown in Figure 9c demonstrates better similarity to the true well log data shown in Figure 9a than the result by the conventional parameterization for the AVO approximation shown in Figure 9b, especially for Poisson’s ratio.
We also show the probability distribution density (PDF) map of true and inverted parameters using different parameterizations for the AVO approximation shown in Figure 10, in which the marginal 1D PDFs and joint 2D PDFs are illustrated to compare different methods to estimate the Young’s modulus, Poisson’s ratio and density, and the white dots present the well log data. From the marginal 1D PDFs of Young’s modulus (Figure 10a), Poisson’s ratio (Figure 10b), and density (Figure 10c), we can see that with the true model parameters as benchmark, the inverted model parameters using the novel reparameterized four-term AVO approximation are better than that using the conventional YPD–AVO approximation. From the analysis results of joint 2D PDFs for Young’s modulus and Poisson’s ratio shown in Figure 10d–f, the reparameterized four-term AVO approximation yields more accurate inversion results than the YPD–AVO approximation. However, the difference in joint 2D PDFs for Poisson’s ratio and density between the reparameterized four-term AVO approximation and the YPD–AVO approximation is not large due to the relatively poor inversion result of density term.
Finally, we extend the proposed method based on the novel reparameterized AVO approximation for Young’s modulus and Poisson’s ratio to the 2D case. The background information for the 2D case can be obtained using the available well log data in this area, i.e., the initial models of Young’s modulus, Poisson’s ratio, and density can be constructed by interpolating along the seismic interpretation horizons.
Figure 11 illustrates the stacked seismic section, and Figure 12 and Figure 13 demonstrate the inverted 2D sections of Young’s modulus and Poisson’s ratio, in which the ellipse solid lines indicate the target reservoir with brittle zones. Although the large contrast exists in impedance and k from the target layer into the carbonate layer, the inverted Young’s modulus and Poisson’s ratio match the drilling results. We can see that the lateral continuity and vertical variations in subsurface layers are both preserved because of the novel reparameterization and the proposed inversion algorithm. Moreover, the relatively more brittle layer can also be clearly delineated based on the inverted geomechanic parameters. In conclusion, this 2D field example verifies the validity and practicality of the proposed method.

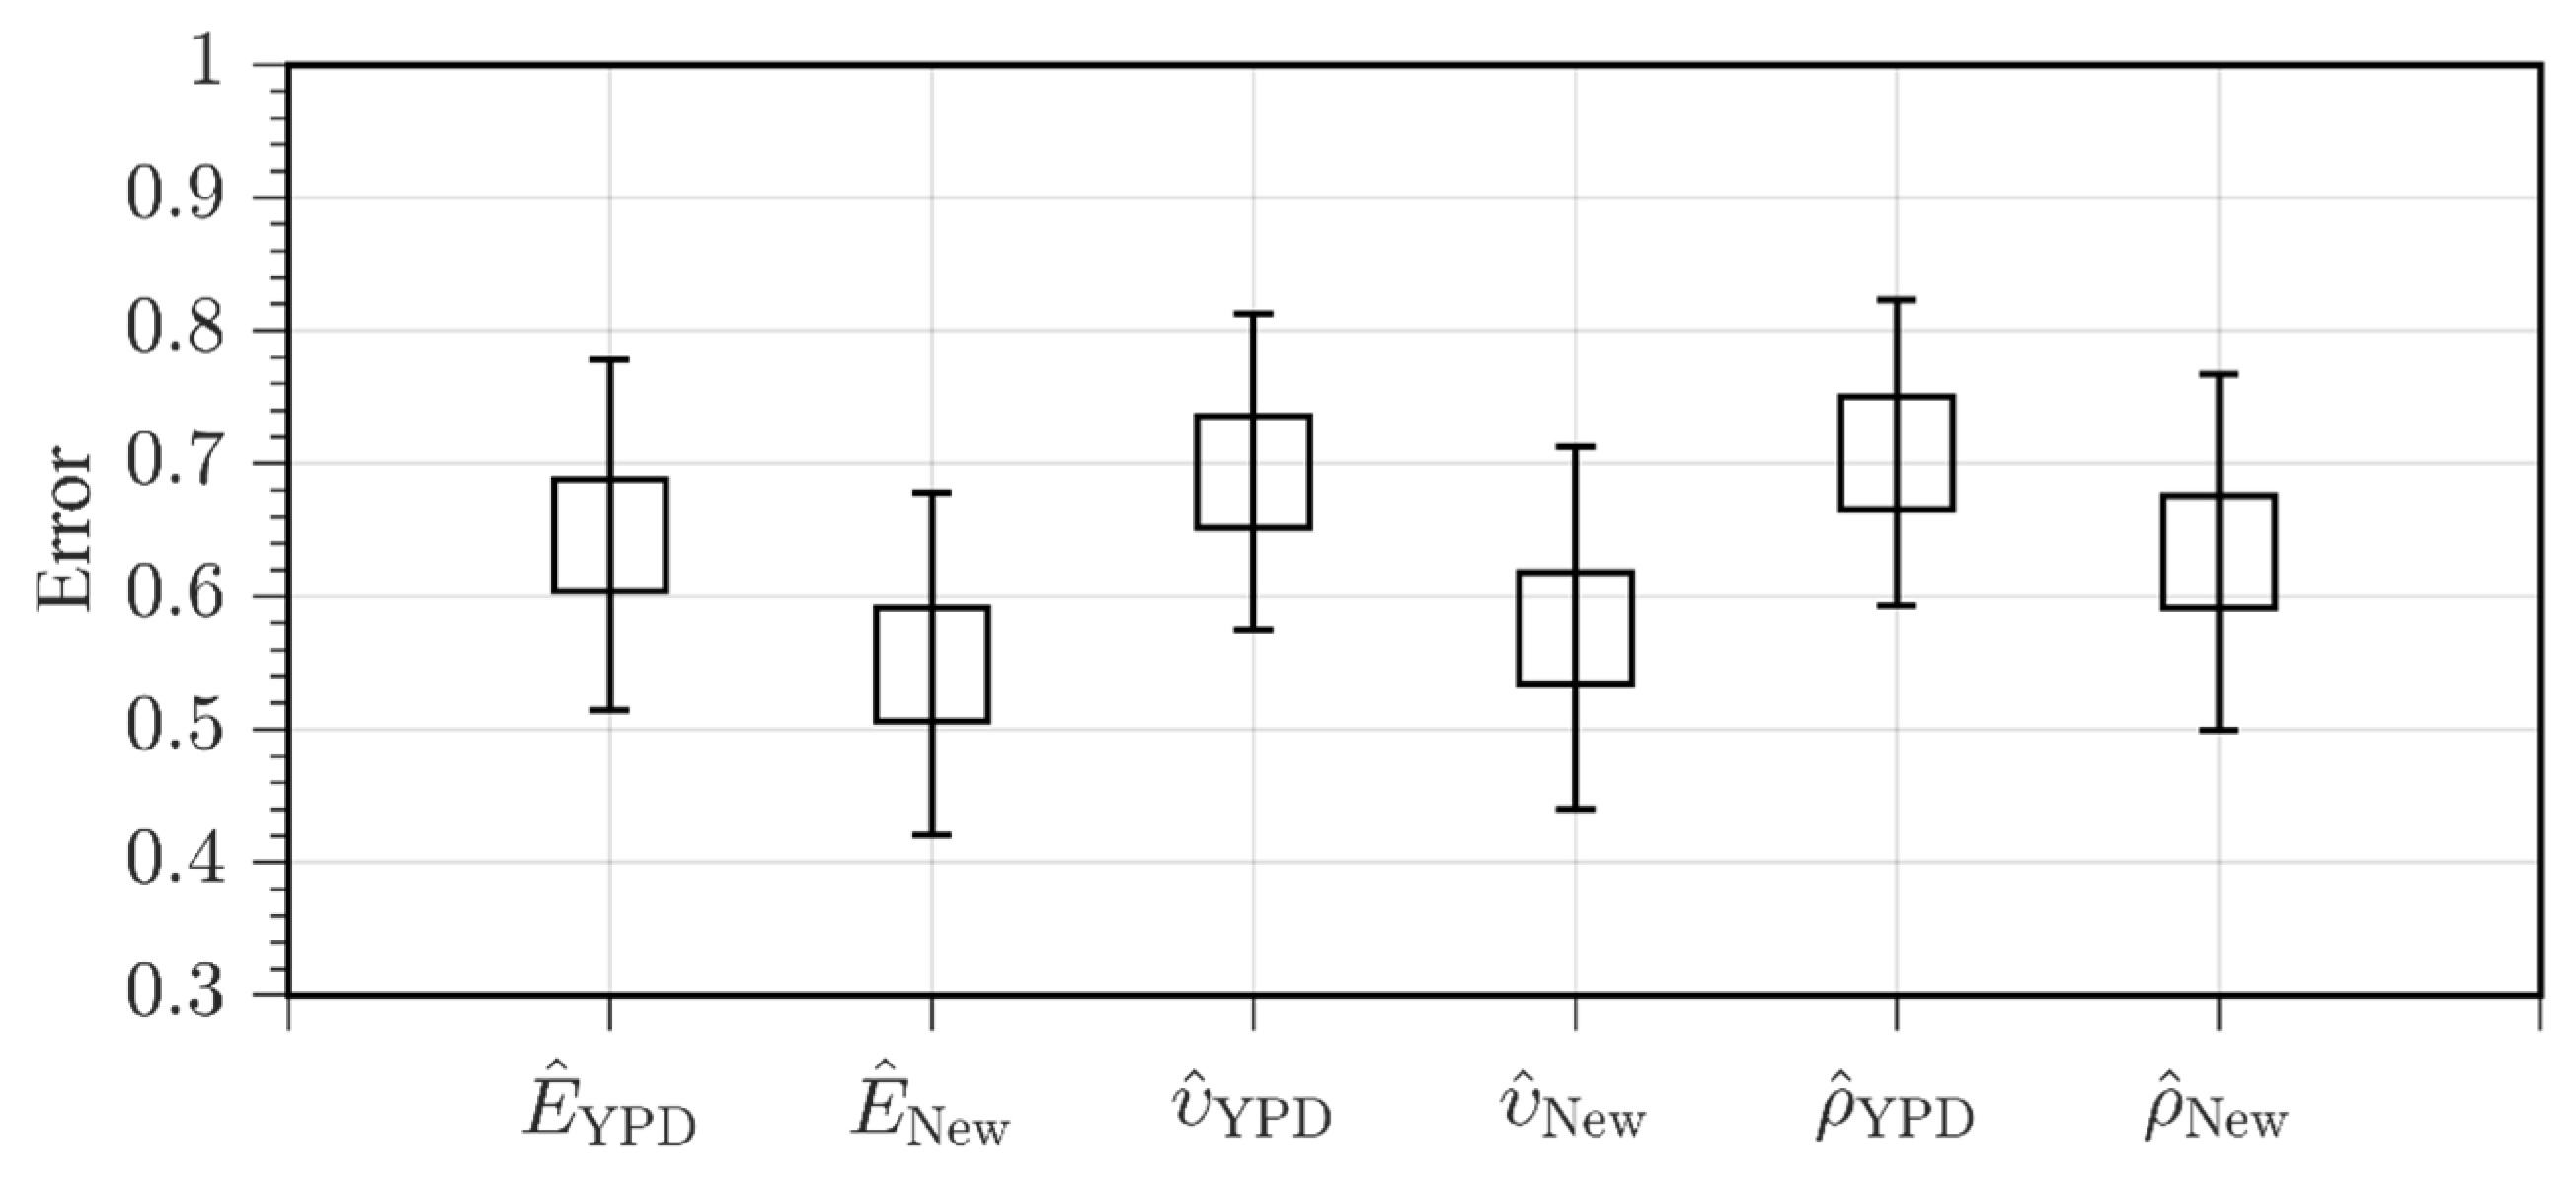
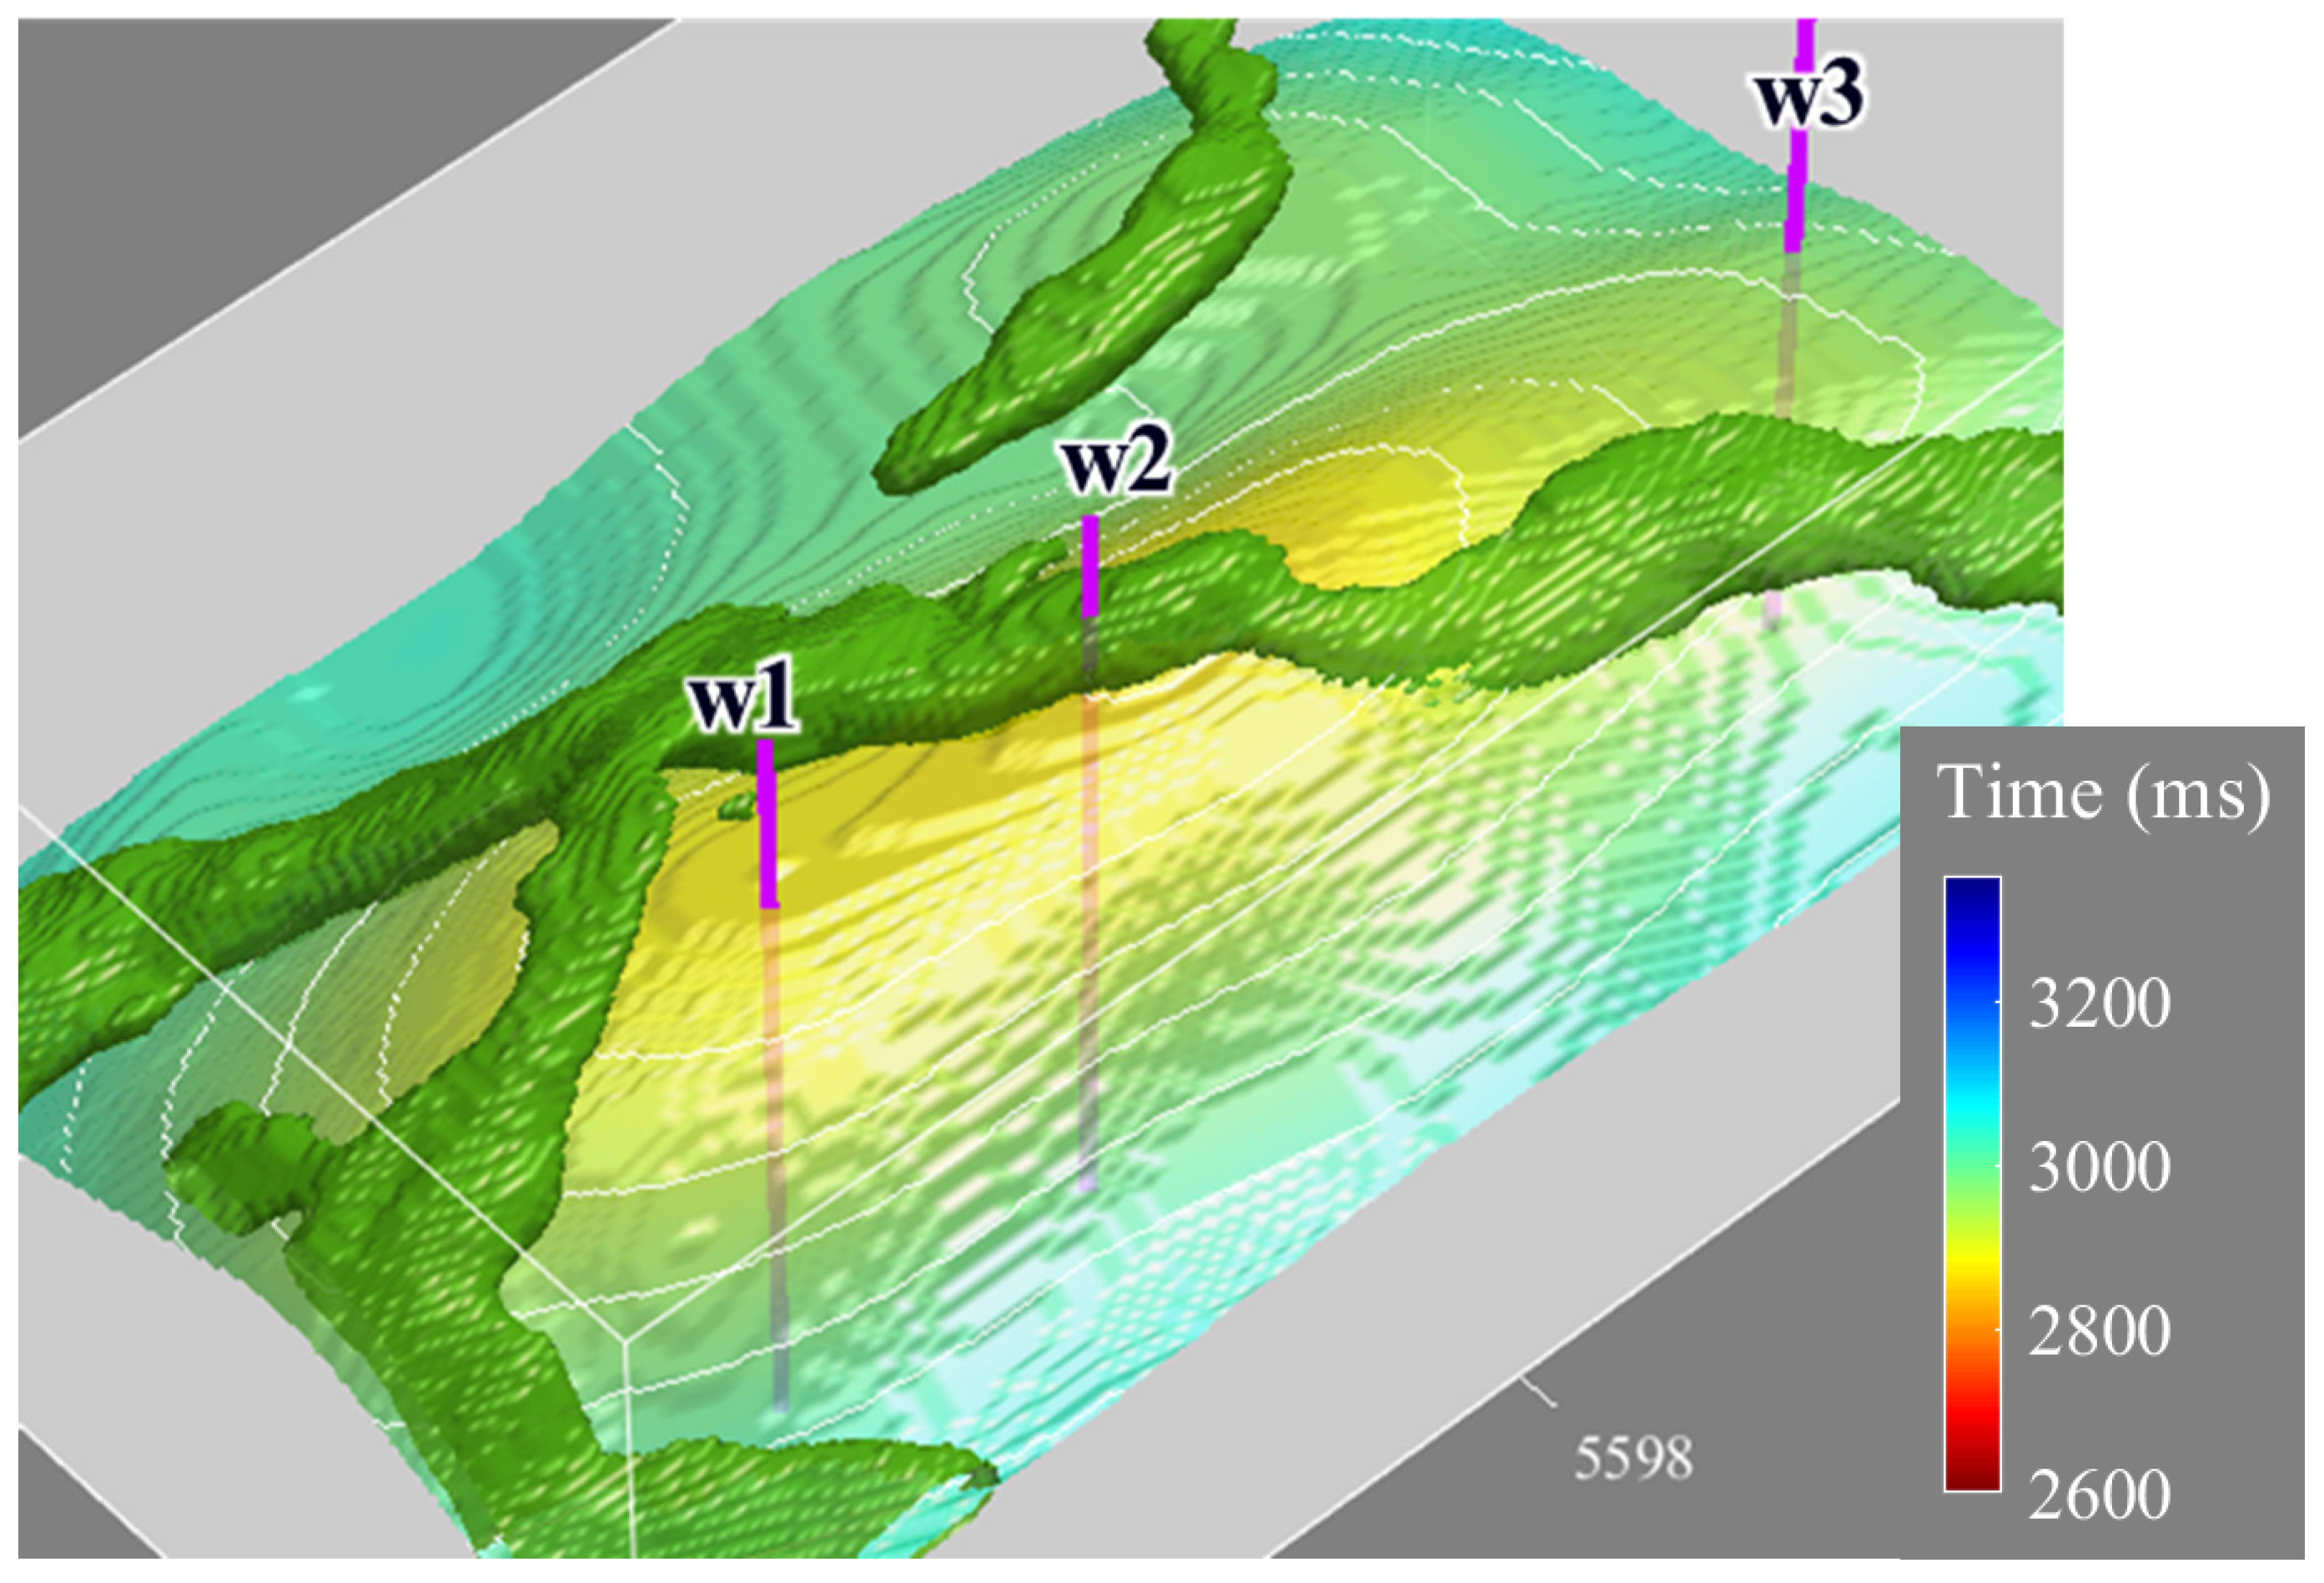
4.2. Three-Dimensional Real Data Example for Reservoir Characterization

This section shows the 3D practical effectiveness of the proposed method in a field scenario. The target area is located in East China. The target formation was deposited in a low-magnitude anticline structure and forms north–south trending distributary channels with a fault compartment, which has good lithologic hydrocarbon accumulation conditions. The favorable reservoir was controlled by the coupling of fault seal and sand. Therefore, accurate sand body description is essential for reservoir prediction. The main formations host most of the natural gas potential in the fluvial sequence. It is discovered by well w2 which comes across deep buried gas reservoirs with an average thickness of 15 m. The reservoirs consist of multiple sets of distributary channel sands, and the channels are stacked and separated by shale layers. Particularly, the burial and compaction have a strong influence on elastic properties, and the sandstones show an average porosity of 12.5% and a small difference in P-impedance with shale. As a result, the AVO anomalies of sands mostly behave as the class II or class IIp, and the energy of reflection amplitude is too weak to reveal the sand bodies in full-stack seismic data. To address that, amplitude-preserving processing is implemented to ensure the data quality. In fact, the gas field is in the appraisal phase, so it is crucial to obtain reliable inversion results for the delineation of target sand bodies.
The rock physics templates (RPTs) of shale content, porosity, and water saturation in terms of Young’s modulus and Poisson’s ratio are created to interpret the inversion results, which are shown in Figure 13. The RPTs indicate that the Poisson’s ratio of a layer with higher sand content is lower than that of the shale layer in the study area. Moreover, the RPTs suggest that Young’s modulus could decrease with the porosity, and gas content could further lower the Poisson’s ratio. Based on the RPTs, we can define a red polygonal zone, and use it directly transform the 3D inverted Young’s modulus and Poisson’s ratio data pairs into the geobodies by the polygonal zone mapping.
As shown in Figure 14, wells w1, w2, and w3 are all drilled appraisal wells (exploratory, vertical wells). The green geological body represents a sand body. In the context of exploration geophysics, geo-bodies—short for geological bodies—refer to distinct volumes or regions within the Earth’s subsurface that possess certain physical properties (e.g., elastic parameters, density) compared to their surrounding materials. These properties differentiate them from adjacent geological formations. Geo-bodies are critical targets for exploration because they often correspond to economically valuable resources. The 3D visualization is performed by using geobody-sculpting techniques. The opacity of the voxels is set at certain threshold values for elastic parameters given by rock physics template, and this may bring out the spatial distribution of the targeted channel sands. In addition, the distribution of the distributary channels is clearly delineated, which exhibits a good match at three drilled wells, the colored surface is the target horizon in time domain. Based on the gas layers and thicknesses interpreted from well log data, the well w2 encountered a 21.1 m gas-bearing sand, and the other drilled wells w1 and w3 individually encountered a 2 m dry layer and a 1.1 m water-bearing sand. We find that the target reservoirs in the study area are dominated by structure and lithology, with a maximum thickness of more than 35 m. The inversion results are consistent with the actual drilling results, demonstrating good spatial resolution and accuracy. The promising results support the continued reservoir characterization in appraisal and development.
Figure 13. Rock physics template for the target formation in terms of Young’s modulus and Poisson’s ratio, in which the colored scatter circles refer to sand content from well log interpretation, ϕ is the porosity, SW is the water saturation, VShale is the shale content, and VSand is the sand content. The red polygonal zone highlights the gas sand.
Jmse 13 00948 g013

5. Discussion

The proposed Bayesian inversion method for Young’s modulus and Poisson’s ratio, based on a novel reparameterized four-term PP-wave reflection coefficient, addresses a key limitation in conventional AVO inversion—its strong sensitivity to the background S-to-P wave velocity ratio. Unlike earlier approximations such as the Aki–Richard’s equation [48] and the YPD parameterization by Zong et al. [29], the new approach reduces the intrinsic nonlinearity associated with this ratio. This allows for more stable and accurate inversion results, particularly for Poisson’s ratio.
Compared with methods that assume a constant or empirically estimated value for the velocity ratio [20,27,29], our reparameterized equation provides a more robust formulation, particularly in heterogeneous reservoirs where this assumption breaks down. Similarly to recent efforts by Zhou et al. [31] and Ma and Sun [32] using the exact Zoeppritz formulations, our method emphasizes direct parameterization but does so within a linearized framework, making it computationally more efficient while retaining accuracy.
Furthermore, the use of Bayesian inversion incorporating Cauchy prior and low-frequency model constraints aligns with modern trends in probabilistic seismic inversion [42,43,44], which aim to better handle uncertainty and non-uniqueness in the inversion process. Our findings reinforce the utility of probabilistic frameworks when combined with tailored AVO approximations for specific elastic parameters like Poisson’s ratio, which is known to be a fluid and brittleness indicator [1,3].
By reducing sensitivity to velocity ratio assumptions, the proposed method contributes to improved reliability in seismic reservoir characterization. This advantage is particularly relevant for unconventional plays such as shale reservoirs, where elastic properties are tightly linked to brittleness and fracturability.

6. Conclusions

This study presents a novel Bayesian AVO inversion approach for directly estimating Young’s modulus and Poisson’s ratio from marine seismic data. By introducing a reparameterized four-term PP-wave reflection coefficient, we significantly reduce the dependence on the background S-to-P wave velocity ratio—a long-standing source of uncertainty in conventional AVO inversion methods such as the YPD approximation. Our method improves the stability and accuracy of Poisson’s ratio estimation, particularly in geologically complex and heterogeneous reservoirs. The integration of Cauchy prior and low-frequency model regularization within a Bayesian framework enhances the robustness of the inversion results, as confirmed through synthetic and field data applications. Importantly, the approach enables more reliable characterization of mechanical properties linked to reservoir quality and brittleness, which are critical for hydraulic fracturing and unconventional resource development. The application to real 3D seismic data demonstrates the practical viability of this method in delineating reservoir heterogeneity with greater confidence. Future work may explore extending this approach to anisotropic media and integrating rock physics constraints more deeply, further enhancing its applicability to complex geological settings.

Author Contributions

Conceptualization, J.W., X.P. and X.Z.; formal analysis, W.S., C.L. and Y.Z.; funding acquisition, J.W. and X.P.; methodology, X.Z.; project administration, J.W., X.P. and X.Z.; resources, J.W. and X.Z.; software, J.W. and X.Z.; supervision, X.P.; validation, W.S., C.L. and Y.Z.; visualization, X.Z.; writing—original draft, X.Z.; writing—review and editing, X.P. and X.Z. All authors have read and agreed to the published version of the manuscript.

Funding

This research was funded by the National Natural Science Foundation of China (Grant No. U23B20158, 42474172), the Natural Science Foundation of Hunan Province (2025JJ20036), the Technology Innovation Program of Hunan Province (Grant No. 2022RC1238), and the Open Fund Project of National Engineering Laboratory of Offshore Oil Exploration (Grant No. CCL2024RCPS0288KQN).

Data Availability Statement

The original contributions presented in this study are included in the article. Further inquiries can be directed to the corresponding author.

Acknowledgments

The authors would like to thank the CNOOC Research Institute for permission to publish this article.

Conflicts of Interest

The authors Jianhua Wang, Wenbo Sun, Chao Li and Ying Zheng were employed by the company CNOOC Research Institute Co., Ltd., and the author Xiaolong Zhao was employed by the company CNOOC (China) Limited Beijing New Energy Branch. The remaining authors declare that the research was conducted in the absence of any commercial or financial relationships that could be construed as a potential conflict of interest.

Nomenclature

E Young’s modulus
υ Poisson’s ratio
ρ density
θ incidence angle
Δ small perturbation
¯background value
k the square of S-to-P-wave velocity ratio
N temporal samples
M numbers of incidence angles
d θ seismic angle gather vector
L θ kernel matrix
m model parameter vector
n noise vector
σ n 2 variances of measured noise
σ i 2 variances of model parameters
J G m data error matrix term
J C a u c h y m Cauchy-sparse constraint term
J L F M m low-frequency model constraint term
Q m diagonal matrix
W θ j Toeplitz matrix
W θ wavelet matrix
G i θ j coefficient-weighting matrix
O zero matrix
I l identity matrix
C integral matrix

Appendix A

Appendix A.1. Derivation of the Novel Four-Term Reparameterization for the AVO Approximation

For small changes in the P-wave velocity, S-wave velocity, and density across a boundary between two elastic media, the P-wave reflection coefficient for an incident P-wave as a function of angle in an isotropic medium can be expressed in terms of P- and S-wave velocities ( V P and V S ), and density ( ρ ) reflectivities given by Aki and Richards [48], i.e.,
R PP θ = R V P θ + R V S θ + R ρ θ
where each angle-weighted reflectivity term, respectively, for P-wave velocity V P , S-wave velocity V S , and density ρ , can be expressed as
R V P θ = sec 2 θ 2 Δ V P V P ¯
R V S θ = 4 k sin 2 θ Δ V S V S ¯
R ρ θ = 1 2 1 4 k sin 2 θ Δ ρ ρ ¯
where the symbol Δ represents the small perturbation (i.e., Δ V P = V P 2 V P 1 , Δ V S = V S 2 V S 1 , and Δ ρ = ρ 2 ρ 1 ), and the bar ¯ represents the background value of elastic parameters across the reflection boundary (i.e., V P ¯ = V P 1 + V P 2 / 2 , V S ¯ = V S 1 + V S 2 / 2 , and ρ ¯ = ρ 1 + ρ 2 / 2 ).
In addition, Shuey [49] transforms Equation (A1) from S-wave velocity and perturbation in S-wave velocity to Poisson’s ratio and perturbation in Poisson’s ratio. Gray et al. [50] reformulate Equation (A1) for two sets of fundamental constants: the first and second Lamé constants and density ( λ , μ , ρ ), and bulk modulus, shear modulus and density ( K , μ , ρ ). Russel et al. [51] combines poroelasticity theory and linearized AVO to give a new formulation to estimate fluid properties of the reservoirs.
Under the assumption of isotropic media, P- and S-wave velocities and density can be expressed as a function of Young’s modulus (E) and Poisson’s ratio (ν), which are given by
ρ V P 2 = E 1 υ ( 1 + υ ) ( 1 2 υ )
ρ V S 2 = 1 2 E ( 1 + υ )
Young’s modulus and Poisson’s ratio are fundamental elastic parameters that describe the mechanical response of a material under stress. Young’s modulus (E) quantifies a material’s stiffness and is defined as the ratio of uniaxial stress to uniaxial strain in the linear elastic region of the stress–strain curve. It characterizes how resistant a material is to axial deformation; materials with higher Young’s modulus values are stiffer and store more elastic energy. Poisson’s ratio (ν), on the other hand, describes the ratio of lateral strain to axial strain when a material is compressed or stretched. It reflects how much a material deforms laterally when subjected to longitudinal stress. Together, these parameters provide a comprehensive understanding of the elastic behavior of subsurface rocks, which is essential for seismic reservoir characterization, geomechanical modeling, and brittleness evaluation. For further theoretical background, readers may refer to Lee et al. [52] and Udoh et al. [53], who detail the interrelations among elastic moduli and their applications in material and geophysical contexts.
Therefore, the conventional YPD equation can be thus derived as
R P P θ = R E θ + R υ θ + R ρ θ
Combining Equations (5) and (6), Equations (A5) and (A6) can be expressed in terms of υ 1 and υ 2 as
ρ V P 2 = E υ 1 υ 2 2 υ 2 3 υ 2 1
ρ V S 2 = E υ 2 3 υ 2 1
By applying the chain rule of multi-variate partial derivatives to Equations (A8) and (A9), the relative perturbations in Δ V P E , υ 1 , υ 2 , ρ and Δ V S E , υ 1 , υ 2 , ρ can be expressed as
Δ V P V P ¯ = 1 2 Δ E E ¯ + Δ υ 1 υ 1 ¯ + 3 5 k 3 4 k Δ υ 2 υ 2 ¯ Δ ρ ρ ¯
Δ V S V S ¯ = 1 2 Δ E E k 3 4 k Δ υ 2 υ 2 Δ ρ ρ
Substituting Equations (A10) and (A11) into Equation (A1) yields
R P P θ = R E θ + R υ 1 θ + R υ 2 θ + R ρ θ

Appendix A.2. Process of Bayesian AVO Inversion for Young’s Modulus and Poisson’s Ratio

The seismic angle gather d θ with N temporal samples and M angles of incidence is linearly related to the model parameters m and the noise n
d θ N M × 1 = L θ N M × 4 N m 4 N × 1 + n N M × 1
where seismic angle gather vector d θ can be written as d θ i = d t 1 , θ i d t N , θ i T , and the model parameter vector m can be written as
m 4 N × 1 = m 1 , m 2 , m 3 , m 4 T = Δ E E ¯ , Δ υ 1 υ ¯ 1 , Δ υ 2 υ ¯ 2 , Δ ρ ρ ¯ T
In addition, L θ = G θ W θ is a kernel matrix as a multiplication between convolution matrix of angle-dependent wavelet matrix W θ and coefficient-weighting matrix G θ = G 1 T θ G 2 T θ G 3 T θ G 4 T θ , which can be expressed as
L θ N M × 4 N = G 1 θ 1 W θ 1 G 2 θ 1 W θ 1 G 3 θ 1 W θ 1 G 4 θ 1 W θ 1 G 1 θ 2 W θ 2 G 2 θ 2 W θ 2 G 3 θ 2 W θ 2 G 4 θ 2 W θ 2 G 1 θ M W θ M G 2 θ M W θ M G 3 θ M W θ M G 4 θ M W θ M
in which the angle-dependent weighting coefficients for the ith inversion parameter and jth angle of incidence G i θ j can be written as
G 1 θ j N × N = d i a g a E t 1 , θ j a E t N , θ j ,  
G 2 θ j N × N = d i a g a ν 1 t 1 , θ j a ν 1 t N , θ j ,
G 3 θ j N × N = d i a g a ν 2 t 1 , θ j a ν 2 t N , θ j ,  
G 4 θ j N × N = d i a g a ρ t 1 , θ j a ρ t N , θ j ,
where
a E θ j = sec 2 θ j 4 2 k sin 2 θ j ,  
a ν 1 θ j = sec 2 θ j 4 ,
a ν 2 θ j = 3 5 k 4 3 4 k sec 2 θ j + 2 k 2 3 4 k sin 2 θ j ,  
a ρ θ j = 1 2 1 4 sec 2 θ j .
The seismic wavelet matrix for jth angle of incidence W θ j is a Toeplitz matrix, shown as the form of wavelet vector and the identity matrix:
W θ j = w 0 θ j w 1 θ j w L 1 θ j w 1 θ j w 0 θ j w 1 θ j w 1 θ j w 1 θ j w 1 θ j w 0 θ j w 1 θ j w ( L 1 ) θ j w 1 θ j w 0 θ j                       = w ( L 1 ) θ j O 1 + + w 0 θ j 1 O O 1 + + w L 1 θ j 1 O                       = w L 1 θ j I L 1 + + w L 1 θ j I 0 + w L 1 θ j I L 1                       = l = L + 1 L 1 w l θ j I l .
where w l θ j is the seismic wavelet for jth angle of incidence, O and I l are the zero matrix and identity matrix, respectively, and L = 1 2 N + 1 .
We further consider extending our formulation by introducing the low-frequency model (LFM) prior information distributed according to the Gaussian distribution—it is equivalent to constraining the problem with L2 norm regularization. We take the case of Young’s modulus, and the reflectivity of Young’s modulus m 1 = Δ E E ¯ can be expressed in the small reflectivity as
m 1 t = Δ E t E ¯ t d E t E ¯ t ln E t 2 t
The above equation is integrated with respect to time, and we can obtain the following:
1 2 ln E t E t 1 = t 1 t E τ d τ
where E t 1 is the initial values of Young’s modulus, and equation (38) can link the Young’s modulus to the reflectivity of Young’s modulus. Similar cases can be extended to the Poisson’s ratio υ 1 , υ 2 , and the density ρ .
In Equation (16) and take Young’s modulus for example, ξ 1 is equal to 1 2 ln E t / E t 1 , in which E t 1 is the LFM value at the first time sample t 1 . In addition, the integral matrix C converting the reflectivity into the formation property parameters can be expressed as follows:
C = t 1 t d τ = 1 1 1 1 1 1 1 n × n

References

  1. Zong, Z.; Yin, X. Direct inversion of Young’s and Poisson impedances for fluid discrimination. Geofluids 2016, 16, 1006–1016. [Google Scholar] [CrossRef]
  2. Singleton, S. Geophysical data processing, rock property inversion, and geomechanical model building in a Midland Basin development project, Midland/Ector Counties, Texas. Lead. Edge 2018, 37, 182–189. [Google Scholar] [CrossRef]
  3. Pan, X.; Zhang, G. Amplitude variation with incident angle and azimuth inversion for Young’s impedance, Poisson’s ratio and fracture weaknesses in shale gas reservoirs. Geophys. Prospect. 2019, 67, 1898–1911. [Google Scholar] [CrossRef]
  4. Sayers, C.M.; Koesoemadinata, A.; Dasgupta, S.; Sudhakar, V.; Hearn, R. Predicting drilling performance in unconventional reservoirs using seismic inversion. In The SEG Technical Program Expanded Abstracts; Society of Exploration Geophysicists: Houston, TX, USA, 2020; pp. 310–314. [Google Scholar]
  5. Avseth, P.; Mukerji, T.; Mavko, G. Quantitative Seismic Interpretation: Applying Rock Physics Tools to Reduce Interpretation Risk; Cambridge University Press: Cambridge, UK, 2005. [Google Scholar]
  6. Arévalo-López, H.S.; Dvorkin, J.P. Porosity, mineralogy, and pore fluid from simultaneous impedance inversion. Lead. Edge 2016, 35, 423–429. [Google Scholar] [CrossRef]
  7. Keynejad, S.; Sbar, M.L.; Johnson, R.A. Comparison of model-based generalized regression neural network and prestack inversion in predicting Poisson’s ratio in Heidrun Field, North Sea. Lead. Edge 2017, 36, 938–946. [Google Scholar] [CrossRef]
  8. Rickman, R.; Mullen, M.; Petre, J.; Grieser, W.; Kundert, D. A practical use of shale petrophysics for stimulation design optimization: All shale plays are not clones of the Barnett shale. In SPE Annual Technical Conference and Exhibition; Society of Petroleum Engineers (SPE): Denver, CO, USA, 2008. [Google Scholar]
  9. Guo, Z.; Li, X.; Liu, C.; Feng, X.; Shen, Y. A shale rock physics model for analysis of brittleness index, mineralogy and porosity in the Barnett shale. J. Geophys. Eng. 2013, 10, 25006. [Google Scholar] [CrossRef]
  10. Wang, Q.; Wang, Y.; Guo, S.; Xing, Z.; Liu, Z. The effect of shale properties on the anisotropic brittleness criterion index from laboratory study. J. Geophys. Eng. 2015, 12, 866–874. [Google Scholar] [CrossRef]
  11. Wu, H.; Dong, S.; Huang, Y.; Wang, H.; Chen, G. Brittleness index calculation and evaluation for CBM reservoirs based on AVO simultaneous inversion. J. Appl. Geophys. 2016, 134, 191–198. [Google Scholar] [CrossRef]
  12. Harris, N.B.; Miskimins, J.L.; Mnich, C.A. Mechanical anisotropy in the Woodford Shale, Permian Basin: Origin, magnitude, and scale. Lead. Edge 2011, 30, 284–291. [Google Scholar] [CrossRef]
  13. Sena, A.; Castillo, G.; Chesser, K.; Voisey, S.; Estrada, J.; Carcuz, J.; Carmona, E.; Hodgkins, P. Seismic reservoir characterization in resource shale plays: Stress analysis and sweet spot discrimination. Lead. Edge 2011, 30, 758–764. [Google Scholar] [CrossRef]
  14. Gray, D.; Anderson, P.; Logel, J.; Delbecq, F.; Schmidt, D.; Schmid, R. Estimation of stress and geomechanical properties using 3D seismic data. First Break 2012, 30, 59–68. [Google Scholar] [CrossRef]
  15. Sharma, R.K.; Chopra, S. Determination of lithology and brittleness of rocks with a new attribute. Lead. Edge 2015, 34, 554–564. [Google Scholar] [CrossRef]
  16. Sayers, C.; Lascano, M.; Gofer, E.; Den Boer, L.; Walz, M.; Hannan, A.; Dasgupta, S.; Goodway, W.; Perez, M.; Purdue, G. Geomechanical model for the Horn River formation based on seismic AVA inversion. In the SEG Technical Program Expanded Abstracts; Society of Exploration Geophysicists: Dallas, TX, USA, 2016. [Google Scholar]
  17. Pan, X.; Zhang, G.; Yin, X. Estimation of effective geostress parameters driven by anisotropic stress and rock physics models with orthorhombic symmetry. J. Geophys. Eng. 2017, 14, 1124–1137. [Google Scholar] [CrossRef]
  18. Zoeppritz, K. On reflection and propagation of seismic waves. Gottinger Nachrichten 1919, 1, 66–84. [Google Scholar]
  19. Wang, Y.H. Approximations to the Zoeppritz equations and their use in AVO analysis. Geophysics 1999, 64, 1920–1927. [Google Scholar] [CrossRef]
  20. Downton, J.E. Seismic Parameter Estimation from AVO Inversion. Ph.D. Thesis, University of Calgary, Calgary, AB, Canada, 2005. [Google Scholar]
  21. Yin, X.Y.; Zhang, S.X. Bayesian inversion for effective pore-fluid bulk modulus based on fluid-matrix decoupled amplitude variation with offset approximation. Geophysics 2014, 79, R221–R232. [Google Scholar] [CrossRef]
  22. Dai, R.; Yin, C.; Peng, D. AVA inversion of pre-stack seismic data with cross-gradient constraints. J. Appl. Geophys. 2022, 199, 104594. [Google Scholar] [CrossRef]
  23. Fatti, J.L.; Smith, G.C.; Vail, P.J.; Strauss, P.J.; Levitt, P.R. Detection of gas in sandstone reservoirs using AVO analysis: A 3-D seismic case history using the geostack technique. Geophysics 1994, 59, 1137–1362. [Google Scholar] [CrossRef]
  24. Russell, B.H. Prestack seismic amplitude analysis: An integrated overview. Interpretation 2014, 2, C19–C36. [Google Scholar] [CrossRef]
  25. Debski, W.; Tarantola, A. Information on elastic parameters obtained from the amplitudes of reflected waves. Geophysics 1995, 60, 1426–1436. [Google Scholar] [CrossRef]
  26. Pan, X.; Zhang, G. Model parameterization and PP-wave Amplitude Versus Angle and Azimuth (AVAZ) direct inversion for fracture quasi-weaknesses in weakly anisotropic elastic media. Surv. Geophys. 2018, 39, 937–964. [Google Scholar] [CrossRef]
  27. Pan, X.; Zhang, G.; Yin, X. Elastic impedance variation with angle and azimuth inversion for brittleness and fracture parameters in anisotropic elastic media. Surv. Geophys. 2018, 39, 965–992. [Google Scholar] [CrossRef]
  28. Pan, X.; Zhang, P.; Zhang, G.; Guo, Z.; Liu, J. Seismic characterization of fractured reservoirs with elastic impedance difference versus angle and azimuth: A low-frequency poroelasticity perspective. Geophysics 2021, 86, M123–M139. [Google Scholar] [CrossRef]
  29. Zong, Z.; Yin, X.; Wu, G. Elastic impedance parameterization and inversion with Young’s modulus and Poisson’s ratio. Geophysics 2013, 78, N35–N42. [Google Scholar] [CrossRef]
  30. Sharifi, J.; Hafezi Moghaddas, N.; Lashkaripour, G.R.; Javaherian, A.; Mirzakhanian, M. Application of extended elastic impedance in seismic geomechanics. Geophysics 2019, 84, R429–R446. [Google Scholar] [CrossRef]
  31. Zhou, L.; Li, J.; Chen, X.; Liu, X.; Chen, L. Prestack amplitude versus angle inversion for Young’s modulus and Poisson’s ratio based on the exact Zoeppritz equations. Geophys. Prospect. 2017, 65, 1462–1476. [Google Scholar] [CrossRef]
  32. Ma, Q.; Sun, Z. Direct inversion of Young’s modulus and Poisson’s ratio using exact Zoeppritz equations based on double constraints. J. Seism. Explor. 2019, 28, 175–204. [Google Scholar]
  33. Grana, D.; Russell, B.; Mukerji, T. Petrophysical inversion based on f-s-r amplitude-variation-with-offset linearization and canonical correlation analysis. Geophysics 2022, 87, M247–M258. [Google Scholar] [CrossRef]
  34. Li, P.; Grana, D.; Liu, M. Bayesian neural network and Bayesian physics-informed neural network via variational inference for seismic petrophysical inversion. Geophysics 2024, 89, M185–M196. [Google Scholar] [CrossRef]
  35. Grana, D.; Liu, M.; de Figueiredo, L. GeosPIn: A MATLAB library for geostatistical petrophysical inversion. Geophysics 2024, 89, F77–F88. [Google Scholar] [CrossRef]
  36. Liu, M.; Grana, D.; Mukerji, T. Geostatistical inversion for subsurface characterization using Stein variational gradient descent with autoencoder neural network: An application to geologic carbon sequestration. J. Geophys. Res. Solid Earth 2024, 129, e2024JB029073. [Google Scholar] [CrossRef]
  37. Grana, D.; de Figueiredo, L.; Paparozzi, E.; Ravasio, A. Hierarchical Bayesian AVO-facies inversion using I p and Vp/Vs parametrization. Geophysics 2025, 90, 1–53. [Google Scholar] [CrossRef]
  38. Mallick, S. AVO and elastic impedance. Lead. Edge 2001, 20, 1094–1104. [Google Scholar] [CrossRef]
  39. Smith, G.C.; Gidlow, P.M. Weighted stacking for rock property estimation and detection of gas. Geophys. Prospect. 1987, 35, 993–1014. [Google Scholar] [CrossRef]
  40. Aleardi, M.; Tognarelli, A. The limits of narrow and wide-angle AVA inversions for high Vp/Vs ratios: An application to elastic seabed characterization. J. Appl. Geophys. 2016, 131, 54–68. [Google Scholar] [CrossRef]
  41. Downton, J.E.; Roure, B. Interpreting azimuthal Fourier coefficients for anisotropic and fracture parameters. Interpretation 2015, 3, ST9–ST27. [Google Scholar] [CrossRef]
  42. Scales, J.A.; Tenorio, L. Prior information and uncertainty in inverse problems. Geophysics 2001, 66, 389–397. [Google Scholar] [CrossRef]
  43. Sacchi, M.D. Reweighting strategies in seismic deconvolution. Geophys. J. Int. 1997, 129, 651–656. [Google Scholar] [CrossRef]
  44. Alemie, W.; Sacchi, M.D. High-resolution three-term AVO inversion by means of a Trivariate Cauchy probability distribution. Geophysics 2011, 76, R43–R55. [Google Scholar] [CrossRef]
  45. Saneifar, M.; Aranibar, A.; Heidari, Z. Rock classification in the Haynesville Shale based on petrophysical and elastic properties estimated from well logs. Interpretation 2015, 3, A65–A75. [Google Scholar] [CrossRef]
  46. Russell, B.; Hampson, D.; Chun, J. Noise elimination and the Radon transform, Part 1. Lead. Edge 1990, 9, 18–23. [Google Scholar] [CrossRef]
  47. Contreras, A.; Torres-Verdín, C.; Fasnacht, T. Sensitivity analysis of data-related factors controlling AVA simultaneous inversion of partially stacked seismic amplitude data: Application to deepwater hydrocarbon reservoirs in the central Gulf of Mexico. Geophysics 2007, 72, C19–C29. [Google Scholar] [CrossRef]
  48. Aki, K.; Richards, P.G. Quantitative Seismology, 2nd ed.; W.H. Freeman and Company: New York City, NY, USA, 2002. [Google Scholar]
  49. Shuey, R.T. A simplification of the Zoeppritz equations. Geophysics 1985, 50, 609–614. [Google Scholar] [CrossRef]
  50. Gray, F.; Chen, T.; Goodway, W. Bridging the gap: Using AVO to detect changes in fundamental elastic constants. In 69th Annual International Meeting, SEG, Expanded Abstracts; Society of Exploration Geophysicists: Houston, TX, USA, 1999; pp. 852–855. [Google Scholar]
  51. Russell, B.H.; Gray, D.; Hampson, D.P. Linearized AVO and poroelasticity. Geophysics 2011, 76, C19–C29. [Google Scholar] [CrossRef]
  52. Lee, S.J.; Han, S.W.; Hyun, S.M.; Lee, H.J.; Kim, J.H.; Kim, Y.I. Measurement of Young’s modulus and Poisson’s ratio for thin Au films using a visual image tracing system. Curr. Appl. Phys. 2009, 9, S75–S78. [Google Scholar] [CrossRef]
  53. Udoh, P.J.; Nsien, E.F.; Abasiekwere, U.A. On the relationship between young’s modulus, shear modulus and Poisson’s ratio. World J. Appl. Sci. Technol. 2023, 15, 354–361. [Google Scholar] [CrossRef]
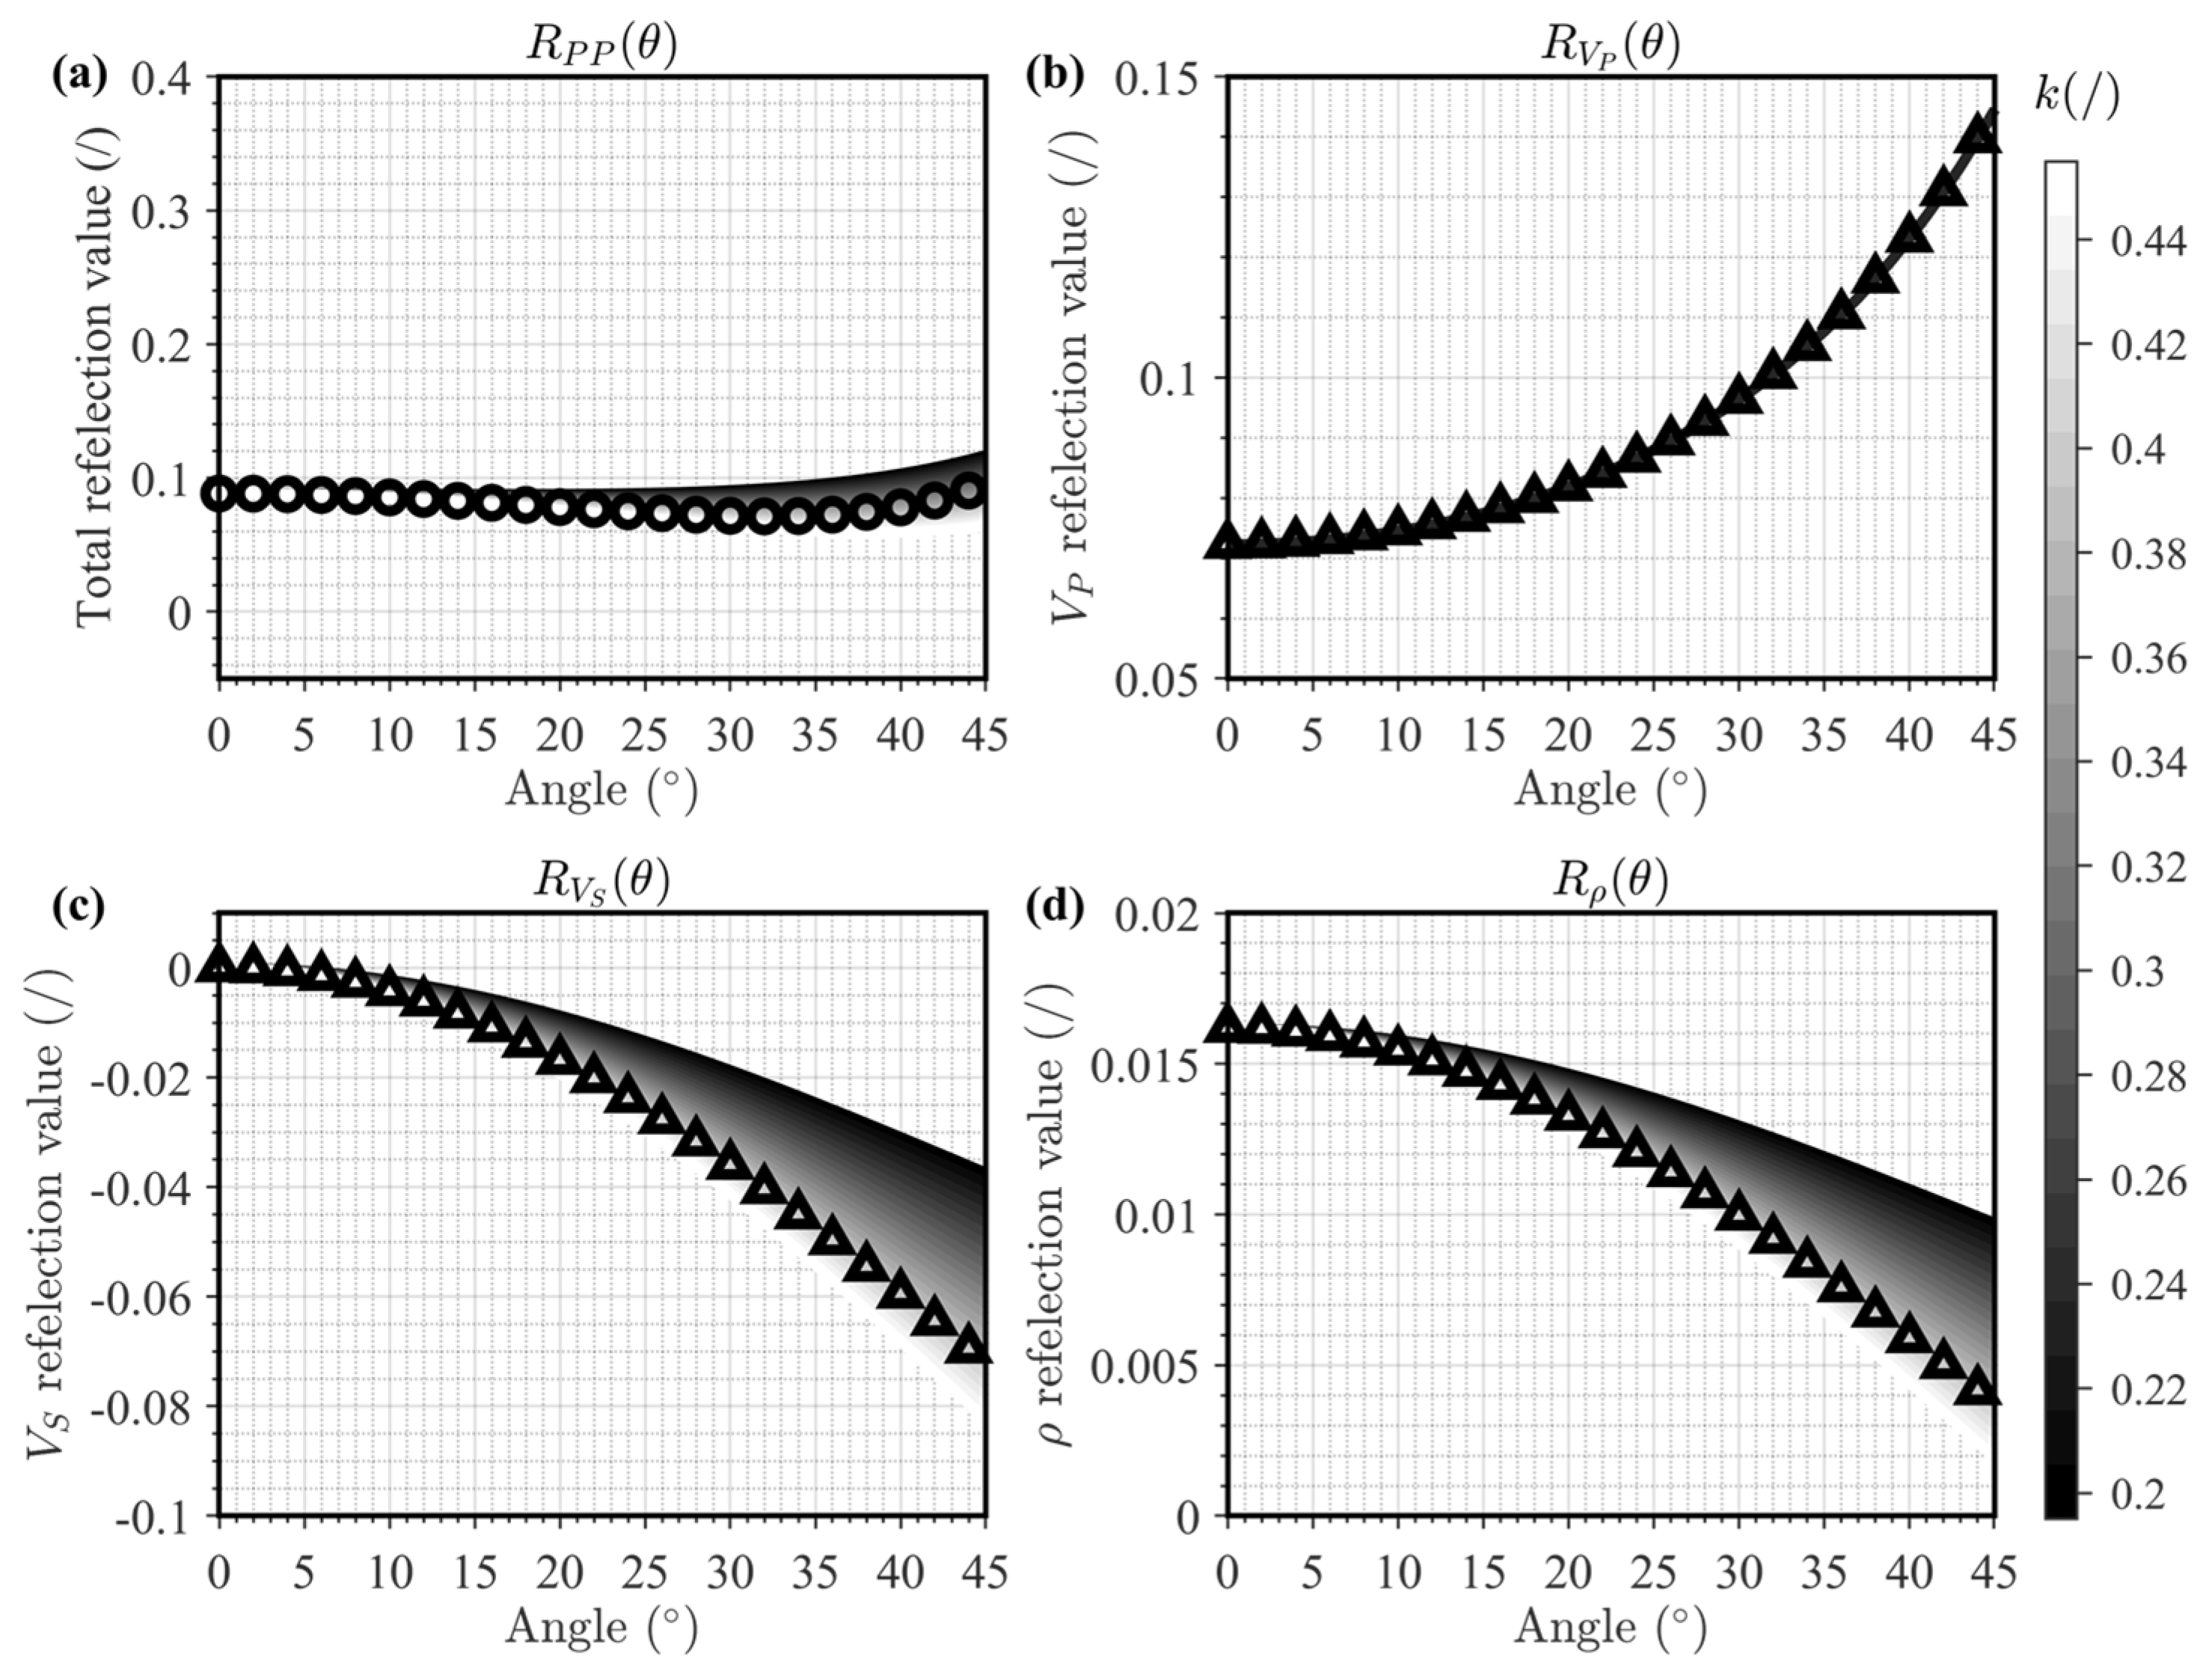
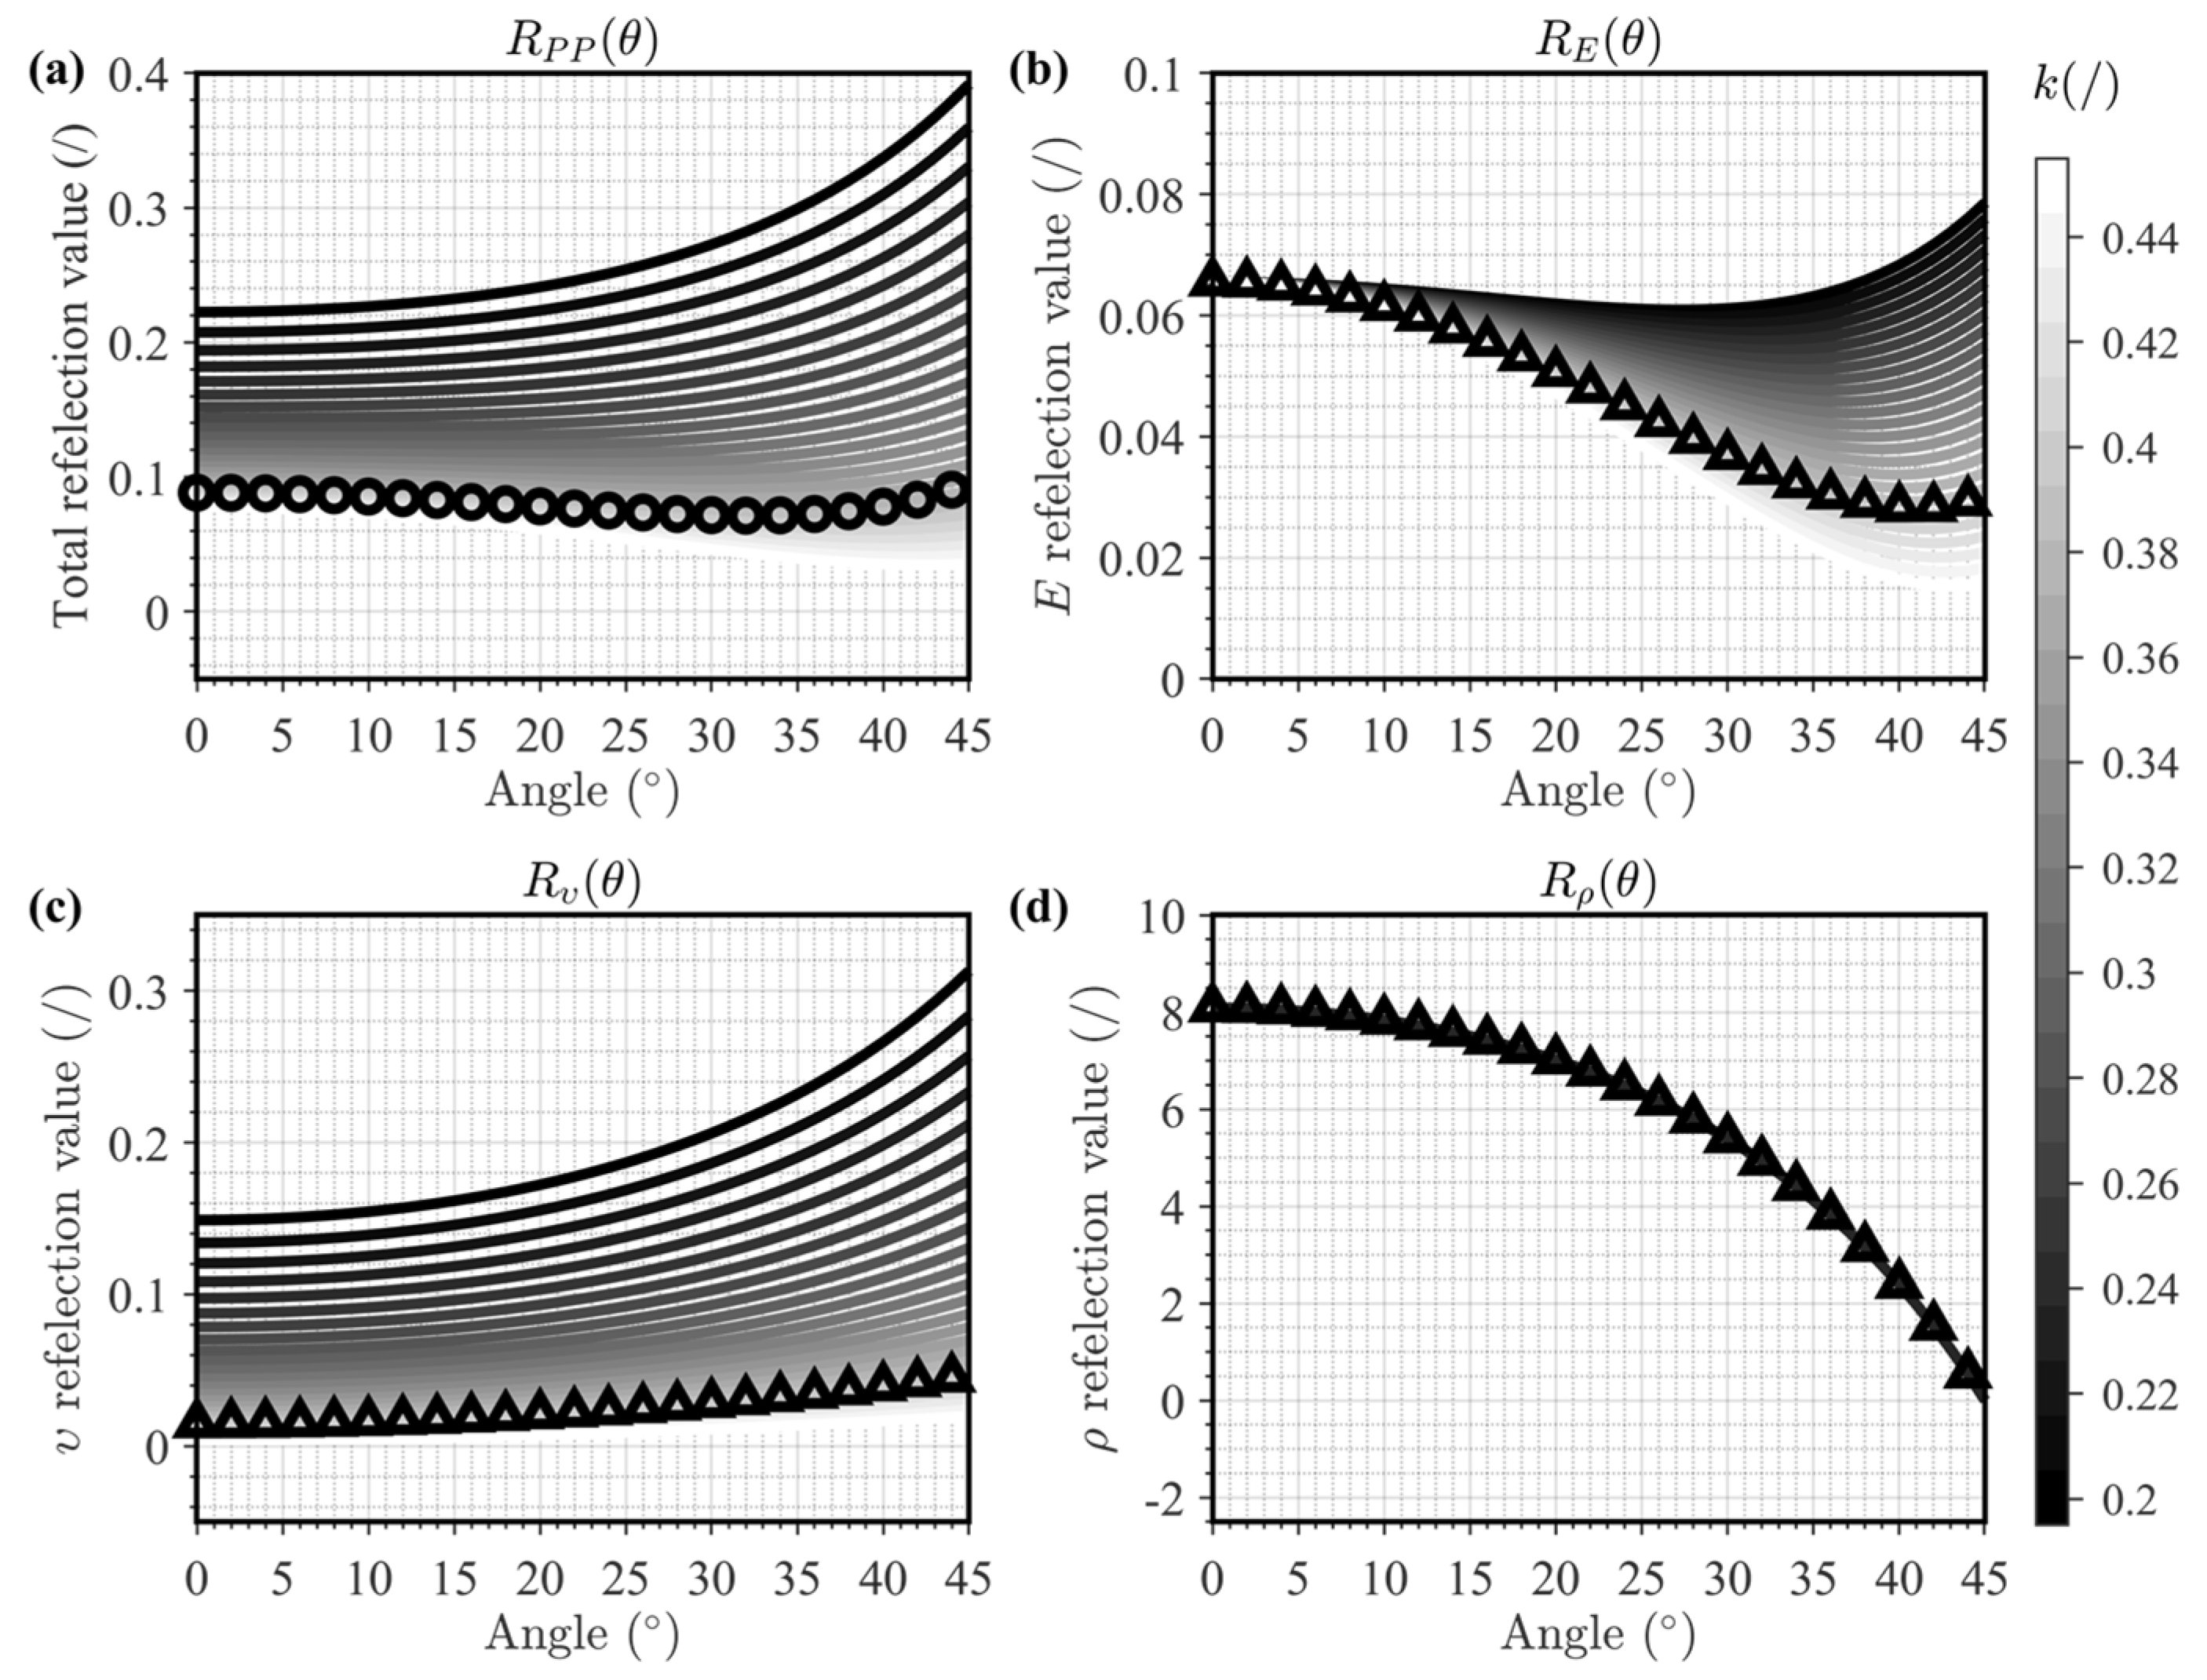
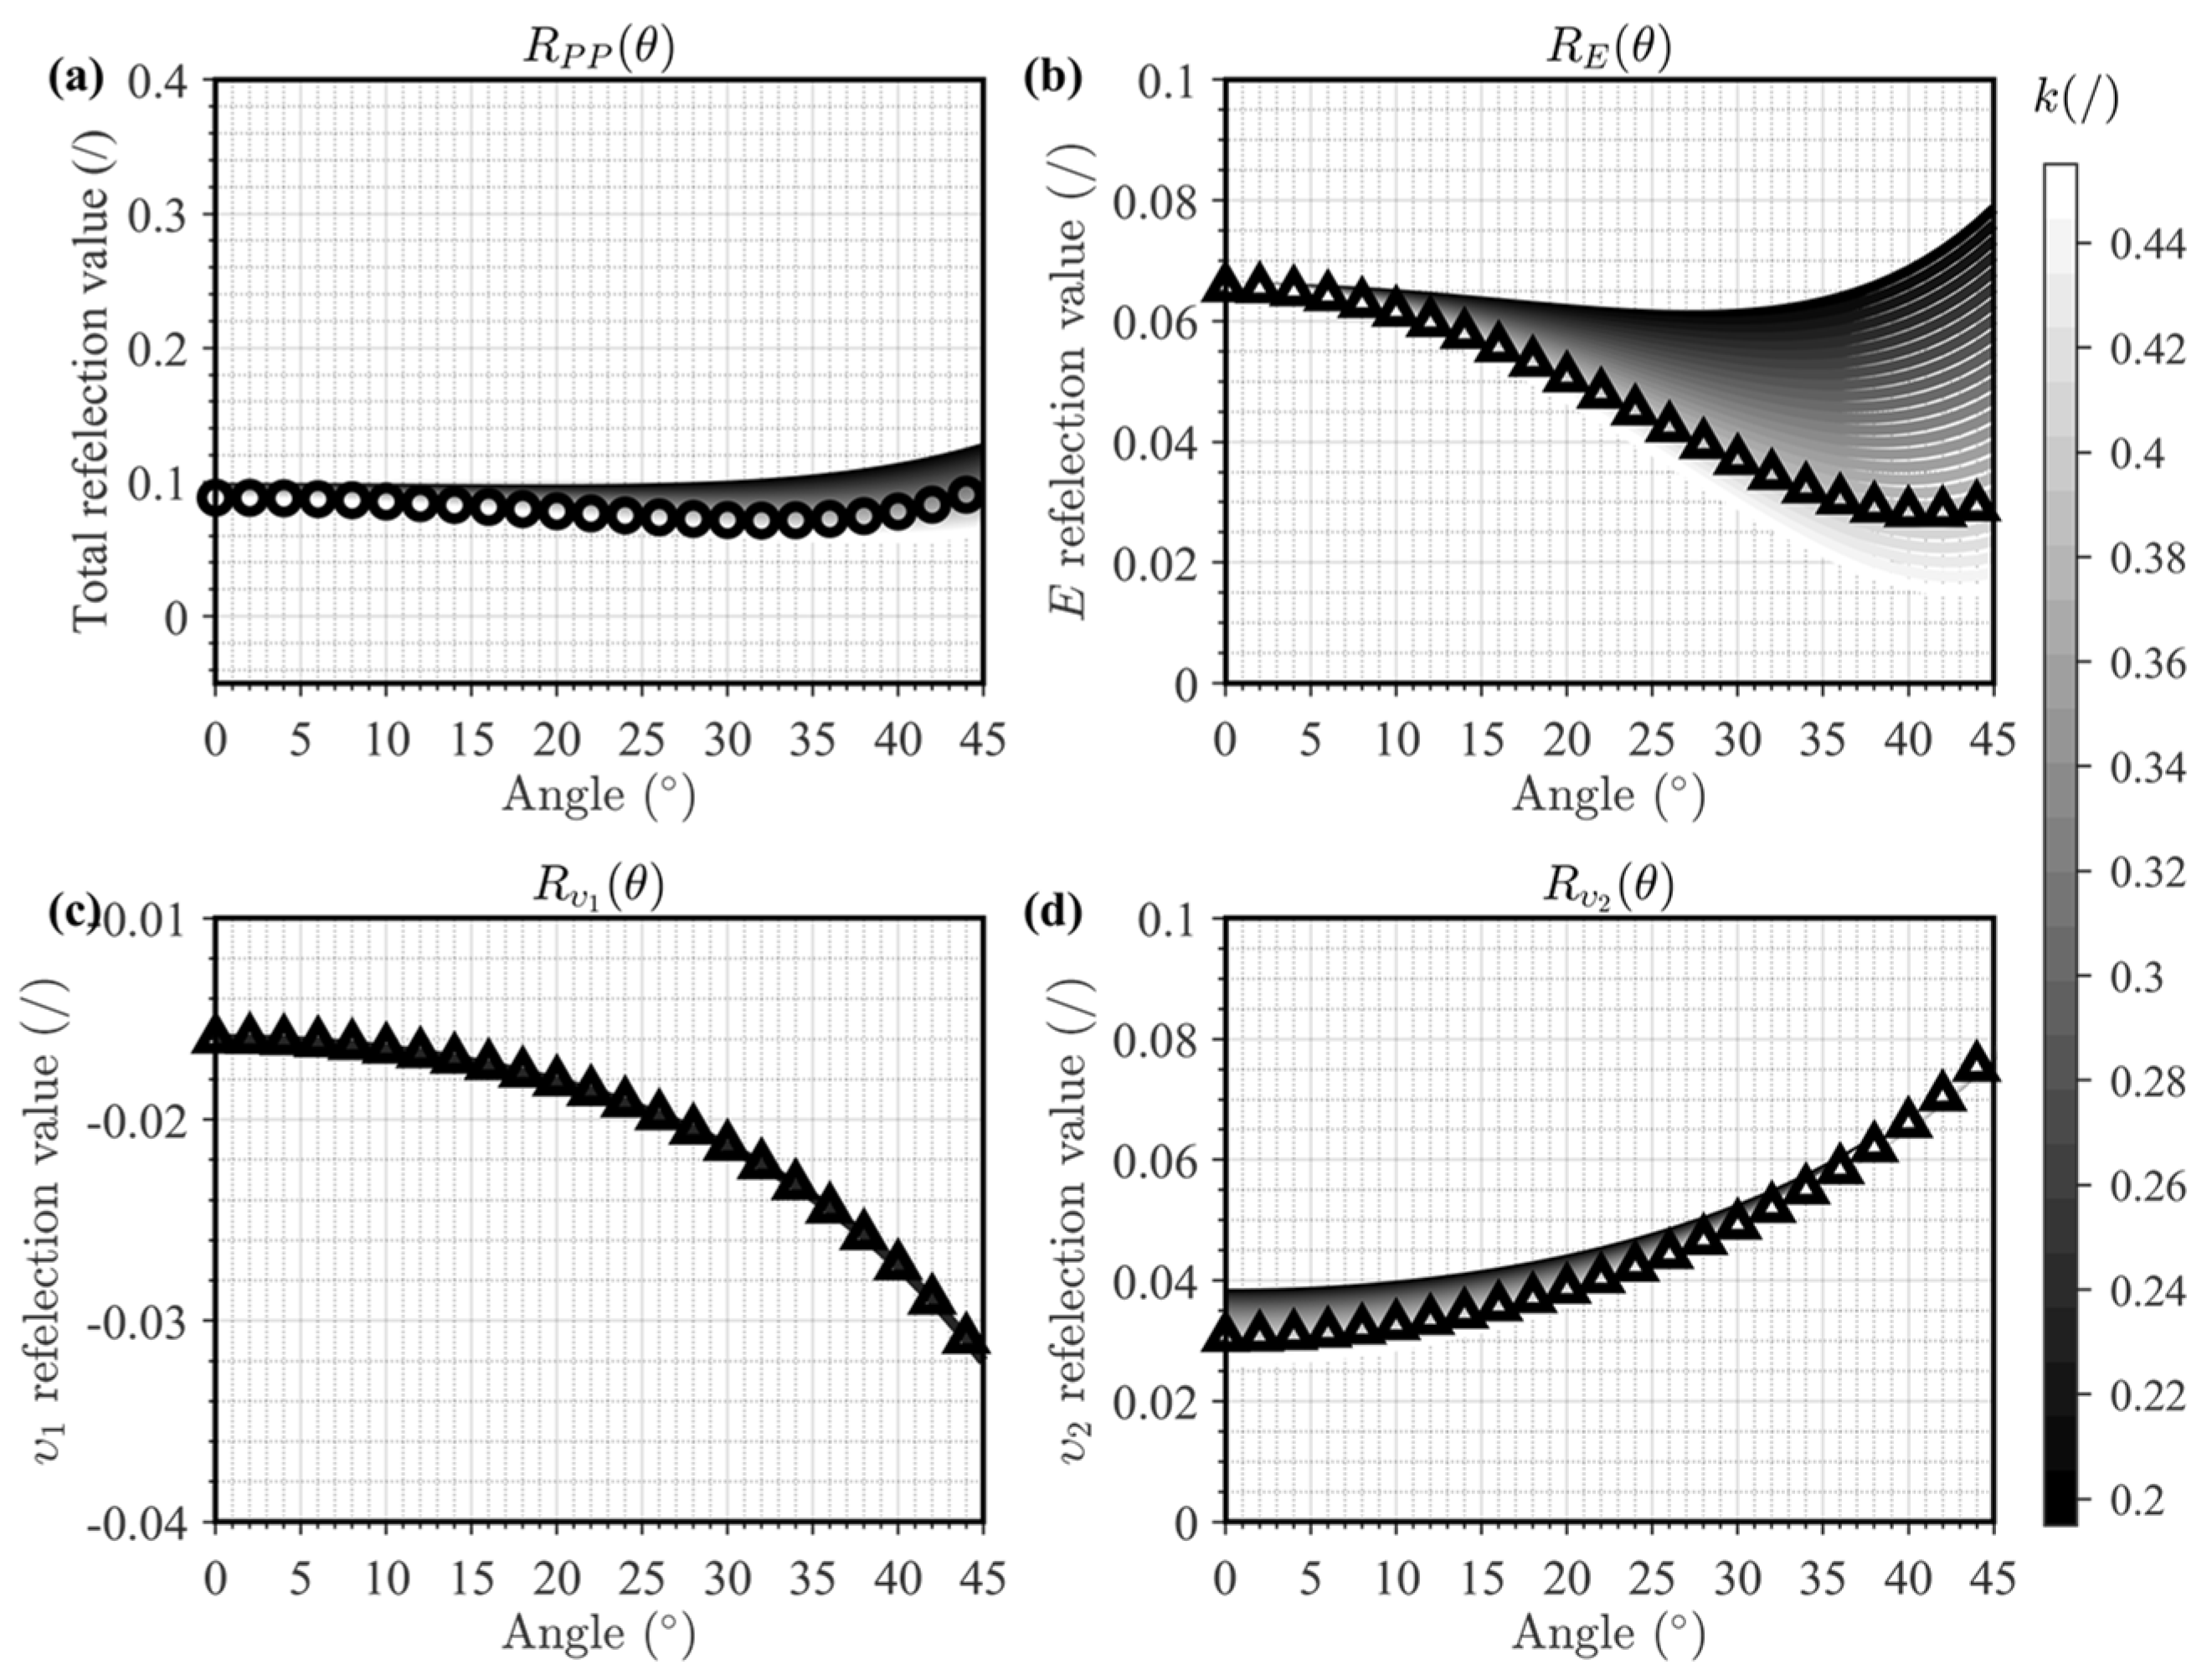
Figure 1. Analysis of parameterization for Aki–Richards’s AVO approximation, where (a) shows the PP-wave reflection coefficient (solid line) derived from Equation (1) with different k for a two-layer model given by Table 1, in which the circle markers derived from the exact Zoeppritz equation; and the angle-weighted reflectivities of (b) P-wave velocity, (c) S-wave velocity, and (d) density, resulting from Equations (A2)–(A4) with different values of k , respectively, in which the triangle markers indicate the results using the exact k value.
Jmse 13 00948 g001
Figure 2. Analysis of parameterization for the YPD–AVO approximation, where (a) shows the PP-wave reflection coefficient (solid line) derived from Equation (1) with different k for two-layer model given by Table 1, in which the circle markers derived from the exact Zoeppritz equation; and the angle-weighted reflectivities of (b) Young’s modulus, (c) Poisson’s ratio, and (d) density, resulting from Equations (2)–(4) with different values of k , respectively, in which the triangle markers indicate the results using the exact k value.
Jmse 13 00948 g002
Figure 3. Analysis of novel reparameterization for the AVO approximation proposed in this paper, where (a) shows the PP-wave reflection coefficient (solid line) derived from Equation (7) with different k for two-layer model given by Table 1, in which the circle markers derived from the exact Zoeppritz equation; and the angle-weighted reflectivities of (b) Young’s modulus, (c) υ 1 , and (d) υ 2 , resulting from Equations (8)–(10) with different values of k , respectively, in which the triangle markers indicate the results using the exact k value.
Jmse 13 00948 g003
Figure 4. Well log curves of (a) VP, (b) VS, (c) k, (d) ρ, (e) well-side synthetic seismic gather, and (f) real seismic gather, in which the yellow zone refers to target layer, and the blue zone refers to high impedance carbonate layer.
Jmse 13 00948 g004
Figure 5. Fitting results of probability density distribution of the well log data, in which the blue solid lines are the fitting results of Gaussian distribution, and the red solid lines are the fitting results of Cauchy distribution.
Jmse 13 00948 g005aJmse 13 00948 g005b
Figure 6. Comparison of relative inversion results at well location between the methods using the conventional parameterization for the YPD–AVO approximation (blue lines) and the novel reparameterization for the AVO approximation proposed in this paper (red lines), in which the black solid lines refer to the inverted result.
Jmse 13 00948 g006
Figure 7. Comparison of inverted results at well location between the methods using the conventional parameterization for the YPD–AVO approximation (blue lines) and the novel reparameterization for the AVO approximation proposed in this paper (red lines), in which the black solid lines refer to the inverted result.
Jmse 13 00948 g007
Figure 8. Analysis for relative inversion results at well location obtained by the conventional parameterization for the YPD–AVO approximation and the novel reparameterization for the AVO approximation proposed in this paper, respectively.
Jmse 13 00948 g008
Figure 9. Comparison of inverted results at well location, where (a) shows the true well log data; (b) shows the inverted results obtained by the conventional parameterization for the YPD–AVO approximation; and (c) shows the results obtained by the novel reparameterization for the AVO approximation. Note that the different colored surfaces denote the trend fitting surfaces of true well log values and inverted results at well location using the different AVO approximations.
Jmse 13 00948 g009
Figure 10. Probability distribution density (PDF) map of true and inverted parameters using different parameterizations for the AVO approximation, where the first line shows the marginal 1D PDF of Young’s modulus (a), Poisson’s ratio (b), and density (c), respectively, for true values (black line), the YPD–AVO approximation (blue line), and the novel four-term AVO approximation (red line), the second line shows the joint PDF of Young’s modulus and Poisson’s ratio for true values (d), the YPD–AVO approximation (e), and the novel four-term AVO approximation (f), and the third line shows the joint PDF of Poisson’s ratio and density for true values (g), the YPD–AVO approximation, (h) and the novel four-term AVO approximation (i).
Jmse 13 00948 g010
Figure 11. Stacked seismic section for the 2-D case.
Jmse 13 00948 g011
Figure 12. Inverted sections of Young’s modulus (a) and Poisson’s ratio (b) for the 2D case, where the dash lines refer to the logging data of Young’s modulus and Poisson’s ratio.
Jmse 13 00948 g012
Figure 14. The geo-bodies extracted from inversion results, in which the colored contour refers to target horizon, and the purple lines are the well path.
Jmse 13 00948 g014
Table 1. Elastic parameters used in the analysis of the novel reparameterization for the AVO approximation.
LayerVP (m/s)VS (m/s)ρ (g/cm3)E (GPa) υ (−) υ 1 (−) υ 2 (−) k (−)
131061976249422.590.160.841.470.41
235902170260629.750.210.791.720.37
RC (%)14.59.44.427.427.06.115.710.3
Disclaimer/Publisher’s Note: The statements, opinions and data contained in all publications are solely those of the individual author(s) and contributor(s) and not of MDPI and/or the editor(s). MDPI and/or the editor(s) disclaim responsibility for any injury to people or property resulting from any ideas, methods, instructions or products referred to in the content.

