1. Introduction
Maritime transportation plays a vital role in the development of global trade and economic growth. However, it is also a remarkable contributor to atmospheric pollution [
1]. Approximately 90% of the global trade volume is carried by ship, leading to high volumes of exhaust emissions, which have negative impacts [
2]. The Second International Maritime Organization (IMO) Greenhouse Gas study [
3] suggests that shipping greenhouse emissions accounted for approximately 3.3% of global emissions, with projections indicating a continued rise if mitigation strategies are not intensified. In the IMO GHG study, carbon dioxide was the highest emitted greenhouse gas in terms of quantity and global warming potential. A ship’s engine combustion emits 450 different air pollutants [
4], but the key ship sources of air pollutants are greenhouse gases, carbon monoxide, NO
x, SO
x, and particulate matter [
5,
6]. Around 70% of these vessel emissions are discharged within a radius of 400 km from the coastline, and the emissions travel further through the atmosphere as ships maneuver near densely inhabited coastal areas [
7]. As a result, around 230 million people living in the top 100 world ports are directly impacted by marine pollution [
8].
To address this, international bodies such as the IMO have set increasingly ambitious targets. The IMO, through its legislation, the International Convention on the Prevention of Pollution from Ships (MARPOL) Annex VI, has regulations to mitigate maritime pollution. Since 2018, the IMO has actively analyzed shipping emissions to establish long-term strategies to control marine pollution, including the IMO 2020 sulfur limit [
9]. In the NO
x ECAs, tiered emission limits are imposed based on the ship’s engine construction date and type. Carbon dioxide is one of the largest contributors to global warming; hence the revised 2023 IMO GHG strategy to minimize shipping carbon intensity by up to 40% by 2030 and 70% by 2050 compared to 2008 [
9]. IMO’s ambitious strategy to achieve net-zero GHG emissions in international shipping by around 2050 has encouraged the formulation of policies such as the use of alternative green fuels and the establishment of green shipping corridors as pilots for systemic change. These goals align with broader global frameworks like the Paris Agreement, which emphasizes rapid decarbonization across all sectors. The Paris Agreement aims to maintain global average temperatures to below 2 °C and limit its increase to 1.5 °C above pre-industrial levels. In the agreement, all parties were required to report the national GHG inventory and information on mitigation policies and support framework to the United Nations [
10]. According to the IPCC [
11], global greenhouse gas emissions need to be cut by at least 40% below 1990 levels by 2030, to net-zero emissions by 2050 and move towards negative emissions thereafter to achieve the Paris Agreement goals.
Aside from the IMO pursuing stricter regulations to cut GHG emissions, individual countries and regions are also striving to contribute to the decarbonization of the shipping industry. The European Union (EU) expanded its emissions trading system (ETS) to include the maritime sector in 2024, requiring vessels over 5000 GT calling ports within the European Economic Area (EEA) to purchase EU allowances for GHG monitoring in line with the EU Monitoring, Reporting and Verification (EU MRV) regulation [
12]. Ships that do not comply with this regulation are subject to pecuniary penalties and may be denied entry into ports within the EEA territory. Further, the United States enacted the Inflation Reduction Act (IRA) in 2022, which has provisions for direct support of electrification to reduce port emissions and the hydrogen tax incentive that aims to significantly contribute to making the ammonia supply chain greener [
12]. China continues to be a global leader in designing and building ammonia-ready vessels, in addition to implementing its short-term measures to decrease vessel GHG emissions [
12]. All these milestones indicate the motivation of nations to achieve low-carbon transformation in their shipping operations. Similarly, South Korea has also made great strides in developing maritime carbon reduction goals to achieve carbon neutrality by 2050.
Shipping forms the backbone of South Korea’s economy, as nearly all of its imports and exports, totaling 99.7%, rely on maritime transport [
12]. Internationally, South Korea is a prominent player in the maritime industry, ranking seventh globally in vessel ownership, fourth in container port traffic, and first in shipbuilding [
2]. Being a maritime nation and a global leader in shipbuilding, South Korea is directly impacted by the maritime pollution issue, thus actively responding to these environmental challenges. Studies estimate South Korea’s GHG equivalent emissions to be around 701.3 million tons of CO
2-equivalent, with the transportation sector, including the shipping industry, accounting for approximately 14% of the total emissions [
10]. The Ministry of Oceans and Fisheries in Korea has reported that Korea is responsible for less than 1% of national emissions; however, the estimations do not cover the bulk of emissions arising from international emissions. As a result, it fails to give an accurate depiction of the entire shipping industry’s pollution potential since GHG emissions from international shipping are intensive [
10]. The Korean government launched multiple initiatives, such as the “Air Quality Management Basic Plan”, to cut maritime emissions and protect people from harmful air pollutants. In 2019, the Ministry of Oceans and Fisheries [
13] introduced VSR programs at key ports of Korea (Busan/Incheon/Ulsan/Yeosu–Gwangyang), requiring vessels to reduce speeds within designated zones to lower exhaust gases. In 2020, Korea announced its goal to achieve carbon neutrality in domestic shipping by 2050. Following the carbon neutrality declaration, the Ministry of Oceans and Fisheries (MOF), which oversees the shipping sector, introduced a decarbonization plan for domestic shipping and fisheries [
13]. The government passed the Eco-Friendly Ship Act which establishes a basis for pushing the manufacture and distribution of eco-friendly ships that use green fuels. Based on this act, in 2021, the Ministry of Ocean and Fisheries announced the Greenship-K Promotion Strategy with the aim to produce low-CO
2 vessels and incentivize the use of alternative fuels to create eco–friendly ships [
13]. On an international scale, South Korea is taking part in green corridor development to accelerate shipping decarbonization. During COP27, Korea announced an intent to explore the feasibility of creating the Busan–Seattle/Tacoma green corridor between Busan port and Seattle/Tacoma port [
14]. Other policy recommendations include setting the zero-emissions “At Berth” policy by 2030 to mandate the use of shore power in Korean ports to reduce harmful emissions.
The Natural Resources Defense Council [
15] reports that numerous research articles have studied and proven the adverse impacts of shipping emissions on global climate and the environment. Additionally, along with causing poor air quality [
16] and climate change, plenty of studies have related these pollutants to severe health impacts [
17,
18]. Researchers have focused on preparing ship emission inventories to evaluate the impacts of pollutants on air quality [
19,
20]. According to [
21], studying exhaust gas characteristics is fundamental to guiding the implementation of sustainable policies. To support maritime emission reduction strategies, numerous studies have developed ship emission estimation models, referring to the top-down and bottom-up approaches in the guidelines provided by the Inter-Governmental Panel on Climate Change [
11]. The top-down approach utilizes statistically analyzed marine fuel consumption data and fuel-related emission factors to estimate emissions [
7,
22], but the results are inaccurate since it does not take into account the vessel’s operating conditions. The method would be ideal since fuel consumption and emissions discharged from the engine combustion have a positive correlation. However, [
23] found a huge discrepancy between fuel sale statistics and the actual fuel used by the global fleet. In Korea, the Ministry of Oceans and Fisheries, the Ministry of Environment, and the Korea Maritime Institute (KMI) applied a top-down approach to estimate emissions and determine the amount of air pollutant emissions in ports, but the exhaust gas data were inaccurate [
24]. In contrast, the bottom-up method estimates emissions based on vessel activity and technical parameters such as engine specifications, speed profiles, and activity time derived from extensive maritime data such as AIS [
25]. In an attempt to differentiate the two methods, [
26] calculated the quantity of pollutants from ships. The bottom-up method was reliable for understanding emission patterns and intensity, leading to the establishment of effective green policies for air quality management [
27,
28,
29]. However, the approach could introduce uncertainties for global applications due to the diverse input parameters required, model assumptions, and data anomalies that introduce uncertainties when used in large-scale applications without validation [
30,
31,
32].
Since IMO mandated the installation of AIS receivers on passenger and merchant ships of over 300 gross tonnages (GT) on international voyages, many scholars have used AIS data to create emission assessment models for different world regions [
33]. A few authors developed the Ship Emission Inventory Model (SEIM) to evaluate the impacts of ship pollution in East Asia [
34]. Ref. [
35] estimated carbon emissions in global high seas using a proposed Geographic Emission Estimation Model (GEEM) based on geographic location. Ref. [
24] estimated emissions from ships at Busan Port, highlighting the hoteling mode and CO
2 as major contributors, but their model lacked vessel-specific temporal granularity. Ref. [
36] also conducted a study to estimate emissions from vessels operating at Yeosu-Gwangyang port in Korea using the bottom-up approach and established that CO
2 and the hoteling mode accounted for the highest emission levels. Further, the authors reported that containers and tankers together emitted the highest volume of exhaust gases. However, their estimations did not factor in the updated policies, such as the IMO 2020 sulfur cap [
9]. Refs. [
19,
37] calculated the exhaust emissions of oceangoing ships in Hong Kong and Busan Port, respectively, obtaining an emission contribution rate of different ship types. On the other hand, [
38] conducted a comparative analysis of the estimation methods of ship pollutants and proposed that data statistics and management are essential foundations for research. Such inventories provide a basis for further refining the emission estimation models and enhancing emission databases for implementing macro-emission policies.
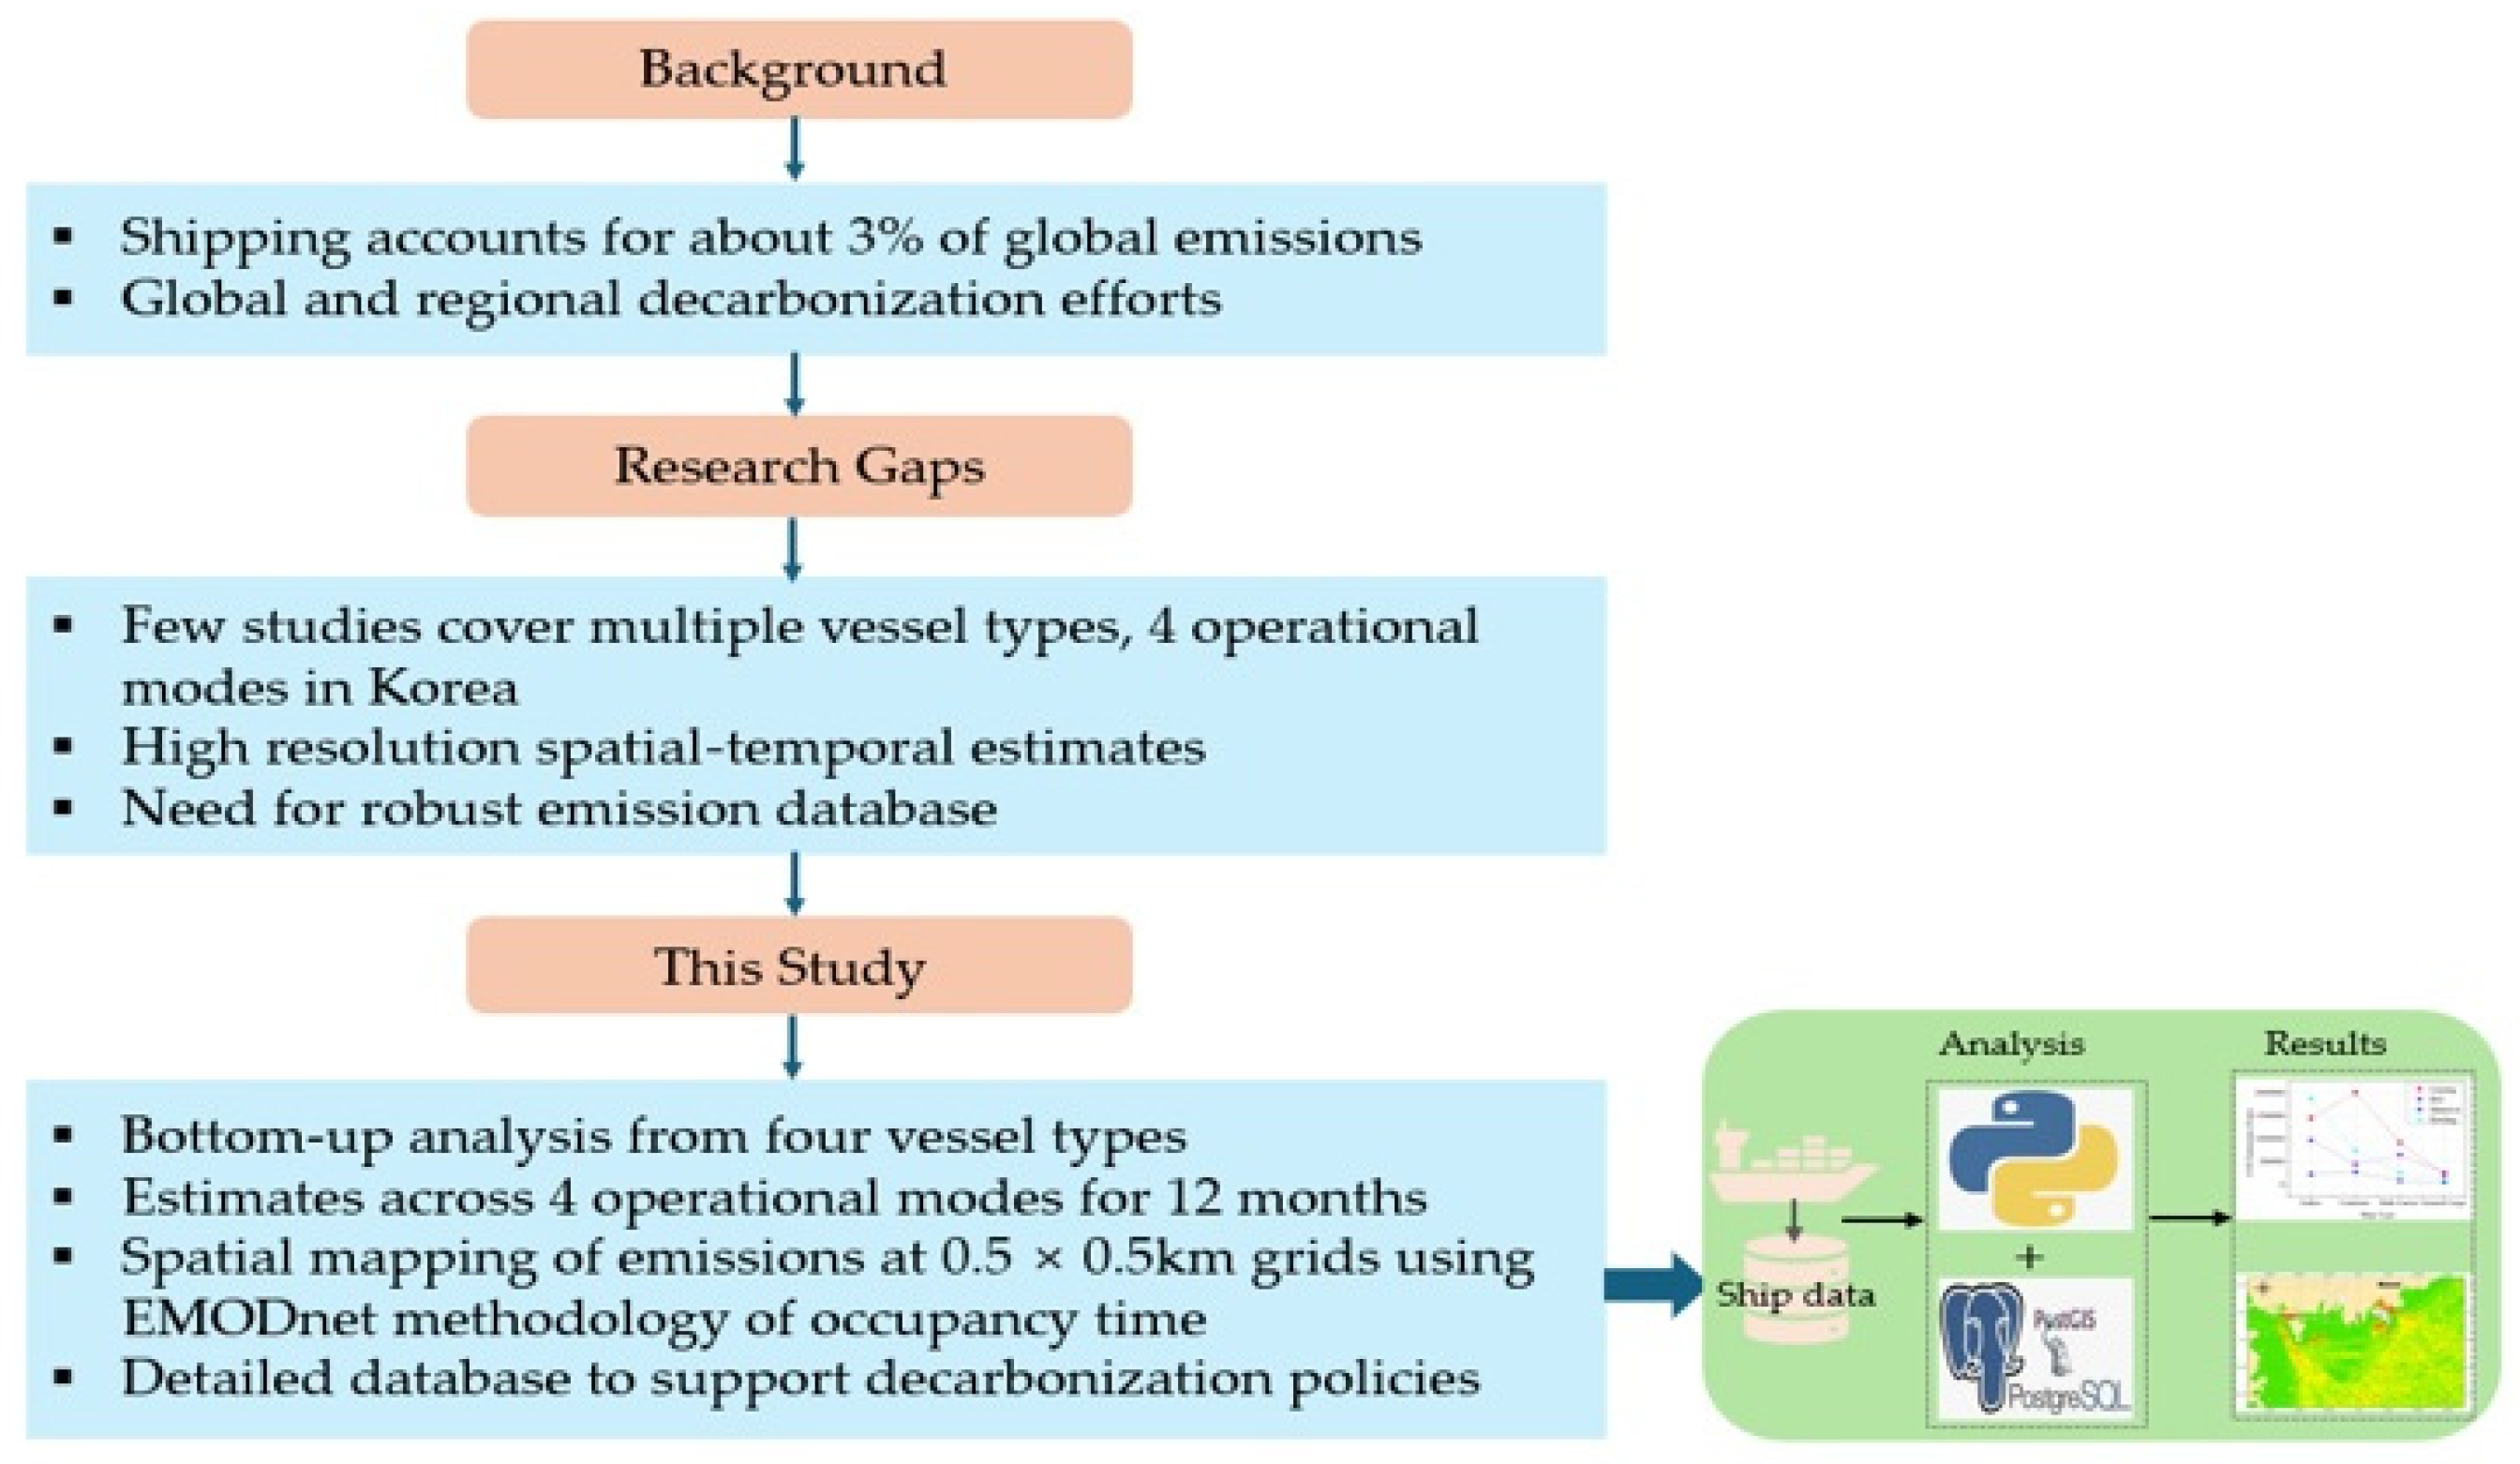
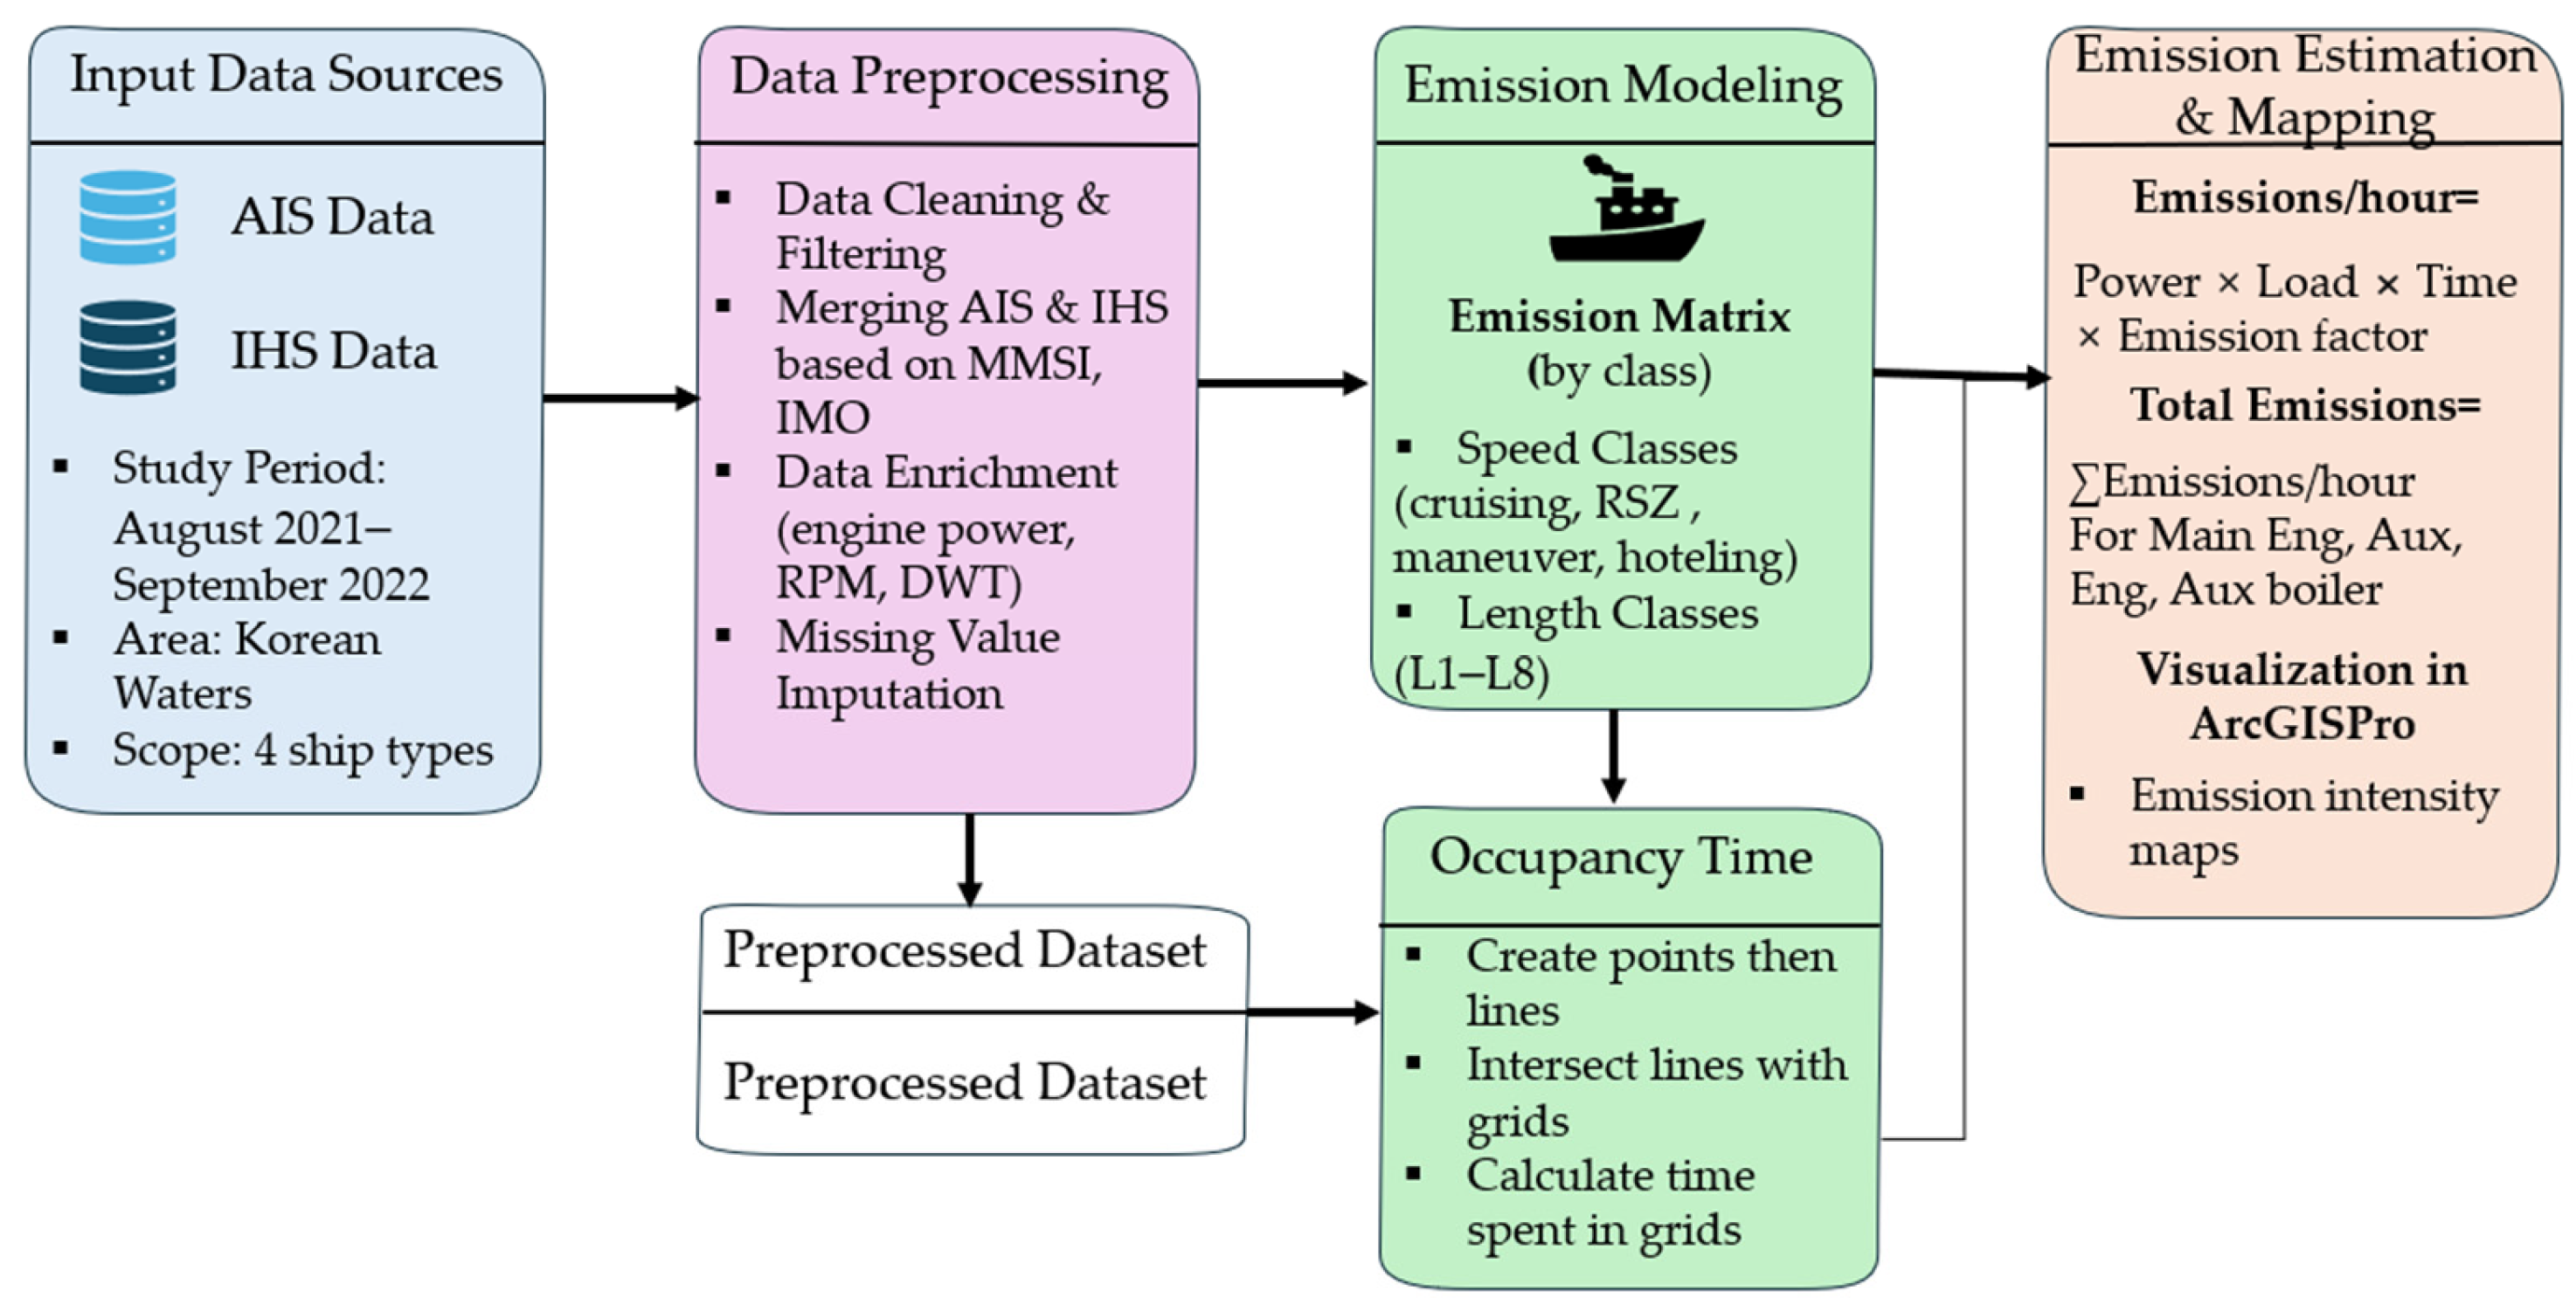
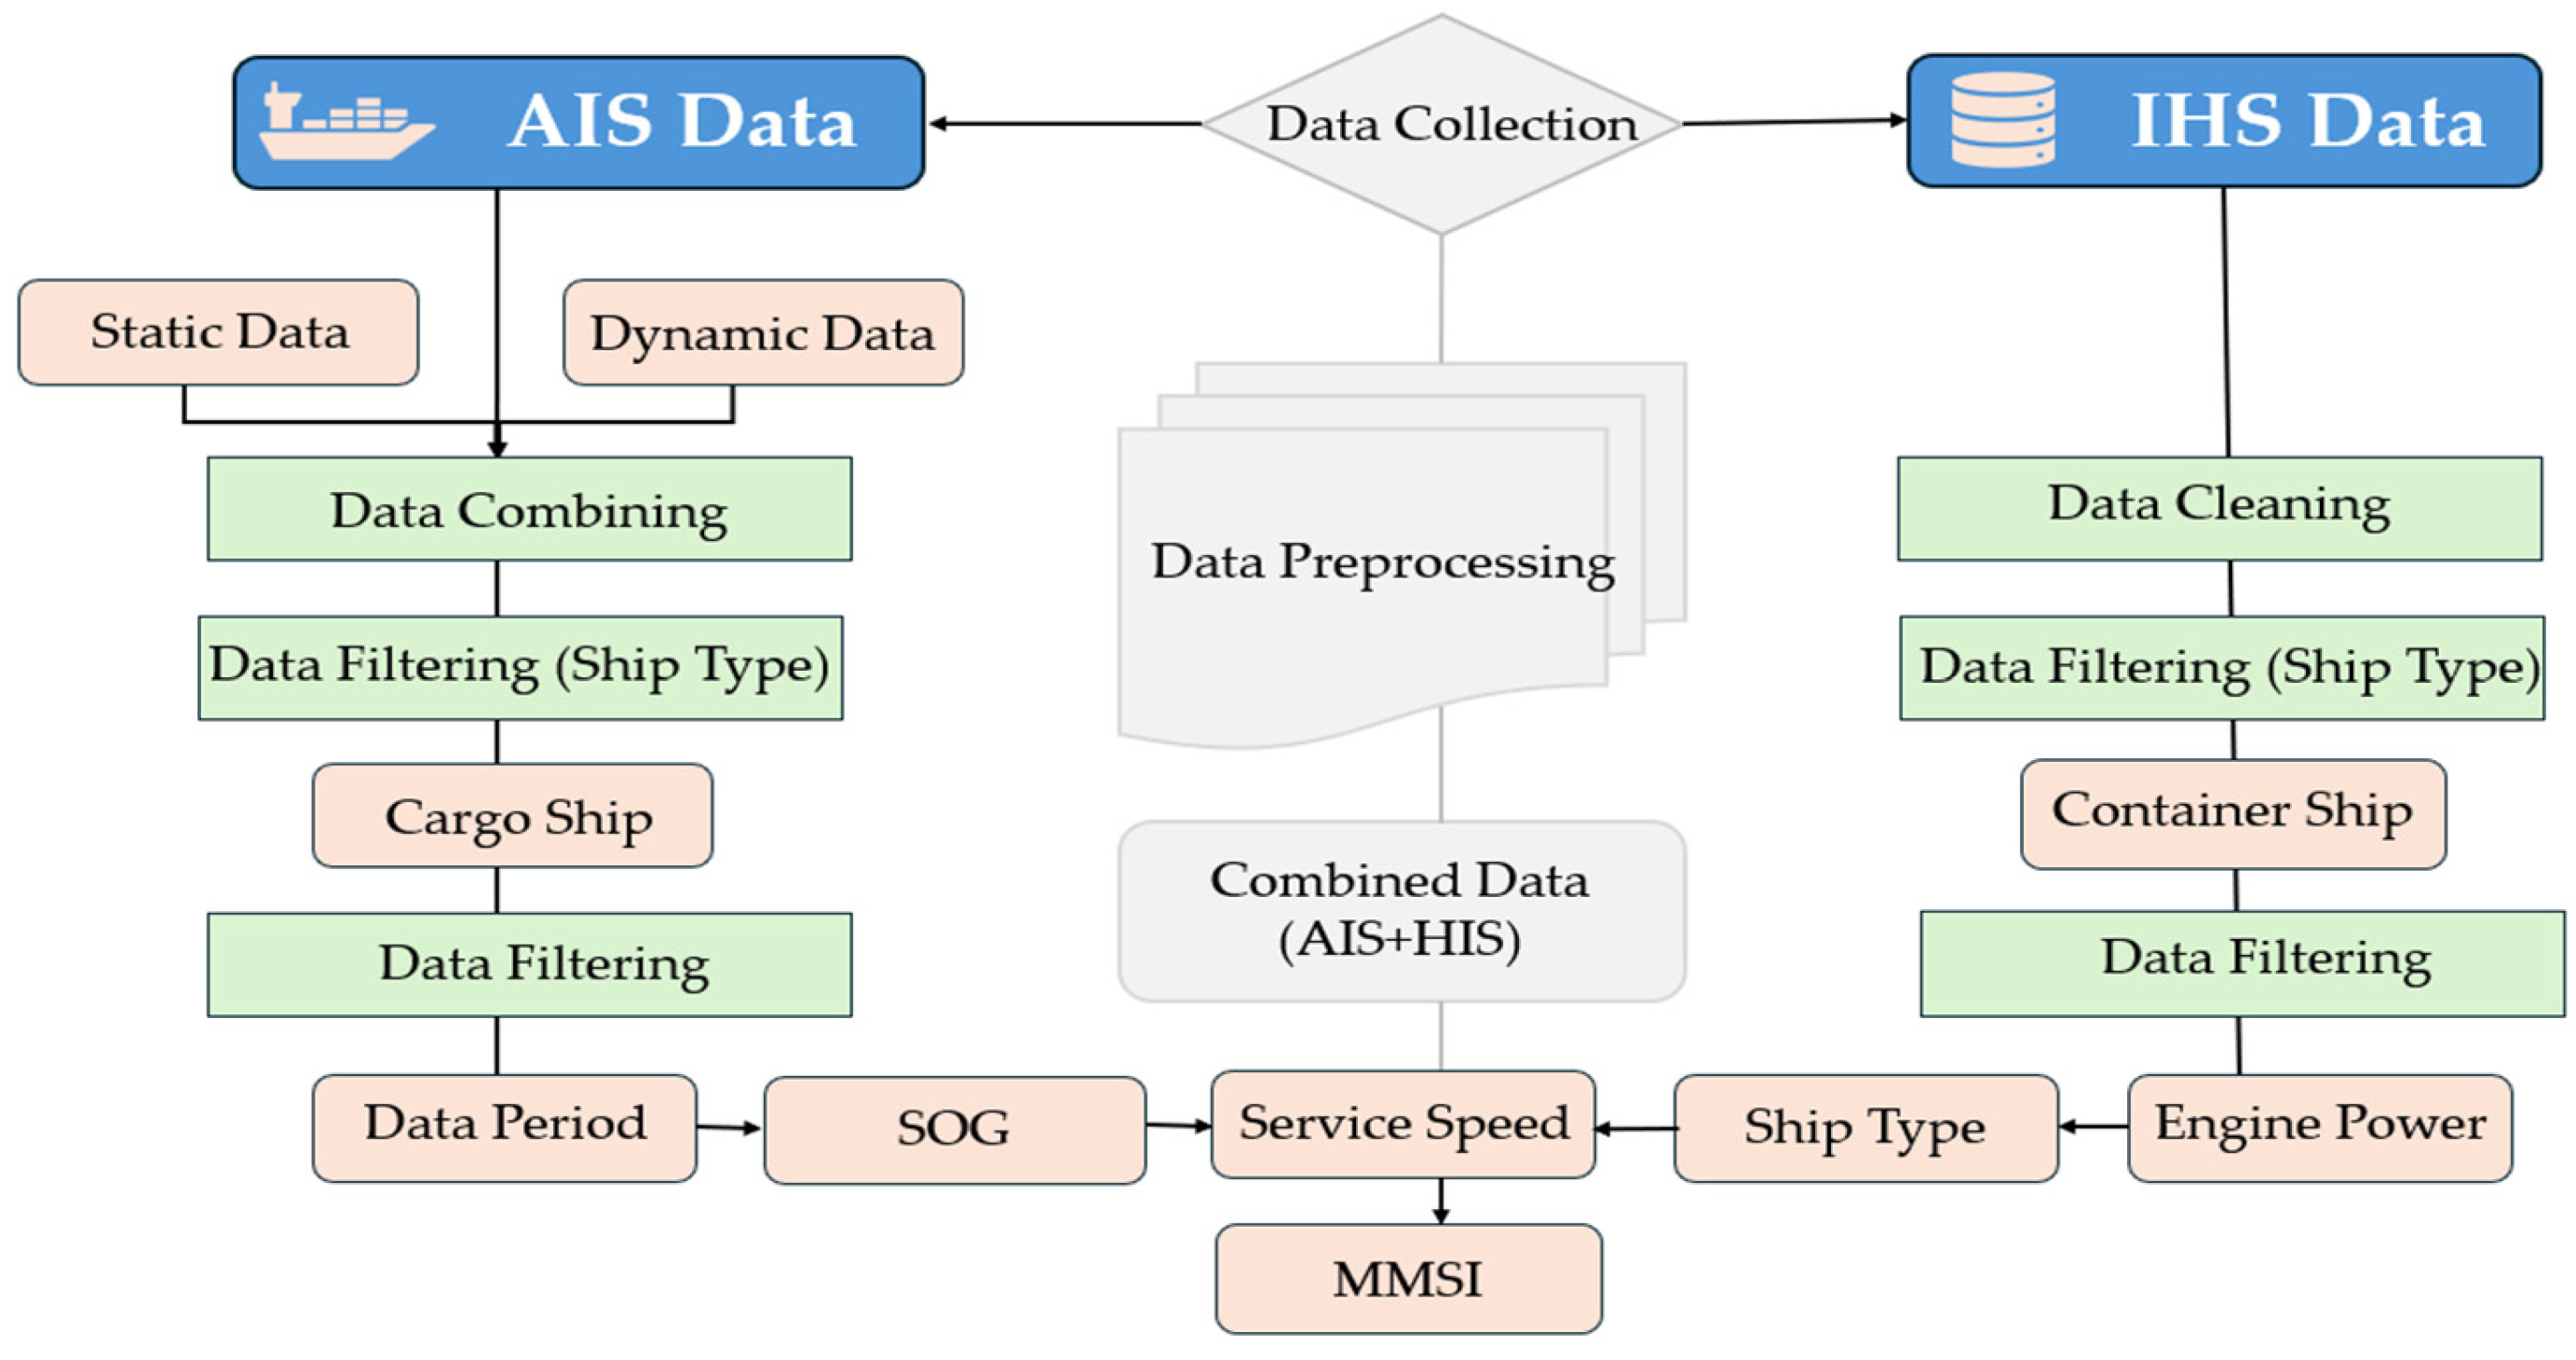
Despite these advancements, few studies have mapped emissions at grid-level resolution using spatial occupancy metrics and aggregated grid spatial emissions. This study responds to the global efforts to reduce maritime emissions and utilizes a comprehensive, data-driven emission estimation framework for vessels operating within the Republic of Korea’s coastal waters. Over a period of 12 months (September 2021–August 2022), exhaust gases of CO
2, NO
x, and SO
x were calculated for four major vessel types: tankers, container ships, bulk carriers, and general cargo vessels across four distinct operational modes, such as cruising, RSZ, maneuvering, and hoteling. This study integrates Automatic Identification System (AIS) data, IHS ship registry data, and spatial grid modeling (0.5 km × 0.5 km) to generate detailed, high-resolution maps of exhaust emissions, all visualized using ArcGIS Pro. What sets this study apart is the application of the spatial-temporal density method, derived from the EMODnet framework, enabling the estimation of vessel occupancy time within grid cells, which is then used to calculate emissions based on the US EPA’s bottom-up modeling formula. Additionally, this research contributes to the creation of a robust maritime emissions database, a resource that is increasingly critical for data-driven decision-making to promote sustainable development. The increasing global efforts to decarbonize shipping, with the IMO targeting net zero by around 2050, presents a pressing need for transparent, traceable, and high-resolution emissions data. Maritime stakeholders, including governments, port authorities, and environmental regulators, require insights into when, where, and why emissions occur, categorized per vessel type, operational mode, engine profile, and pollutant class. By combining operational data, this study provides detailed information, thereby availing opportunities for sustainable management of shipping pollution.
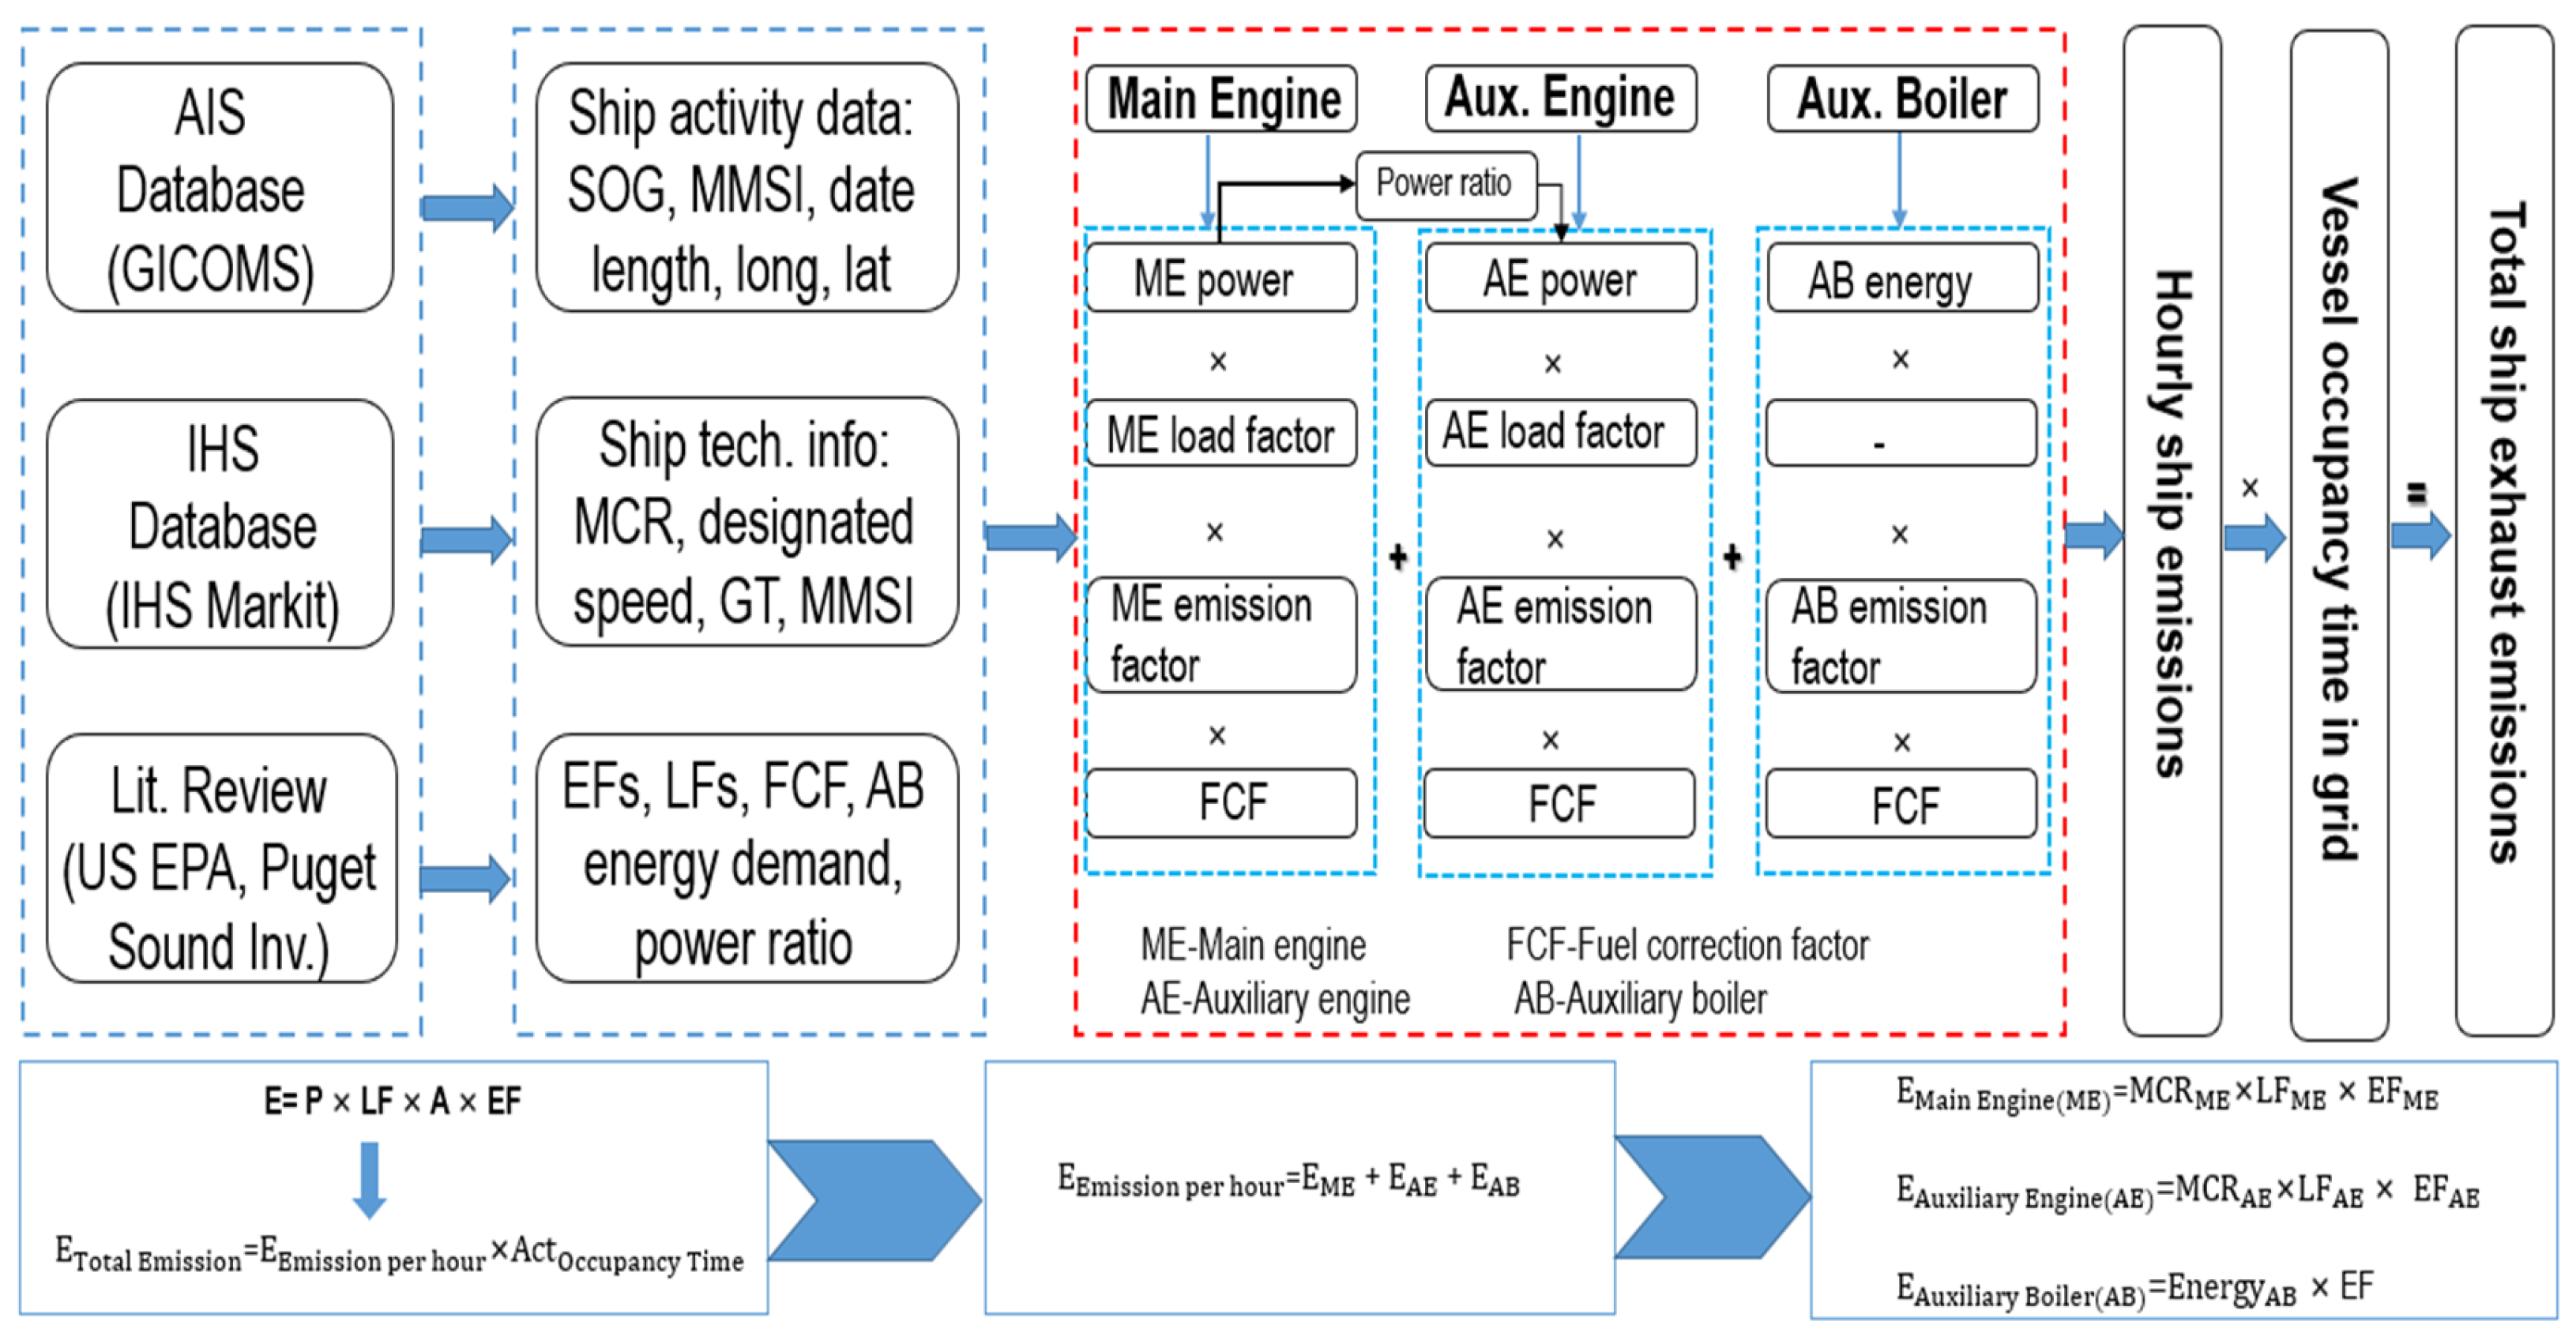
Figure 1 is an illustration of the study background, the research gaps in current research, and how this study aims to enhance the current emission databases.
The remaining sections are divided as follows: In
Section 2, details of the data preprocessing steps, emission estimation, and spatial methods are provided.
Section 3 presents the emission characterization results for different categories.
Section 4 highlights the discussions of the study results. In
Section 5, we summarize the study and describe its limitations and future research tasks.
4. Discussion
This study aligns with the global and national efforts to reduce maritime pollution by providing a data-driven emission inventory and a detailed analysis of current emissions levels using a bottom-up and spatio-temporal approach. Through the integration of AIS, IHS, and GIS technologies, vessel emissions across different ship types, operational modes, and equipment categories were quantified and mapped for Korean coastal waters, identifying key areas where compliance with international regulations can further minimize the environmental footprint of maritime activities.
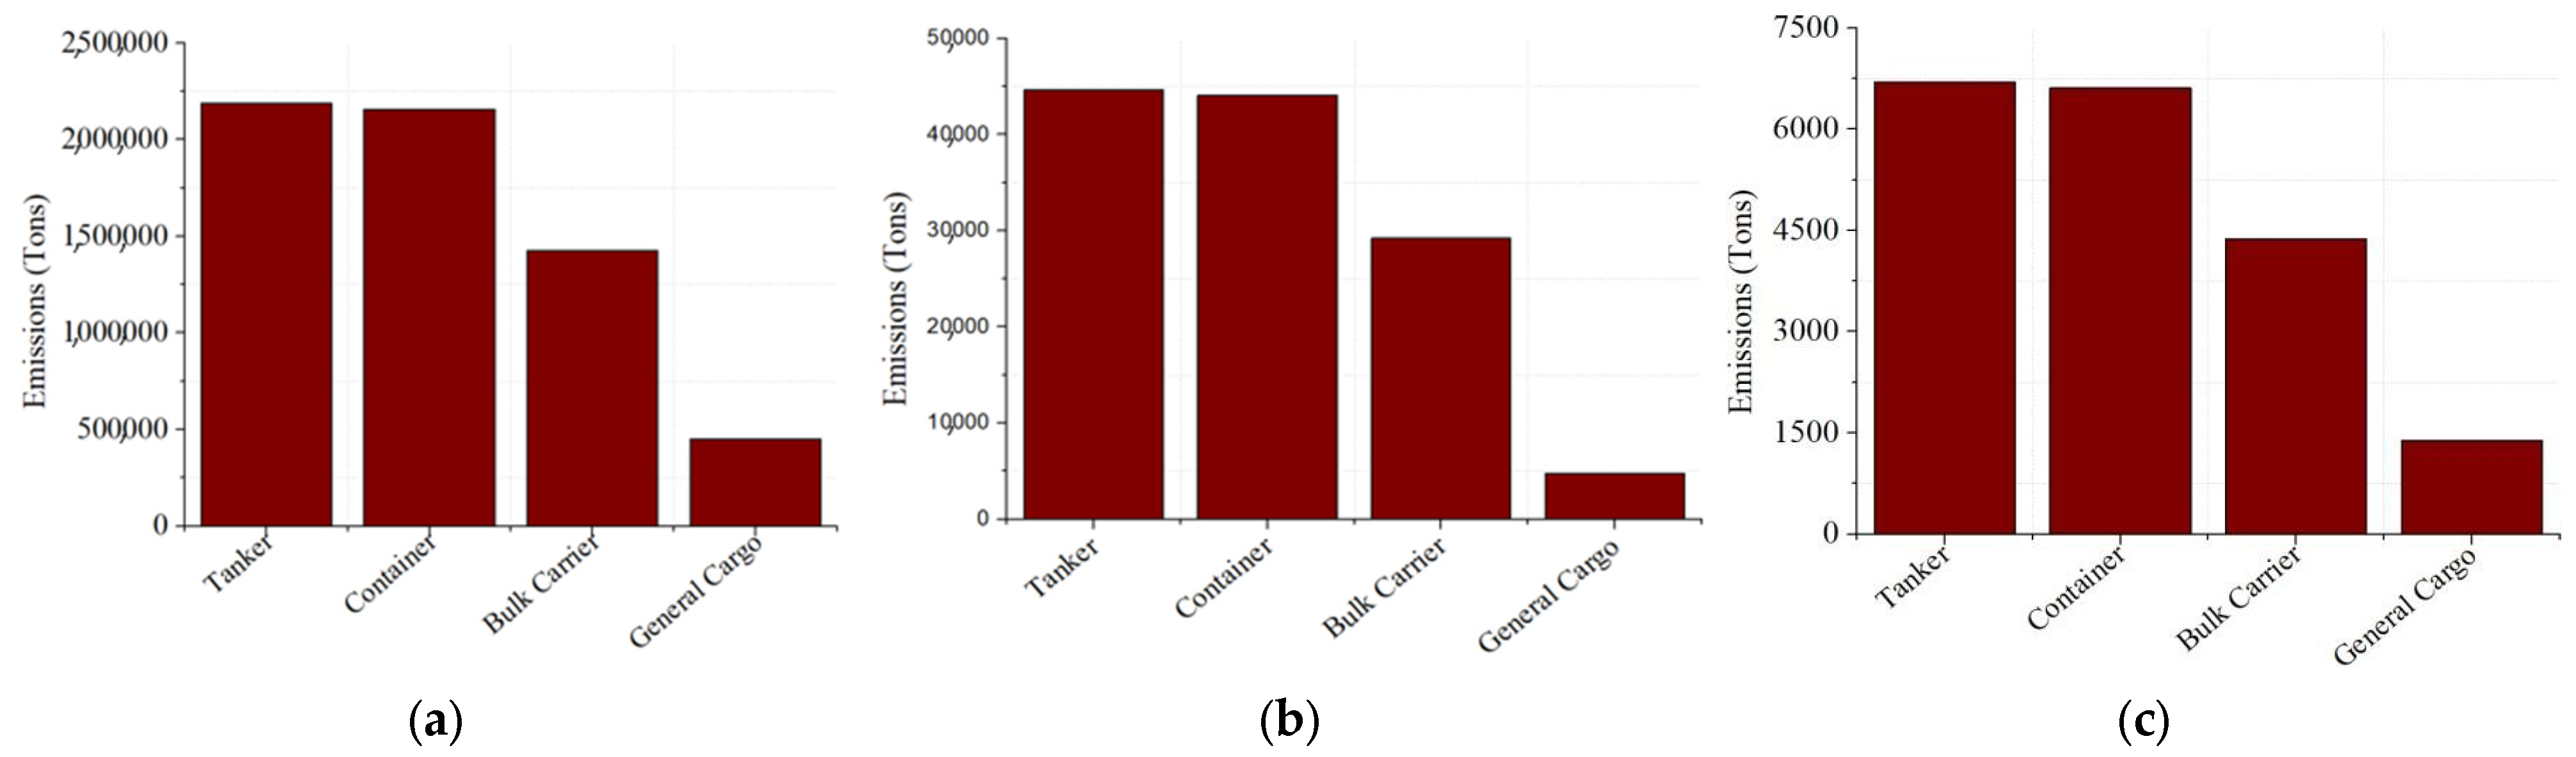
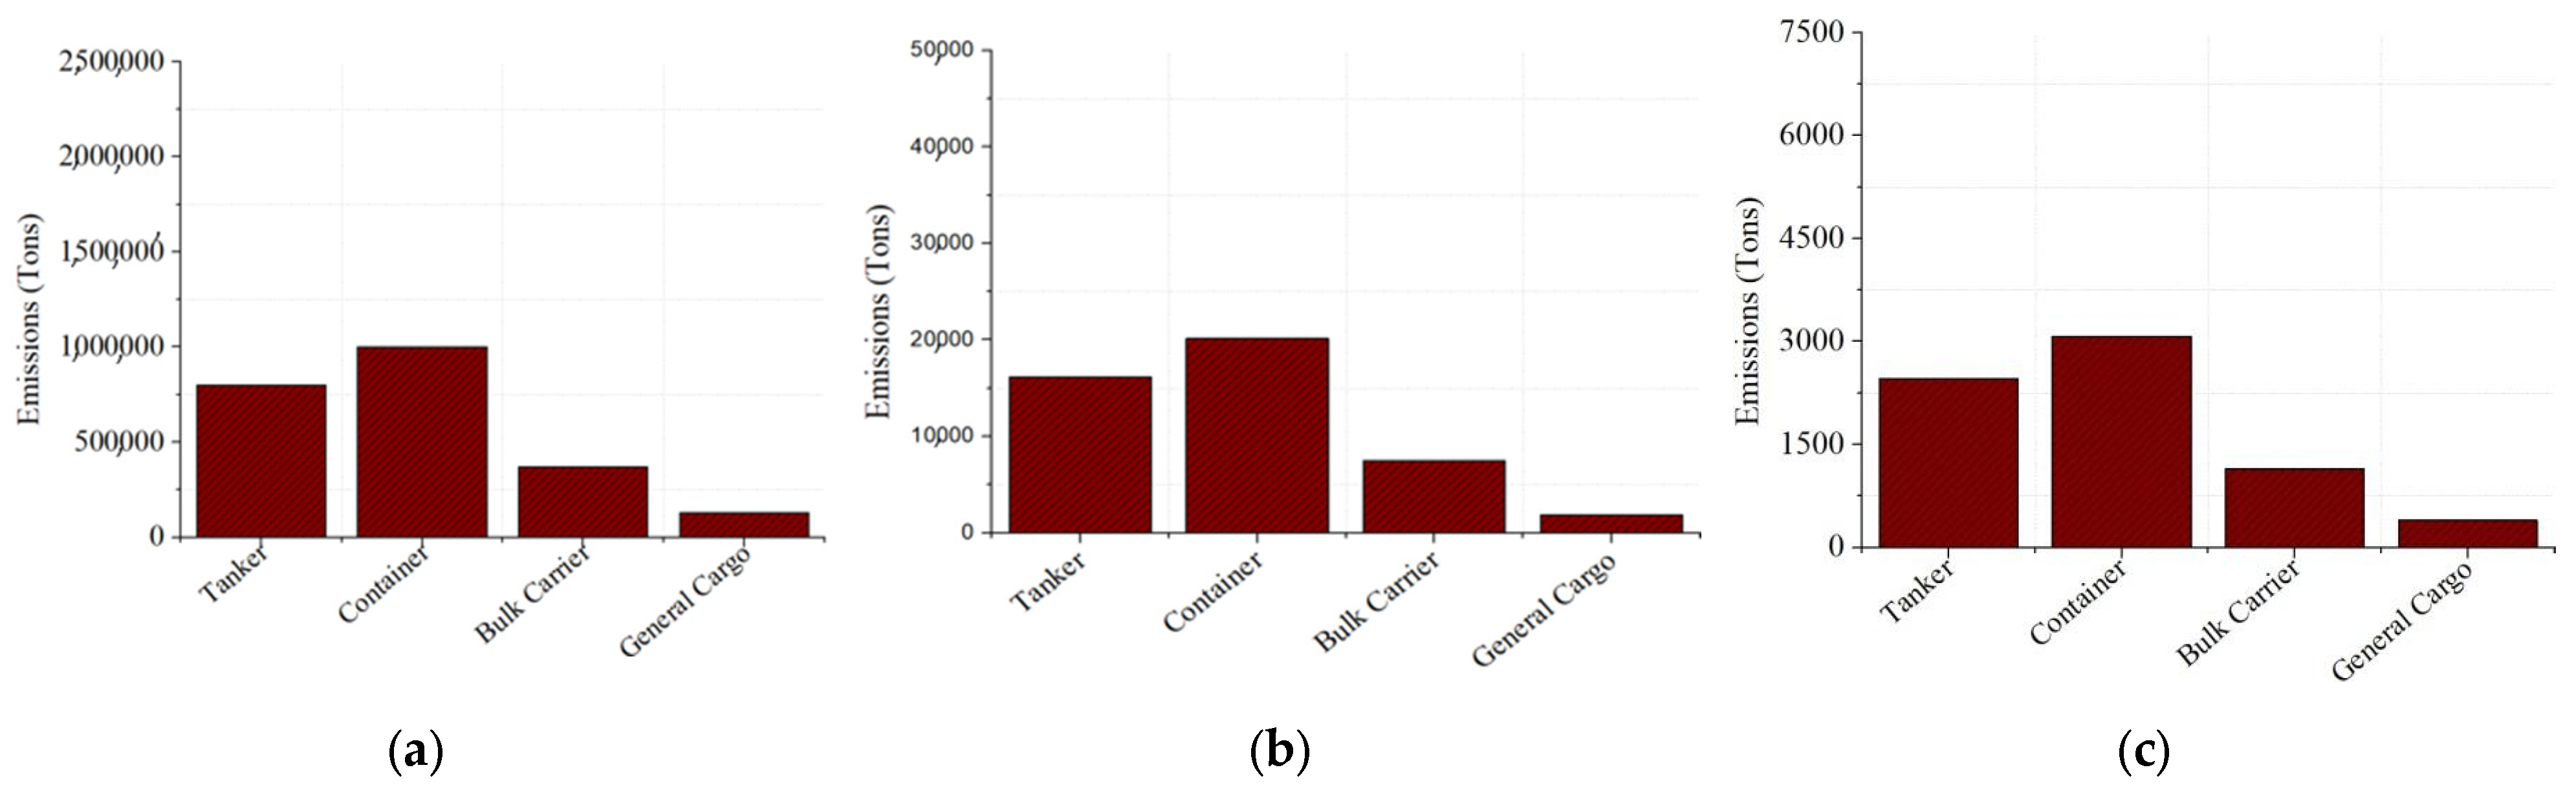
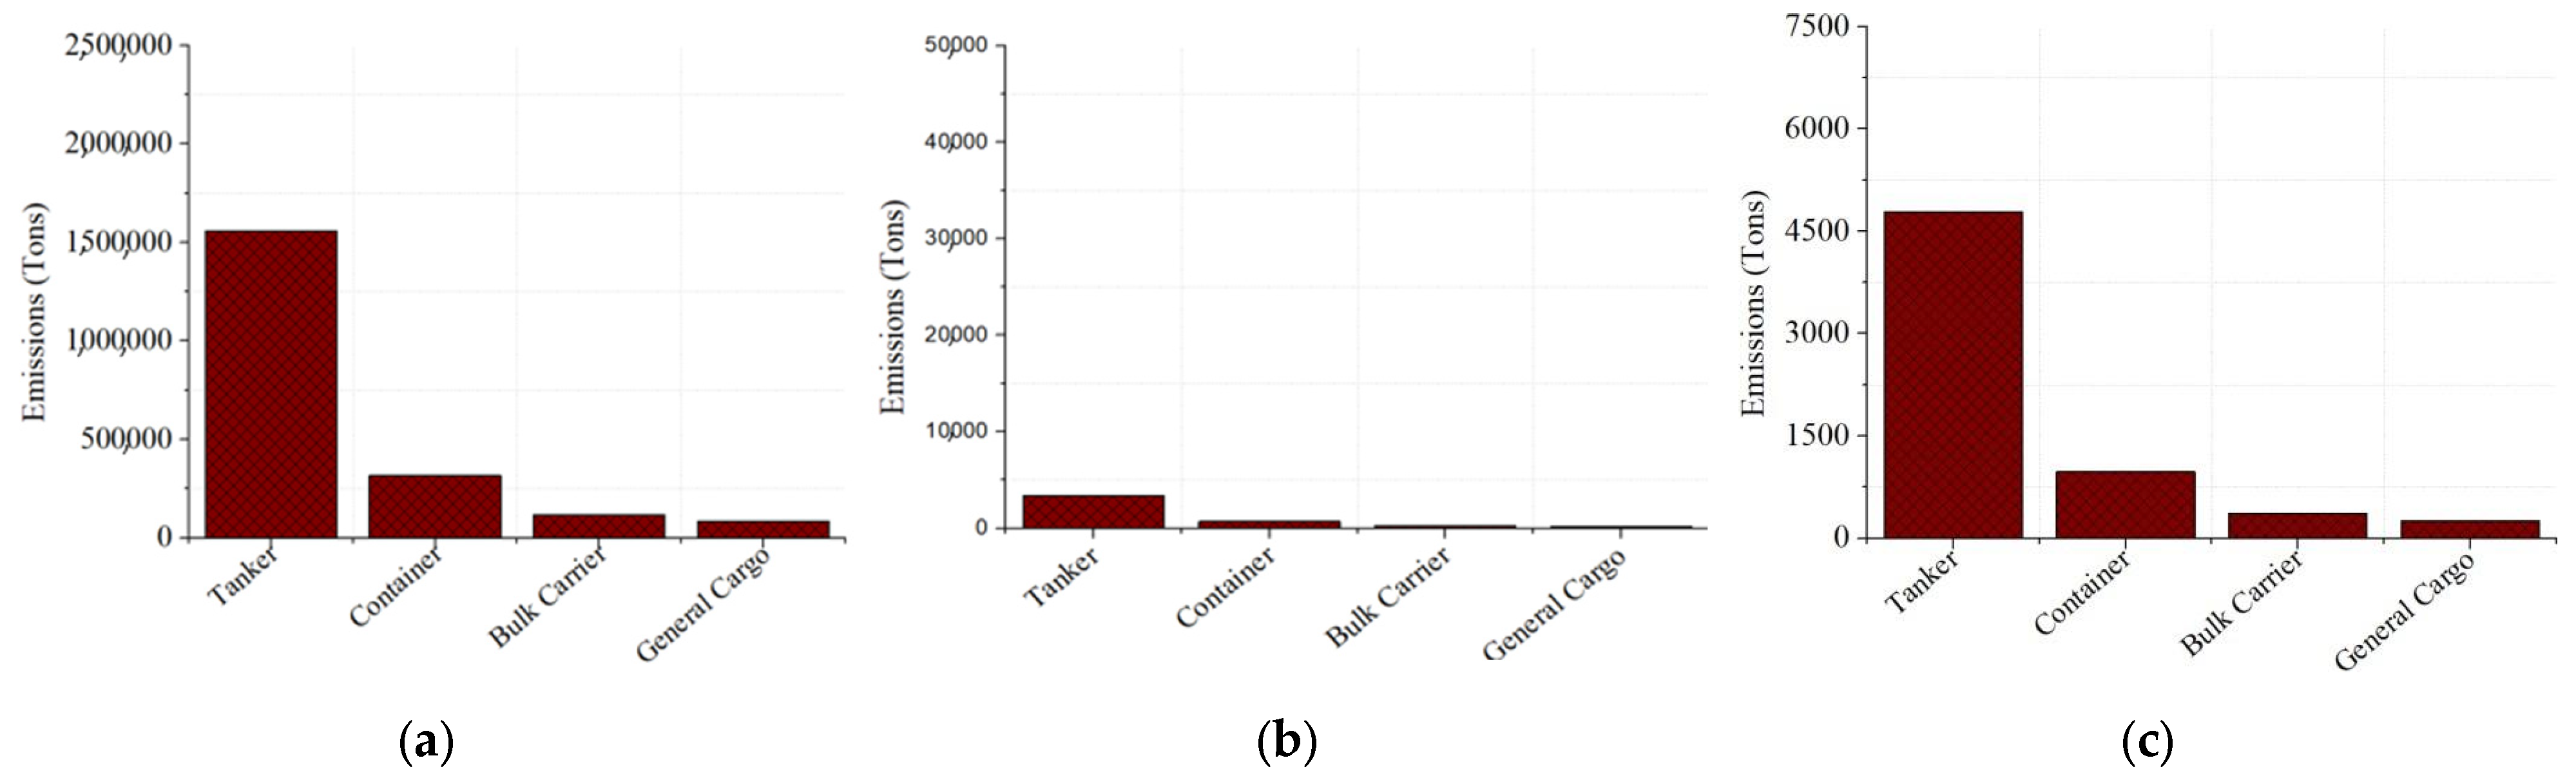
This research revealed significant differences in emissions levels from the four vessel types. Tankers were the largest emitters of CO
2, NO
x, and SO
x emissions, followed by container vessels, bulk carriers, and general cargo ships. As shown in
Table 12, tankers accounted for the largest share of CO
2, nearly 43.3%, contributing around 4.5 million tons annually, corresponding to [
51]’s research that found tanker ships as the highest emitters at Incheon port. Container ships contributed slightly lower CO
2 amounts, totaling 3.5 million tons, but emitted comparable levels of NO
x, while general cargo had the least value at 6.3%. The dominance of tanker emissions can be attributed to their larger engine sizes, leading to higher fuel consumption, extended hoteling periods, and intensive auxiliary boiler operations during cargo loading and unloading operations. Additionally, there are many tanker ships, accounting for a significant percent of the global fleet; hence, generally, CO
2, NO
x, and SO
x emissions were highest for tanker ships and lowest for general cargo.
Table 9,
Table 10 and
Table 11 showing equipment-specific results emphasize the primary sources of emissions for CO
2 and NO
x as the main engines, while auxiliary boilers significantly contributed to SO
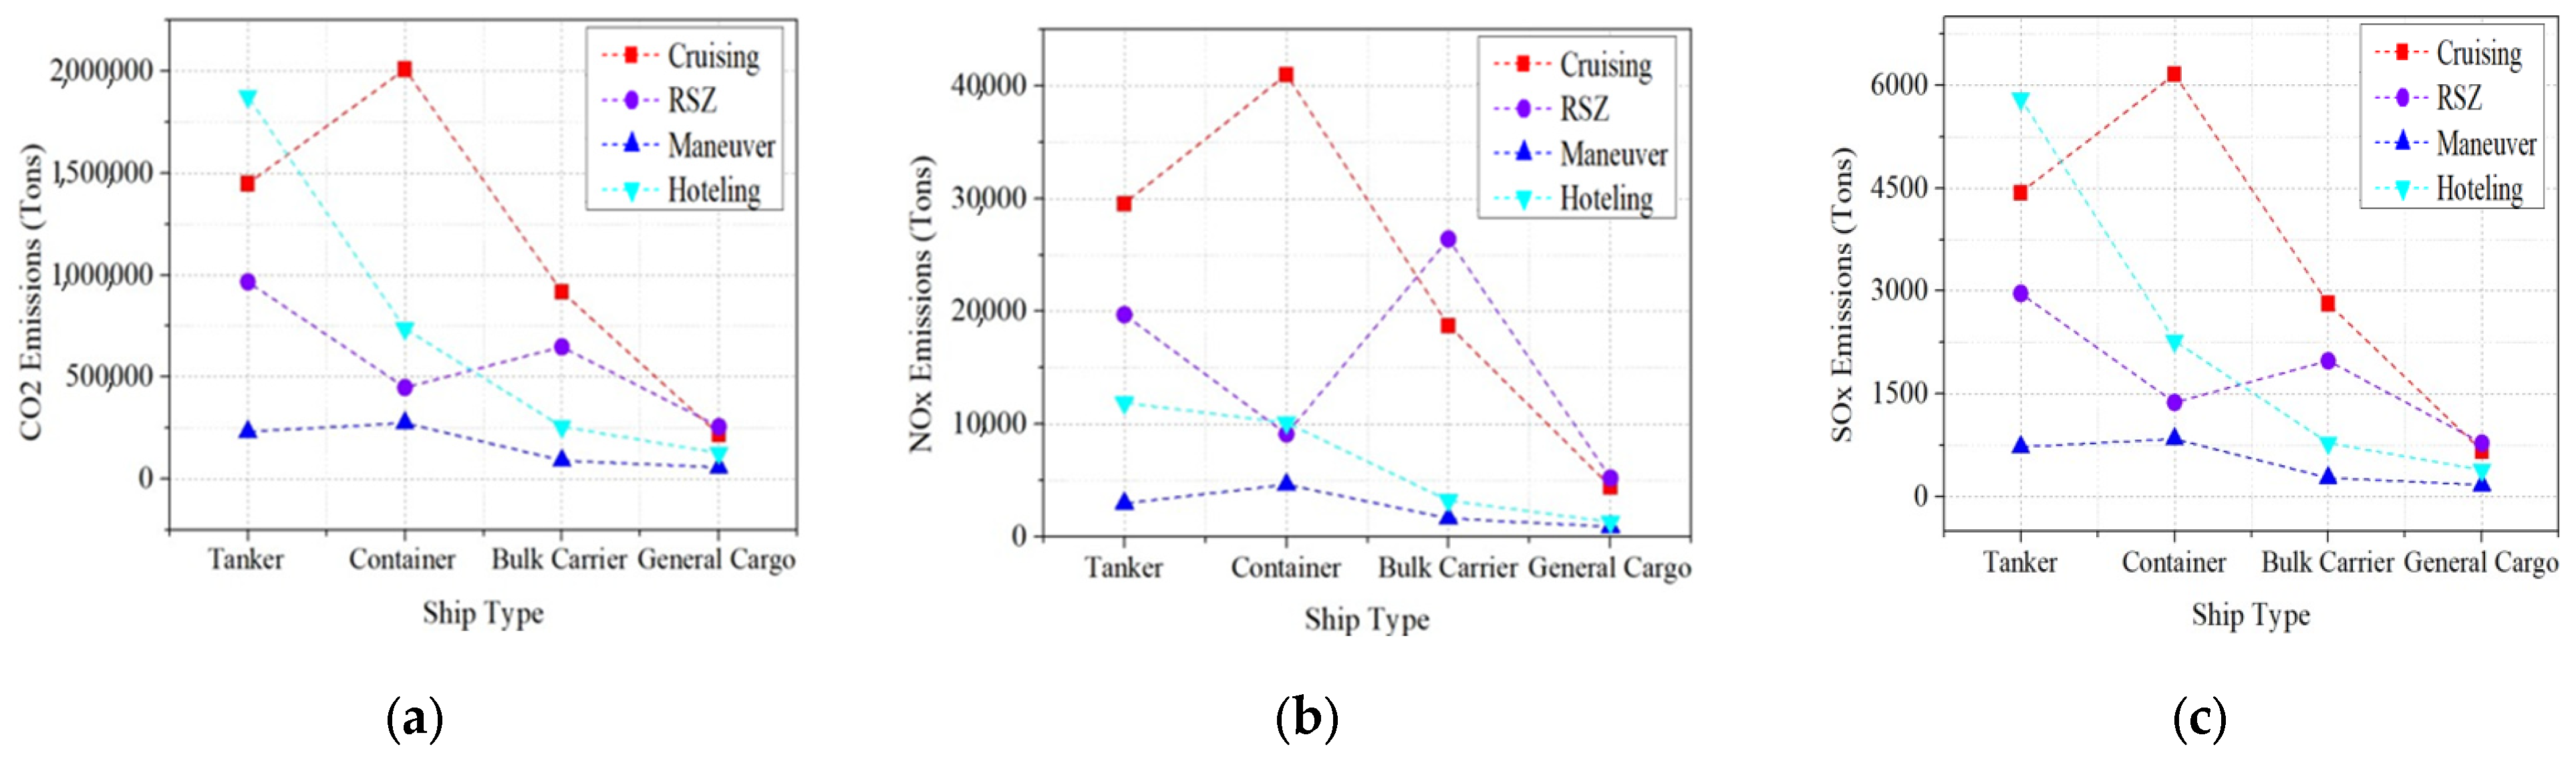
x emissions, particularly for tankers and general cargo ships. The operational mode results presented in
Table 13,
Table 14 and
Table 15 show that the cruising mode generated the highest emissions for container vessels, particularly for CO
2 and NO
x, compared to other ship types. In contrast, hoteling was a major emission contributor for tankers and bulk carriers due to long idle times at anchorage using auxiliary engines and boilers. This emphasizes the need to expedite the adoption of shore power at major ports like Busan. In the line graphs in
Figure 13, emissions during maneuvering and RSZ operations were non-negligible and varied significantly between vessel types, indicating the operational profiles’ critical impact on total emissions.
Overall, this study highlights tankers and containers as major contributors to maritime emissions. Tankers were the largest contributors to the total emissions in Korean coastal waters. Container ships, while contributing slightly lower overall CO2 emissions, exhibited high NOx emissions, particularly during the maneuvering and cruising phases, reflecting their frequent port entries and high-load engine operations. Bulk carriers and general cargo vessels produced lower emission volumes but showed characteristic patterns linked to extended hoteling periods and slow-speed operations near port approaches. These vessel categories, often older and operating less efficiently, contributed a disproportionately higher amount of SOx relative to their CO2 emissions, suggesting the potential use of higher-sulfur fuels. Additionally, vessels generated varying exhaust gases depending on their sizes and operational modes, suggesting that distinct operational characteristics of ships played a critical role in emission levels. The high amounts of CO2 emissions across all ship types suggest that the use of high-quality fossil fuels has been insufficient in minimizing GHG emissions. Therefore, all ship types should be strictly required to adhere to IMO’s energy efficiency standards. Additionally, emphasis should be directed towards the adoption of clean energy sources such as green ammonia or hybrid propulsion options.
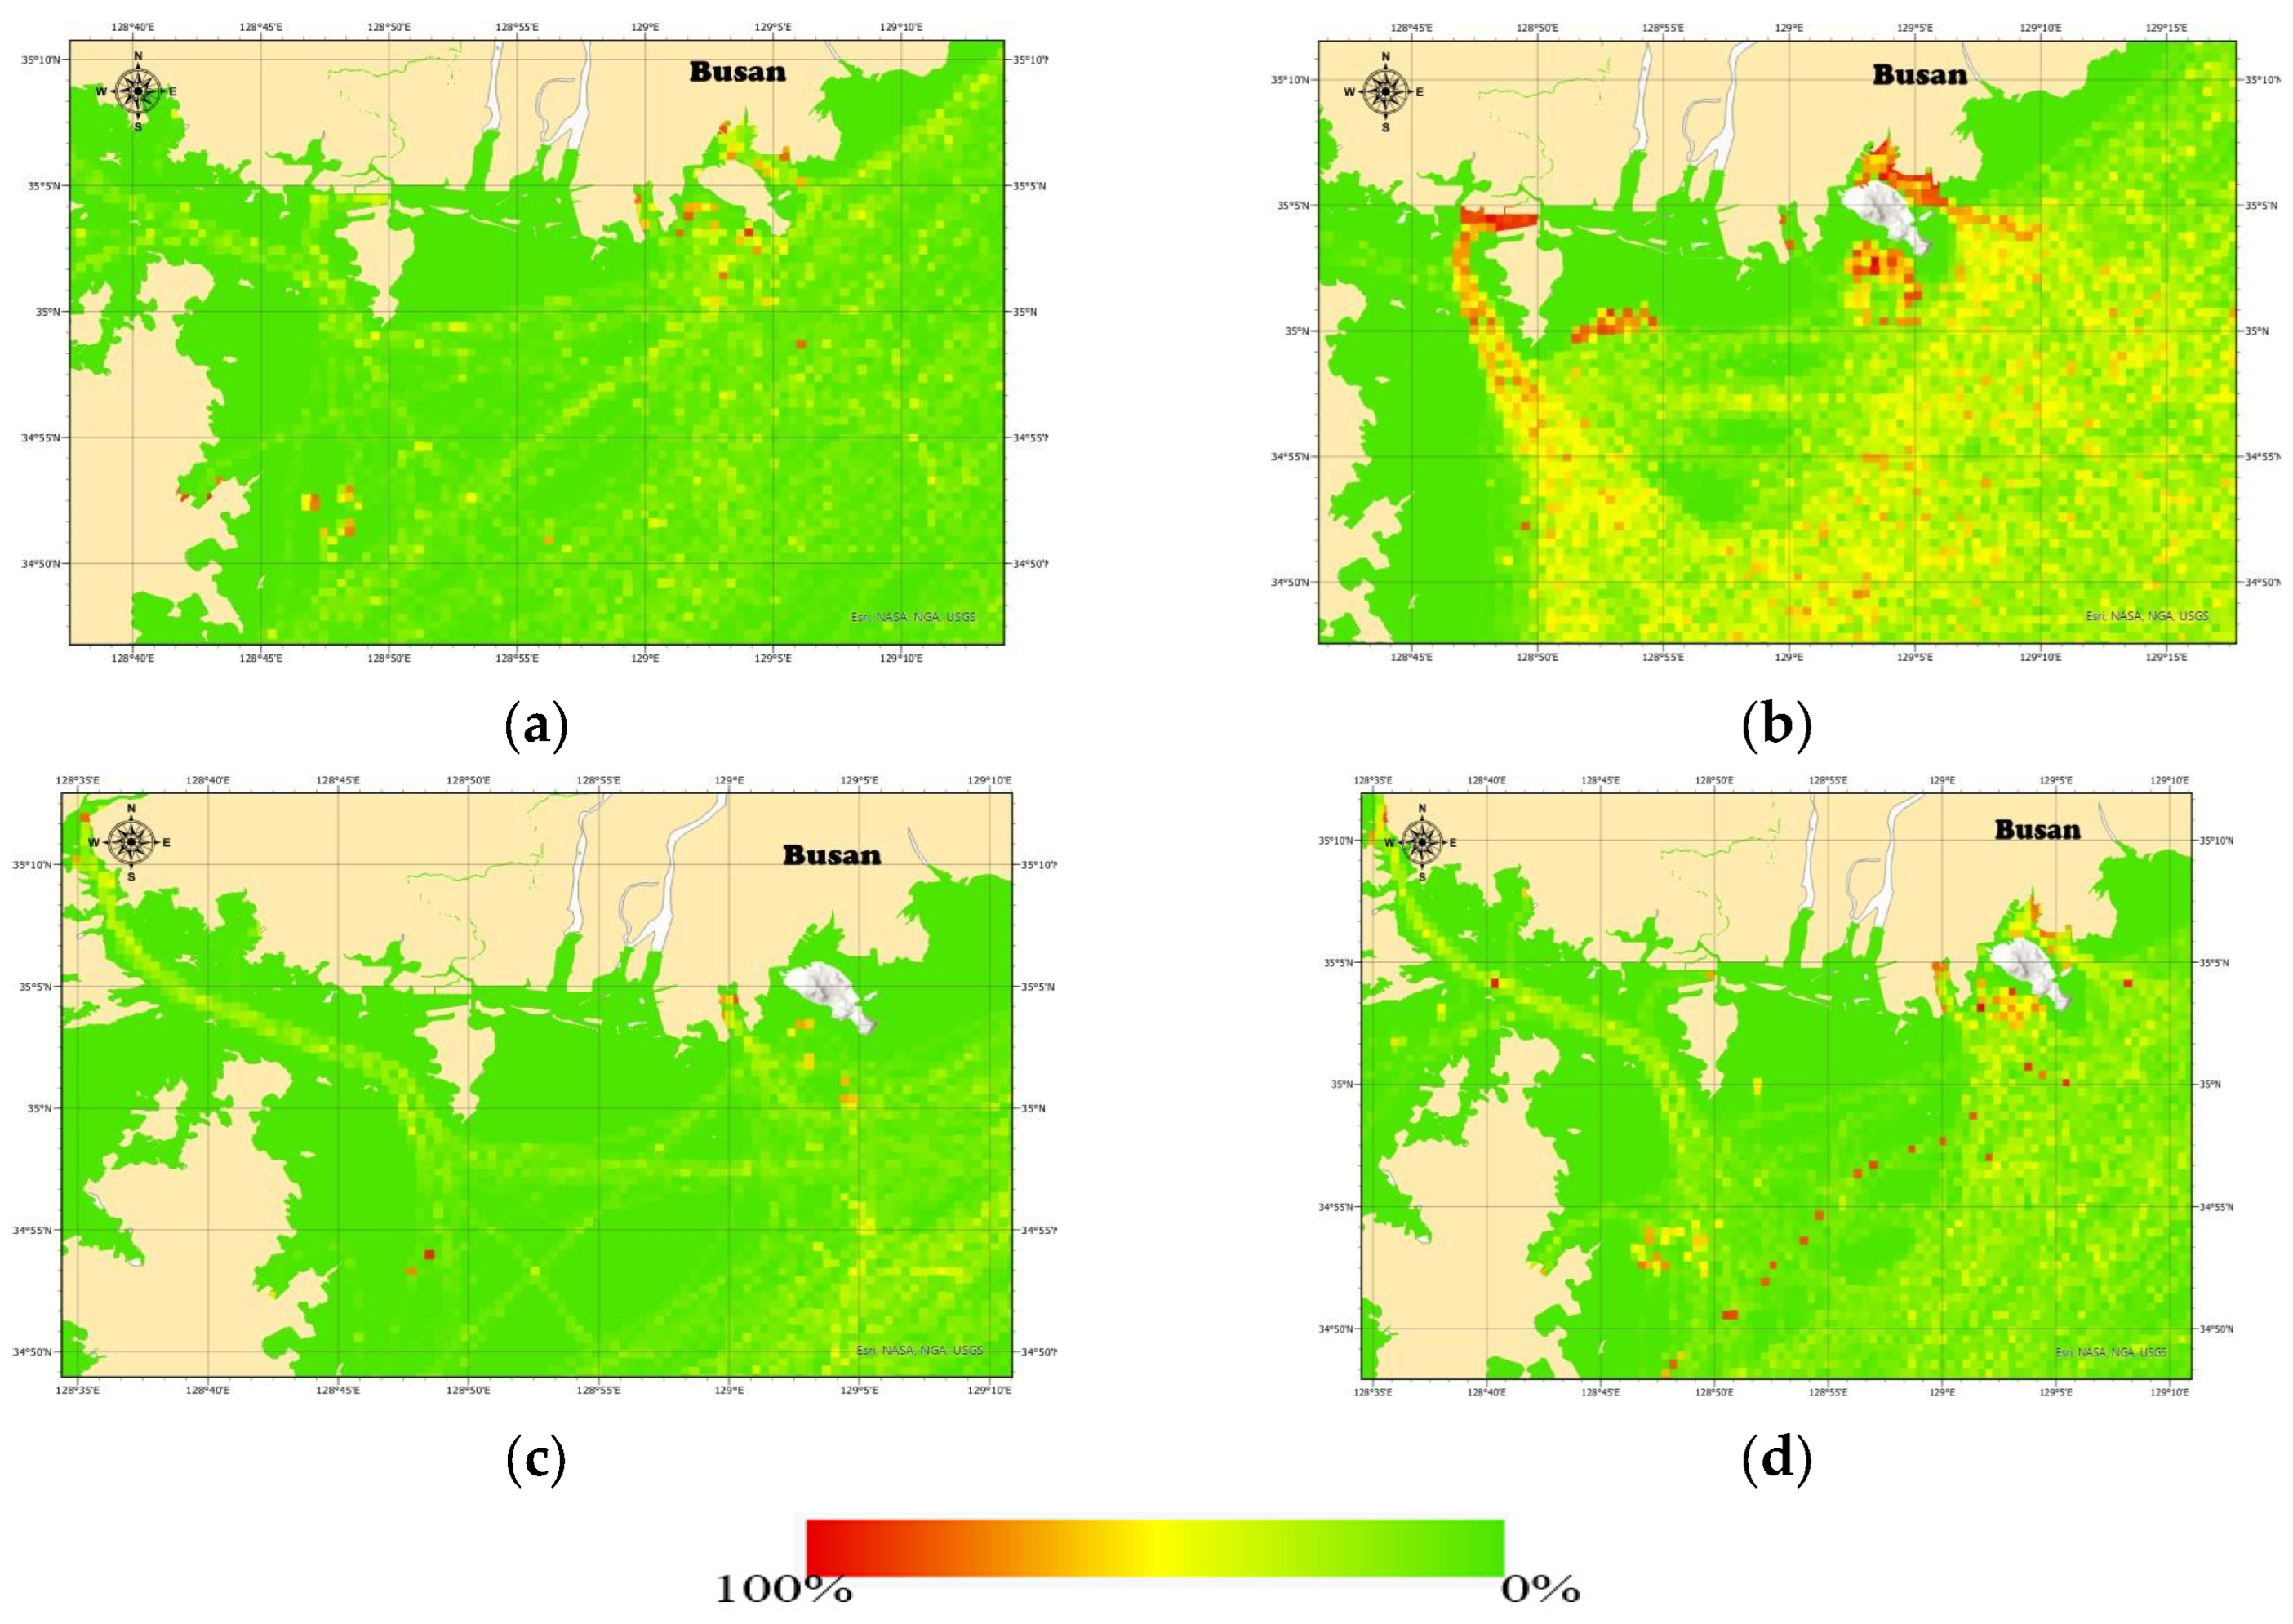
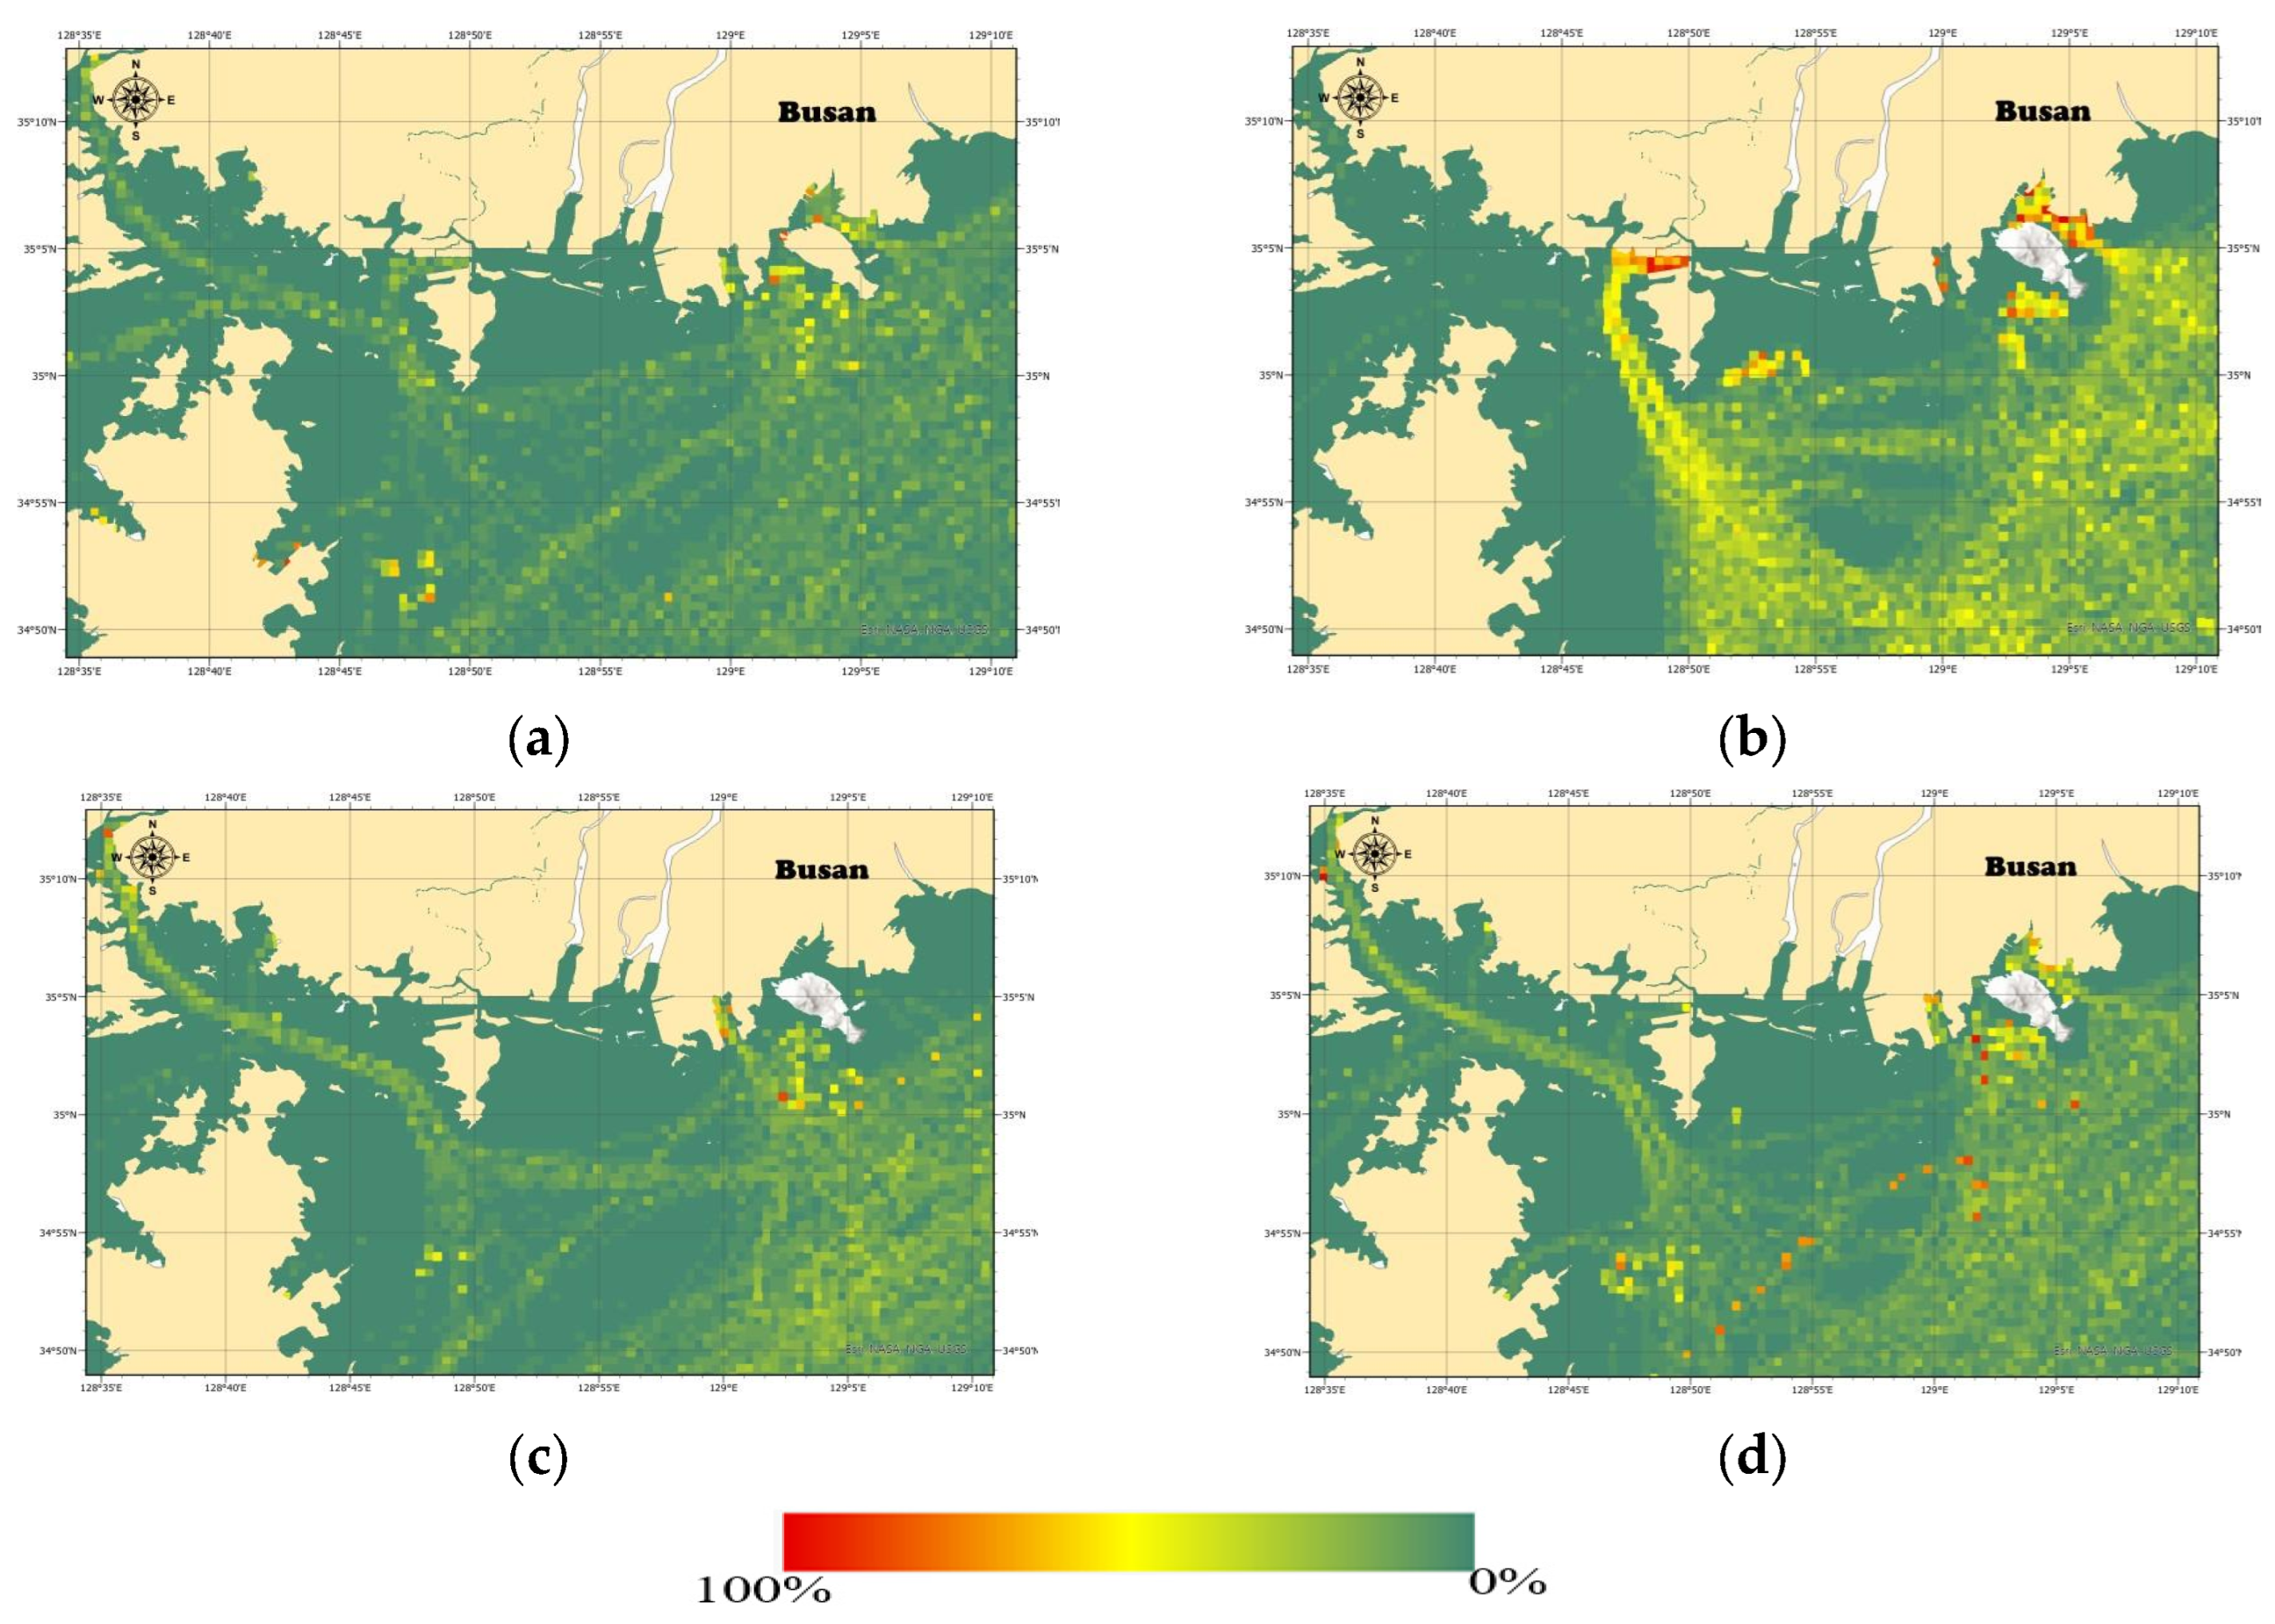
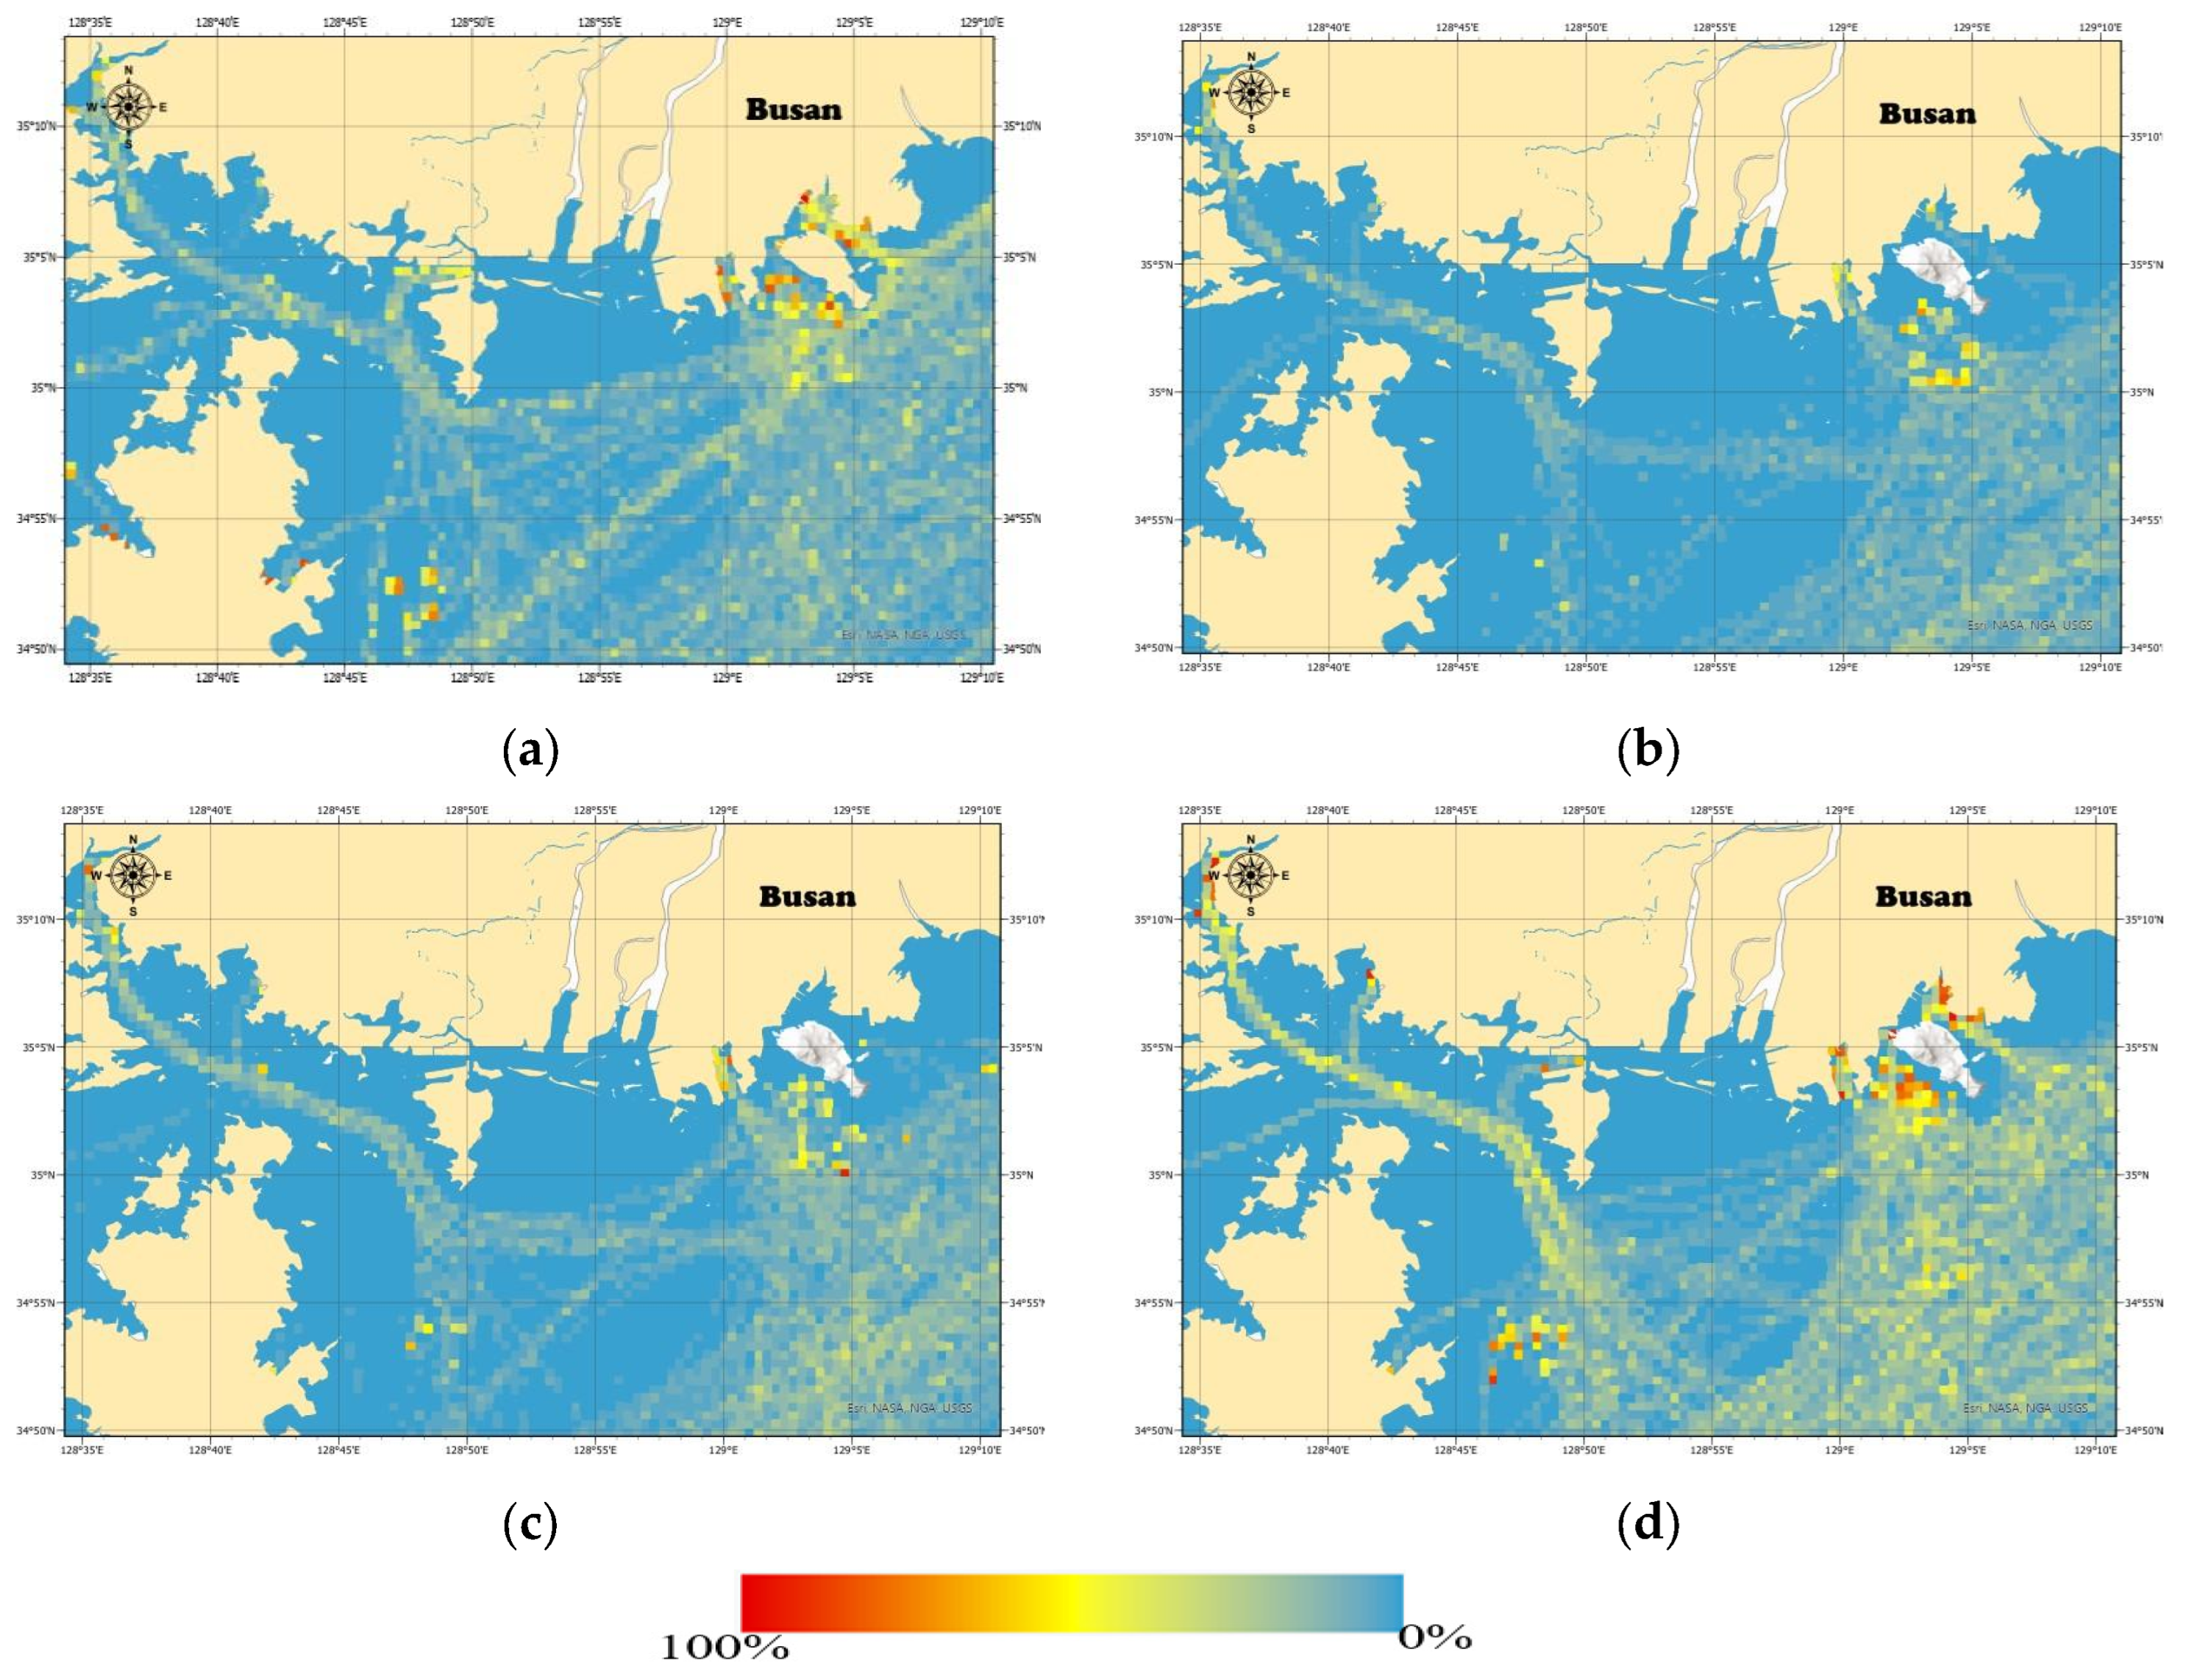
Moreover, this study revealed significant spatial variations in emissions in Busan, highlighting the influence of vessel types and operational modes on emission volumes. The emission hotspots identified through GIS mapping correspond to anchorage zones and the major shipping lanes. Anchorage zones and ship terminals and berths had high-intensity emissions, especially for CO2. In the study, Busan had the highest CO2 emissions clustering from container vessels near the North Port and the New Port, aligning with its position as among the busiest container terminals in the world. However, SOx emissions were notably lower in Busan, primarily concentrated around anchorage zones due to stringent fuel regulations in ECAs. These results highlight the concentration of container shipping activities in Busan Port and the need for localized maritime pollution control strategies. Additionally, the research revealed the need to apply different emission control measures for different vessel types, regions, and shipping activities. For example, tanker and general cargo vessels’ emissions can be significantly reduced by adopting shore power in port areas that experience the highest vessel activities. Promoting the use of shore power in these zones will reduce the environmental impact of stationary vessels at the port. Port authorities should expand the shore power networks and charging infrastructure to allow ships to switch off the auxiliary engines while at ports. Furthermore, improving communication and cooperation between ports will contribute to environmentally friendly port management. On the other hand, container vessels’ cruising emissions can be controlled by finding a balance between speed reduction and maintaining their schedules.
Generally, CO
2 emissions were the highest, totaling approximately 10.5 million tons for a period of 1 year. In 2019, Korea’s annual shipping GHG emissions accounted for around 27.4 million tons of CO
2-equivalent, representing approximately 3.9% of the total GHG emissions in Korea (about 701.3 million tons of CO
2-equivalent) [
10]. Additionally, according to the Greenhouse Gas Inventory and Research Center of Korea (GIR), the Republic of Korea’s total GHG emissions in 2022 was reported as 642.8 million tons of CO
2-equivalent [
52]. Focusing specifically on CO
2 from fuel combustion, the total emissions was around 549.31 million tons in 2022 [
53]. To contextualize the results of this study, the 10.5 million tons of CO
2 emissions estimated from the four vessel types represent approximately 1.9% of the Republic of Korea’s total CO
2 emissions from the fuel combustion generated in 2022. The value only represents a percentage of emissions from the shipping sector since this study only covers the four dominant contributors of ship exhaust gases (tankers, containers, bulk carriers, and general cargo). Although this proportion seems modest, it is significant in Korea’s national emissions reduction target since the maritime industry is integral to the region’s development. The prolonged reliance on fossil fuels is a huge hindrance to decarbonization in the Republic of Korea, with research indicating that by 2021, the transport sector will be mostly dominated by fossil fuels [
54]. In this study, all the ships used fossil fuels, specifically MDO outside ECAs and MGO within the ECAs. The share of low-carbon fuels in the transport mix needs to increase to between 40–60% by 2040 if the Republic of Korea wants to largely reduce national GHG emissions [
55]. Consequently, MOF released the 2050 Net-Zero Roadmap, which sets target emission reductions for Nationally Determined Contributions (NDCs), which include domestic shipping emissions at 40% by 2030 and 70% by 2050 compared to 2018 levels, whereas, for international shipping, the goal aligns with IMO’s 50% GHG reduction in emissions. Furthermore, the Republic of Korea implemented several policies to facilitate emission reductions in its shipping industry. These include a green fleet transition that entails conversion to eco-friendly ships, the use of alternative fuels, the establishment of zero-emission shipping routes, and international corporations [
10]. With increasing global pressure to decarbonize and the Republic of Korea’s vision to be among the leaders in shipping and shipbuilding to realize net-zero emissions by 2050, a comprehensive database of current emission levels from Korean ships is paramount. This study complements the existing emission inventories and avails emission data that are vital in promoting the development of targeted emission reduction strategies to achieve the Republic of Korea’s broader climate goal and maintain its competitiveness in global shipping.
The bottom-up methodology combined with the spatio-temporal technique applied in this study generated detailed emission values by vessel type, operational mode, and equipment type, thus contributing to existing emission databases to help mitigate maritime pollution [
55]. However, the bottom-up approach still generates uncertainties in the results due to the imputation of missing technical data, load factors, vessel operational behaviors, and lack of integration of dynamic environmental conditions that greatly affect fuel consumption and emissions [
32]. Future work should address these uncertainties by incorporating probabilistic modeling, real-time metocean data, and machine learning techniques to refine predictive capabilities. Further, the differentiated emissions by vessel type, operational mode, pollutant type, and spatial location offer actionable insights for maritime stakeholders, including port authorities, regulators, and policymakers. From the findings, port authorities are mandated to expand shore power systems at terminals where hoteling emissions are dominant. Korea has already implemented vessel speed programs at its major ports; however more should be done to further mitigate pollution in its port areas. The government should also increase incentivization for fuel switching or provide retrofit investments based on ship emission profiles as part of its maritime pollution policies. In addition, emission monitoring systems integrating AIS, remote sensing, and onboard reporting should be mandated for all ships to enable South Korea to pursue its carbon neutrality targets along with IMO’s net-zero targets.
To conclude, this study underlines the use of a bottom-up and spatio-temporal analysis approach as a basis for conducting ship-type and mode-specific emission inventories. This has implications for tracking emission changes and understanding its patterns at various levels, which is fundamental for targeted emission reduction strategies that will contribute towards addressing the adverse impacts of ship pollutants in the Republic of Korea’s coastal regions. These findings provide actionable insights for developing differentiated policies aimed at specific vessel categories and operational behaviors, supporting the Republic of Korea’s broader maritime decarbonization goals aligned with the IMO’s net-zero strategy.


