1. Introduction
The International Maritime Organization (IMO) regulations on the emissions of nitrogen oxides (NO
x) and sulphur oxides (SO
x) have been one reason for the increased utilization of liquefied natural gas (LNG) as a fuel for shipping. Due to the very low sulphur content in LNG, the contribution to sulphur oxide emissions is negligible. NO
x emissions are dependent on the engine combustion cycle, and with gas engines utilizing an otto-cycle (or diesel cycle engines with post-combustion treatment), the strict IMO Tier III NO
x limit is also achieved. In addition, it is shown that LNG utilization leads to significantly lower particle emissions compared to oil-based marine fuels (see, e.g., [
1,
2,
3,
4]). All this means that LNG utilization has direct effects and indeed benefits on air quality and human health.
The most popular LNG engine type is the low-pressure dual-fuel engine (see, e.g., [
5] and references therein), where the air–fuel mixture is ignited with a diesel fuel (pilot fuel) injection into the cylinder. The fact that the dual-fuel engine can be run with LNG (with diesel as the pilot fuel) but also solely with diesel fuel makes it an even more attractive engine for vessel operators who want to have more options for fuels with one engine. Over the past few years, LNG utilization in shipping has been rapidly increasing, and it is still increasing, with a total of 1239 LNG-capable ships currently sailing and 832 ships on order, as reported in June 2024 [
6].
The fact that CO2 emission is lower with NG use compared to diesel fuels is also a key factor in favouring the use of LNG instead of diesel-based marine fuels. Natural gas is mainly composed of methane with a higher H/C ratio compared to diesel. The hydrocarbon emissions due to non-combusted fuel, on the other hand, are higher with NG compared to diesel fuels. Because natural gas is mainly methane, most of the hydrocarbon emissions are also methane. This ‘methane slip’ should be minimized, because methane is a strong greenhouse gas, the release of which quickly reduces the benefit of lower CO2 emissions.
While there are no IMO standards for dealing with methane slip, European Union’s Fit for 55 programme addresses methane emissions in the energy sector through the inclusion of CO2, N2O, and CH4 in the Monitoring, Reporting and Verification system as part of the EU Emissions Trading Scheme regulatory framework.
EU MRV (Monitoring, Reporting and Verification) Maritime Regulation, starting Jan 2024, requires the reporting of GHG emissions, including methane, for all legs of voyages involving an EU port, as well as the emissions in the port. EU ETS (Emission Trading Systems) forces shipping companies to purchase and use emission allowances for each ton of in-scope CO2e emissions. In 2025, companies must buy allowances covering 40% of their reported emissions from the previous year. This will increase to 70% of emissions reported in 2026 and 100% in 2027. Methane and N2O will be included in the ETS from 2026.
IMO is also active in the field and has approved the 2024 life-cycle assessment (LCA) of GHG emissions from marine fuels (MEPC.391(84)) including well-to-wake GHG intensity calculation for marine fuels. Discussion on regulating intensity reduction is expected to be finalized in 2025. Considering the total emissions over the life cycle of all fuels is important, and the real effects on climate need to be understood to compare the different fuels (e.g., [
7]).
Since methane emissions become regulated (and monetized), reliable emission detection and quantification will play a key role. There is not yet any universally regulated method for measuring methane slip, but various technologies are available for detecting and quantifying methane emissions. However, few studies have compared these technologies or used those on board.
In the current study, we compare different measurement methods to study methane slip from state-of-the-art LNG engines, in the engine laboratory and on board a state-of-the-art cruise ship. Moreover, we also conduct measurements downstream of a methane oxidation catalyst, a technology expected to be in use in the near future.
2. Methods
2.1. Methane Measurement Devices
To measure total hydrocarbons (THC), a heated flame ionization detector (HFID) is generally the accepted method (e.g., in ISO 8178, NOx Technical code). In FID, the sample gas is introduced into a hydrogen flame inside the FID. Any hydrocarbons in the sample will produce ions when they are burnt. Ions are detected using a metal collector which is biased with high DC voltage. The current across this collector is thus proportional to the rate of ionization, which in turn depends upon the concentration of HC in the sample gas. In our current study, we had two different devices utilizing the FID method. Horiba MEXA HFID (HORIBA, Kyoto, Japan) was used, and measured total hydrocarbons and CH4 (with the help of a non-methane cutter catalyst that burns all non-methane hydrocarbons). Cambustion FAST FID (Cambustion, Cambridge, UK) was also used. This FID analyser uses conventional detection principles and a unique patented sampling system to give millisecond response times. However, when thinking of measurements on board, bringing the equipment with the fuel gas (containing hydrogen) on board some vessels may present a challenge. In addition to FID, we involved other methods to measure methane in our study.
Gas chromatography (GC) combined with a suitable detector can be used to measure methane, and in the current study, Agilent 490 Micro Gas Chromatograph (Agilent, Santa Clara, CA, USA) was utilized. In this instrument, a small amount of sample is injected every 2 min in a column able to separate methane. The thermal conductivity detector (TCD) follows downstream of the separation column to detect the difference in thermal conductivity between a reference cell and a measurement cell. The TCD is concentration dependent.
The non-dispersive infrared (NDIR) spectroscopy-based analyser uses an infrared light source to measure the gas concentration by flowing sample gas into a gas cell. The infrared radiation passes through the sample gas in the cell, and the absorbed infrared radiation by the gas in the cell corresponds to the sample-gas concentration as detected by the detector. Different gas molecules have different infrared wavelengths that are absorbed. NDIR uses infrared radiation containing wavelengths in mid-infrared radiation to measure the concentration of gas components. A Horiba PG-350GHG analyser (HORIBA, Kyoto, Japan) was used in the present study to detect CH4. This device uses a cross-modulation NDIR method that involves alternating the introduction of sample gas and reference gas into the same gas cell by switching a solenoid valve at regular time intervals. Since clean reference gas (air) is fed into the sample cell in between each sample-gas measurement, the gas cell remains clean. New records are saved every 5 s. In addition, a MARSIC300 measuring device from SICK (Waldkirch, Germany) was used to measure methane. This device has been used especially in connection with aftertreatment devices for SOx and NOx on board ships. The measurement principle for CH4 in this is also NDIR spectroscopy. Measurement is carried out online at 1 s intervals.
Fourier transformation infrared (FTIR) utilizes a broad range of infrared adsorption, measures all the IR wavelengths simultaneously, and produces a full spectrum to identify and quantify multiple gas compounds simultaneously, with CH4 being one of those. All molecules can be identified by their characteristic absorption spectrum, because each molecule absorbs infrared radiation at its characteristic frequencies. Every molecular structure has a unique combination of atoms and therefore produces a unique spectrum when exposed to infrared light. The infrared spectrum is a plot of infrared radiation-related quantities as a function of wavelength. The absorption strength (peak height) is directly proportional to concentration, and this way the IR spectrum can be used to determine concentrations of gases in the sample. In the current study, two Gasmet DX-4000 FTIR devices (Gasmet, Vantaa, Finland) were in use. Measurement with FTIR was performed online at 20 s intervals.
All instruments were equipped with heated sampling lines (180 °C) and heated filters (180 °C). A sampling condition unit to dry the gas was in use prior to the MikroGC and Horiba NDIR devices. Studies were carried out in the engine laboratory and on board.
All methods to measure methane in this study have also been earlier used in studies measuring methane emissions on board LNG-powered vessels: FID in Refs. [
2,
3,
8,
9,
10]; GC in Refs. [
2,
4,
11]; NDIR in Ref. [
10]; FTIR in Refs. [
4,
11,
12].
2.2. Engine Laboratory
Wärtsilä 25 DF is a state-of-the-art medium speed 4-stroke dual-fuel engine equipped with the most-recent-generation common rail technology, 2-stage turbocharging, electronically controlled gas admission and a hydraulic valve mechanism for optimized combustion performance. The studied engine was a new 6-cylinder engine from the production line, with a rated power of 345 kW/cylinder summing up to 2070 kW.
Measurements were conducted on five different engine loads: 10%, 25%, 50%, 75%, and 100% loadings. The fuel in use was LNG with 94 mol-% methane and the pilot fuel was a marine gas oil (MGO) with low sulphur level of 0.001 m-%.
In addition to measuring methane from engine exhaust, measurements were also performed downstream of a catalyst, namely a methane abatement catalyst (MAC) consisting of a sulphur guard bed (SGB) and a methane oxidation catalyst (MOC). The challenge in the development of MOC was the deactivation of the catalyst, since the palladium-based catalysts needed for methane oxidation are very sensitive to sulphur poisoning and as little as 1 ppm SO
2 present in the exhaust has already been found to inhibit the oxidation of methane [
13,
14]. In the present study, the catalyst system involves an innovation of a sulphur guard bed to collect the sulphur from the exhaust gas upstream of the actual MOC. At the time of this study, the technology was being demonstrated in the engine laboratory, and will next move to onboard demonstration on a live vessel to trial the system under real marine conditions. Therefore, this catalyst concept is likely to be used in the future, and methane measurements in connection with this concept are seen to be relevant.
The same Gasmet FTIR, Horiba GHG analyzer (NDIR), and Cambustion FID that were used to measure the engine exhaust were also used downstream of the MAC. In addition, there was a second Gasmet FTIR placed downstream of the MAC. The installation of the other instruments, like MEXA FID and SICK NDIR, did not allow for them to be used downstream of the MAC in the current study. The drawing of the measurement setup is presented in
Figure 1. Unfortunately, even though the MikroGC was installed in such a way that it was able to be used both upstream and downstream of the MAC, due to human error, the results downstream of the MAC are not available.
2.3. On Board
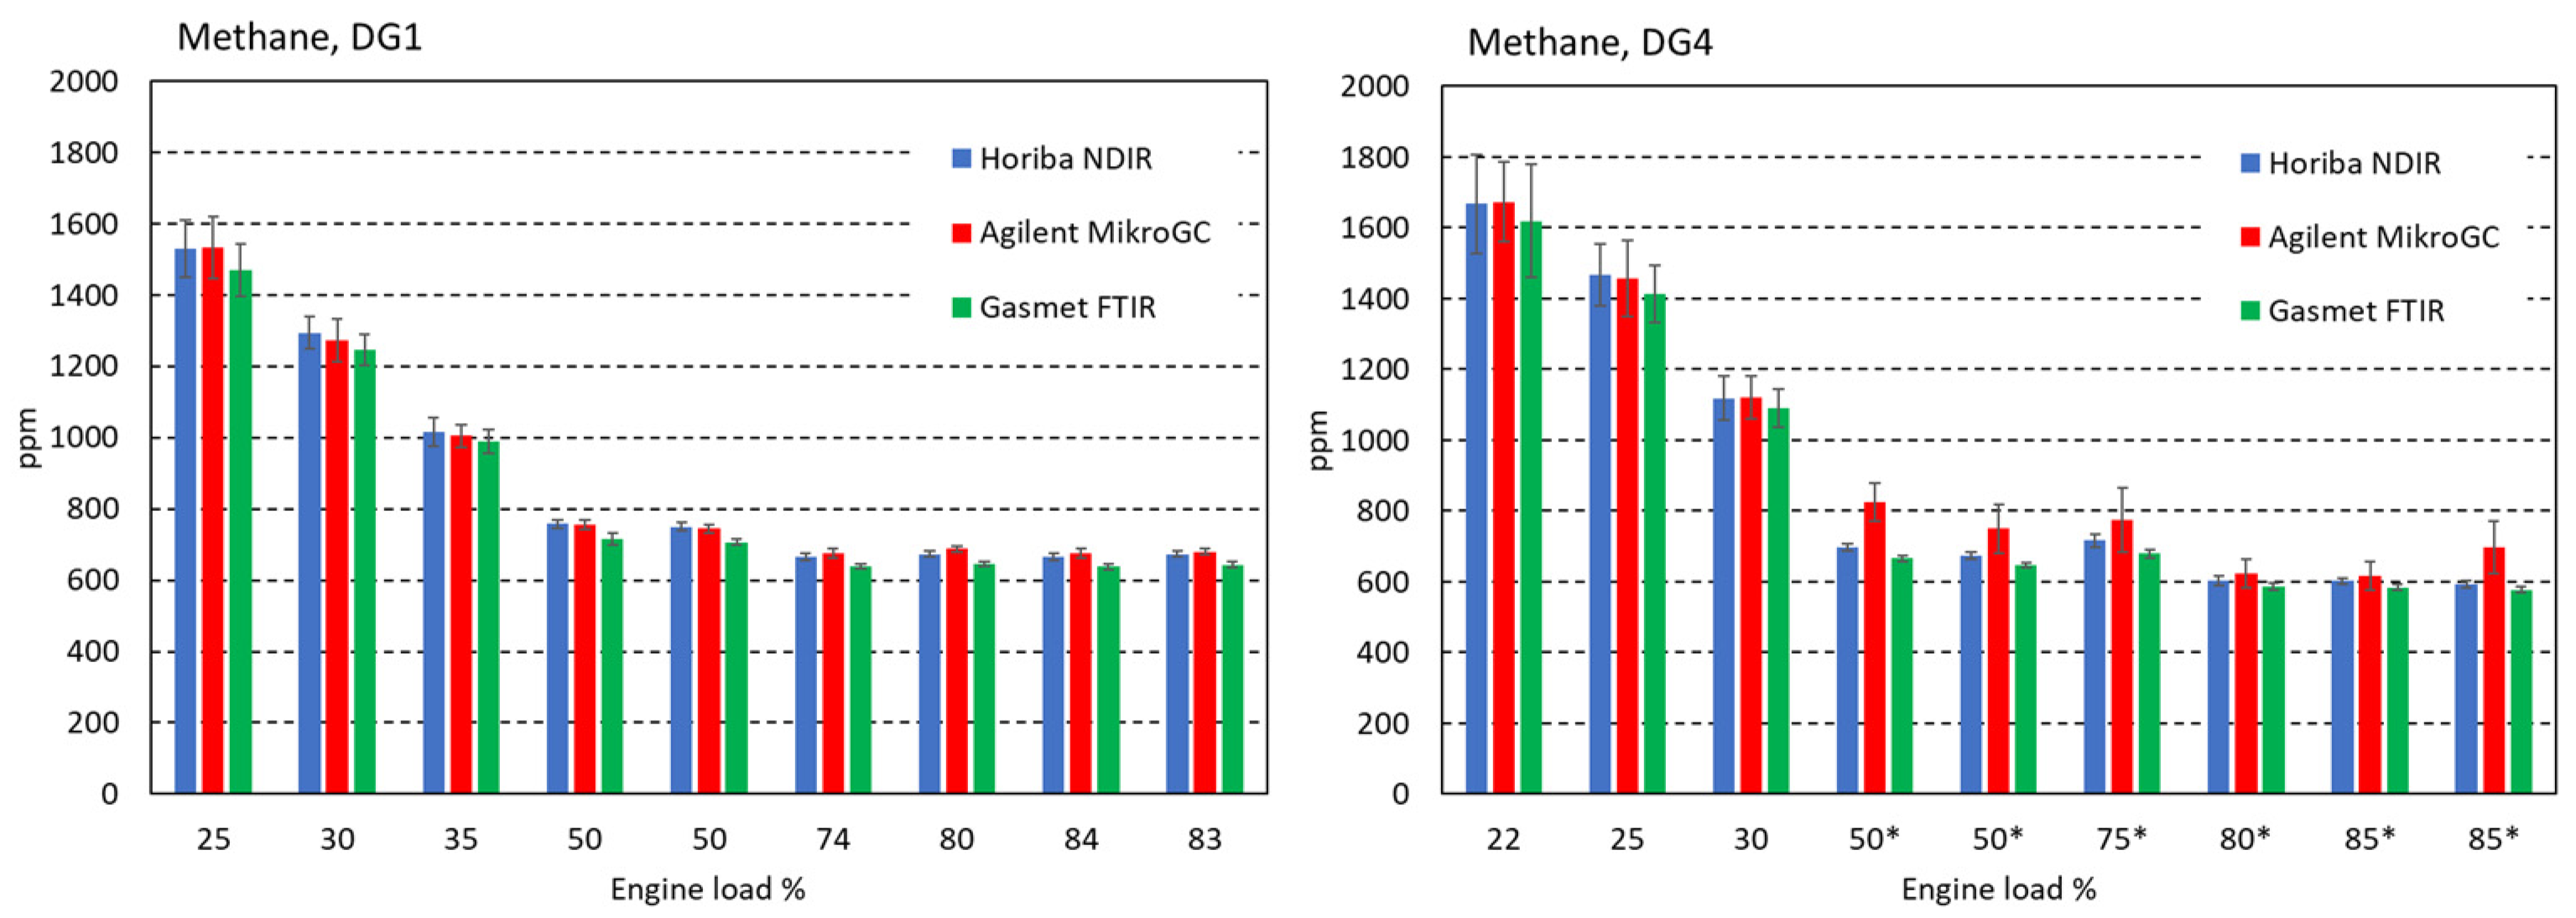
Methane measurements were made on board a state-of-the-art cruise ship, namely MSC Euribia from two Wärtsilä 46 DF dual-fuel engines, one with 16 cylinders and the other with 12 cylinders. Engine loads used during normal vessel operation, from a minimum of 22% up to 85% engine load, were studied. The LNG fuel had 90.7% methane content, and the pilot fuel was a marine gas oil (MGO) with a low sulphur level of 0.06 m-%.
On board the cruise ship, the measurements were performed with three devices: Agilent MikroGC, Gasmet FTIR, and Horiba GHG analyzer (NDIR). FID was not used on board, since bringing the equipment with the fuel gas (containing hydrogen) on board was not possible.
Measurements were conducted by sampling the engine exhaust through a sonde installed to a connector port on the deck above the engine room, a few metres from the engine outlet. The exhaust was then split to the three instruments in use.
2.4. Measurement Protocol and Result Calculation
To secure stable engine operation during the measurements, one hour of time was reserved for each measurement point (i.e., engine load), both in the engine laboratory and on board. In practice, this meant that when switching to a new engine load, time (usually the first 15 min) was first reserved to stabilize the conditions, leaving 30 min (or more) for the actual measurement. On board, the emission measurements were fitted into the vessel’s normal operation and required constant interaction with the crew and measurers to ensure, e.g., that the engine load was stable for the measurement period.
The results as/kWh were calculated based on the carbon balance method (described, e.g., in ISO 8178 and NOx technical code). For this, the fuel consumption (for both LNG and the pilot fuel) was measured during the studies, together with the engine loading data (power in kW). The LNG composition was measured in the engine laboratory and received from the LNG bunkering report in the case of onboard studies. The pilot-fuel sample was received from the vessel and was further analyzed for C, H, and N to include these in the calculation of the exhaust-gas mass flow rate using the carbon balance method.
In addition to measuring methane, CO2 and CO needed to be measured to involve calculation based on the carbon balance method. In this study, the Horiba GHG analyzer also measured CO2, and the CO was measured with the FTIR. H2O was measured with FTIR as well.
4. Discussion
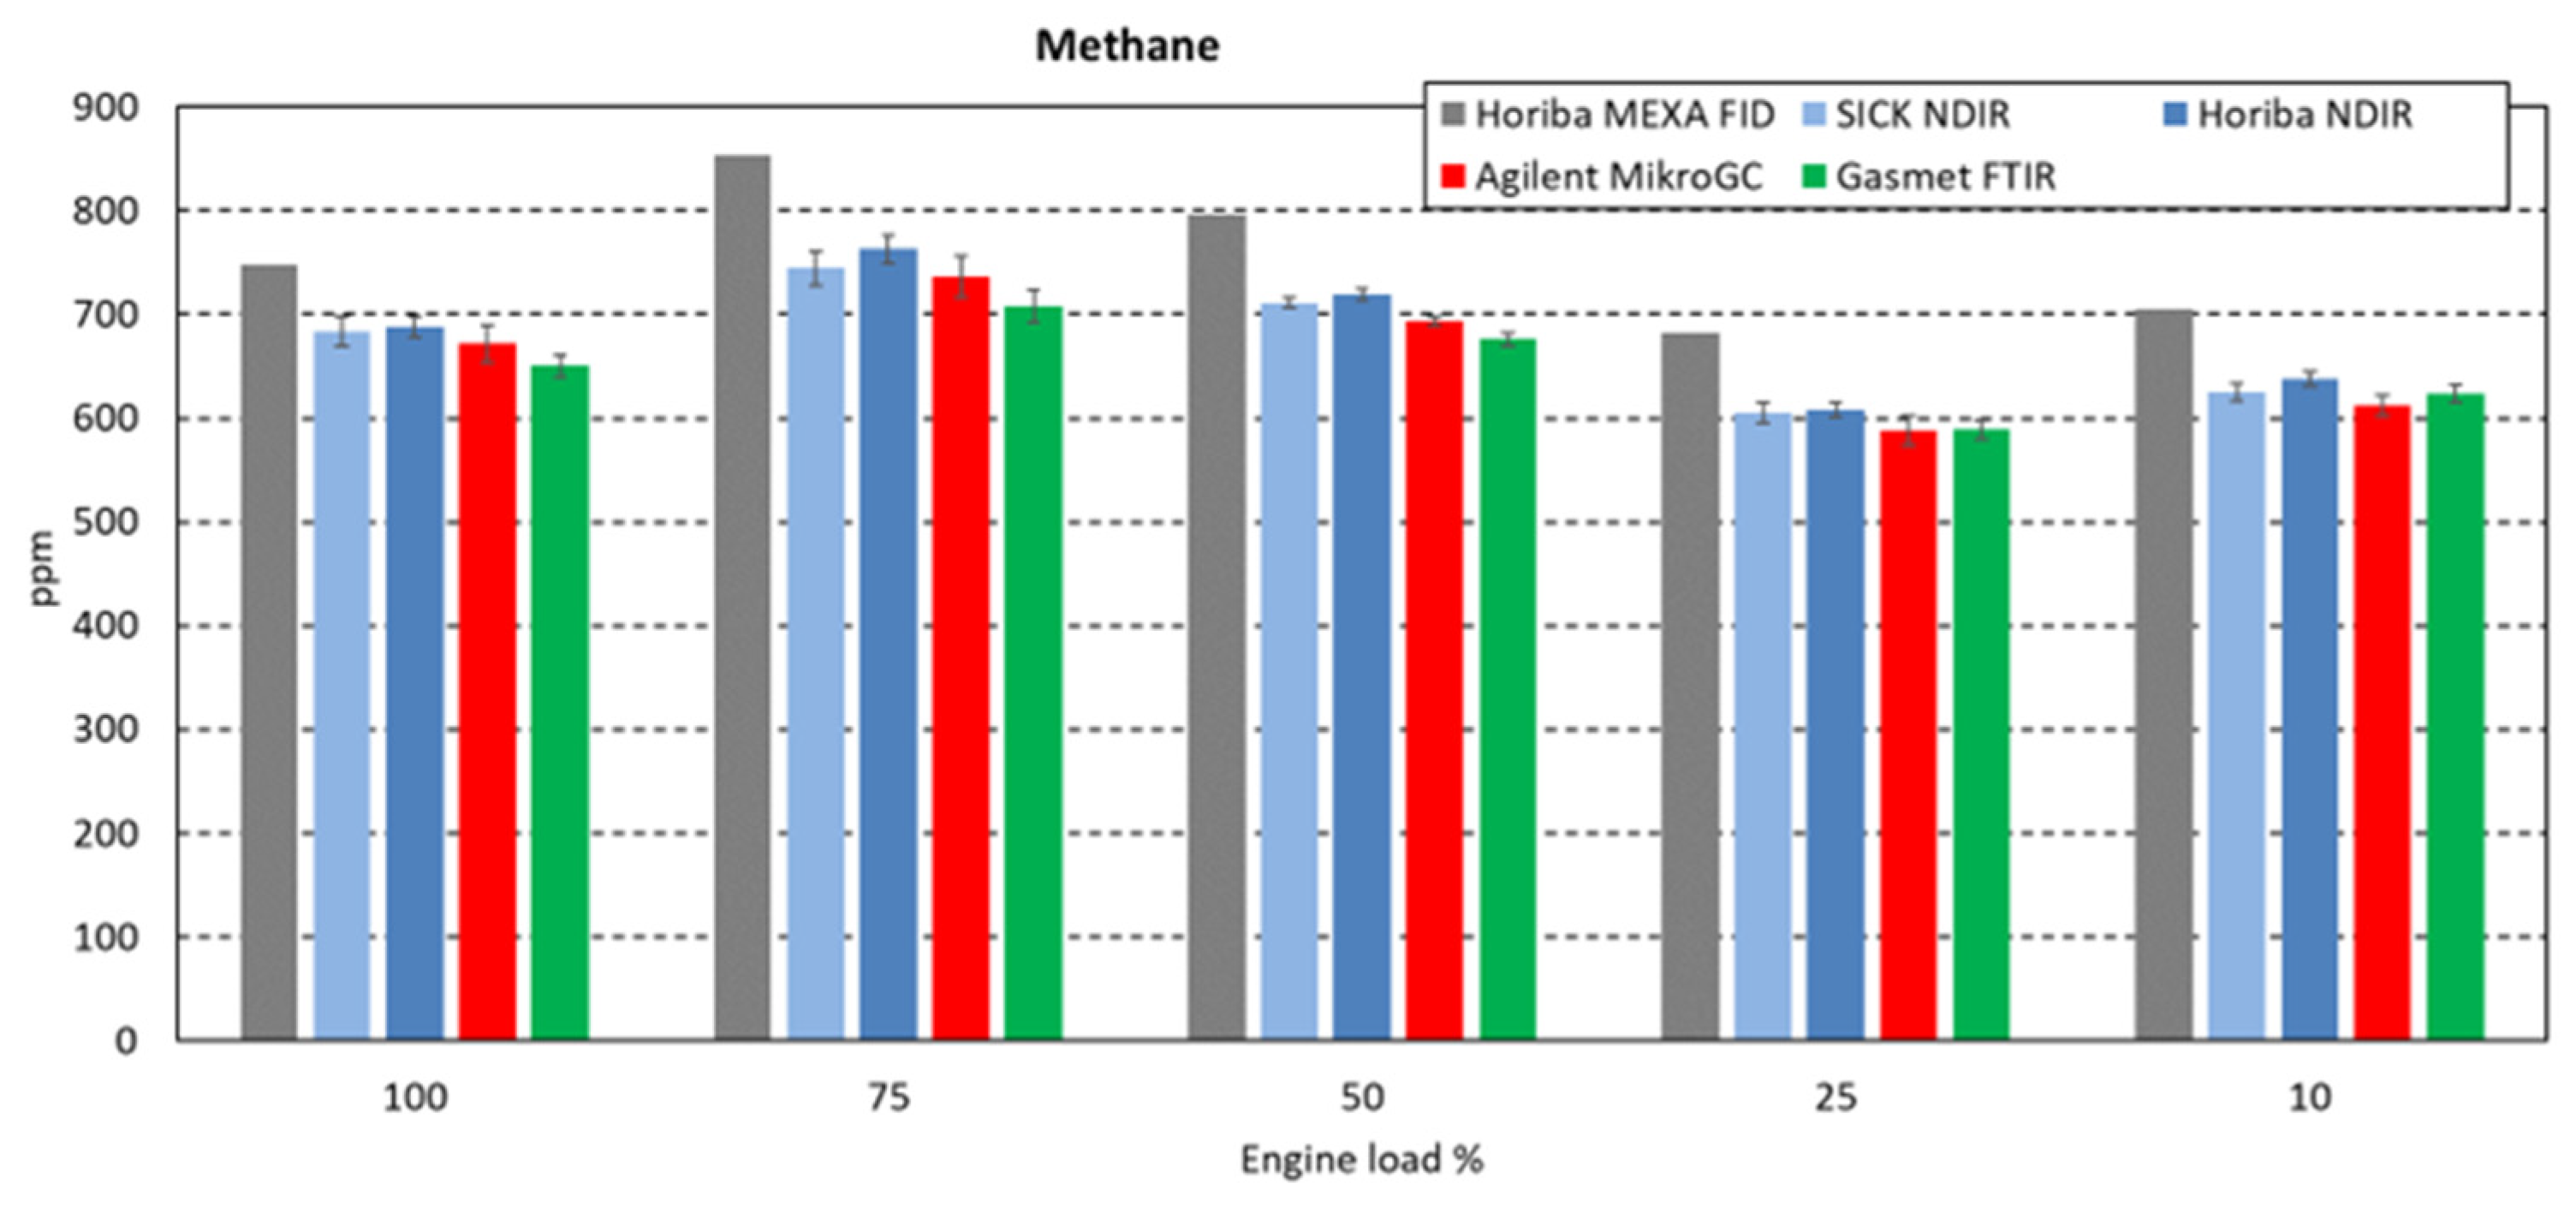
The methane-slip levels from 600 ppm to 1600 ppm were measured with different devices in the current study and, in general, the devices’ outputs were found to agree well. An exception was found with one device (MEXA FID), which showed roughly 10% higher values compared to the highest values from all other devices.
To see how the methane-slip levels of the current study correlate to other recently published studies showing methane slips from 4S LPDF engines, we first carry out a comparison of the 25 DF engine results with other studies conducted with engines of size <5000 kW. The results as/kWh were calculated based on the carbon balance method and are collected in
Figure 6. Earlier, it has been shown (see, e.g., [
5] and references therein), and can also be seen in the results of the current study, that the methane slip depends on the engine-load conditions. In all cases, lower load conditions increase the methane slip. Although, the newer engine (2024 production) studied in the engine laboratory also shows lower methane-slip values even at low load conditions compared to other studies carried out in the 2020s. The values from the current study (25 DF engine) are 2.2 g/kWh at 100% load, 2.6 g/kWh at 75% load, 2.7 g/kWh at 50% load, 3.0 g/kwh at 25% load, and 6.8 g/kWh at 10% load. These values are clearly lower compared to other studies published in the 2020s with engines smaller than 5000 kW [
11,
12,
15]. One exception to this is the ME3 engine in a study by Lehtoranta et al. [
11], but that engine was piloting a new combustion concept. To accurately evaluate the methane slip from ships, the measured methane-slip emissions under specific loads would need to be combined with the actual operating load curve.
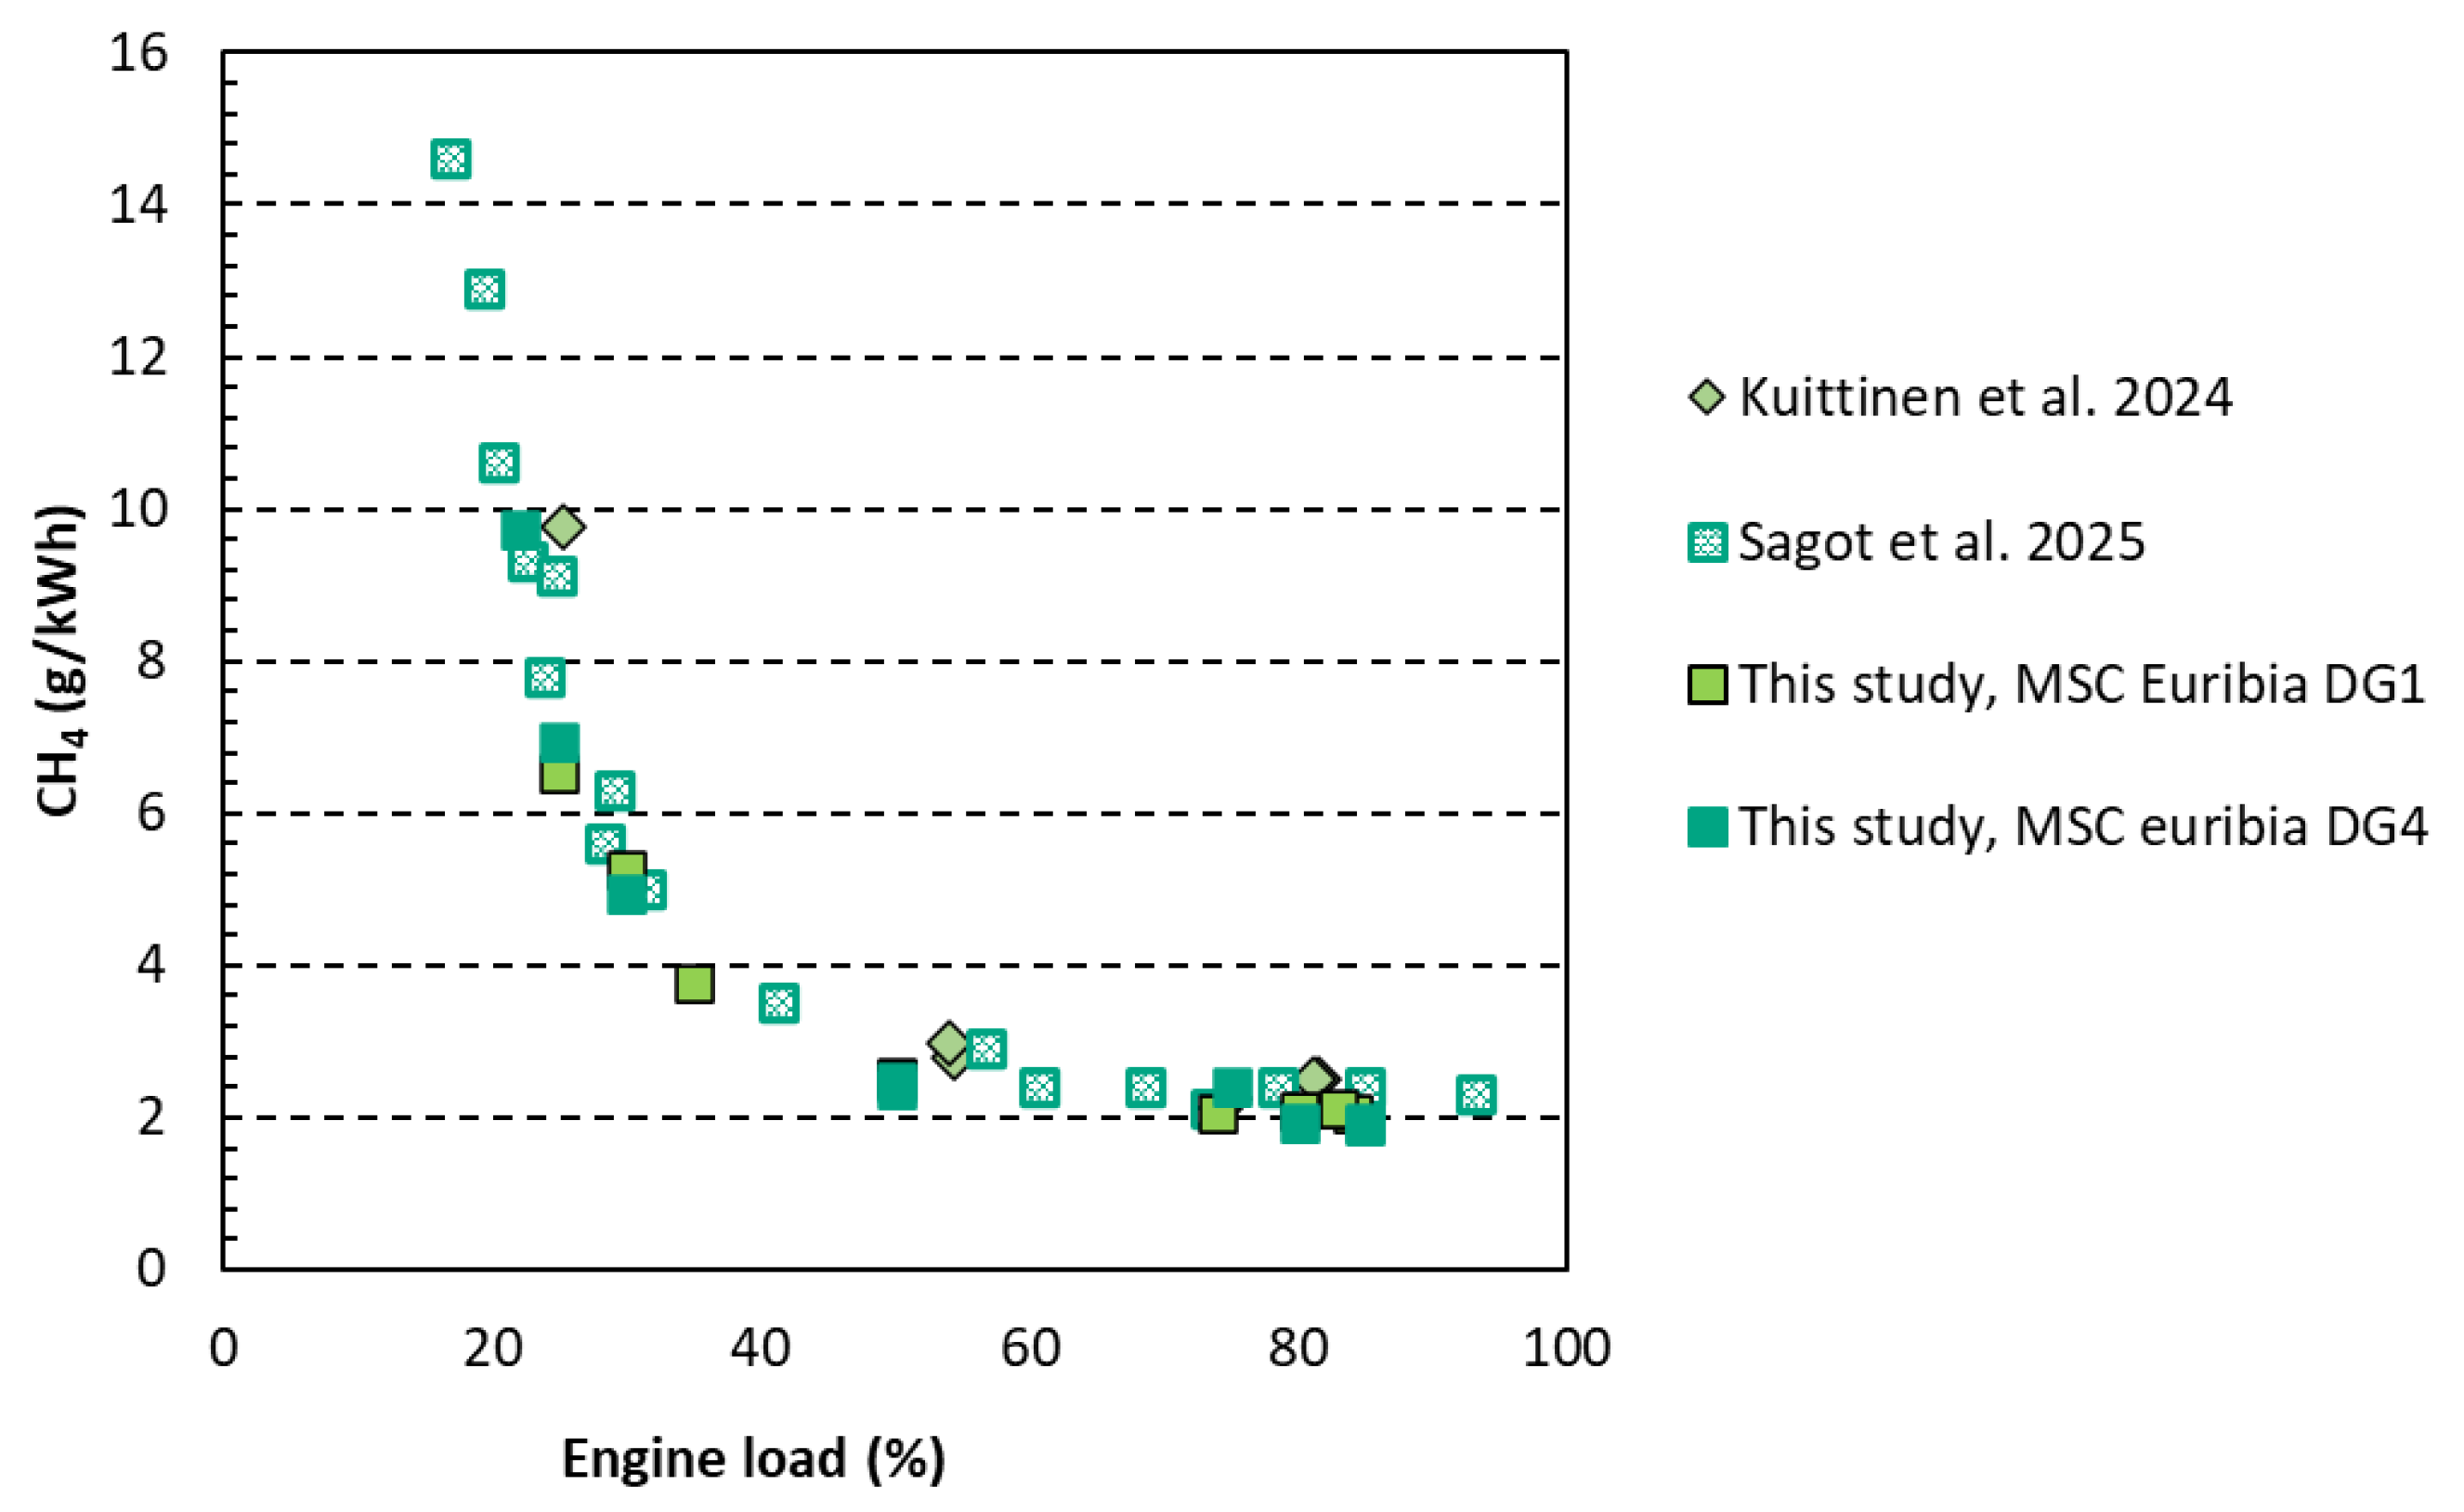
Interestingly, in comparing the methane-slip results of onboard studies independently of this study, Sagot et al. [
10] recently also published methane-emission results from this same vessel—MSC Euribia. They studied the 12V46DF engine, which was the same as the DG4 in our study. For methane measurement, they used the NDIR method. To compare our results to those in the study, we have calculated the methane-emission factors as g/kwh and show those together with Sagot et al.’s results in
Figure 7. The results from these two studies are rather similar. In general, the current study showed the same or lower methane-slip levels compared to Sagot et al. The fact that the current study always involved, at minimum, an hour at the specific engine load, and the measurement results were recorded only after 15 min of load stabilization, is different compared to the significantly shorter periods (shortest only 3 min) recorded during sea trials in the study of Sagot et al. [
10]. The biggest difference can be seen at lower loads. For example, at around 25% load, differences between the results of these two studies are large, but it is worth noting that at this low engine load, the two measurements conducted by Sagot et al. [
10] already differ quite a lot from each other, (being 9.1 and 7.8 g/kWh) and at this low load, the methane slip is also increasing sharply with the decreasing engine load, meaning that even a very small change in the engine load can mean a change in the methane-slip level.
In general, when comparing all the results from the current study and Sagot et al. [
10], and also adding the results from another modern cruise ship with a similar-sized engine [
4],
Figure 7 shows a rather uniform graph, presenting methane slip as a function of engine load. This indicates that the engine (46 DF) behaved rather similarly in these studies and the measurements carried out at different occasions on board by different devices and parties gave similar results.
While the methane slips from the newest engines show lower levels compared to earlier studies, it is essential to reduce the slip even more. One possible technology to reduce the methane slip is the methane oxidation catalyst. In the current study, the engine laboratory tests show that methane conversion efficiency for the MAC even reaches above 95% with an exhaust temperature of 370 °C or more. This is a very high methane conversion carried out at significantly lower temperatures compared to the few earlier methane catalyst studies carried out with engines [
16,
17]. In our study, as low as 30 ppm and lower methane levels were measured downstream of the MAC system with three different measurement methods (FID, NDIR, FTIR). These measurement methods could detect the 27–29 ppm level very well, and results from different devices were very close to each other. At around the 10–15 ppm methane level, the variation between the different devices is larger, and so is the accuracy of all of the devices. During this study, the MAC system was demonstrated in an engine laboratory for up to 600 h, while the measurements of this study were conducted when the MAC had been running for a total of 140 h. Next, the MAC will be demonstrated on board to confirm its efficiency during normal vessel operation over time.
In the current study, we compared four different measurement methods to study methane slip from representative, state-of-the-art LNG engines in an engine laboratory, and on board a modern cruise ship. Altogether, five different devices were found to show similar results when measuring 600–800 ppm methane levels from the engine exhaust. However, the sixth device (Horiba MEXA FID) showed a higher value compared to the five other devices. This might reflect the usage and maintenance of the specific device rather than the device’s capability to measure methane accurately. When measuring 600–1600 ppm methane slip from the engine exhaust on board, the three devices involved provided very good consistency. One exception was seen, and that was related to the first measurements with MikroGC, as the column conditioning, although run overnight prior to the first measurement day according to the manufacturer’s guidance, was not enough. This again reflects the fact that the usage and maintenance of the devices has an important role in achieving reliable results. Overall, two methodologies (FTIR and NDIR) were seen to provide good consistency across the full range of measurements, covering the engine-out exhaust studies in the laboratory and on board and also the low methane levels studied downstream of the MAC system.
The results indicate that, as it is important to have reliable methane-emission quantification, there are also several methods to be used for this quantification. Moreover, it is important to ensure good and careful maintenance and operation of the devices to secure reliable results. To measure total hydrocarbons, heated flame ionization detectors have generally been the accepted method (e.g., in ISO 8178, NOx Technical code). Based on this study, other methods as reliable as FID for methane measurement exist, and these methods can be utilized on board. This is an important finding and can also especially aid in cases where the hydrogen containing fuel gas (needed by FID) is potentially challenging to bring on board.
The measurement methods used in the current study cover many of the methods used for measuring methane from LNG engines’ exhausts. However, additional methods exist, one of those being wavelength modulation spectroscopy [
15,
18]. While reliable methane quantification is the key issue, several practical issues (like the fuel gas needed by FID, sampling and maintenance issues, as well as required calibrations) can significantly affect the choice of measurement methodology to be used on board, as well. A recent research report by SGMF [
19] also discusses these practical insights into the methods used in current study.
Sustainable future fuels are needed for maritime decarbonization. Currently, they are not yet (widely) available. LNG is a fossil fuel, but can be replaced with methane produced from bio or synthetic sources, with presumably only minor modifications needed on board existing LNG-powered vessels. Also, with these bio- and synthetic-based methane fuels, the exhaust emissions need to be controlled, and the measurement methods studied in this paper can be used with those as well.
Overall, while focusing strongly on decarbonization, it is also important to cover other aspects in addition to global warming, now and in the future. Although, environmental analysis can be challenging overall, and its complexity is increased when also considering an economic point of view (e.g., [
20]). Zero carbon emissions is not the same as zero emissions. The impact of ship-emission reductions should be maximized by considering climate, health, and environmental effects simultaneously [
1].


