1. Introduction
The maritime sector has intensified its decarbonization efforts over the past decade since the introduction of the Initial Greenhouse Gas (GHG) Strategy in 2018 by the International Maritime Organization (IMO) [
1]. The strategy has undergone revisions, the most recent of which is the 2023 IMO Strategy on Reduction of GHG Emissions from Ships, which includes a target of reaching net-zero emissions by 2050 [
2]. Meeting this target necessitates the widespread adoption of innovative strategies and practices across all shipping industry segments, including large vessels, as well as smaller ones such as ferries. While representing a relatively minor fraction of the global fleet in total tonnage, ferries play a vital role in regional transport systems, particularly in the European island and coastal regions where they serve as vital links in the transportation network [
3]. The special operational characteristics of ferries, which include fixed routes, shorter voyages, and frequent docking operations, present an opportunity to implement energy efficiency improvements on these vessels [
4].
The Baltic Sea region facilitates an array of continuous ferry traffic connecting at least ten countries along its coastline [
5,
6]. It is reported that approximately 3500 to 5000 ships navigate through the Baltic Sea per month [
7]. In addition to being the site of the most intensive shipping activity globally accounting for approximately 15% of global trade, the Baltic Sea experiences large seasonal variations ranging from a low of zero to −5 °C to a high of 15 °C to 20 °C [
7,
8]. This fluctuation in the operating environment ultimately affects the efficiency of the vessels traversing the region. Studies have highlighted that the presence of sea ice can affect the maneuverability of vessels, leading to slower speeds and higher fuel consumption [
9]. Fuel consumption tends to increase under severe weather conditions and higher cargo levels when the ship maintains constant speed [
10]. Advancements in technologies such as onboard data systems have significantly improved the capabilities for the real-time monitoring of ferry operations; however, the effective conversion of raw operational data into actionable insights that can inform and guide fuel-efficient practices and emissions reductions is still minimally explored and adopted [
11,
12].
Despite IMO’s ambitious 2050 zero carbon targets, the poor availability and high price of cleaner fuels and technologies push operators to find alternative energy efficiency measures [
13]. One such interim measure involves finding new operational strategies to reduce fuel consumption on vessels. Previous studies have discussed power management strategies for ferries as well as the potential of data-driven approaches to optimize maritime operations [
14,
15,
16,
17]. Whilst these studies have provided sufficient insight, very few of them address the nuances of energy efficiency approaches for double-ended ferries. In fact, Balestra and Schjølberg [
18] highlighted the need for differing approaches to the optimization of operations when considering the double-ended ferries. Double-ended ferries are characterized by their bidirectional travel capabilities and are most prevalent in regional maritime networks, particularly for high-frequency, short sea routes. Their unique design enables efficient operations and minimal terminal time through a specific symmetric hull form and propulsion system, allowing for equally efficient sailing ahead and astern [
19]. Double-ended ferries generally operate on fixed schedules. Their design and operational characteristics pose energy management challenges in optimizing their performance as they frequently encounter highly variable environmental conditions that directly impact their energy efficiency. Despite this, the actual performance of double-ended ferries remains under-researched [
20].
While previous studies [
21,
22] have looked into predictions of power requirements of ships, data-driven methods have emerged as key components of energy efficiency strategies. These methods rely on machine learning techniques to analyze ship energy performance [
23,
24]. It has been reported that these models are useful in predicting the power demand and energy consumption of ships [
25,
26]. Prior approaches to energy management have rarely captured the nuances of dual-propulsion configurations, where optimizing fuel consumption necessitates balancing engine loads. Existing studies have highlighted the use of regression models in predicting fuel consumption using artificial neural networks [
27]; meanwhile, others have explored machine learning and optimization algorithms, revealing their effectiveness in dynamically adjusting revolutions per minute (RPM) configurations to achieve optimal performance under varying conditions [
28,
29]. These methodologies represent a broader industry trend toward leveraging data-driven approaches for maritime energy management. Despite the technological advancements, there remains a heavy reliance on human expertise for effective energy management. Operators play a key role in interpreting system outputs and making real-time decisions that account for situational variables not fully captured by automated systems. Agand et al. [
30] outlined that earlier studies focused on the vessel’s operational performance, overlooking the operator’s perspective and environmental factors. They emphasized the lack of research on developing a systematic approach for selecting and analyzing tailored datasets.
Using data-driven methodology, this paper analyzes sensor data alongside operational characteristics and environmental conditions. This study examines a double-ended ferry operating in the Baltic Sea and demonstrates how optimizing propulsion loads combined with strategic operator decisions can reduce fuel consumption and lower GHG emissions. Although this case study is specific to the Baltic Sea region, the findings and methods are broadly applicable to the wider maritime industry, offering valuable recommendations for ferry operators and policymakers. This study is centered on the following two research questions:
- (1)
How can ferry operators effectively utilize operational and environmental data to reduce fuel consumption and emissions without compromising performance?
- (2)
In what ways do operator decisions and seasonal variations impact propulsion efficiency in double-ended ferries?
Understanding the dynamics of ferry operations requires addressing these critical questions, as they uncover actionable strategies for enhancing sustainability performance.
This study offers suggestive findings on how to minimize fuel consumption on ships but acknowledges some important limitations. The regression models were developed for a specific route in Estonia and may not be entirely applicable to other geographical areas with differing environmental conditions. Future research could expand the analysis to include diesel fuel consumption as well as other fuel types and explore the impacts of various propulsion systems. Additionally, the quantitative nature of the regression models does not account for all factors influencing fuel consumption. Other studies could incorporate other operational parameters including crew behavior, scheduled maintenance, and hull integrity as these have been known to impact vessel efficiency. Furthermore, while seasonal adjustments took into account the effects of the winter months, more detailed data on ice conditions, sea state, and wind patterns could enhance the models’ precision.
This research provides two main contributions. First, it shows that real-time monitoring combined with data-driven propulsion load strategies can reduce fuel consumption. Second, it emphasizes the need for an even split in using the fore and aft engines for optimal efficiency in double-ended ferries. These findings assist ferry operators and guide primary research geared towards modifying operational goals to increase fuel savings and achieve sustainability in maritime shipping.
This paper is structured as follows:
Section 2 outlines the data sources used in this study and the methodological framework, which includes the application of regression models, wind influence corrections, and seasonal performance adjustments to assess the variability in operational conditions. In
Section 3, the data analysis demonstrates that balanced propulsion loads and informed operator decisions result in reduced fuel consumption.
Section 4 interprets the findings, while
Section 5 details the study’s conclusion, summarizes the key insights, and offers practical recommendations for ferry operators and suggestions for future research.
2. Data and Methodology
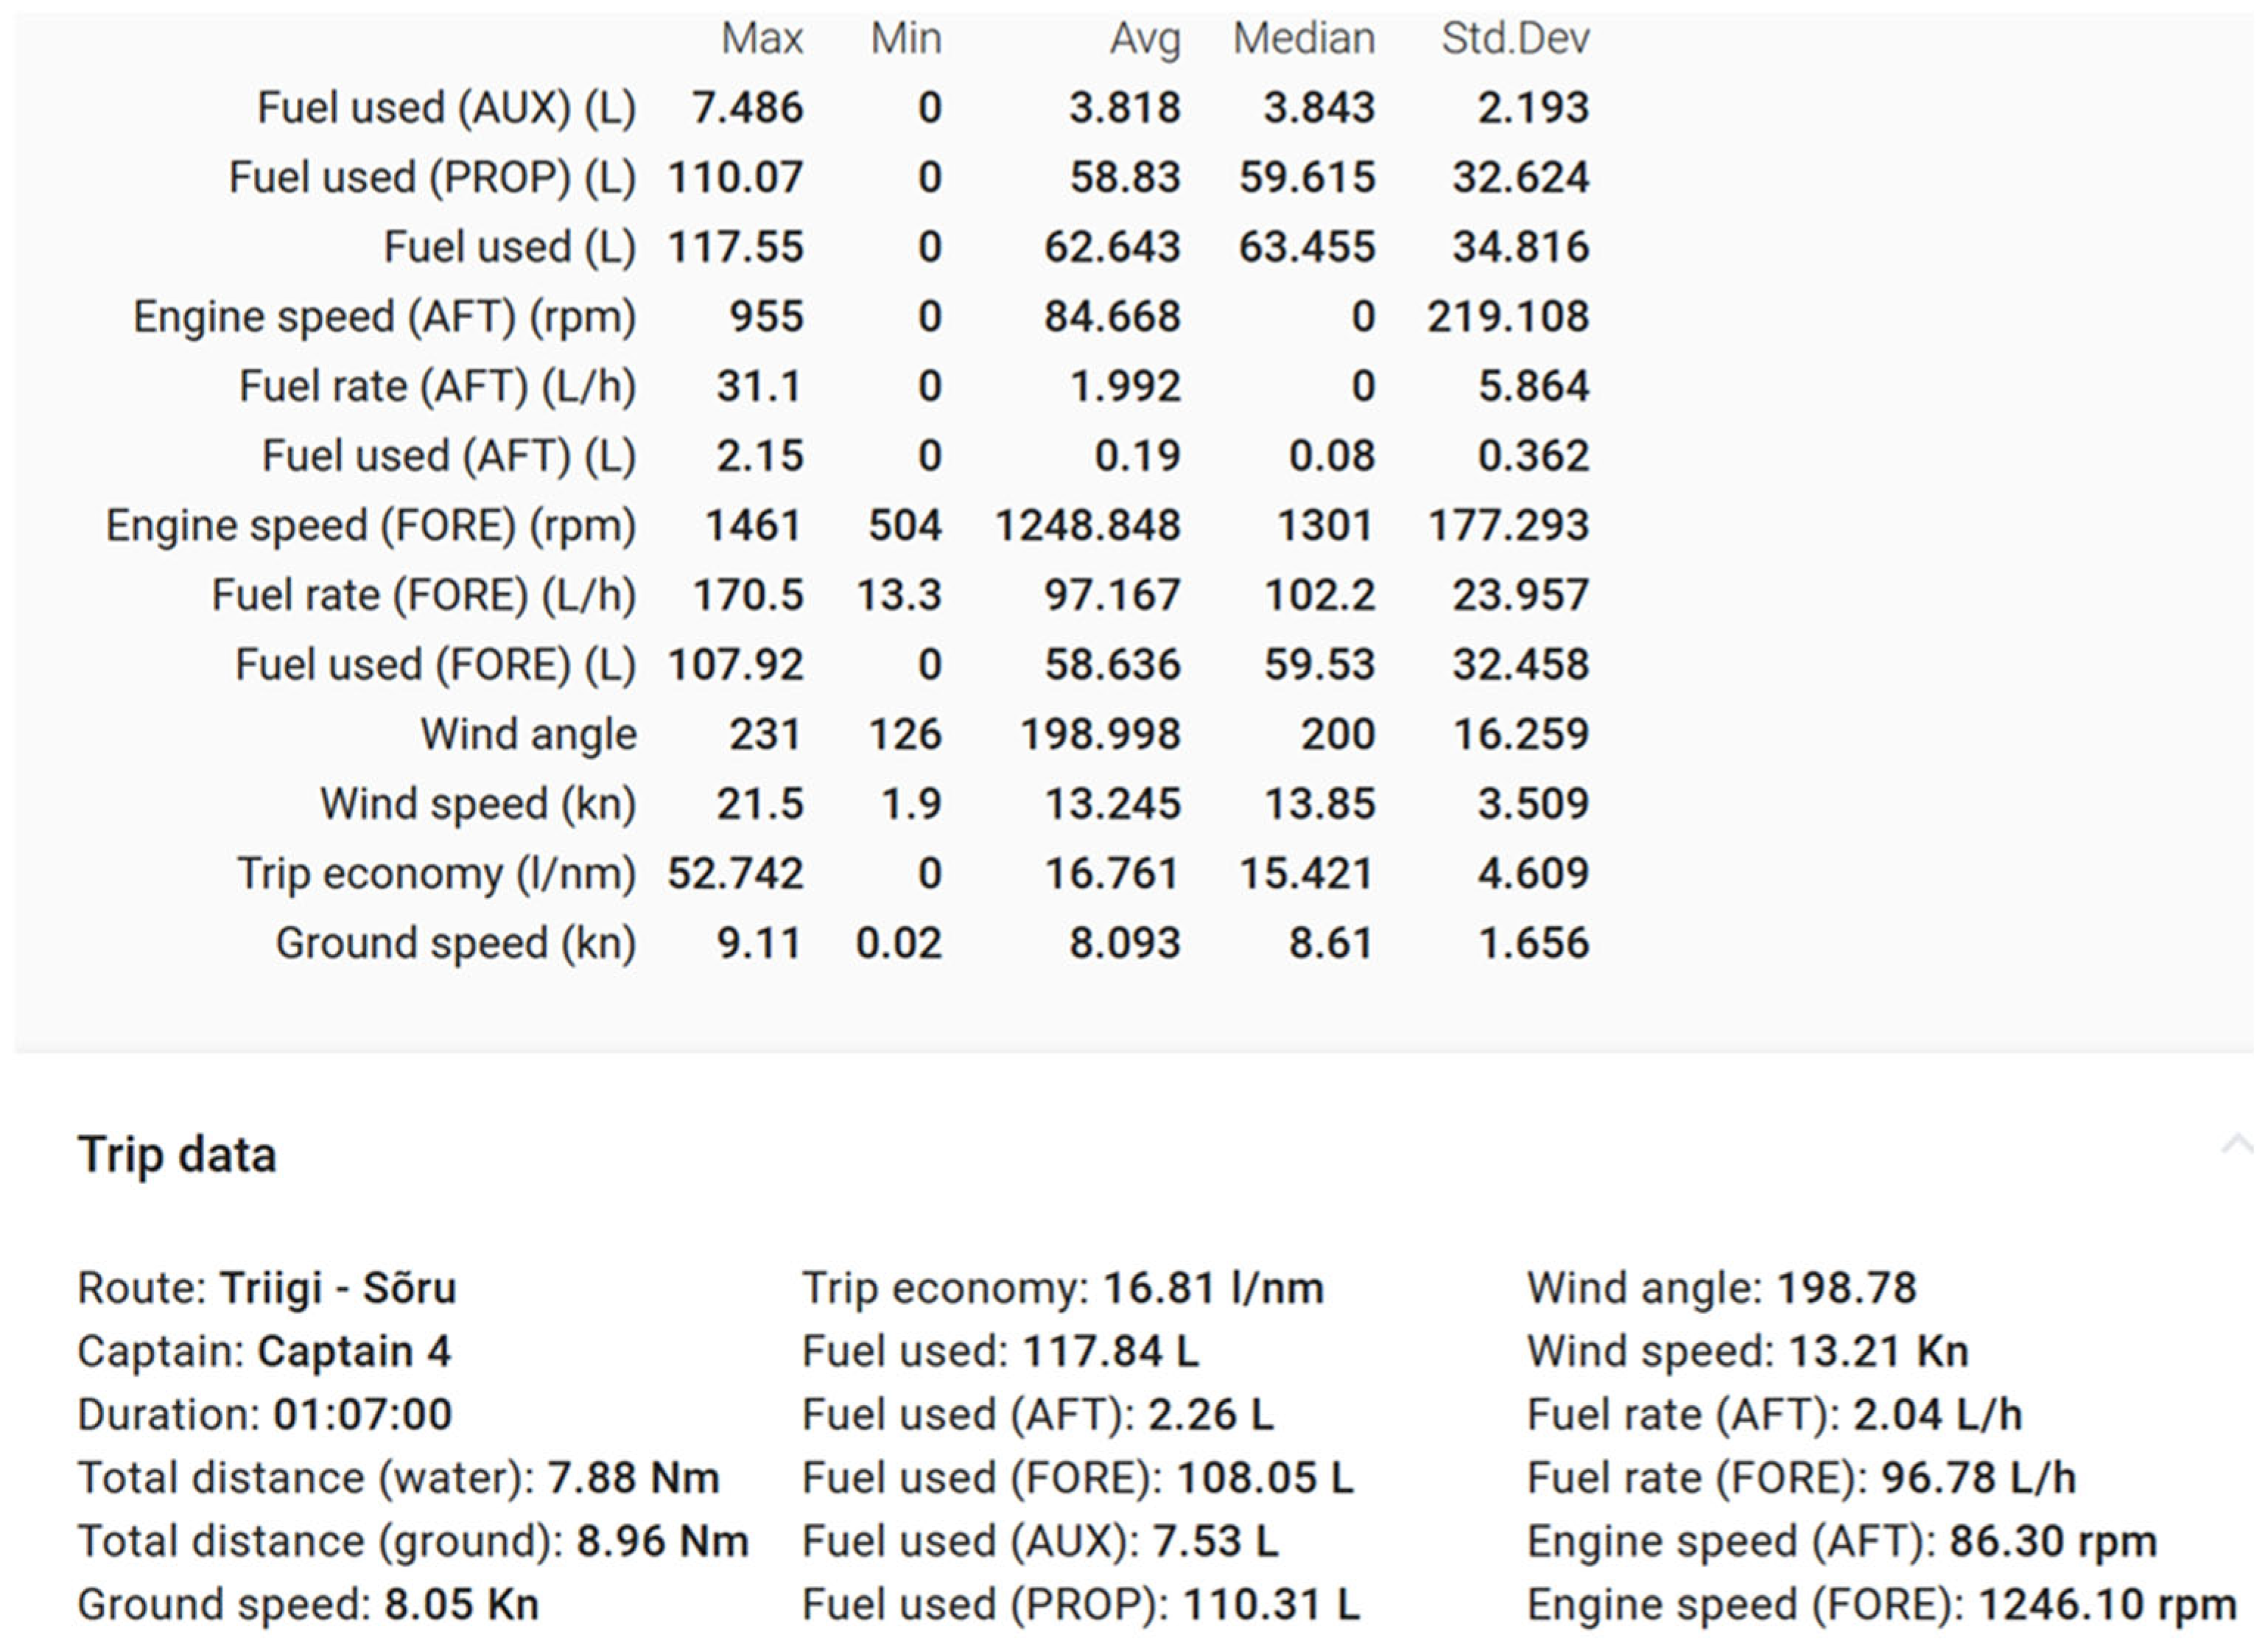
Data for this study were obtained from the Vessmon (v. 300-05.000.01) Energy Monitoring System (EMS) data from the double-ended ferry MV Soela. This system was developed and installed by the Estonian shipbuilder Baltic Workboats (Nasva Harbor, Saaremaa, Estonia). The platform is integrated, collecting and analyzing real-time data (see
Figure 1) using multiple variables and inputs. It monitors fuel flow, engine load, and environmental conditions to compile and assess high-resolution energy usage profiles for each subsystem. Additionally, performance alerts are recorded to improve the system’s analysis.
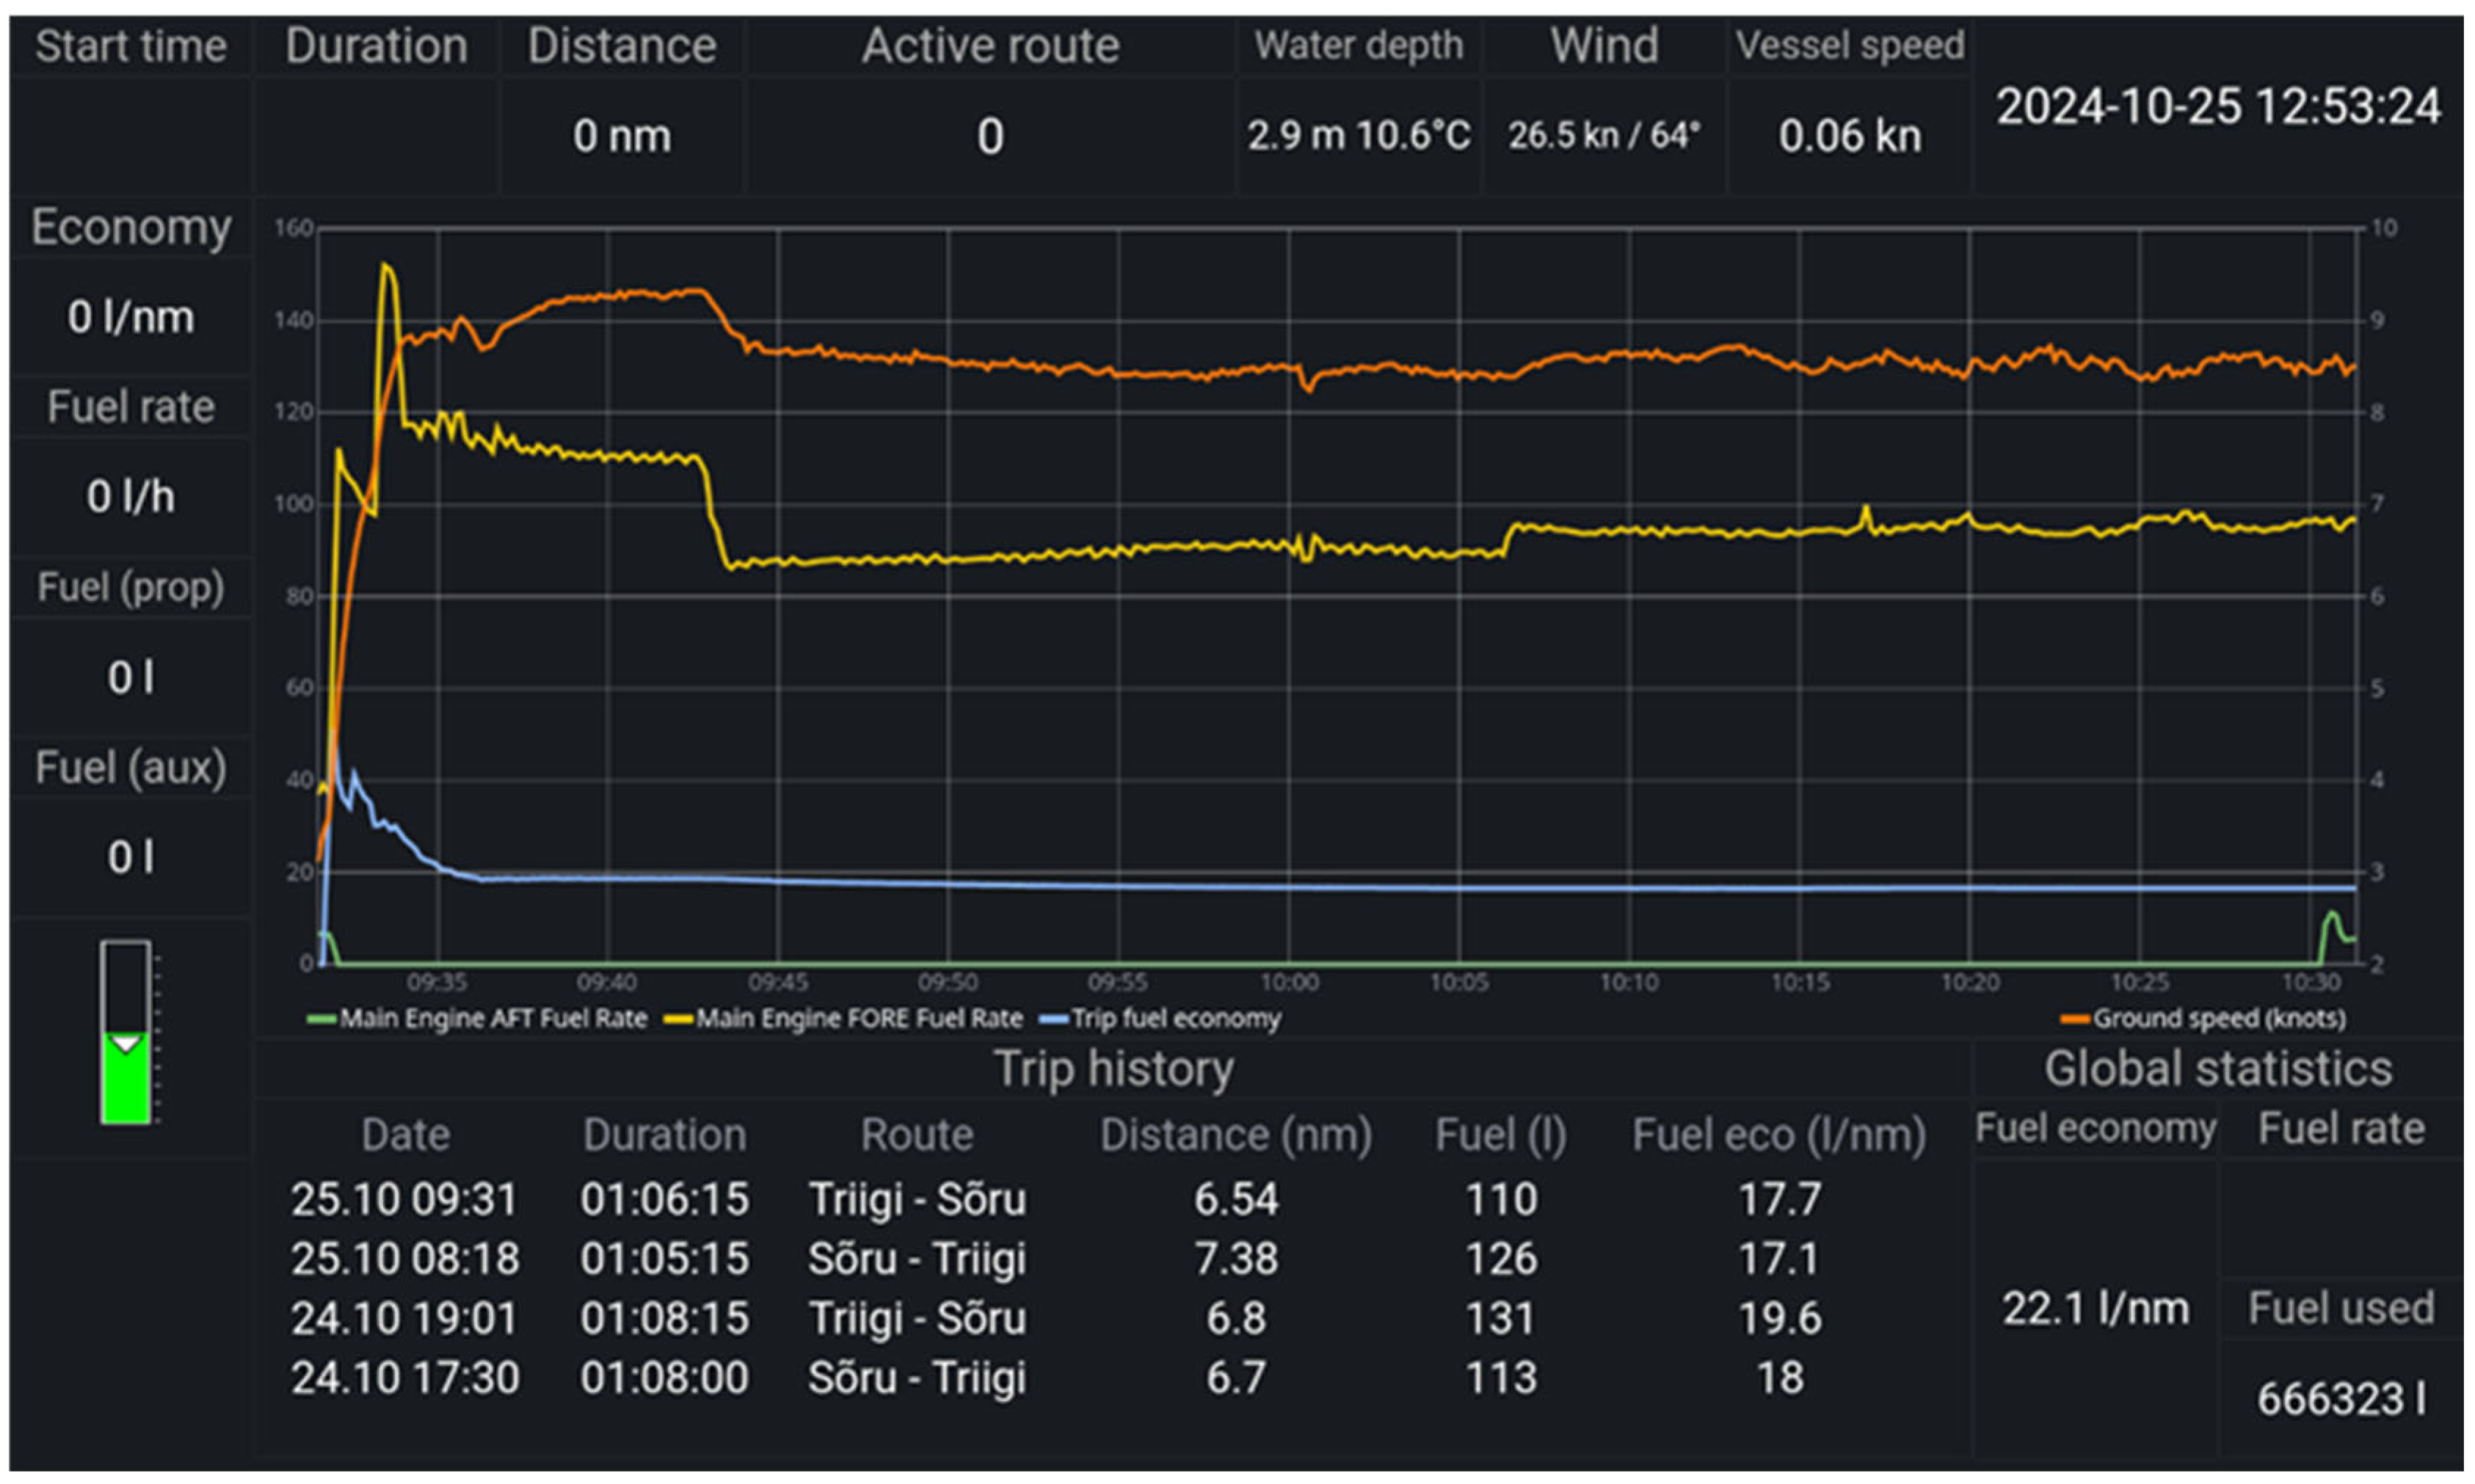
The system interface is accessible both on board (see
Figure 2) and on shore and uses predictive algorithms for optimizing the vessel’s speed, path, and use of equipment to enhance fuel efficiency. Other elements, such as trip data over past periods and comparisons across the fleet, also provide for further strategic planning and decision-making.
This vessel, detailed in
Table 1, operates a nine nautical mile (NM) route in the Baltic Sea between the Estonian islands of Hiiuma (Sõru Harbor) and Saaremaa (Triigi Harbor). The data, which include fuel consumption, engine load (both AFT and FORE), the distance travelled, speed, and wind conditions, were collected between June 2022 and September 2024. The selected route for comparison was Sõru to Triigi, chosen to assess the impact of wind on fuel consumption. Reversing the route would alter the wind effects, complicating the comparison. The ferry is operated by four different captains, who work in two-captain shifts for two weeks each, ensuring continuous and varied operational data. This operational structure provides a range of practices that can be analyzed to study the effects of human factors on fuel efficiency [
31].
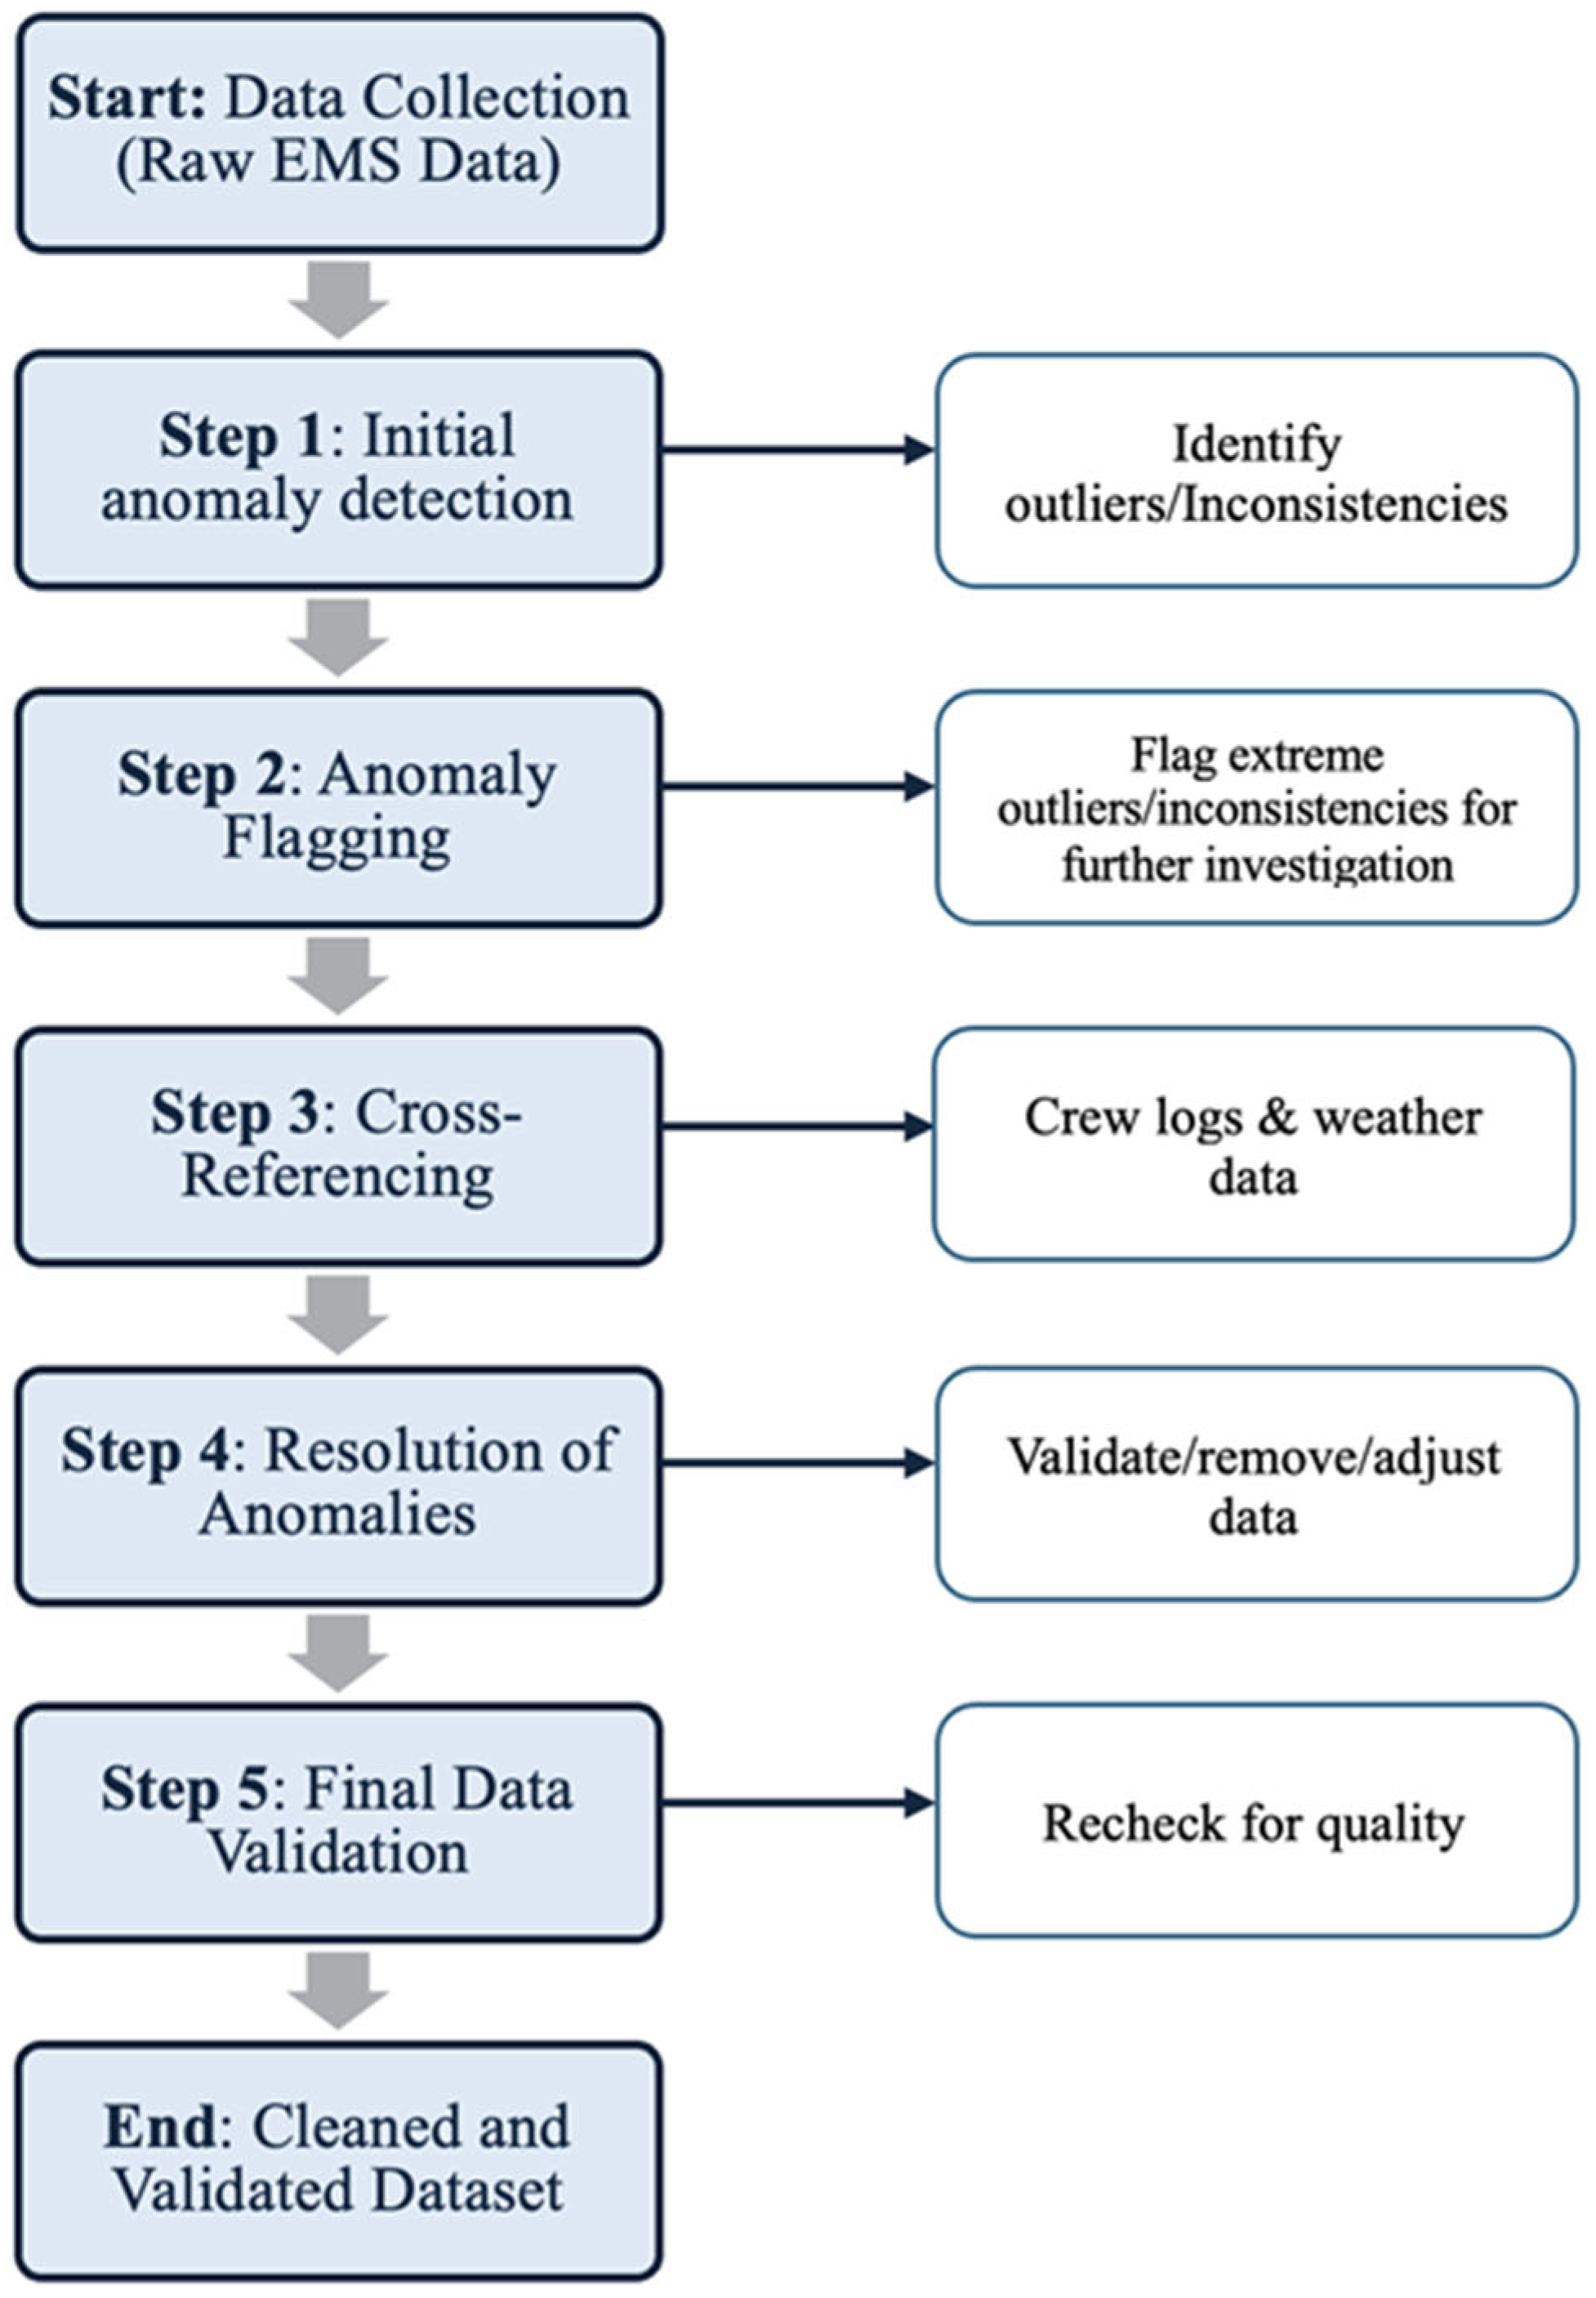
To ensure accuracy of the data, these data first underwent a validation process as shown in
Figure 3. Outliers were detected and removed, and inconsistencies in vessel speed and fuel consumption were flagged. After flagging the outliers and inconsistencies, the remaining dataset was then compared to manual crew logs and weather data to verify variables such as wind speed and directions, and environmental conditions. This is an important step when working with large maritime datasets [
32]. Following the cross-referencing of data, anomalies were resolved through a systematic process of data removal, correction, and verification. Inconsistencies in vessel performance metrics were adjusted, and wind and environmental data were aligned with recorded observations. Additionally, discrepancies in timestamps and sensor readings were corrected to maintain consistency across all data points. The dataset was then rechecked for correctness before resulting in a cleaned and validated dataset for detailed analysis.
To handle missing or incomplete data, we used an interpolation method which involves predicting the values of missing point from the trends observed in the dataset. Through this method, we preserved the continuity of the dataset so that our analysis could accurately capture as close as possible to actual scenarios. We explored the relationship between wind conditions and fuel consumption by performing regression analysis. Regression models serve as powerful tools for exploring and quantifying relationships between variables and examine the effects of one or more explanatory variables on another, such as in the case of fuel consumption and its relationship with other factors like distance travelled [
23].
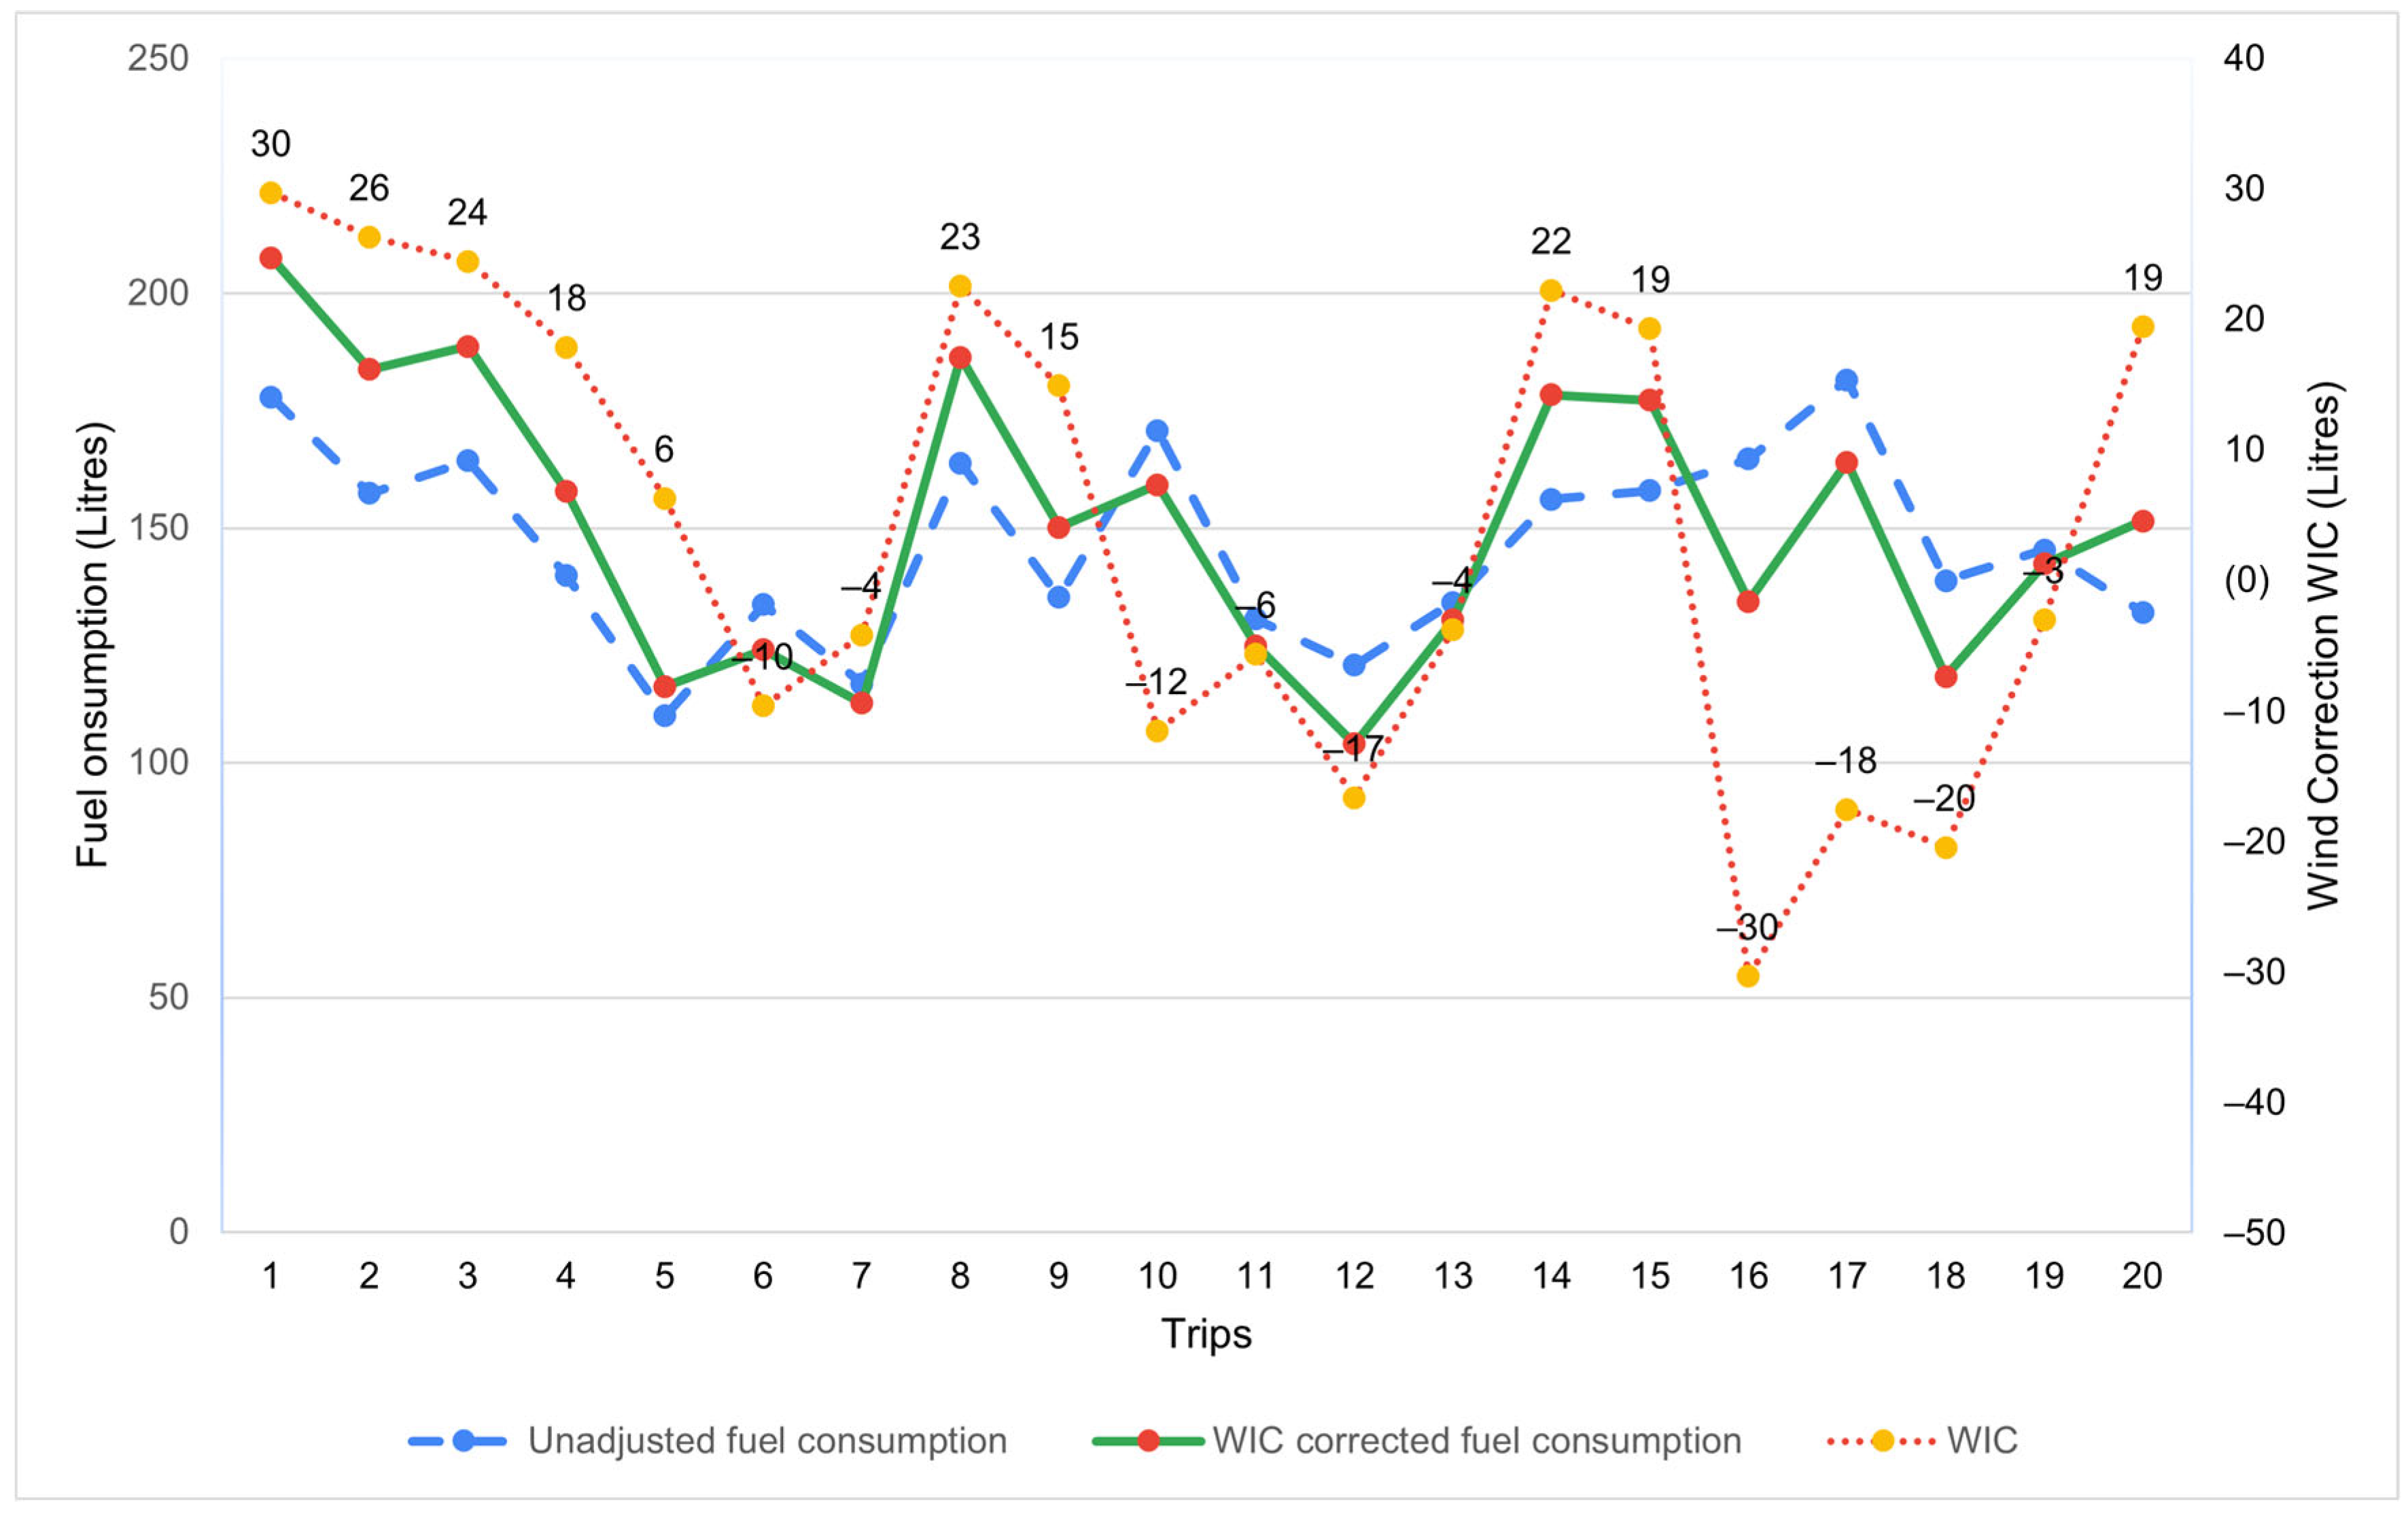
Within this study, the regression model incorporated variables such as wind speed and direction, operational practices, and engine load to provide a more detailed analysis of factors influencing fuel consumption. We developed two regression models to allow for a more in-depth analysis. First, an unadjusted model, referring to straightforward fuel consumption without comparisons to wind conditions; and second, a corrected model, with comparisons to wind speed, angle and direction. This second model required an assessment of as many factors that may affect fuel consumption as possible. The corrected model showed that there was some variation in the fuel consumption adjustments as seen in
Figure 4. For example, in headwind conditions, the corrected consumption values were higher by as much as 30 L. Alternatively, when tail winds were used, the corrected values were lower by as much as 30 L. Nevertheless, when it came to the general impact of the correction on the dataset, the impact was rather faint. The average fuel consumption of the dataset was lower by 1.62% from 140.6 L to 138.4 L.
Wind Influence Correction
Wind conditions significantly affect a ship’s operational efficiency. To understand impacts on fuel consumption we developed a wind influence coefficient (WIC), defined as: WIC = cos(θ)⋅WS, where theta represents the angle between wind direction and the ship’s course and WS is wind speed in knots. The use of the cosine function enables a more precise assessment of wind direction effects on ship propulsion. Typically, headwinds correspond to an angle of 130 degrees, while tailwinds are associated with 310 degrees. The WIC serves as a parameter which evaluates wind impact on fuel consumption based on wind speed and direction. Specifically, the cosine function accounts for wind directional effects: cos (130°) produces a negative value, indicating increased resistance and a fuel penalty during headwind conditions, whereas cos (310°) yields a positive value, reflecting reduced resistance and fuel savings in tailwind conditions.
The corrected fuel consumption (CFC) is derived from the initial fuel consumption (FC) by incorporating the WIC, represented as follows: CFC = FC + k⋅WIC. In this equation, FC represents the baseline fuel consumption for the voyage, while k is the scaling factor that determines the sensitivity of fuel consumption to the wind influence coefficient. Although k can be adjusted based on vessel-specific performance data, for this analysis, it is set to 1, assuming a direct proportionality between WIC and its impact on fuel consumption. Adjustments to k can be made based on vessel-specific performance data [
33]. This methodology enhances the evaluation of maritime fuel efficiency by isolating the effects of wind conditions, allowing for the analysis of fuel consumption trends independent of external wind influences resulting in a clearer assessment of operational parameters.
3. Results
Both regression models (
Table 2 and
Table 3) resulted in relatively similar outcomes (using linear regression as non-linear regression did not perform well). Generally, using the rear engine (AFT) will increase lower co-efficient diesel fuel consumption compared to the front engine (FORE)—these are both highly statistically significant. The ratio between AFT and FORE is also similarly statistically significant, and it reveals that if the front engine is not used at all (or on a very minor scale), and the power weight is essentially only on the rear engine, then consumption will increase. The regression model also argues that usage of the front engine consumes more diesel fuel (compared to the rear), the vessel needs to apply some reasonable area of power for the front engine and not remove from it too significant a quantity of overall power.
3.1. Seasonal Adjustments (Winter Effect)
Regression models were able to forecast 45.8% (see
Table 2 and R
2) and 43.7% (see
Table 3 and R
2) out of the diesel fuel consumption with data consisting of all seasons of the year (from June 2022 to September 2024). In
Table 2, the explanation power of the three variables are reduced somewhat, even if weather conditions are better considered. The data are from the Estonian route, located in Northern Europe, where winter is expected to occur with snow, ice, and low temperatures (especially in January and February) every year. The seabed occasionally freezes, and vessels operating in sea ice conditions require high power usage from both engines.
Based on the data, we identified December, January, and February as winter months (higher than average diesel fuel consumption compared to other months), and these were assigned with number one (1) as the rest of the months in the data were marked with zero (season is a binary variable, 0 or 1). As
Table 4 and
Table 5 illustrate, enlarged regression models show increased explanation power (R
2) close to 50% or above. Adding winter months as a variable to the model is also justified as its statistical significance is very high. Winter months increase diesel fuel consumption per journey by 35–36 L. Other regressors have a similar order of importance in coefficients, and all have very high statistical significance. Incorporating the winter months appears to reduce these coefficients, but only minimally.
3.2. Identifying Optimal Engine Speed Combinations
This study evaluates the improvement in the fuel economy of dual engine vessels that operate over a range of engine speeds. In the process of identifying the optimal RPMs that would result in the lowest fuel consumption, the impacts of AFT and FORE engine speeds on fuel use were assessed. The approach integrates statistical analysis and data visualization to derive meaningful findings. The dataset consists of vessel operational data including AFT RPM, FORE RPM, and fuel consumption in liters.
To quantify the impact of RPM on fuel consumption, multiple linear regression (MLR) was employed. MLR is a statistical technique that models the relationship between multiple independent variables and a single dependent variable by fitting a linear equation. In this analysis, MLR was used to examine how variations in AFT and FORE RPM influence fuel consumption, providing a quantitative assessment of their effects.
The regression equation is formulated as follows:
where
β0 is the intercept;
β1 and β2 are the regression coefficients for AFT and FORE RPM, respectively;
ϵ represents the residual error.
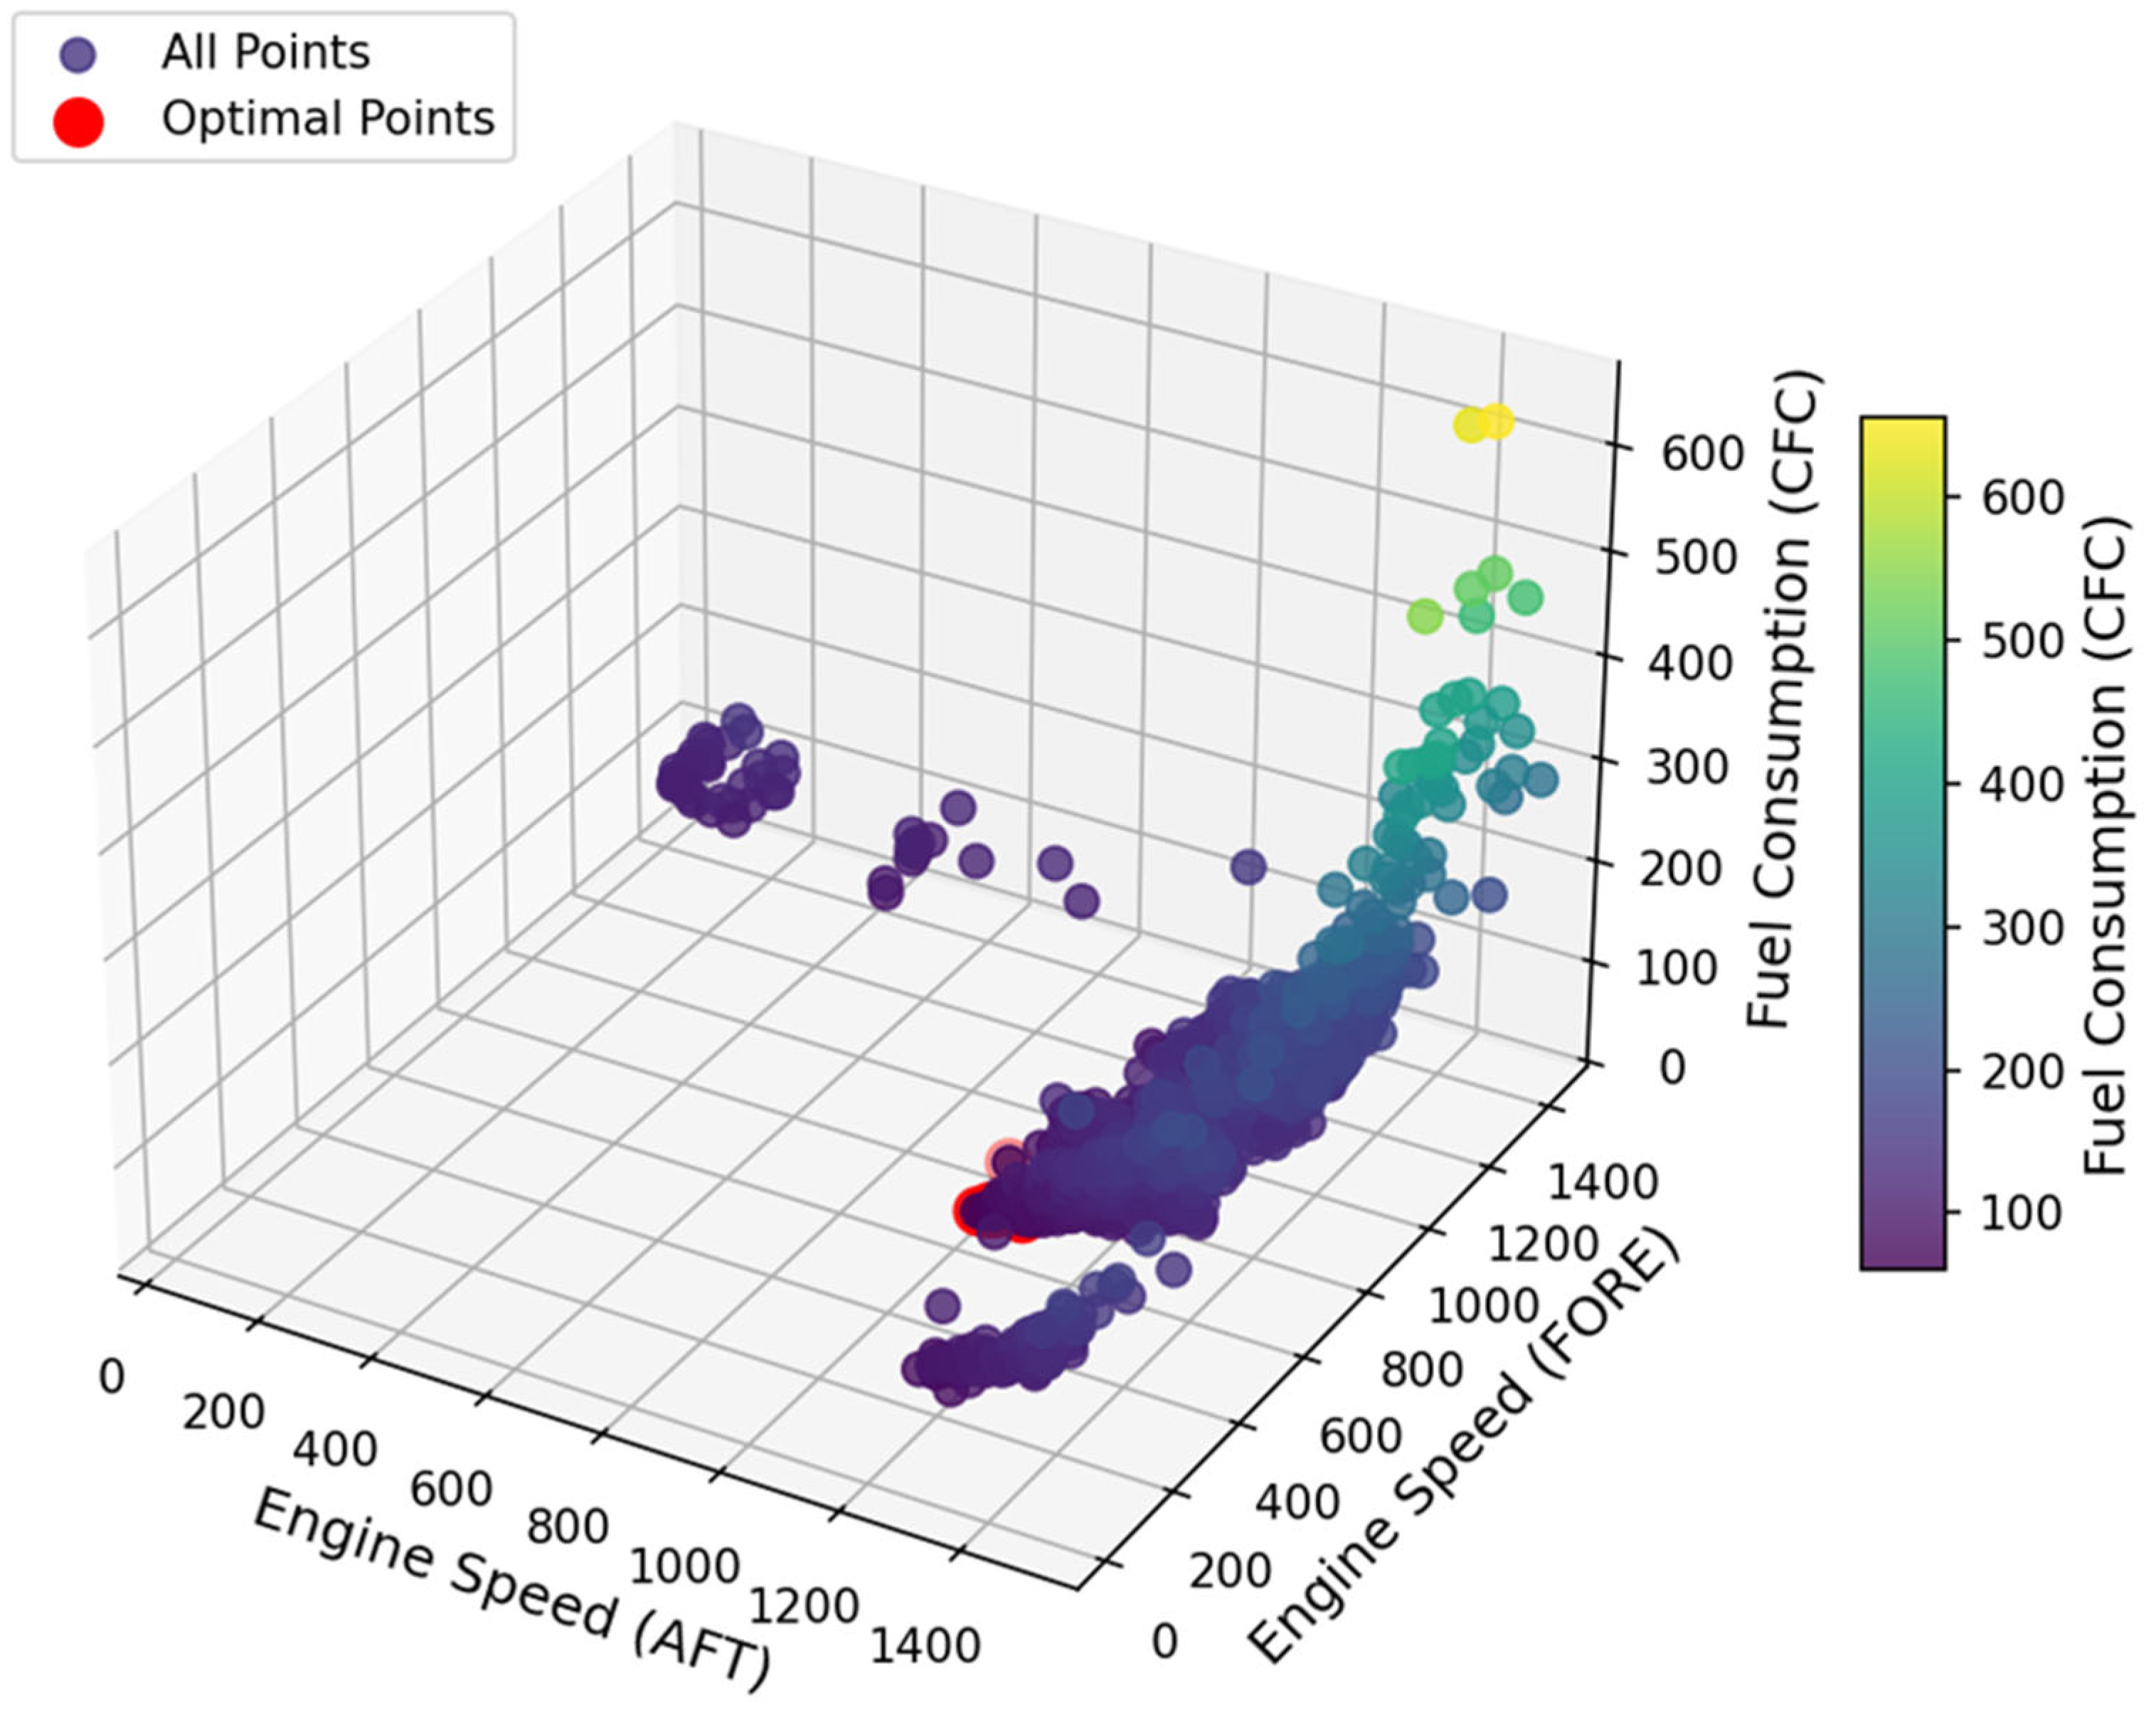
This approach is in line with the methodologies applied in maritime studies to predict fuel consumption as a function of operational parameters. Percentile-based filtering was used to determine engine speed combinations that are linked with percentiles of fuel consumption lower than or equal to 0.10. The most fuel-efficient operations were identified at the 10th percentile of fuel consumption data. This subset highlights the optimal AFT and FORE RPM combinations that contribute minimal fuel usage. To visualize these relationships, a 3D scatter plot was generated using Python 3.13, illustrating the interaction between AFT engine speed, FORE engine speed, and fuel consumption. In
Figure 5, the AFT RPM (
X-axis), FORE RPM (
Y-axis), and fuel consumption (
Z-axis) are depicted through the plotted data points. Data points are color-coded based on fuel consumption levels, with the most efficient operating conditions distinctly highlighted for clarity.
The color gradient (see
Figure 5) (from purple to yellow) indicates fuel consumption levels, with purple representing lower fuel consumption and yellow representing higher fuel consumption.
3.3. Optimal Cluster
The highlighted red points represent the most fuel-efficient operation ranges where fuel consumption is at its lowest. These points correspond to specific AFT and FORE engine speed ratios that minimize fuel usage. The red points are positioned in the lower section of the Z-axis and form a cluster, indicating that the optimal fuel consumption is achieved at moderate engine speed levels for both the AFT and FORE engines. This clustering provides valuable insights for operators to identify the ideal RPM ranges that enhance fuel efficiency. In contrast, the yellow points, which represent higher fuel consumption, are positioned further along the Z-axis, illustrating that increased RPMs result in higher fuel consumption. The non-optimal zones can be avoided during regular vessel operations to improve fuel economy. This visualization technique enables the identification of optimal engine speed ratios and is commonly used in maritime research. To facilitate data analysis and visualization, the following libraries were employed:
pandas (v.2.2.3) for data manipulation;
NumPy (v.2.1.3) for numerical computations;
Matplotlib (v.3.9.3) for plotting.
3.4. Trend
The relationship between engine speeds and fuel consumption is non-linear. At lower and moderate engine speeds, fuel consumption remains relatively stable, but at higher engine speeds, it increases at a higher rate, indicating reduced efficiency. The results highlight specific AFT and FORE engine speed settings that yield the lowest fuel consumption. The 3D scatter plot effectively visualizes these optimal ranges, providing insights that can inform operational adjustments to enhance fuel efficiency. As shown in
Figure 5, it is evident that reducing AFT RPM while increasing FORE RPM does not always lower fuel consumption. In fact, excessive increases in FORE RPM lead to higher fuel usage due to its impact on overall fuel burn. On the other hand, significantly lowering the FORE RPM while over-relying on the AFT engine is also inefficient. This suggests that both engines should be operated in a moderate range, with the AFT set slightly higher than the FORE. This configuration balances both engines within a more optimal operating range.
Table 6 presents the ten most optimal FORE-AFT RPM combinations.
This approach provides a comprehensive method for enhancing fuel efficiency by optimizing vessel engine operations through the use of multiple linear regression analysis and enhanced visualization techniques.
4. Discussion
The regression analyses conducted in this study provide valuable insights into the key factors influencing fuel consumption in short sea shipping, with a particular focus on engine design, operational parameters, and environmental factors such as wind and seasonal variations. The regression models consistently demonstrated that fuel consumption is closely linked to the choice of operating the AFT or FORE engine. Notably, the findings indicate that using the AFT engine results in relatively lower fuel consumption as compared to the FORE engine and this difference is statistically significant. Further, the relationship between the two engines revealed that reducing or completely shutting down the FORE engine results in a slight increase in overall fuel consumption, emphasizing the importance of maintaining a balanced power distribution between the two engines.
An important aspect of this study is the evaluation of engine load management, and particularly, the most optimal usage of the AFT and FORE engines in hybrid systems. The findings indicate that effectively managing both engines simultaneously, and ensuring proper load distribution, significantly reduces the fuel consumption. The results suggest that vessel operators avoid shutting off the FORE engine, as doing so negatively impacts fuel efficiency. To enhance the regression models, an additional variable was introduced to account for winter months (December to February), improving model accuracy, and capturing the seasonal effects on fuel consumption. This indicates the impact of factors on fuel consumption trends. Adverse weather conditions, including high winds and low temperatures, have been seen to increase resistance and propulsion demands, and therefore fuel consumption [
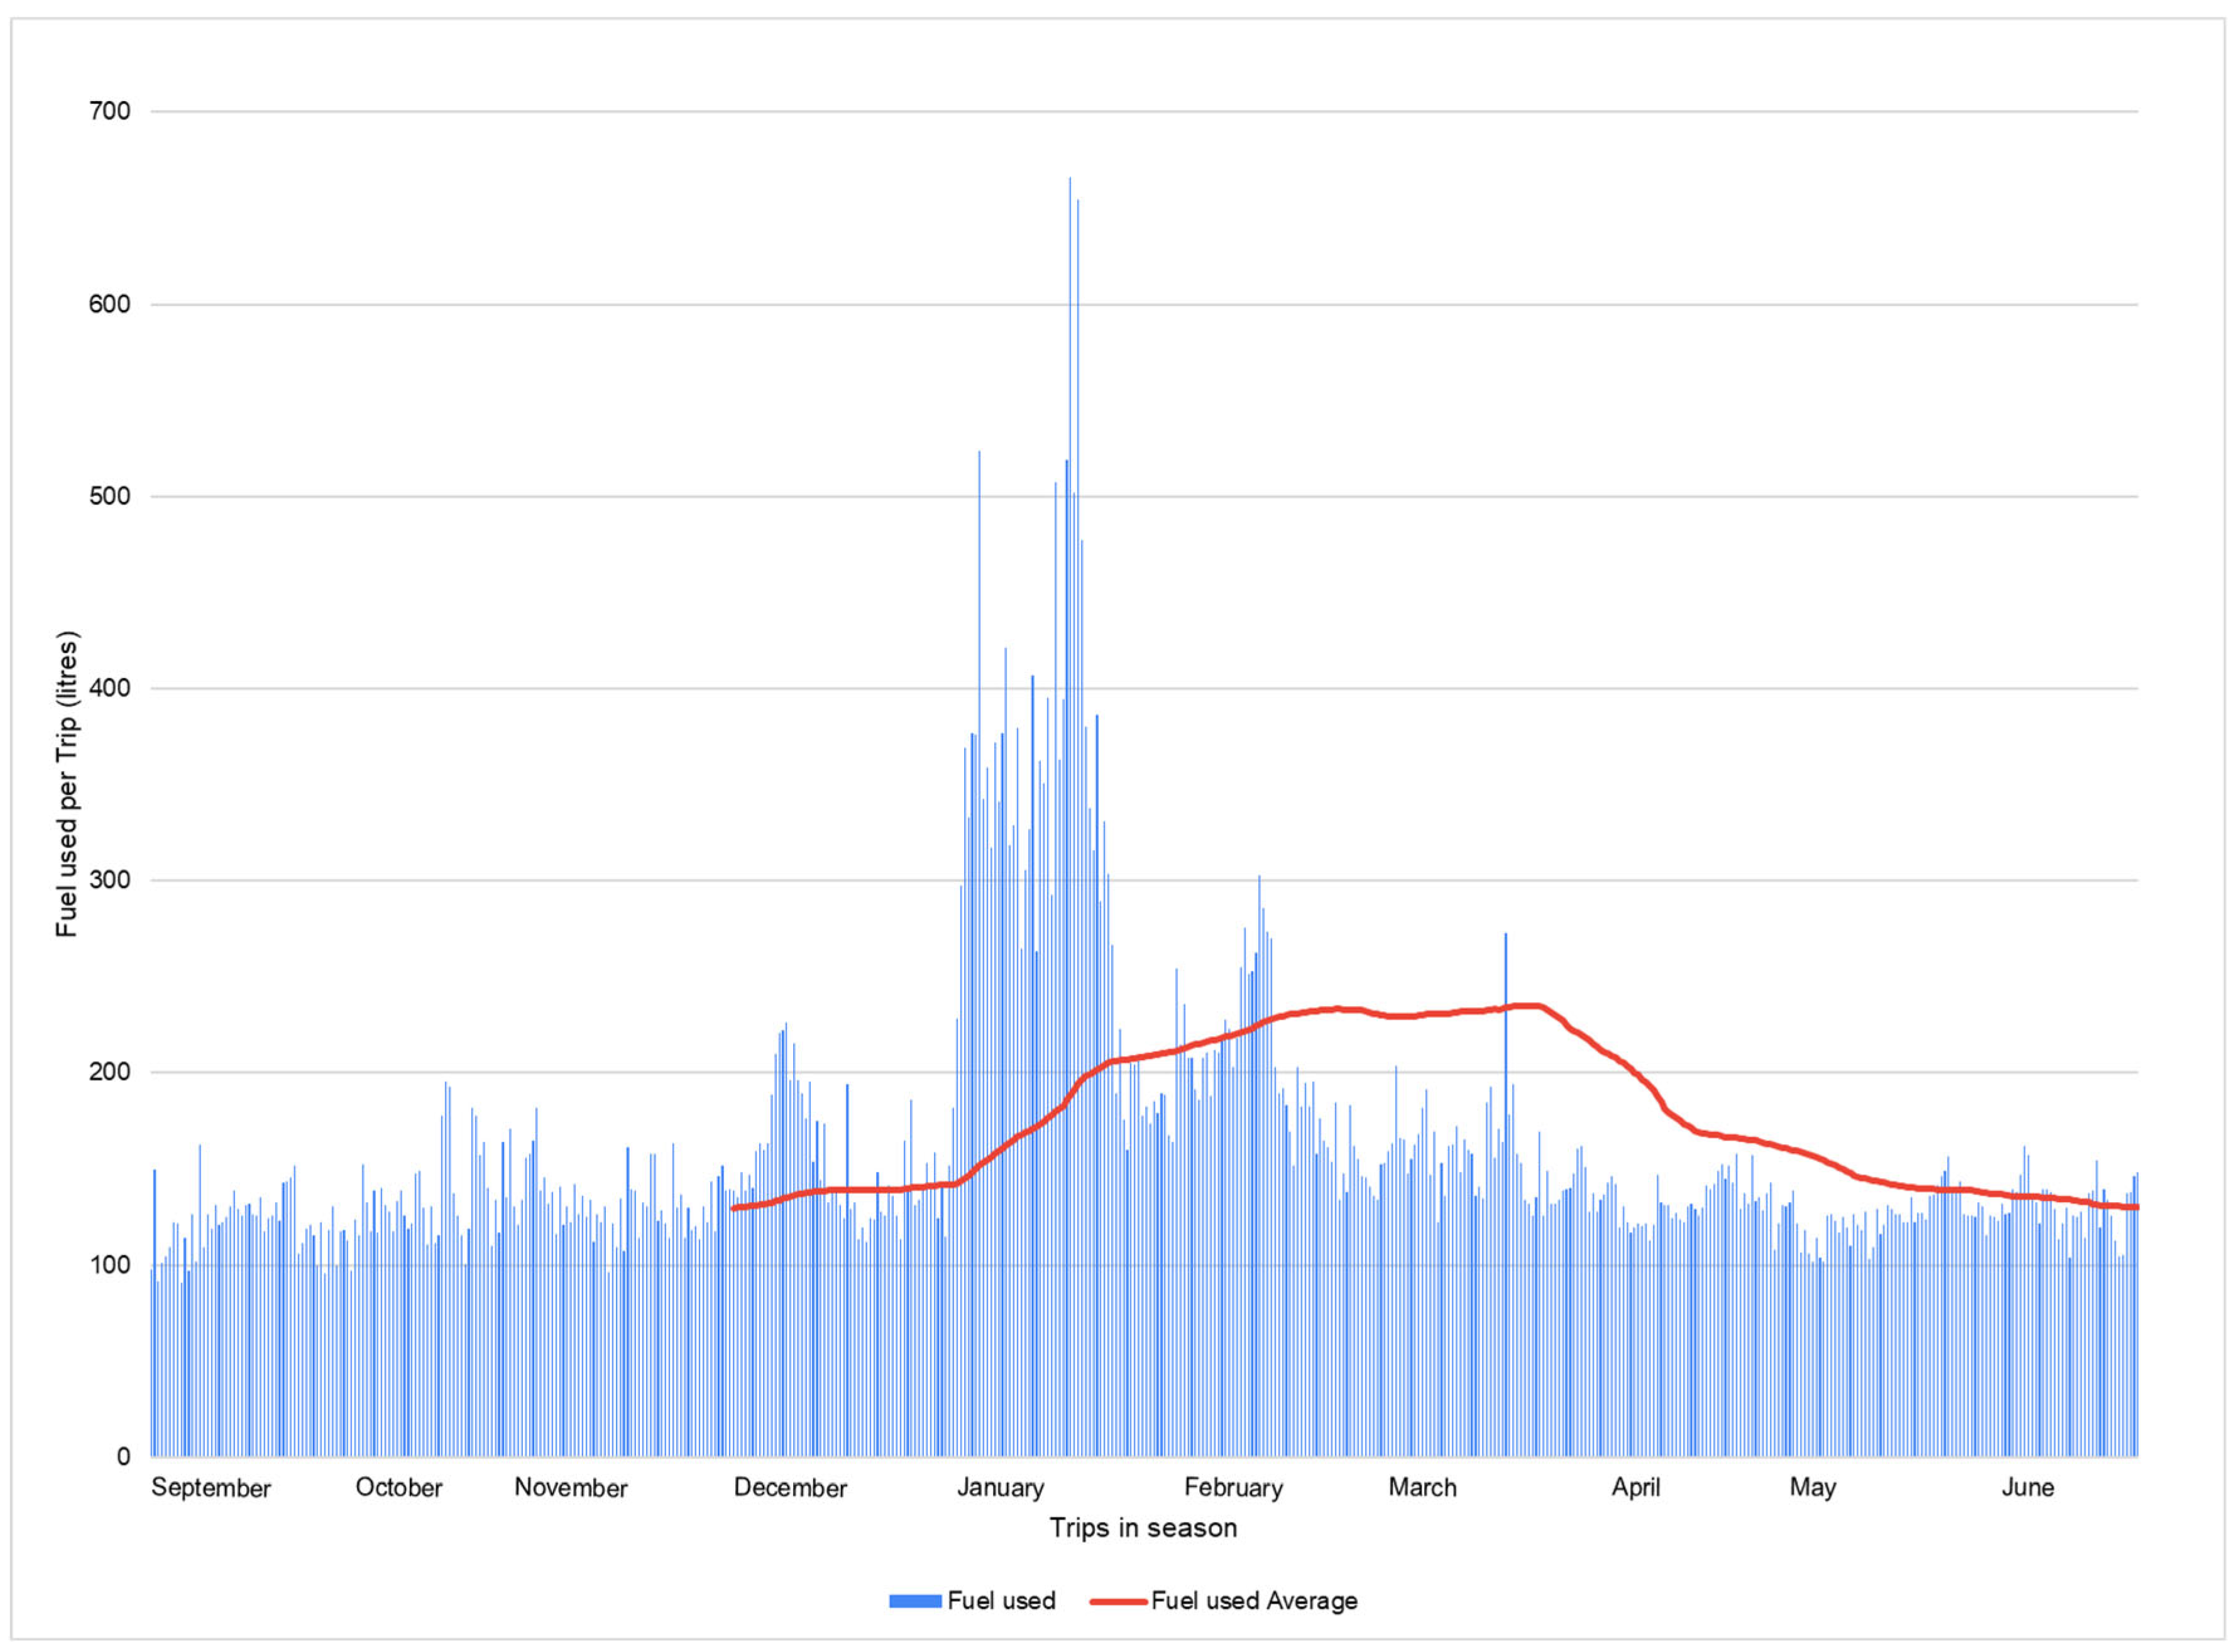
10]. In comparison to the results illustrated in
Figure 6, where seasonal consumption seems to be greater in winter, our linear regression analyses (refer to
Table 4 and
Table 5) suggest that the average difference is only around 35 to 36 L more fuel utilized per trip in freezing settings. This “winter penalty” while insignificant is understated, highlighting the fact that working under low temperature conditions requires extra energy.
It is important to note that while incorporating winter conditions enhanced the dataset’s explanatory power, the overall impact on fuel consumption across the sample remained relatively minor. Although winter weather affects efficiency to some extent, it does not significantly alter overall fuel consumption trends. This suggests that while seasonal variations are important for operational planning, they may not require major adjustments to fuel consumption strategies.
One of the key contributions of this study is the identification of optimal engine speed combinations that minimize fuel consumption. Through a linear regression analysis, certain configurations of AFT and FORE engine speeds were linked to variations in fuel usage. The 3D scatter plots (
Figure 5) visually depict the relationship between AFT RPM and FORE RPM, and fuel consumption, while higher RPMs lead to excessive fuel usage. These findings align with previous research on fuel efficiency, which often highlights the non-linear relationship between engine speeds and fuel consumption.
Table 6 presents the most effective AFT and FORE RPM combinations for fuel optimization. Based on these findings, vessel operators can alter engine speeds to enhance fuel efficiency, lower operational costs, and reduce environmental impact. This study suggests that the frequent use of the FORE engine leads to increased fuel consumption, making it more advantageous to limit its use when possible. However, the optimal strategy is not to over-rely on either engine but to operate both in a balanced manner.
Figure 5 highlights specific RPM ranges where fuel consumption is minimized, offering clear guidance for operators on propulsion adjustments. Notably, the findings align with Al-Falahi et al. [
15] who emphasized that optimizing engine performance will support fuel efficiency. In addition, the identification of specific RPMs that are linked with lower fuel consumption gives practical advice for ferry operators. In this way, with such data-driven approaches, operators can improve the operational efficiencies and decrease the environmental impacts that are relevant to the increased regulatory pressures on emissions. Additionally, the research underscores the importance of combining technical optimizations with crew training to maximize fuel savings.
Optimized engine use in maritime transportation presents unique challenges. Stoumpos et al. [
34] concluded that advanced knowledge of engine functionality is essential for efficiency improvements. This study further clarifies the complexity highlighting that reducing reliance on one engine may initially appear beneficial but can introduce inefficiencies that increase fuel consumption. These insights underscore the need for more advanced engine management systems. Furthermore, the integration of modern technologies like machine learning and big data analytics can enhance the operational efficiency of the vessel. Machine learning techniques, in particular, could be applied to real-time fuel consumption forecasting, providing critical decision support for maritime operations [
35].
5. Conclusions
This study applies regression modelling to study how fuel consumption is affected by certain operational and environmental characteristics of a double-ended ferry in Estonia. The findings of this study agree with the idea that engine configuration, operational strategies, and environmental conditions are critical in determining fuel efficiency. Finding the best combinations of engine speeds is helpful in terms of practicality to the marine operators and aids in making sustainable marine transportation. Furthermore, applying seasonal modifications increases the accuracy of the fuel consumption estimates of specific regions, especially in the colder areas.
This study builds on previous works [
10,
36,
37] and shows that incorporating operational data with wind corrections, seasonal shifts, and human adjustments improves the energy efficiency of double-ended ferry operations in terms of GHG emissions. The findings of this study can serve as a useful reference for operator training, route planning, and fleet management to identify the ideal RPM settings and to consider the ship state and importance of balanced propulsion. This study agrees with previous works which have noted that wind corrections, seasonal components, and proper engine loading are factors to be considered for maximizing the energy efficiency of double-ended ferry operations. Our regression analyses also supported previous findings that winter conditions raise average fuel consumption by approximately 35–36 L per trip. Although the general change is small, winds can change consumption as much as ±35 L.
The core contribution of this research lies in the detailed analysis of engine load combinations, examined through ordinary regression and the 10th percentile approach. The findings indicate that reducing the use of the FORE engine can actually lead to an overall increase in fuel consumption. Consequently, the most effective strategy is to maintain a balanced operation of both AFT and FORE engines. These results align with existing theories on energy management, reinforcing current human-centered approaches while introducing new, actionable methods for adjusting propulsion based on specific environmental conditions. Rather than contradicting established principles, this study provides data-driven insights that enhance operational decision-making.
Future research could explore the impact of incorporating additional parameters into efficiency projections, potentially refining fuel optimization strategies. Additionally, studies could examine how incentives and crew training programs influence adherence to fuel-efficient operational practices. Such initiatives will become increasingly relevant in the context of regulatory compliance and sustainability, particularly as the maritime industry moves toward decarbonization.


 ,
, 


