Abstract
Understanding the climate–weathering coupling mechanisms remains pivotal for interpreting global glacial–interglacial cycles, yet advancements have been constrained by the limited high-resolution sedimentary archives. The newly acquired BXZK2017-2 borehole (30.5 m core) from Bohai Bay provides an exceptional sedimentary sequence to investigate the Late Quaternary climate–weathering interactions. Through an integrated high-resolution chronostratigraphic framework (AMS 14C and OSL dating) coupled with multi-proxy sedimentological analyses (major element geochemistry and granulometric parameters), we reconstructed the chemical–weathering dynamics in the Bohai coastal region since the Late Pleistocene. Our findings revealed four distinct climate-weathering phases that correlate with the regional paleoenvironmental evolution and global climate perturbations: (1) enhanced weathering during mid-MIS3 to ~37.5 cal kyr BP (Chemical Index of Alteration (CIA): 55.9–62.2), corresponding to regional warming and strengthened summer monsoon circulation; (2) weathering minimum in late MIS3 through early–mid-MIS2 (37.5–14.8 cal kyr BP, CIA < 55), marking the peak aridity before the Last Glacial Maximum; (3) maximum weathering intensity from mid-MIS2 to early MIS1 (14.8–3.34 cal kyr BP, CIA: 65–68), documenting the postglacial humidification driven by the intensified East Asian Summer Monsoon; (4) renewed weathering decline during the Neoglacial (3.34 cal kyr BP-present, CIA: 59–63), coinciding with the late Holocene cooling events. Remarkably, this study identifies a striking synchronicity between the CIA in marine drill cores and δ18O records derived from Greenland ice cores. Our results indicate that chemical weathering proxies from marginal sea sediments can serve as robust recorders of post-Late Pleistocene climate variability, establishing a new proxy framework for global paleoclimate comparative research.
1. Introduction
The study of climate-weathering coupling mechanisms during the Quaternary is crucial for understanding the co-evolution of modern processes and the carbon cycle, holding significant scientific value for deciphering the self-regulating mechanisms of the climate system over geological timescales [1,2,3]. As the primary carbon sequestration process in the Earth system, the coupling between silicate weathering and glacial–interglacial cycles directly governs the millennial-scale fluctuations in the atmospheric CO2 concentrations, thereby regulating the ice sheet dynamics and sea-level changes [4,5]. Particularly during Marine Isotope Stages MIS 5–2, the response characteristics of global weathering fluxes to orbital forcing and abrupt climate events have become a pivotal scientific issue for validating the carbon–water–rock interaction theory in the Earth’s critical zone [6,7].
The study of climate–chemical weathering coupling in the East Asian monsoon region holds critical significance for understanding the terrestrial carbon dynamics and global climate–carbon cycle feedback mechanisms. This region contributes approximately 15–20% of global continental silicate weathering fluxes, whose spatiotemporal evolution directly influences the atmospheric CO2 concentration regulation [8]. Moreover, the multiscale coupling of monsoon precipitation–temperature–tectonic activity provides a natural laboratory for investigating weathering response thresholds. Recent studies utilizing multi-scale geological archives, including loess–paleosol sequences, fluvial sediments, and marginal sea cores, have systematically elucidated the regulatory mechanisms of orbital- to millennial-scale monsoon variability in relation to silicate weathering fluxes and weathering regimes [9,10,11]. However, the current research still faces significant gaps in understanding the mechanisms behind the spatial heterogeneity of the weathering responses across climate zones [12], particularly regarding the quantitative constraints on the divergence between the physical and chemical weathering processes in northern arid–semiarid regions. To overcome this research gap, it is imperative to establish a multi-scale comparative research framework incorporating terrestrial–marine continuous profiles, with special emphasis on obtaining high-resolution drill core records that exhibit distinct glacial–interglacial chemical weathering signatures.
To address this knowledge gap, we collected a 30.5 m sediment core from Bohai Bay (Figure 1). The core was subjected to analyses including: (1) sedimentary facies reconstruction, (2) stratigraphic subdivision, and (3) geochronological dating using AMS 14C and optically stimulated luminescence (OSL) techniques. Integrating the previous regional studies, we systematically investigated the Late Pleistocene to Holocene stratigraphic architecture and sedimentary evolution of central Bohai Bay. Furthermore, major and trace element geochemistry reveals chemical weathering patterns and paleoenvironmental responses to glacial–interglacial cycles in this marginal sea. This study provides new constraints for understanding the East Asian monsoon variability during the Holocene in this critical shelf region.
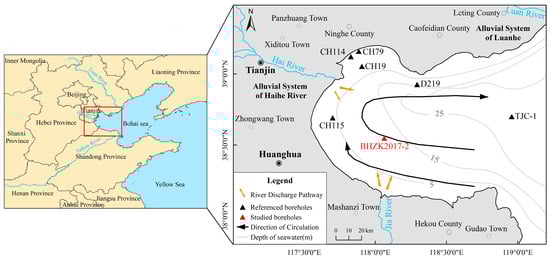
Figure 1.
Location map of the study area.
2. Regional Background
Bohai Bay (38°03′ N–39°15′ N, 117°45′ E–118°53′ E) is a semi-enclosed basin in northern China. As one of three primary embayments within the Bohai Sea, it spans 200 km longitudinally between the Daqing River Estuary (north) and Yellow River Delta (south) (Figure 1). This 17,500 km2 basin opens eastward, bounded by Shandong in the south, Tianjin in the west, and Hebei in the north [13]. The seafloor comprises a Mesozoic–Cenozoic shelf basin developed on the eastern China continental margin [14]. Bathymetric gradients show a gentle (<1°) radial inclination toward the central axis and bay mouth (Figure 1). The surface sediment’s grain size ranges from sandy silt in the northeast to silty clay in the central basin, reflecting hydrodynamic sorting. There are significant hydrocarbon accumulations in the Mesozoic–Cenozoic stratum (>5000 m thick) [13,15,16]. This epicontinental shelf basin has experienced intense land–ocean interactions during the Late Quaternary glacial–interglacial cycles, particularly through eustatic sea-level variations [17]. Three major marine–terrestrial transitions have occurred since the Late Pleistocene, driven by combined eustatic changes and sediment reworking [18].
As a semi-enclosed basin in the East Asian monsoon belt, Bohai Bay experiences strong land–sea interactions. The maritime climate features the following: (1) a mean annual temperature of 11.9 °C, (2) significant oceanic thermal buffering, and (3) precipitation showing a strong seasonal variation with a southeast–northwest gradient from 900 mm to 600 mm [13]. The Winter Sea Surface Temperature (SST) shows inverse latitudinal patterns (coastal: ≤1 °C in January; central basin: 1–2 °C) due to sea ice formation. The Summer SST reverses (coastal: 28–30 °C in August; central: 24–26 °C) due to the difference in temperature. The annual SST amplitude reaches 30 °C, reflecting strong continentality [13]. Seasonal ice cover persists December–March with a maximum thickness of ~20–40 cm, particularly in western shoals. The salinity gradients range from 23–29‰ at the coasts to 29–31‰ in the central basin, which is controlled by freshwater inputs. Local hyper-salinity (≤33‰) occurs near saltworks due to the anthropogenic discharge. Seasonal salinity variability reaches 8‰, modulated by monsoon rainfall [13].
Wind-generated waves constitute the primary hydrodynamic forcing in Bohai Bay. Wave regimes show monsoonal seasonality: NW-N waves dominate the winter months (November–March) while SE waves prevail during the summer (June–August). Significant wave heights average 1.0–1.5 m, with extreme events reaching 7.5 m during winter storms [13]. The semi-diurnal tidal system produces mean tidal ranges of 2–3 m with spring tides ≤ 4 m, ranking among the strongest in the Bohai Sea. Tidal asymmetry manifests as a longer ebb duration (7 h) versus flood (5 h), indicating ebb-dominant conditions [19]. The circulation dynamics are controlled by the Yellow Sea Warm Current (YSWC), which intrudes through the northern Bohai Strait (σt > 25.0 kg/m3) before bifurcating west of 118°E. The southern YSWC branch forms a cyclonic gyre (vorticity ~10−5 s−1) in northern Bohai Bay. Concurrently, Yellow River plume water with salinity < 26‰ drives an anticyclonic flow along the southern coast. This creates a dipole circulation pattern: northern cyclonic and southern anticyclonic gyres [13,14].
3. Material and Methods
3.1. Bore Hole
Core BHZK-2017-2 (38°33′37″ N, 118°03′51″ E; Figure 1) was collected from Bohai Bay in July 2017 using rotary drilling techniques. The 30.5 m long core exhibited 95.2% average recovery, indicating excellent preservation of the sedimentary sequences. Positioning was conducted by using a H32 GNSS RTK system (horizontal accuracy ± 1 cm + 1 ppm, HI-TARGET, Guangzhou, China). The split core was systematically photographed under controlled lighting conditions. Comprehensive sedimentological descriptions were documented: (1) Munsell color, (2) grain-size composition, (3) sedimentary structures, (4) paleontological content, (5) biogenic structures, and (6) stratigraphic contacts. These datasets enabled the reconstruction of the depositional environments (Figure 2), following standard facies analysis protocols.
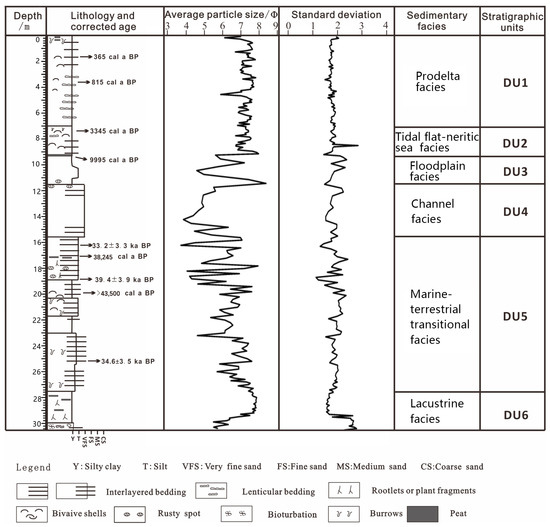
Figure 2.
Comprehensive stratigraphic division of core BHZK2017-2.
3.2. Age Analysis
During core processing, we systematically collected sediment samples with photographic documentation following the International Ocean Discovery Program (IODP) standards. Macrofossils (primarily bivalves) were extracted, ultrasonically cleaned, taxonomically identified, and imaged under standardized conditions. Shells, along with a small number of well-preserved peat or plant rhizome debris samples with minimal wear, were selected for AMS 14C dating. AMS measurements were performed at Beta Analytic (Miami) using their standard acid–base–acid pretreatment protocol for carbonate samples. Marine reservoir corrections applied ΔR = −178 ± 50 yr [20], with the final calibration using CALIB 7.0.2 [21] and the Marine20 curve.
To ensure the reliability of optically stimulated luminescence (OSL) dating, samples were collected from stratigraphic layers with relatively stable depositional environments. Triplicate samples per horizon were collected in light-tight stainless steel cylinders (3.5 × 6 cm) and immediately double-packed in black PVC tubes to prevent light exposure and mechanical disturbance. The samples were then tested at Qingdao Institute of Marine Geology (QIMG) using the methods described in Wintle [22] and Qiu et al. [23]. The U and Th contents required for the dose rate calculation were measured using the Thermo X Series II plasma mass spectrometer (Thermo Fisher Scienfitic, USA), while the K content was detected using the IRIS Intrepid II XSP plasma emission spectrometer. The equivalent dose was measured using the Daybreak 2200 luminescence measuring instrument (Daybreak, Guilford, CT, USA), with a blue diode (λ = 470 ± 30 nm) as the excitation light source and a (90 Sr/90 Y)β radiation as the irradiation source.
3.3. Major Element Analysis
We analyzed the major element compositions in 131 sediment samples collected at 20 cm intervals throughout the core. Analyses were performed at the Laboratory of QIMG by using a PANalytical Axios PW4400 wavelength-dispersive XRF spectrometer (PANalytical B.V., Almelo, The Netherlands). The instrument’s maximum power is 4000 W, maximum voltage is 60 kV, and maximum current is 125 mA. The specific process is as follows: Samples were dried in an oven at 120 °C for 8 h, then 4 g of the dried sample was weighed and ground in a mold, with the bottom and edges sealed using low-pressure polyethylene. A wafer with an outer diameter of 40 mm and an inner diameter of 32 mm was formed under 30 t pressure. We quantified seven major oxides, Al2O3, SiO2, K2O, Na2O, CaO, Fe2O3, and MgO, with method detection limits (MDL) of 0.01 wt%. Calibration employed NIST-certified marine sediment reference material GBW07315 (GSMS-2). Analytical precision, expressed as relative standard deviation (RSD), was <5% for all the reported oxides.
4. Results
4.1. Dating Results
Six AMS 14C ages and four OSL ages of sediments from BHZK2017-2 are shown in Table 1 and Table 2. Except for a few dating results that exceed the effective range of the testing method, the majority of the dating data demonstrate excellent stability and reliability, accurately reflecting the chronological information of the sedimentary strata and providing reliable evidence for establishing the stratigraphic age framework.

Table 1.
List of AMS 14C ages from core BHZK2017-2 in the Bohai Bay.
Table 2.
List of OSL ages from core BHZK2017-2 in the Bohai Bay.
4.2. Sedimentary Facies and Sedimentary Units
Based on sedimentological analysis, core BHZK2017-2 revealed six distinct depositional units (DUs) labeled sequentially from the base (DU6) to the top (DU1) (Figure 2). The lithostratigraphic characteristics are as follows:
DU6: 30.5–27.5 m.
The sedimentary unit primarily comprised gray-brown silty clay containing abundant plant rhizome debris (Figure 3a) and sporadic calcareous nodules. Grain-size analysis indicated an average particle size of 7.13 ± 1.98 Φ (predominantly fine silt), with sand and clay contents averaging 11.94% and 34.6%, respectively (Table 3, Figure 4). The lack of marine fossils and abundant plant fragments indicate a terrestrial environment in this unit [24]. The DU6 probably represents a swamp environment rather than a lacustrine environment, because the plant materials and rootlets are relatively abundant in this facies [24]. While direct chronological constraints prevent precise age determination for DU6, stratigraphic relationships with overlying units DU5 and DU4 constrain its deposition to no earlier than the late Marine Isotope Stage 3 (MIS3).
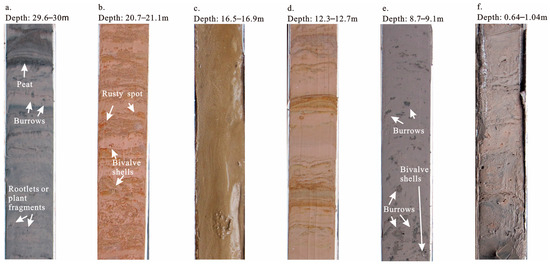
Figure 3.
Typical sedimentary facies of core BHZK2017-2. (a) Lacustrine facies. (b) Marine–terrestrial transitional facies. (c) Channel facies. (d) Floodplain facies. (e) Tidal flat–neritic sea facies. (f) Prodelta facies.
Table 3.
Characteristics of particle size content of core BHZK2017-2 since the Late Pleistocene.
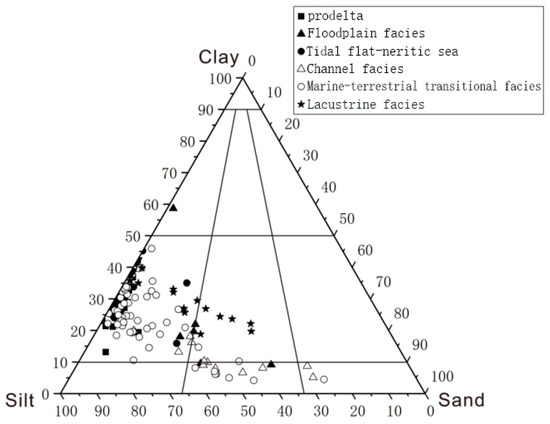
Figure 4.
The Folk triangle of core BHZK2017-2 in Bohai Bay since the Late Pleistocene.
DU5: 27.5–15.5 m.
The sedimentary unit comprised two distinct sedimentary cycles, each divisible into upper and lower subunits. The lower subunit contained brown-gray silty clay with thin gray silt interbeds, displaying sporadic bioturbation and plant rhizome debris, which are good indicators of the saltmarsh and supratidal environment [25]. The upper subunit consists of gray-yellow-brown silt and silty clay interbeds (mean grain size: 6.43 ± 1.89 Φ), with silt (63.73% mean; range: 22.52–75.95%), clay (24.76%), and sand (11.50%) components (Table 3, Figure 4). Fine-grained sediments exhibited rust-colored mottling, burrows (Figure 3b), and localized gastropod fossils (Nassarius sp.), suggesting tidal flat deposition. The AMS 14C and OSL dates from BHZK2017-2 constrain the DU5 deposition to 33.2 ± 3.3–39.4 ± 3.9 ka BP (late MIS3), interpreted as marine–terrestrial transitional deposits. The cyclic sedimentation likely reflects MIS3 sea-level fluctuations.
DU4: 15.5–11.51 m.
The sedimentary unit predominantly comprised light yellow-brown silt to coarse silt (Figure 3d), locally interbedded with thin clayey silt layers. The upper contact displayed rust-colored mottling. No marine shells or shell fragments were found. The grain-size analysis revealed a mean size of 4.93 ± 1.84 Φ, dominated by silt (mean 50.44%; range: 27.96–69.88%) with subordinate clay (11.1%) components (Table 3, Figure 4). In borehole BHZK2017-2, DU4 exhibited thick coarse silt bodies with an abundance of parallel lamination and a lack of marine fossils, which are characteristic features of fluvial-channel deposits, possibly distributary channel deposits [24,26].
DU3: 11.51–9.35 m.
The sedimentary unit predominantly comprised grayish-yellow silt and light gray silty clay. The grain-size analysis indicated a mean particle size of 6.22 ± 1.93 Φ, dominated by silt (mean 54.14%) with sand (20.88%; range: 0.56–53.23%) and clay (24.98%) components (Table 3, Figure 4). The enrichment of Fe-Mn oxides and carbonate nodules is indicative of pedogenic alteration. The sharp contact with the underlying fluvial deposits suggests rapid channel abandonment [27]. An AMS 14C age of 9995 cal yr BP from the uppermost peaty layer in DU3 constrained the deposition to the late MIS2–early Holocene transition, indicative of terrestrial sedimentation.
DU2: 9.35–7.1 m.
This unit primarily comprised gray silty clay interbedded with thin brown-gray clayey silt layers. The grain-size analysis revealed a mean particle size of 7.1 ± 1.84 Φ, with a silt-dominated composition (mean 65.14%), supplemented by clay (31.79%) and minor sand (3.75%; range: 0.26–23.96%) (Table 3, Figure 4). Localized burrows, silt lenses, and abundant shell debris (including small oyster fragments; Figure 3f) suggest tidal flat to neritic sea deposition. While modern Yellow River Delta tidal flats were extensive, the borehole sequences exhibited thinner (<2 m) units lacking well-developed tidal bedding (e.g., lenticular structures), potentially reflecting a rapid early Holocene sea-level rise [28,29]. The AMS 14C dates constrain DU2 deposition to 9990–3340 cal yr BP, consistent with Holocene marine sedimentation.
DU1: 7.1–0 m.
Unit DU1 primarily comprised gray, light gray, and brown-gray silty clay interbedded with gray clayey silt and silt lenses. The grain-size analysis revealed a mean particle size of 7.25 ± 1.77 Φ, dominated by silt (66.82%) with clay (31.94%) and minimal sand (1.36%; range: 0.02–11.74%) (Table 3, Figure 4). Core BHZK2017-2 exhibited abundant bioturbation, interbedding with organic-rich layers (Figure 3f), and contained ubiquitous shell fragments of Arca subcrenata, Potamocorbula laevis, and Sinonovacula sp.—species characteristic of freshwater-influenced intertidal/estuarine environments [30,31]. The high clay content, coupled with the euryhaline assemblages and moderate bioturbation intensity, strongly suggests a low-energy depositional environment, consistent with a prodelta setting [32] (Coleman and Wright, 1975). Stratigraphic relationships indicate prodelta deposition for the main unit, transitioning to modern shallow marine sediments at the top.
4.3. Content Characteristics of Major Elements
The contents of the major elements in the Late Pleistocene sediments from borehole BHZK2017-2 are presented in Table 4. The elements, SiO2 (51.31% mean) and Al2O3, (15.86%) were dominant constituents, followed by CaO (6.36%) and Fe2O3 (5.12%). MgO (2.75%), Na2O (2.72%), and K2O (2.51%) showed comparable concentrations, with K2O being the least abundant. The elemental abundance followed the sequence: SiO2 > Al2O3 > CaO > Fe2O3 > MgO > Na2O > K2O.
Table 4.
Major element contents of the Late Pleistocene strata in core BHZK2017-2.
To study the vertical distribution of each major element in the borehole (Figure 5 and Table 4), the overall content distributions of these elements for each unit are summarized as follows:
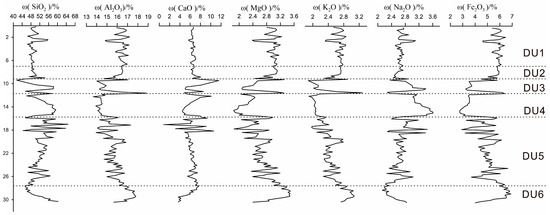
Figure 5.
Element characteristics of the sediment core BXZK2017-2.
There were two distinct patterns found within the lacustrine facies (DU6) (Figure 5). The contents of SiO2 and Na2O experienced depletion ranging 60.21–45.30% and 2.84–2.13%, respectively, whereas the changes in the contents of the elements, Al2O3, CaO, MgO, K2O, and Fe2O3, were opposite.
Within the marine–terrestrial transitional facies (DU5), the major element contents exhibited significant variability between depths of 18.5 and 15.5 m. There were two distinct patterns in this unit (Figure 5). SiO2 and Na2O displayed enrichments which ranged 44.40–64.78% and 2.23–3.44%, respectively, with SiO2 peaking within this interval. Conversely, Al2O3, CaO, MgO, K2O, and Fe2O3 showed a gradual depletion with the content values of 17.31–13.94%, 10.58–0.85%, 3.19–1.85%, 2.79–1.97%, and 6.65–2.91% upwards, respectively.
Within the channel facies (DU4), the major element concentrations exhibited two distinct trends (Figure 5). SiO2 and Na2O experienced progressive depletion upwards ranging 46.04–59.26% and 2.72–3.61%, respectively, with the Na2O content peaking in this interval. Conversely, Al2O3, CaO, MgO, K2O, and Fe2O3 displayed consistent enrichment patterns which ranged 13.66–15.07%, 4.50–10.12%, 1.84–2.63%, 1.90–2.18%, and 2.75–4.90%, respectively.
There were no systematic variations in the element contents in the floodplain facies (DU3), except for a pronounced geochemical anomaly at the depth of 11.3 m where all the elements except Na2O showed abrupt enrichment (Figure 5). The ranges of all elements were as follows: SiO2 (41.50–58.26%), Na2O (14.01–18.84%), Al2O3 (4.86–11.58%), CaO (2.08–3.30%), MgO (1.88–3.28%), K2O (2.28–3.40%), and Fe2O3 (3.24–6.40%). Notably, the contents of Al2O3, CaO, and K2O peaked at this horizon.
The shallow tidal flat–neritic sea facies (DU2) displayed stable geochemical signatures, with no significant variations in the contents of major elements. The ranges of elements were as follows: SiO2 (45.09–54.34%), Na2O (14.70–17.05%), Al2O3 (6.15–8.13%), CaO (2.45–3.31%), MgO (2.29–2.89%), K2O (2.35–2.89%), and Fe2O3 (4.50–5.94%).
The prodelta facies (DU1) exhibited no systematic variations in the major element contents, although significant geochemical fluctuations occurred at the depth of 0–4 m. The contents of element ranges were as follows: SiO2 (46.39–55.70%), Na2O (14.83–17.19%), Al2O3 (5.66–7.08%), CaO (2.38–3.24%), MgO (2.32–2.86%), K2O (2.51–3.10%), and Fe2O3 (4.62–6.46%) (Table 4). Remarkably, the contents of MgO and Fe2O3 peaked at this shallow interval.
Correlation analysis of the sedimentary major elements (Table 5) revealed distinct geochemical associations. SiO2, Na2O, and Fe2O3 exhibited strong positive or negative correlations with the other elements (p < 0.01), while Al2O3 correlated well with all the elements (p < 0.01) except CaO. CaO demonstrated significant correlations except with Al2O3, and MgO showed similar patterns except with K2O. These relationships define two geochemical groups: (1) SiO2 and Na2O display synchronous cyclic variations with the pattern of increase→decrease→increase→decrease; and (2) Al2O3, MgO, and Fe2O3 exhibited concordant but inverse trends (decrease→increase→decrease→gradual increase).
Table 5.
Correlation coefficients among the major elements in core BHZK2017-2.
4.4. Major Element Analysis Mass Transfer Characteristics
The geochemical composition of major elements reflects both source bedrock characteristics and post-depositional weathering processes [33,34]. Comparative analysis between BHZK2017-2 sediments and upper continental crust (UCC) averages revealed environment-dependent fractionation patterns [35] (Figure 6). Mobile elements (Ca, Mg, Fe) exhibited significant enrichment throughout the borehole, with Ca showing particularly strong enrichment due to Yellow River-derived carbonate inputs [36]. In contrast, Na experienced pronounced depletion, consistent with its high mobility under warm–humid conditions [37]. Stable elements demonstrated limited fractionation: Al maintained near-UCC concentrations, while Si and K showed moderate depletion. Terrestrial facies (DU3-DU4) exhibited additional Fe depletion. These patterns collectively indicated: (1) compositional stability across sedimentary facies, (2) active Na removal signaling the initial weathering stages, and (3) limited progression to more advanced K-Si weathering stages, suggesting overall weak chemical weathering intensity in Bohai Bay sediments.
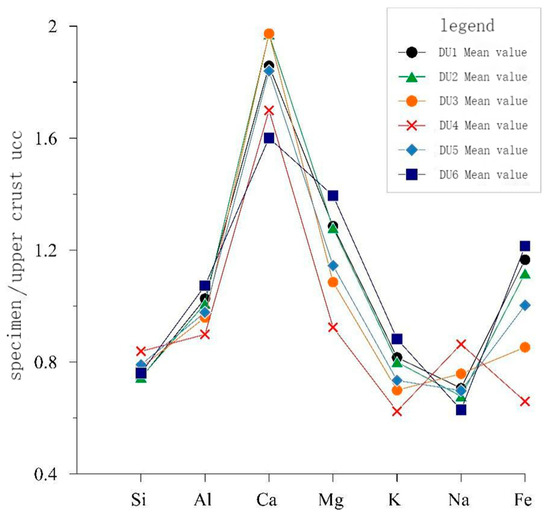
Figure 6.
UCC-normalized abundances of major elements of the Late Pleistocene strata in core BHZK2017-2.
Aluminum demonstrated exceptional geochemical stability in the sediment samples (Figure 6). To accurately assess the elemental mobility during weathering processes, we normalized all the major element concentrations against Al as an immobile reference element [38]. The enrichment/depletion trends were calculated using the following standardized equation:
Δ(%) = [(XS/IS/(XP/IP) − 1] × 100%
In the geochemical normalization equation, XS and IS denote the concentrations of target element X and reference element Al in the samples, while XP and IP represent their respective contents in protolith. The mobility index (Δ) quantifies the elemental fractionation: Δ > 0 indicates enrichment relative to Al, Δ = 0 reflects stability, and Δ < 0 signifies depletion. The results demonstrate Si depletion versus Al, whereas Ca, Mg, K, Na, and Fe show systematic enrichment (Figure 7). The mobility sequence in BHZK2017-2 sediments followed K > Na > Ca > Fe > Mg > Al > Si, reflecting the differential element behavior during Late Pleistocene weathering.
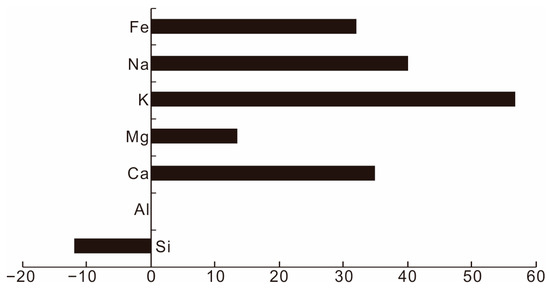
Figure 7.
Mass transfer ratio of major elements calculated relative to the stable element Al in core BHZK2017-2 since the Late Pleistocene strata.
4.5. Chemical Weathering Intensity
The Chemical Index of Alteration (CIA), developed by Nesbitt et al. [38], remains the most widely applied geochemical proxy for quantifying the sediment weathering intensity. This index was calculated as follows:
CIA = (Al2O3/Al2O3 + Na2O + K2O + CaO*) × 100
In the CIA calculation, Al2O3, Na2O, K2O, and CaO* represent molar percentages, where CaO* specifically denotes the calcium content in silicate minerals (excluding carbonate- and phosphate-bound Ca) [38]. Following McLennan’s correction method [38], we calculated CaO* as: CaO’ = CaO* − 10 × P2O5/3. The final CaO* value was determined by: (1) adopting CaO’ when CaO’ < CaO*, or (2) using the Na2O content when CaO’ > CaO*.
The CIA quantitatively tracks the transformation of aluminosilicate minerals (particularly feldspars) to clay minerals during weathering [38,39,40]. Higher CIA values reflect greater leaching of mobile cations (Na+, Ca2+, K+) from parent silicates, indicating intensified chemical weathering [41,42]. Concurrently, the n(Na)/n(K) molar ratio serves as a sensitive plagioclase weathering indicator, with lower ratios corresponding to advanced weathering stages [41]. This inverse relationship with CIA values arises from the differential weathering rates: K-rich phases (K-feldspar, micas) resist weathering compared to Na-rich plagioclase (albite), causing n(Na)/n(K) to decrease as the weathering progresses [43].
The stratigraphic variations in CIA values and n(Na)/n(K) ratios across the sedimentary facies revealed distinct weathering patterns (Figure 8). Lacustrine facies (DU6) exhibited progressive chemical weathering intensification (CIA: 56–62.7, mean = 60.9), evidenced by a rising CIA and declining n(Na)/n(K). Marine–terrestrial transitional facies (DU5) displayed complex but overall weakening weathering trends (CIA: 50.9–66.2, mean = 58.1), despite containing peak weathering intensities. Channel facies (DU4) showed renewed weathering enhancement (CIA: 50.3–57.2, mean = 52.5), though maintaining the lowest Pleistocene values. Floodplain facies (DU3) recorded abrupt weathering reduction followed by gradual recovery (CIA: 51.7–62.5, mean = 56.1). Tidal flat–neritic sea facies (DU2) demonstrated inverse CIA and n(Na)/n(K) trends, with overall weathering declines (CIA: 55.1–61.1, mean = 58.7). Prodelta facies (DU1) exhibited a consistently decreasing weathering intensity (CIA: 53.8–60.2, mean = 58.3).
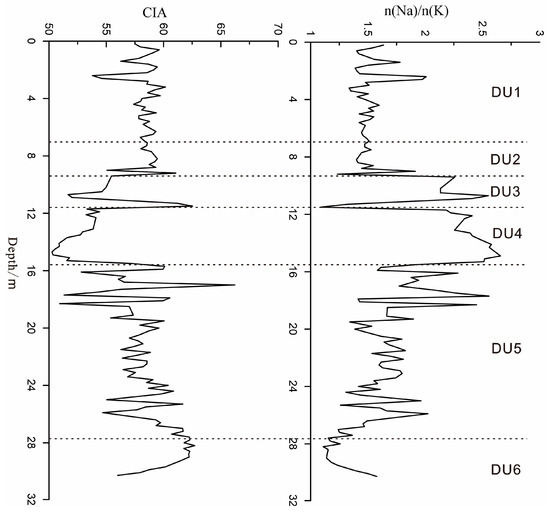
Figure 8.
Variation curves of CIA and n(Na)/n(K) of the BHZK2017-2 since Late Pleistocene strata.
Figure 9 presents the scatter plot of CIA and n(Na)/n(K) parameters for sediments in BHZK2017-2 since the Late Pleistocene. A strong correlation was observed between the CIA and n(Na)/n(K) (R2 = 0.88), supporting the relative stability of the sediment provenance during this period. The CIA values ranged from 50 to 65, indicating that the chemical weathering intensity in the Bohai Bay area was low, characteristic of cold and dry climate conditions.
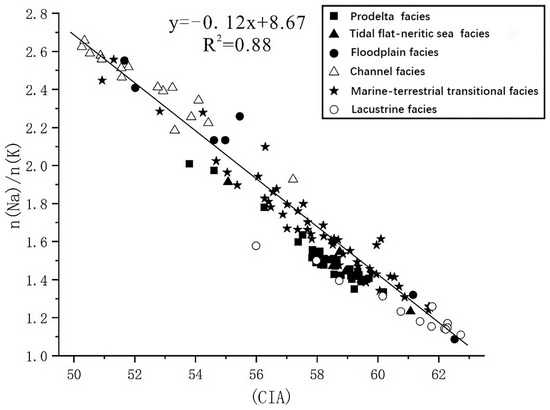
Figure 9.
Scatter diagram of CIA and n(Na)/n(K) of core BHZK2017-2 since the Late Pleistocene strata.
The CIA versus n(Na)/n(K) cross-plot for the Late Pleistocene sediments from BHZK2017-2 exhibited a strong negative correlation (R2 = 0.88; Figure 9), confirming consistent sediment provenance. The CIA values ranging between 50 and 65 reflected a low chemical weathering intensity throughout the sequence, consistent with cold–dry paleoclimatic conditions in the Bohai Bay region during this interval.
The sedimentary facies analysis of BHZK2017-2 revealed distinct weathering patterns: DU6 showed a concentrated data distribution, indicating strong chemical weathering; DU5 exhibited a wide compositional variability reflecting weaker weathering than DU6; DU4 demonstrated homogeneous signatures with minimal weathering; DU3 displayed scattered but slightly intensified weathering relative to DU4; DU2 presented sporadic data with marginally stronger weathering than DU3, while DU1 showed clustered data trending toward final-stage low-grade chemical weathering.
5. Discussion
5.1. Chemical Weathering Trends
Nesbitt and Young [38,41] established two ternary weathering diagrams—the A-CN-K (Al2O3-CaO* + Na2O-K2O) and A-CNK-FM (Al2O3-CaO* + Na2O + K2O-FeOₜ + MgO) systems—through feldspar dissolution kinetics, mineral stability thermodynamics, and mass balance calculations. These models effectively track chemical weathering progression and the associated mineralogical transformations in continental environments.
Nesbitt et al. [42] categorized chemical weathering into three progressive stages: initial Ca-Na removal, intermediate K depletion, and final Si loss. The Bohai Bay sediments plot were parallel and proximal to the A-CN boundary in the ternary diagram (Figure 10), indicating incipient weathering where only plagioclase underwent limited Ca-Na leaching while K-feldspar remained stable. This geochemical signature, resulting from K adsorption during ion exchange, demonstrated early-stage weathering without significant K depletion. Continued weathering drives Ca-Na reduction and Al enrichment, though the system remained in the pre-depletion stage (approaching Sm-IL line), favoring montmorillonite/illite over kaolinite/gibbsite formation. Lacustrine facies plot nearest to the A vertex, showing substantial plagioclase weathering, while fluvial deposits clustered along the Pl-Ks line, reflecting minimal weathering. Marine–terrestrial transitional and floodplain facies displayed wide compositional ranges. These variations, controlled by complex depositional influences on the weathering intensity, correlated with the CIA and n(Na)/n(K) patterns (Figure 10).
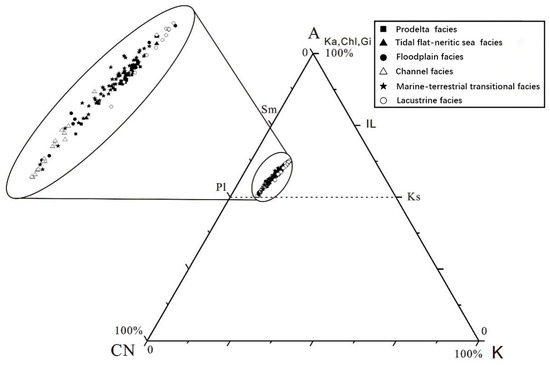
Figure 10.
A-CN-K ternary diagram of core BHZK2017-2 since the Late Pleistocene strata. Annotation: A: Al2O3, CN: CaO* + Na2O, K: K2O, Ka: kaolinite, Chl: turquoise, Gi: gibbsite, Sm: montmorillonite, IL: illite, Pl: plagioclase, Ks: potash feldspar.
The A-CN-K diagram (Figure 10) tracks the alkali metal–aluminum fractionation and chemical weathering intensity. Complementary A-CNK-FM analysis (Figure 11) revealed Fe-Mg behavior and dark/light mineral weathering trends [43]. Bohai Bay sediments clustered near the feldspar domain without crossing the weathering threshold line, confirming limited chemical alteration. Lacustrine facies plots were closest to the FM vertex, showing elevated dark mineral content (hornblende, pyroxene, chlorite, biotite) that reflects a peak weathering intensity [38,41], likely due to the stable depositional conditions favoring in-situ elemental accumulation. In contrast, fluvial facies clustered near the CNK vertex, dominated by quartz and feldspar, indicate arrested plagioclase weathering typical of early-stage alteration.
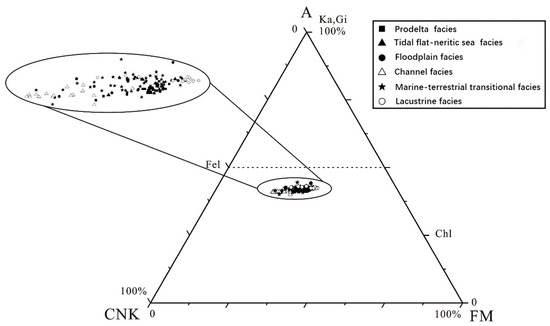
Figure 11.
A-CNK-FM ternary diagram of core BHZK2017-2 since the Late Pleistocene strata. Annotation: CNK: (CaO* + Na2O + K2O), FM: (FeOT + MgO), Fel: Feldspar; the rest of the code is consistent with Figure 10.
Integrated analysis of the weathering trends based on A-CN-K (Figure 10) and A-CNK-FM (Figure 11) demonstrated uniformly low chemical alteration intensities across the Bohai Bay sediments, with all facies retaining early-stage weathering characteristics. Lacustrine–marsh facies exhibited pronounced Ca-Na depletion, indicating relatively stronger weathering, while fluvial deposits showed weaker alteration due to K retention, which was consistent with CIA and n(Na)/n(K) patterns (Figure 8 and Figure 9). These regional paleoclimate evolutions reconstructed by weathering signatures include the following: DU6 that reflected warming/humidification; DU5-DU4 cooling/aridification in DU5-DU4; rewarming condition indicated by DU3-DU2; and DU1 that marked the onset of another cool–dry phase.
5.2. Regional Weathering and Climate Change
In our previous study, we utilized chemical weathering parameters such as CIA, n(Na)/n(K), and A-CN-K and A-CNK-FM triangular diagrams to investigate the characteristics of chemical weathering in Bohai Bay since the Late Pleistocene. Overall, the degree of chemical weathering in this region exhibited a trend of increase–decrease–increase–gradual decrease. In DU6, relatively higher chemical weathering indices indicated a shift toward warmer and more humid climatic conditions. DU5 displayed low-intensity chemical weathering, while DU4 showed the weakest geochemical weathering signature in the sequence, suggesting a transition to colder and drier conditions. Chemical weathering slightly intensified in DU3 compared to fluvial facies, with further enhancement in DU2, reflecting a return to warmer and more humid conditions. DU1 maintained low-level chemical weathering, signaling the onset of another gradual transition toward a colder and drier climate.
It is well known that the degree of chemical weathering is influenced by various factors such as vegetation development, climate, and topography, with precipitation and temperature playing crucial roles. Generally, under cold and dry climatic conditions, chemical weathering is weaker, whereas under warm and humid conditions, chemical weathering is stronger. Therefore, in-depth research into the degree of chemical weathering experienced by a region can provide valuable insights into its climatic transitions. In this study, we used chemical weathering parameters such as the CIA and n(Fe)/n(Mg) and compared them with the GISP2-δ18O curve and 42°N Northern Hemisphere insolation to understand the climatic transitions in Bohai Bay since the Late Pleistocene (Figure 12). As shown in Figure 12, the chemical weathering parameters, CIA and n(Fe)/n(Mg), from the BHZK2017-2 core during the Holocene generally align with the fluctuations in the GISP2-δ18O curve and correspond well with climatic events (labeled YD, H1, H2, H3) on a temporal scale, with only minor deviations due to dating errors. Based on the correspondence between the degree of chemical weathering and the GISP2-δ18O curve data, we identified four distinct climatic stages in this region since the Holocene onset:
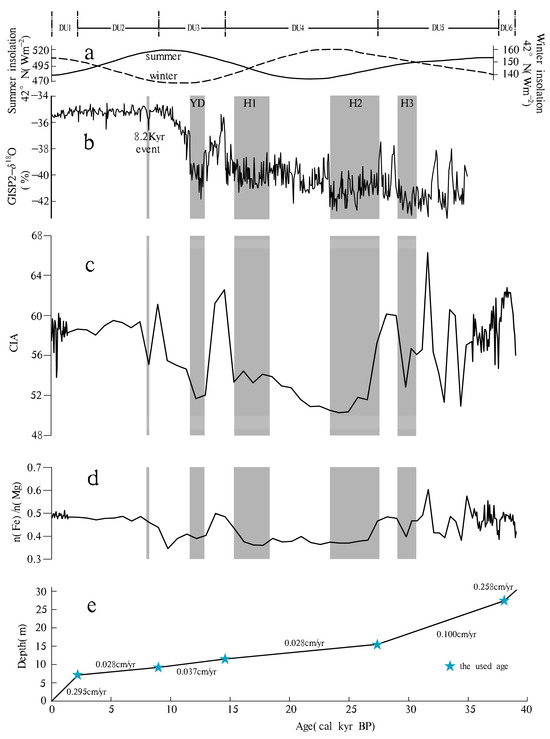
Figure 12.
Sediment proxy records in coreBHZK2017-2. (a) The Northern Hemisphere insolation [44]; (b) GISP2-δ18O [45]; (c) CIA; (d) n(Fe)/n(Mg); (e) age–elevation model.
During mid-MIS3 to approximately 37.5 cal kyr BP (Figure 12), the Northern Hemisphere experienced strong summer insolation, which intensified the summer monsoon. As China’s climate system is predominantly governed by monsoon dynamics, this led to substantially increased precipitation. Concurrently, weaker winter insolation reduced the influence of cold, dry winter monsoons. Consequently, regional temperatures gradually increased, enhancing the chemical weathering intensity. This is reflected in the rise of the Chemical Index of Alteration (CIA) values from 55.9 to 62.2, indicating a shift toward warmer and more humid climatic conditions (Figure 12).
From late MIS3 to early–mid-MIS2 (37.5–14.8 cal kyr BP; Figure 12), the Northern Hemisphere summer insolation progressively weakened, while the winter insolation intensified, resulting in a temperature decline. The chemical weathering reached its minimum intensity during this interval, as reflected in the lowest recorded CIA values of 50.2. This interval encompassed three well-documented cold events: Heinrich Event 3 (H3), Heinrich Event 2 (H2), and Heinrich Event 1 (H1) [46,47,48]. Collectively, these data demonstrate a progressive shift toward colder and drier climatic conditions in the Bohai Bay region (Figure 12).
From mid-MIS2 to early MIS1 (14.8–3.345 cal kyr BP; Figure 12), the Northern Hemisphere summer insolation progressively increased, intensifying the summer monsoon activity. This region experienced an enhanced summer monsoon influence, leading to greater precipitation. Concurrently, the diminished winter insolation reduced the impact of cold, dry winter monsoons. These changes resulted in gradual temperature increases and enhanced chemical weathering. The onset of this interval coincided with the Younger Dryas cold event [46,47,48], which triggered abrupt climatic cooling recorded in GISP2 δ18O as the 8.2 ka BP event [49,50]. This climatic reversal temporarily reduced the chemical weathering intensity in Bohai Bay during the Holocene, evidenced by the CIA values decreasing from 62.5 to 51.6. Following this brief cold/dry phase, the CIA values rebounded to 59.5, reflecting a return to warmer, more humid conditions.
During the MIS1 period (3340 cal yr BP to present; Figure 12), the progressive weakening of the Northern Hemisphere summer insolation with intensified winter insolation led to a regional temperature decline. The chemical weathering reached its minimum intensity during this interval, as evidenced by the CIA values decreasing from 60.1 to 53.7 before subsequent gradual recovery, collectively indicating a transition to colder and drier climatic conditions in the Bohai Bay region.
6. Conclusions
On the basis of major element chemistry, grain size data, AMS 14 C and OSL dating, and the analysis of foraminifera in core BXZK2017-2, this study reached the conclusions as follows:
- (1)
- The oxides, SiO2 and Na2O, that indicate an arid condition and the proxies, Al2O3, MgO, and Fe2O3, for humid environments, were inversely correlated throughout the sedimentary sequence, which indicate alternating wet and dry climatic phases in the Bohai Bay area: wet conditions from mid-MIS3 to ~37.5 cal kyr BP, followed by dry conditions during late MIS3 to early–mid-MIS2 (37.5–14.8 cal kyr BP), then wet conditions from mid-MIS2 to early MIS1 (14.8–3.345 cal kyr BP), and finally dry conditions during the MIS1 period (3340 cal yr BP to present). Comparative analysis with upper continental crust (UCC) values and element mass transfer rate revealed the mobility sequence of the major elements in Bohai Bay sediments since the Late Pleistocene in the order of K > Na > Ca > Fe > Mg > Al > Si.
- (2)
- There was significant Ca and Na leaching in lacustrine and marsh facies, yielding lower residual concentrations and indicating relatively intense chemical weathering as evidenced by the analysis of A-CN-K and A-CNK-FM weathering trends. Conversely, fluvial facies showed significant K retention and moderate Ca and Na leaching, suggesting weaker chemical weathering. These observations are consistent with both the CIA values and Na/K ratios.
- (3)
- The CIA values ranged ~50–65, demonstrating limited chemical weathering in the Bohai Bay region. This low weathering intensity reflects cold, arid climatic conditions. There were warmer, more humid conditions evidenced by relatively stronger chemical weathering in DU6, cooling and drying conditions in DU 5, while there was the least geochemical alteration in the unit of DU4, collectively indicating climatic cooling and drying. DU3 manifested slightly enhanced weathering compared to fluvial facies, with further intensification in DU2, marking a return to warmer, wetter conditions. Finally, there was another gradual shift toward colder, drier weathering intensity in the unit DU1 evidenced by the persistent low weathering intensity in this unit.
Our findings demonstrate that the proxies, CIA, SiO2, Na2O, Al2O3, MgO, and Fe2O3, derived from marginal sea sediments, can function as a reliable record to manifest climate variability since the Late Pleistocene, thus establishing a novel proxy system for global-scale paleoclimate comparative studies.
Author Contributions
Methodology, X.L., L.H. and S.Y.; Validation, Z.Z.; Formal analysis, Y.L., Y.Z. and S.Y.; Investigation, Y.L. and Y.Z.; Data curation, L.X. and S.Y.; Writing—original draft, Y.L. and S.Y.; Writing—review & editing, Y.L., L.H., L.X. and S.Y. All authors have read and agreed to the published version of the manuscript.
Funding
This research was jointly supported by the project of Natural Science Foundation of Shandong Province (No. ZR2022MD024), Regional Development Foundation of National Natural Science Foundation (No. U22A20558), Laoshan Laboratory Science and Technology Innovation (No. LSKJ202204003), and the project of China Geological Survey (No. DD20221775).
Data Availability Statement
The original contributions presented in this study are included in the article. Further inquiries can be directed to the corresponding authors.
Acknowledgments
We thank Lixin Pei, Guohua Hou, Dapeng Su, and Liangyong Zhou for their help in the geological survey and manuscript preparation. We would also like to express our gratitude for the support from the Ocean Negative Carbon Emissions (ONCE) Program.
Conflicts of Interest
The authors declare no conflict of interest.
References
- Hessler, A.M.; Zhang, J.; Covault, J.; Ambrose, W. Continental weathering coupled to Paleogene climate changes in North America. Geology 2017, 45, 911–914. [Google Scholar] [CrossRef]
- Deng, K.; Yang, S.; Guo, Y. A global temperature control of silicate weathering intensity. Nat. Commun. 2022, 13, 1781. [Google Scholar] [CrossRef] [PubMed]
- Li, F.; Yang, S.; Breecker, D.O.; Ramos, E.J.; Huang, X.; Duan, Z.; Guo, Y.; Li, C.; Mei, X. Responses of silicate weathering intensity to the Pliocene-Quaternary cooling in East and Southeast Asia. Earth Planet. Sci. Lett. 2022, 578, 117301. [Google Scholar] [CrossRef]
- Jin, Z.; Yu, J.; Zhang, F.; Qiang, X. Glacial-interglacial variation in catchment weathering and erosion paces the Indian summer monsoon during the Pleistocene. Quat. Sci. Rev. 2020, 248, 106619. [Google Scholar] [CrossRef]
- Wan, S.; Qin, L.; Yang, S.; Zhao, D.; Zhang, J.; Jiao, D.; Cai, G.; Pei, W.; Gong, H.; Xu, Z.; et al. South China Sea shelf weathering in glacial periods and its link to carbon cycle. Quat. Sci. 2020, 40, 1531–1549. [Google Scholar]
- Clark, P.U.; Archer, D.; Pollard, D.; Blum, J.D.; Rial, J.A.; Brovkin, V.; Mix, A.C.; Pisias, N.G.; Roy, M. The middle Pleistocene transition: Characteristics, mechanisms, and implications for long-term changes in atmospheric pCO2. Quat. Sci. Rev. 2006, 25, 3150–3184. [Google Scholar] [CrossRef]
- Torres, M.A.; Moosdorf, N.; Hartmann, J.; Adkins, J.F.; West, A.J. Glacial weathering, sulfide oxidation, and global carbon cycle feedbacks. Proc. Natl. Acad. Sci. USA 2017, 114, 8716–8721. [Google Scholar] [CrossRef]
- Gaillardet, J.; Dupré, B.; Louvat, P.; Allegre, C.J. Global silicate weathering and CO2 consumption rates deduced from the chemistry of large rivers. Chem. Geol. 1999, 159, 3–30. [Google Scholar] [CrossRef]
- Buggle, B.; Glaser, B.; Hambach, U.; Gerasimenko, N.; Marković, S. An evaluation of geochemical weathering indices in loess–paleosol studies. Quat. Int. 2011, 240, 12–21. [Google Scholar] [CrossRef]
- Shao, J.; Yang, S.; Li, C. Chemical indices (CIA and WIP) as proxies for integrated chemical weathering in China: Inferences from analysis of fluvial sediments. Sediment. Geol. 2012, 265–266, 110–120. [Google Scholar] [CrossRef]
- Clift, P.D.; Betzler, C.; Clemens, S.C.; Christensen, B.; Eberli, G.P.; France-Lanord, C.; Gallagher, S.; Holbourn, A.; Kuhnt, W.; Murray, R.W.; et al. A synthesis of monsoon exploration in the Asian marginal seas. Sci. Drill. 2022, 31, 1–29. [Google Scholar] [CrossRef]
- Zhang, S.; Bai, X.; Zhao, C.; Tan, Q.; Luo, G.; Wang, J.; Li, Q.; Wu, L.; Chen, F.; Li, C. Global CO2 consumption by silicate rock chemical weathering: Its past and future. Earth’s Future 2021, 9, e2020EF001938. [Google Scholar] [CrossRef]
- Institute of Oceanography. Chinese Academy of Sciences. Geology of Bohai Sea; Science Press: Beijing, China, 1985. [Google Scholar]
- Zhao, B.; Zhuang, G.; Cao, D.; Lei, F. The circulation and tidal residual current of Bohai Sea and their influence on sediment disribution. Oceanol. Limnol. Sinica 1995, 26, 466. [Google Scholar]
- Gao, R.; Zhao, W.; Kong, F. The Young Explorers Discussed Ptroleum Geology of Bohai Bay Basin. Master’s Thesis, Ptroleum Industy Press, Beijing, China, 2004. [Google Scholar]
- Fu, Z.; Chen, F.; Li, M.; Shi, P.; Min, F. Sedimentary characteristics of the Xinbei oilfield and their controls on hydrocarbon accumulation. Geol. China 2008, 35, 691–698. [Google Scholar]
- Li, J.; Li, R.; Yang, S.; Chen, X.; Chen, S. Pollenspore assemblages and induced palaeoenvironmental changes in the western Bohai Seasince Late Pleistoene. Mar. Geol. Quat. Geol. 2018, 38, 115–128. [Google Scholar]
- Zhao, S.; Yang, G.; Cang, S.; Zhang, H.; Huang, Q.; Xia, D.; Wang, Y.; Liu, F.; Liu, C. On the Marine stratigraphy and coastlines of the western coast of the gulf of Bohai. Oceanol. Limnol. Sinica 1978, 9, 15. [Google Scholar]
- Dong, L.; Su, J.; Wang, K. Tide current in the Yellow Sea and its relationship with sediment transport. Acta Oceanol. Sin. 1989, 11, 102–114. [Google Scholar]
- Southon, J.; Kashgarian, M.; Fontugne, M. Marine reservoir corrections for the Indian Ocean and Southeast Asia. Radiocarbon 2002, 44, 167–180. [Google Scholar] [CrossRef]
- Reimer, P.; Bard, E.; Bayliss, A. IntCal13 and Marine13 Radiocarbon Age Calibration Curves 0–50000 Years cal BP. Radiocarbon 2013, 55, 1869–1887. [Google Scholar] [CrossRef]
- Wintle, A. Luminescence dating: Laboratory procedures and protocols. Radiat. Meas. 1997, 27, 769–817. [Google Scholar] [CrossRef]
- Qiu, J.; Liu, J.; Saito, Y. Sedimentary evolution ofthe Holocene subaqueous clinoform off the Southern Shandong Peninsula in theWestern South Yellow Sea. J. Ocean Univ. China 2014, 13, 747–760. [Google Scholar] [CrossRef]
- Galloway, W.E.; Hobday, D.K. Terrigenous Clastic Depositional Systems: Applications to Petroleum, Coal, and Uranium Exploration; Springer: New York, NY, USA, 1983; p. 51. [Google Scholar]
- Liu, J.; Wang, H.; Wang, F.; Qiu, J.; Saito, Y.; Lu, J.; Zhou, L.; Xu, G.; Du, X.; Chen, Q. Sedimentary Evolution During the Last ~ 1.9 Ma near the Western Margin of the Modern Bohai Sea. Palaeogeogr. Palaeoclimatol. Palaeoecol. 2016, 451, 84–96. [Google Scholar] [CrossRef]
- Miall, A.D. Alluvial Deposits. In Facies Models: Response to Sea Level Change; Walker, R.G., James, N.P., Eds.; Geological Association of Canada: Waterloo, ON, Canada, 1992; p. 119. [Google Scholar]
- He, L.; Xue, C.; Ye, S.; Laws, E.A.; Yuan, H.; Yang, S.; Du, X. Holocene evolution of the Liaohe Delta, a tide-dominated delta formed by multiple rivers in Northeast China. J. Asian Earth Sci. 2018, 152, 52–68. [Google Scholar] [CrossRef]
- Liu, J.; John, D.M.; Gao, S. Holocene development of the Yellow River’s subaqueous delta, north Yellow Sea. Mar. Geol. 2004, 209, 45–67. [Google Scholar] [CrossRef]
- Hori, K.; Saito, Y. An early Holocene sea-level jump and delta initiation. Geophys. Res. Lett. 2007, 34, L18401. [Google Scholar] [CrossRef]
- Zhang, S. Atlas of Marine Mollusks in China; China Ocean Press: Beijing, China, 2008. [Google Scholar]
- Xu, F.; Zhang, S. An Illustrated Bivalvia Mollusca Fauna of China Seas; Science Press: Beijing, China, 2008. [Google Scholar]
- Coleman, J.M.; Wright, L.D. Modern River Deltas: Variability of Processes and Sand Bodies. In Deltas: Models for Exploration; Broussard, M.L., Ed.; Houston Geological Society: Houston, TX, USA, 1975; p. 99. [Google Scholar]
- Hu, M.; Zuo, H.; Pan, N. Evolution of chemical weathering processes since the middle-late Holocene in the Maqu Plateau. J. Desert Res. 2016, 36, 623–635. [Google Scholar]
- Wang, X.; Ye, S.; Han, Z. The sedimentary cnvironment evolution and biogenic silica records of the Liaohe Estuary since 33 ka BP. Geol. China 2015, 42, 1092–1102. [Google Scholar]
- Taylor, S.; McLennan, S. The Continental Crust: Its Composition and Evolution; Blackwell: London, UK, 1985; Volume 57. [Google Scholar]
- Yang, S.; Li, C. Characteristic element compositions of the yangtze and the yellow river sediments and their geological background. Mar. Geol. Quat Ernary Geol. 1999, 2, 19. [Google Scholar]
- Guo, R.; Ye, S.; He, L. Chemical weathering and its implications regarding climate changes in the Liaohe Delta since the Holocene. Mar. Sci. 2018, 42, 38. [Google Scholar]
- Nesbitt, H.; Young, G. Early Proterozoic climates and plate motions inferred from major element chemistryoflutites. Nature 1982, 299, 715–717. [Google Scholar] [CrossRef]
- Fedo, C.; Nesbitt, H.; Young, G. Unraveling the effects of potassium metasomatism in sedimentary rocks and paleosols, with implications for paleo-weathering conditions and provenance. Geology 1995, 23, 921–924. [Google Scholar] [CrossRef]
- Kautz, C.; Martin, C. Chemical and physical weathering in New Zealand’s Southern Alps monitored by bedload sediment major element composition. Appl. Geochem. 2007, 22, 1715–1735. [Google Scholar] [CrossRef]
- Nesbitt, H.; Young, G. Prediction of some weathering trends of plutonic and volcanic rocks based on thermodynamic and kinetic considerations. Geochim. Cosmochim. Acta 1984, 48, 1523–1534. [Google Scholar] [CrossRef]
- Nesbitt, H.; Young, G. Formation and diagenesis of weathering profiles. J. Geol. 1989, 97, 129–147. [Google Scholar] [CrossRef]
- Nesbitt, H.; Markovics, G.; Price, R. Chemical processes affecting alkalis and alkaline earths during continental weathering. Geochim. Cosmochim. Acta 1980, 44, 1659–1666. [Google Scholar] [CrossRef]
- Laskar, J.; Robutel, P.; Joutel, F.; Gastineau, M.; Correia, A.; Levrard, B. A longterm numerical solution for the insolation quantities of the Earth. Astron. Astrophys. 2004, 428, 261–285. [Google Scholar] [CrossRef]
- Rasmussen, S.O.; Bigler, M.; Blockley, S.P.; Blunier, T.; Buchardt, S.L.; Clausen, H.B.; Cvijanovic, I.; Dahl-Jensen, D.; Johnsen, S.J.; Fischer, H.; et al. A stratigraphic framework for abrupt climatic changes during the Last Glacial period based on three synchronized Greenland ice-core records: Refining and extending the INTIMATE event stratigraphy. Quat. Sci. Rev. 2014, 106, 14–28. [Google Scholar] [CrossRef]
- Heinrich, H. Origin and consequences of cyclic ice rafting in the northeast Atlantic Ocean during the past 130,000 years. Quat. Res. 1988, 29, 142–152. [Google Scholar] [CrossRef]
- Hemming, S.R. Heinrich events: Massive late Pleistocene detritus layers of the North Atlantic and their global climate imprint. Rev. Geophys. 2004, 42. [Google Scholar] [CrossRef]
- Rasmussen, T.L.; Oppo, D.W.; Thomsen, E.; Lehman, S.J. Deep sea records from the southeast Labrador Sea: Ocean circulation changes and ice-rafting events during the last 160,000 years. Paleoceanography 2003, 18. [Google Scholar] [CrossRef]
- Dansgaard, W.; Johnsen, S.J.; Clausen, H.B. Evidence for general instability of past climate from a 250-kyr ice-core record. Nature 1993, 364, 218–220. [Google Scholar] [CrossRef]
- Dykoski, C.A.; Edwards, R.L.; Cheng, H.; Yuan, D.; Cai, Y.; Zhang, M.; Lin, Y.; Qing, J.; An, Z.; Revenaugh, J. A highresolution, absolute-dated Holocene and deglacial Asian monsoon record from Dongge Cave, China. Earth Planet. Sci. Lett. 2005, 233, 71–86. [Google Scholar] [CrossRef]
Disclaimer/Publisher’s Note: The statements, opinions and data contained in all publications are solely those of the individual author(s) and contributor(s) and not of MDPI and/or the editor(s). MDPI and/or the editor(s) disclaim responsibility for any injury to people or property resulting from any ideas, methods, instructions or products referred to in the content. |
© 2025 by the authors. Licensee MDPI, Basel, Switzerland. This article is an open access article distributed under the terms and conditions of the Creative Commons Attribution (CC BY) license (https://creativecommons.org/licenses/by/4.0/).