Abstract
Power cables transmit electricity from offshore wind turbines (OWTs) to consumers. The configuration, design, and optimization of power cables for floating offshore wind turbines (FOWTs) are subject to various objectives, variables, and constraints. These components are outlined, and existing research gaps that need to be addressed for a more sustainable and robust design for future developments are highlighted. The main aim of power cable configuration design is to optimize performance and minimize costs. This can be achieved through thoughtful consideration of variables like power cable selection, configuration design, and the integration of specialized components and ancillaries. An extensive overview of constraints for power cable configuration design is provided, and the most important ones are identified. The local conditions determine which constraints are of key importance in optimization. Environmental factors like wind, waves, and especially currents significantly influence design processes, introducing uncertainties when comprehensive data are lacking. Marine growth posed a significant challenge in prior FOWT projects and must be considered carefully. Considering the potential impact of climate change is crucial, especially for extreme weather events. Early integration of environmental considerations and assessment of effects on socio-economic impacts is essential for a successful project. The power cable response is also influenced by its inherent limitations, including tension and compression thresholds, curvature constraints, and the necessary minimum fatigue life. A flowchart is provided to aid in choosing variables and constraints in the design and optimization processes.
1. Introduction
According to the forecast by Det Norske Veritas (DNV) [1], floating offshore wind technologies are expected to account for 15% of the total offshore wind capacity by 2050. To achieve this, around 20,000 OWTs must be mounted on floating platforms [1]. However, these technologies are in the early stages of development and require commercialization for broader adoption. Cost reduction is crucial for economic viability, with standardization, larger OWTs, and industrialization being key factors [1]. Further, larger offshore wind farms and optimized mooring and cable systems are essential to lower costs [1].
Over 20% of total project capital costs account for offshore transmission, inter-array cabling, and offshore substations, as reported by the International Energy Agency (IEA) [2]. According to GCube [3], subsea cables, both inter-array and export, accounted for a majority (30%) of all insurance claims in the offshore wind industry from 2010 to 2020 and exceeded 50% of the total claims expenditure during this period. Dynamic power cables are relatively new to the offshore wind industry and incur higher costs for floating than bottom-fixed offshore wind technologies, which do not require them. Therefore, thorough design analysis and optimization of power cable configurations are essential for successful FOWT farms. This is particularly critical with the expected growth of FOWT farm sizes and the need for a significant amount of inter-array electricity transmission. Therefore, the present study discusses the different parameters that influence the design and optimization of dynamic inter-array power cable configurations. Further, the uncertainties of the design parameters are discussed.
The present paper is organized as follows. Section 2 presents the state-of-the-art dynamic power cable configuration design processes. Section 3 comprises the rules and regulations. The design objectives are discussed in Section 4, the variables in Section 5, and the constraints in Section 6. Section 7 shows an overview of published optimization algorithms. A flowchart to determine the most relevant optimization parameters is presented in Section 7. Conclusions are drawn in Section 8. A comprehensive list of references is also presented.
2. The State of the Art of Dynamic Power Cable Configuration Design Processes
OWTs convert wind kinetic energy into electrical energy, which is transmitted to consumers through a network of power cables. The inter-array cables connect OWTs within offshore wind farms, forming feeders that link to collectors or substations [4]. From there, an export cable transmits electrical energy to consumers, such as land-based grids or offshore platforms. In offshore wind farms with bottom-fixed OWTs, inter-array cables are either statically laid on the seabed or buried. In floating offshore wind farms, the power cables connect to FOWTs. Therefore, they must be designed to account for dynamic responses caused by FOWT motions and environmental loads.
In the FOWT farms in operation today, one FOWT acts as the collector or substation of all feeders. This can be seen in commercial FOWT farms currently in operation: Hywind Scotland [5], Kincardine Offshore Wind Farm [6], Hywind Tampen [7], WindFloat Atlantic [8], and the METCentre test site [9]. Larger FOWT farms may require substations with a transformer connecting the inter-array and export cables. The test site Fukushima FORWARD is the first to have a floating substation in operation [10]. The transformer contains a significant amount of toxic oil and is an environmental threat in the case of substation failure [11]. Therefore, the substation must have a resilient mooring system with high safety levels [12]. The dynamic section of the export cable from the FOWT or the substation faces constraints like those of the inter-array cables. Nevertheless, its configuration might be designed differently than for inter-array cables in an FOWT farm, as they usually have a larger diameter and other stiffness values.
The design of a dynamic power cable configuration is usually a time-consuming iterative process performed by an experienced engineer. First, a hypothesis is made on the configuration setup that will be feasible for the given problem. Simulations are then performed, and the results are evaluated against the design constraints. Afterwards, the hypothesis is updated, and the process is repeated until it converges to a solution. Power cable configuration design is often considered after the FOWT floater and mooring system are designed. It is commonly assumed that power cable motions have a negligible influence on FOWT behavior and can be considered separate.
The design of oil and gas (O&G) industry risers and mooring systems has been performed together numerous times [13]. Ja’e et al. [14] provided an overview of such studied and implemented systems. The combined consideration is crucial for the functionality and safety of riser systems, as damage can have fatal repercussions. Similarly, the safety levels for offloading lines must be high to prevent severe incidents. Mooring systems and power cables are not as closely reliant on each other in offshore wind farms as mooring systems and O&G lines containing highly flammable fluids. That is because damaged power cables have fewer consequences on human lives and the marine environment than a damaged riser or an offloading line can have. Even though this means that lower safety levels may be applied to power cables [15], they are nevertheless a crucial part of the functionality of offshore wind farms. A damaged power cable disrupts the connection between the electrical energy-generating wind turbine and the consumer, resulting in zero revenue and possibly high repair costs for the wind farm owner and operator.
Offshore wind farm power cables are also referred to as “power umbilicals” as they are a specific type of umbilical. Umbilicals focus on providing various services to offshore equipment, whereas power cables concentrate on transmitting electrical energy over long distances from FOWTs to consumers. OWTs have already exceeded the number of facilities installed in the O&G industry by tenfold, and the demand is projected to rise [15]. That means a much larger quantity of power cables is necessary for an offshore wind farm project compared with the umbilicals needed in an O&G project. In addition, FOWTs often have response characteristics or failure modes that differ from O&G platforms [15]. FOWTs are mainly without crew and do not contain explosive hydrocarbon fluids that can threaten humans and the environment. The overall configuration design can be like the umbilical design in the O&G industry. However, caution is needed when applying umbilical configuration design practices to dynamic power cable configurations due to differences in diameters, stiffness, components, function, applications, and system-level reliability.
3. Rules and Regulations
Several rules and regulations have already been implemented for power cable configuration design. Nevertheless, limited regulations on dynamic power cable configurations are currently being established. For example, the standard DNV-ST-0119 [16] states that this is the responsibility of the supplier. The following list shows relevant codes, standards, and recommended practices:
- -
- ISO 19900 “Petroleum and natural gas industries—General requirements for offshore structures” [17]
- -
- ISO 19901-1 “Petroleum and natural gas industries—Specific requirements for offshore structures—Part 1: Metocean design and operating considerations” [18]
- -
- ISO 13628-5 “Petroleum and natural gas industries—Design and operation of subsea production systems—Part 5: Subsea umbilicals” [19]
- -
- ISO 13628-11 “Petroleum and natural gas industries—Design and operation of subsea production systems—Part 11: Flexible pipe systems for subsea and marine applications” [20]
- -
- DNV-ST-0119 “Floating wind turbine structures” [16]
- -
- DNV-ST-0359 “Subsea power cables for wind power plants” [21]
- -
- DNV-OS-E301 “Position mooring” [22]
- -
- DNV-RP-0360 “Subsea power cables in shallow water” [23]
- -
- DNV-RP-F401 “Electrical power cables in subsea applications” [24]
- -
- DNV-RP-C205 “Environmental conditions and environmental loads” [25]
- -
- NORSOK-N003 “Action and action effects” [26]
- -
- API RP 2A-LRFD “Recommended practice for planning, designing and constructing fixed offshore platforms—load and resistance factor design” [27]
- -
- API RP 2A-WSD “Recommended practice for planning, designing and constructing fixed offshore platforms—working stress design” [28]
- -
- API SPEC 17E “Specifications for subsea umbilicals” [29]
Other regulations that the configuration must comply with are defined by the government responsible for the site. This often includes environmental restrictions.
In the pursuit of cost competitiveness, there have been considerable cost reductions in the planning phase of offshore wind projects over the last decade, and thus also in production, building, and operation. However, this emphasis on cost efficiency has negatively impacted safe design concepts. Consequently, there has been a rise in both the frequency and seriousness of insurance claims within the sector [3]. Proper insurance is essential to protect the public from paying for a malfunctioning offshore wind farm project [11].
4. Design Objectives
The design objective refers to the specific goal or outcome that the design process of a project aims to achieve. For power cable configurations, they are mostly related to economic and performance indicators, which are explained in more detail in this section. Overall, the most important objective should always be to create a safe design that will work.
4.1. Economic Indicators
Most design and optimization objectives are directly or indirectly related to minimizing costs. For power cable configurations, several economic indicators can be relevant. Some key indicators considered early in the design process can help minimize long-term costs and are presented here:
- -
- Levelized Cost of Energy (LCOE): It is a widely used metric to assess cost-effectiveness by considering total lifetime costs divided by total lifetime energy output, with lower values indicating efficiency [30]. The LCOE of floating offshore wind projects is about five times as high as for bottom-fixed offshore wind projects [1]. Predictions for the future vary, including higher, equal, and lower LCOE values by 2050 for floating compared to bottom-fixed offshore wind projects [1]. Nevertheless, they all predict a decrease in the LCOE for floating offshore wind projects due to technological advancement [31].
- -
- Capital Expenditure (CapEx): This metric refers to the initial investment required to design, manufacture, and install the floating wind turbine and its associated power cables. For offshore wind projects, most lifetime costs occur for the development and construction of the project as CapEx [31].
- -
- Installation and decommissioning costs are considered parts of capital expenditure: A design can have low costs considering the price of the components involved, but it might be costly during transport, installation, and decommissioning. Improper consideration of these costs has been a major problem in past renewable energy projects, such as when removing wave energy converters (WECs). It can quickly lead to bankruptcy [32]. Further, the available equipment for installation and removal must be considered in the design process to avoid using unusual or hardly available equipment, which can be very costly. Also, the choice of ancillaries should be made considering the need for potentially new molding and their installation time, which can increase and raise costs.
- -
- Operating Expenditures (OpEx): These are the day-to-day costs, covering expenses like rent, utilities, salaries, maintenance, and other essential operational needs. Maintenance costs include regular inspections and repairs throughout the lifetime of the power cable configuration. These costs can vary based on cable design, materials used, and accessibility for maintenance crews. Critical components, such as the hang-off section and the touch-down point (TDP), are crucial for the integrity of the system. Addressing these early in the design process can prevent future repair work. Regularly removing marine growth from the power cables and ancillaries can significantly raise maintenance costs. If considered correctly, the need for removals or buoyancy additions throughout the lifetime might be limited. Rinaldi et al. [30], Garcia-Teruel et al. [33], and Yang et al. [34] present analyses including operation and maintenance costs for FOWTs.
- -
- Regulations and permits: Compliance with regulations and permitting requirements can influence design choices and costs. For example, factors such as seabed intervention (e.g., trenching or similar activities), marine life entanglement, trawling entanglement, and ghost net entanglement must be carefully assessed, as these can be regulated and require specific permits. Further, it may be necessary to obtain an initial technical qualification for a new power cable system.
- -
- Risk assessment: Economic indicators should also incorporate risk analysis at every design stage. Identifying potential failure points, downtime risks, and their financial consequences is crucial for estimating overall project costs accurately. It helps to account for unforeseen events such as supply chain disruptions or regulatory changes.
- -
- Future expansions and upgrades: Designing for future expansion and upgrades helps minimize project costs by avoiding costly modifications later. Anticipating potential expansions and technology improvements in FOWT farms, leading to increased power generation, is crucial for long-term viability.
Further economic indicators that influence the design objectives include, for instance, the selection of the discount rate for the project, the optimization of the Net Present Value (NPV) of the project, given the selected discount rate, Return on Investment (ROI), and Weighted Average Cost of Capital (WACC) [35,36].
In academic research and industrial projects, specific cost data are often unavailable. Therefore, different objectives related to cost reduction may be used, particularly for feasibility research studies and preliminary designs in early project stages. The following presents some of these objectives:
- -
- Minimize cable lengths: Shorter cable lengths reduce both electrical losses and material costs associated with cable manufacturing and installation. Power transmission efficiency can be improved by strategically planning cable configurations and routes and minimizing unnecessary detours, ensuring the electricity reaches its destination with minimal loss. However, a difference in cable length by a few percentage points may not significantly affect capital and operational costs, depending on the project.
- -
- Minimize the use of ancillaries: Ancillaries represent an additional cost to the power cable. Using as few ancillaries as possible can reduce costs as well as installation and maintenance times.
4.2. Performance Indicators
Proper design objectives are crucial for long-term project feasibility, ensuring reliability, safety, and regulatory compliance. Performance-focused goals are essential for power cable configurations, alongside economic indicators, to guarantee project viability and safety. Several possible objectives are the following:
Maximize performance: The performance of power cables relates to their ability to handle the required data transmission rates, power levels, and signal quality without significant losses or degradation. Finding the right balance between performance and cost is essential for ensuring the economic viability of the project.
Maximize reliability: For example, at some FOWT farm locations, such as off the eastern coast of Japan, the cable cannot be repaired for half a year due to the harsh environmental conditions during certain seasons [37]. Design efforts should focus on minimizing the risk of cable failures, downtime, and maintenance disruptions.
Safety and compliance: Design efforts should aim to facilitate the design to comply with relevant codes and standards.
Minimize environmental impact: The environmental impact should be considered at every project stage [33]. Offshore cable designs must minimize the environmental impact by choosing routes away from sensitive ecological areas and using installation, maintenance, and decommissioning techniques to reduce impact.
Minimize footprint: The footprint of an offshore structure refers to the area on the seabed or ocean floor that the subsea structure occupies or covers. Its size can be minimized to possibly decrease the amount of material needed, reduce the environmental impact, keep the equipment in the regulatory zones, or keep clear of fishing routes. The placement of the power cable configuration heavily depends on the environmental conditions and the mooring system, which all need to be considered together.
Extend the lifetime of the cable configuration: Offshore projects often exceed their initial timelines. To extend the life of a power cable configuration, the current system is assessed, and analyses are conducted to determine its expected lifetime. Necessary measures may be taken to make the extension feasible, such as adding buoyancy modules or redesigning hang-off sections.
5. Design Variables
A design variable is an adjustable parameter or factor that influences the design, behavior, or performance of a system. For the design and optimization of power cable configurations, key variables are the material choice of the actual cable, overall configuration design, and the design of special components and ancillaries.
5.1. Power Cable Selection
The design of the power cable is usually heavily site- and project-dependent. First, the choice of the voltage rating and between alternating current (AC) or direct current (DC) technology must be made. Usually, the inter-array cables use medium- or high-voltage AC due to the short distances covered. They are rated up to 66 kV in current projects, depending on the wind turbines and the cable length [5,38,39,40]. With OWT sizes increasing compared to OWTs that have been installed in the past [41,42] the power cable sizes increase as well, and are expected to rise to a voltage rating of 132 kV [43] and beyond [44]. Larger cable diameters lead to new challenges, especially regarding cable buckling and conductor creep [38].
The power transmission capacity within a feeder varies as the cables transmit energy from nearby and distant OWTs. A cost-effective approach is using a single cable design sized for the largest load, applicable to all inter-array cables [45]. The different feeders are combined at the collector or substation, and an export cable with a high-voltage AC or an ultra-high-voltage AC connects the FOWT farm to consumers [5,38]. With increasing FOWT farm sizes and further distances from shore or consumers, DC technology can be used for the export cable, as has been installed in fixed-bottom offshore wind farms [46,47]. Note that the electrical energy loss in DC cables is less than that in AC cables. However, the costs of a substation transforming the current from DC to AC at the farm location and back to DC at a substation near the consumers can increase capital expenditures.
Figure 1 shows an exemplary cross-section of a power cable, including the conductors, optical fibers, insulation, and any shielding or protective layers. The conductor area determines the current capacity, with larger areas allowing higher currents. Power cables commonly have several layers of armor to define axial, bending, and torsional stiffness. Smaller diameter cables of lower current rating do not necessarily have to be equipped with armor, reducing costs and facilitating the installation and maintenance; see Ringsberg et al. [48].
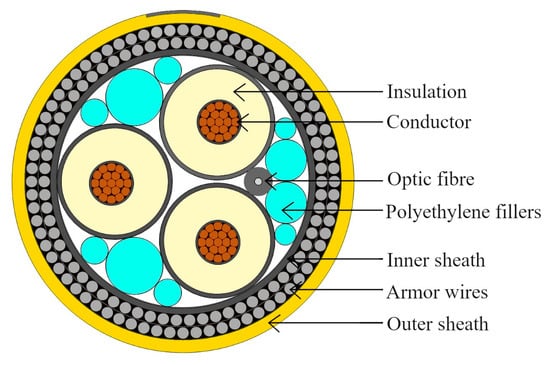
Figure 1.
Exemplary power cable cross-section with copper cores.
The primary objective of various cross-sectional components is to determine the behavioral properties of the power cable and to protect the conductor core. Copper and aluminum are commonly used for cable conductor cores, with copper being the prevailing choice today. Aluminum cables were studied by Thies et al. [49], Schnepf et al. [50], and Ahmad et al. [51]. An actual aluminum cable was first implemented for the TetraSpar FOWT in the Northern North Sea, which is currently operating [52]. In cables with identical voltage ratings, the cross-sectional area of the copper conductor core is typically smaller than that of its aluminum counterparts. Additionally, copper cables exhibit a more significant weight per unit length when compared to aluminum cables of equal conductivity [53]. This difference is due to copper being more conductive than aluminum and the low density of aluminum [53]. Therefore, the submerged-weight-to-diameter ratio is usually lower for aluminum cables than for copper cables of the same conductivity [50].
5.2. Configuration Design
Ikhennicheu et al. [45] and Clausen and D’Souza [54] provided overviews of overall configurations successfully implemented for O&G risers, offloading hoses, and umbilicals. Figure 2 shows several configurations that can be used for dynamic power cable configurations of FOWTs.
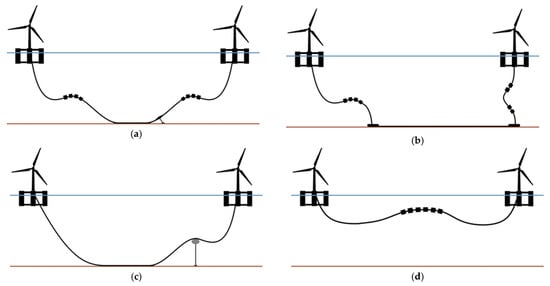
Figure 2.
Different power cable configuration types. (a) Lazy-wave (left) and tethered-wave (right) configurations. (b) Steep-wave (left) and Chinese lantern (right) configurations. (c) Catenary (left) and lazy-S (right) configurations. (d) Suspended configuration.
A vastly researched configuration is the lazy-wave configuration shown in Figure 2a (left), which was the study subject of, for example, Rentschler et al. [4,55], Thies et al. [56], and Zhao et al. [57]. It has been installed in the FOWT farm WindFloat Atlantic [8]. The lazy-wave configuration has a section of buoyancy attached to the cable between the FOWT and the TDP on the seabed. This way, the motions of the floater can be decoupled from the lower hanging cable sections and the TDP to a large extent. It is a simple configuration that only needs buoyancy modules attached to the cable, a bend restrictor at the connection to the FOWT, and possibly cable protection at the seabed.
Double lazy-wave power cable configurations are usually considered in shallower water depths, having two buoyancy sections instead of one [57,58,59]. Such a system has been installed in the China Three Gorges (CTG) Yangxi Shapa III wind farm, where an FOWT is connected to a fixed-bottom monopile wind turbine in water depths from 29 m to 35 m [60,61].
The tethered-wave configuration is very similar to the lazy-wave configuration, and is also named the pliant-wave configuration. In addition to the lazy-wave setup, it has a tether restraining the motions of the power cable at the TDP, as shown in Figure 2a (right). This effectively limits motions at the TDP when the wave configuration decouples them from the floater. Further, it controls the TDP location throughout its lifetime, preventing damage and alterations caused by factors such as extreme weather and marine growth. On the other hand, the tethered-wave configuration needs more equipment than the lazy-wave configuration, making installation more complex. The commercial floating offshore wind farms Hywind Scotland [5] and Hywind Tampen [7] use tethered-wave configurations.
The steep-wave configuration in Figure 2b (left) is a wave configuration, with the distinction that the cable is vertically connected to a seabed junction with a bend stiffener. It has the advantage that an excursion of the cable close to the seabed can be prevented. This configuration has often been used in O&G applications to connect subsea equipment with a vessel or platform at the sea surface, for example, using a riser from a subsea wellhead to a floating production facility [62].
Chinese lantern configurations, as shown in Figure 2b (right), have been used primarily with Catenary Anchor Leg Mooring (CALM) buoys [63]. A buoyancy section to decouple the motions of the floater from the bottom location keeps the cable in a U-shape in a vertical direction. The cable is usually vertically connected to a seabed junction with a bend stiffener. This configuration is usually installed in shallower water depths [63].
The most straightforward configuration is the catenary configuration shown in Figure 2c (left), also often referred to as “free hanging”. It does not require additional equipment except for possibly a bend restrictor at the hang-off location and protection at the TDP. Nevertheless, it does not decouple the motions of the floater from the TDP, which can make it challenging to apply [4].
The lazy-S configuration in Figure 2c (right) is also like the lazy-wave configuration. However, instead of buoyancy modules attached to create an arch, it uses fewer and larger buoyancy devices, such as a buoy. That buoy can be tethered or buoyant, controlling the hog bend location. It reduces the excursions of the power cable under the current. An altered lazy-S power cable configuration with six buoys attached to a tether configuration was successfully used for two years at the Haenkaze FOWT while it was installed off Kabashima Goto, Nagasaki prefecture, Japan [64]. Another example is the Wello wave energy converter project off the coast of Scotland, United Kingdom, where the lazy-S configuration had been implemented with a buoyed loop stabilized by a chain [65]. The subsea buoy can also be implemented in a tethered-S configuration with an additional tether to control the TDP and a steep-S configuration with a vertical connection at the bottom.
The suspended power cable configuration is shown in Figure 2d. In this configuration, the cable does not touch the seabed, which can be useful for deepwater applications and reduces costs due to shorter cable lengths and less additional equipment than the other configurations. Suspended configurations are common practice for O&G offloading lines, as described by Araújo et al. [66], He et al. [67], and Kang et al. [68]. They have been researched for application with FOWTs by Beier et al. [69,70], Schnepf et al. [50,71], Ahmad et al. [51], and Li et al. [72]. Their applicability depends on the environmental conditions of the location where the cable will be installed. Buoyancy elements can be designed in one section or divided into several sections distributed over the cable length. Subsea buoys may also replace buoyancy modules to minimize drag.
The presented power cable configuration options do not depict all possible designs. They only summarize tried and tested practices in O&G and renewable energy applications. To name a few, further power cable configurations can be the double-tethered-wave, lazy-camel [54], camel-S [54], and corkscrew [73] configurations. Configurations applied in the O&G industry that have weights added in the configuration are, for example, the weight-added wave [74,75], multi-wave with weights [76], and touchdown chain-added wave [74]. Power cables usually need extra ancillary equipment, such as buoyancy modules and bend stiffeners, to successfully implement configurations with weights attached, not exceeding the maximum allowable tension values. An example of weight chains successfully implemented in an umbilical configuration is the “cage-hose” concept connecting large fish cages in the northern Norwegian Sea [77]. The configuration choice must be made based on the specific environmental conditions and further constraints it will encounter, which are all heavily site-dependent.
5.3. Special Components and Ancillaries
The tension in the power cable throughout the dynamic configuration is usually highest at the hang-off section from the FOWT [49,50,56,78]. This section must be designed to support and suspend the weight of the power cable, restrict it from overbending, and withstand the loads from the environmental conditions. It consists of clamps, connectors, and a bend stiffener or bell mouth. Typically, it is placed beneath the sea surface, although it can also be installed above sea level for ease of access. Dai et al. [79] addressed the behavior of dynamic steel tube umbilicals in a bell-mouth hang-off section. Svensson et al. [80] showed that the bell mouth is the most critical point for fatigue. The conductor of their power cable failed inside the bell mouth in their numerical models and laboratory tests. Further research on the hang-off section and its design variables should be carried out for dynamic power cable configuration design.
The lazy-wave and similar configurations employ numerous buoyancy modules between the hang-off point and the TDP. The size and number of the modules vary; they can all be customized [81]. As casting a mold is usually the most expensive part of the buoyancy module fabrication, standard sizes can be used to save costs. The attached buoyancy modules change the behavior of the flow around the cable, which must be considered in the analysis [82].
The cable section around the TDP can be designed in various ways. One decision is whether a tether should be installed and, if so, in what manner. This influences the overall configuration design significantly. The decision depends on the soil conditions and power cable motions, which can lead to damage. A cable protection device [81] can be attached to the power cable at the TDP to reduce wear and tear.
6. Design Constraints
The power cable configuration must be designed to endure the environmental conditions it is exposed to, as well as adhere to lifecycle, regulations, modeling, environmental, and socio-economic factors. This section discusses these aspects in detail.
Figure 3 shows critical points of the power cable configuration to which special attention must be paid in the design. These points are the hang-off location, sag bend, hog bend, TDP, and, if applicable, the tether clamp close to the TDP with the respective bend stiffeners. Further, the attached buoyancy modules and their attachment points on the power cable need special consideration. These points are especially prone to exceeding the limits of certain constraints detailed in the following.
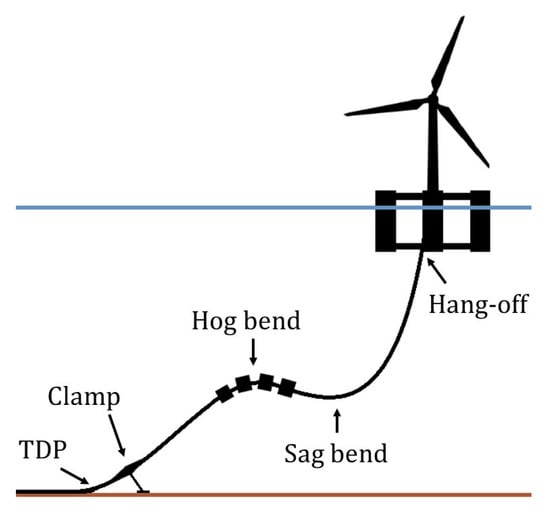
Figure 3.
The critical power cable configuration points in the design.
6.1. Environmental Constraints
This section describes how environmental factors impose limitations on power cable configurations. Extensive measurements and appropriate modeling methods are essential for determining statistical descriptions and extreme conditions for analysis [83,84]. Usually, the measurements must be taken directly at the site or nearby.
6.1.1. Wind and Waves
If a part of the power cable configuration extends above the sea surface, it becomes directly susceptible to wind and wave loads. Such a configuration is only chosen in rare instances. Typically, the entire power cable configuration is submerged beneath the sea surface, experiencing an indirect impact from wind and waves. Furthermore, wind and waves significantly determine the FOWT behavior and, consequently, the behavior of the power cable from its hang-off location.
According to DNV-RP-C205 [25] the modeling of waves for short durations is assumed to be stationary, with a duration of 3 h. For analysis regarding stable wind speed, a duration of 1 h is considered as per DNV-RP-C205. This can be disputed, as such stable conditions are somewhat uncommon [85]. Transient conditions, characterized by varying wind speeds and wave conditions, are frequently overlooked in the analyses and might be worth investigating if they can potentially lead to larger responses than initially assumed.
It is crucial to account for the most severe wind and wave conditions, particularly those where the FOWT exerts the greatest influence on the behavior of the power cable. These extreme conditions typically coincide with the generation of currents induced by wind and waves. The most extreme responses of FOWTs can occur during events such as hurricanes and typhoons. Such conditions can generate extreme FOWT motions and currents at the same time, which the power cable configuration must survive.
Furthermore, it is essential to consider special wave conditions, including exceptional occurrences like freak waves and tsunamis. Freak waves, often also referred to as rogue waves, are distinguished by their significantly greater height than the surrounding waves. These phenomena can occur across varying water depths and arise abruptly. Certain regions exhibit a higher statistical occurrence of freak waves, notably the North Atlantic, the North Sea, the waters surrounding Australia, and the Agulhas Current south of Africa [86,87]. Their formation is attributed to the crossing of different sea states characterized by distinct energy levels and frequencies [86], as well as other factors such as interactions between ocean currents and waves [87,88]. On the other hand, tsunamis must be considered where appropriate. Tsunamis typically originate from seismic events and have extremely high water-particle velocities, directly impacting power cable configurations. Unlike freak waves, tsunamis exhibit small wave amplitudes at sea but pose a significant threat as they grow substantially in height when approaching coastal areas.
Another crucial factor to consider is the availability of sufficient wind resources, which determines the feasibility of offshore wind projects. Figure 4 shows the mean wind speeds along the coastlines of the world, with higher speeds generally indicating more favorable wind resources. Additionally, it is essential to consider the local mean wind power density, which indicates the available wind resources at a specific location [89,90].
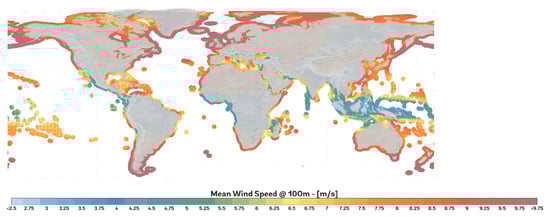
Figure 4.
World map of mean wind speed for wind resources (Reference [89]).
6.1.2. Currents
Different currents impacting offshore structures include oceanic currents (like the Gulf Stream), upwelling/downwelling currents (bringing nutrients to the surface/transporting surface water downward), wind-generated currents (influenced by wind speed and direction), tidal currents (due to the gravitational pull of the moon and sun, causing regular patterns of water movement), and coastal currents (influenced by tidal and wind-driven forces, local topography, and storm surges). The local current that must be designed for is usually a combination of the different current types.
Knowing statistics and extreme current events is essential for the design. Most current measurements are averaged over 5 to 20 min, which might undermine “gusty” strong current events [91,92]. This can lead to an underestimation of the prevalent current and its turbulence that must be considered for the design.
Current velocity profiles show the distribution of water particle velocities at different water depths. Often, the fastest velocities occur near the surface and decrease with depth. This is also the case for the general unidirectional current profile suggested in the recommended practice DNV-RP-C205 [25] characterized as a power law function. Therefore, a common design approach for power cable configurations is to avoid strong current regions by installing large cable sections in deeper waters.
Currents can exhibit varying degrees of directionality, ranging from unidirectional to bidirectional or even multidirectional. In unidirectional current profiles, water flows consistently in a single direction, such as in a river or an oceanic current. Bidirectional profiles occur when currents exhibit a reversal in the flow direction, for example, caused by tidal influences. Multidirectional profiles indicate a complex flow pattern, where currents may change direction frequently and vary in intensity. Numerous factors, including geographical features, wind patterns, tidal forces, and the presence of obstructions or constrictions in the water body, influence the directionality of current velocity profiles. Therefore, multidirectional profiles should be considered for analyzing power cable configurations according to the local conditions [93,94,95].
Extreme current events occur especially at the sea surface and can result from specific local circumstances. An exemplary region with very high surface current velocities is the Northern North Sea, reaching velocities of 2.5 m/s, as shown in Figure 5 [96]. The Norwegian Coastal Current (NCC) causes this. It originates primarily from the freshwater outflow from the Baltic Sea and the freshwater runoff from Norway. It flows northwards along the coast of Norway as a low-salinity current [97]. Figure 6 shows a satellite image of the outflow of the Norwegian Coastal Current from the Baltic Sea and its multidirectional meandering in eddies northwards along the Norwegian Coast. After storm surges from the North, vast amounts of water can flow out from the Baltic Sea. When combined with the tidal current, high current velocities occur along the coast of Norway [11,26,96].
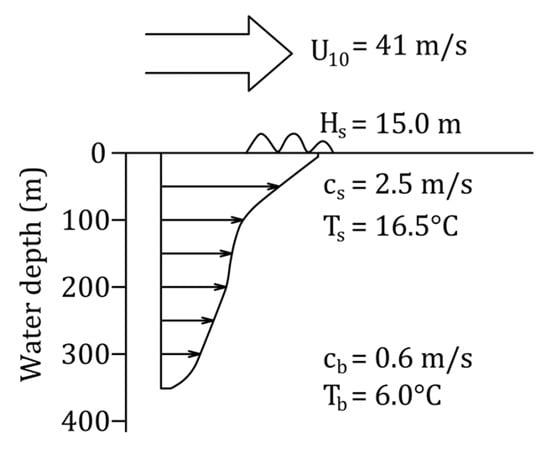
Figure 5.
The 100-year metocean design criteria for the oil and gas field Troll location in the Northern North Sea. The figure shows the extreme horizontal current velocity as a function of the water depth. —mean wind velocity 10 m above mean sea surface level, —significant wave height, —surface current velocity, —current velocity at the seabed, —water temperature at the surface, and —water temperature at the seabed (see Saetre [96] and Marechal [88]). Adapted from [26] with permission from Standards Norway.
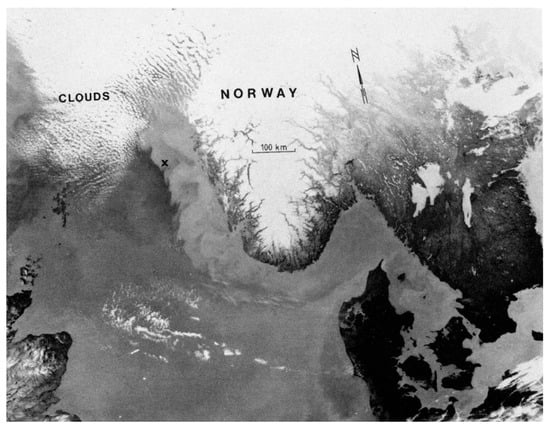
Figure 6.
A satellite image showing the Norwegian Coastal Current on 13 April 1981. Courtesy of Tromsø Telemetry Station, Norway.
Another extreme local current example is the loop current in the Gulf of Mexico. It forms from warm subtropical water streaming northwards and through the geographical shape of the Gulf [84]. It leads to large current direction and velocity variabilities throughout the entire water depth, which can also change quickly. Extreme current velocities of up to 2.10 m/s have also been measured at deeper waters, with even larger velocities at the sea surface [84]. Such extreme events can statistically occur every 50 to 100 years, making long-term measurements for currents critical, as well as proper modeling techniques to predict them [98]. Often, measurement campaigns are only carried out for a couple of months to years, which can be insufficient to estimate extreme conditions correctly.
6.1.3. Internal Waves
Internal waves are like waves at the surface of a water body. However, they occur where different water densities meet below the surface, often caused by different water temperatures [84]. The internal density gradients are significantly smaller than those at the water surface, giving the internal waves slightly different characteristics from surface waves [99]. Internal waves can have large amplitudes, wavelengths, and periods. For example, Hyder et al. [99] observed internal waves with amplitudes of about 40 m and periods of 40 min. These waves cause water particles to move both vertically and horizontally with high accelerations [100]. Hyder et al. [99] measured currents up to 0.6 m/s for their particular case of internal waves. A current with this velocity can have a significant impact on power cable configurations.
Internal waves occur in areas all over the world, often near fjords, estuaries, and straits. Some exemplary areas with potential offshore wind farm development with frequent internal wave phenomena are the South China Sea, the Sulu Sea in the southwestern Philippines, the Australian North West Shelf, and the Scotian Shelf southeast of Canada [101]. An overview of possible locations with internal waves of large amplitudes, i.e., internal solitary waves, has been provided by Global Ocean Associates (GOA) [102].
6.1.4. Water Depth
The water depth is critical in determining the dynamic subsea power cable configuration for FOWTs. Shallow waters usually require complex configurations to decouple the cable motions from the floater and the TDP [57]. Suspended configurations are not feasible in shallow water either. The currents imposed on the power cables, as well as the influence of the waves and the FOWT motions, can be significant. Additionally, the space between the seabed and the sea surface is limited, requiring complex configurations that can be prone to damage. Intermediate and deep waters facilitate power cable configuration design compared to shallow waters. However, the weight of the cable itself can pose a problem, as well as large FOWT motions, due to the large flexibility in the mooring systems, especially for deep water configurations. Nevertheless, cables at deeper water depths are less susceptible to marine growth and environmental forces, allowing different power cable setups with space for buoyancy and motion decoupled from the FOWT and the TDP or the next connection point. Furthermore, FOWTs are generally installed at intermediate to deep water depths because bottom-fixed OWTs typically have better economic viability for shallower waters. Therefore, the development of floating renewable energy technologies should focus on areas where bottom-fixed solutions are not feasible.
6.1.5. Marine Growth
Marine growth refers to the accumulation of organisms such as barnacles, mussels, algae, and others on surfaces. As FOWTs are located at the water surface, their power cables span various layers of water where they are subjected to different kinds of marine growth. The attached biomass can drastically increase the size and mass of the cable, strongly impacting its responses.
The presence of marine growth can have several detrimental effects on the power cable. First, it increases the actual diameter and roughness, and thus the hydrodynamic drag, potentially leading to higher structural loads. This can be particularly problematic when exposed to strong currents, waves, and floater motions. Second, the additional weight of marine growth can affect the load distribution on the power cable. It can lead to uneven loading and stress concentrations, potentially compromising the safety of the power cable configuration. Third, marine growth can also cause localized corrosion due to biofouling, accelerating the degradation of protective coatings and metal surfaces.
Several offshore standards, such as ISO 19901-1 [18], DNV-OS-E301 [22], NORSOK N-003 [26], and API RP 2A-LRFD [27] recommend different considerations of the marine growth effects in the design analysis of offshore structures. They agree to increase the diameter to an equivalent diameter corresponding to the roughness of the surface. Further, the drag coefficient is adjusted depending on the roughness expected at the installation location. Generally, higher water temperatures facilitate the accumulation of marine growth compared with lower water temperatures. Deeper waters have less marine growth that will be attached to the power cable than close to the surface due to the temperature, the sunlight availability, and the general flora and fauna in the different regions [26]. Accumulation can, in part, be avoided by configuring the buoyancy arc of configurations in deeper waters.
Nevertheless, the different variables used are the subject of several publications that challenge the standard. For example, Marty et al. [103] conducted experiments on cylinders with mussels and corals attached. When comparing their experimental results to calculations from DNV-OS-E301 [22] and API RP 2A-WSD [28] they found that these standards sufficiently predict drag coefficients under current conditions within the sub-critical regime but differ significantly for oscillating drag and inertia coefficients in wave and current conditions.
Further research suggests that the assumed marine growth in specific regions is insufficient when applied as described in the standards because marine growth is strongly site-specific [104]. Such an underestimation led to an incident in the Pacific Ocean in the test field off the coast of Fukushima, Japan, where a dynamic power cable connected to an FOWT became damaged due to contact with the seabed [37]. The marine growth changed the configuration of the dynamic cable so that it sank and touched the seabed in its sag point, where it was damaged and needed to be repaired. Since then, marine growth must be removed regularly, which adds costs to the research project. Okubo et al. [105] showed that the marine growth on an FOWT in the Sea of Japan (East Sea) also led to its cable sagging significantly more than expected during the design work. Later, additional installations of buoyancy devices were necessary when a sag point of the dynamic power cable configuration came critically close to the seabed. The marine growth measured at the location exceeds the general reference values suggested in DNV-OS-E301 [22]. The DNV reference values were obtained from locations in the North Sea and the Norwegian Sea, which have lower water temperatures and less marine growth than other locations with, for example, usually higher water temperatures, such as around Japan. Measurement campaigns and analyses should be carried out considering the marine growth that can occur at the specific location.
Preventive measures are often employed to manage marine growth. These can include applying antifouling coatings or materials to the surfaces of the structures to deter or minimize attachment. Okubo et al. [105] successfully applied an antifouling coating on the buoyancy modules attached to a power cable for an FOWT. Nevertheless, antifouling should be employed sparingly or ideally avoided altogether, given the significant environmental hazards stemming from its toxicity [106]. Periodic cleaning and maintenance are also carried out to remove accumulated growth and ensure the structural integrity of the power cable in several projects, as reported by Ishii et al. [37]. If unavoidable, the cost of cleaning the cable on a regular basis is usually significantly lower than risking a critical cable failure and replacement.
6.1.6. Temperature
The temperature of the surrounding environment can have significant effects on power cables. Therefore, they must be designed to withstand the different temperatures in different layers of water and the seabed while efficiently transmitting electrical power [107].
The primary concern for subsea power cables is the temperature of the conductor, which carries the electrical current. High temperatures can be generated due to the resistance of the conductor itself and the electrical load it carries. This heat must be managed to prevent cable overheating, which can lead to insulation degradation and, ultimately, cable failure [38]. Excessive heat can also accelerate the aging of the insulation materials, potentially shortening the operational lifespan. It can also affect the electrical properties of the cable, leading to losses and reduced efficiency. Cold water temperatures can reduce the conductor’s temperature. While this may help prevent overheating, it can also make the cable more brittle, which may affect its mechanical properties.
Furthermore, biofouling around the power cable can modify the heat transfer and change the temperature in the conductor, affecting its fatigue life [108]. Depending on the age of the mussels attached to the power cable in experiments by Maksassi et al. [108] the global thermal resistance led the conductor to either overheat or cool down.
6.1.7. Cold Climate
The polar regions are characterized by their unique cold climate and extensive glacial ice. These remote areas have recently become more accessible for commercial use due to technological progress and the receding sea ice. However, the polar regions have delicate ecosystems that can take considerable time to recover from even minor disruptions [109,110]. Therefore, all activities in these regions must undergo thorough environmental assessments to guarantee long-term sustainability.
Snow and icing, whether from atmospheric conditions or sea spray, can impact FOWTs, subsequently affecting the motions and loads experienced by the power cable. In colder regions, more immediate hazards to power cable setups also include sea ice and icebergs, where the latter can also be a threat to the entire wind farm. Drifting sea ice ridge keels can extend several meters below the sea surface, exceeding the hang-off location of the power cable from the FOWT. In such situations, the hang-off section and the upper part of the power cable must be equipped to withstand the presence of sea ice adhering to it or potential collisions.
6.1.8. Bathymetry and Geotechnical Conditions
Bathymetry defines the setup of the entire footprint of an FOWT farm. The primary concern when laying power cables on the seabed is the geotechnical condition of the ocean floor. Variations in sediment composition, bedrock, and unstable formations can greatly affect the stability and integrity of the power cables. Extensive geotechnical surveys must be conducted to assess the seabed conditions and make informed decisions about cable placement; these surveys should be conducted in parallel with data collection for the mooring systems. The on-bottom stability of the power cable must be considered accordingly.
In regions with soft seabed soil, there is a concern that power cables may dig themselves into the sediment over time. This phenomenon could lead to a snap load with excessive tension and potential damage when the cable is released from the soil. Burying cables over certain distances can be a solution to prevent damage. Also, more unconventional solutions, such as cable protection systems, have been implemented successfully [111]. Areas with rocky seafloor usually have rock piles or mats on top of the power cables to prevent them from moving. A solution without additional measures to keep the cable in place on the rocky seabed has been successfully tested for a power cable connected to a tidal stream turbine in the UK [112].
Certain areas have a significant risk of underwater avalanches, rock falls, and sediment shifting [113]. They can disconnect cables and create catastrophic failures in the FOWT farm, mainly due to anchor failures. On a smaller scale, the cable sections on the seabed can be suspended over distances, leading to vortex-induced vibrations (VIVs) and fatigue. Identifying and avoiding these zones is essential during the planning process of the inter-array cables and the entire FOWT farm.
6.1.9. Climate Change Impact
Due to climate change, statistics over the last decades might not always be a reliable basis to estimate future environmental conditions accurately [114,115]. The environmental conditions have been changing in the last few decades, with a general trend towards more extreme sea states. In some locations, extreme values may appear more frequently than before; this can, for example, mean that the 100-year condition is the new 50-year condition. For example, Feng et al. [115] obtained a change of 0.82 m in annual and 1.39 m in winter over 30 years of measurements in the Norwegian Sea. According to them, this is a change that never occurred that rapidly before their measurements. As another example, Taiwan experiences typhoons significantly less frequently than in the past, whereas the sea temperature around the island is rising at the same time [116,117]. This influences, for example, the wind, waves, current, and marine growth conditions that FOWTs installed there will experience. Modeling techniques and designs must consider these uncertainties and should refer to a ‘dynamic design baseline’ in the future, where appropriate.
6.2. Response Constraints
Multiple factors influence the behavior of a dynamic power cable. External factors are loads exerted by the surrounding environment and the motions of the components to which the power cable is connected. The inherent structure of the power cable not only dictates how it responds to these external forces but also constrains the flexibility of the cable. The power cable structure has specific thresholds that must not be exceeded to maintain the integrity of the system. Therefore, several methods of analysis to obtain the failure modes of the power cable components by carrying out global configuration analysis have been proposed, for example, by Ran et al. [118] and Young et al. [119]. This section is about these crucial constraints governing the responses of the power cable in the global configuration.
Each structural component and section of a power cable has a distinctive failure mode linked to its material properties and strain response. For example, when a cable is bent beyond its minimum bend radius, it can suffer from a phenomenon known as ‘bird caging’ [120]. When a typical power cable is bent too sharply, the outer layers are stretched along the outer curve of the bend while the inner layers are compressed. This unequal stretching and compression can cause the outer insulation and shield to deform and create small gaps or openings resembling a birdcage. This damage often occurs due to sharp bends during the installation of power cables. However, it can also appear during operations when the cable is subjected to excessive compression. Dobson et al. [38] provided an overview of the critical failure modes of power cables.
6.2.1. Tension and Compression Limits
The manufacturer of the power cable provides tension and compression limits. Tension limits denote the maximum tensile stress a cable can bear without undergoing permanent deformation or failure. Compression limits define the maximum compressive stress a cable can endure without buckling or collapsing. Exceeding these limits can lead to elongation, plastic deformation, or even breakage, compromising the structural stability of the entire system. Experiments are conducted to obtain these limits; see Ringsberg et al. [48], Grivas et al. [121], and Nasution et al. [122].
One particularly high-risk area for exceeding the maximum tension limit is the hang-off, where the cable experiences motions from the floater, curvature loads, and static tensile loads from the weight of the hanging cable [50,56,123]. Factors such as cable temperature, service loads, solar radiation, insulation, and mechanical and electrical loads contribute to this risk.
The sag and hog bends of the power cable configuration are usually subjected to cyclic compression and bending, which makes them a significant risk area for exceeding the maximum compression limit [118]. If buoyancy modules, bend stiffeners, and clamps are applied with excessive pressure, they can hinder the lateral movement of helical components in the cable [38]. This restriction might cause compressive overload or amplify fatigue loading in the armor or conductors, posing a severe threat to the integrity of the cable. Proper attachment techniques are essential to prevent unintended stress concentrations that could compromise the reliability of the cable.
6.2.2. Curvature Limits
The ability of a power cable to withstand maximum curvature is directly tied to its capacity for enduring compression forces. In most cases, designs allow for minimal to zero compression stresses, strictly adhering to maximum allowable curvature requirements. The manufacturer of the power cable provides the limit values. Note that the minimum bend radius is often used to ensure the maximum allowable curvature instead of the maximum curvature constraint.
An important point of the power cable configuration where exceeding the maximum curvature becomes critical is typically the TDP location. It is subjected to cyclic bending, compression, and abrasive loading due to contact with the seabed. Preventing failure at this point often involves implementing a cable protection system. Such a system restricts bending and shields the power cable from abrasion. By limiting cable movements with a tether, such as in the tethered-wave configuration, stability at the TDP can be better controlled compared with a lazy-wave configuration.
Additionally, there are other crucial locations in the design where surpassing the maximum curvature constraint can be a concern. These include the hog bend, sag bend, hang-off location, and tether clamp. The sag and hog bends must be equipped with appropriate buoyancy to support the cable and prevent overbending. Furthermore, the hang-off location requires a bend stiffener or bell mouth to prevent the power cable from overbending [79,124]. The hang-off section and the seabed tether connection are commonly custom-designed for each project to meet the specific design requirements and ensure optimal performance.
6.2.3. Fatigue
Due to the dynamic loading of the power cable configuration, the cable itself is subjected to significant fatigue. The primary cause of fatigue damage in dynamic cables is the stress resulting from cable bending rather than tension [119]. The relevant design constraint is the fatigue life, meaning the minimum lifetime the cable can operate before breaking.
In academic literature, cables are often simplified as single homogeneous materials with equivalent cross-sections, assuming infinite friction between layers, as seen in Rentscher et al. [55]. This methodology generally offers a conservative assessment of stress and strain levels, as it does not account for potential slippage between layers that might mitigate stress within the cable. Land et al. [125] supported this assumption, as the obtained strain for their full-stick cable model is significantly larger than for their full-slip model. Nevertheless, they chose to use the full-slip model to be more realistic. That the non-slip assumption is conservative can be challenged, as it might not apply to every case. Beier et al. [69] demonstrated higher stress values in their power cable model, incorporating friction, in contrast to the identical cable configuration with zero friction. This finding suggests that considering interlayer slip could result in more realistic estimations of stress and strain in cables.
Most published fatigue estimation studies primarily focus on assessing the fatigue of copper cable conductors. A more extensive study by Beier et al. [69] supports that approach, as the conductor is the first component to fail due to fatigue. The cores are typically made from electrolytic tough pitch (ETP) copper, which exhibits mechanical properties such as stress relaxation and non-linear stress–strain behaviors [125]. Therefore, when evaluating fatigue in such cables, it is recommended by Karlsen et al. [126] to use strain-cycle (ε-N) curves instead of the more common stress-cycle (σ-N) curves.
A larger transmission capacity, either by increased voltage or conductor cross-sections, increases the physical footprint of cable components or introduces new components in a dynamic cable context. For example, a radial water barrier is needed to protect the insulation system against humidity and prevent the water treeing failure mechanism [127]. Fatigue as a failure mode becomes increasingly relevant and critical where the relevant mechanisms and material selection differentiate from the lower voltage standard [44].
A notable issue encountered is the underprediction of low-frequency floater surge motions in numerical software [128,129,130,131]. Holcombe et al. [128] compared the numerical results from three potential-flow-based software to the experimental results of an FOWT exposed to waves. All three software models underpredicted the FOWT surge response in low-frequency wave regions compared to the experimental results. This can result in a considerable underestimation of power cable fatigue damage. Land et al. [125] found that by increasing the low-frequency surge responses of the FOWT by 20%, based on the findings of Robertson et al. [130] there was a notable increase of 2.1% in the curvature of the power cable. Furthermore, this adjustment led to a significant 13% increase in the annual fatigue damage compared to the simulation results that did not incorporate the increased surge responses.
6.2.4. Torsion Limits
In general, umbilicals possess relatively low torsional stiffness, making them vulnerable to damage caused by excessive torque or twisting [132]. The risk of torsion damage is particularly high during installation [132]. During operation, torsional failure is not regarded as a large threat, as it is seldom reported as an incident [133]. Torsion has a minimal impact on the structural response of umbilical cables during the global configuration analysis [134]. When the wires are coiled in a helical pattern, the power cable experiences tension when it is twisted. These loads can lead to the rupture of helical elements if applied excessively [133]. However, the torsion within helical elements is minimal and does not affect the cross-section of the umbilical cable; instead, tension induces the torsion [134]. Therefore, torsion limits are usually neglected in the analysis of power cable configurations, and often even the effect of torsion itself.
6.2.5. Snap Loading
Snap loading refers to a sudden, significantly higher load on a power cable than its rated capacity. The most common occurrence of such an event is during installation, but it can also occur during operation. This excessive load can be caused by factors such as intense drag forces on specific cable parts, like the buoyancy section, and pulling forces induced by the FOWT. A more common scenario involves the cable becoming stuck in seabed mud. If weather conditions cause substantial floater motions, the cable can be strongly pulled at the TDP, leading to a snap load. Design considerations must prevent such occurrences.
6.2.6. Resonance
The oscillations of the FOWT floater can be close to the natural frequencies of the power cable in specific degrees of freedom. Resonance poses a significant risk, potentially causing cable damage and fatigue. The fundamental frequency of the power cable setup can be adjusted, especially by positioning buoyancy at specific distances from the hang-off location. The fundamental frequency of the power cable heavily relies on the catenary between its hang-off and first buoyancy attachment [50].
When the power cable is suspended and the connected FOWTs move asynchronously, as is typical in actual sea conditions, a resonance between the movements of the FOWTs and the power cable can occur. In this context, the bending radius can be a critical factor, potentially leading to failures.
Resonance can also arise from vibrations originating in the FOWT, transmitted to the power cable through the hang-off point. This is important because the FOWT inherently vibrates due to rotor rotation and system elasticity. The configuration must be designed to avoid exposure to its natural frequencies to prevent issues.
The impact of the power cable configuration on the FOWT is usually small. The power cable is usually considerably lighter than the FOWT structure. However, when a heavy cable is used on a lightweight platform, it can substantially affect the responses of the platform. Schnepf et al. [50] showed that their suspended power cable increases the low-frequency sway and roll responses of the spar FOWT to which it is attached. If this occurs, it must be accounted for in the analysis.
6.2.7. Vortex-Induced Vibrations (VIVs)
Vortices are formed behind a structure encountering a current. These vortices impose forces on the structure, resulting in VIVs. They can cause increased drag forces in the flow direction and significant accumulated fatigue damage [101,135]. The impact angle of the current towards the power cable configuration greatly influences the VIV behavior [136]. Discrepancies between different VIV estimation software can occur [136] and should be subject to further investigations. If VIVs are present in the power cable configuration, they should be suppressed with devices such as strakes, or the configuration should be redesigned to avoid VIVs [137,138]. Optimization of the configuration to avoid VIV effects can save costs due to a longer asset lifetime [138,139].
6.3. Geometrical Constraints
Geometrical constraints involve seabed and sea surface clearance, as well as ensuring safe placement regarding other infrastructure and ancillaries.
6.3.1. Clearance to the Seabed and Sea Surface
A specified minimum distance from the seabed, i.e., seabed clearance, in specific sections, is a constraint in nearly all published optimization algorithms for power cable configurations. This requirement is crucial to prevent uncontrolled contact between the power cable and the seabed, which can damage the cable. Additionally, it aims to prevent a change in behavior in the power cable due to the near-wall effect. Among all sections of the power cable configuration, the sag bend is the most critical area where unwanted contact with the seabed can occur.
Opposite to the sag bend, the hog bend has a risk of encountering the sea surface. This must be avoided to prevent large loads on the power cable from waves. Depending on the type of optimization algorithm, a constraint on the sea surface clearance should be implemented.
6.3.2. Placement to Other Infrastructure
The power cable must be placed so that it does not cross any other lines when viewed from atop, such as other power cables, moorings, and other infrastructure. This is a primary concern in optimization algorithms for the overall layout of the inter-array cable system. Also, this needs to be considered, especially for the dynamic power cable configuration excursions. Depending on the environmental conditions, the power cable can have large excursions leading to potential interaction with mooring lines, which must be avoided. Crossing pipelines and cables can be necessary and possible with special precautions [21].
6.3.3. Inherent Constraints of Ancillaries
Ancillary components are typically designed to meet specific configuration requirements, but also have inherent limitations. For instance, buoyancy modules are rigid and cannot conform to the curvature of the power cable. Similarly, bend stiffeners are limited in their flexibility due to material constraints [140,141]. These limitations primarily stem from production constraints, such as restricted mold casting and oven sizes, which impose geometric restrictions. Additionally, it is important to guarantee that the design of ancillary components facilitates installation with minimal risk and cost.
6.4. Lifecycle Constraints
The project lifecycle for a power cable configuration can be divided into seven phases: preliminary design, detailed design, manufacturing and testing, load-out, transport and installation, commissioning, in-service, and decommissioning [21]. Each phase imposes limitations on the design, which are discussed in this section.
6.4.1. Installation
According to GCube [3] approximately 44% of their cable insurance claim expenses can be traced back to errors made by contractors during transit and cable laying. Therefore, it is crucial to consider complying with the constraints during load-out, transport, installation, and commissioning. During installation, similar response and geometrical constraints apply as those during operation. Additionally, the torsion damage risk is high, occurring below the final sheave on a laying vessel when it turns. This occurs due to the weight of the cable inducing a twist, leading to friction preventing rotation as it exits the sheave, potentially causing various failures [142]. Preventive measures involve maintaining cable tension and utilizing torque-balanced armor to minimize torsion effects. Other noteworthy risks include elongation damage and crushing, where the cable falls uncontrolled onto the seabed. Okkerstrøm et al. [143,144] provided an overview of risks and factors to consider during the installation.
6.4.2. Operation and Maintenance
The primary operational cost drivers for offshore wind farms are regular inspections and failures that necessitate maintenance and repair of moorings and cables [1]. A durable system design with minimal failure is crucial to reduce these costs. Also, the power cable configuration must be designed to guarantee adequate access for inspection, maintenance, and repair. When major repairs on FOWTs are required, they might be towed to port, as for the Hywind Scotland FOWT farm [145]. The cable will be disconnected from the FOWT and left at its current location. The design must consider how the cable can be placed in this situation. Possibilities include dropping the cable to the seabed or keeping it afloat with buoys. Measures should also be implemented to prevent entanglement with nearby fishing equipment.
6.4.3. Decommissioning
How the power cable configuration will be decommissioned must be considered from the start of the design. How the seabed will look afterwards is specified in governmental regulations. The decommissioning process of the power cable configuration needs to be planned from the initial design stage. Ongoing debates exist about whether all objects added during installation should be removed or if disturbing the seabed during cable extraction is acceptable [146]. Governmental regulations specify the post-removal seabed appearance [147]. Additionally, the recycling possibilities for power cables should influence the initial cable selection [53].
6.5. Modeling and Analysis Limitations
Efficient simulations are crucial for cost savings, sparking ongoing debates in research on minimizing simulation durations [148,149]. Fast and accurate results are crucial, especially in optimization when numerous simulations are required. The equation of motion is solved in many software, such as described by Orcina [150]. Often, a compromise between time efficiency and precision must be found. Various methods are therefore employed:
Frequency domain analyses: Analyzing power cable configurations in the frequency domain shows their responses to various frequencies. Identifying critical resonance frequencies enables adjustments in the system design to prevent resonances. Frequency domain analysis is generally fast. However, it fails to capture the dynamic responses of coupled complex systems, for example, the FOWT floater and rotor.
Static and steady-state analyses: Steadier results can sometimes be obtained through steady-state or static calculations in optimization algorithms. However, they often necessitate the use of safety factors for accuracy.
Dynamic simulations: For the most precise analyses and optimizations, dynamic time-domain simulations are employed. However, these simulations usually demand significantly more time than frequency and static analysis. Optimization typically means a compromise between time efficiency and precision.
6.6. Environmental Impacts
Installing, operating, and decommissioning subsea power cables have significant environmental impacts, as outlined by Taormina et al. [151]. Installation and decommissioning cause underwater noise and risk of chemical pollution, while burying or laying the cable on the seabed leads to sediment resuspension and habitat reworking. During operation, a primary chemical concern involves potentially releasing buried pollutants in the sediment, such as heavy metals and hydrocarbons [151], resulting from sediment resuspension at the TDP. Sediment toxicity assessments in potentially polluted areas can help cable routing planning to prevent pollutant mobilization [152]. Sea electrodes at monopolar DC cables emit harmful electrolysis by-products such as chlorine and bromine, polluting the water [151]. Artificial electromagnetic fields can disrupt the geomagnetic abilities of marine organisms [153]. Low-frequency electromagnetic fields can negatively affect various species, with evidence from studies on cockles [154], crabs [155], sponges [156], and eels [157]. Adequate shielding and cable burial can reduce exposure from sensitive species [152]. The dynamic cable section between the seabed and FOWT poses entanglement risks for animals, especially for large mammals [158,159].
On the other hand, FOWT farms can accommodate a wide variety of marine life. It can be a refuge for fish, as fishing activities cannot be carried out between the FOWTs due to mooring lines and power cables. They can also have a “reef effect” [151,153], which is the creation of artificial reefs due to the increased habitat complexity of the unburied cables. It is commonly regarded as a favorable human-caused influence since artificial reefs have higher fish and decapod biomass densities than nearby seabed areas [151]. Without the fisheries in the area, it can function as a reserve for these populations and stabilize them in the surrounding areas. That was already determined for the European lobster and the edible crab in offshore wind parks [160,161]. All potential effects of the power cables on the environment should be considered in future developments, and negative impacts should be avoided [53,162,163].
6.7. Socio-Economic Aspects
Fishing is the livelihood of many coastal communities. Ensuring that fishing activities remain undisturbed by the FOWT farm is crucial. Finding a compromise that satisfies all parties involved is essential if disturbances occur. Of particular concern are power cables, which pose significant risks to the fishing industry. Nets and crustacean traps can become entangled in the dynamic sections of these cables, while cables on the seabed can obstruct trawling operations. Fishing activities account for 52% of the causes of damage to telecom cables in the Atlantic [53]. It is essential to engage the fishing industries from the beginning of the project, ensuring their consultation and active involvement in the planning process [7].
Like the fishing industry, the placement of the FOWTs must take shipping routes into account. This is crucial to prevent collisions between ships and FOWT farm structures [164] and avoid significant detours for ships [7]. Suppose an FOWT farm is near a port where ships often anchor while waiting for entry; it poses a significant risk to the power cables. This concern should be addressed from the beginning of the project, and early engagement with local harbors and shipping industries is essential.
The primary immediate benefit of an FOWT farm, in contrast to other existing sources of electrical energy for society, lies in its offshore location, often hidden from public view. The only link between the offshore wind farm and the land where the electricity is required is through power cables. The power distribution network is frequently ill-equipped for integrating an FOWT farm, potentially requiring construction activities on land. This situation could also allow coastal communities to create new employment opportunities. For further information, Holmås et al. [165] provide an overview of the societal repercussions of the Hywind Tampen FOWT farm.
7. Optimization
This section presents the most important parameters for design and optimization in a flowchart. Further, published studies on power cable configuration design optimization, as well as for umbilical and riser configurations in the oil and gas industry, are presented and discussed.
7.1. Determining the Most Relevant Optimization Parameters
Due to limited computational capabilities and time, analysis and optimization cannot be performed on all design parameters. Further, variables and constraints on power cable configuration design are heavily site-dependent and determined by the local conditions. Therefore, choosing the most relevant variables and constraints for the specific location is crucial for a safe and efficient design. Figure 7 shows a flowchart as a reference to assist in the process of optimizing parameter selection. It is divided into the following main sections: objectives, variables, and constraints. The subsections outline the critical factors of each parameter.
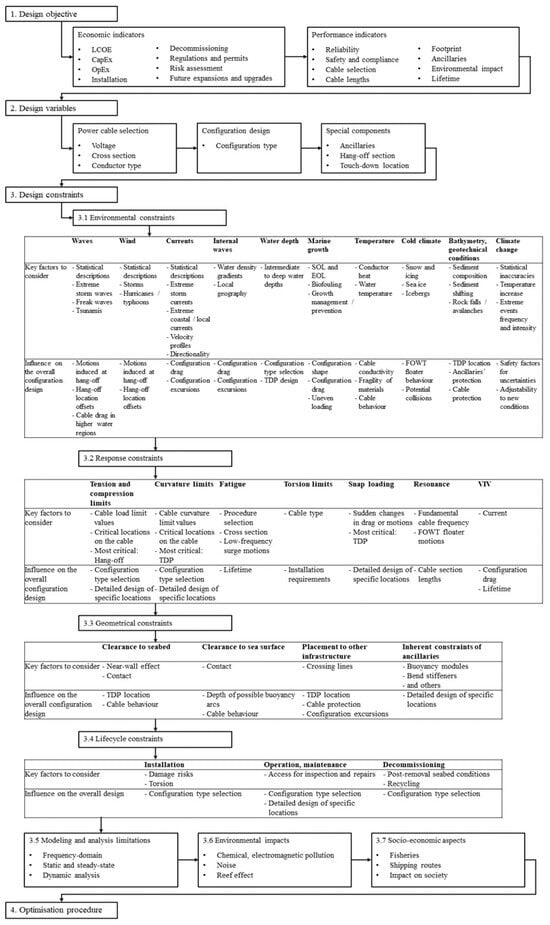
Figure 7.
A flowchart outlining a step-by-step approach for identifying key optimization parameters in dynamic cable configuration design.
The key is optimizing with respect to the constraints that influence design most. In the flowchart, each constraint includes the crucial factors to consider and their influence on the design of the power cable configuration. Yet, uncertainties surrounding these constraints necessitate careful consideration and integration into the design and optimization processes. Using this flowchart as a decision-making tool aids in identifying parameters with significant design impact.
The selection of design parameters can also involve considering multiple, often conflicting, factors. For example, it is crucial to design the connection of the power cable to the FOWT properly. This typically involves using a bend stiffener. The multi-criteria assessment at this stage considers factors such as the ability of the bend stiffener to bend and the minimum bend radius requirements of the power cable set by the manufacturer.
The ultimate constraint on selection depends on the experience of the engineer. For instance, if the current is very weak, bringing this constraint into the optimization procedure might not be relevant, as the water wave kinematics is much larger than the current velocity. However, it might be the most important constraint for the design in the case of a relatively strong current; see Figure 5. Choices made in the project, such as whether marine growth will be cleaned regularly or not, will influence whether this is an important parameter to implement in the optimization procedure. These constraints must be carefully considered one by one.
Appendix A shows the application of the flowchart for a location in the Northern North Sea to demonstrate the selection of the most important design objectives, variables, and constraints for design and optimization.
7.2. Power Cable Configuration Optimization for FOWTs
Kallinger et al. [166] and Song et al. [167] provided reviews on the existing literature relevant to optimizing the layout of the entire electrical system of offshore wind farms. Song et al. [167] and Lerch et al. [168,169] developed optimization methods specifically for the inter-array layout planning of FOWT farms, highlighting the significant impact of dynamic cable configurations, which is absent in bottom-fixed wind farms. Similarly, Giassi et al. [170] concluded that the hydrodynamical interactions significantly influenced the optimal design of their studied WEC farm power cable layout. In contrast, the lengths of the inter-array cables did not substantially impact the WEC farm economy.
Patryniak et al. [171] and Faraggiana et al. [172] reviewed numerous optimization algorithms for FOWT support structures. It is noteworthy that power cable design is integrated into only one algorithm [173] among their listings. However, ensuring the integrity of the power cable should be a fundamental consideration in the platform and mooring system design, limiting FOWT motions accordingly [119,171,174,175,176].
Table 1 presents an overview of published studies on the optimization of dynamic power cable configurations for FOWTs. Their optimization procedures utilize Sequential Quadratic Programming (SQP), a Genetic algorithm (GA), or a fitness function.

Table 1.
Publications on the optimization of power cable configurations for FOWTs.
7.3. Umbilical and Riser Optimization in Further Industries
Other floating renewable energy technologies, such as WECs and floating solar plants, similarly have power cables connecting them with consumers for electrical energy transmission. However, no published optimization procedures have been found for their dynamic power cable configurations.
Optimization procedures have been applied in the O&G industry to design umbilical and riser configurations. Typically, umbilicals in O&G applications are larger and heavier than power cables, and they may also include pipes that carry fluids. Power cables are a specific type of offshore umbilicals, often also referred to as ‘power umbilicals.’ Risers are pipes that transport different fluids throughout their use. Unlike risers or many O&G umbilicals, power cables do not carry any fluids; they have a solid core at their center, which is a key difference. The pressure inside the umbilical pipes and risers means that their design needs can be different from those of power cables, which can have a lot of friction between their internal and external parts. Nevertheless, their similarities in many properties, and especially in shape, are important when looking at optimization procedures that can also be considered for power cable configuration design.
Table 2 summarizes published optimization methods for O&G industry umbilical configurations. Remarkably, there are very few published optimization procedures. The ones published utilize either GA or SQP.
Optimization procedures for riser configurations have been studied extensively in the O&G industry. An overview is provided in Table 3 for configuration types that could also be relevant to dynamic power cable designs. As such, the optimization procedures presented could potentially be considered for application in the design of power cable configurations. This table serves as a resource for selecting and refining optimization procedures for power cable designs in future research. Some modifications might be necessary to adjust the parameters from riser pipes to power cables. For example, von Mises stress limits of the steel pipe are usually critical for risers. However, for power cables, the strain and stress in the conductor carrying the electricity are of high importance.
Furthermore, the oil industry uses suspended pipes to transfer oil from floating ship-type production platforms to tankers. Failures in the pipes and connections, likely caused by fatigue, have been reported, particularly for pipelines located off the coast of West Africa near Angola [181]. In this region, a strong current towards the north is prevailing, and long swell waves propagate northwards from the southern Atlantic. These long swell waves are in resonance with the natural periods of the vessel.
Cunliffe and McCarthy [182], Vieira [183], Vieira [184], and Laddé [185] published further optimization procedures using Genetic algorithms; the authors could not obtain the publications. Optimization procedures with GAs are the most often published studies, with 21 entries. GAs do often have a long runtime, which is considered unfavorable compared to other optimization methods used in several studies, for example, by Cardoso [186] and Vieira et al. [187,188]. Gradient-based methods, like SQP, are usually faster in runtime than GA methods. Nevertheless, they bear a higher risk of finding a local minimum than the best global solution. Converging to a local minimum may be acceptable if it leads to useful improvements in the design. However, if a local minimum is far from the global optimum or does not result in a better solution than the initial setup, it might be preferable to use more effective methods. Even though the combined design of the mooring system and the riser of a floating platform is considered crucial for its functionality [14], the published studies focus solely on riser optimization without the mooring system.
Successful umbilical and riser optimization procedures must be considered for optimizing power cable configurations to ensure that the learnings from the O&G industry are also used in the wind industry to avoid repeating failures. The main learning from the O&G industry is the need to identify the most important design constraints. Focusing on critical constraints makes the optimization process more efficient, leading to better performance and reliability in dynamic power cable designs. This approach is taken forward in the present work. Additionally, integrating robust optimization techniques, or a combination of different methods, can mitigate the limitations inherent to each method when used independently, ensuring a balance between computational efficiency and solution accuracy.
The two most common optimization objectives in Table 2 and Table 3 are minimizing cost and line lengths. Line length minimization is often selected to reduce material costs, particularly relevant for risers with significantly larger diameters. However, the length reductions achieved are often not significant enough to decrease costs considerably. Other optimization goals, such as a long design life, should be preferred. Most optimization procedures also apply response, geometrical, and environmental constraints.
Table 2.
Published studies on the optimization of umbilical configurations.
Table 2.
Published studies on the optimization of umbilical configurations.
| Reference | Wang et al., 2011 [189], Yang et al., 2012 [190] | Yang et al., 2021 [191] | Yan et al., 2023 [192] |
|---|---|---|---|
| Optimization technique | Non-dominated Sorting Genetic Algorithm II (NSGA-II) | Non-dominated Sorting Genetic Algorithm II (NSGA-II) | Non-Linear Programming by Quadratic Lagrangian (NLPQL) algorithm |
| Objective function | Minimize the buoyancy per unit length, length of the buoyancy section | Minimize umbilical max. tension strain, and bending moment | Minimize the umbilical length, cumulative fatigue damage |
| Design variables | Buoyancy per unit length, end positions of the buoyancy section | Umbilical thickness, helical angle, length, hang-off angle, buoyancy section length, and position | Angles at the hang-off and buoyancy section ends |
| Umbilical max. top tension, min. bending radius, max. equivalent stress | Umbilical max. tension, max. curvature, min. fatigue life | Min. fatigue life |
| Min. and max. buoyancy per unit length, min. and max. position of the buoyancy section ends | Umbilical min. and max. thickness, min. and max. helical angle, min. and max. length, buoyancy section min. and max. length, min., and max. position; min. and max. hang-off angle | Min. and max. angles at hang-off and buoyancy section ends, umbilical min. and max. length |
| Unidirectional load cases with regular waves, constant current, and current profile | Multidirectional extreme load cases with regular waves, constant current (no current profile provided) | Multidirectional load cases with wave spectrum, current (no current profile provided) |
| Modeling and analysis method | Response Surface Model (RSM) and Radial Basis Function (RBF) approximation models | Approximation through a neural network based on Radial Basis Function (RBF) | Approximation through a surrogate model with Radial Basis Function (RBF) |
| Umbilical configuration type | Lazy wave | Lazy wave | Lazy wave |
| Other components included? | No | Yes: Cross-section | No |
Table 3.
Published studies on the optimization of riser configurations.
Table 3.
Published studies on the optimization of riser configurations.
| Reference | Riggs 1989 [193] | Riggs and Leraand 1991 [194] | Larsen and Hanson 1999 [195] | Vieira et al., 2003 [196] | Cunliffe et al., 2004 [197] |
|---|---|---|---|---|---|
| Optimization technique | Sequential Quadratic Programming (SQP) | Adaptive Discretization algorithm | Sequential Quadratic Programming (SQP) | Genetic algorithm (GA) | Genetic algorithm (GA) |
| Objective function | Minimize riser length | Minimize the riser’s overall length | Minimize riser wall thickness linked to material cost | Minimize the acquisition cost of riser sections | Minimize the bill of materials |
| Design variables | Riser section lengths, hang-off height, and buoyancy section weight | Riser section lengths, weight of the second riser section, and the mean location of the vessel | Riser section lengths, wall thickness, and horizontal distance from the lower to upper end (far position) | Riser section lengths, buoyancy section length | Riser section lengths |
| Response constraints | Riser max. top tension, max. top tension variation, min. service life | Riser min. bend radius, max. top tension variation | Riser sections’ max. equivalent stress, critical bending strain, pressure, buckling threshold | Riser max. von Mises stress, max. operating stress | Riser max. wall stress, collapse pressure, collapse propagation |
| Geometrical constraints | Riser min. bend radius, max. angle at hang-off, min. seabed clearance, max. span, buoyancy max. elevation | Riser min. seabed and sea surface clearance, max. buoyancy elevation, min. first section length, min. and max. bottom angle, max. bottom angle variation, max. top angle variation | Riser min. overall length, min. length on the seafloor in the far position | Riser max. top angle, min. and max. section lengths, buoyancy section min. and max. length | Riser far end is horizontal on the seabed for tie-in, material 30 m from TDP on the seabed is changed from titanium to duplex |
| Environmental constraints | Varying hang-off positions | Uniform current, hang-off location position | Hang-off location position, current (no profile provided) | None | Near and far ultimate limit states (ULS) (applied parameters not provided) |
| Modeling and analysis method | Analytic equations; static | Catenary equations, cable elements, static, steady state | Finite Element Analysis (FEA); static | Modeling method not provided; static | Finite Element Analysis (FEA); static, dynamic |
| Riser configuration type | Steep-wave, lazy-wave, lazy-S | Steep-wave | Catenary | Lazy wave | Catenary |
| Other components included? | No | No | No | No | No |
| Reference | Rodrigues 2004 [198] | Roveri et al., 2005 [199] | Lima et al., 2005 [200] | Tanaka and Martins 2006 [201] | Tanaka et al., 2006 [202] |
| Optimization technique | Genetic algorithm (GA) | Parametric analysis | Hybrid fuzzy/Genetic algorithm (GA) | Genetic algorithm (GA) | Simulated Annealing (SA) |
| Objective function | Minimize the acquisition costs of riser components | Find feasible configurations | Minimize riser section lengths and buoyancy section lengths | Minimize acquisition cost and launch cost | Minimize pipe and buoy material volume by price |
| Design variables | Riser section lengths, tendon length, and buoy net buoyancy | Riser section lengths | Riser section lengths, buoyancy section length | Riser section lengths, outer diameters, and buoyancy section outer diameters | Riser overall length, external diameter, and buoy thickness |
| Riser top max. tension, max. traction force, tendon top max. traction force | Riser min. fatigue life | Riser max. von Mises stress | Riser min. curvature radius, propagating buckling collapse criteria, max. stress, max. top tension | Riser propagating buckling collapse criteria, max. stress |
| Tendon vertical max. and min. inclination angles | Riser max. top angle, min. curvature radius, min., and max. section lengths | Riser min. and max. section lengths, max. top angle, buoyancy section min. and max. lengths | Riser min. and max. section lengths, min., and max. outer diameters, buoyancy modules outer min. and max. diameters, max. top angle | Riser max. top angle, min. and max. lengths, min. and max. external diameters, buoy min. and max. thicknesses |
| Variable current velocities, three-dimensional current profile | Current (no profile provided), waves (no specifications provided) | None | Load cases with current at the surface from different directions (no profile provided) | Load cases with different current directions (no profile provided) |
| Modeling and analysis method | Catenary equations integration, steady-state (static) | Differential ordinary equations with the Runge–Kutta method, static, dynamic | Finite Element Analysis (FEA), static | Modeling method not provided, static | Solving differential equations with the Runge–Kutta method, static |
| Riser configuration type | Lazy-S | Lazy-wave | Catenary, lazy wave | Catenary, lazy wave | Catenary, lazy wave |
| Other components included? | No | No | No | No | No |
| Reference | Tanaka and Martins 2007 [203] | Vieira et al., 2008 [204] | Yang et al., 2009 [205] | Tanaka 2009 [206] | Vieira et al., 2009 [188] |
| Optimization technique | Genetic algorithm (GA) | Artificial Immune System (AIS), Genetic algorithm (GA) | Island-based Genetic algorithm (IGA) | Simulated Annealing (SA), Genetic algorithm (GA), Sequential Linear Programming (SLP), Linear Programming, Powell’s Conjugate Directions Method, Quasi-Newton, Interval Division, Fletcher-Reeves, Hessian matrix approximation | Artificial Immune System (AIS), Genetic algorithm (GA), Particle Swarm Optimization (PSO) |
| Objective function | Minimize max. stress amplitude | Minimize riser length and buoy volume by price | Minimize riser material | Minimize volume per price, max. static stress, max. dynamic stress amplitude | Minimize riser length and buoy volume by price |
| Design variables | Riser section lengths, buoyancy floater diameter | Riser section lengths, buoy diameter, length, spacing | Riser wall thickness, coating density | Riser section material, length; buoyancy module number, material, inner and outer diameter | Riser section lengths, buoy diameter, length, spacing |
| Response constraints | Riser min. tension, min. curvature radius, max. stress | Riser max. von Mises stress, max. top stress, min. stress | Riser max. von Mises stress, collapse criteria | Riser buckling threshold, max. top traction, min. and max. tension, max. equivalent tension | Riser max. von Mises stress, max. top stress, min. stress |
| Geometrical constraints | Riser min. and max. section lengths; buoyancy min. and max. floater diameter | Riser min. and max. section lengths, min. and max. top angles, max. top angle variation, buoy min. and max. diameters, min. and max. lengths, min. and max. spacing | Not specified | Riser external diameter > internal diameter, max. length, max. top angle, min. curvature | Riser min. and max. section lengths, min. and max. top angles, max. top angle variation; buoy min. and max. diameters, min. and max. lengths, min. and max. spacing |
| Environmental constraints | One load case with steady current profile, hang-off offset, and motion | Not specified | Not specified | Multidirectional steady current profiles | Not specified |
| Modeling and analysis method | Finite Element Analysis (FEA), frequency domain, static, dynamic | Analytic catenary, static | Finite Element Analysis (FEA), dynamic | Finite Element Analysis (FEA), static, dynamic | Analytic catenary, static |
| Riser configuration type | Catenary and lazy-wave | Lazy wave | Catenary | Lazy wave | Lazy wave |
| Reference | Andrade et al., 2010 [207] | Pina et al., 2008, 2011 [208,209] | Zhen and Yang 2010 [210], Yang and Zheng 2011 [211] | Tanaka and Martins 2011 [212] | Vieira et al., 2012 [187] |
| Optimization technique | Non-dominated Sorting Genetic Algorithm II (NSGA-II) | Particle Swarm Optimization (PSO) | Single-loop reliability-based design optimization (RBDO) | Genetic algorithm (GA); Simulated Annealing (SA) | Genetic algorithm (GA); Particle Swarm Optimization (PSO); Artificial Immune System (AIS) |
| Objective function | Minimize the buoyancy module volume, riser top tension | Minimize the cost of material | Minimize the wall thicknesses of riser sections | Minimize max. dynamic stress amplitude along the riser | Minimize the cost and length of each riser section, and the cost and volume of the buoyancy module type applied |
| Design variables | Riser section lengths, buoyancy section length, buoyancy modules diameters, lengths, and spacing | Riser section lengths, buoyancy section length, buoyancy module length, diameter, spacing | Riser sections’ wall thicknesses | Riser section lengths, buoyancy thickness | Riser section lengths, buoyancy modules diameter, length |
| Response constraints | Installation riser max. tension, stresses, compression, max. VIV fatigue life | Riser max. von Mises stress, max. top tension, min. tension at the bottom | Riser max. dynamic equivalent stress, min. required probability value | Riser propagating buckling collapse criteria, min. curvature, min. tension, max. stress | Riser sections max. von mises Stress, min. tension at seabed sections, max. top tension |
| Geometrical constraints | Sag and hog bend min. and max. vertical positions; TDP min. and max. horizontal position | Riser top min. and max. angle, max. angle variation, min., and max. riser section lengths; buoyancy section min. and max. length; buoyancy module min. and max. diameter, length, spacing | Riser sections min. and max. wall thicknesses | None | Riser min. and max. top angle, max. ‘built-in’ angle variation, min., and max. section lengths; buoyancy modules min. and max. diameter, length, spacing |
| Environ-mental constraints | Multi-directional steady current profiles (profiles not provided) | None | Cosine motion imposed at hang-off | Multidirectional extreme load cases with sea states, steady current profiles | None |
| Modelling and analysis method | Finite Element Analysis (FEA); static, dynamic | Analytical catenary; static | Design of Experiment (DoE) with Finite Element Analysis (FEA), during optimization, a Kriging metamodel constructed by Latin hypercube sampling (LHS); static, dynamic | Linear model using frame finite elements solved iteratively; frequency domain | Analytical catenary; static |
| Riser configuration type | Lazy wave | Lazy wave | Catenary | Catenary, lazy-wave | Lazy-wave |
| Other components included? | No | No | No | No | No |
| Other components included? | No | No | No | No | |
| Reference | Arruda et al., 2012 [213] | Martins 2011 [214], Martins et al., 2013 [215] | Voie and Sødahl 2013 [216] | Nariño et al., 2014 [217] | Chen et al., 2016 [218] |
| Optimization technique | Genetic algorithm (GA) | Non-dominated Sorting Genetic Algorithm II (NSGA-II) | Sequential Quadratic Programming (SQP) | Non-dominated Sorting Genetic Algorithm II (NSGA-II) | Surrogate model: Kriging, Radial Basis Function (RBF); multi-island genetic algorithm (MIGA); Non-linear Programming by Quadratic Lagrangian (NLPQL) algorithm |
| Objective function | Minimize the total volume of floaters | Minimize total riser volume, stress utilization factor | Find a design to meet the target fatigue life | Minimize the amplitude variations in the von Mises stresses and the total length of the riser sections with hydrodynamic dampers | Minimize riser curvature |
| Design variables | The floater section starts and ends on the riser | Riser section lengths, outer diameter, heavy coating wall thickness, overlength fraction, buoyancy module diameter, and well horizontal offset | Weight section length, distance to hang-off, distance to buoyancy section, buoyancy key factor, buoyancy section length, buoyancy key factor | Number, position, and length of the hydrodynamic dampers | Riser section length, buoyancy section length, hang-off to TDP distance |
| Response constraints | Riser max. service tension, max. traction tension at the floaters | Riser max. von Mises stress, min. effective tension, min. radius of curvature | Riser min. fatigue life | Riser max. stress | Riser max. dynamic tension, max. curvature |
| Geometrical constraints | Riser min. seabed clearance, floater section min. distance to hang-off, max. length | None | None | Max total length of the hydrodynamic damper sections | Riser min. and max. section lengths, max. overall length, max. hang-off angle, min. and max. buoyancy section length, min., and max. hang-off to TDP distance, seabed clearance to sag bend |
| Environmental constraints | Load case with current and current profile | Two directions of collinear waves with a spectrum, current | Several unidirectional ultimate and accident limit states with regular waves, hang-off offsets | Wave and current (specifications not provided) | One condition with a regular wave, constant current (no current profile provided) |
| Modeling and analysis method | Finite Element Analysis (FEA), static | Finite Element Analysis (FEA), static, dynamic | Finite Element Analysis (FEA), dynamic | Finite Element Analysis (FEA), static, dynamic | Finite Element Analysis (FEA), dynamic |
| Riser configuration type | Lazy-wave | Vertical access with weight between the hang-off and buoyancy section | Lazy-wave with weights between the buoyancy section and the hang-off | Catenary with hydrodynamic dampers | Steep-wave |
| Other components included? | No | No | No | No | |
| Reference | Yang et al., 2018 [219] | Diakonova et al., 2019 [220] | Cardoso 2019 [186,221] | Ai et al., 2019 [222] | Bhowmik et al., 2019, 2020 [223,224] |
| Optimization technique | Particle Swarm Optimization (PSO) | Brute force with limited load case selection | Globalized Bounded Nelder–Mead method (GBNM) | Genetic algorithm (GA) | Random Forest (RF) metamodel coupled with Evolutionary Algorithm (RF-EA), Radial Basis Function (RBF) metamodel coupled with Evolutionary Algorithm (RBF-EA) |
| Objective function | Maximize the utilization rate of tension, curvature | Minimize the cost of procurement and installation | Minimize total riser length | Minimize the max. stress, fatigue damage | Minimize material cost, fatigue damage |
| Design variables | Riser section length, buoyancy section length, riser wall thickness | Riser top angle, section lengths, buoyancy section length, buoyancy factor | Riser section lengths, buoyancy module diameter, section length, spacing | Riser section length, buoyancy section length, buoyancy module diameter | Riser top angle, sag bend elevation, hog bend elevation, buoyancy section length, buoyancy module diameter |
| Response constraints | Riser max. tension, max. curvature, min. fatigue life, min., and max. yield stress | Riser min. and max. interface loads (topside, seabed), min. fatigue life | Riser combined loading criterion (max. bending moment and effective tension) | None | Riser max. tension at hang-off, min. tension at TDP, max. von Mises stress, min. fatigue life |
| Geometrical constraints | Riser min. and max. section lengths, min. and max. hang-off angles, min. and max. spiral angles at buoyancy section ends, min. and max. buoyancy section lengths; min. and max. wall thicknesses | Riser max. offset | Riser min. and max. section lengths, buoyancy module min. and max. diameters, min. and max. section lengths, min. and max. spacing | Riser min. and max. section lengths, min. and max. vertical offset, max. hang-off angles, buoyancy section min. and max. lengths, buoyancy module min. and max. diameters | Riser max. hang-off angle, min. sag bend seabed clearance |
| Environmental constraints | Unidirectional extreme load cases with waves (wave type not provided), constant current (no current profile provided) | Extreme load case (no specifications provided) | One imposed riser top-end motion case | Unidirectional extreme load case with irregular waves, steady current profile | One extreme condition with a regular wave, constant current, and current profile |
| Modeling and analysis method | Bi-scale response surface | Finite Element Analysis (FEA), static, dynamic | Finite Element Analysis (FEA), dynamic | Finite Element Analysis (FEA), dynamic | Finite Element Analysis (FEA), dynamic |
| Riser configuration type | Lazy wave | Lazy wave | Lazy wave, catenary with hydrodynamic damper | wave | Lazy wave |
| Other components included? | No | No | No | No | No |
| Reference | Lal et al., 2020 [225] | Ogbeifun et al., 2021 [226] | Lal et al., 2021 [227] | Elsas et al., 2021 [228] | |
| Optimization technique | Genetic algorithm (GA) | 2D tabular optimization method | Genetic algorithm (GA) | Bayesian Optimization (BO) algorithm, derivative-free evolutionary hybrid algorithm MIDACO, Globalized Bounded Nelder–Mead (GBNM) method, Genetic algorithm (GA) | |
| Objective function | Minimize bending stress, fatigue | Minimize riser hanging length, hang-off tension, stress utilization, fatigue damage around the bends, smeared buoyancy section length, and thickness | Maximize strength and fatigue response, and minimize the cost of the buoyancy section | Minimize total riser length | |
| Design variables | Riser section lengths, hang-off angle, buoyancy section length, buoyancy factor | Riser hanging length, smeared buoyancy section length, and thickness | Riser length between hang-off and buoyancy section, buoyancy section length | Riser section lengths, buoyancy modules spacing, length, diameter, and hydrodynamic damper section lengths | |
| Response constraints | None | Minimum apparent mass ratio of the buoyant sections | Riser max. von Mises stress | Riser max. effective load | |
| Geometrical constraints | Minimum seabed clearance, sag bend always lower than hog bend | Minimum sag height elevation from the seabed, min. arc height | Riser min. and max. lengths between hang-off and buoyancy section, min. seabed clearance, buoyancy section min. and max. lengths, minimum seabed clearance must be higher than the sag bend | Riser min. and max. section lengths, min. and max. top angles, buoyancy modules’ min. and max. spacing, min. and max. lengths, min. and max. diameters, hydrodynamic dampers’ min. and max. section lengths, min. seabed clearance, max. total riser length | |
| Environmental constraints | Regular heave motion at hang-off | Two unidirectional regular wave load cases | Several load cases (no specifications provided) | One load case with steady current profile, prescribed hang-off motion | |
| Modeling and analysis method | Finite Element Analysis (FEA), dynamic | Finite Element Analysis (FEA), steady-state (static) | Finite Element Analysis (FEA) and neural network, dynamic | Finite Element Analysis (FEA), steady-state (static) | |
| Riser configuration type | Lazy-wave | Catenary, lazy-wave | Lazy-wave | Lazy-wave, catenary with hydrodynamic dampers | |
| Other components included? | No | No | No | No | |
| Reference | Abam et al., 2022 [229] | Abam et al., 2022 [230] | Lal et al., 2023 [231] | ||
| Optimization technique | Combined Genetic Algorithm (GA) and Artificial Neural Network (ANN) | Genetic algorithm (GA) | Particle Swarm Optimization (PSO) | ||
| Objective function | Minimize riser steel weight | Minimize total structural weight | minimize bending stress, fatigue, and material cost | ||
| Design variables | Riser wall thickness, declination angle, and length | Riser wall thickness, length, declination angle at hang-off | Riser hang-off angle, section lengths, buoyancy section length, buoyancy factor | ||
| Bursting criteria, buckling (collapse) criteria, buckling propagation criteria, yielding criteria, and fatigue limit state (FLS) criteria | Bursting criteria, buckling (collapse) criteria, buckling propagation criteria, yielding criteria, fatigue limit state (FLS) criteria | Riser max. von Mises stress | ||
| Riser min. and max. wall thickness, min. and max. declination angle, min. and max. length | Riser min. and max. wall thickness, min. and max. declination angle, min. and max. length | Minimum seabed clearance, Sag bend always lower than hog bend | ||
| One unidirectional load case with irregular waves, wind spectrum, and steady current profile | One unidirectional load case with irregular waves, wind spectrum, and steady current profile | Harmonic motion at the hang-off | ||
| Modelling and analysis method | Finite Element Analysis (FEA), dynamic | Finite Element Analysis (FEA), dynamic | Finite Element Analysis (FEA), dynamic | ||
| Riser configuration type | Catenary | Catenary | Lazy-wave | ||
| Other components included? | No | No | No | ||
8. Conclusions
The operation of FOWTs relies on power cables to connect them with consumers for economic success. Therefore, a durable power cable configuration is crucial for functionality. The primary goal in designing these configurations is to achieve optimal performance while minimizing costs. The design process considers various variables, predominantly centered around power cable selection, configuration design, and incorporating specialized components and ancillary elements.
Local conditions play a fundamental role in determining the constraints applied in design and optimization processes, with the physical environment conditions at the location being paramount. Factors such as wind and wave conditions, and particularly the influence of currents, are critical considerations. A lack of comprehensive data on local current conditions often introduces significant uncertainties in the design. Additional phenomena, including internal waves and issues such as snow, icing, and sea ice in cold climates, can significantly impact the robustness of the configuration. The water temperature, bathymetry, geotechnical conditions, and water depth further contribute to the overall complexity. Marine growth, identified as a major challenge in previous FOWT projects, requires expanded study. Several long-term measurement campaigns already indicate the effects of climate change, potentially leading to more severe environmental conditions than previously experienced. This aspect should be considered for future designs. Environmental impact considerations must be integrated into the initial stages of the design process, aligning with governmental regulations and necessitating long-term planning well before installation commences. Similarly, assessing the effects on fisheries, shipping routes, and coastal communities should be an integral part of the project from the start.
Consideration must be given to the inherent limitations of the power cable, which impact its response. This includes tension and compression limits, curvature constraints, and the required minimum fatigue life. Additionally, it is crucial to consider responses like snap loading, resonance, and vortex-induced vibrations (VIVs), with the latter having the potential to decrease the fatigue life substantially.
Further constraints arise during installation, decommissioning, and maintenance, predominantly influenced by the available operational equipment carrying out the operation. Moreover, limitations linked to modeling, analysis methodologies, and software should be considered, necessitating the incorporation of adequate redundancy for a robust design.
A flowchart is provided (Figure 7) to facilitate the design and optimization of power cable configurations, guiding the selection of optimal objectives, variables, and constraints. The key is to optimize based on the constraints that have the greatest impact on the design.
Author Contributions
Conceptualization and methodology, A.S. and O.T.G.; investigation, A.S.; writing—original draft preparation, A.S.; writing—review and editing, O.T.G. All authors have read and agreed to the published version of the manuscript.
Funding
The first author received funding from CoreMarine and the Research Council of Norway (grant number 320902). The second author was supported in part by funds provided by “The Program for Maritime Competence (MARKOM II)”, https://www.markomii.no/om-markom-ii/, accessed 23 April 2025, project 10031; and funds made available to Western Norway University of Applied Science, Haugesund, Norway.
Acknowledgments
The first author would like to thank Øyvind Johnsen and Carlos Lopez-Pavon from CoreMarine for the insightful discussions on power cable configuration design.
Conflicts of Interest
The authors declare no conflicts of interest.
Appendix A. Application Case: Northern North Sea
Finding key parameters for the design and optimization of inter-array power cable configurations in FOWT farms is demonstrated in this section based on a location in the Northern North Sea. An exemplary location in that region is Utsira Nord, shown in Figure A1. It has good potential for FOWT farm development: wind resources are abundant [232,233], and it is close to cities and industries [233].
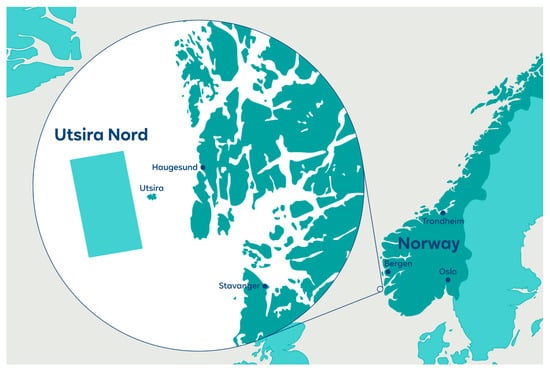
Figure A1.
Location in the Northern North Sea with planned FOWT farm development. The figure is available online: https://utsira-nord.rwe.com/ (accessed on 13 October 2024).
Before designing and optimizing a power cable configuration, or any structure, it is of utmost importance to know the parameters, and especially the constraints, that must be considered. Without a proper design basis, a project can fail easily, and in the worst case, cause huge damage, and cost even human lives. Therefore, the design objectives and variables for power cable configuration design at this location are described in the following section. Afterwards, the design constraints are discussed in more detail.
Design objectives to consider for power cable configuration design are plentiful. Most objectives can be related to costs and performance indicators. Overall, the most important objective should always be a safe design that works. This is important to always keep in mind when choosing more detailed design objectives while designing and optimizing power cable configurations. For example, objectives related to costs are most important for the feasibility of the project. But if the design fails in the long run, the safety might not have been considered correctly.
The variables in a power cable configuration design project can be many. A decision on the type of power cable configuration must be made, a power cable must be chosen, the ancillary equipment must be selected, and the variables inside the chosen configuration must be optimized. A first approach could be to consider the tethered-wave configuration with a copper conductor power cable type like that used in other FOWT farms in the North Sea. Nevertheless, the variables are highly dependent on the constraints of the configuration.
Figure A2 shows constraints that must be considered when designing power cable configurations in the Northern North Sea [234,235,236,237,238,239,240,241,242,243,244,245,246,247,248,249,250]. The environmental conditions are of utmost importance. Wind and waves will significantly influence the behavior of the FOWT floater, which defines the behavior of the power cable hang-off. Storms are frequent in the Northern North Sea, resulting in wind and waves being among the most important environmental loads to consider. The current loads that the power cable configuration will experience are potentially the most important environmental loads to consider. The Norwegian Coastal Current can have very extreme multidirectional current events. They drive changes in the shape of the power cable configuration and might cause the power cable to experience very large tensions that must be considered in the design. Another important factor to consider is the marine growth that will settle on the power cable surface. Even though it might not be as significant in the Northern North Sea as in warmer regions in the world, it nevertheless influences the behavior of the power cable significantly. Other factors, such as internal waves and cold climate, will potentially have a minor effect on the power cable configuration and might therefore need to be considered with less detail than the most important factors.
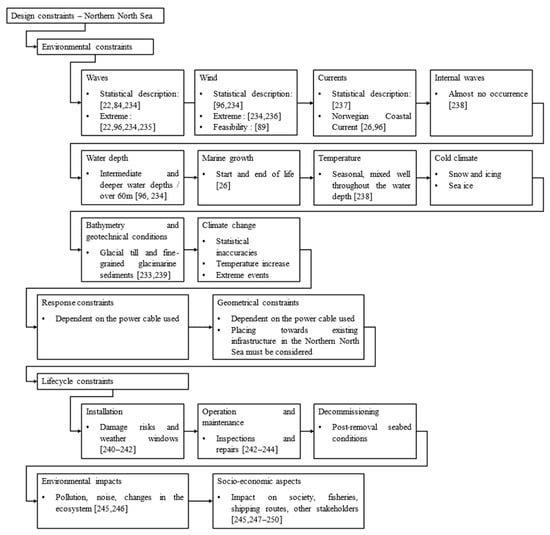
Figure A2.
The most relevant optimization constraints for a location in the Northern North Sea [22,26,84,89,96,234,235,236,237,238,239,240,241,242,243,244,245,246,247,248,249,250].
The responses of the power cable itself must be within the limits the cable can stand. This heavily depends on the chosen power cable. Factors to consider are, for example, tension and compression limits, as well as curvature limits. Some constraints depend on other constraints, such as fatigue, which depends on the load cycles the power cable experiences.
The placement of the power cable configuration might be constrained because of the mooring systems of the FOWTs and other existing infrastructure. Further, it must be possible to install and decommission the power cable configuration, to safely operate it, as well as to maintain and repair it when necessary. Each stage in the project lifecycle poses different constraints on the power cable configuration that must be considered.
Other important aspects to consider are requirements by the issuing government, especially on environmental impacts, which are mainly stemming from socio-economic aspects. For example, several studies must be carried out to show the impact that the power cable configurations as part of the whole FOWT farm can have on the seabed or fish populations.
References
- DNV. Floating Wind: Turning Ambition into Action; Det Norske Veritas: Oslo, Norway, 2023. [Google Scholar]
- Cozzi, L.; Wanner, B. Offshore Wind Outlook 2019: World Energy Outlook Special Report; International Energy Agency (IEA): Paris, France, 2019. [Google Scholar]
- WPED. GCube Releases Decade-Long Research Report on Offshore Wind Project Insurance Claims. Windpower Engineering & Development (WPED). 2021. Available online: https://www.windpowerengineering.com/gcube-releases-decade-long-research-report-on-offshore-wind-project-insurance-claims/ (accessed on 9 October 2023).
- Rentschler, M.U.T.; Adam, F.; Chainho, P.; Krügel, K.; Vicente, P.C. Parametric study of dynamic inter-array cable systems for floating offshore wind turbines. Mar. Syst. Ocean Technol. 2020, 15, 16–25. [Google Scholar] [CrossRef]
- Eldøy, S.; Vold, O.; Graven, H.; Guttormsen, T.; Delp, L. Hywind Scotland Pilot Park Project Plan for Construction Activities 2017; Statoil: Stavanger, Norway, 2017. [Google Scholar]
- Bowie, M.; Parry, A.; Giles, J.; West, A. Development Specification and Layout Plan Kincardine Offshore Windfarm Project; Kincardine Offshore Wind Farm Ltd. (KOWL): Edinburgh, UK, 2018. [Google Scholar]
- Equinor. Hywind Tampen, PL050-PL057-PL089, PUD del II-Konsekvensutredning; Equinor ASA: Stavanger, Norway, 2019. [Google Scholar]
- Duarte, T.; Price, S.; Peiffer, A.; Pinheiro, J.M. WindFloat Atlantic Project: Technology Development Towards Commercial Wind Farms. In Proceedings of the Offshore Technology Conference, Houston, TX, USA, 2–5 May 2022; p. 11. [Google Scholar] [CrossRef]
- Metcentre. Test Areas—Metcentre 2023. Available online: https://www.norwegianoffshorewind.no/about/initiatives/met-centre (accessed on 19 November 2023).
- Yoshimoto, H.; Awashima, Y.; Kitakoji, Y.; Suzuki, H. Development of floating offshore substation and wind turbine for Fukushima FORWARD. In Proceedings of the International Symposium on Marine and Offshore Renewable Energy, Tokyo, Japan, 27–29 October 2013. [Google Scholar]
- Gudmestad, O.T.; Schnepf, A. Design Basis Considerations for the Design of Floating Offshore Wind Turbines. Sustain. Mar. Struct. 2023, 5, 26–34. [Google Scholar] [CrossRef]
- DNV-ST-0145; Offshore Substations. Det Norske Veritas (DNV): Oslo, Norway, 2021.
- Do Prado, V.G.; Monteiro, B.D.F.; De Lima, B.S.L.P.; Jacob, B.P. Optimal design of mooring systems for floating production units based on metamodel-assisted Differential Evolution. Ocean Eng. 2022, 266, 112752. [Google Scholar] [CrossRef]
- Ja’e, I.A.; Osman Ahmed Ali, M.; Yenduri, A.; Nizamani, Z.; Nakayama, A. Optimisation of mooring line parameters for offshore floating structures: A review paper. Ocean Eng. 2022, 247, 110644. [Google Scholar] [CrossRef]
- Griffiths, T.; Draper, S.; Cheng, L.; An, H.; Schläppy, M.-L.; Fogliani, A.; White, D.; Noble, S.; Coles, D.; Johnson, F.; et al. The offshore renewables industry may be better served by new bespoke design guidelines than by automatic adoption of recommended practices developed for oil and gas infrastructure: A recommendation illustrated by subsea cable design. Front. Mar. Sci. 2023, 10, 1030665. [Google Scholar] [CrossRef]
- DNV-ST-0119; Floating Wind Turbine Structures. Det Norske Veritas (DNV): Oslo, Norway, 2021.
- ISO 19900:2019; Petroleum and Natural Gas Industries. General Requirements for Offshore Structures. International Organization for Standardization: Geneva, Switzerland, 2019.
- ISO 19901-1:2015; Petroleum and Natural Gas Industries. Specific Requirements for Offshore Structures. Part 1: Metocean design and operating considerations (EN ISO 19901-1:2015). Standard Norge: Lysaker, Norway, 2015.
- European Standard 13628-5; Petroleum and Natural Gas Industries. Design and Operation of Subsea Production Systems. Part 5: Subsea Umbilicals. International Organization for Standardization: Geneva, Switzerland, 2009.
- European Standard 13628-11; Petroleum and Natural Gas Industries-Design and Operation of Subsea Production Systems-Part 11: Flexible Pipe Systems for Subsea and Marine Applications. International Organization for Standardization: Geneva, Switzerland, 2007.
- DNV-ST-0359; Subsea Power Cables for Wind Power Plants. Det Norske Veritas: Oslo, Norway, 2021.
- DNV-OS-E301; Position Mooring, Offshore Standard. Det Norske Veritas: Oslo, Norway, 2021.
- DNV-RP-0360; Subsea Power Cables in Shallow Water, Recommended Practice. Det Norske Veritas: Oslo, Norway, 2021.
- DNV-RP-F401; Electrical Power Cables in Subsea Applications, Recommended Practice. Det Norske Veritas: Oslo, Norway, 2021.
- DNV-RP-C205; Environmental Conditions and Environmental Loads, Recommended Practice. Det Norske Veritas: Oslo, Norway, 2021.
- NORSOK. N003: Actions and Action Effects. NORSOK: Oslo, Norway, 2018. [Google Scholar]
- API. Recommended Practice for Planning, Designing, and Constructing Fixed Offshore Platforms-Load and Resistance Factor Design, 2A-LRFD; Supplemented 1997; American Petroleum Institute (API): Washington, DC, USA, 1993. [Google Scholar]
- API. Recommended Practice for Planning, Designing, and Constructing Fixed Offshore Platforms-Working Stress Design 2A-WSD; American Petroleum Institute (API): Washington, DC, USA, 2014. [Google Scholar]
- API. Specification for Subsea Umbilicals, API SPEC 17E; American Petroleum Institute: Washington, DC, USA, 2017. [Google Scholar]
- Rinaldi, G.; Garcia-Teruel, A.; Jeffrey, H.; Thies, P.R.; Johanning, L. Incorporating stochastic operation and maintenance models into the techno-economic analysis of floating offshore wind farms. Appl. Energy 2021, 301, 117420. [Google Scholar] [CrossRef]
- Musial, W.; Spitsen, P.; Duffy, P.; Beiter, P.; Shields, M.; Mulas Hernando, D.; Hammond, R.; Marquis, M.; King, J.; Sathish, S. Offshore Wind Market Report: 2022 Edition; U.S Department of Energy, Office of Energy Efficiency and Renewable Energy: Washington, DC, USA, 2022.
- BBC. Jobs Lost as Wave Energy Firm Aquamarine Power Folds. BBC News 2015. Available online: https://www.bbc.com/news/uk-scotland-scotland-business-34901133 (accessed on 18 September 2023).
- Garcia-Teruel, A.; Rinaldi, G.; Thies, P.R.; Johanning, L.; Jeffrey, H. Life cycle assessment of floating offshore wind farms: An evaluation of operation and maintenance. Appl. Energy 2022, 307, 118067. [Google Scholar] [CrossRef]
- Yang, C.; Jia, J.; He, K.; Xue, L.; Jiang, C.; Liu, S.; Zhao, B.; Wu, M.; Cui, H. Comprehensive Analysis and Evaluation of the Operation and Maintenance of Offshore Wind Power Systems: A Survey. Energies 2023, 16, 5562. [Google Scholar] [CrossRef]
- Gudmestad, O.T.; Zolotukhin, A.B.; Jarlsby, E.T. Petroleum Resources with Emphasis on Offshore Fields, 1st ed.; WIT Press: Southampton, UK, 2010. [Google Scholar]
- Kausche, M.; Adam, F.; Dahlhaus, F.; Großmann, J. Floating offshore wind. Economic and ecological challenges of a TLP solution. Renew. Energy 2018, 126, 270–280. [Google Scholar] [CrossRef]
- Ishii, M.; Ueda, E.; Utsunomiya, T.; Kiyomiya, L.; Harada, B. Floating Offshore Wind Power Generation Systems off the Coast of Fukushima-Demonstration and Research Project-General Committee Report; Ministry of Economy, Trade, and Industry; Agency for Natural Resources and Energy: Tokyo, Japan, 2018.
- Dobson, A. Challenges Associated with High Voltage Dynamic Inter-Array Cables. Volume 3: Materials Technology; Pipelines, Risers, and Subsea Systems; American Society of Mechanical Engineers: Melbourne, Australia, 2023; p. V003T04A024. [Google Scholar] [CrossRef]
- Equinor. Hywind Tampen: The World’s First Renewable Power for Offshore Oil and Gas. Hywind Tampen 2022. Available online: https://www.equinor.com/energy/hywind-tampen (accessed on 9 August 2023).
- Fujii, S.; Tanaka, H. Power transmission system for “Fukushima FORWARD Project”—Power cable system for offshore floating-type wind farm pilot plant. In Proceedings of the Fall ICC Meeting, Washington, DC, USA, 9–10 December 2013. [Google Scholar]
- Edwards, E.C.; Holcombe, A.; Brown, S.; Ransley, E.; Hann, M.; Greaves, D. Evolution of floating offshore wind platforms: A review of at-sea devices. Renew. Sustain. Energy Rev. 2023, 183, 113416. [Google Scholar] [CrossRef]
- Hartman, L. Wind Turbines: The Bigger, the Better. Office of Energy Efficiency & Renewable Energy, USA. 2022. Available online: https://www.energy.gov/eere/articles/wind-turbines-bigger-better (accessed on 9 August 2023).
- The Carbon Trust. 132 kV Array Cable Requirements and The Need for Improved Testing Standards; The Carbon Trust: London, UK, 2023. [Google Scholar]
- Johanson, A.; Gjølmesli, E. Dynamic High Voltage Subsea Cables and Fatigue of their Components. In Proceedings of the Offshore Technology Conference, Houston, TX, USA, 1–4 May 2023; OTC: Houston, TX, USA, 2023. [Google Scholar] [CrossRef]
- Ikhennicheu, M.; Lynch, M.; Doole, S.; Borisade, F.; Wendt, F.; Schwarzkopf, M.A.; Matha, D.; Vicente, R.D.; Tim, H.; Ramirez, L.; et al. Review of the State of the Art of Dynamic Cable System Design; Corewind: Copenhagen, Denmark, 2020. [Google Scholar]
- Srinil, N. Cabling to connect offshore wind turbines to onshore facilities. In Offshore Wind Farms; Ng, C., Ran, L., Eds.; Woodhead Publishing: Sawston, UK, 2016; pp. 419–440. [Google Scholar] [CrossRef]
- Antunes, T.A.; Castro, R.; Santos, P.J.; Pires, A.J. Power-from-Shore Optioneering for Integration of Offshore Renewable Energy in Oil and Gas Production. Energies 2023, 17, 151. [Google Scholar] [CrossRef]
- Ringsberg, J.W.; Dieng, L.; Li, Z.; Hagman, I. Characterization of the Mechanical Properties of Low Stiffness Marine Power Cables through Tension, Bending, Torsion, and Fatigue Testing. J. Mar. Sci. Eng. 2023, 11, 1791. [Google Scholar] [CrossRef]
- Thies, P.R.; Harrold, M.; Johanning, L.; Grivas, K.; Georgallis, G. Performance Evaluation of Dynamic HV Cables with Al Conductors for Floating Offshore Wind Turbines. In Proceedings of the ASME 2019 2nd International Offshore Wind Technical Conference, St. Julian’s, Malta, 3–6 November 2019; American Society of Mechanical Engineers: St. Julian’s, Malta, 2019; p. V001T01A039. [Google Scholar] [CrossRef]
- Schnepf, A.; Lopez-Pavon, C.; Ong, M.C.; Yin, G.; Johnsen, Ø. Feasibility study on suspended inter-array power cables between two spar-type offshore wind turbines. Ocean Eng. 2023, 277, 114215. [Google Scholar] [CrossRef]
- Ahmad, I.B.; Schnepf, A.; Ong, M.C. An optimisation methodology for suspended inter-array power cable configurations between two floating offshore wind turbines. Ocean Eng. 2023, 278, 114406. [Google Scholar] [CrossRef]
- UNITECH. TetraSpar Floating Wind Turbine Pilot Installed. GCE Ocean Technology 2021. Available online: https://www.gceocean.no/news/posts/2021/august/tetraspar-floating-wind-turbine-pilot-installed/ (accessed on 15 August 2023).
- Worzyk, T. Submarine Power Cables: Design, Installation, Repair, Environmental Aspects; Springer: Berlin/Heidelberg, Germany, 2009. [Google Scholar] [CrossRef]
- Clausen, T.; D’ Souza, R. DEEPWATER E&P: Dynamic Risers’ Key Component for Deepwater Drilling, Floating Production. Offshore 2001. Available online: https://www.offshore-mag.com/deepwater/article/16759046/deepwater-ep-dynamic-risers-key-component-for-deepwater-drilling-floating-production (accessed on 10 August 2023).
- Rentschler, M.U.T.; Adam, F.; Chainho, P. Design optimization of dynamic inter-array cable systems for floating offshore wind turbines. Renew. Sustain. Energy Rev. 2019, 111, 622–635. [Google Scholar] [CrossRef]
- Thies, P.R.; Harrold, M.; Johanning, L.; Grivas, K.; Georgallis, G. Load, and fatigue evaluation for 66 kV floating offshore wind submarine dynamic power cable. In Proceedings of the Jicable’19-10th International Conference on Insulated Power Cables, Paris-Versailles, France, 23–27 June 2019. [Google Scholar]
- Zhao, S.; Cheng, Y.; Chen, P.; Nie, Y.; Fan, K. A comparison of two dynamic power cable configurations for a floating offshore wind turbine in shallow water. AIP Adv. 2021, 11, 035302. [Google Scholar] [CrossRef]
- Hung, Y.-C.; Yang, R.-Y. Experimental and Numerical Study on Suitable Configuration of Dynamical Power Cable Connected to Floating Substation in Shallow Water. SSRN 2023. Available online: https://dx.doi.org/10.2139/ssrn.4349135 (accessed on 23 April 2025).
- Zhao, S.; Wang, Y.; Chen, P. Dynamic Analysis of Multi-Wave Configurations of a Dynamic Export Cable for a Floating Wind Turbine in Shallow Water. In Proceedings of the 32nd International Ocean and Polar Engineering Conference, Shanghai, China, 5–10 June 2022; p. ISOPE-I-22-061. [Google Scholar]
- Durakovic, A. First Floating-to-Fixed Wind Turbine Connection Completed Offshore China. Offshore Wind 2021. Available online: https://www.offshorewind.biz/2021/09/02/first-floating-to-fixed-wind-turbine-connection-completed-offshore-china/ (accessed on 14 August 2023).
- Durakovic, A. Floating-to-Fixed Wind Turbine Connection Comes Online Offshore China-VIDEO. Offshore Wind 2021. Available online: https://www.offshorewind.biz/2021/12/10/floating-to-fixed-wind-turbine-connection-comes-online-offshore-china-video/ (accessed on 14 August 2023).
- Calvert, S.J.; Balash, C.; Chai, S.; Izarn, C.; Morand, H. Effects of Buoyancy Modules Geometry on Hydro-Elastic and Hydrodynamic Performance of a Steep Wave Riser in Steady Current. Volume 5A: Pipeline and Riser Technology; American Society of Mechanical Engineers: St. John’s, NL, Canada, 2015; p. V05AT04A037. [Google Scholar] [CrossRef]
- Amaechi, C.V.; Chesterton, C.; Butler, H.O.; Wang, F.; Ye, J. Review on the design and mechanics of bonded marine hoses for Catenary Anchor Leg Mooring (CALM) buoys. Ocean Eng. 2021, 242, 110062. [Google Scholar] [CrossRef]
- Taninoki, R.; Abe, K.; Sukegawa, T.; Azuma, D.; Nishikawa, M. Dynamic Cable System for Floating Offshore Wind Power Generation. SEI Tech. Rev. 2017, 190, 45–50. [Google Scholar]
- Thomson, D.; Thomson, A.; Muoniovaara, M.; Long, C.; Scuse, J. Decommissioning Penguin WEC 1 and Mooring Components-Method Statement; Orcades Marine Management Consultants Ltd.: Scotland, UK, 2020. [Google Scholar]
- Araújo, J.B.; Fernandes, A.C.; Sales, J.S., Jr.; Thurler, A.C.; Vilela, A.M. Innovative Oil Offloading System for Deep Water. In Proceedings of the Offshore Technology Conference, Houston, TX, USA, 6–9 May 2019; OTC: Houston, TX, USA, 2019; p. D022S057R006. [Google Scholar] [CrossRef]
- He, N.; Zhang, C.; Kang, Z. Analysis of Coupling Characteristics of the Offloading Buoy System in West Africa Seas. In Proceedings of the Twenty-Eighth (2018) International Ocean and Polar Engineering Conference, Sapporo, Japan, 10–15 June 2018. [Google Scholar]
- Kang, Y.; Sun, L.; Kang, Z.; Chai, S. Coupled Analysis of FPSO and CALM Buoy Offloading System in West Africa. In Proceedings of the ASME 2014 33rd International Conference on Ocean, Offshore and Arctic Engineering, San Francisco, CA, USA, 8–13 June 2014; American Society of Mechanical Engineers: New York, NY, USA, 2014. [Google Scholar] [CrossRef]
- Beier, D.; Schnepf, A.; Van Steel, S.; Ye, N.; Ong, M.C. Fatigue Analysis of Inter-Array Power Cables between Two Floating Offshore Wind Turbines Including a Simplified Method to Estimate Stress Factors. J. Mar. Sci. Eng. 2023, 11, 1254. [Google Scholar] [CrossRef]
- Beier, D. Dynamic and Fatigue Analyses of Suspended Power Cables for Multiple Floating Offshore Wind Turbines. Master’s Thesis, University of Stavanger, Stavanger, Norway, 2023. [Google Scholar]
- Schnepf, A.; Devulder, A.; Johnson, Ø.; Ong, M.C.; Lopez-Pavon, C. Numerical Investigations on Suspended Power Cable Configurations for Floating Offshore Wind Turbines in Deep Water Powering an FPSO. J. Offshore Mech. Arctic. Eng. 2023, 145, 030904. [Google Scholar] [CrossRef]
- Li, D.-R.; Su, Y.-S.; Yang, R.-Y. Experimental and Numerical Study of Suspended Inter-Array Cable Configurations for Floating Offshore Wind Farm. J. Mar. Sci. Eng. 2024, 12, 853. [Google Scholar] [CrossRef]
- Bech, A.; Storvoll, E. Marine Flexible Elongate Element and Method of Installation. US10370905B2, 6 August 2019. [Google Scholar]
- Amaechi, C.V.; Chesterton, C.; Butler, H.O.; Wang, F.; Ye, J. An Overview on Bonded Marine Hoses for Sustainable Fluid Transfer and (Un)Loading Operations via Floating Offshore Structures (FOS). J. Mar. Sci. Eng. 2021, 9, 1236. [Google Scholar] [CrossRef]
- Tan, Z.; Zhang, J.; Sheldrake, T.H.; Hou, Y.; Hill, T. Weight Added Wave (WAW) System in Production Brazil Offshore Application. In Proceedings of the Offshore Technology Conference (OTC), Houston, TX, USA, 6–9 May 2013; OnePetro: Richardson, TX, USA, 2013. [Google Scholar] [CrossRef]
- Hanonge, D.; Luppi, A. Challenges of Flexible Riser Systems in Shallow Waters. In Proceedings of the Offshore Technology Conference (OTC), Houston, TX, USA, 3–6 May 2010; OnePetro: Richardson, TX, USA, 2010; p. 14. [Google Scholar]
- Tess. Large Bore Flexible Umbilical for Aquaculture 2021. Available online: https://techtransfer.no/en/fishing-and-aquaculture/tess/ (accessed on 29 November 2023).
- Martinelli, L.; Lamberti, A.; Ruol, P.; Ricci, P.; Kirrane, P.; Fenton, C.; Johanning, L. Power Umbilical for Ocean Renewable Energy Systems-Feasibility and Dynamic Response Analysis. In Proceedings of the 3rd International Conference on Ocean Energy (ICOE), Bilbao, Spain, 6–9 October 2010; p. 8. [Google Scholar]
- Dai, T.; Sævik, S.; Ye, N. Experimental and numerical studies on dynamic stress and curvature in steel tube umbilicals. Mar. Struct. 2020, 72, 102724. [Google Scholar] [CrossRef]
- Svensson, G.; Sævik, S.; Ringsberg, J.W. Fatigue damage analysis of dynamic power cables by laboratory testing and FE analysis. In Developments in the Analysis and Design of Marine Structures, 1st ed.; CRC Press: London, UK, 2021; pp. 477–484. [Google Scholar] [CrossRef]
- Ovun. Offshore & Subsea-Buoyancy Systems and Cable Protection Solutions; Ovun AS: Åndalsnes, Norway, 2024. [Google Scholar]
- Shaukat, U.; Schnepf, A.; Giljarhus, K.E.T. Flow over a step cylinder using partially averaged Navier-Stokes equations with application towards dynamic subsea power cables. IOP Conf. Ser. Mater. Sci. Eng. 2023, 1294, 012002. [Google Scholar] [CrossRef]
- Li, L.; Gao, Z.; Moan, T. Joint Distribution of Environmental Conditions at Five European Offshore Sites for Design of Combined Wind and Wave Energy Devices. J. Offshore Mech. Arctic. Eng. 2015, 137, 031901. [Google Scholar] [CrossRef]
- Chakrabarti, S.K. (Ed.) Handbook of Offshore Engineering; Elsevier: London, UK, 2005. [Google Scholar] [CrossRef]
- Obhrai, C.; Kalvig, S.; Gudmestad, O.T. A Review of Current Guidelines and Research on Wind Modelling for the Design of Offshore Wind Turbines. In Proceedings of the Twenty-Second International Offshore and Polar Engineering Conference, Rhodes, Greece, 17–22 June 2012; OnePetro: Richardson, TX, USA, 2012. [Google Scholar]
- Bitner-Gregersen, E.M.; Toffoli, A. Occurrence of rogue sea states and consequences for marine structures. Ocean Dyn. 2014, 64, 1457–1468. [Google Scholar] [CrossRef]
- Ponce De León, S.; Guedes Soares, C. Numerical study of the effect of current on waves in the Agulhas Current Retroflection. Ocean Eng. 2022, 264, 112333. [Google Scholar] [CrossRef]
- Marechal, G.; Ardhuin, F. Surface Currents and Significant Wave Height Gradients: Matching Numerical Models and High-Resolution Altimeter Wave Heights in the Agulhas Current Region. J. Geophys. Res. Oceans 2021, 126, 1–16. [Google Scholar] [CrossRef]
- DTU Wind Energy, VORTEX, The World Bank. Offshore Wind Resource Map-Mean Wind Speed 2019. Available online: https://globalwindatlas.info (accessed on 22 November 2023).
- DTU Wind Energy, VORTEX, The World Bank. Offshore Wind Resource Map-Wind Power Density Potential 2019. Available online: https://globalwindatlas.info (accessed on 22 November 2023).
- Olagnon, M.; Quiniou-Ramus, V. Specification of Metocean Design Conditions: Recent Progress and Remaining Gaps. In Proceedings of the Thirteenth International Offshore and Polar Engineering Conference, Honolulu, HI, USA, 25–30 May 2003; OnePetro: Richardson, TX, USA, 2003. [Google Scholar]
- Yamaguchi, A.; Taki, S.; Ishihara, T. Metocean Measurement at Fukushima Offshore Site. In Proceedings of the Grand Renewable Energy 2018 Proceedings, Yokohama, Japan, 20–22 June 2018. [Google Scholar]
- Kim, S.W.; Sævik, S.; Wu, J.; Leira, B.J. Time domain simulation of marine riser vortex-induced vibrations in three-dimensional currents. Appl. Ocean Res. 2022, 120, 103057. [Google Scholar] [CrossRef]
- Santala, M. Examining Variations in West of Shetlands Current Profile Shapes in Light of Regional Oceanography. In Proceedings of the Offshore Technology Conference, Houston, TX, USA, 30 April–3 May 2012; OnePetro: Richardson, TX, USA, 2012. [Google Scholar] [CrossRef]
- Yu, S.; Wu, W.; Naess, A. Current Profile Extreme Prediction in the South China Sea Based on the EOF-ACER Method, by Considering Current Directions. IJOPE 2021, 31, 275–282. [Google Scholar] [CrossRef]
- Saetre, H.J. Acquisition of Critical Metocean Data on the Norwegian Deepwater Frontier. In Proceedings of the Offshore Technology Conference, Houston, TX, USA, 3–6 May 1999; OnePetro: Richardson, TX, USA, 1999. [Google Scholar] [CrossRef]
- McClimans, T.A.; Lønseth, L. Oscillations of frontal currents. Cont. Shelf Res. 1985, 4, 699–707. [Google Scholar] [CrossRef]
- Lima, J.A.M.; Scofano, A.M. New Oceanographic Challenges in Brazilian Deepwater Oil Fields. In Proceedings of the Offshore Technology Conference, Houston, TX, USA, 3–6 May 1999; OnePetro: Richardson, TX, USA, 1999. [Google Scholar] [CrossRef]
- Hyder, P.; Jeans, D.R.G.; Cauquil, E.; Nerzic, R. Observations and predictability of internal solitons in the northern Andaman Sea. Appl. Ocean Res. 2005, 27, 1–11. [Google Scholar] [CrossRef]
- Umehara, M.; Matsuki, S. Measurements of velocity and trajectory of water particle for internal waves in two density layers: Internal Wave Trajectory. Geophys. Res. Lett. 2011, 38, 1–7. [Google Scholar] [CrossRef]
- Felisita, A. On the Application of Steel Lazy Wave Riser for Deepwater Locations with Harsh Environments (no. 330). Ph.D. Thesis, University of Stavanger, Stavanger, Norway, 2016. [Google Scholar]
- GOA-Global Ocean Associates. An Atlas of Internal Solitary-Like Waves and Their Properties. 2004. Available online: http://internalwaveatlas.com/ (accessed on 3 January 2024).
- Marty, A.; Schoefs, F.; Soulard, T.; Berhault, C.; Facq, J.V.; Gaurier, B.; Germain, G. Effect of Roughness of Mussels on Cylinder Forces from a Realistic Shape Modelling. J. Mar. Sci. Eng. 2021, 9, 598. [Google Scholar] [CrossRef]
- Ameryoun, H. Probabilistic Modeling of Wave Actions on Jacket-Type Offshore Wind Turbines in the Presence of Marine Growth. Ph.D. Thesis, Université de Nantes, Nantes, France, 2015. [Google Scholar]
- Okubo, S.; Mitani, S.; Azumaya, O.; Yuto, H.; Niizato, H.; Kosasih, K.M.A.; Takeuchi, K.; Suzuki, H. Survey of Marine Growth on the Dynamic Cable for Floating Offshore Wind Turbine-Comparison of Survey Results and Design Values. In Proceedings of Lectures of the Japan Society of Shipbuilding and Marine Engineering No. 33; Japanese Shipbuilding and Marine Engineering Society: Tokyo, Japan, 2021. [Google Scholar]
- Tian, L.; Yin, Y.; Bing, W.; Jin, E. Antifouling Technology Trends in Marine Environmental Protection. J. Bionic Eng. 2021, 18, 239–263. [Google Scholar] [CrossRef] [PubMed]
- Gulski, E.; Anders, G.J.; Jongen, R.A.; Parciak, J.; Siemiński, J.; Piesowicz, E.; Paszkiewicz, S.; Irska, I. Discussion of the electrical and thermal aspects of offshore wind farms’ power cables’ reliability. Renew. Sustain. Energy Rev. 2021, 151, 111580. [Google Scholar] [CrossRef]
- Maksassi, Z.; Garnier, B.; Moctar, A.O.E.; Schoefs, F.; Schaeffer, E. Thermal Characterization and Thermal Effect Assessment of Biofouling around a Dynamic Submarine Electrical Cable. Energies 2022, 15, 3087. [Google Scholar] [CrossRef]
- Peyton, H.R. Arctic engineering. J. Pet. Technol. 1970, 22, 1076–1082. [Google Scholar] [CrossRef]
- Winther, S.N.; Gudmestad, O.T. Impact of and solutions to the effects of climate change for Longyearbyen, Svalbard, Norway. IOP Conf. Ser. Material Sci. Eng. 2023, 1294, 012036. [Google Scholar] [CrossRef]
- Jorgensen, J.; Griffiths, T.; McGrath, N.; Görmüş, D.; Severs, G.; Thurstan, B.; Pistani, F.; Ledoux, B. Application of STABLEpipe Method C Assessment to Determine On-Bottom Stability of a Cable Crossing in North Sea Mobile Seabed Conditions. In Proceedings of the ASME 2023 42nd International Conference on Ocean, Offshore and Arctic Engineering, vol. 8, Melbourne, Australia, 11–16 June 2023; The American Society of Mechanical Engineers (ASME): New York, NY, USA, 2023. [Google Scholar] [CrossRef]
- McGrath, N.; Griffiths, T.; Jorgensen, J.; Pistani, F.; Draper, S.; Cheng, L. Improved Reliability Assessment Methods for Subsea Cables on Rocky Seabed Using NPV Calculation. In Proceedings of the ASME 2023 42nd International Conference on Ocean, Offshore and Arctic Engineering, vol. 8, Melbourne, Australia, 11–16 June 2023; The American Society of Mechanical Engineers (ASME): New York, NY, USA, 2023. [Google Scholar] [CrossRef]
- Allianz. A Turning Point for Offshore Wind-Global Opportunities and Risk Trends; Allianz: Munich, Germany, 2023. [Google Scholar]
- Bitner-Gregersen, E.M.; Waseda, T.; Parunov, J.; Yim, S.; Hirdaris, S.; Ma, N.; Soares, C.G. Uncertainties in long-term wave modelling. Mar. Struct. 2022, 84, 103217. [Google Scholar] [CrossRef]
- Feng, X.; Tsimplis, M.N.; Yelland, M.J.; Quartly, G.D. Changes in significant and maximum wave heights in the Norwegian Sea. Glob. Planet. Chang. 2014, 113, 68–76. [Google Scholar] [CrossRef]
- Jensen, S. Taiwan May Face Fewer Typhoons—But Harsher Droughts-as the Planet Warms. Reuters 2020. Available online: https://www.reuters.com/article/us-climate-change-taiwan-typhoon-feature-idUSKBN28W00D (accessed on 24 October 2023).
- Lee, H.-Y. One-Third of Taiwan’s Corals Are Dying Due to Bleaching: Researchers. Focus Taiwan-CNA English News 2021. Available online: https://focustaiwan.tw/society/202101120010 (accessed on 23 November 2023).
- Ran, X.; Yu, Z.; Lijun, Z.; Zhou, Z.; Jiangyan, G. Reliability analysis of an umbilical under ultimate tensile load based on response surface approach. Underw. Technol. 2020, 37, 87–93. [Google Scholar] [CrossRef]
- Young, D.; Ng, C.; Oterkus, S.; Li, Q.; Johanning, L. Predicting failure of dynamic cables for floating offshore wind. In Proceedings of the RENEW 2018, Lisboa, Portugal, 8–10 October 2018. [Google Scholar]
- Rabelo, M.A.; Pesce, C.P.; Santos, C.C.P.; Ramos, R.; Franzini, G.R.; Gay Neto, A. An investigation on flexible pipes bird caging triggering. Mar. Struct. 2015, 40, 159–182. [Google Scholar] [CrossRef]
- Grivas, K.; Moraiti, A.; Georgallis, G.; Bareiro, O. D3.4-Final 72.5 kV Dynamic Cable Sample; FLOTANT: Patras, Greece, 2021. [Google Scholar]
- Nasution, F.P.; Sævik, S.; Berge, S. Experimental and finite element analysis of fatigue strength for 300 mm2 copper power conductor. Mar. Struct. 2014, 39, 225–254. [Google Scholar] [CrossRef]
- Yan, Q.; Hong, G.; Lei, Z.; Zhenqin, Y.; Juyue, L. Extreme and Fatigue Analysis of a Dynamic Subsea Power Umbilical. In Volume 5A: Pipelines, Risers, and Subsea Systems; American Society of Mechanical Engineers: Glasgow, UK, 2019; p. V05AT04A004. [Google Scholar] [CrossRef]
- Balena, R.; Williams, P. Risk-Based Structural Analysis of Frade Umbilical Cables. In Proceedings of the 20th International Congress of Mechanical Engineering COBEM 2009, Gramado, Rio Grande Do Sul, Brazil, 15–20 November 2009; Brazilian Society of Mechanical Sciences and Engineering, ABCM: Parana, Brazil, 2009. [Google Scholar]
- Land, E.; Hu, Z.; Haley, N.; Brindley, W.; Ng, C. The effects of surge underprediction on fatigue damage of floating offshore wind turbine dynamic cables. In Advances in the Analysis and Design of Marine Structures, 1st ed.; CRC Press: London, UK, 2023; pp. 503–510. [Google Scholar] [CrossRef]
- Karlsen, S.; Slora, R.; Heide, K.; Lund, S.; Eggertsen, F.; Osborg, P.A. Dynamic Deep-Water Power Cables. In Proceedings of the RAO/CIS Offshore Conference and Exhibition 2009, St. Petersburg, Russia, 15–18 September 2009; p. 10. [Google Scholar]
- Resner, L.; Paszkiewicz, S. Radial Water Barrier in Submarine Cables, Current Solutions, and Innovative Development Directions. Energies 2021, 14, 2761. [Google Scholar] [CrossRef]
- Holcombe, A.; Edwards, E.; Tosdevin, T.; Greaves, D.; Hann, M. A Comparative Study of Potential-Flow-Based Numerical Models to Experimental Tests of a Semi-Submersible Floating Wind Turbine Platform. In Proceedings of the 33rd International Ocean and Polar Engineering Conference, Ottawa, ON, Canada, 19–23 June 2023; International Society of Offshore and Polar Engineers (ISOPE): Cupertino, CA, USA, 2023. [Google Scholar]
- Robertson, A.N.; Gueydon, S.; Bachynski, E.; Wang, L.; Jonkman, J.; Alarcon, D.; Amet, E.; Beardsell, A.; Bonnet, P.; Boudet, B.; et al. OC6 Phase I: Investigating the underprediction of low-frequency hydrodynamic loads and responses of a floating wind turbine. J. Phys. Conf. Ser. 2020, 1618, 032033. [Google Scholar] [CrossRef]
- Robertson, A.N.; Wendt, F.; Jonkman, J.M.; Popko, W.; Dagher, H.; Gueydon, S.; Qvist, J.; Vittori, F.; Azcona, J.; Uzunoglu, E.; et al. OC5 Project Phase II: Validation of Global Loads of the DeepCwind Floating Semisubmersible Wind Turbine. Energy Procedia 2017, 137, 38–57. [Google Scholar] [CrossRef]
- Pinkster, J.A. Low-Frequency Phenomena Associated with Vessels Moored at Sea. Soc. Pet. Eng. J. 1975, 15, 487–494. [Google Scholar] [CrossRef]
- Bryant, M.J.; Hickok, D.D. Umbilical Failure-Mechanisms and Avoidance. In Proceedings of the Subsea Control and Data Acquisition: Proceedings of an International Conference, London, UK, 4–5 April 1990; OnePetro: Richardson, TX, USA, 1990. [Google Scholar]
- Simonsen, A. Inspection and Monitoring Techniques for Unbonded Flexible Risers and Pipelines. Master’s Thesis, University of Stavanger, Stavanger, Norway, 2014. [Google Scholar]
- Saneian, M.; Gao, Y.; Bai, Y.; Liu, T. Analysis of Subsea Umbilical Mechanical Behavior Under Simultaneous Bending, Tension and Torsion. In Proceedings of the 38th International Conference on Ocean, Offshore and Arctic Engineering; Volume 5A: Pipelines, Risers, and Subsea Systems, Glasgow, Scotland, UK, 9–14 June 2019; American Society of Mechanical Engineers (ASME): New York, NY, USA, 2019; p. V05AT04A032. [Google Scholar] [CrossRef]
- Börü, M.E. VIV Fatigue of Dynamic Power Cables Applied in Offshore Wind Turbines. Master’s Thesis, Norwegian University of Science and Technology, Torgarden, Norway, 2021. [Google Scholar]
- Elrick, P.; Venugopal, V. Vortex-Induced Vibrations of Dynamic Power Cable for Floating Wind Turbines. In Proceedings of the 42nd International Conference on Ocean, Offshore and Arctic Engineering; Volume 7: CFD & FSI, Melbourne, Australia, 11–16 June 2023; American Society of Mechanical Engineers (ASME): New York, NY, USA, 2023; p. V007T08A026. [Google Scholar] [CrossRef]
- Fuglsang, A.; Kusangaya, A.J.; Dillon-Gibbons, C.; Bauer, P.; Marcollo, H. Comparison of Vessel Motion Induced-VIV Response of Lazy-Wave and W-Shaped FOWT Power Cable Configurations. In Proceedings of the OMAE Conference, Melbourne, Australia, 12–15 June 2023; ASME: New York, NY, USA, 2023. [Google Scholar] [CrossRef]
- Lal, M.; Sebastian, A.; Rana, Y. Application of Artificial Intelligence for VIV Strake Optimization of Steel Lazy Wave Risers. In Volume 3: Materials Technology; Pipelines, Risers, and Subsea Systems; American Society of Mechanical Engineers: Hamburg, Germany, 2022; p. V003T04A035. [Google Scholar] [CrossRef]
- Yin, D.; Wu, J.; Lie, H.; Jin, J.; Passano, E.; Saevik, S.; Riemer-Sorenson, S.; Rustad, A.M.; Tognarelli, M.A.; Grytyr, G.; et al. Optimization of Hydrodynamic Coefficients for VIV Prediction. Volume 8: CFD and FSI. Virtual, online. Am. Soc. Mech. Eng. 2021, 85185, V008T08A025. [Google Scholar] [CrossRef]
- Liu, D.; Ahmad, I.; Janocha, M.J.; Nystrøm, P.; Ong, M.C. Optimization of bend stiffeners of a suspended inter-array power cable between two floating offshore wind turbines. IOP Conf. Ser. Mater. Sci. Eng. 2023, 1294, 012018. [Google Scholar] [CrossRef]
- Tang, M.; Yan, J.; Chen, J.; Yang, Z.; Yue, Q. Nonlinear analysis and multi-objective optimization for bend stiffeners of flexible riser. J. Mar. Sci. Technol. 2015, 20, 591–603. [Google Scholar] [CrossRef]
- Mainçon, P.; Longva, V. Torsion Failures in Handling Operations for Power Cables, Umbilicals and Flexible Pipes. In Proceedings of the 40th International Conference on Ocean, Offshore and Arctic Engineering; Volume 4: Pipelines, Risers, and Subsea Systems, Virtual online, 21–30 June 2021; American Society of Mechanical Engineers (ASME): New York, NY, USA, 2021; p. V004T04A003. [Google Scholar] [CrossRef]
- Okkerstrøm, L. Sensitivity Analysis of Peak Tension Loads on Subsea Power Cables during Laying Operations. Master’s Thesis, Western Norway University of Applied Sciences, Bergen, Norway, 2021. [Google Scholar]
- Okkerstrøm, L.; Gudmestad, O.T.; Pedersen, E. Simulation of peak tension loads in Subsea power cables during installation. IOP Conf. Ser. Mater. Sci. Eng. 2021, 1201, 012010. [Google Scholar] [CrossRef]
- Buljan, A. World’s First Floating Wind Farm to Undergo First Major Maintenance Campaign, Turbines to Be Towed to Norwegian Port. Offshore Wind 2024. Available online: https://www.offshorewind.biz/2024/01/15/worlds-first-floating-wind-farm-to-undergo-first-major-maintenance-campaign-turbines-to-be-towed-to-norwegian-port/ (accessed on 19 January 2024).
- Al-Sallami, O. Cables Decommissioning in Offshore Wind Farms: Environmental and Economical Perspective. Master’s Thesis, Uppsala Universitet, Uppsala, Sweden, 2021. [Google Scholar]
- ARUP, Marine Scotland. Review of Approaches and Costs of Decommissioning Offshore Wind Installations; ARUP: Scotland, UK, 2018. [Google Scholar]
- Haid, L.; Stewart, G.; Jonkman, J.; Robertson, A.; Lackner, M.; Matha, D. Simulation-Length Requirements in the Loads Analysis of Offshore Floating Wind Turbines. In Proceedings of the 32nd International Conference on Ocean, Offshore and Arctic Engineering; Volume 8: Ocean Renewable Energy, Nantes, France, 9–14 June 2013; American Society of Mechanical Engineers (ASME): New York, NY, USA, 2013; p. V008T09A091. [Google Scholar] [CrossRef]
- Pillai, A.C.; Thies, P.R.; Johanning, L. Mooring system design optimization using a surrogate-assisted multi-objective genetic algorithm. Eng. Optim. 2019, 51, 1370–1392. [Google Scholar] [CrossRef]
- Orcina Ltd. OrcaFlex 2024. Available online: https://www.orcina.com/webhelp/OrcaFlex/ (accessed on 29 February 2024).
- Taormina, B.; Bald, J.; Want, A.; Thouzeau, G.; Lejart, M.; Desroy, N.; Carlier, A. A review of potential impacts of submarine power cables on the marine environment: Knowledge gaps, recommendations, and future directions. Renew. Sustain. Energy Rev. 2018, 96, 380–391. [Google Scholar] [CrossRef]
- Merck, T.; Wasserthal, R. Assessment of the Environmental Impacts of Cables; OSPAR Commission: London, UK, 2009. [Google Scholar]
- Farr, H.; Ruttenberg, B.; Walter, R.K.; Wang, Y.-H.; White, C. Potential environmental effects of deepwater floating offshore wind energy facilities. Ocean Coast. Manag. 2021, 207, 105611. [Google Scholar] [CrossRef]
- Jakubowska-Lehrmann, M.; Białowąs, M.; Otremba, Z.; Hallmann, A.; Śliwińska-Wilczewska, S.; Urban-Malinga, B. Do magnetic fields related to submarine power cables affect the functioning of a common bivalve? Mar. Environ. Res. 2022, 179, 105700. [Google Scholar] [CrossRef]
- Scott, K.; Harsanyi, P.; Easton, B.A.A.; Piper, A.J.R.; Rochas, C.M.V.; Lyndon, A.R. Exposure to Electromagnetic Fields (EMF) from Submarine Power Cables Can Trigger Strength-Dependent Behavioral and Physiological Responses in Edible Crab, Cancer pagurus (L.). J. Mar. Sci. Eng. 2021, 9, 776. [Google Scholar] [CrossRef]
- Dunham, A.; Pegg, J.R.; Carolsfeld, W.; Davies, S.; Murfitt, I.; Boutillier, J. Effects of submarine power transmission cables on a glass sponge reef and associated megafaunal community. Mar. Environ. Res. 2015, 107, 50–60. [Google Scholar] [CrossRef]
- Westerberg, H.; Lagenfelt, I. Sub-Sea power cables and the migration behavior of the European eel. Fish. Manag. Ecol. 2008, 15, 369–375. [Google Scholar] [CrossRef]
- Garavelli, L. 2020 State of the Science Report. In Chapter 8: Encounters of Marine Animals with Marine Renewable Energy Device Mooring Systems and Subsea Cables; A report prepared by Pacific Northwest National Laboratory on behalf of the U.S. Department of Energy; U.S. Department of Energy: Washington, DC, USA, 2020. [Google Scholar] [CrossRef]
- Lin, T.-H.; Yang, R.-Y. Stability Analysis and Environmental Influence Evaluation on a Hybrid Mooring System for a Floating Offshore Wind Turbine. J. Mar. Sci. Eng. 2023, 11, 2236. [Google Scholar] [CrossRef]
- Hooper, T.; Austen, M. The co-location of offshore windfarms and decapod fisheries in the UK: Constraints and opportunities. Mar. Policy 2014, 43, 295–300. [Google Scholar] [CrossRef]
- Krone, R.; Dederer, G.; Kanstinger, P.; Krämer, P.; Schneider, C.; Schmalenbach, I. Mobile demersal megafauna at common offshore wind turbine foundations in the German Bight (North Sea) two years after deployment-increased production rate of Cancer pagurus. Mar. Environ. Res. 2017, 123, 53–61. [Google Scholar] [CrossRef] [PubMed]
- Hutchison, Z.L.; Gill, A.B.; Sigray, P.; He, H.; King, J.W. A modelling evaluation of electromagnetic fields emitted by buried subsea power cables and encountered by marine animals: Considerations for marine renewable energy development. Renew. Energy 2021, 177, 72–81. [Google Scholar] [CrossRef]
- Maxwell, S.M.; Kershaw, F.; Locke, C.C.; Conners, M.G.; Dawson, C.; Aylesworth, S.; Loomis, R.; Johnson, A.F. Potential impacts of floating wind turbine technology on marine species and habitats. J. Environ. Manag. 2022, 307, 114577. [Google Scholar] [CrossRef]
- Hirokawa, E.; Suzuki, H.; Hirabayashi, S.; Muratake, M. Estimation of Risk of Progressive Drifts in a Wind Farm Caused by Collision of Drift Ship. In Proceedings of the 34th International Conference on Ocean, Offshore and Arctic Engineering; Volume 6: Ocean Space Utilization, St. John’s, NL, Canada, 31 May–5 June 2015; American Society of Mechanical Engineers (ASME): New York, NY, USA, 2015; p. V006T05A011. [Google Scholar] [CrossRef]
- Holmås, H.E.; Dale, M.S.; Gjerde, S.S.; Holmås, H.E.; Jacobsen, A.K.; Magnus, E.; Mekki, A.; Notkevich, L.; Persen, G.; Vevatne, T.I. Hywind Tampen-Samfunnsmessige Ringvirkninger; Equinor: Stavanger, Norway, 2019. (In Norwegian) [Google Scholar]
- Kallinger, M.D.; Rapha, J.I.; Trubat Casal, P.; Domínguez-García, J.L. Offshore Electrical Grid Layout Optimization for Floating Wind; A Review. Clean. Technol. 2023, 5, 791–827. [Google Scholar] [CrossRef]
- Song, D.; Yan, J.; Gao, Y.; Wang, L.; Du, X.; Xu, Z.; Zhang, Z.; Yang, J.; Dong, M.; Chen, Y. Optimization of floating wind farm power collection system using a novel two-layer hybrid method. Appl. Energy 2023, 348, 121546. [Google Scholar] [CrossRef]
- Lerch, M.; De-Prada-Gil, M.; Molins, C. A metaheuristic optimization model for the inter-array layout planning of floating offshore wind farms. Int. J. Electr. Power Energy Syst. 2021, 131, 107128. [Google Scholar] [CrossRef]
- Lerch, M.; De-Prada-Gil, M.; Molins, C. Collection Grid Optimization of a Floating Offshore Wind Farm Using Particle Swarm Theory. J. Phys. Conf. Series. 2019, 1356, 012012. [Google Scholar] [CrossRef]
- Giassi, M.; Castellucci, V.; Göteman, M. Economic layout optimization of wave energy parks clustered in electrical subsystems. Appl. Ocean Res. 2020, 101, 102274. [Google Scholar] [CrossRef]
- Patryniak, K.; Collu, M.; Coraddu, A. Multidisciplinary design analysis and optimisation frameworks for floating offshore wind turbines: State of the art. Ocean Eng. 2022, 251, 111002. [Google Scholar] [CrossRef]
- Faraggiana, E.; Giorgi, G.; Sirigu, M.; Ghigo, A.; Bracco, G.; Mattiazzo, G. A review of numerical modelling and optimisation of the floating support structure for offshore wind turbines. J. Ocean Eng. Mar. Energy 2022, 8, 433–456. [Google Scholar] [CrossRef]
- Fylling, I.; Berthelsen, P.A. WINDOPT: An Optimization Tool for Floating Support Structures for Deep Water Wind Turbines. In Proceedings of the 30th International Conference on Ocean, Offshore and Arctic Engineering; Volume 5: Ocean Space Utilization; Ocean Renewable Energy, Rotterdam, The Netherlands, 19–24 June 2011; The American Society of Mechanical Engineers Digital Collection (ASMEDC): New York, NY, USA, 2011; pp. 767–776. [Google Scholar] [CrossRef]
- Brommundt, M.; Krause, L.; Merz, K.; Muskulus, M. Mooring System Optimization for Floating Wind Turbines using Frequency Domain Analysis. Energy Procedia 2012, 24, 289–296. [Google Scholar] [CrossRef]
- Hegseth, J.M.; Bachynski, E.E.; Martins, J.R.R.A. Integrated design optimization of spar floating wind turbines. Mar. Struct. 2020, 72, 102771. [Google Scholar] [CrossRef]
- Leimeister, M.; Kolios, A.; Collu, M.; Thomas, P. Design optimization of the OC3 phase IV floating spar-buoy, based on global limit states. Ocean Eng. 2020, 202, 107186. [Google Scholar] [CrossRef]
- Poirette, Y.; Guiton, M.; Huwart, G.; Sinoquet, D.; Leroy, J.M. An Optimization Method for the Configuration of Inter-Array Cables for Floating Offshore Wind Farm. In Proceedings of the 36th International Conference on Ocean, Offshore and Arctic Engineering; Volume 10: Ocean Renewable Energy, Trondheim, Norway, 25–30 June 2017; American Society of Mechanical Engineers: New York, NY, USA, 2017; p. 10. [Google Scholar] [CrossRef]
- Schnepf, A.; Giljarhus, K.E.T.; Johnsen, Ø.; Lopez-Pavon, C. Dynamic Power Cable Configuration Design for Floating Offshore Wind Turbines Using Gradient-Based Optimization. In Proceedings of the 42nd International Conference on Ocean, Offshore and Arctic Engineering (OMAE); Volume 8: Ocean Renewable Energy, Melbourne, Australia, 11–16 June 2023; American Society of Mechanical Engineers (ASME): New York, NY, USA, 2023; p. 11. [Google Scholar] [CrossRef]
- Schnepf, A. Design Optimisation of Power Cable Configurations for Floating Offshore Wind Turbines. Ph.D. Thesis, University of Stavanger, Stavanger, Norway, 2024. [Google Scholar]
- Schnepf, A.; Giljarhus, K.E.T. Efficient Global Optimization of dynamic power cable configurations for floating offshore wind turbines. Offshore Mech. Arctic Eng. 2024. (submitted). [Google Scholar]
- Nehme, R.; Dethoor, X. Oil Offloading Lines and Fiber Optic Cable Package. Presented at the Offshore Technology Conference, Houston, TX, USA, 4–7 May 2015; 2015; p. OTC-25885-MS. [Google Scholar] [CrossRef]
- Cunliffe, N.; McCarthy, T.J. Application of Genetic Algorithms for the Automated Design of Offshore Riser Systems. In Proceedings of the Seventh International Conference on the Application of Artificial Intelligence to Civil and Structural Engineering, Egmond-Aan-Zee, The Netherlands, 2–4 September 2003; p. 35. [Google Scholar] [CrossRef]
- Vieira, L.T. Projeto Ótimo de Risers via Algoritmos Genéticos (Optimal Riser Design via Genetic Algorithms). Ph.D. Thesis, COPPE/UFRJ, Rio de Janeiro, Brazil, 2004. [Google Scholar]
- Vieira, L.T. Otimização de Sistemas de Risers para Exploração de Petróleo Offshore Através de Algoritmos Genéticos Paralelos (Optimization of Riser Systems for Offshore Oil Exploration Using Parallel Genetic Algorithms). Ph.D. Thesis, Universidade Federal do Rio de Janeiro, COPPE, Rio de Janeiro, Brazil, 2008. [Google Scholar]
- Laddé, S. Multi-Objective Optimization of Steel Lazy Wave Riser Design Through Genetic Algorithms. Master’s Thesis, TU Delft, Delft, The Netherlands, 2011. [Google Scholar]
- Cardoso, P.H.D.S. Otimização da Configuração Geométrica de Risers Rígidos (Optimization of the Geometric Configuration of Rigid Risers). Master’s Thesis, Pontifícia Universidade Católica do Rio de Janeiro, Rio de Janeiro, Brazil, 2019. [Google Scholar] [CrossRef]
- Vieira, I.N.; de Lima, B.S.L.P.; Jacob, B.P. Bio-inspired algorithms for the optimization of offshore oil production systems. Int. J. Numer. Methods Eng. 2012, 91, 1023–1044. [Google Scholar] [CrossRef]
- Vieira, I.N.; Silva, A.J.M.; Lima, B.; Jacob, B.P. A Comparative Study Applied to Risers Optimization Using Bio-Inspired Algorithms. Int. J. Model. Simul. Pet. Ind. 2009, 3, 12. [Google Scholar]
- Wang, A.; Yang, H.; Li, H. Multi-objective Optimization for Dynamic Umbilical Installation Using Non-Dominated Sorting Genetic Algorithm. In Proceedings of the 30th International Conference on Ocean, Offshore and Arctic Engineering (OMAE); Volume 4: Pipeline and Riser Technology, Rotterdam, The Netherlands, 19–24 June 2011; American Society of Mechanical Engineers (ASME): New York, NY, USA, 2011; pp. 121–129. [Google Scholar] [CrossRef]
- Yang, H.; Wang, A.; Li, H. Multi-objective optimization for deepwater dynamic umbilical installation analysis. Sci. China Phys. Mech. Astron. 2012, 55, 1445–1453. [Google Scholar] [CrossRef]
- Yang, Z.; Yan, J.; Sævik, S.; Lu, Q.; Ye, N.; Chen, J.; Yue, Q. Integrated optimisation design of a dynamic umbilical based on an approximate model. Mar. Struct. 2021, 78, 102995. [Google Scholar] [CrossRef]
- Yan, J.; Su, Q.; Li, R.; Xu, J.; Lu, Q.; Yang, Z. Optimization Design Method of the Umbilical Cable Global Configuration Based on Representative Fatigue Conditions. IEEE J. Ocean. Eng. 2023, 48, 188–198. [Google Scholar] [CrossRef]
- Riggs, H.R. Automated Preliminary Design of Flexible Riser Configurations. In Proceedings of the Eighth International Conference on Offshore Mechanics and Arctic Engineering, The Hague, the Netherlands, 19–23 March 1989; American Society of Mechanical Engineers: New York, NY, USA, 1989; pp. 503–510. [Google Scholar]
- Riggs, H.R.; Leraand, T. Efficient Static Analysis and Design of Flexible Risers. J. Offshore Mech. Arctic Eng. 1991, 113, 235–240. [Google Scholar] [CrossRef]
- Larsen, C.M.; Hanson, T. Optimization of Catenary Risers. J. Offshore Mech. Arctic Eng. 1999, 121, 90–94. [Google Scholar] [CrossRef]
- Vieira, L.T.; de Lima Bde, S.L.P.; Evsukoff, A.G.; Jacob, B.P. Application of Genetic Algorithms to the Synthesis of Riser Configurations. In Proceedings of the 22nd International Conference on Offshore Mechanics and Arctic Engineering, Cancun, Mexico, 8–13 June 2003; Offshore Technology; Ocean Space Utilization. American Society of Mechanical Engineers (ASME): New York, NY, USA, 2003; Volume 1, pp. 391–396. [Google Scholar] [CrossRef]
- Cunliffe, N.; Baxter, C.; McCarthy, T.; Trim, A. Evolutionary Design of Marine Riser Systems. In Proceedings of the 23rd International Conference on Offshore Mechanics and Arctic Engineering, Parts A and B, Vol. 1, Vancouver, BC, Canada, 20–25 June 2004; American Society of Mechanical Engineers: New York, NY, USA, 2004; pp. 733–739. [Google Scholar] [CrossRef]
- de Rodrigues, G.J.O. Ferramentas Computacionais para Otimização e Síntese de Sistemas Híbridos de Risers Baseados no Conceito de Bóia de Subsuperfície (Computational Tools for the Optimisation and Synthesis of Hybrid Risers Based on the Subsurface Buoy Concept). Ph.D. Thesis, Universidade Federal do Rio de Janeiro, COPPE, Rio de Janeiro, Brazil, 2004. [Google Scholar]
- Roveri, F.E.; de Arruda Martins, C.; Balena, R. Parametric Analysis of a Lazy-Wave Steel Riser. In Proceedings of the 24th International Conference on Offshore Mechanics and Arctic Engineering: Volume 1, Parts A and B, Halkidiki, Greece, 12–17 June 2005; The American Society of Mechanical Engineers Digital Collection (ASMEDC): New York, NY, USA, 2005; pp. 289–295. [Google Scholar] [CrossRef]
- de Lima, B.S.L.P.; Jacob, B.P.; Ebecken, N.F.F. A hybrid fuzzy/genetic algorithm for the design of offshore oil production risers. Int. J. Numer. Meth. Eng. 2005, 64, 1459–1482. [Google Scholar] [CrossRef]
- Tanaka, R.L.; de Martins, C.A. A Genetic Algorithm Approach to Steel Riser Optimization. In Proceedings of the 25th International Conference on Offshore Mechanics and Arctic Engineering, Hamburg, Germany, 28 May–2 June 2006; Offshore Technology; Offshore Wind Energy; Ocean Research Technology; LNG Specialty Symposium. American Society of Mechanical Engineers (ASME): New York, NY, USA, 2006; Volume 1, pp. 271–277. [Google Scholar] [CrossRef]
- Tanaka, R.L.; de Martins, C.A.; de Takafuji, F.C.M. Steel riser optimization with simulated annealing. In Proceedings of the 13th Rio Oil & Gas Expo and Conference, Rio de Janeiro, Brazil, 11–15 September 2006. [Google Scholar]
- Tanaka, R.L.; de Martins, C.A. Dynamic Optimization of Steel Risers. In Proceedings of the Sixteenth (2007) International Offshore and Polar Engineering Conference, Lisbon, Portugal, 1–6 July 2007; The International Society of Offshore and Polar Engineers (ISOPE): Cupertino, CA, USA, 2007. [Google Scholar]
- Vieira, I.N.; de Lima, B.S.L.P.; Jacob, B.P. Optimization of Steel Catenary Risers for Offshore Oil Production Using Artificial Immune System. In Artificial Immune Systems; Bentley, P.J., Lee, D., Jung, S., Eds.; Springer: Berlin/Heidelberg, Germany, 2008; pp. 254–265. [Google Scholar]
- Yang, H.; Jiang, R.; Li, H. Optimization Design of Deepwater Steel Catenary Risers Using Genetic Algorithm. Computational Structural Engineering; Springer: Dordrecht, The Netherlands, 2009. [Google Scholar] [CrossRef]
- Tanaka, R.L. Otimização da configuração de risers rígidos (Optimising the Configuration of Rigid Risers). Doutorado em Engenharia de Controle e Automação Mecânica, Universidade de São Paulo, São Paulo, Brazil, 2009. [CrossRef]
- Andrade, E.Q.d.; Aguiar, L.L.d.; Senra, S.F.; Siqueira, E.F.N.; Torres, A.L.F.L.; Mourelle, M.M. Optimization Procedure of Steel Lazy Wave Riser Configuration for Spread Moored FPSOs in Deepwater Offshore Brazil. In Proceedings of the Offshore Technology Conference (OTC), Houston, TX, USA, 3–6 May 2010; p. OTC-20777-MS. [Google Scholar] [CrossRef]
- de Pina, A.A.; Albrecht, C.H.; de Lima, B.S.L.P.; Jacob, B.P. Tailoring the particle swarm optimization algorithm for the design of offshore oil production risers. Optim. Eng. 2011, 12, 215–235. [Google Scholar] [CrossRef]
- de Pina, A.A.; de Lima, B.S.L.P.; Albrecht, C.H.; Jacob, B.P. Parameter Selection and Convergence Analysis of the PSO Algorithm Applied to the Design of Risers. In Proceedings of the EngOpt 2008-International Conference on Engineering Optimization, Rio de Janeiro, Brazil, 1–5 June 2008. [Google Scholar]
- Zheng, W.; Yang, H. Dynamic Optimization of Steel Catenary Risers Based on Reliability Using Metamodel; American Society of Mechanical Engineers Digital Collection, New York, NY, USA, 2010; pp. 223–228. [CrossRef]
- Yang, H.Z.; Zheng, W. Metamodel approach for reliability-based design optimization of a steel catenary riser. J. Mar. Sci. Technol. 2011, 16, 202–213. [Google Scholar] [CrossRef]
- Tanaka, R.L.; Martins, C.d.A. Parallel Dynamic Optimization of Steel Risers. J. Offshore Mech. Arctic Eng. 2011, 133, 011302. [Google Scholar] [CrossRef]
- Arruda, M.D.S.V.; de Martins, M.A.L.; Lages, E.N. Otimização dos flutuadores de risers com catenária em configuração complexa (Optimization of complex configuration of catenary risers buoyancy modules). Semin. Ciências Exatas E Tecnol. 2012, 33, 149–164. [Google Scholar] [CrossRef][Green Version]
- de Martins, M.A.L. Otimização da Configuração de Risers Verticais Complacentes (Compliant Vertical Access Risers Optimization). Master’s Thesis, Universidade Federal de Alagoas, Maceió, Brazil, 2011. [Google Scholar]
- de Martins, M.A.L.; Lages, E.N.; Silveira, E.S.S. Compliant vertical access riser assessment: DOE analysis and dynamic response optimization. Appl. Ocean Res. 2013, 41, 28–40. [Google Scholar] [CrossRef]
- Voie, P.E.; Sødahl, N. Optimisation of Steel Catenary Risers. In Proceedings of the 32nd International Conference on Ocean, Offshore and Arctic Engineering; Volume 4A: Pipeline and Riser Technology, Nantes, France, 9–15 June 2013; American Society of Mechanical Engineers: New York, NY, USA, 2013; p. V04AT04A011. [Google Scholar] [CrossRef]
- Nariño, G.A.R.; Martha, L.F.; de Menezes, I.F.M. Otimização de Risers em Catenária com Amortecedores Hidrodinâmicos (Optimization of Catenary Risers with Hydrodynamic Dampers). In Proceedings of the XXXV Iberian Latin-American Congress on Computational Methods in Engineering, Fortaleza, CE, Brazil, 23–26 November 2014; Pontifícia Universidade Católica do Rio de Janeiro: Rio de Janeiro, Brazil, 2014. [Google Scholar] [CrossRef]
- Chen, J.; Yan, J.; Yang, Z.; Yue, Q.; Tang, M. Flexible Riser Configuration Design for Extremely Shallow Water with Surrogate-Model-Based Optimization. J. Offshore Mech. Arctic Eng. 2016, 138, 041701. [Google Scholar] [CrossRef]
- Yang, Z.; Yan, J.; Sævik, S.; Zhen, L.; Ye, N.; Chen, J.; Yue, Q. Multi-Objective Optimization Design of Flexible Risers Based on Bi-Scale Response Surface Models. In Proceedings of the 37th International Conference on Ocean, Offshore and Arctic Engineering (OMAE); Volume 5: Pipelines, Risers, and Subsea Systems, Madrid, Spain, 17–22 June 2018; American Society of Mechanical Engineers: New York, NY, USA, 2018; p. V005T04A018. [Google Scholar] [CrossRef]
- Diakonova, E.; Bonnet, G.; Brouard, Y. SLWR Innovative Design Methodology Supporting Concept Engineering Through to Project Cost Optimisation. In Proceedings of the Offshore Technology Conference, Houston, TX, USA, 6–9 May 2019; p. D021S018R004. [Google Scholar] [CrossRef]
- Cardoso, P.H.S.; Casaprima, N.A.G.; Senhora, F.V.; Menezes, I.F.M. Optimization of catenary risers with hydrodynamic dampers. Ocean Eng. 2019, 184, 134–142. [Google Scholar] [CrossRef]
- Ai, S.; Xu, Y.; Kang, Z.; Yan, F. Performance comparison of stress-objective and fatigue-objective optimisation for steel lazy wave risers. Ships Offshore Struct. 2019, 14, 534–544. [Google Scholar] [CrossRef]
- Bhowmik, S.; Noiray, G.; Naik, H. Riser Design Automation with Machine Learning. In Proceedings of the Abu Dhabi International Petroleum Exhibition & Conference, Abu Dhabi, United Arab Emirates, 11–14 November 2019; SPE Society of Petroleum Engineers: Richardson, TX, USA, 2019; p. D041S106R003. [Google Scholar] [CrossRef]
- Bhowmik, S.; Naik, H.; Noiray, G. Lazy Wave Steel Catenary Riser Design Optimisation in Digital Field Twin. In Proceedings of the Offshore Technology Conference Asia, Kuala Lumpur, Malaysia, 2–6 November 2020; OnePetro: Richardson, TX, USA, 2020; p. D012S001R074. [Google Scholar] [CrossRef]
- Lal, M.; Sebastian, A.; Wang, F.; Lu, X. Steel Lazy Wave Riser Optimization Using Artificial Intelligence Tool. In Proceedings of the 39th International Conference on Ocean, Offshore and Arctic Engineering, Virtual, Online, 3–7 August 2020; American Society of Mechanical Engineers (ASME): New York, NY, USA, 2020; Volume 4. [Google Scholar] [CrossRef]
- Ogbeifun, A.M.; Oterkus, S.; Race, J.; Naik, H.; Moorthy, D.; Bhowmik, S.; Ingram, J. A tabular optimisation technique for steel lazy wave riser. IOP Conf. Ser. Mater. Sci. Eng. 2021, 1052, 012022. [Google Scholar] [CrossRef]
- Lal, M.; Sebastian, A.; Rana, Y. Steel Lazy Wave Riser Optimization Using Artificial Neural Networks and Genetic Algorithm. In Proceedings of the International Conference on Offshore Mechanics and Arctic Engineering, Volume 4: Pipelines, Risers, and Subsea Systems, Virtual, Online, 21–30 June 2021; American Society of Mechanical Engineers: New York, NY, USA, 2021; p. V004T04A034. [Google Scholar] [CrossRef]
- Elsas, J.H.; Casaprima, N.A.G.; Cardoso, P.H.S.; Menezes, I.F.M. Bayesian optimization of riser configurations. Ocean Eng. 2021, 236, 109402. [Google Scholar] [CrossRef]
- Abam, J.T.; Pu, Y.; Hu, Z. Cost-Effective Optimal Solutions for Steel Catenary Riser Using Artificial Neural Network. In Volume 3: Materials Technology; Pipelines, Risers, and Subsea Systems; American Society of Mechanical Engineers: Hamburg, Germany, 2022; p. V003T04A031. [Google Scholar] [CrossRef]
- Abam, J.T.; Pu, Y.; Hu, Z. Weight Optimisation of Steel Catenary Riser Using Genetic Algorithm and Finite Element Analysis; American Society of Mechanical Engineers Digital Collection: Hamburg, Germany, 2022; p. 9. [Google Scholar] [CrossRef]
- Lal, M.; Yenduri, A.; Sebastian, A. Steel Lazy Wave Riser Optimization Using Particle Swarm Optimization Algorithm. In Volume 3: Materials Technology; Pipelines, Risers, and Subsea Systems; American Society of Mechanical Engineers: Melbourne, Australia, 2023; p. V003T04A048. [Google Scholar] [CrossRef]
- Jakobsen, E.A. Performance Efficiency and Reliability Analysis of Offshore Wind Power Plants: Case Study of Utsira Nord. Master’s Thesis, NTNU, Trondheim, Norway, 2023. [Google Scholar]
- Petrie, H.E.; Eide, C.H.; Haflidason, H.; Watton, T. A conceptual geological model for offshore wind sites in former ice stream settings: The Utsira Nord site, North Sea. JGS 2022, 179, jgs2021-163. [Google Scholar] [CrossRef]
- Cheynet, E.; Li, L.; Jiang, Z. Metocean Conditions at Two Norwegian Sites for Development of Offshore Wind Farms. Renew. Energy 2024, 224, 120184. [Google Scholar] [CrossRef]
- Reistad, M.; Magnusson, A.K.; Haver, S.; Gudmestad, O.T.; Kvamme, D. How severe wave conditions are possible on the Norwegian Continental Shelf? Mar. Struct. 2005, 18, 428–450. [Google Scholar] [CrossRef]
- Liang, G.; Jiang, Z.; Merz, K. Dynamic analysis of a dual spar floating offshore wind farm with shared moorings in extreme environmental conditions. Mar. Struct. 2023, 90, 103441. [Google Scholar] [CrossRef]
- Asplin, L.; Albretsen, J.; Johnsen, I.A.; Sandvik, A.D. The hydrodynamic foundation for salmon lice dispersion modeling along the Norwegian coast. Ocean Dyn. 2020, 70, 1151–1167. [Google Scholar] [CrossRef]
- Jackson, C.R.; Alpers, W. North Sea and Skagerrak Strait; Office of Naval Research: Alexandria, VA, USA, 2004. [Google Scholar]
- Petrie, H.E. An Integrated Geological Characterization of Marine Ground Conditions in the North Sea. Ph.D. Thesis, The University of Bergen, Bergen, Norway, 2023. [Google Scholar]
- Hansen, T.D. Utsira Nord Floating Wind Farm–Optimalisation of Marine Operations Related to Inter-Array Cable Installation. Master’s Thesis, University of Stavanger, Stavanger, Norway, 2023. [Google Scholar]
- von Schlanbusch, F. Driving Factors for Levelized Cost of Energy in Floating Wind Farms. Master’s Thesis, The University of Bergen, Bergen, Norway, 2022. [Google Scholar]
- Jodar Hernandez, P. Optimization of Marine Operations for the Assembly and Installation of a New Floating Wind Concept. Master’s Thesis, University of Stavanger, Stavanger, Norway, 2023. [Google Scholar]
- Høines, I. Modelling Analysis of Maintenance Logistics Optimization for a Floating Wind Park: A Case Study for Utsira Nord. Master’s Thesis, University of Stavanger, Stavanger, Norway, 2022. [Google Scholar]
- Austreim, A.H. Hvilke drift og vedlikeholds oppgaver må gjennomføres under vann på den flytende vindparken Utsira Nord, og hva vil være kostnaden? (Which Operation and Maintenance Tasks Must Be Carried Out Underwater at the Utsira Nord Floating Wind Farm, and What Will the Cost Be?). Master’s Thesis, University of Stavanger, Stavanger, Norway, 2023. [Google Scholar]
- Olsson, E.S. Potential Conflicts in Offshore Wind Development–a Qualitative Study of Utsira Nord; Norwegian University of Life Sciences, Aas, Norway, 2021.
- Wang, W. Significance of Offshore Wind Farm Sound on Marine Populations. Master’s Thesis, NTNU, Trondheim, Norway, 2019. [Google Scholar]
- Tjøsvoll, S.E.G. What Socioeconomic Dynamics Will Offshore Wind Affect? A Regional Case Study of Utsira North. Master’s Thesis, University of Stavanger, Stavanger, Norway, 2022. [Google Scholar]
- Anda, L.M. Communication and Stakeholder Management in Renewable Energy Development; Case Study Utsira Nord Floating Wind Offshore Energy Development. Master’s Thesis, University of Stavanger, Stavanger, Norway, 2022. [Google Scholar]
- Oliveira, R.V. Whispers in the Wind: Ethical dimensions of social conflict in offshore wind. J. Phys. Conf. Ser. 2023, 2626, 012070. [Google Scholar] [CrossRef]
- Flermoen, P. Motvind eller medvind for norske havvindutbygginger (Headwind or Downwind for Norwegian Offshore Wind Developments). Master’s Thesis, NTNU, Trondheim, Norway, 2023. (In Norwegian). [Google Scholar]
Disclaimer/Publisher’s Note: The statements, opinions and data contained in all publications are solely those of the individual author(s) and contributor(s) and not of MDPI and/or the editor(s). MDPI and/or the editor(s) disclaim responsibility for any injury to people or property resulting from any ideas, methods, instructions or products referred to in the content. |
© 2025 by the authors. Licensee MDPI, Basel, Switzerland. This article is an open access article distributed under the terms and conditions of the Creative Commons Attribution (CC BY) license (https://creativecommons.org/licenses/by/4.0/).