Collaborative Optimization of Shore Power and Berth Allocation Based on Economic, Environmental, and Operational Efficiency


Abstract

1. Introduction
- (1)
- High Construction and Maintenance Costs: The high cost of building and maintaining shore power systems remains a major obstacle to their widespread adoption. According to the 2022 China Port Shore Power Technology Development Report, the average construction cost per berth is approximately 500,000 RMB. Additionally, the electricity cost for ships using shore power is around 0.95 RMB/kWh—significantly higher than the 0.65 RMB/kWh cost of traditional fuel-based power generation. These high costs reduce port operators’ willingness to invest in shore power infrastructure and further discourage ship operators from adopting the system.
- (2)
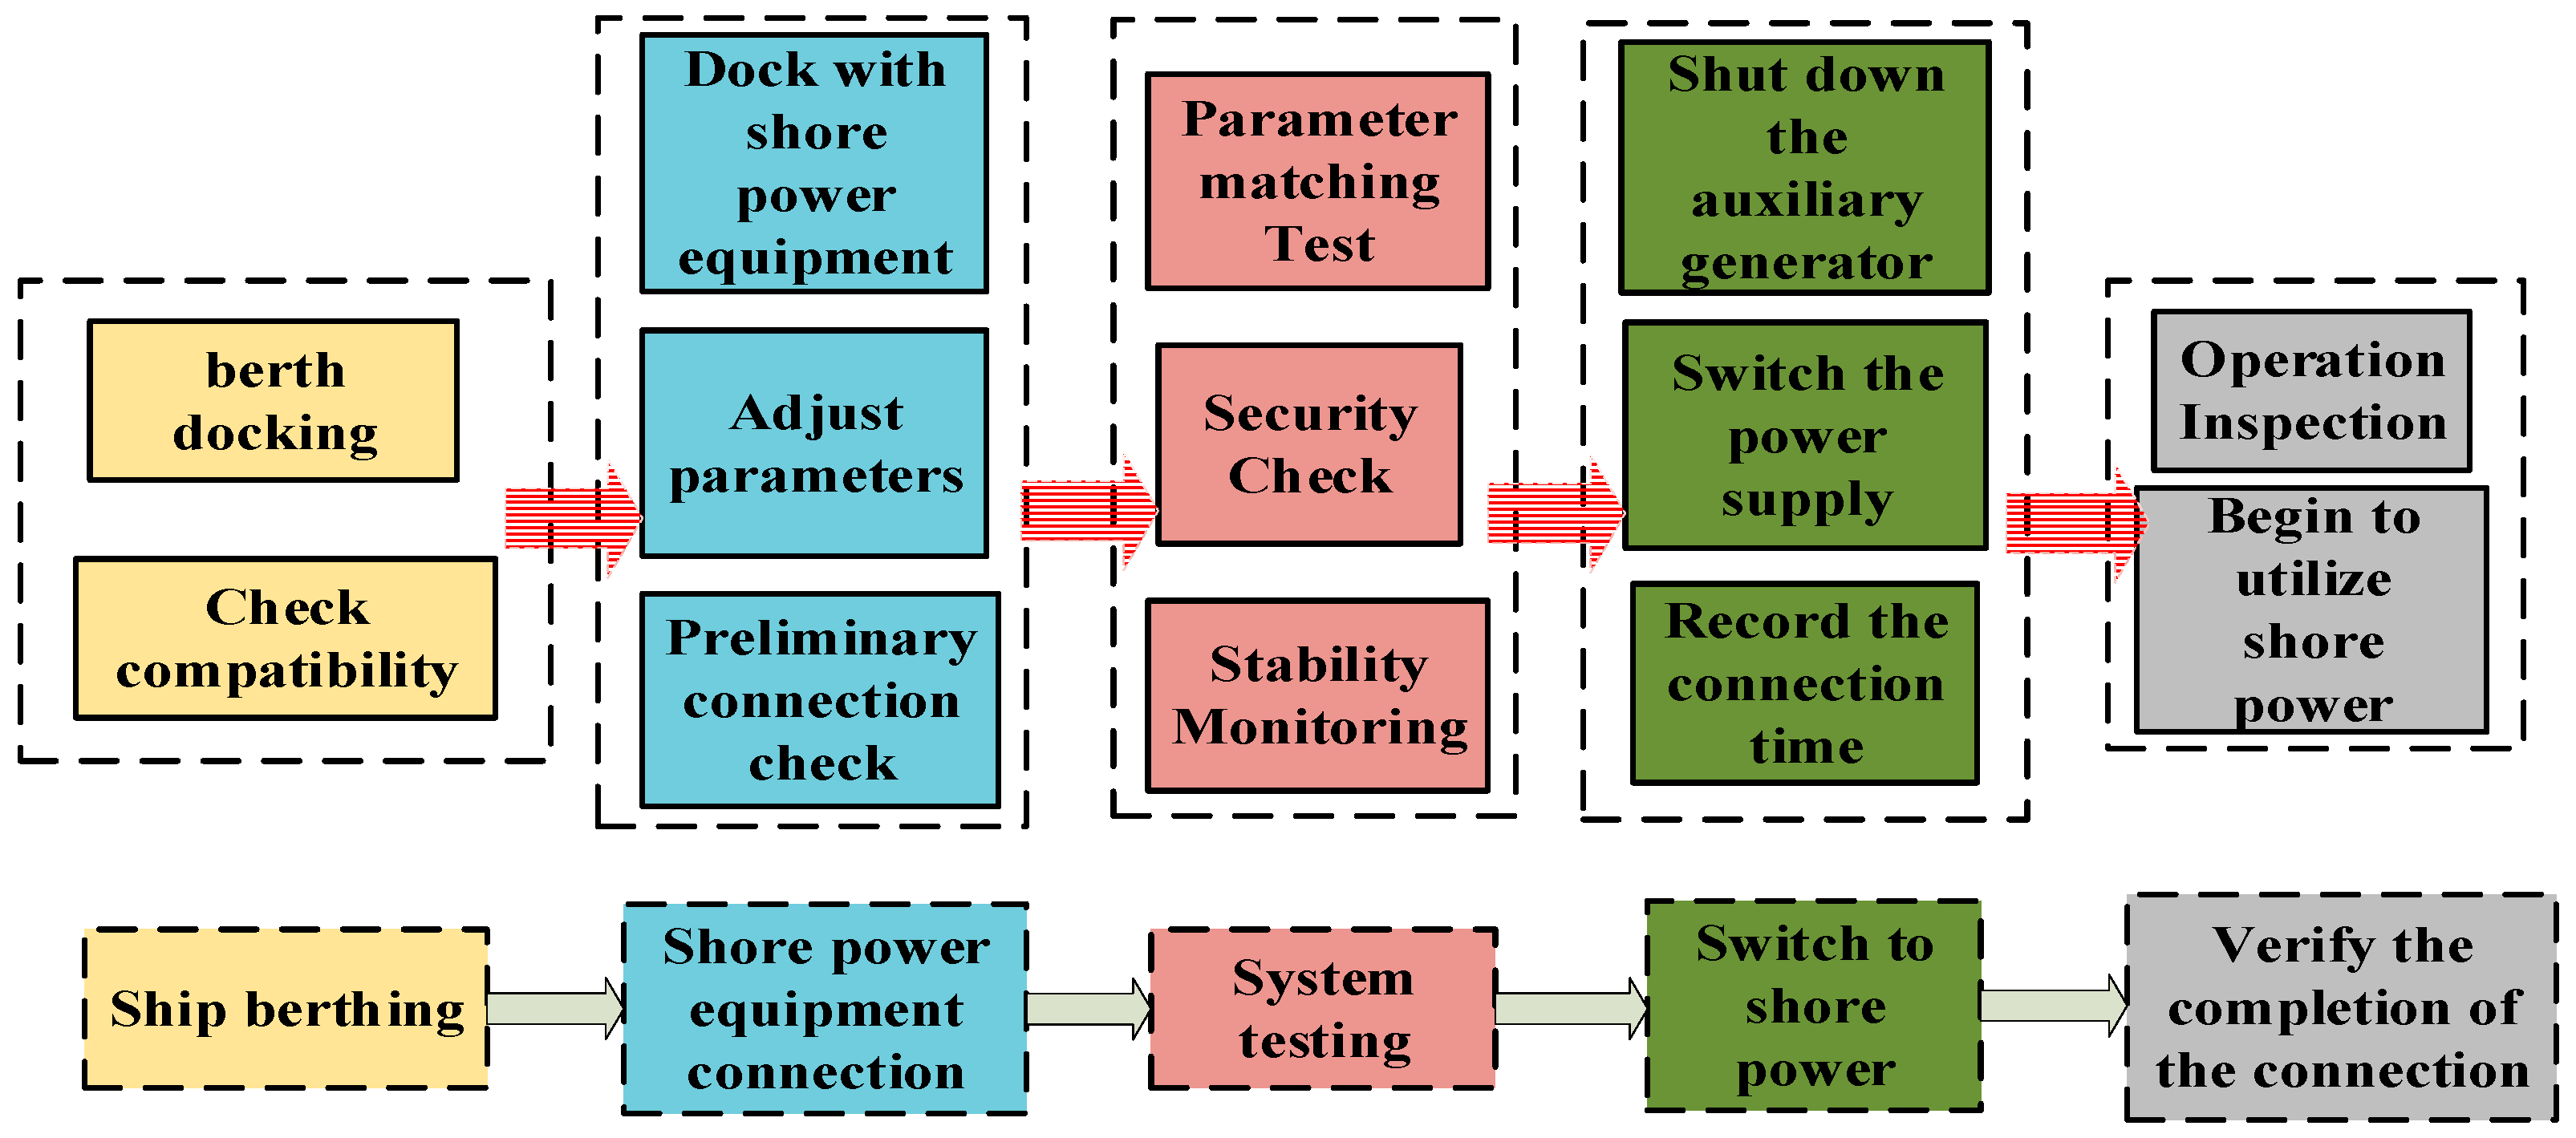
- Complex Connection Procedures and High Time Costs: Connecting to shore power requires intricate equipment interfaces, electrical parameter synchronization, and rigorous safety testing (as illustrated in Figure 1), all of which extend vessel docking times and negatively impact overall port operational efficiency.
- (3)
- Limited Ship Compatibility: Currently, only about 40% of vessels worldwide are equipped with shore power connection capabilities. This low compatibility rate severely restricts the large-scale implementation of shore power systems. The International Chamber of Shipping (ICS) identifies high retrofit costs as the primary barrier, with installation expenses for medium-sized vessels ranging between $150,000 and $250,000.
- (4)
- Insufficient Policy Incentives: While many countries have introduced subsidies for the construction of shore power facilities, economic incentives for ship operators remain inadequate. As a result, shipowners lack sufficient motivation to utilize shore power. For instance, in 2022, the fee reductions for shore power at certain Chinese ports were limited in scope, reducing their economic attractiveness to shipping companies.
- (5)
- Lack of Coordination Between Berths and Shore Power: Ship arrival times are highly variable, and berth resource utilization directly affects the availability of shore power. The absence of an effective coordinated optimization mechanism further constrains shore power efficiency, limiting its practical benefits.
2. Materials and Methods
2.1. Mathematical Model
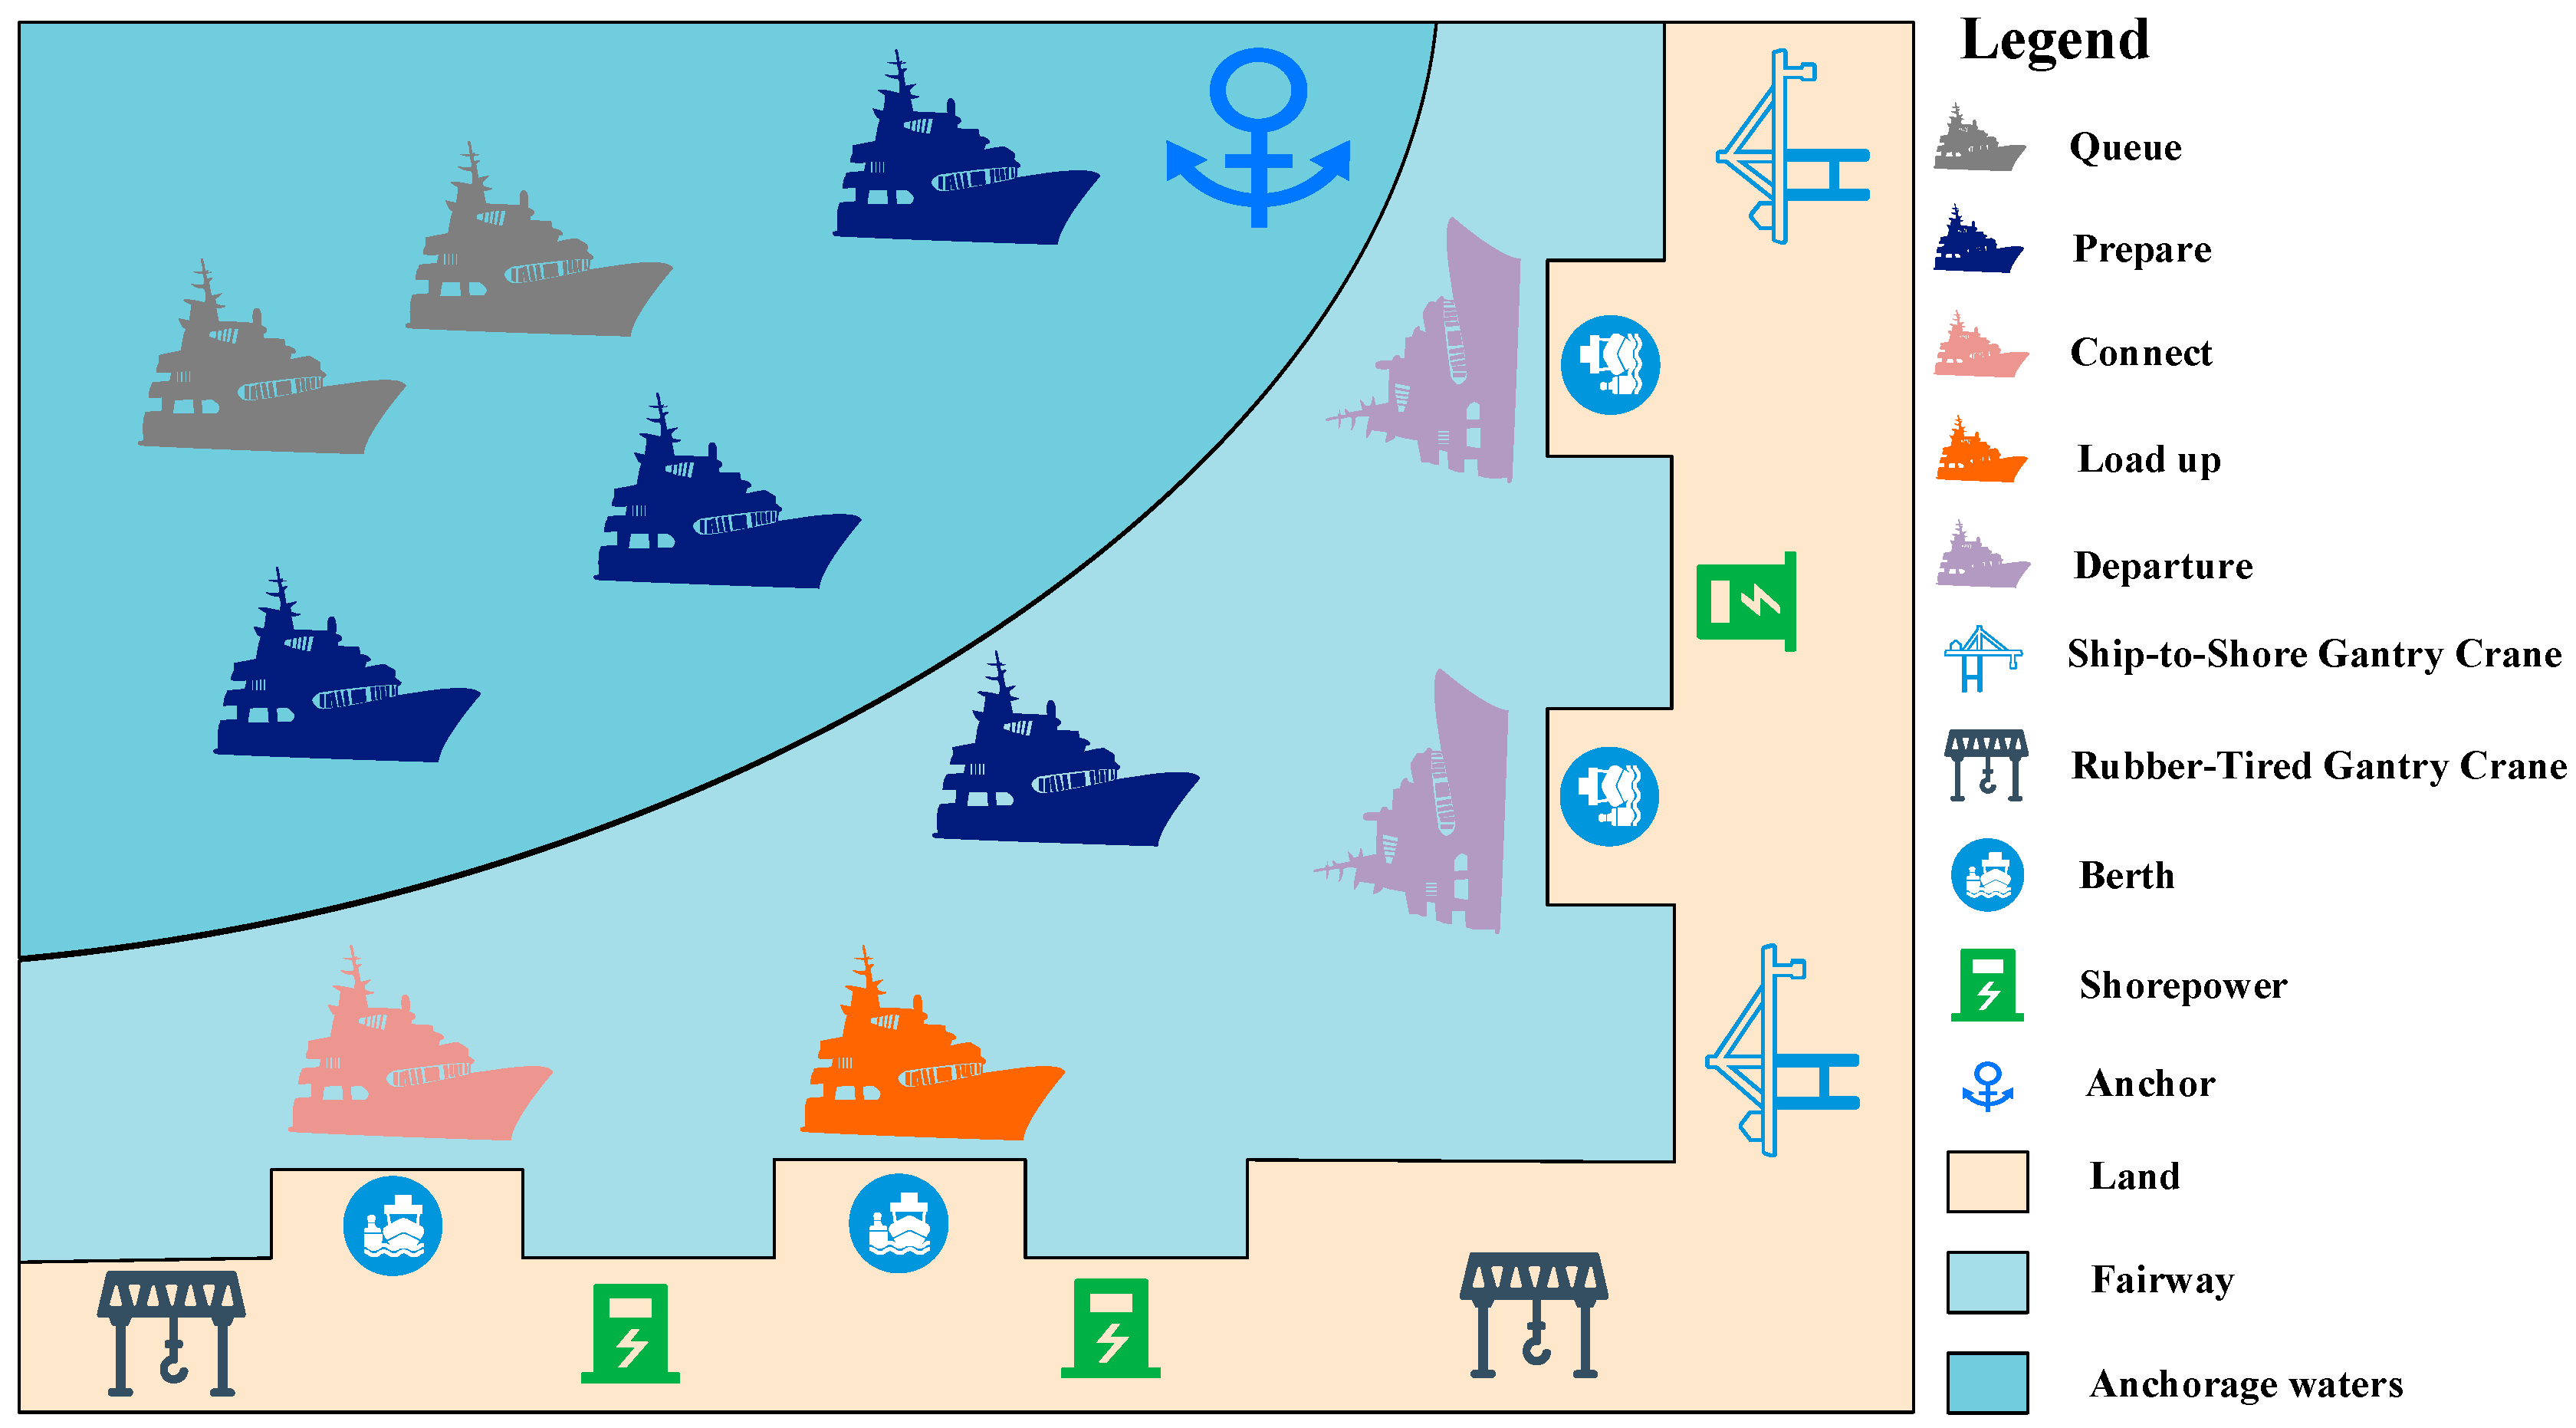
2.1.1. Problem Description
2.1.2. Model Assumptions
- (1)
- The navigation channel has sufficient width and depth to provide for navigation; hence, tidal issues do not need to be considered.
- (2)
- The arrival time of the ships is known, and the disturbances to the ships from unexpected accidents are not considered.
- (3)
- All incoming vessels have been retrofitted or equipped with shore power connection devices, and the berths can provide shore power to all ships.
2.1.3. Notation Definition
2.1.4. Objective Functions and Constraints
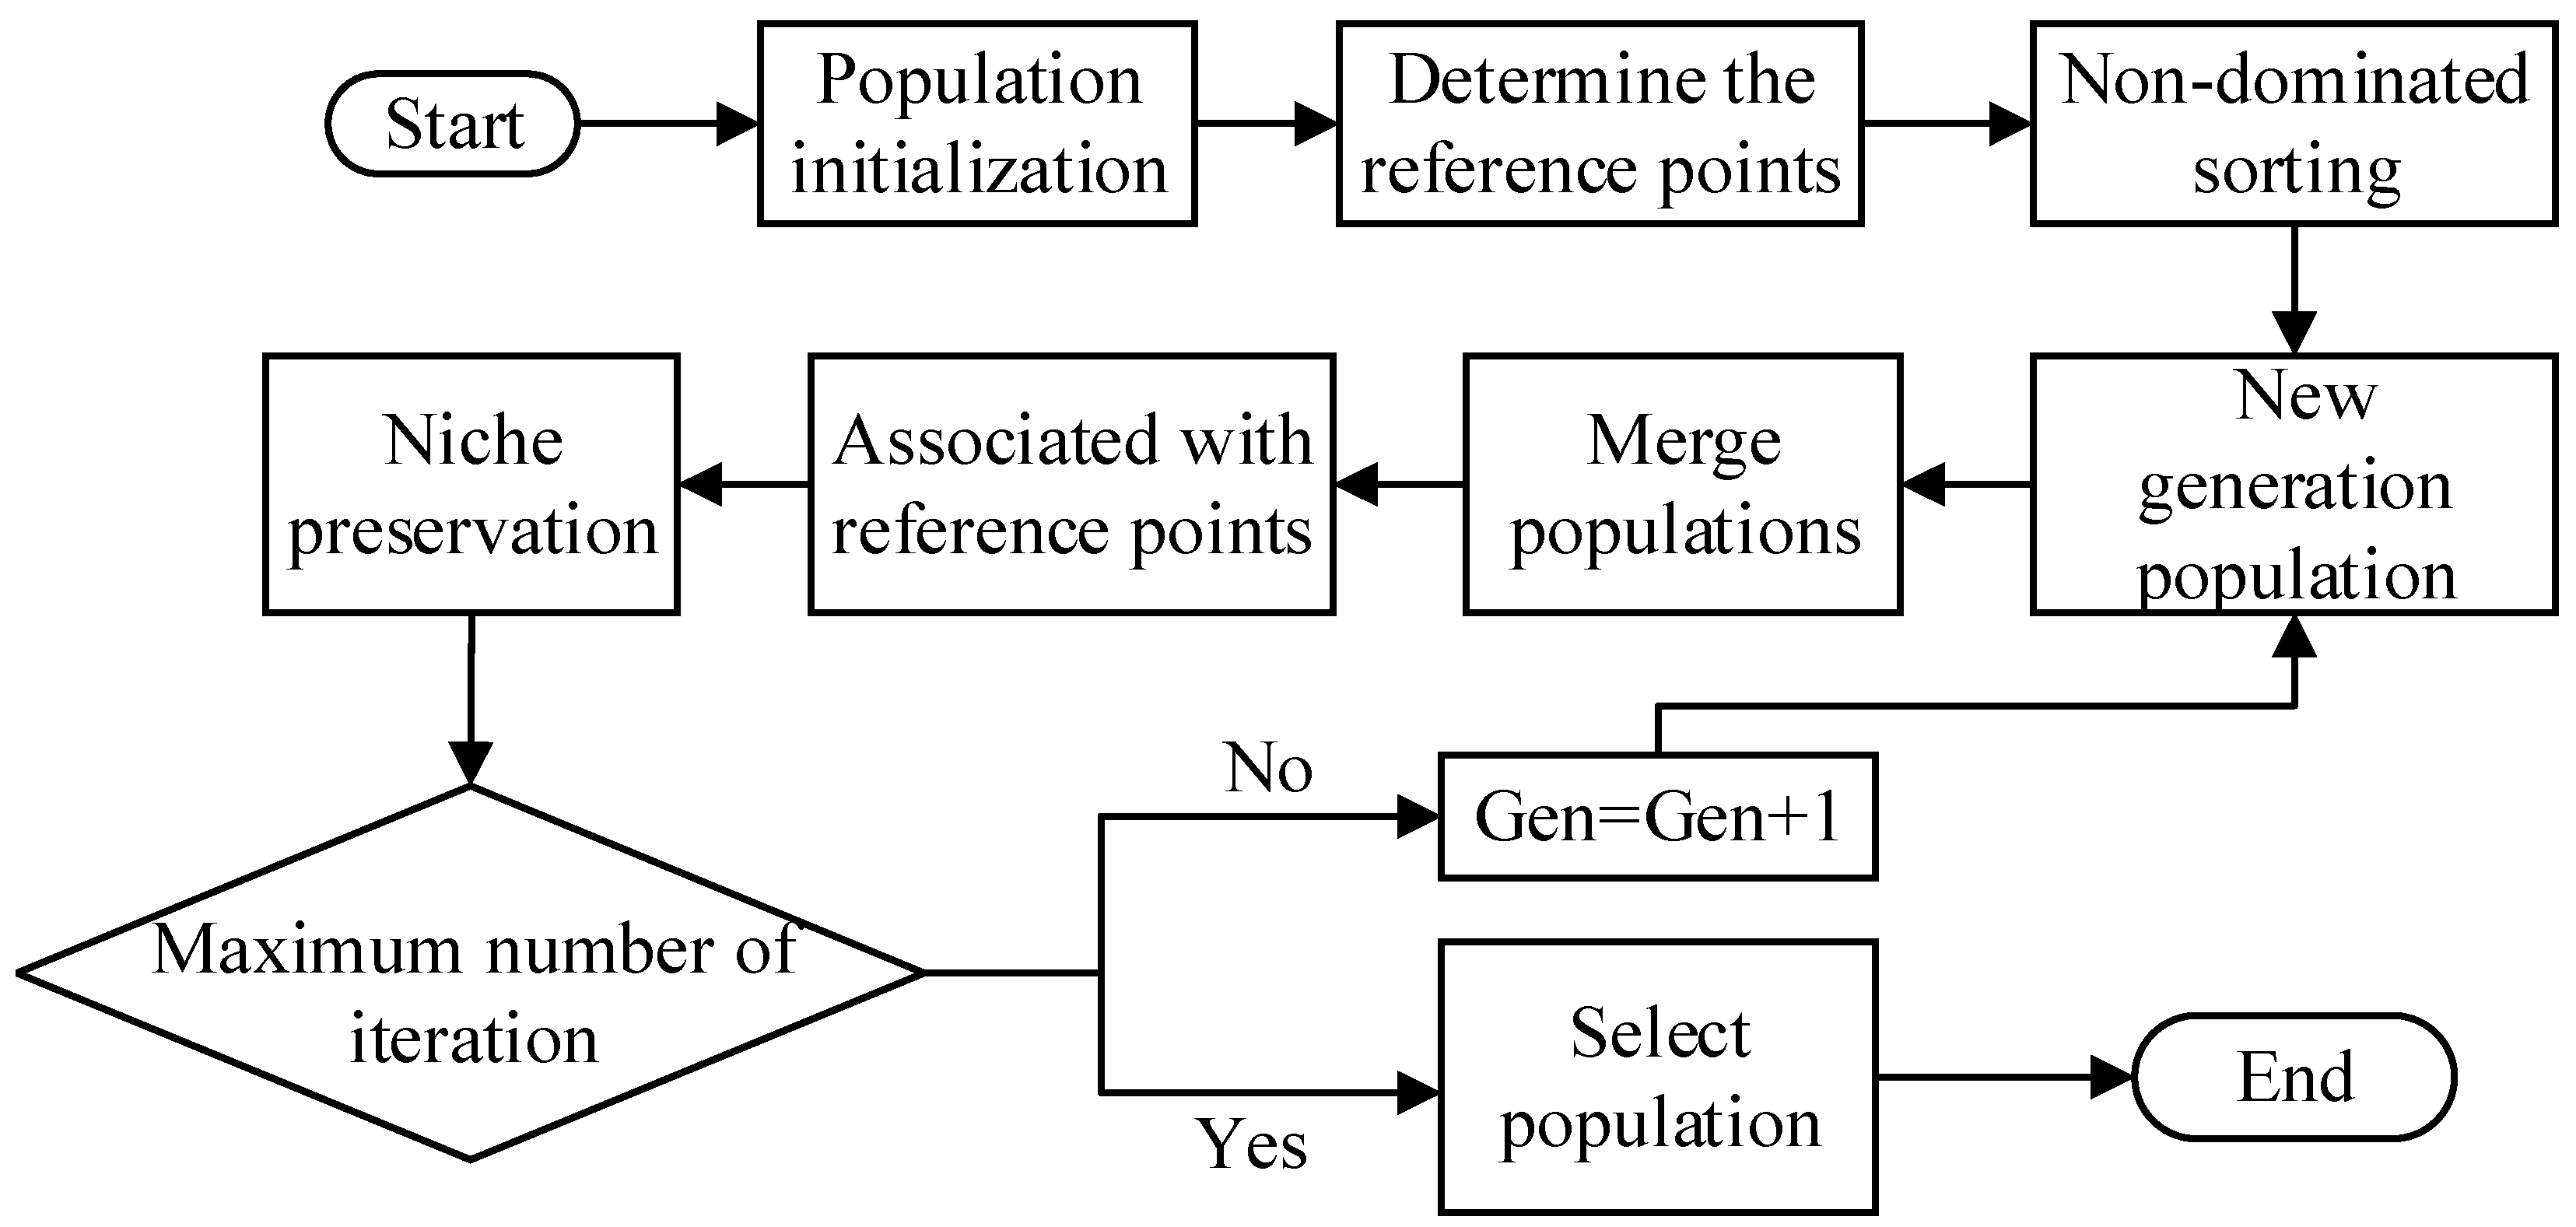
2.2. NSGA-3 Optimization Algorithm
2.2.1. Adaptive Normalization Process
2.2.2. Association Method Between Population and Reference Points
- (1)
- Drawing Reference Lines: Each reference point is connected to the origin to form reference lines . For an optimization problem with objectives, there will be reference points, resulting in reference lines.
- (2)
- Calculating the distance between individuals and reference lines: For each individual in the population, the distance to each reference line is calculated using Equation (25).
- (3)
- Determining the Reference Point for Each Individual: For an individual , if its shortest distance is to the reference line, then individual is considered to belong to the reference point, as shown in Equation (26):The distance from individual to the reference line can then be calculated using Equation (27):
- (4)
- Repeat the above steps for all individuals in the population. After completing this process, the association between the population and the reference points is established.
2.2.3. Niche Preservation Operation
- (1)
- Determine candidate reference points
- (2)
- Select individuals associated with the reference point to add to .
- (3)
- Update Relevant Parameters
- (4)
- Repeat the above steps until , completing the niche preservation operation.
2.2.4. NSGA-III Algorithm Implementation Steps
- (1)
- Determine population size and initialize the population: Set the population size and generate the initial population.
- (2)
- Establish the ideal point: Normalize the objective values for all individuals, calculate the extreme points, construct the hyperplane, and determine the reference points.
- (3)
- Perform non-dominated sorting on the population: Rank individuals based on their dominance levels.
- (4)
- Apply genetic operators: Use genetic operators to perform selection, crossover, and mutation, generating an offspring population of size .
- (5)
- Merge populations: Combine the parent and offspring populations to form a new population of size . Conduct a fast non-dominated sorting to establish dominance levels.
- (6)
- Select individuals for the next generation: Sequentially add individuals to the next generation population based on non-dominated levels in ascending order until the population size reaches . At this point, the current non-dominated level is .
- (7)
- Select individuals from level : In most cases, not all individuals from level can be included in the population . A portion of individuals from level must be selected to fill the population. First, associate individuals from levels 1 to with reference points. Then, identify the reference point with the fewest associated individuals from levels 1 to . Finally, select an individual from level associated with that reference point and add it to the population. Repeat this process until the size of the population reaches . Replace the current population with .
- (8)
- Repeat steps 4 to 8: Continue repeating steps 4 through 8 until the predetermined number of generations is reached. The final Pareto optimal solutions are obtained, and the optimized solution can be derived by decoding the solution set.
3. Results
3.1. Parameter Settings
3.1.1. Ship Parameters
3.1.2. Emission Coefficients and Energy Prices Parameters
3.1.3. Time Parameters
3.2. Results and Analysis
3.3. Number of Shore Power Connections
3.4. Shore Power Connection Speed
4. Discussion
5. Conclusions
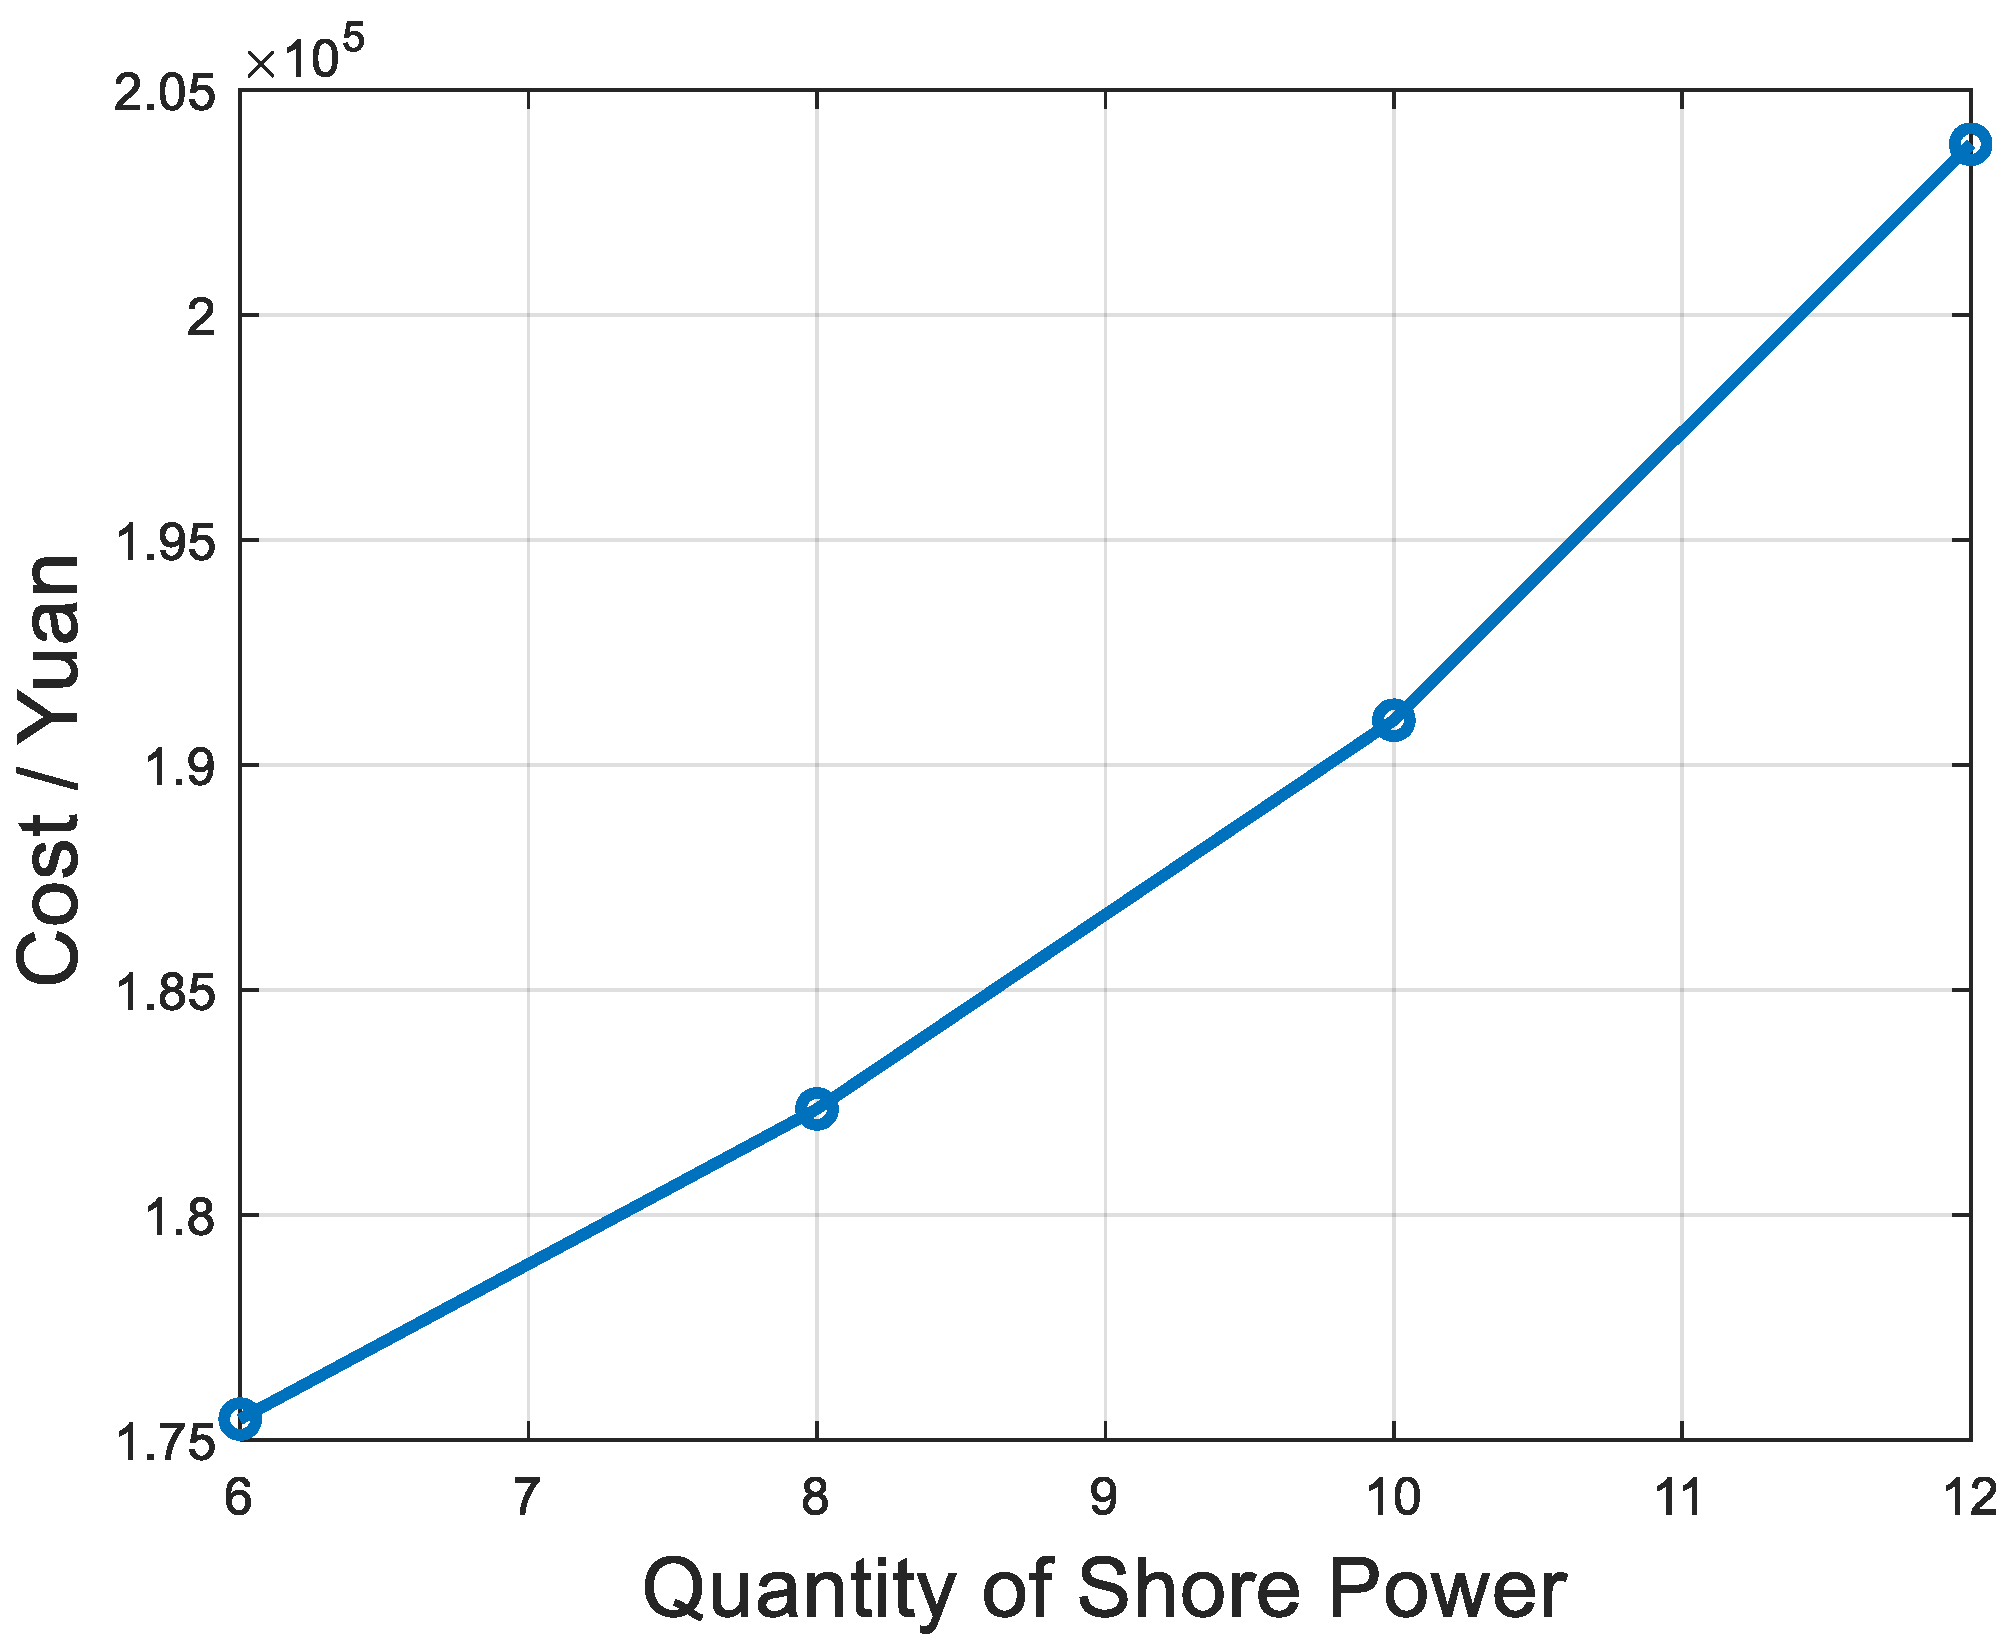
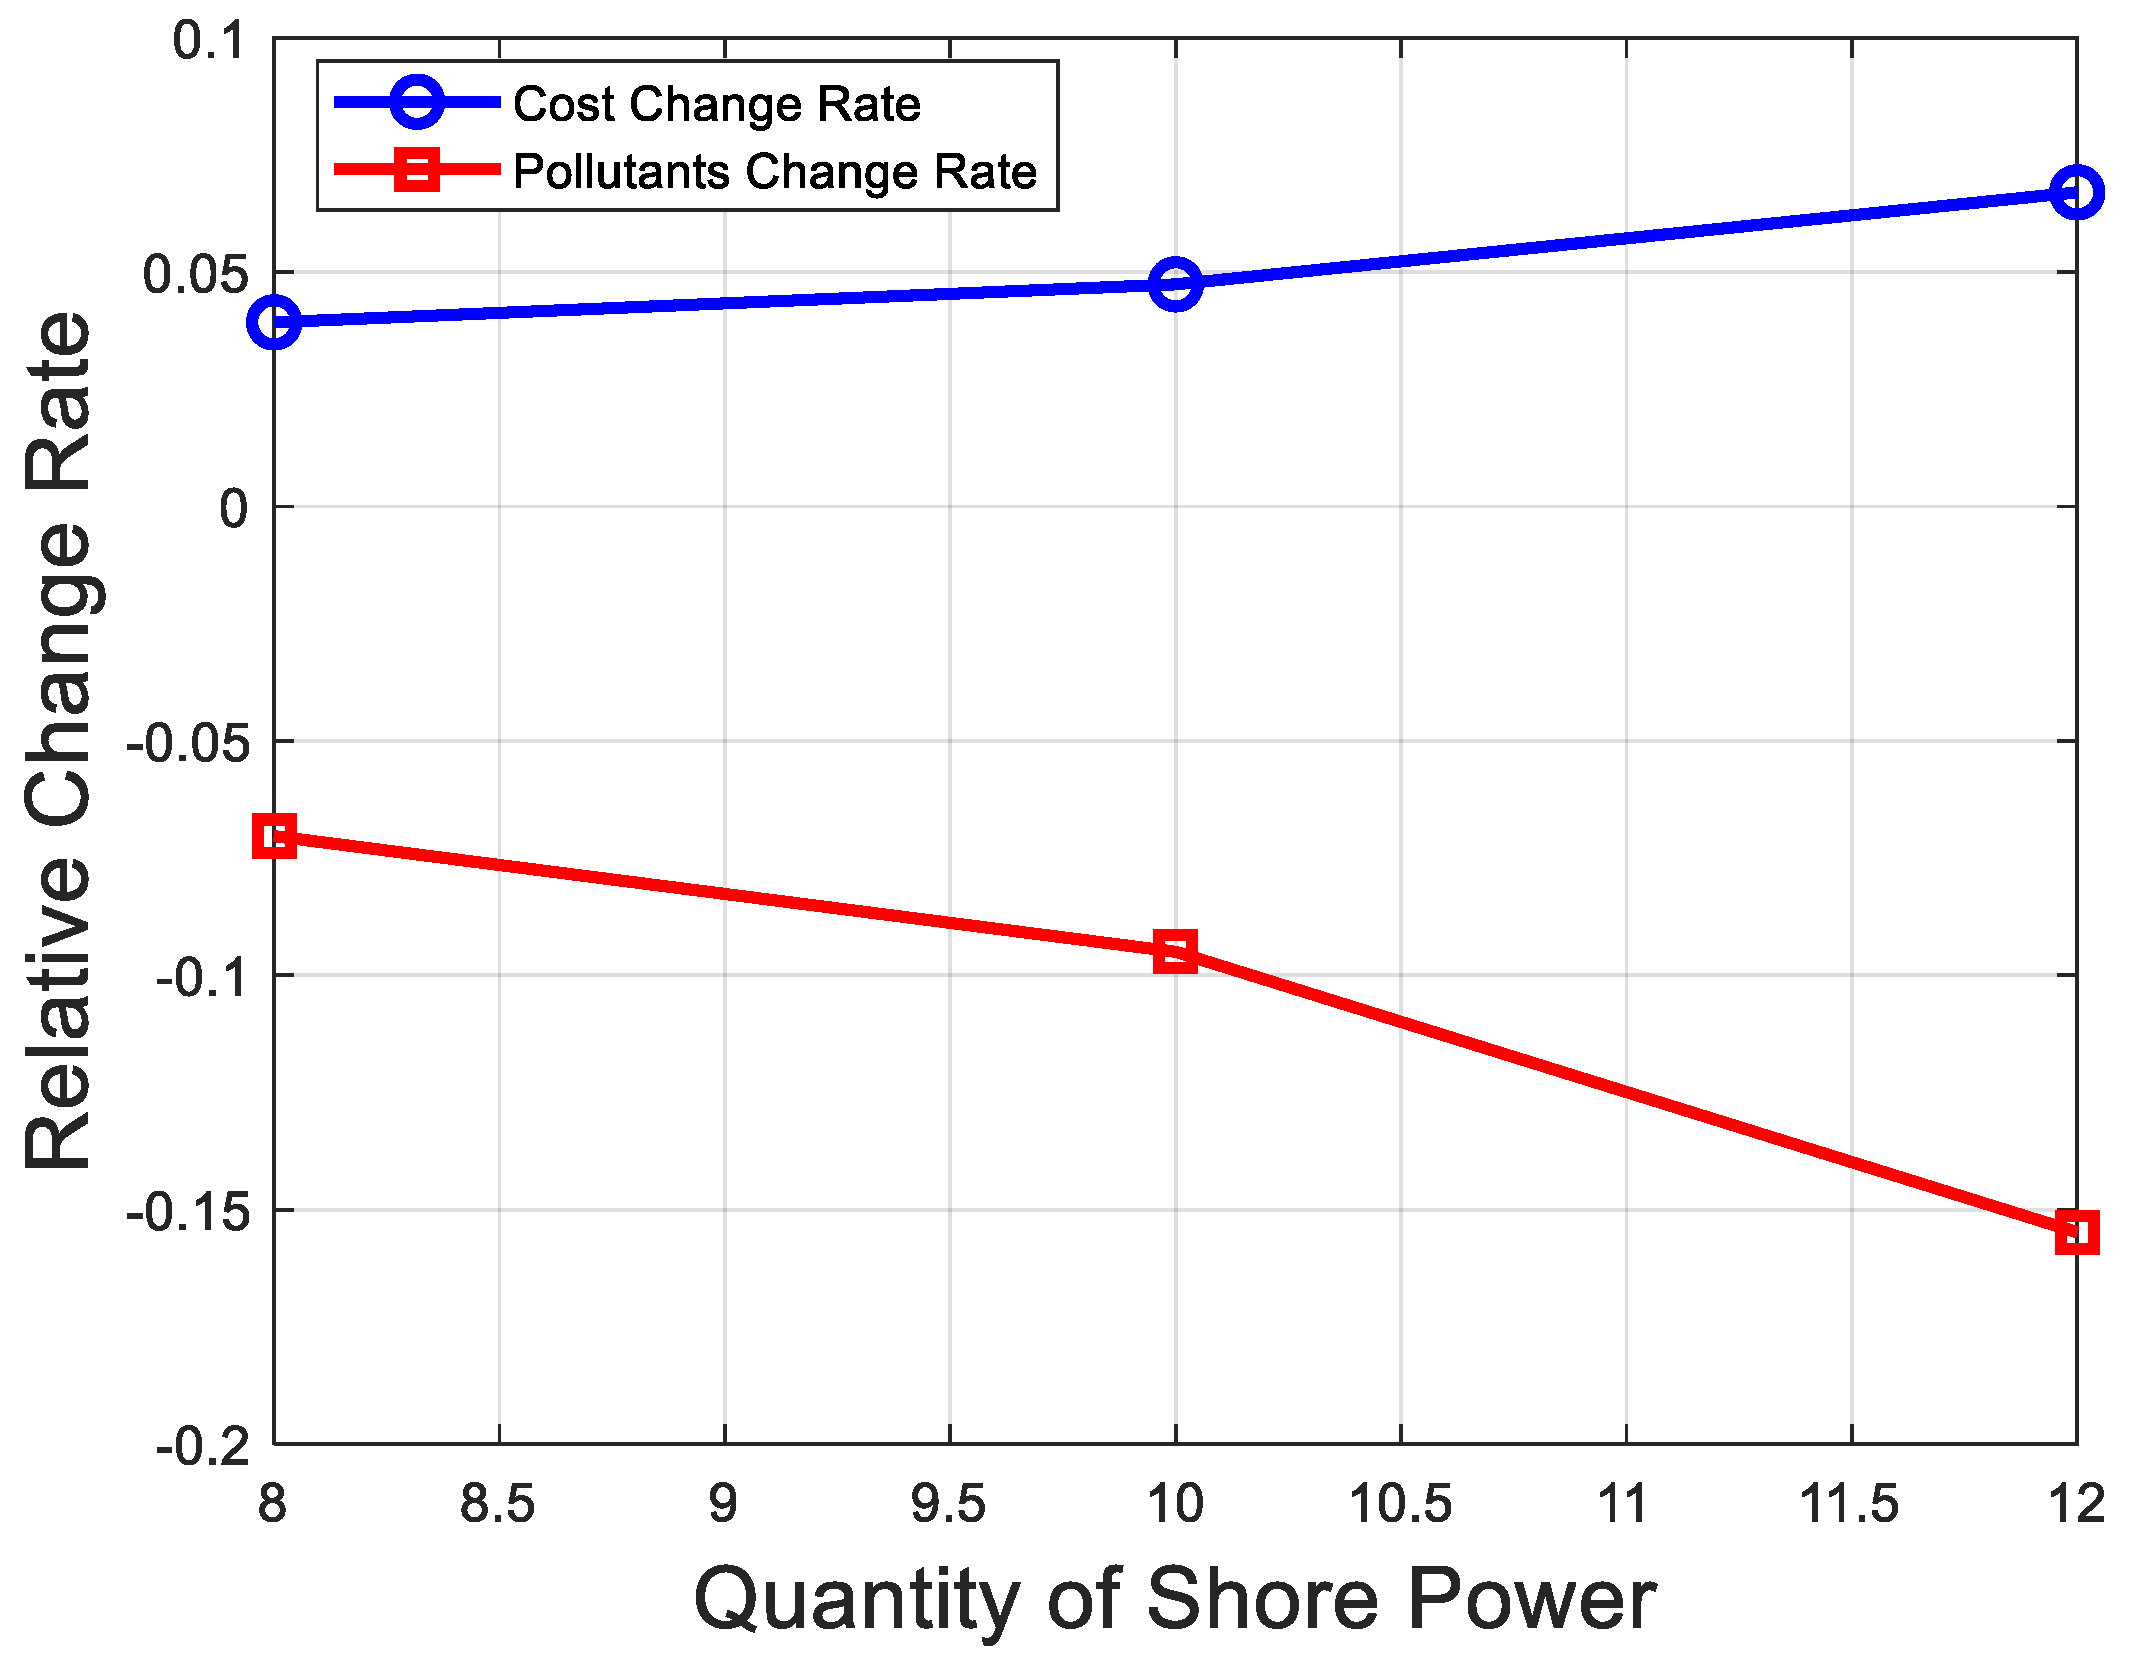
- Expanding Shore Power Capacity: While an increase in shore power connections may lead to higher operational costs, its positive impact on pollutant reduction becomes increasingly significant. Expanding shore power capacity plays a crucial role in environmental protection and pollution control, with a demonstrated 28.9% reduction in pollutant emissions when scaling from 6 to 12 connections (Table 6).
- Optimized Shore Power Allocation: Analyzing the impact of different shore power capacities on port operations reveals that when shore power capacity reaches 80% of the total number of berths (e.g., 10 connections for 12 berths), an optimal balance is achieved between cost, pollutant emissions, and vessel waiting time. This configuration reduces emissions by 15.54% compared to a 6-connection baseline while limiting cost increases to 8.88% (Table 6), serving as a practical reference for the development of green and intelligent ports.
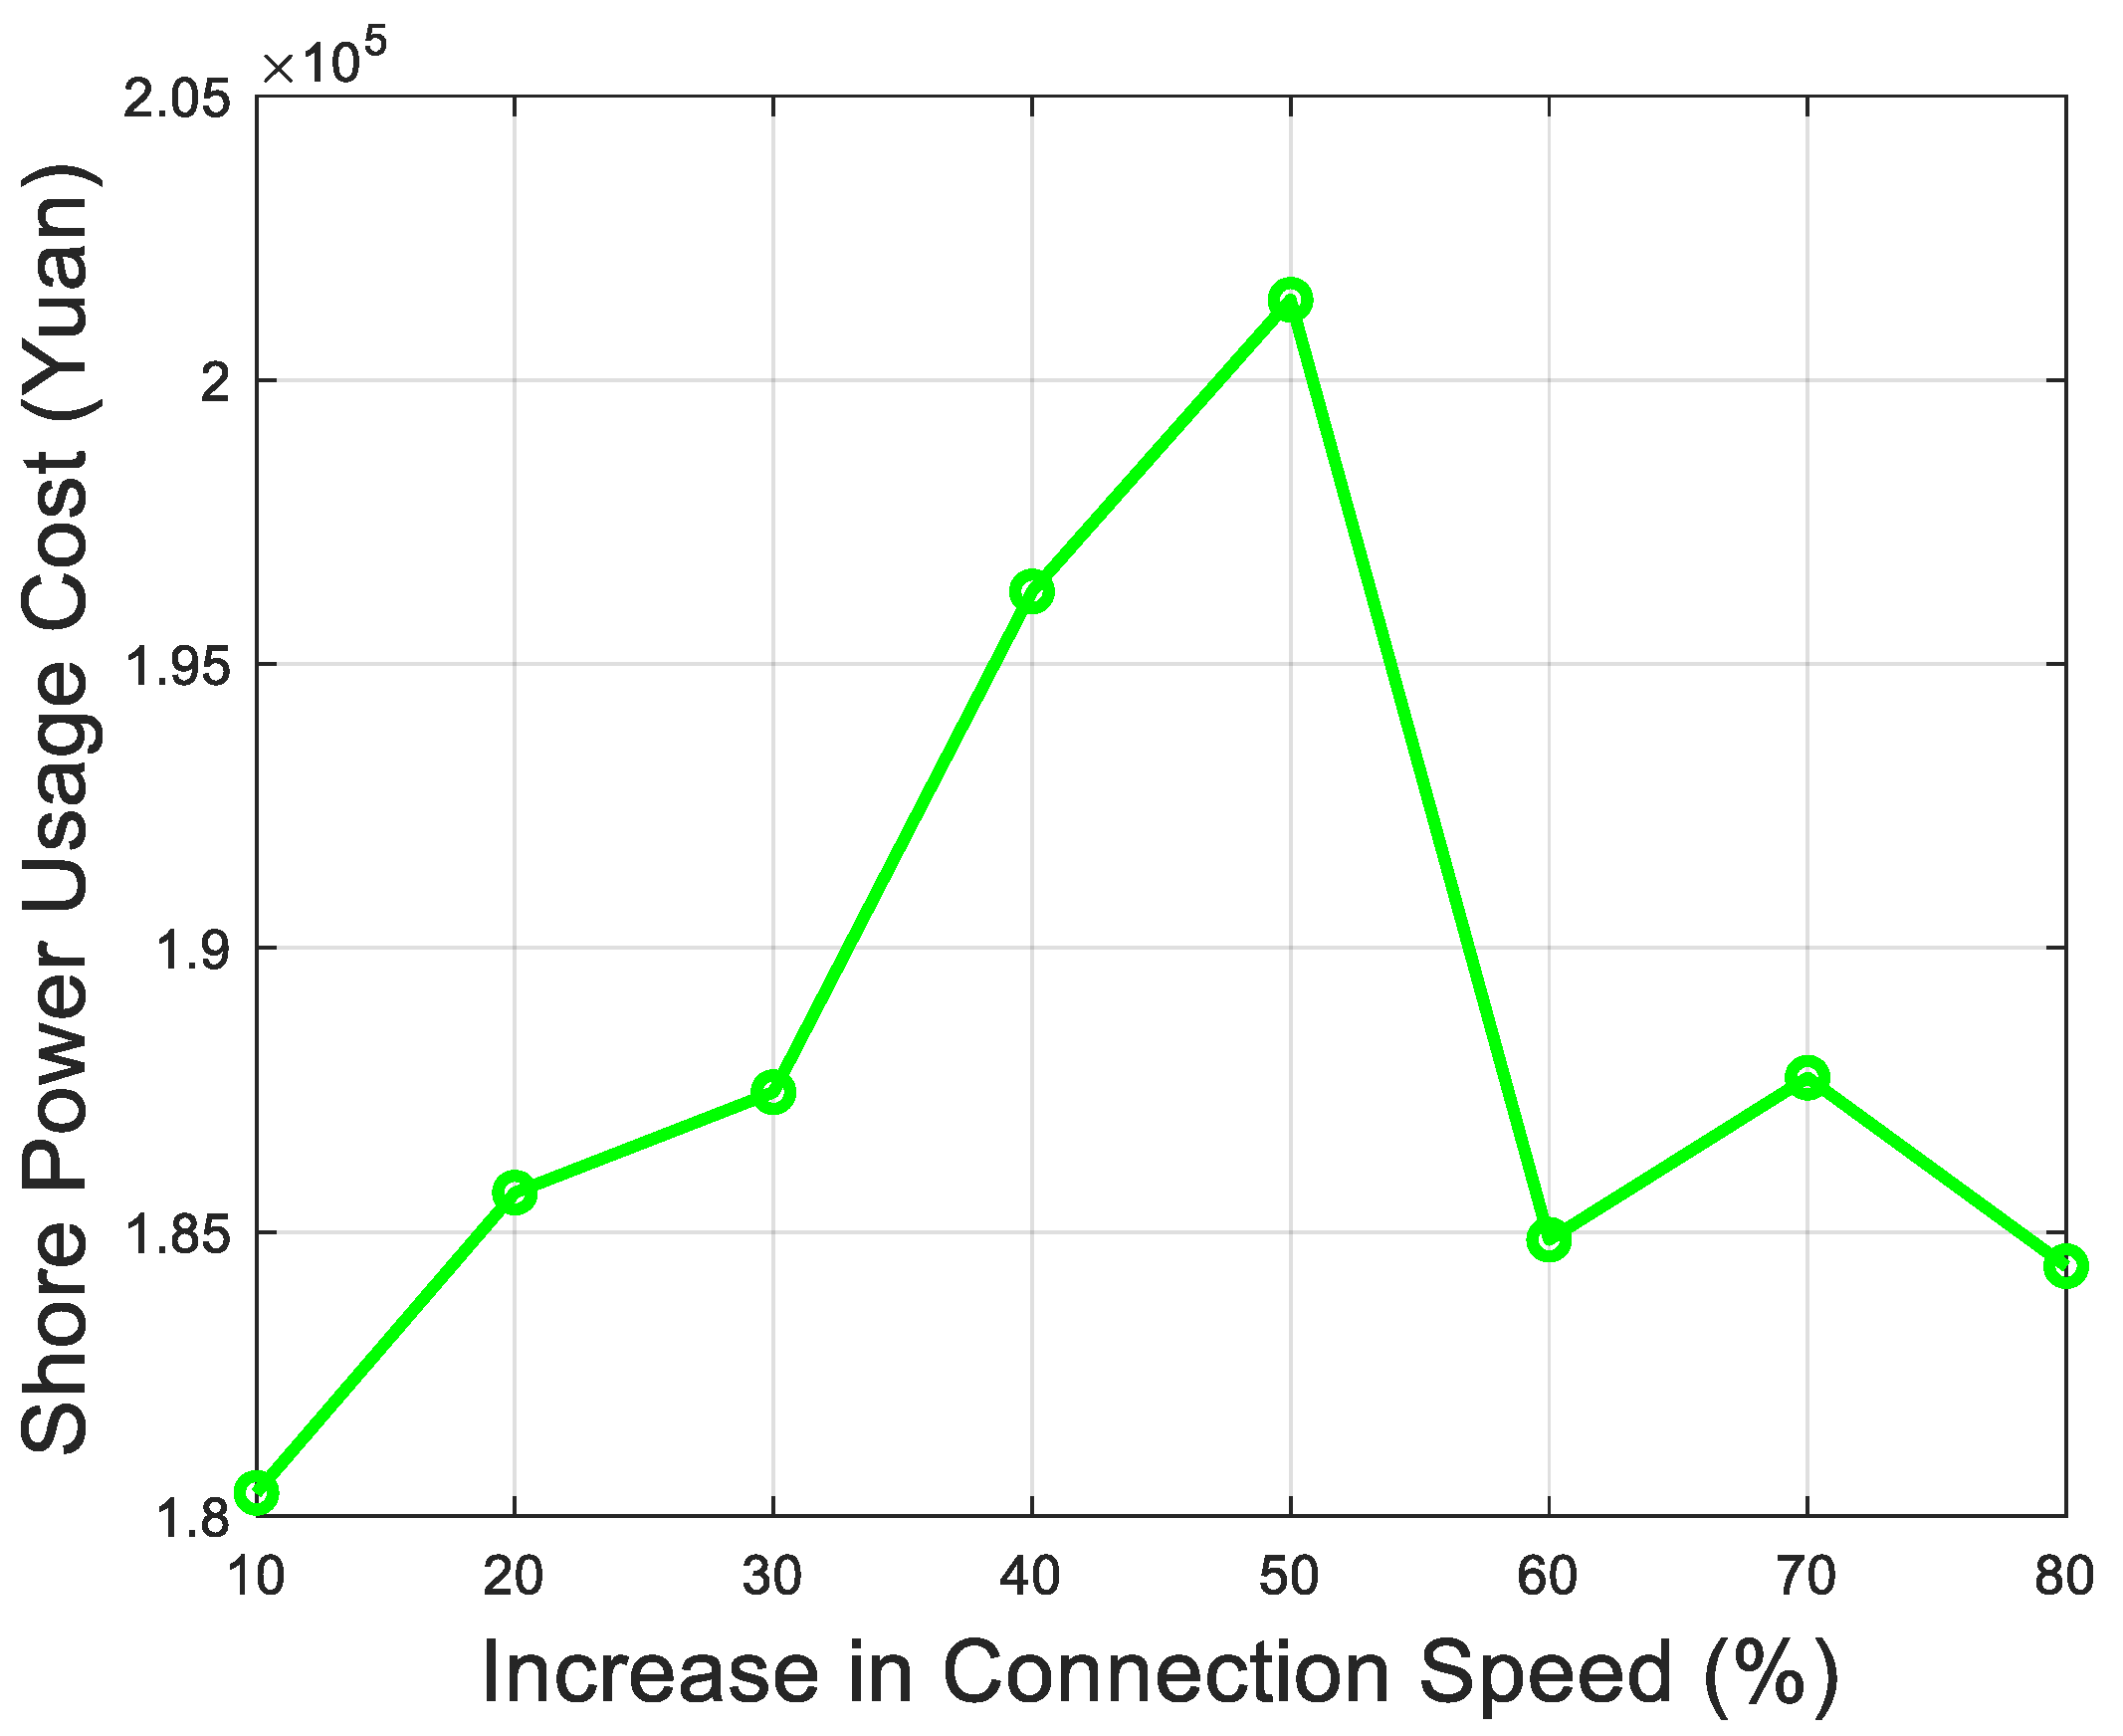
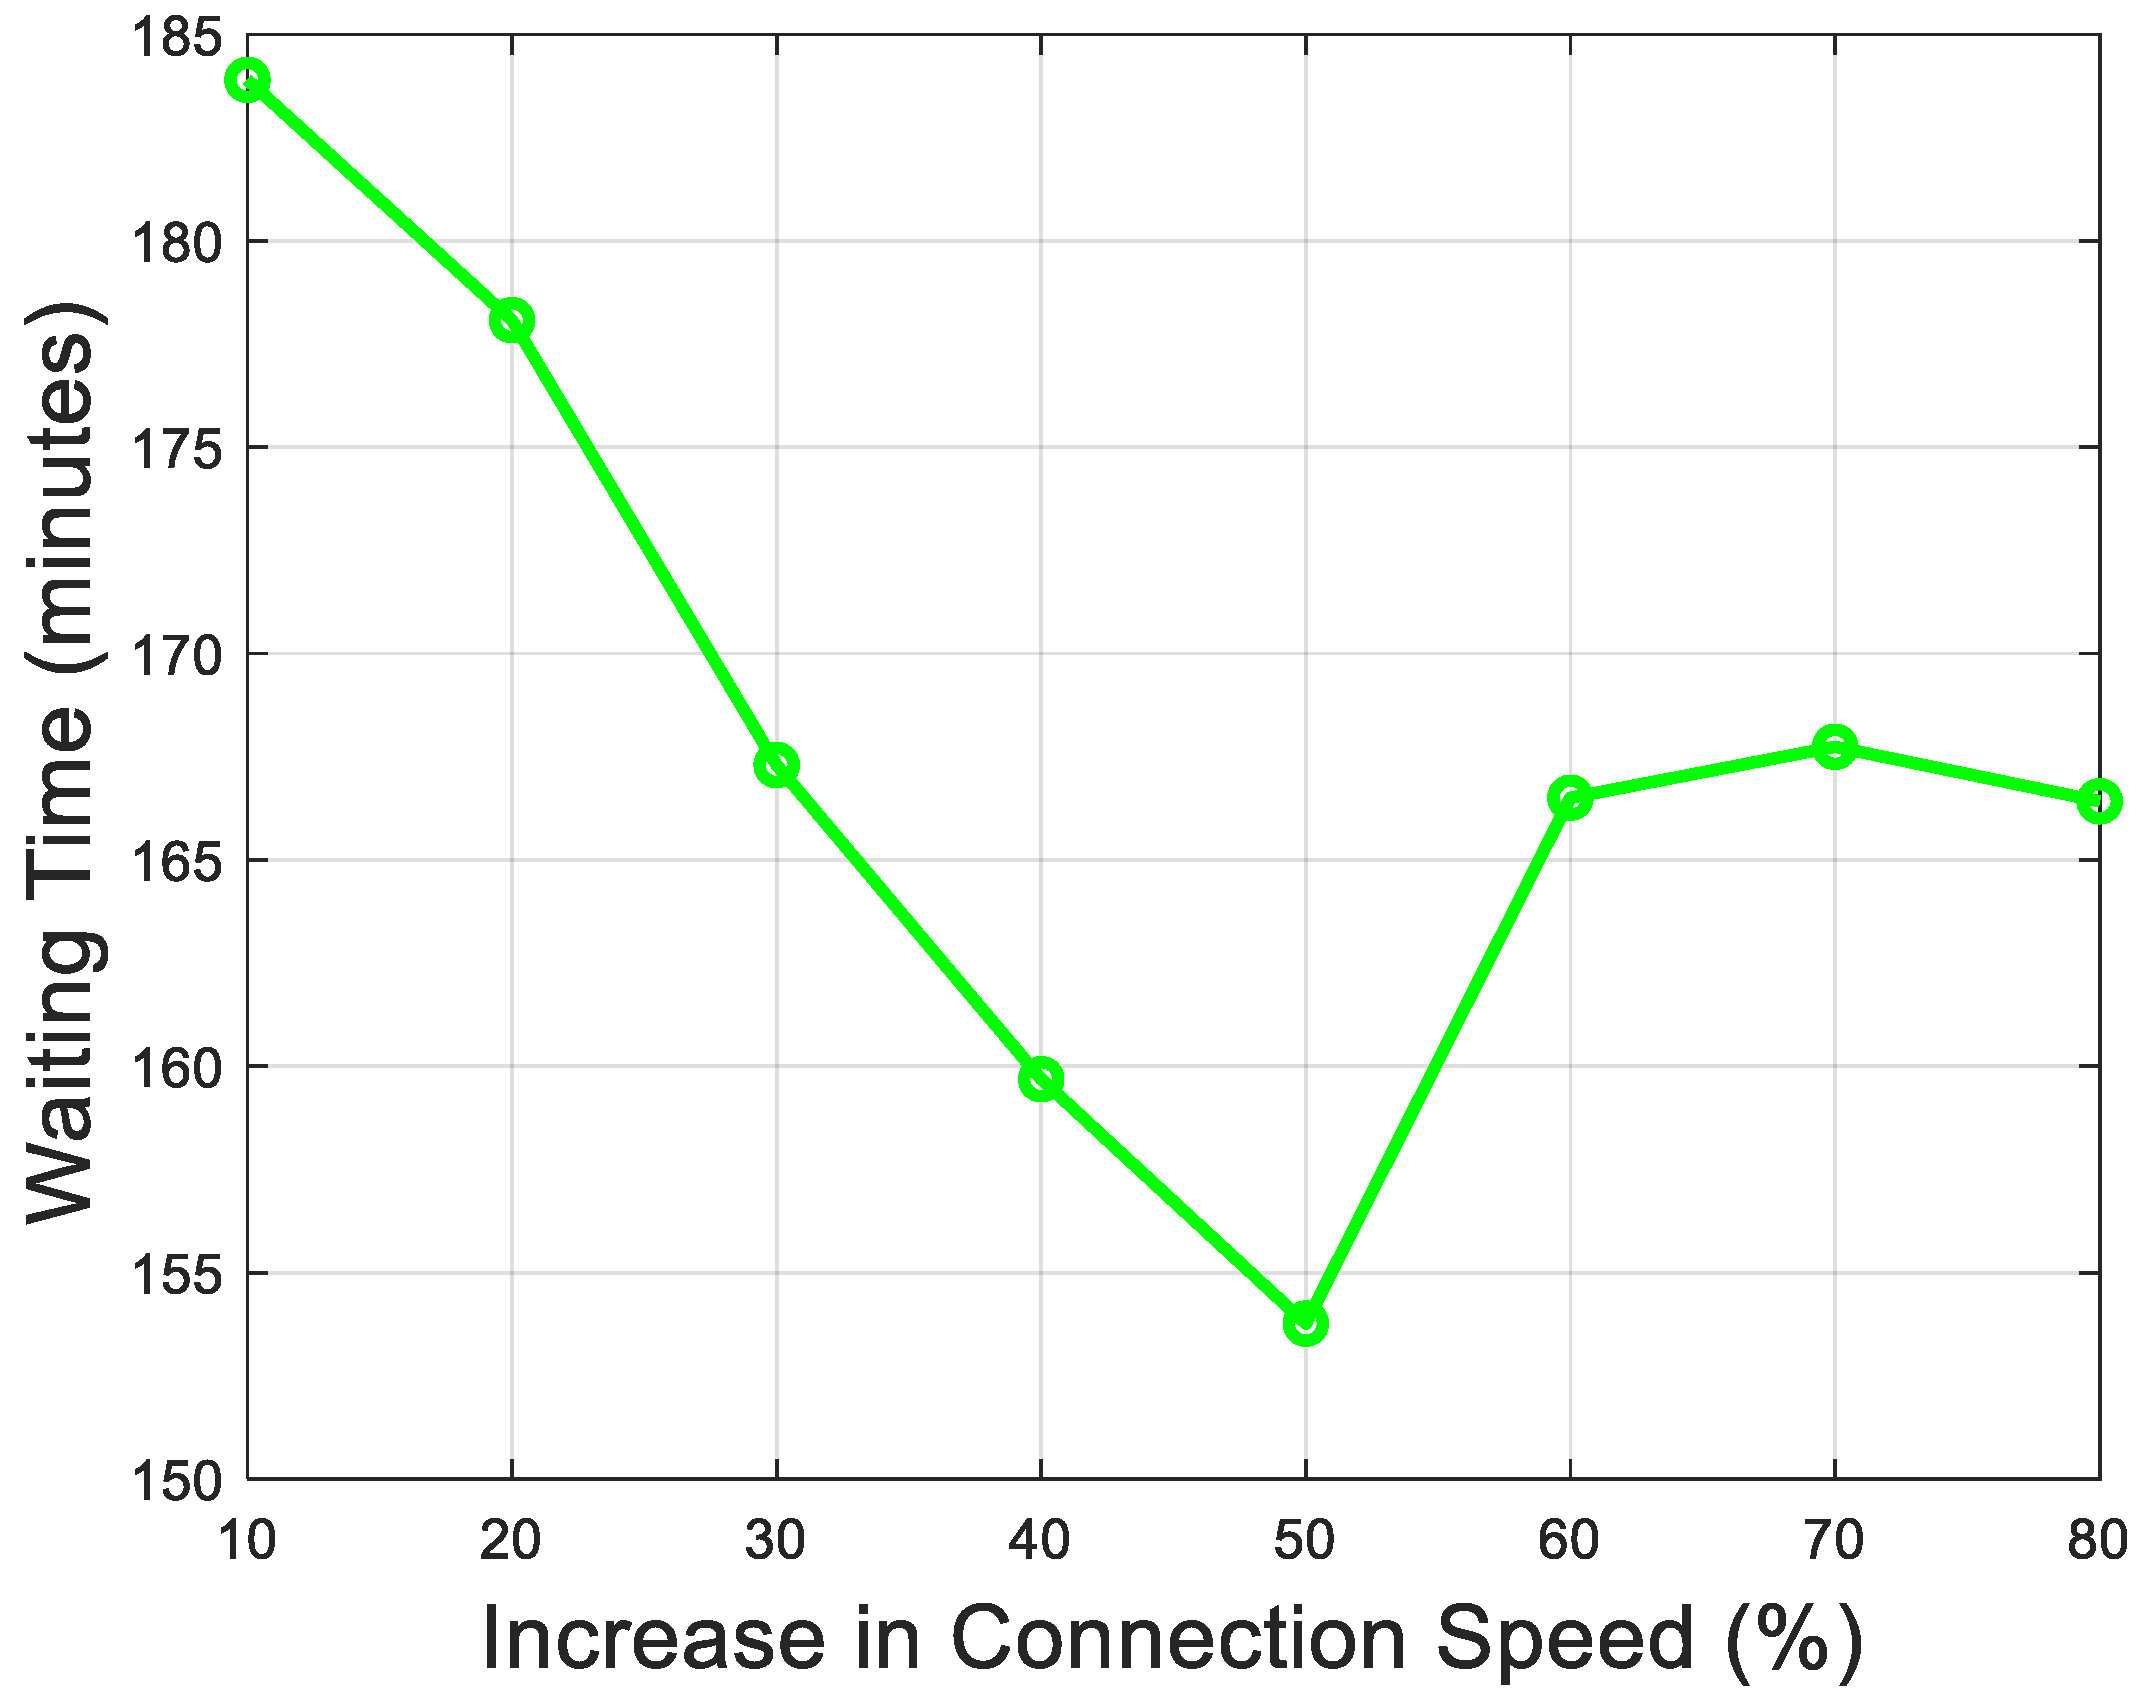
- Shore Power Connection Speed: Enhancing shore power connection speed can significantly improve system efficiency and streamline overall port operations. A 50% increase in connection speed reduces vessel waiting time by 16.39% and pollutant emissions by 9.67%, with only a modest 7.8% rise in costs (Table 7). This well-calibrated increase is particularly crucial for port optimization, as larger vessels benefit more substantially from faster connections, leading to greater operational efficiency gains.
- Impact of Vessel Type: Vessel type significantly influences the willingness to adopt shore power, with larger vessels demonstrating a higher inclination to connect compared to smaller ones, especially as connection speeds improve (Figure 13). Ports should prioritize the needs of large vessels while encouraging smaller vessels to utilize shore power through enhanced connection speeds and policy incentives, such as subsidies or preferential pricing.
Author Contributions
Funding
Data Availability Statement
Conflicts of Interest
Abbreviations
| PB | Preferred Berth |
| AB | Alternative Berth |
| AT | Arrival Time |
| BT | Berthing Time |
| ST | Loading/Unloading Service Time (min) |
| DT | Departure Time |
| WF | Weather Factor |
| DVC | Deviation Cost (CNY) |
| DMC | Demurrage Cost (CNY) |
| NSGA-III | elitist non-dominated sorting genetic algorithm-III |
| TOPSIS | Technique for Order Preference by Similarity to Ideal Solution |
References
- Feng, Y.; Huang, D.; Hong, X.; Wang, H.; Loughney, S.; Wang, J. Spatial-temporal evolution of maritime accident hot spots in the East China Sea: A Space-Time Cube Representation. J. Mar. Sci. Eng. 2025, 13, 233. [Google Scholar] [CrossRef]
- Yin, C.; Zhang, Z.A.; Fu, X.; Ge, Y.E. A low-carbon transportation network: Collaborative effects of a rail freight subsidy and carbon trading mechanism. Transp. Res. Part A Policy Pract. 2024, 184, 104066. [Google Scholar] [CrossRef]
- Yin, C.; Zhang, Z.; Zhang, X.; Chen, J.; Tao, X.; Yang, L. Hub seaport multimodal freight transport network design: Perspective of regional integration development. Ocean Coast. Manag. 2023, 242, 106675. [Google Scholar] [CrossRef]
- Lu, H.; Huang, L. Optimization of shore power deployment in green ports considering government subsidies. Sustainability 2021, 13, 1640. [Google Scholar] [CrossRef]
- Song, Z.; Tang, W.; Zhao, R.; Zhang, G. Implications of government subsidies on shipping companies’ shore power usage strategies in port. Transp. Res. Part E Logist. Transp. Rev. 2022, 165, 102840. [Google Scholar] [CrossRef]
- Peng, Y.; Liu, Q.; Xu, J. Dynamic incentive contract of government for port enterprises to reduce emissions in the blockchain era: Considering carbon trading policy. Sustainability 2023, 15, 12148. [Google Scholar] [CrossRef]
- Gu, Y.; Yu, X. A life cycle cost analysis of different shore power incentive policies on both shore and ship sides based on system dynamics and a Chinese port case. Environ. Sci. Pollut. Res. 2024, 31, 29563–29583. [Google Scholar] [CrossRef]
- Seddiek, I.S. Application of fuel-saving strategies onboard high-speed passenger ships. J. Mar. Sci. Technol. 2016, 21, 493–500. [Google Scholar] [CrossRef]
- Song, T.; Li, Y.; Zhang, X.P.; Wu, C.; Li, J.; Guo, Y.; Gu, H. Integrated port energy system considering integrated demand response and energy interconnection. Int. J. Electr. Power Energy Syst. 2020, 117, 105654. [Google Scholar] [CrossRef]
- Seddiek, I.S.; Mosleh, M.A.; Banawan, A.A. Cost and environmental benefit in the use of shore connection in BJTI port. J. Marit. Technol. Eng. 2020, 6, 41–48. [Google Scholar]
- Tarnapowicz, D.; German-Galkin, S. Energy optimization of the ‘shore to ship’ system—A universal power system for ships at berth in a port. Sensors 2020, 20, 3815. [Google Scholar] [CrossRef]
- Samosir, D.H.; Markert, M.; Busse, W. The technical and business analysis of using shore power connection in the port of Hamburg. J. Tek. ITS 2017, 5, 18860. [Google Scholar] [CrossRef]
- Rogosic, M.; Stanivuk, T.; Lucaci, D. A study on the application of shore-side power as a method to reduce the emissions of greenhouse gases by cruise ships. J. Mar. Sci. Eng. 2025, 13, 453. [Google Scholar] [CrossRef]
- Qu, S.; Li, X.; Liu, C.; Tang, X.; Peng, Z.; Ji, Y. Two-stage robust programming modeling for continuous berth allocation with uncertain vessel arrival time. Sustainability 2023, 15, 10560. [Google Scholar] [CrossRef]
- Wang, Z.; Hu, H.; Zhen, L. Berth and quay cranes allocation problem with on-shore power supply assignment in container terminals. Comput. Ind. Eng. 2024, 188, 109910. [Google Scholar] [CrossRef]
- Sheikholeslami, A.; Mardani, M.; Ayazi, E.; Arefkhani, H. A dynamic and discrete berth allocation problem in container terminals considering tide effects. Iran J. Sci. Technol. Trans. Civ. Eng. 2020, 44, 369–376. [Google Scholar] [CrossRef]
- Wang, P.; Li, J.; Cao, X. Discrete dynamic berth allocation optimization in container terminal based on Deep Q-Network. Mathematics 2024, 12, 3742. [Google Scholar] [CrossRef]
- Rodrigues, F.; Agra, A. Berth allocation and quay crane assignment/scheduling problem under uncertainty: A survey. Eur. J. Oper. Res. 2022, 303, 501–524. [Google Scholar] [CrossRef]
- Xu, Y. Multi-objective optimization of joint scheduling of berth and quay crane under green ports. In Proceedings of the 7th International Conference on Traffic Engineering and Transportation System (ICTETS 2023), Dalian, China, 22–24 September 2023; Volume 13064, pp. 190–197. [Google Scholar] [CrossRef]
- Cheimanoff, N.; Fontane, F.; Kitri, M.N.; Tchernev, N. A reduced VNS based approach for the dynamic continuous berth allocation problem in bulk terminals with tidal constraints. Expert Syst. Appl. 2021, 168, 114215. [Google Scholar] [CrossRef]
- Lin, X.; Pu, X.; Bai, X. On the efficiency impacts of berthing priority provision. Transp. Sci. 2024, 58, 557–683. [Google Scholar] [CrossRef]
- Chu, L.; Zhang, J.; Chen, X.; Yu, Q. Optimization of integrated tugboat–berth–quay crane scheduling in container ports considering uncertainty in vessel arrival times and berthing preferences. J. Mar. Sci. Eng. 2024, 12, 1541. [Google Scholar] [CrossRef]
- Yang, S.; Shen, H.; Zhong, Z.; Qian, X.; Wang, Y. Collaborative scheduling for Yangtze Riverport channels and berths using multi-objective optimization. Appl. Sci. 2024, 14, 6514. [Google Scholar] [CrossRef]
- Chang, S.-C.; Lin, M.-H.; Tsai, J.-F. An optimization approach to berth allocation problems. Mathematics 2024, 12, 753. [Google Scholar] [CrossRef]
- Wang, Y.; Zou, T. Optimization of berth-tug co-scheduling in container terminals under dual-carbon contexts. J. Mar. Sci. Eng. 2024, 12, 684. [Google Scholar] [CrossRef]
- Peng, Y.; Dong, M.; Li, X.; Liu, H.; Wang, W. Cooperative optimization of shore power allocation and berth allocation: A balance between cost and environmental benefit. J. Clean. Prod. 2020, 276, 123816. [Google Scholar] [CrossRef]
- Mo, A.; Zhang, Y.; Xiong, Y.; Ma, F.; Sun, L. Energy–Logistics cooperative optimization for a port-integrated energy system. Mathematics 2024, 12, 1917. [Google Scholar] [CrossRef]
- Zhang, Y.; Liang, C.; Shi, J.; Lim, G.; Wu, Y. Optimal port microgrid scheduling incorporating onshore power supply and berth allocation under uncertainty. Appl. Energy 2022, 313, 118856. [Google Scholar] [CrossRef]
- Yue, M.; Wang, Y.; Guo, S.; Dai, L.; Hu, H. A multi-objective optimization study of berth scheduling considering shore side electricity supply. Ocean Coast. Manag. 2025, 261, 107500. [Google Scholar] [CrossRef]
- Wang, W.; Liu, K.; Peng, Y.; Yu, Q.; Guo, J.; Yu, T. Investigating relationships between shore power utilization and characteristics of ships and berths. Transp. Res. Part D Transp. Environ. 2024, 136, 104446. [Google Scholar] [CrossRef]
- Guo, Q.; Yin, C.; Zheng, S. An intermodal transport network planning scheme considering carbon emissions. Energy 2025, 322, 135564. [Google Scholar] [CrossRef]
- Bierwirth, C.; Meisel, F. A survey of berth allocation and quay crane scheduling problems in seaport container terminals. Transp. Sci. 2010, 44, 312–329. [Google Scholar] [CrossRef]
- Dragović, B.; Park, N.K.; Radmilović, Z.; Maraš, V. Simulation modelling of ship-berth link with priority service. Marit. Econ. Logist. 2005, 7, 316–335. [Google Scholar] [CrossRef]
- Dragović, B.; Tzannatos, E.; Park, N.K. Simulation modelling in ports and container terminals: Literature overview and analysis by research field, application area and tool. Flex. Serv. Manuf. J. 2017, 29, 4–34. [Google Scholar] [CrossRef]
- GB/T 51305-2018; Technical Standard for Shore-To-Ship Power Supply System Engineering. China Planning Press: Beijing, China, 2018.
- Yin, C.; Zeng, L.; Fu, X.; Zhong, M. Transition of multimodal transport network under different carbon price scenarios. Transp. Policy 2025, 164, 1–26. [Google Scholar] [CrossRef]


| Research Area | Authors & Year | Research Methods | Key Contributions |
|---|---|---|---|
| Shore power configuration | Lu et al. (2021) [4] | Multi-objective optimization | Analyzed the impact of government subsidies on shore power deployment, showing that appropriate subsidy strategies can balance cost and environmental benefits. |
| Song et al. (2022) [5] | Game theory | Governments should prioritize subsidies for ships using shore power to enhance the investment appeal of emission reduction technologies. | |
| Peng et al. (2023) [6] | Dynamic incentive mechanism | With government support, the combination of blockchain technology and carbon trading markets can further enhance emission reduction efficiency. | |
| Gu and Yu. (2024) [7] | Life-cycle analysis | Appropriate incentive policies can effectively reduce costs and promote the widespread adoption of shore power. | |
| Seddiek et al. (2016) [8] | Analytical models and equations | Highlighted the potential benefits of shore-side power and cold ironing in reducing fuel costs and emissions. | |
| Song et al. (2020) [9] | Probabilistic modeling framework | Addressed previous limitations in static cost-benefit analyses of shore power systems. | |
| Seddiek et al. (2020) [10] | Cost-benefit analysis | Evaluated the economic feasibility of implementing shore power systems at ports. | |
| Tarnapowicz et al. (2020) [11] | Energy optimization algorithm | Optimized energy flows to effectively reduce port pollution. | |
| Busse et al. (2017) [12] | Economic model and market analysis | Analyzed the feasibility of shore power and its role in pollutant reduction. | |
| Rogosic et al. (2025) [13] | Scenario analysis | Evaluated the environmental benefits of shore power technology. | |
| Berth Allocation | Qu et al. (2023) [14] | Two-stage robust optimization | Addressed uncertainty in ship arrival times, significantly improving the reliability of berth scheduling. |
| Wang et al. (2024) [15] | Integrated optimization | Developed an integrated berth allocation and crane scheduling optimization model, improving port throughput efficiency and service levels. | |
| Sheikholeslami (2020) [16] | Mixed integer linear programming | Demonstrated significant delay reductions through optimized berth allocation and channel dredging, while advocating active-reactive strategies for uncertainty management. | |
| Wang et al. (2024) [17] | Novel deep Q-network | Addressed the DDBAP under uncertain ship arrivals and variable loads. | |
| Rodrigue and Agra (2023) [18] | Stochastic berth scheduling | Optimized port operations by considering uncertainty factors like weather, suitable for high-variability port environments. | |
| Xu (2024) [19] | Multi-objective berth and crane scheduling model | Balanced cost and service quality, demonstrating excellent optimization performance using an immune particle swarm algorithm. | |
| Cheimanoff et al. (2021) [20] | Tidal constraint model | Investigated the impact of tidal conditions on berth allocation and solved optimization problems. | |
| Lin et al. (2024) [21] | Multi-objective optimization | Reasonable priority strategies could improve port operational efficiency and resource utilization. | |
| Chu et al. (2024) [22] | Mixed-Integer programming | Reducing queuing time can directly alleviate port congestion costs, thereby enhancing operational efficiency. | |
| Yang et al. (2024) [23] | Multi-objective optimization | Demonstrated the applicability of an enhanced NSGA-III algorithm in port scheduling. | |
| Collaborative Optimization of Shore Power and Berth Allocation | Chang et al. (2024) [24] | Mixed-integer linear programming | Optimized berth and shore power resource allocation, reducing ship waiting times and energy consumption. |
| Wang et al. (2024) [25] | Two-layer mixed-integer linear programming | Addressed dynamic berth preferences and collaborative scheduling of berthing and towing assistance in container terminals. | |
| Peng et al. (2020) [26] | Cost-benefit balancing approach | Proposed a collaborative optimization method for berths and shore power, demonstrating its potential for emission reduction and economic value. | |
| Mo et al. (2024) [27] | Hybrid system model | Developed an energy-logistics collaborative optimization framework incorporating hybrid system modeling to address low-carbon port operations. | |
| Zhang et al. (2022) [28] | Mixed-integer linear programming | Emphasized the potential of microgrids and shore power technology in reducing port operational costs and pollution emissions. | |
| Yue et al. (2024) [29] | Multi-objective optimization | Focused on green port scenarios, integrating berth and shore power scheduling to achieve both energy savings, emission reductions, and efficiency improvements. | |
| Wang et al. (2024) [30] | Hybrid algorithm | Showed the application potential of berth allocation and shore power scheduling optimization in complex port operations. |
| Sets | |
| The set of port vessels | |
| The set of berths | |
| The set of time slots | |
| The set of pollutants | |
| Parameters | |
| The arrival time of ship | |
| The berthing time of ship | |
| The waiting time of ship | |
| The departure time of ship | |
| The estimated working time of ship at berth | |
| The actual working time of ship at berth | |
| The time of ship connecting to shore power | |
| The estimated departure time of ship | |
| The price of shore power | |
| The price of diesel | |
| The berthing position of ship | |
| The actual berth of ship | |
| The length of ship | |
| The deviation cost of ship | |
| The demurrage cost of ship | |
| The waiting cost of ship at anchorage | |
| The auxiliary engine power of ship | |
| The length of berth | |
| The number of shore power | |
| The weather factor | |
| The weather threshold | |
| Decision variables | |
| Equals 1, if ship is provided with electricity by shore power while working at the berth; 0, otherwise. | |
| Equals 1, if the position of ship is below the position of ship ; 0, otherwise. | |
| Equals 1, if the work of ship begins when the work of ship ends; 0, otherwise. | |
| Equals 1, if ship is stopped at position at time ; 0, otherwise. | |
| Equals 1, if ship is using shore power at time ; 0, otherwise. | |
| Ships | Length | PB | AB | AT | BT | ST | DT | WF | DVC | DMC |
|---|---|---|---|---|---|---|---|---|---|---|
| 1 | 251.92 | 1 | 3 | 0:00 | 0:00 | 381.72 | 9:49 | 2.02 | 618 | 31.81 |
| 2 | 296.06 | 9 | 6 | 1:07 | 4:08 | 616.35 | 15:00 | 1.9 | 816 | 35.94 |
| 3 | 186.07 | 3 | 12 | 6:22 | 8:02 | 476.98 | 16:22 | 1.71 | 555 | 26.86 |
| 4 | 153.21 | 3 | 9 | 10:39 | 13:36 | 137.61 | 16:12 | 2.27 | 1042 | 39.9 |
| 5 | 234.48 | 4 | 6 | 10:48 | 14:37 | 326.06 | 20:31 | 2.19 | 319 | 30.27 |
| 6 | 219.58 | 7 | 4 | 11:59 | 15:33 | 471.3 | 23:51 | 2.04 | 954 | 38.23 |
| 7 | 275.1 | 6 | 11 | 14:33 | 17:41 | 240.81 | 22:14 | 2.28 | 1238 | 24.68 |
| 8 | 217.19 | 5 | 4 | 16:51 | 19:46 | 236.4 | 0:08 | 1.68 | 409 | 18.4 |
| 9 | 163.61 | 12 | 8 | 18:17 | 21:14 | 338.13 | 3:12 | 2.35 | 1076 | 25.83 |
| 10 | 256.86 | 8 | 11 | 23:28 | 3:03 | 528.11 | 12:22 | 1.74 | 363 | 35.44 |
| 11 | 214.5 | 7 | 2 | 23:52 | 4:17 | 453.79 | 12:17 | 2.06 | 525 | 24 |
| 12 | 264.56 | 11 | 7 | 1:37 | 4:00 | 265.72 | 8:58 | 2.1 | 881 | 32.29 |
| 13 | 225.87 | 5 | 3 | 1:55 | 3:45 | 337.18 | 9:49 | 1.66 | 441 | 28.97 |
| 14 | 152.76 | 3 | 6 | 2:28 | 5:54 | 511.12 | 14:44 | 1.8 | 539 | 39.93 |
| 15 | 156.83 | 11 | 4 | 4:20 | 8:23 | 516.32 | 17:19 | 2.19 | 56 | 27.92 |
| 16 | 270.73 | 10 | 12 | 4:26 | 6:42 | 320.52 | 12:35 | 1.87 | 579 | 22.37 |
| 17 | 237.45 | 1 | 9 | 6:33 | 10:23 | 250.24 | 15:02 | 1.88 | 82 | 15.91 |
| 18 | 179.99 | 12 | 8 | 6:44 | 9:25 | 453.53 | 17:20 | 1.79 | 661 | 38.11 |
| 19 | 154.29 | 5 | 2 | 8:49 | 12:21 | 226.63 | 16:26 | 2.07 | 116 | 17.81 |
| 20 | 272.2 | 4 | 10 | 11:16 | 14:42 | 179.96 | 18:14 | 2.14 | 745 | 44.74 |
| Rank | Shore Power Usage Cost (CNY) | Pollutants (kg) | Waiting Time (min) | TOPSIS Score | Vessels Using Shore Power |
|---|---|---|---|---|---|
| 1 | 175,467.69 | 15,807.48 | 189.84 | 0.817 | 1, 4, 7, 13, 20 |
| 2 | 167,176.12 | 17,144.05 | 173.14 | 0.811 | 4, 13, 14, 18, 20 |
| 3 | 176,250.50 | 15,681.30 | 186.58 | 0.810 | 8, 12, 13, 17 |
| 4 | 164,415.62 | 17,589.03 | 169.84 | 0.806 | 2, 6, 7, 9, 12, 20 |
| 5 | 173,056.96 | 16,196.08 | 176.64 | 0.803 | 2, 10, 15 |
| 6 | 168,694.95 | 16,899.22 | 171.36 | 0.802 | 6, 7, 8, 12, 14 |
| 7 | 167,958.93 | 17,017.87 | 169.89 | 0.799 | 6, 11, 15, 19 |
| 8 | 178,254.97 | 15,358.19 | 178.93 | 0.789 | 3, 5, 14, 15, 16 |
| 9 | 170,446.09 | 16,616.95 | 169.08 | 0.789 | 7, 9, 10, 14, 17, 20 |
| 10 | 168,520.34 | 16,927.37 | 167.27 | 0.788 | 2, 6, 9, 14, 17, 20 |
| Solution | Shore Power Usage Cost (CNY) | Pollutants (kg) | Waiting Time (min) | TOPSIS Score | Vessels Using Shore Power |
|---|---|---|---|---|---|
| Optimized | 175,467.69 | 15,807.48 | 189.84 | 0.817 | 1, 4, 7, 13, 20 |
| Non-Optimized | 172,728.29 | 17,055.04 | 187.78 | 0.733 | 2, 10, 20 |
| Comparison | +1.56% | −7.31% | +1.11% | +11.46% |
| Number of Shore Power Connections | Shore Power Usage Cost (CNY) | Pollutants (kg) | Waiting Time (min) | Vessels Using Shore Power | Total Length of Vessels Using Shore Power (m) |
|---|---|---|---|---|---|
| 6 | 175,467.69 | 15,807.48 | 189.84 | 1, 4, 7, 13, 20 | 1178.3 |
| 8 | 182,368.12 | 14,696.04 | 229.55 | 1, 4, 7, 13, 18, 20 | 1358.29 |
| 10 | 191,081.87 | 13,352.17 | 257.01 | 3, 4, 5, 6, 10, 13, 20 | 1548.27 |
| 12 | 203,801.53 | 11,241.45 | 307.31 | 1, 2, 4, 5, 7, 9, 10, 17, 20 | 2140.89 |
| Connection Speed Increase | Shore Power Usage Cost (CNY) | Pollutants (kg) | Waiting Time (min) | Vessels Using Shore Power | Total Length of Vessels Using Shore Power (m) |
|---|---|---|---|---|---|
| 10% | 175,467.69 | 15,807.48 | 189.84 | 1, 4, 7, 13, 20 | 1178.3 |
| 20% | 185,691.76 | 15,075.22 | 178.07 | 1, 4, 7, 17, 20 | 1189.88 |
| 30% | 187,461.77 | 14,729.36 | 167.29 | 2, 4, 7, 17, 20 | 1234.02 |
| 40% | 196,277.38 | 14,493.05 | 159.68 | 2, 4, 7, 10, 20 | 1253.43 |
| 50% | 201,412.05 | 14,034.92 | 153.76 | 1, 2, 7, 13, 18 | 1228.94 |
| 60% | 184,863.49 | 14,850.43 | 166.50 | 1, 2, 8, 13, 20, 17 | 1263.24 |
| 70% | 187,716.24 | 14,637.93 | 167.73 | 1, 2, 9, 17, 20, 16 | 1221.24 |
| 80% | 184,397.73 | 14,681.54 | 166.41 | 1, 7, 8, 16, 20, 15 | 1287.14 |
Disclaimer/Publisher’s Note: The statements, opinions and data contained in all publications are solely those of the individual author(s) and contributor(s) and not of MDPI and/or the editor(s). MDPI and/or the editor(s) disclaim responsibility for any injury to people or property resulting from any ideas, methods, instructions or products referred to in the content. |
© 2025 by the authors. Licensee MDPI, Basel, Switzerland. This article is an open access article distributed under the terms and conditions of the Creative Commons Attribution (CC BY) license (https://creativecommons.org/licenses/by/4.0/).
Share and Cite
Zhang, Z.; Zhu, Y.; Zhu, J.; Huang, D.; Yin, C.; Li, J. Collaborative Optimization of Shore Power and Berth Allocation Based on Economic, Environmental, and Operational Efficiency. J. Mar. Sci. Eng. 2025, 13, 776. https://doi.org/10.3390/jmse13040776
Zhang Z, Zhu Y, Zhu J, Huang D, Yin C, Li J. Collaborative Optimization of Shore Power and Berth Allocation Based on Economic, Environmental, and Operational Efficiency. Journal of Marine Science and Engineering. 2025; 13(4):776. https://doi.org/10.3390/jmse13040776
Chicago/Turabian StyleZhang, Zhiqiang, Yuhua Zhu, Jian Zhu, Daozheng Huang, Chuanzhong Yin, and Jinyang Li. 2025. "Collaborative Optimization of Shore Power and Berth Allocation Based on Economic, Environmental, and Operational Efficiency" Journal of Marine Science and Engineering 13, no. 4: 776. https://doi.org/10.3390/jmse13040776
APA StyleZhang, Z., Zhu, Y., Zhu, J., Huang, D., Yin, C., & Li, J. (2025). Collaborative Optimization of Shore Power and Berth Allocation Based on Economic, Environmental, and Operational Efficiency. Journal of Marine Science and Engineering, 13(4), 776. https://doi.org/10.3390/jmse13040776