Abstract
When vessels are docked at ports, traditional auxiliary engines produce substantial pollutants and noise, exerting pressure on the port environment. Shore power technology, as a green, energy-efficient, and emission-reducing solution, can effectively mitigate ship emissions. However, its widespread adoption is hindered by challenges such as high costs, compatibility issues, and connection complexity. This study develops a multi-objective optimization model for the coordinated allocation of shore power and berth scheduling, integrating economic benefits, environmental benefits, and operational efficiency. The NSGA-III algorithm is employed to solve the model and generate a Pareto-optimal solution set, with the final optimal solution identified using the TOPSIS method. The results demonstrate that the optimized shore power distribution and berth scheduling strategy can significantly reduce ship emissions and port operating costs while enhancing overall port resource utilization efficiency. Additionally, an economically feasible shore power allocation scheme, based on 80% of berth capacity, is proposed. By accounting for variations in ship types, this study provides more targeted and practical optimization strategies. These findings offer valuable decision support for port management and contribute to the intelligent and sustainable development of green ports.
1. Introduction
With the continuous expansion of international trade, cargo throughput at ports has been steadily increasing [1,2,3]. As vital hubs in global commerce, ports face mounting challenges in both operational efficiency and environmental protection. While docked, ships relying on traditional auxiliary engines emit substantial amounts of exhaust and noise, contributing significantly to environmental pollution in surrounding areas.
A report by the Natural Resources Defense Council highlights that a medium- to large-sized container ship using fuel with a sulfur content of 3.5% emits PM2.5 pollutants during its port stay equivalent to the emissions of 500,000 heavy-duty trucks. The escalating environmental impact has made the reduction of energy-related emissions an urgent priority for ports worldwide. Shore power, a promising technology for energy conservation and emission reduction, plays a crucial role in the development of green ports. By supplying electricity from the shore to vessels at berth, shore power systems allow ships to shut down their auxiliary engines, significantly cutting exhaust emissions.
Shore power, a promising technology for energy conservation and emission reduction in the maritime sector, plays a crucial role in the development of green ports. By supplying electricity from the shore to vessels at berth, shore power systems allow ships to shut down their auxiliary engines, significantly cutting exhaust emissions. According to the 2023 report Blue Port Pioneer: Collaborative Air and Climate Evaluation of China’s Typical Ports by the Asia Clean Air Center, as of 2022, shore power coverage at specialized berths in 21 coastal ports across China had reached 84%. However, the report also highlights that the average utilization rate of shore power remains below 20%.
Despite its significant environmental and emission reduction benefits, the low adoption of shore power in practice is primarily due to the following challenges:
- (1)
- High Construction and Maintenance Costs: The high cost of building and maintaining shore power systems remains a major obstacle to their widespread adoption. According to the 2022 China Port Shore Power Technology Development Report, the average construction cost per berth is approximately 500,000 RMB. Additionally, the electricity cost for ships using shore power is around 0.95 RMB/kWh—significantly higher than the 0.65 RMB/kWh cost of traditional fuel-based power generation. These high costs reduce port operators’ willingness to invest in shore power infrastructure and further discourage ship operators from adopting the system.
- (2)
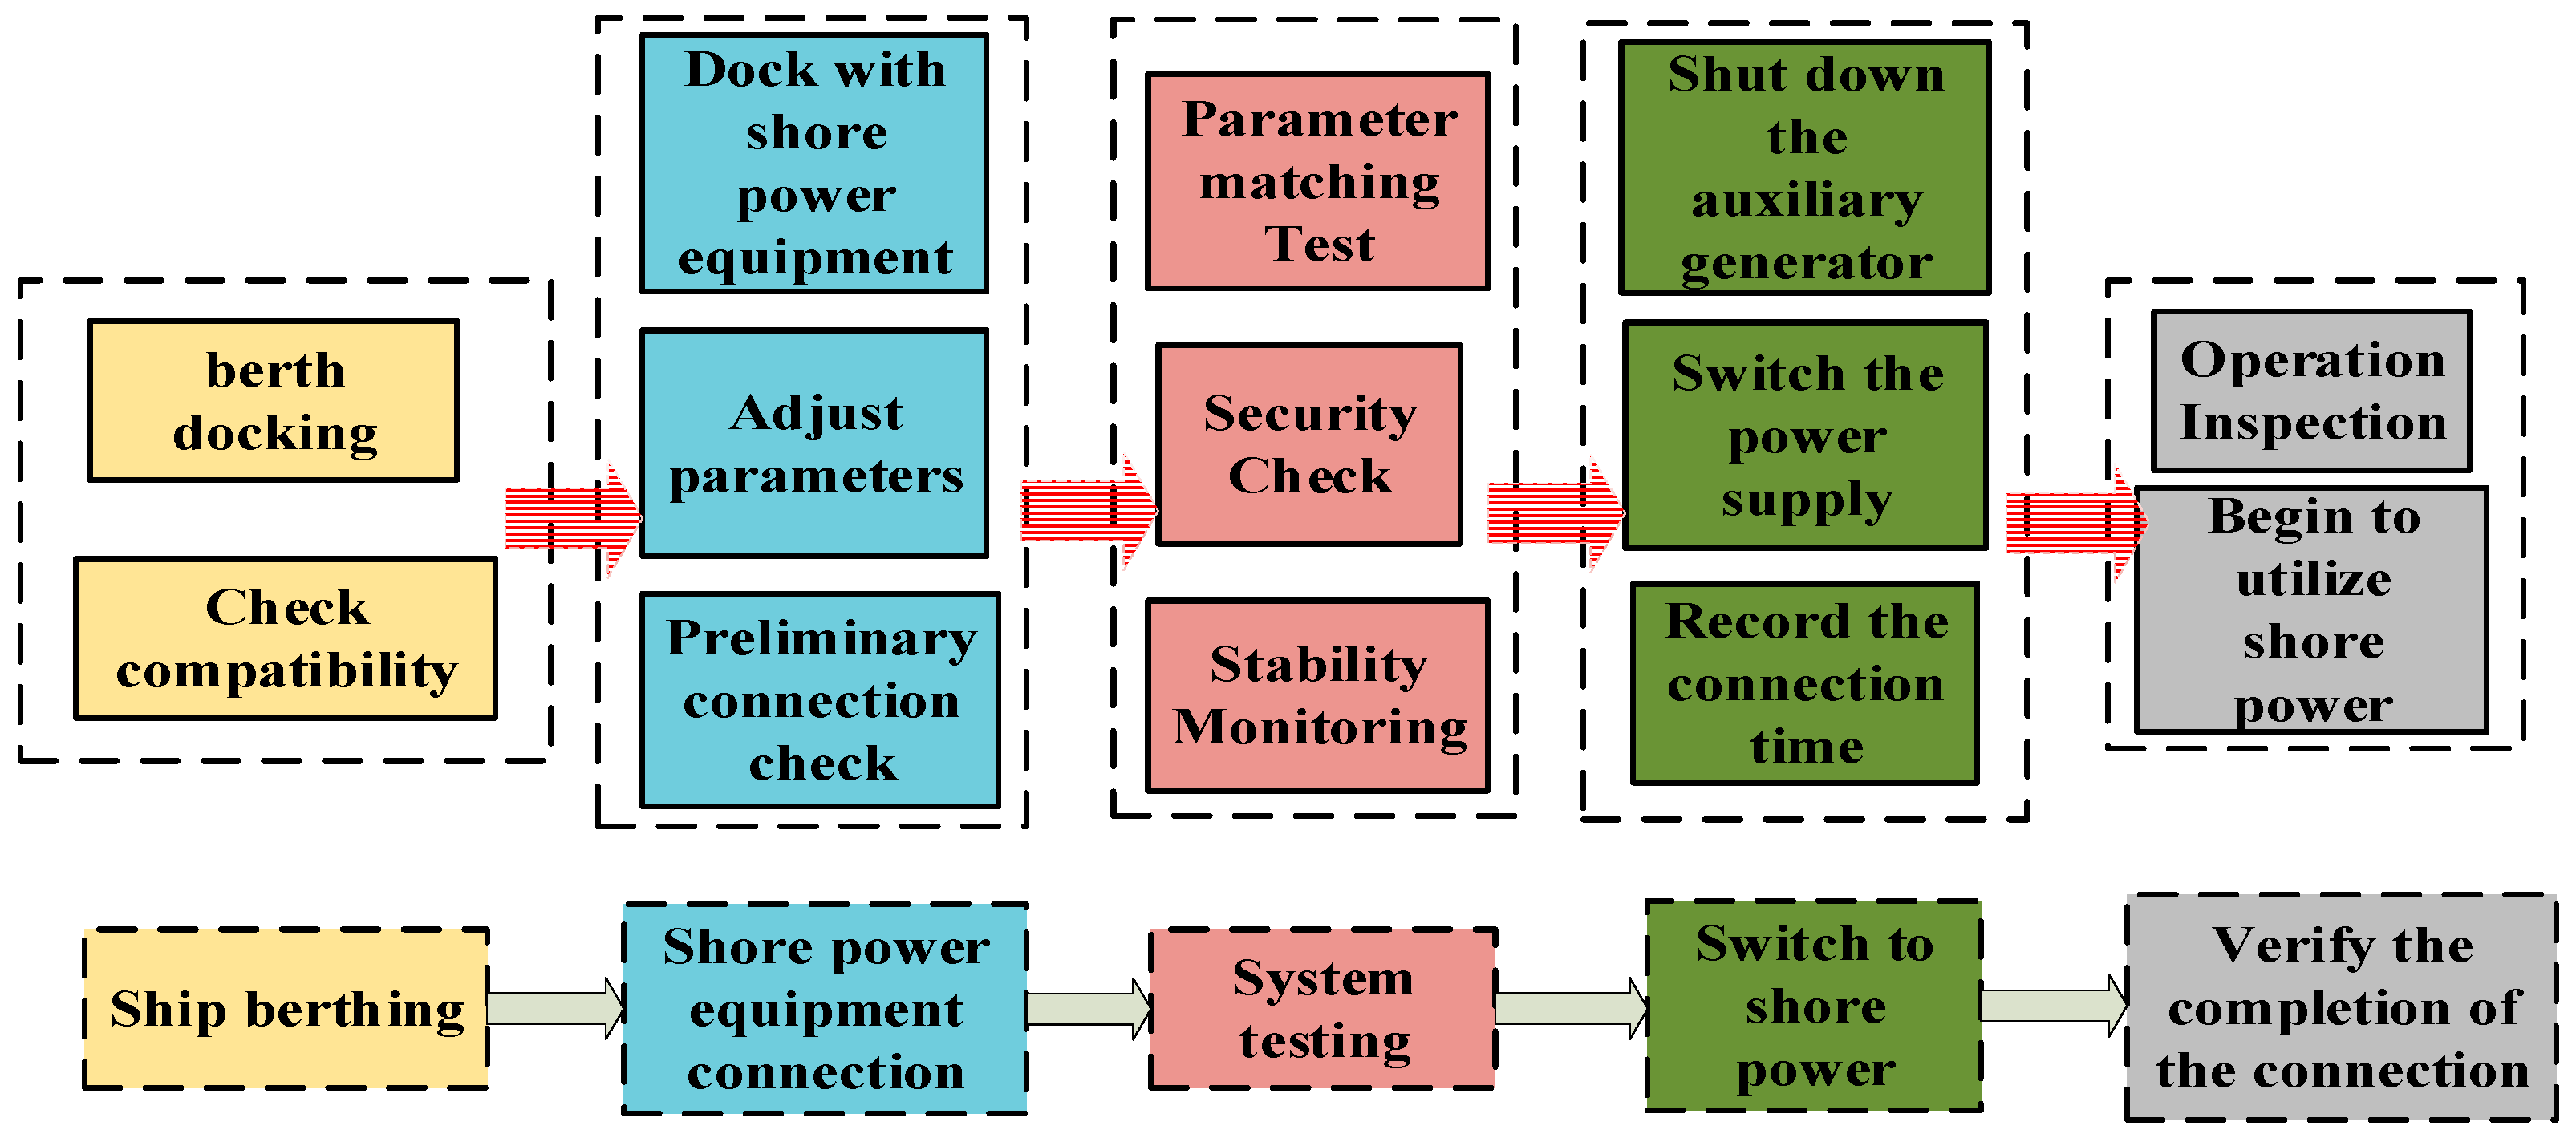
- Complex Connection Procedures and High Time Costs: Connecting to shore power requires intricate equipment interfaces, electrical parameter synchronization, and rigorous safety testing (as illustrated in Figure 1), all of which extend vessel docking times and negatively impact overall port operational efficiency.
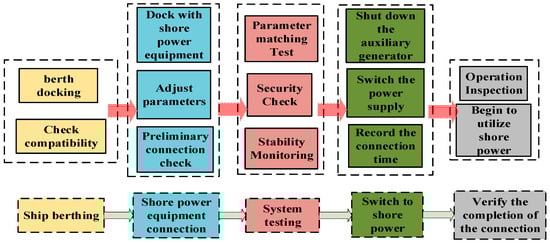 Figure 1. Shore power connection process.
 - (3)
- Limited Ship Compatibility: Currently, only about 40% of vessels worldwide are equipped with shore power connection capabilities. This low compatibility rate severely restricts the large-scale implementation of shore power systems. The International Chamber of Shipping (ICS) identifies high retrofit costs as the primary barrier, with installation expenses for medium-sized vessels ranging between $150,000 and $250,000.
- (4)
- Insufficient Policy Incentives: While many countries have introduced subsidies for the construction of shore power facilities, economic incentives for ship operators remain inadequate. As a result, shipowners lack sufficient motivation to utilize shore power. For instance, in 2022, the fee reductions for shore power at certain Chinese ports were limited in scope, reducing their economic attractiveness to shipping companies.
- (5)
- Lack of Coordination Between Berths and Shore Power: Ship arrival times are highly variable, and berth resource utilization directly affects the availability of shore power. The absence of an effective coordinated optimization mechanism further constrains shore power efficiency, limiting its practical benefits.
In recent years, shore power technology has attracted significant academic attention as an important means of reducing port pollutant emissions. Research has primarily focused on government subsidies, port optimization, and emission reduction benefits. For example, Lu et al. [4] analyzed the impact of government subsidies on shore power deployment using a multi-objective optimization model. The results indicated that appropriate subsidy strategies can effectively reduce operational costs and carbon emissions, balancing both economic and environmental benefits. Other studies have utilized game theory models to analyze the interactions between ports and shipping companies. Song et al. [5] proposed that governments should prioritize subsidies for ships using shore power to increase the investment appeal of emission reduction technologies and optimize the low-carbon operational path of ports. Furthermore, studies based on carbon trading show that increasing the utilization rate of shore power significantly reduces pollutant emissions, with electricity pricing playing a key role in incentivizing ships to use shore power. From an application perspective, Peng et al. [6] investigated dynamic incentive mechanisms for shore power use, emphasizing that, with government support, the combination of blockchain technology and carbon trading markets can further enhance emission reduction efficiency. Gu and Yu [7] analyzed the lifecycle costs of various shore power incentive policies using system dynamics, evaluating their impact on the economic viability of ports and ships, and found that appropriate incentive measures can effectively reduce costs and promote the widespread adoption of shore power. Seddiek et al. [8] demonstrate that comprehensive economic assessments must systematically integrate capital expenditures with long-term operational parameters—including installation, maintenance, and system retrofitting costs—to fully quantify the levelized cost of energy production. This holistic approach reveals hidden financial burdens that conventional project evaluations often overlook. The study showed that government subsidies and market-driven low-carbon preferences can serve as substitutes, balancing cost-sharing ratios to promote low-carbon port operations while providing specific policy recommendations. Song et al. [9] identified three key stochastic factors impacting the economics of Onshore Power Supply (OPS): (1) vessel docking frequency variance, (2) berth connection duration variability, and (3) load profile fluctuations during power transfer. Their probabilistic modeling framework, using Monte Carlo simulations, improves financial projections by accounting for these uncertainties, overcoming limitations of previous static cost-benefit analyses. Seddiek et al. [10] analyzed the cost-benefit and environmental impacts of shore power connections at BJTI port, exploring how shore power systems contribute to reducing greenhouse gas (GHG) emissions and air pollution, and proposed the economic feasibility of implementing shore power systems at ports. Tarnapowicz et al. [11] proposed a “shore-to-ship” system optimization approach aimed at reducing energy consumption and pollutant emissions during vessels’ stay at ports. The study extensively analyzed the energy efficiency of shore power systems under various port layouts and provided systematic optimization solutions for shipping companies. Busse et al. [12] examined the technical and commercial feasibility of shore power connection systems at the Port of Hamburg. Through an analysis of the economic viability, costs, and environmental benefits of shore power systems, the study concluded that shore power technology has significant advantages in reducing port pollution and improving energy use efficiency. Rogosic et al. [13] systematically evaluated the environmental benefits of shore power technology in reducing GHG emissions from cruise ships. Their study demonstrated its significant potential in lowering port-related carbon footprints, particularly in high-energy-demand docking scenarios, where shore power achieved 60–75% higher GHG reduction efficiency compared to conventional fuel-based power generation.
While much of the existing literature on shore power focuses on policies and configurations, there is a lack of research on how ports can allocate shore power efficiently, improve its utilization, and reduce its operational costs.
In terms of berth allocation, Qu et al. [14] proposed a two-stage robust optimization model to address the uncertainty in ship arrival times, significantly improving the reliability of berth scheduling. Their study demonstrated optimal solutions under different uncertainty scenarios through scenario analysis. Wang et al. [15] developed an integrated optimization model for berth allocation and crane scheduling. Using a genetic algorithm, the study optimized berth and crane resource allocation, enhancing port throughput efficiency and service levels. Sheikholeslami [16] proposed a mixed-integer linear programming model incorporating tidal dynamics to minimize departure delays at Iran’s SHRA port. The study demonstrated significant delay reductions through optimized berth allocation and channel dredging and advocated active-reactive strategies for managing uncertainties. Wang et al. [17] developed a novel deep Q-network (DQN)-based model to solve the discrete dynamic berth allocation problem (DDBAP) under uncertain ship arrivals and variable loads. The model achieved a 58.3% reduction in total vessel waiting time compared to traditional algorithms such as ACO while emphasizing the computational demands and data quality requirements for reinforcement learning-based solutions. Rodrigue and Agra [18] proposed a stochastic berth scheduling model, optimizing port operations by considering uncertainty factors such as weather conditions, suitable for high-variability port environments. Xu [19] introduced a multi-objective berth and crane scheduling model, optimizing port operational costs, environmental benefits, and work efficiency using an improved immune particle swarm algorithm, demonstrating strong capability in balancing multiple objectives. Cheimanoff et al. [20] studied the impact of tidal conditions on berth allocation, proposing an improved variable neighborhood search (VNS) algorithm to address the dynamic continuous berth allocation problem under tidal constraints. Lin et al. [21] investigated the impact of berth priority settings on port efficiency, building a multi-objective optimization model that shows how rational priority strategies can enhance port operational efficiency and resource utilization. Chu et al. [22] proposed a mixed-integer programming model that simultaneously optimizes berth allocation and quay crane scheduling, with the objective function incorporating the minimization of vessel queuing time. Through case studies, it was demonstrated that reducing queuing time directly decreases port congestion costs (by improving operational efficiency) while optimizing resource utilization. Yang et al. [23] proposed a multi-objective optimization model for waterway-berth collaborative scheduling in Yangtze River ports, addressing conflicts in port operations by balancing berth deviation costs, total scheduling time, and berth utilization. They demonstrated the applicability of an enhanced NSGA-III algorithm in port scheduling, offering theoretical insights for improving operational efficiency and resource coordination in inland port logistics.
In recent years, the collaborative optimization of berth allocation and shore power distribution has attracted widespread attention. Research has shown that optimizing both berth allocation and shore power supply can significantly improve port operational efficiency and reduce fuel consumption and emissions from vessels. For instance, Chang et al. [24] proposed a mixed-integer linear programming model that optimizes the allocation of berths and shore power resources, reducing ship waiting times while optimizing energy consumption. Wang et al. [25] used a two-layer mixed-integer linear programming model incorporating environmental taxes for emissions from tugs and ships to address dynamic berth preferences and collaborative scheduling of berthing and towing assistance in container terminals. The results showed a 21.73% total cost reduction and a 33.88% environmental improvement compared to traditional scheduling methods through optimized resource allocation and shore power utilization. Peng et al. [26] proposed a method for the collaborative optimization of berths and shore power by balancing the system costs and environmental benefits, demonstrating the emission reduction potential and economic value of this strategy. Mo et al. [27] proposed an energy–logistics collaborative optimization method to fully utilize the potential of port-integrated energy systems. A logistics–energy system model was established by analyzing the operational characteristics of logistics systems and their energy consumption patterns, considering constraints such as ship operational statuses and power balances. Zhang et al. [28] combined berth allocation and shore power optimization, aiming to enhance the economic and environmental benefits of port energy systems by considering uncertainty. The study emphasized the potential of microgrids and shore power technology in reducing port operational costs and pollution emissions. Yue et al. [29] developed a hybrid algorithm that demonstrates the potential applications of berth allocation and shore power scheduling optimization in complex port operations. These studies demonstrate that the collaborative optimization of berths and shore power can reduce ship waiting times and fuel consumption while balancing environmental protection and economic benefits, thus helping the port industry move toward low-carbon and high-efficiency development. Wang et al. [30] conducted an Apriori algorithm-based analysis of 18,724 ship records and 6551 berths in China, identifying significant disparities in shore power utilization across vessel tonnage, types, and regions. The study proposed tailored strategies to address barriers to shore power adoption and projected substantial emission reductions through optimized shore power usage patterns.
The literature summary is presented in Table 1.Although existing research has extensively explored the collaborative optimization of shore power and berth allocation, there are still gaps. Most studies focus on cost and environmental goals without addressing port operations comprehensively. Moreover, existing models fail to account for the effects of vessel waiting times and weather conditions on the optimization of shore power and berth allocation, leading to potential deviations in real-world implementations.

Table 1.
Summary of related studies.
This paper addresses this gap by proposing a novel multi-objective optimization model for shore power allocation and berth scheduling. The model integrates three key objectives: environmental impact (emission reduction), economic costs (energy costs and operational efficiency), and operational goals (waiting times and berth availability). Unlike previous studies, our model explicitly incorporates operational uncertainties, such as weather disruptions and variable vessel docking times, providing a more comprehensive and realistic optimization framework. The optimization is solved using the advanced NSGA-III algorithm, tailored to handle the multi-objective nature of the problem. This approach represents a significant innovation in the field by offering a robust decision-making tool for port managers aiming to enhance sustainability while improving operational efficiency.
The structure of this paper is organized as follows: Section 2 elaborates on the construction of the multi-objective collaborative optimization model, including problem description, model assumptions, objective functions, and constraints, while introducing the NSGA-III algorithm framework and its improvement strategies. Section 3 analyzes the impact mechanisms of shore power connection quantity and docking speed on port economic costs, pollutant emissions, and operational efficiency through simulation experiments. Section 4 comprehensively discusses the synergistic effects and applicability boundaries of optimization strategies, proposing differentiated shore power allocation schemes and management recommendations. Section 5 summarizes the research conclusions, highlights the limitations of the current model, and outlines future research directions. The framework integrates theoretical innovation with practical guidance, providing decision-making support for intelligent scheduling in green port development.
2. Materials and Methods
2.1. Mathematical Model
2.1.1. Problem Description
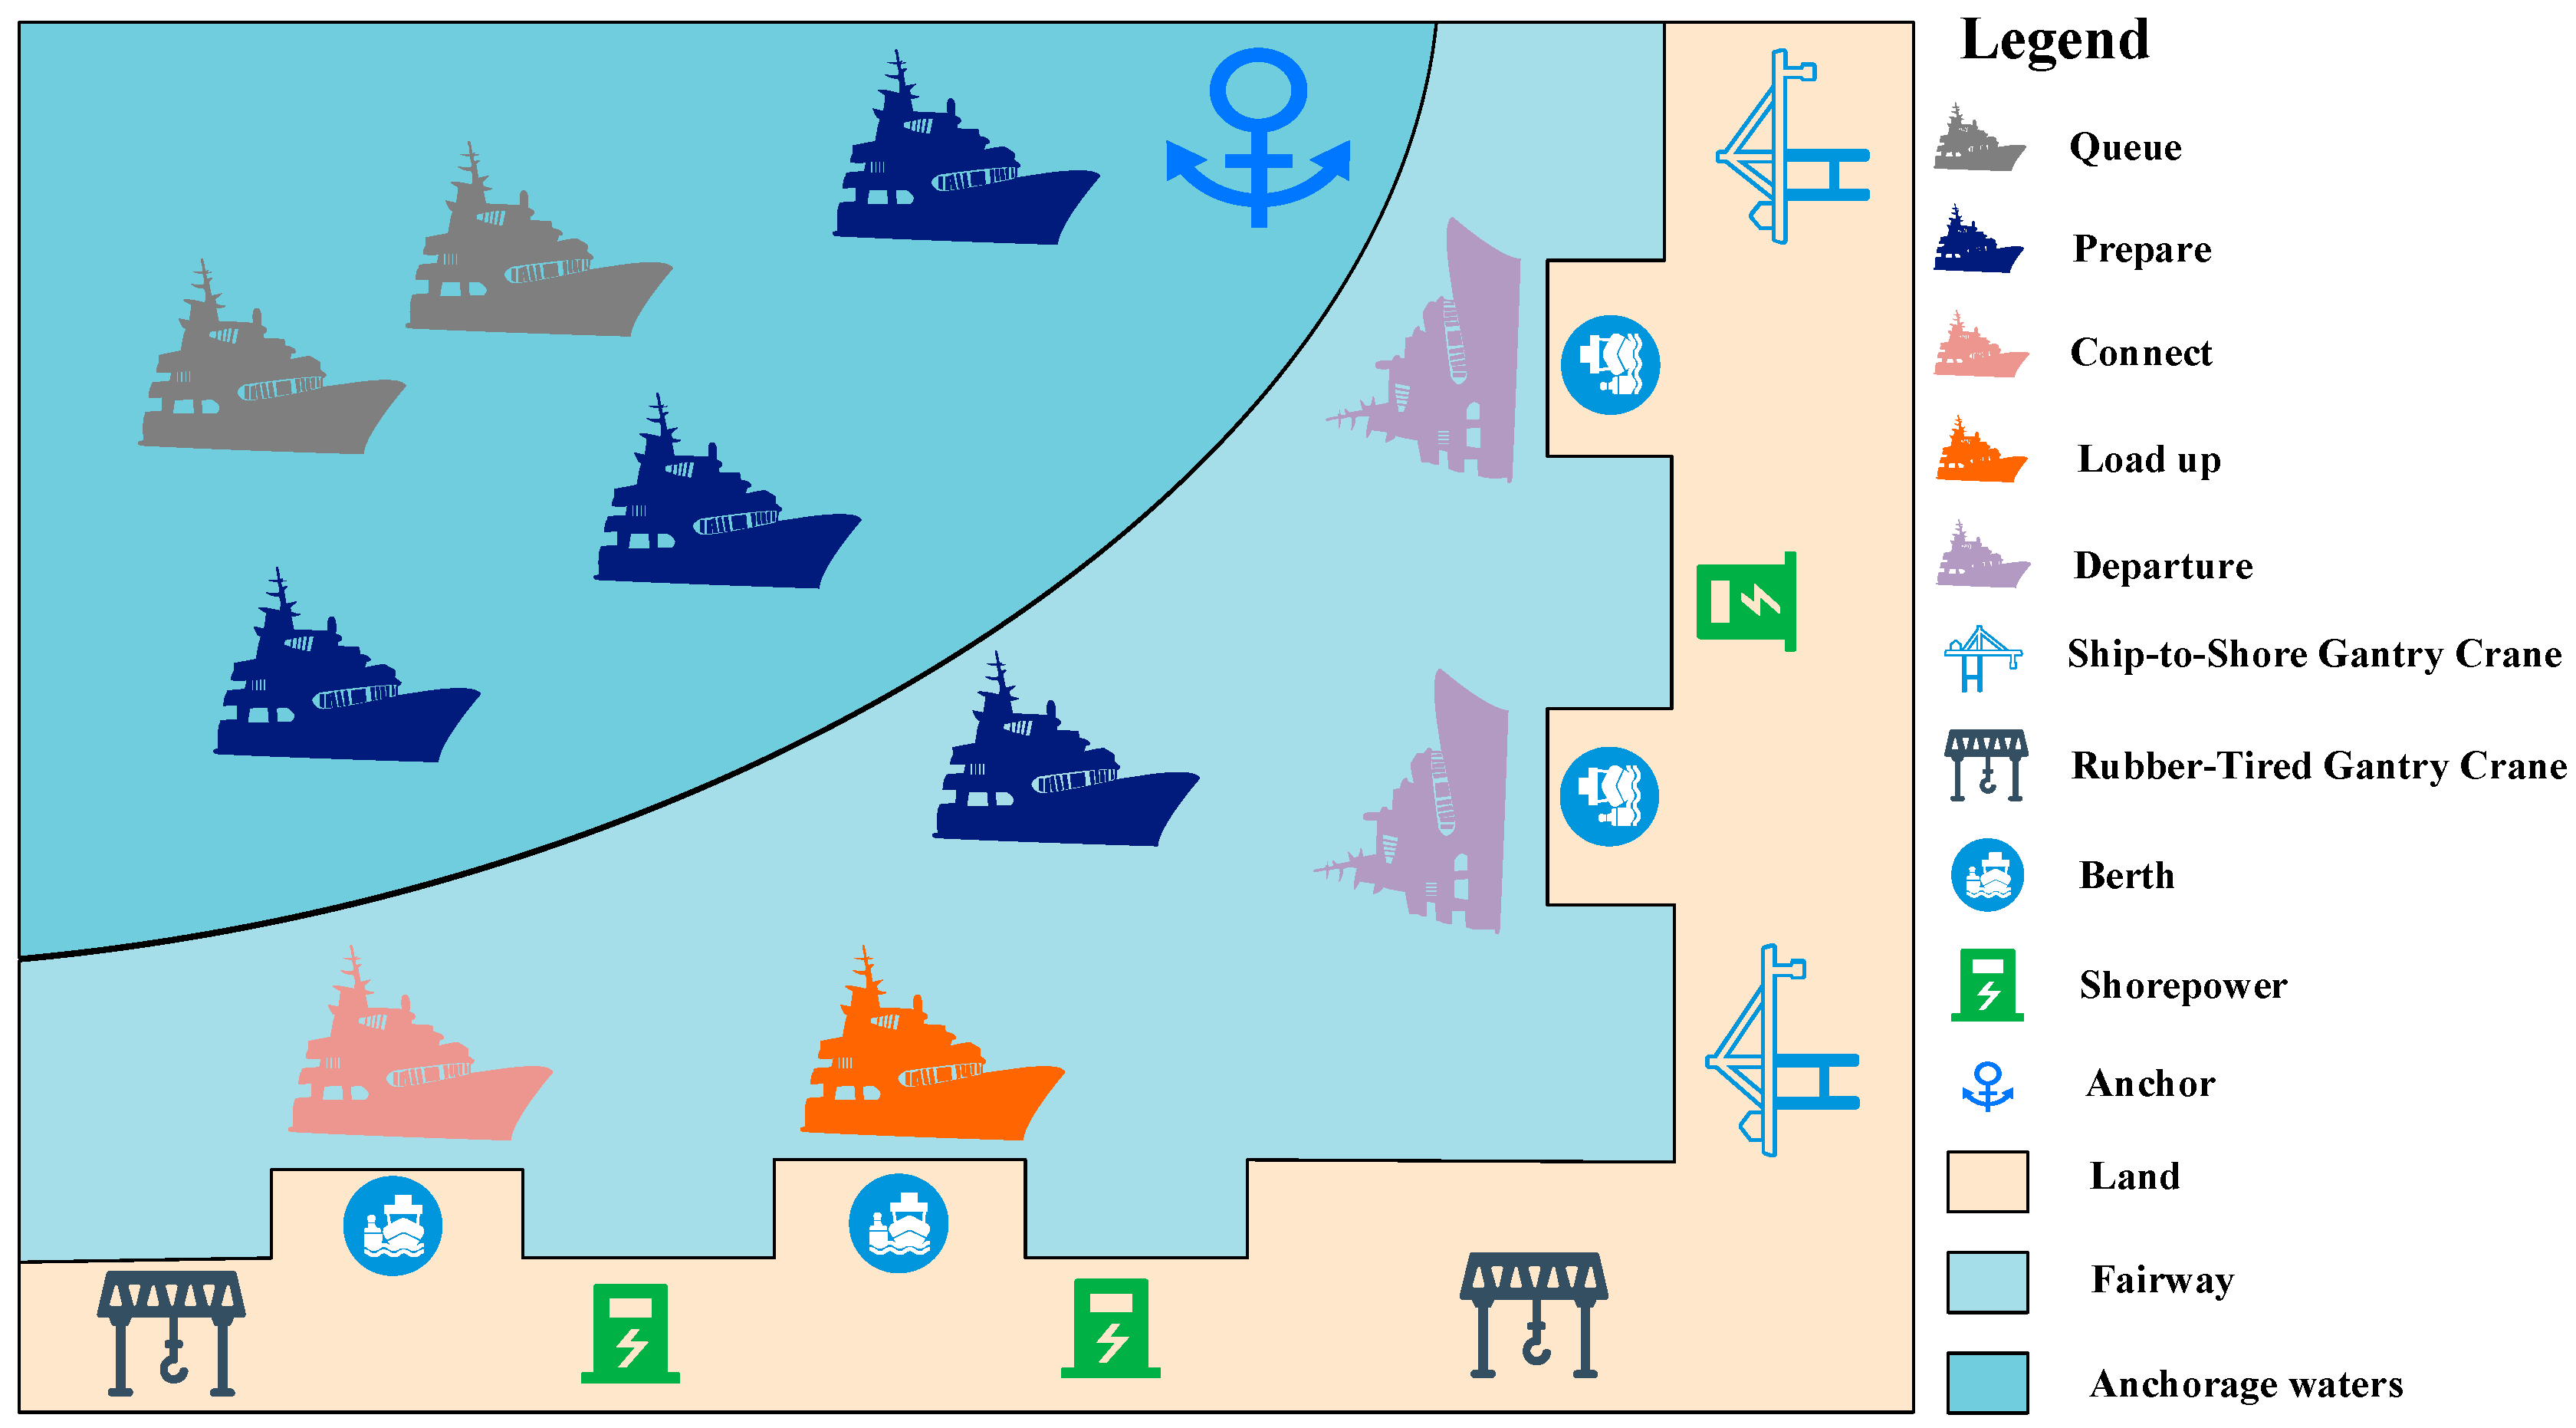
Building upon the continuous berth allocation problem, this study considers the allocation of shore power to ships. Ships exhibit a certain preference for berths due to the compatibility of cargo in the yard and the adaptability of loading and unloading equipment. The process flow of ships in the port is depicted in Figure 2. Upon arrival at the port, ships first wait at the anchorage. If the preferred berth is available, the port arranges for the ship to dock and simultaneously coordinates the loading and unloading equipment for cargo operations, while also considering whether to allocate shore power to the ship. If the preferred berth is not available, the availability of alternative berths is assessed. If alternative berths are free, the ship continues to wait at the anchorage. After completing the loading and unloading operations, the ship departs from the port. The docking position and time of the ship have a significant impact on the cost of shore power usage and the ship’s emissions. Therefore, how to allocate berths to ships is closely related to the efficiency of shore power utilization.
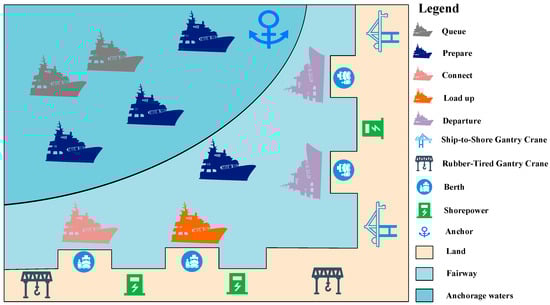
Figure 2.
The entire operational process of the ship.
The focus of the study encompasses three main parts: (1) the configuration of shore power; (2) the configuration of ships; (3) the utilization of shore power. During the ship’s berthing operation, auxiliary engines on the ship consume fuel to provide electricity, resulting in the emission of pollutants and noise. The use of shore power in ports can effectively reduce the emission of ship pollutants. Specifically, when shore power is not allocated to a ship, auxiliary generators must be used to supply power to the ship. The diesel consumption is given by Equation (1).
In the equation, represents the diesel consumption of ship ; denotes the load factor of the ship’s auxiliary engine; indicates the engine power of the ship i; refers to the diesel consumption rate of the ship’s auxiliary engine; and is the working time of the ship at the berth.
The emissions from the auxiliary generator are given by Equation (2).
In the equation, represents the pollutant emission quantity of ship ; denotes the pollutant emission coefficient.
When a ship is allocated shore power, the electricity consumption of the ship is given by Equation (3).
In the equation, represents the amount of electricity consumed by ship .
2.1.2. Model Assumptions
- (1)
- The navigation channel has sufficient width and depth to provide for navigation; hence, tidal issues do not need to be considered.
- (2)
- The arrival time of the ships is known, and the disturbances to the ships from unexpected accidents are not considered.
- (3)
- All incoming vessels have been retrofitted or equipped with shore power connection devices, and the berths can provide shore power to all ships.
2.1.3. Notation Definition
In Table 2, we define some notations used in this section to describe the cooperative optimization model.
Table 2.
Notations.
2.1.4. Objective Functions and Constraints
Objective1:
Objective2:
Objective3:
Constraints:
Equation (4) represents the objective function , which aims to minimize the cost of shore power usage and ship waiting costs. Equation (5) represents the objective function , indicating the pollutants emitted by ships while working at the berth. Equation (6) represents the objective function , indicating the waiting time of ships while working at the berth; queuing time is highly correlated with port operational efficiency [22]. Equation (7) represents the waiting time for each ship. Equations (8)–(12) are spatial and temporal constraints for the ships. Equation (13) indicates that all ships can only stop at one berth. Equation (14) represents the constraint on the number of shore power supplies. Equation (15) and Equation (16) calculate the consumption of diesel and electricity, respectively. Equation (17) represents the waiting cost of ships, including the deviation cost of ships, the waiting cost at anchorage, and the demurrage cost. Equation (18) represents the cost of using shore power. Equation (19) represents the actual working time at the berth under different weather conditions. Equation (20) represents the connection time of shore power.
2.2. NSGA-3 Optimization Algorithm
Multi-objective optimization aims to achieve the best possible outcomes for multiple objectives within a given region, where no single global optimal solution exists. The Non-dominated Sorting Genetic Algorithm (NSGA) is an effective method for addressing multi-objective optimization problems. NSGA-II selects individuals within the same non-dominated rank using crowding distance, which helps preserve non-inferior solutions effectively [31]. However, when dealing with problems involving three or more objectives, the solutions obtained using the crowding distance method often exhibit uneven distribution across the non-dominated layers, leading the algorithm to potentially become trapped in local optima. Therefore, this study adopts the reference point-based Non-dominated Sorting Genetic Algorithm (NSGA-III), which maintains population diversity by introducing predefined reference points.
2.2.1. Adaptive Normalization Process
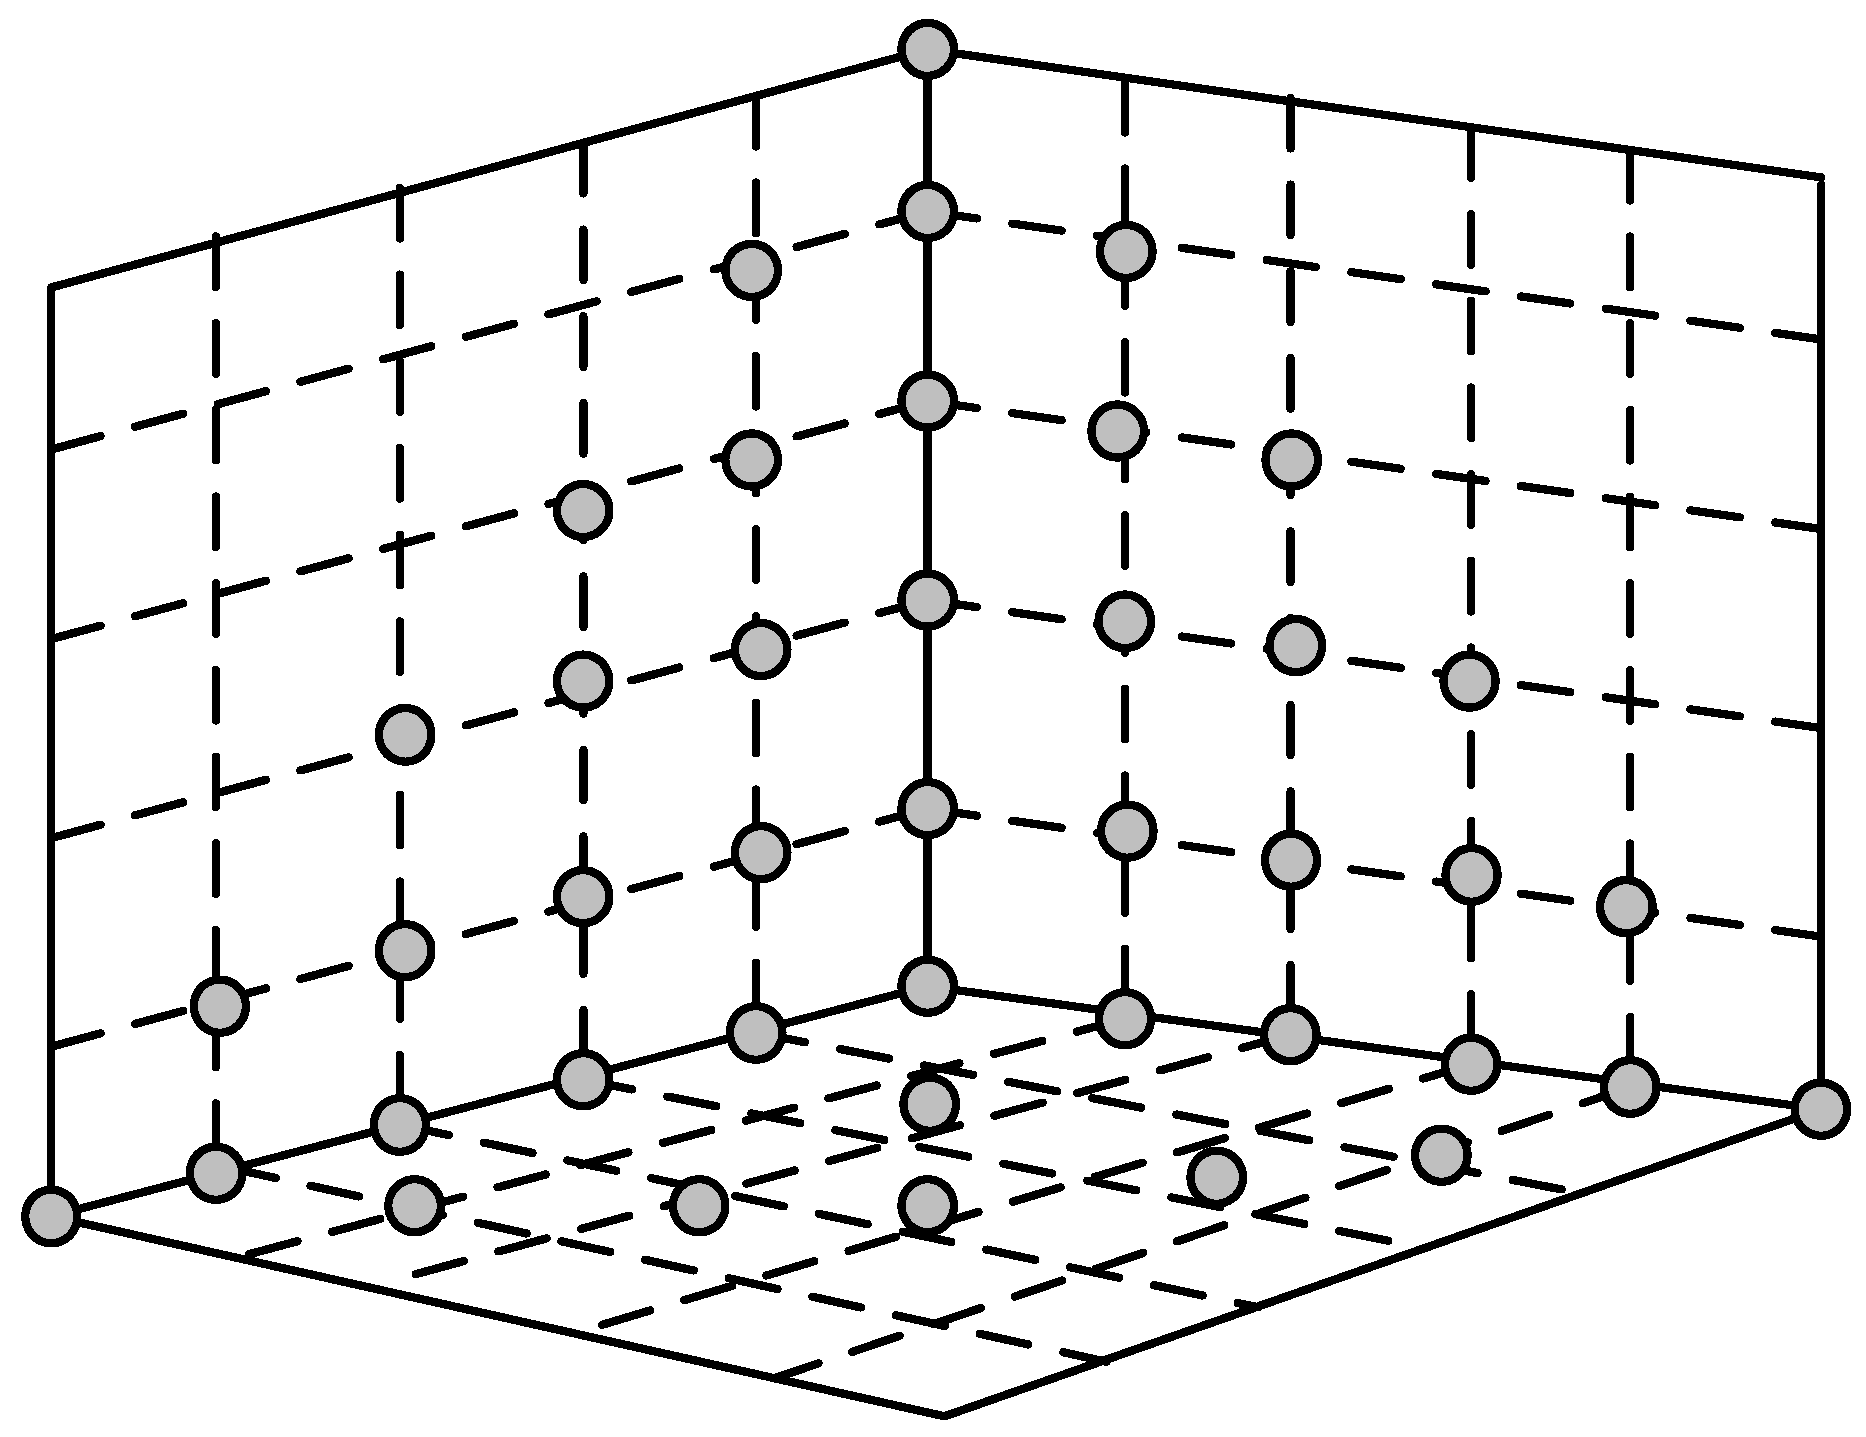
NSGA-III introduces reference points to enhance the execution of the elitist preservation strategy, as shown in Figure 3. This approach ensures a more uniform distribution of solutions within the objective space. The number of reference points generated depends on the dimension of the objective vector and another positive integer . Assuming represents the number of optimization objectives, and each objective is divided into parts, the calculation formula for the number of reference points is provided in Equation (21).
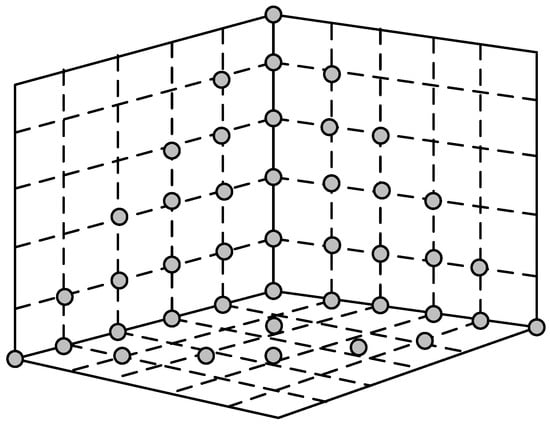
Figure 3.
Illustration of reference points.
In practical multi-objective optimization problems, the dimensions, units, and value ranges of different objectives can vary significantly. To enable a fair comparison among different optimization objectives, normalization is necessary. The normalization process is outlined as follows:
(1) Standardization: First, the ideal point is determined by selecting the minimum value of each objective function within the current population. Subsequently, the value of each objective function for every individual is adjusted by subtracting the corresponding value of the ideal point. This standardizes the objective functions, as illustrated in Equation (22):
(2) Calculating Extreme Points Using the ASF function: The number of extreme points in the population corresponds to the number of optimization objectives. For the dimension, the extreme point is characterized by a significantly large value in the objective function, while the values in other objective functions are relatively small. By applying the ASF function as shown in Equation (23), the extreme points for each dimension are identified by traversing the population to determine the corresponding extreme points for each objective .
(3) Constructing the Hyperplane Based on Extreme Points: Using these extreme points, a hyperplane is constructed. The intersection points of this hyperplane with the coordinate axes represent the intercepts . The hyperplane is illustrated in Figure 4.
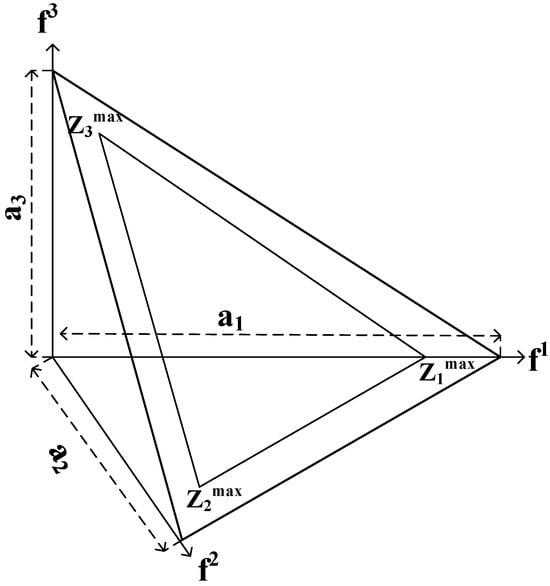
Figure 4.
Illustration of the hyperplane.
(4) Normalization of Objective Functions: Finally, the objective functions need to be normalized based on the calculated results, as shown in Equation (24).
2.2.2. Association Method Between Population and Reference Points
The NSGA-III algorithm uses the method of associating individuals with reference points to measure the uniformity of the objective space. The steps for associating individuals with reference points are outlined as follows:
- (1)
- Drawing Reference Lines: Each reference point is connected to the origin to form reference lines . For an optimization problem with objectives, there will be reference points, resulting in reference lines.
- (2)
- Calculating the distance between individuals and reference lines: For each individual in the population, the distance to each reference line is calculated using Equation (25).
- (3)
- Determining the Reference Point for Each Individual: For an individual , if its shortest distance is to the reference line, then individual is considered to belong to the reference point, as shown in Equation (26):The distance from individual to the reference line can then be calculated using Equation (27):
- (4)
- Repeat the above steps for all individuals in the population. After completing this process, the association between the population and the reference points is established.
2.2.3. Niche Preservation Operation
After associating the population with reference points, the number of individuals linked to each reference point varies. The number of individuals associated with a reference point is defined as the niche size of the reference point. The niche preservation operation is as follows:
- (1)
- Determine candidate reference points
Based on the niche size of each reference point, identify the set of reference points with the smallest . If there is only one reference point with the smallest , it is selected as the candidate reference point. If multiple reference points share the smallest , one is randomly selected as the candidate reference point.
- (2)
- Select individuals associated with the reference point to add to .
Based on Equation (28), select the set of individuals associated with reference point from the non-dominated individual set at level :
If is an empty set, remove it from the reference point set. If is not empty, further calculations are needed. If , select the individual closest to reference point from set and add it to . If , randomly select one individual from set and add it to .
- (3)
- Update Relevant Parameters
In step 2, if the set is not empty, the parameters need to be updated as follows:
The number of individuals in set associated with reference point increases by 1, and the individual is removed from the -level non-dominated set .
If the set is empty, the reference point is removed from the reference point set:
Since no individuals are added to set , , , and do not need to be updated.
- (4)
- Repeat the above steps until , completing the niche preservation operation.
2.2.4. NSGA-III Algorithm Implementation Steps
- (1)
- Determine population size and initialize the population: Set the population size and generate the initial population.
- (2)
- Establish the ideal point: Normalize the objective values for all individuals, calculate the extreme points, construct the hyperplane, and determine the reference points.
- (3)
- Perform non-dominated sorting on the population: Rank individuals based on their dominance levels.
- (4)
- Apply genetic operators: Use genetic operators to perform selection, crossover, and mutation, generating an offspring population of size .
- (5)
- Merge populations: Combine the parent and offspring populations to form a new population of size . Conduct a fast non-dominated sorting to establish dominance levels.
- (6)
- Select individuals for the next generation: Sequentially add individuals to the next generation population based on non-dominated levels in ascending order until the population size reaches . At this point, the current non-dominated level is .
- (7)
- Select individuals from level : In most cases, not all individuals from level can be included in the population . A portion of individuals from level must be selected to fill the population. First, associate individuals from levels 1 to with reference points. Then, identify the reference point with the fewest associated individuals from levels 1 to . Finally, select an individual from level associated with that reference point and add it to the population. Repeat this process until the size of the population reaches . Replace the current population with .
- (8)
- Repeat steps 4 to 8: Continue repeating steps 4 through 8 until the predetermined number of generations is reached. The final Pareto optimal solutions are obtained, and the optimized solution can be derived by decoding the solution set.
The solving steps are illustrated in Figure 5.
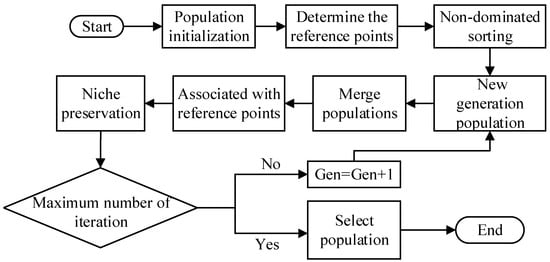
Figure 5.
NSGA-III process flow.
3. Results
3.1. Parameter Settings
This section conducts an experiment using a continuous berth container terminal as an example. The basic parameters of the terminal include berths, channels, and arriving vessels.
The terminal plans to install shore power systems at some berths to reduce pollutant emissions. Terminal operators need to determine at which berths to install the shore power systems. Therefore, the following conducts experiments that take the data of ships, times, emission coefficients, and energy prices as input parameters.
3.1.1. Ship Parameters
A simulation for 20 ships is conducted in the port, using data such as shore power systems, vessels, berths, emission coefficients, and energy prices as input parameters for the experiment. The arrival times, economic penalty costs, and generator powers of the 20 ships are presented in Table 3 [32,33,34].
Table 3.
Ship parameters.
3.1.2. Emission Coefficients and Energy Prices Parameters
According to the “Technical Standard for Shore-to-ship Power Supply System Engineering” (Ministry of Transport of China, 2018) [35], high-voltage shore power systems are adopted in this paper. Upon inquiry, the maximum auxiliary power of a ship is 2700 kW, and the load coefficient of the auxiliary engines is 0.5.
According to the Chinese fuel market, the average price of diesel is 3805.2 CNY/ton, and the cost of using shore power is 0.9546 CNY/kWh. There is no unified pricing policy for the equivalent values of diesel, electricity, natural gas, and liquefied natural gas, which are 0.95, 0.95, 2.18, and 2.18, respectively [29].
3.1.3. Time Parameters
The time parameters involved in this paper mainly include the ship’s arrival time at the port, the loading/unloading service time, and the time difference to the berth.
The arrival time of ships at the port is typically assumed to follow an exponential distribution, which is a type of continuous probability distribution commonly used to describe the time intervals between independent random events. The main characteristic of the exponential distribution is its memorylessness, meaning that the probability of an event occurring in a future time period is not affected by past events. The independence and randomness of ship arrival times align with the properties of the exponential distribution, making it a common choice for modeling the time intervals between ship arrivals. Additionally, the parameter of the exponential distribution, which is the average rate of occurrence, can be used to describe the average frequency of ship arrivals. In practical applications, the assumption of an exponentially distributed interarrival time for ships helps port managers with berth planning and resource scheduling.
The loading/unloading service time refers to the time required for a ship to load and unload cargo at the port, while the berthing time difference typically refers to the time difference between a ship’s departure from the anchorage and its arrival at the berth. Both of these processes are influenced by a variety of factors, such as weather, equipment performance, and the efficiency of the operating personnel. Each of these factors may not be normally distributed, but due to the Central Limit Theorem, when there are enough of these factors and they are independent of each other, their sum tends towards a normal distribution. The normal distribution is very common in statistics, suitable for describing continuous variables, and widely applied in both natural and social sciences research. The assumption of a normal distribution for loading/unloading service times aids in statistical analysis and forecasting, thereby optimizing port operations.
3.2. Results and Analysis
By setting the population size to 200 and the number of iterations to 600, the obtained Pareto optimal solutions are shown in Figure 6.
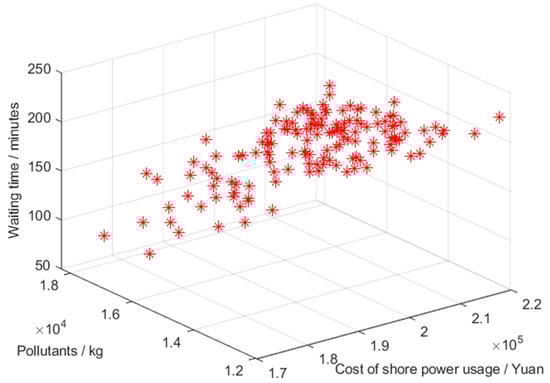
Figure 6.
Pareto optimal solutions.
The top 10 solutions in the Pareto optimal set are listed in Table 4.
Table 4.
Top 10 solutions in the Pareto optimal set.
Based on the table data, the optimal solution was determined: shore power is provided to vessels 1, 4, 7, 13, and 20, docked at berths 1, 3, 6, 5, and 4, respectively. This solution was compared in detail with the non-optimized solution (which employs random selection for shore power and berth connections), as shown in Table 5. The results indicate that under the optimized solution, shore power usage costs increased by 1.56%, pollutant emissions decreased by 7.31%, waiting time slightly increased by 1.11%, and solution correlation significantly improved by 11.46%.
Table 5.
Comparison of data between the optimized solution and the original solution.
For ports and shipping companies, the primary goal is to achieve greater economic benefits and operational efficiency while keeping costs under control. However, as environmental issues gain increasing attention from society, operators must consider environmental impacts alongside economic development, requiring a balance between economic and environmental benefits.
3.3. Number of Shore Power Connections
To determine the optimal configuration of the shore power system, the number of shore power connections is set to 8, 10, and 12. The results are shown in Table 6, and the relationship between the objective functions and the number of shore power connections is illustrated in Figure 7, Figure 8 and Figure 9.
Table 6.
Results for each scenario.

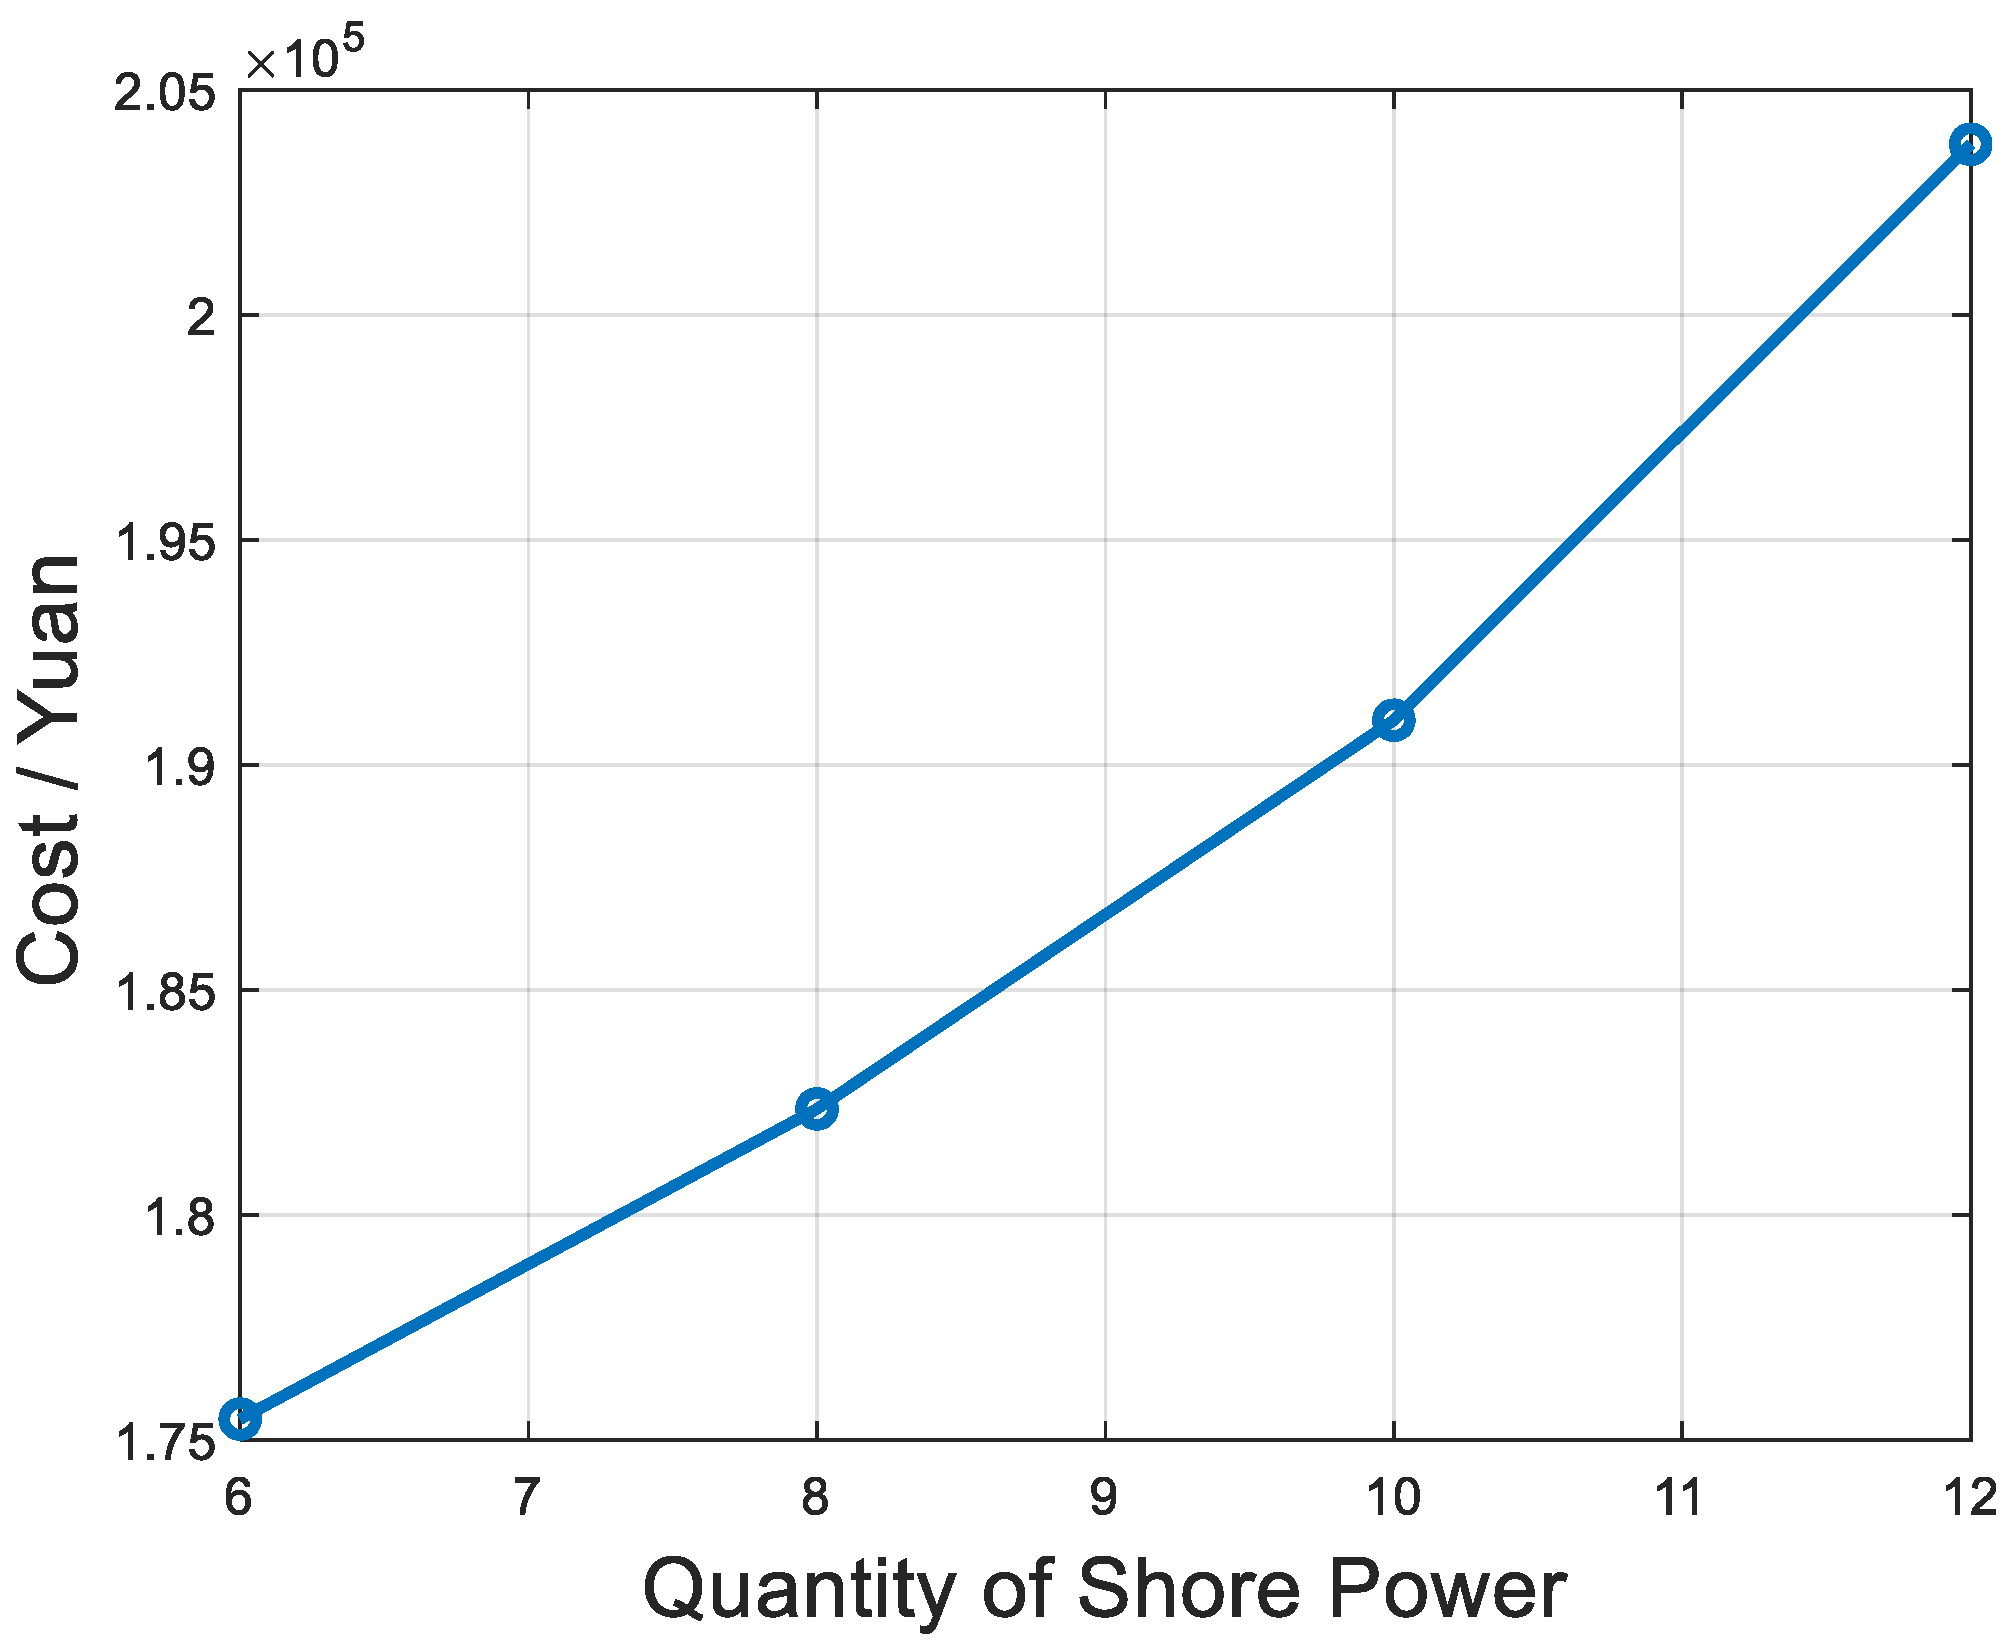
Figure 7.
Quantity of shore power changes in shore power costs.
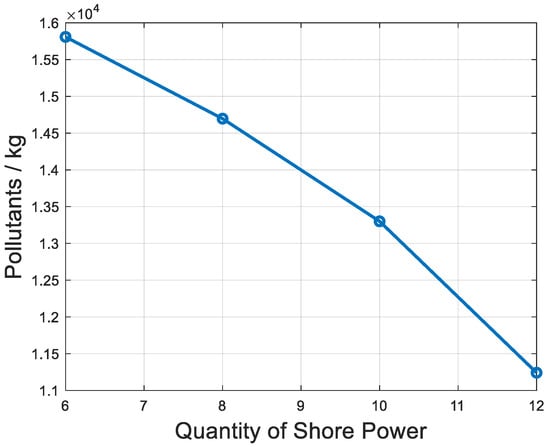
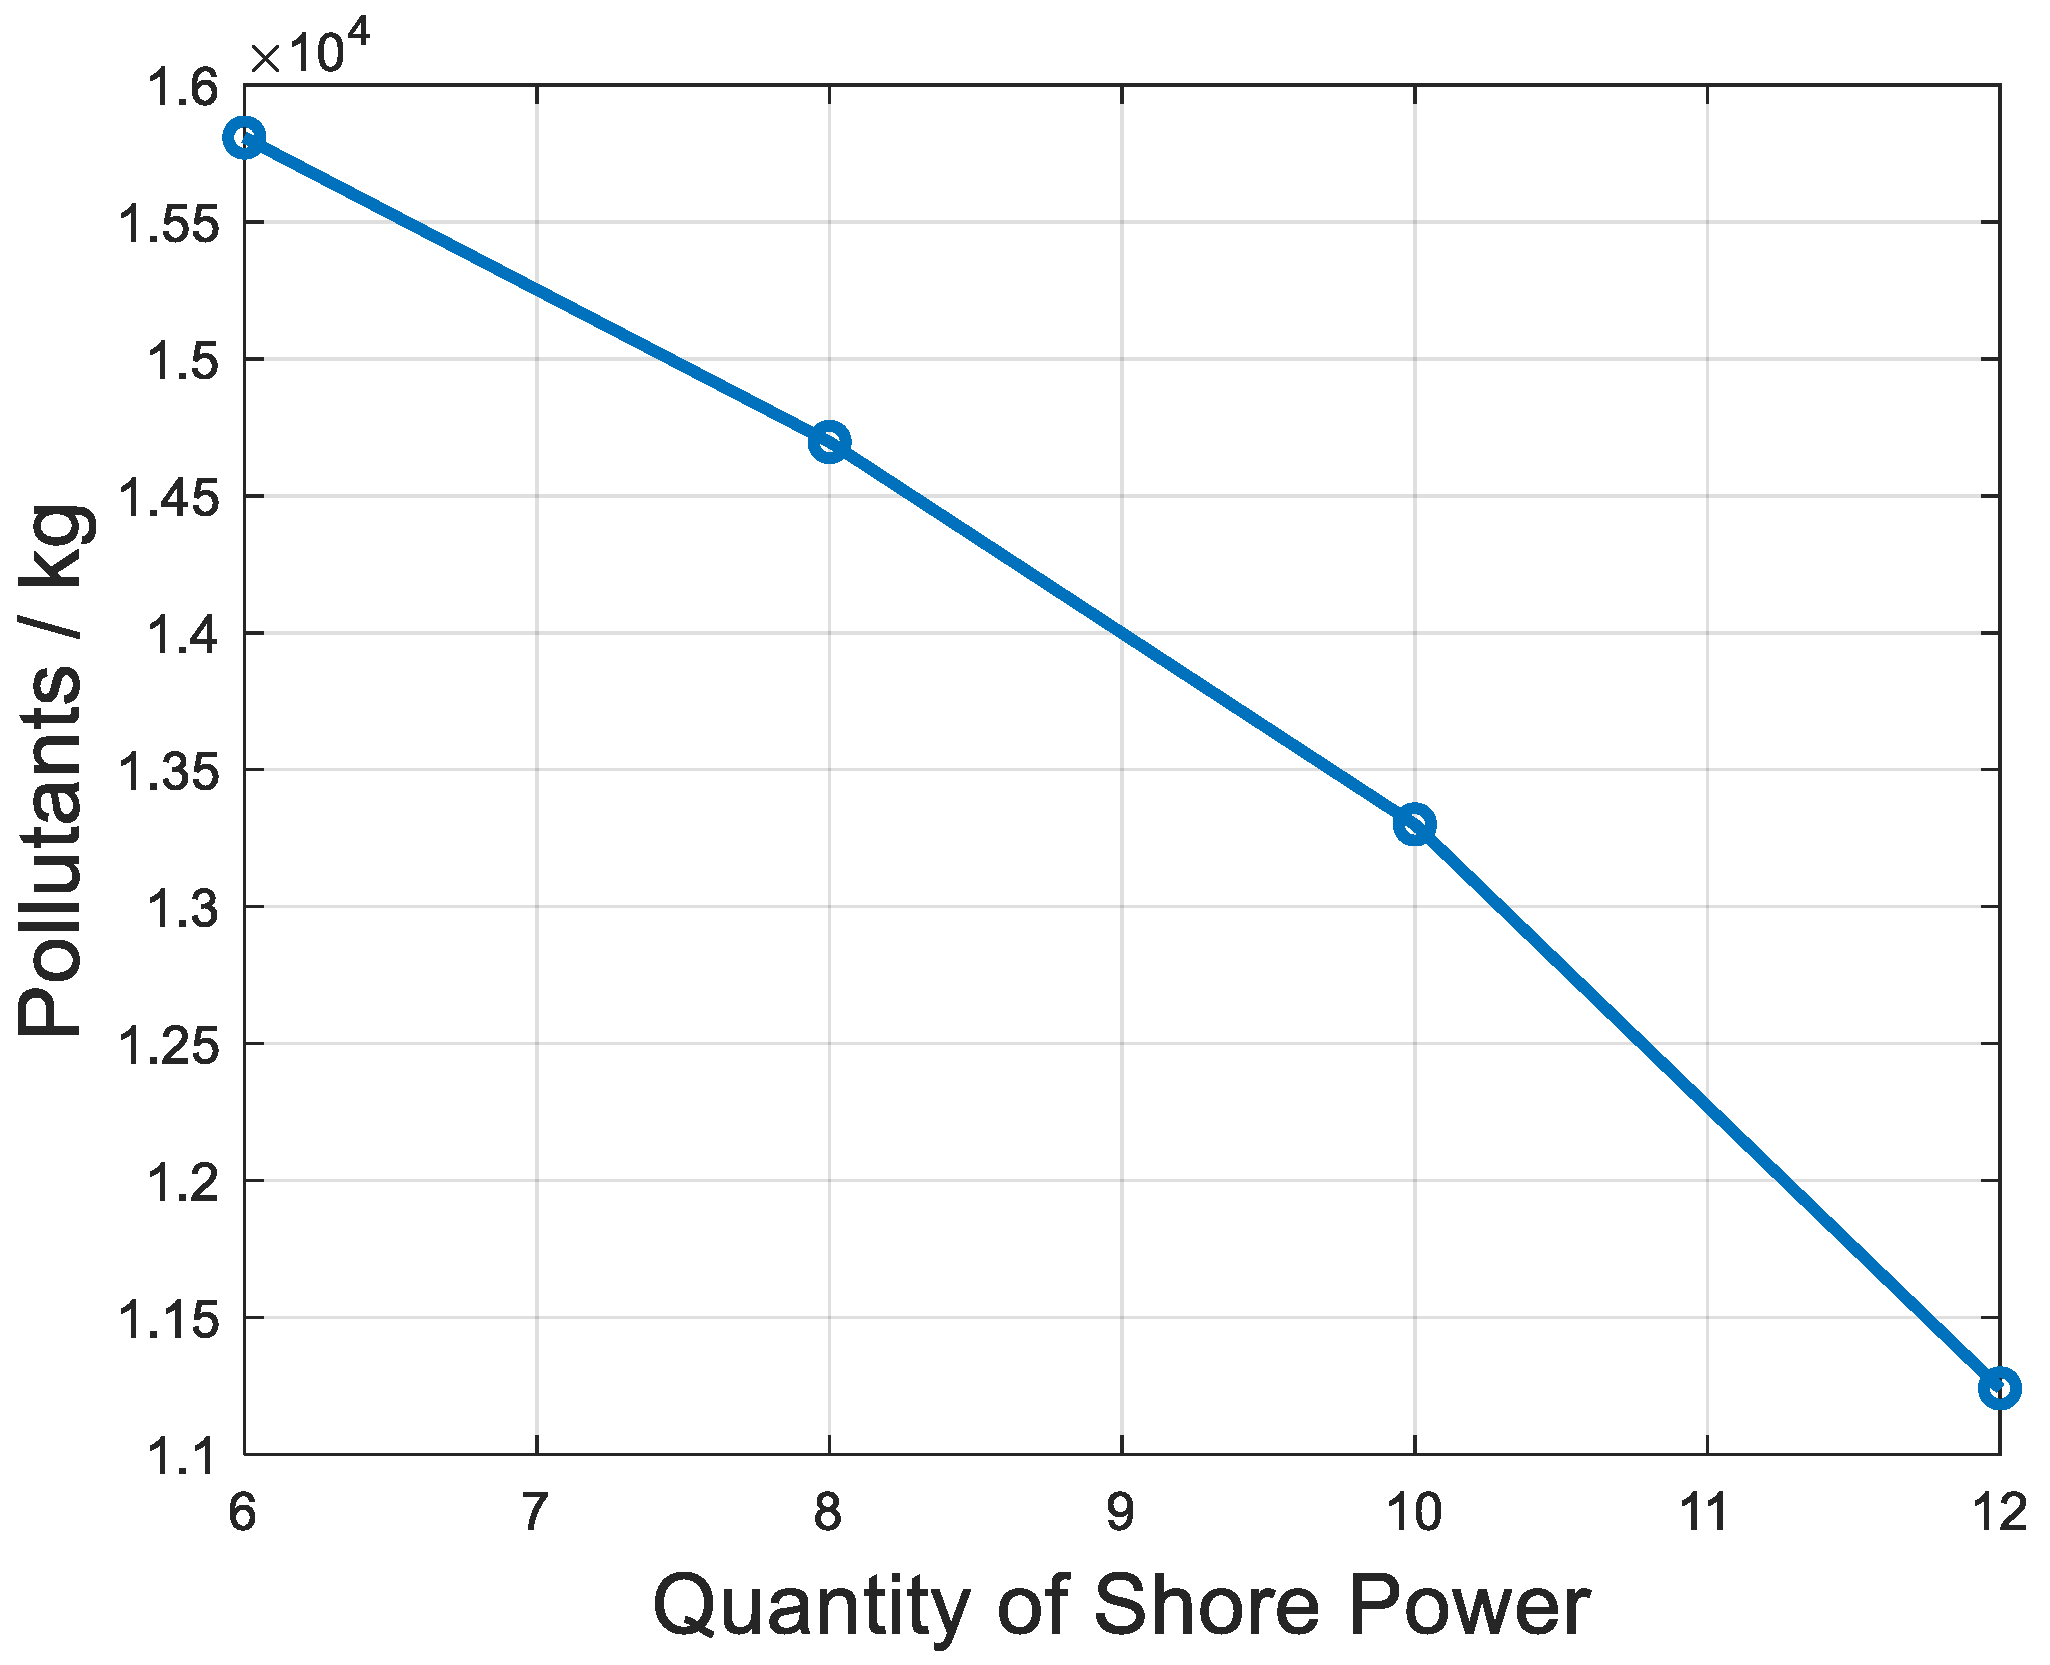
Figure 8.
Quantity of shore power changes in pollutant emissions.
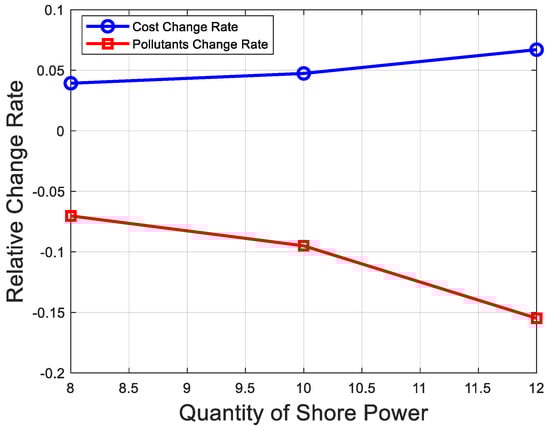
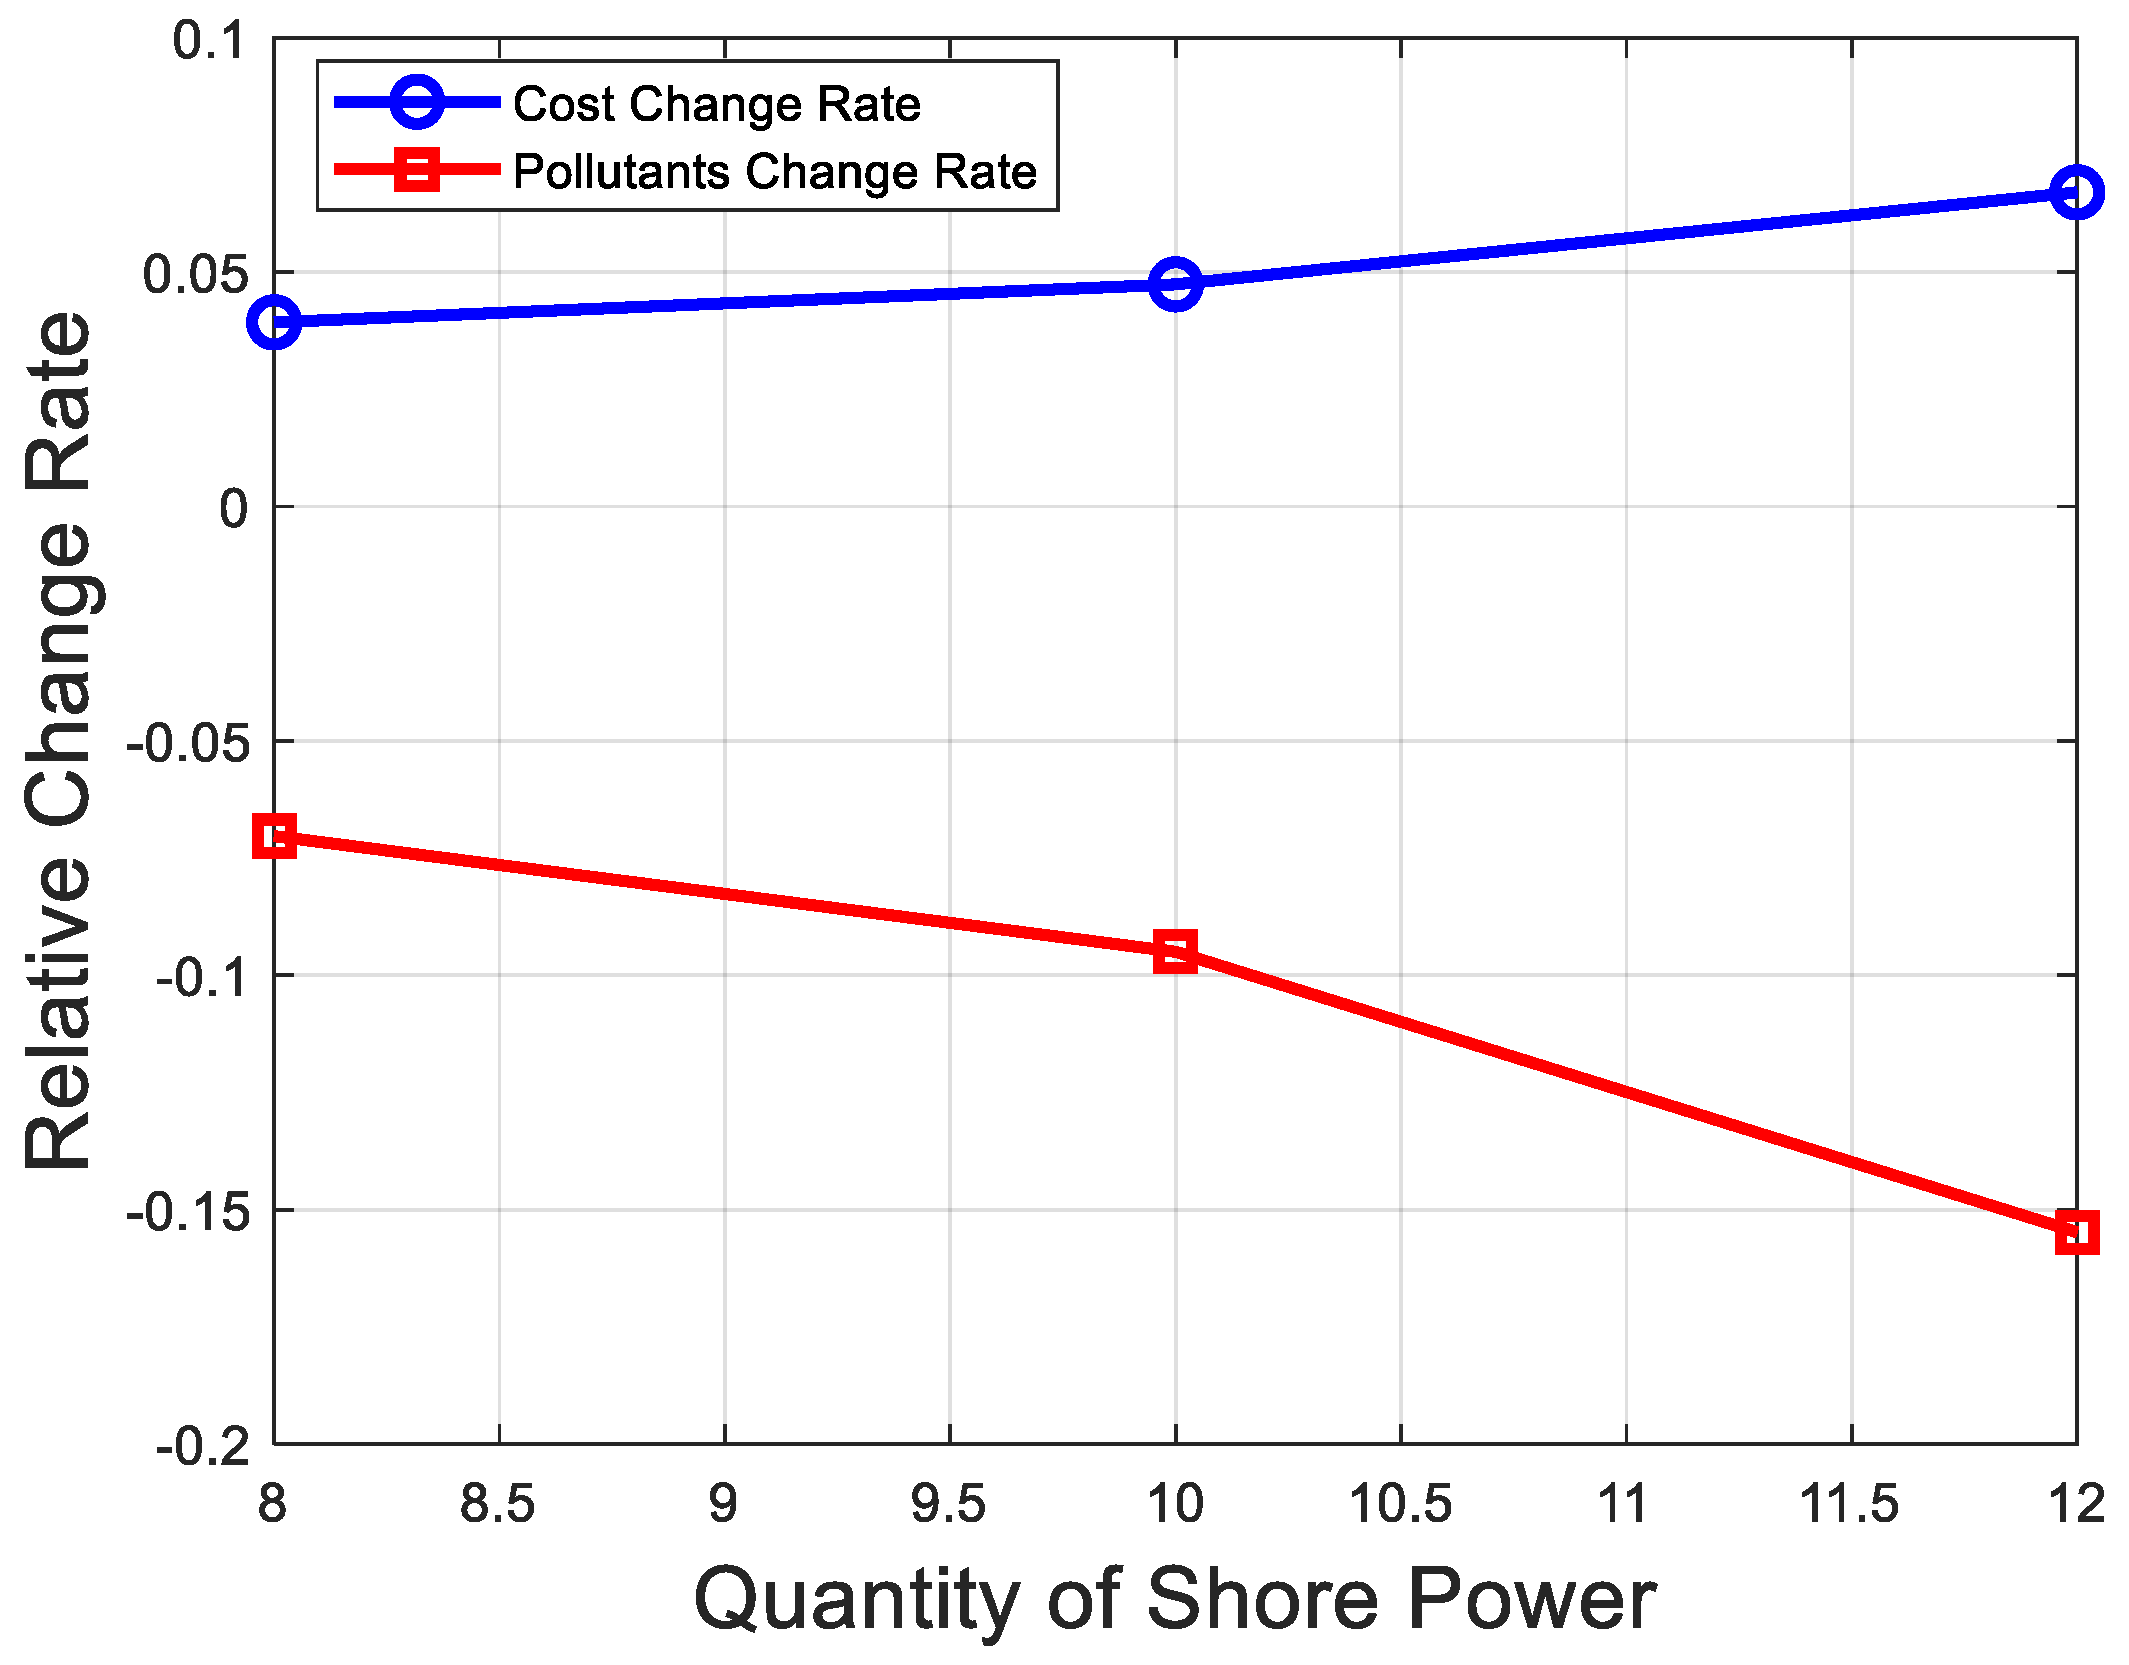
Figure 9.
Quantity of shore power relative changes in costs and pollutants.
The data reveal that as the number of shore power connections increases from 6 to 12, pollutant emissions decrease substantially, from 15,807.48 kg to 11,241.45 kg, yielding a significant reduction of 28.9%. This underscores the strong environmental benefits of expanding shore power infrastructure, as it directly reduces reliance on auxiliary diesel engines, a primary source of port-related emissions such as CO2, NOx, and SOx. However, this environmental gain comes with a financial trade-off, as costs rise from 175,467.69 CNY to 203,801.53 CNY, reflecting a 16.2% increase driven by higher electricity consumption and infrastructure maintenance. A comprehensive analysis highlights that setting the number of shore power connections to 80% of the total berths (i.e., 10 connections for the current 12 berths) achieves an optimal balance across cost, pollutant emissions, and waiting time. At this level, pollutant emissions drop to 13,352.17 kg—a 15.54% reduction from the 6-connection baseline—approaching the environmental performance of 12 connections while maintaining cost efficiency. The cost rises to 191,081.87 CNY, an 8.88% increase over 6 connections, which is notably lower than the 16.2% surge seen with 12 connections, reflecting a more controlled financial burden. Waiting time, however, increases to 257.01 min, a 35.39% rise from the 189.84 min at 6 connections, yet this is significantly less severe than the 61.9% jump to 307.31 min at 12 connections. This moderate increase in waiting time suggests that 10 connections avoid the excessive operational inefficiencies—such as berth congestion or scheduling delays—that emerge at higher connection levels. Thus, for a port with 12 berths, configuring shore power connections at approximately 80% of the berth total emerges as the optimal choice. This configuration not only delivers substantial environmental benefits but also ensures economic feasibility and operational practicality, offering a scientifically grounded framework for sustainable port development. Additionally, this ratio could serve as a scalable benchmark for ports of varying sizes, provided adjustments are made for berth utilization rates and vessel traffic patterns.
The increase in shore power usage undeniably elevates port costs, as electricity and infrastructure expenses scale with the number of connections; however, the corresponding reduction in pollutant emissions is far more pronounced, both in magnitude and societal value. As shore power adoption grows from 6 to 12 connections, the 28.9% drop in emissions far outpaces the 16.2% cost increase, suggesting that the environmental return on investment justifies the financial outlay, particularly when factoring in long-term benefits like improved air quality and compliance with stringent emissions regulations (e.g., IMO 2020 sulfur caps). This trend becomes increasingly evident as the system scales: while costs rise linearly, pollutant reductions exhibit a diminishing but still impactful return, emphasizing the shore power system’s role as a cornerstone of green port initiatives. Enhancing shore power usage thus has a clear and positive effect on environmental protection, reducing emissions that contribute to climate change and public health risks near port communities. Moreover, within a certain range—specifically between 6 and 10 connections—ports should prioritize optimizing the efficiency of existing systems, such as through smart grid technologies or demand-based scheduling, rather than solely pursuing an increase in connection numbers. Beyond 10 connections, the marginal environmental gains (e.g., an additional 13.54% reduction from 10 to 12 connections) are offset by disproportionate increases in cost (7.24% more) and waiting time (19.56% more), indicating a point of diminishing returns. Under specific conditions—such as stable vessel arrival patterns and predictable power demand—the economically optimal configuration of shore power connections stabilizes around 80% of the total berth count. This threshold could be further refined by incorporating real-time data on vessel types (e.g., container ships vs. cruise liners), power requirements, and regional electricity pricing, ensuring that the system remains adaptable to dynamic operational and economic contexts. Ultimately, this analysis not only supports the adoption of shore power as a sustainable practice but also underscores the importance of strategic planning to maximize its benefits without overburdening port resources.
3.4. Shore Power Connection Speed
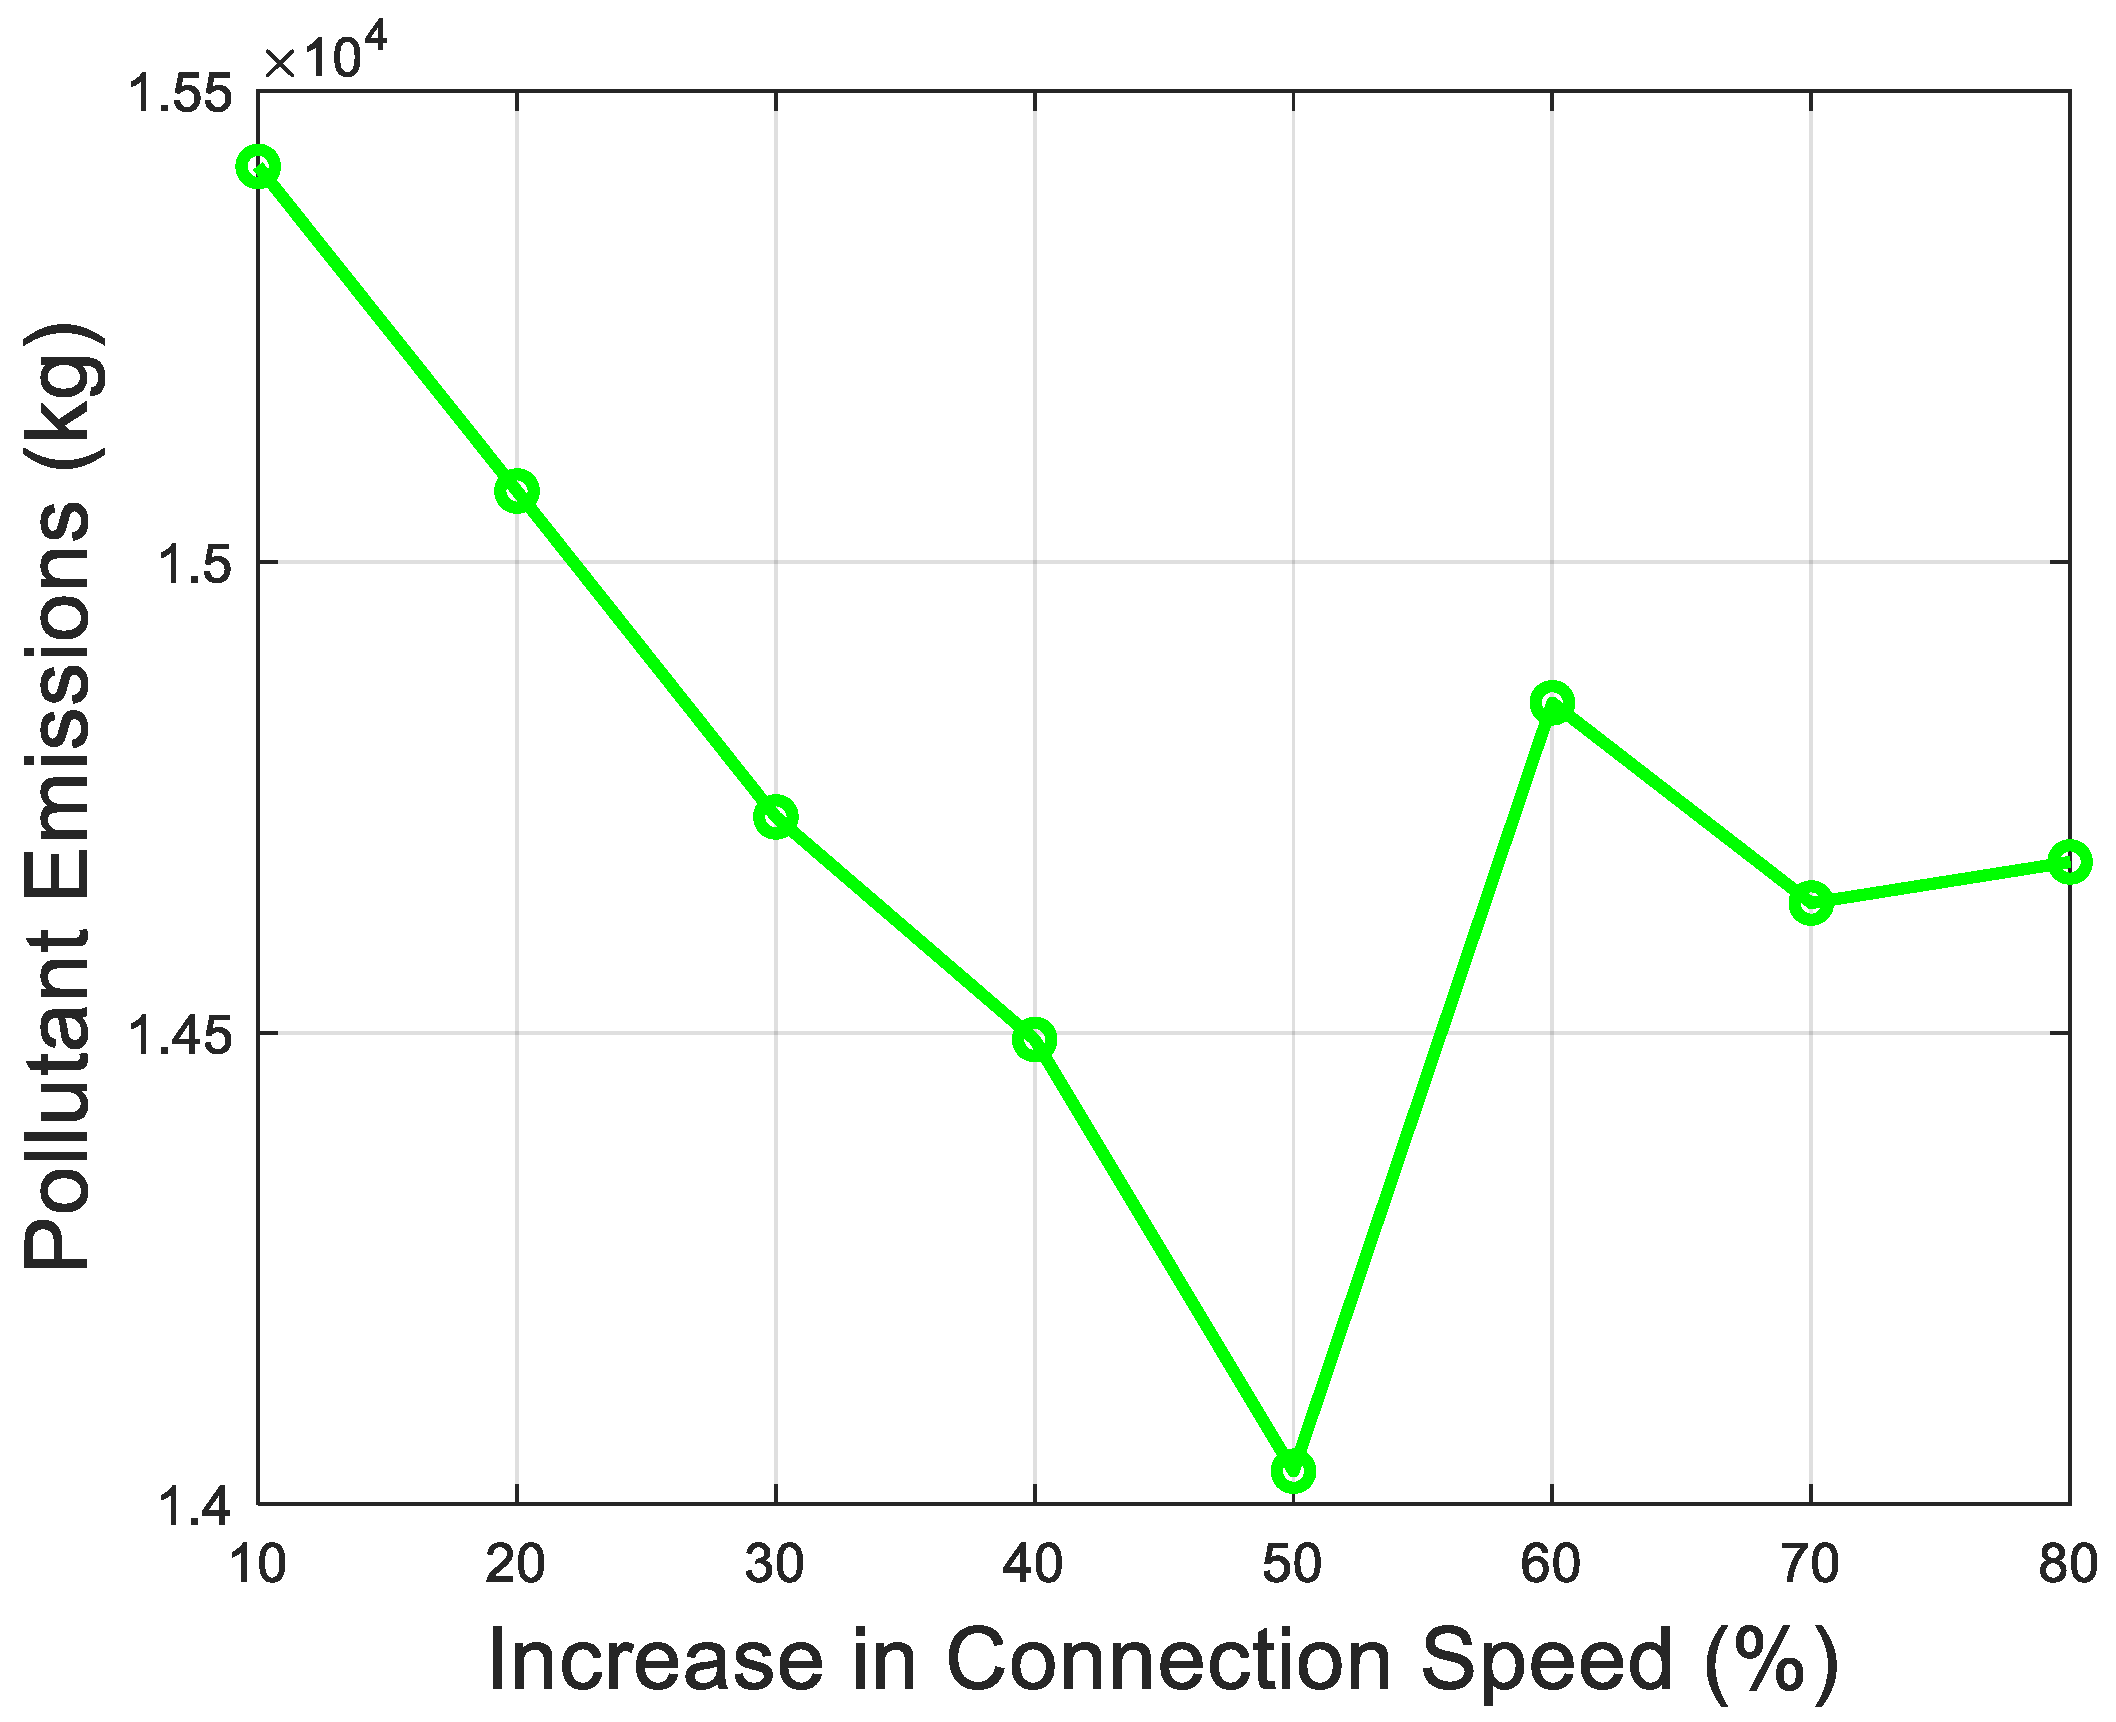
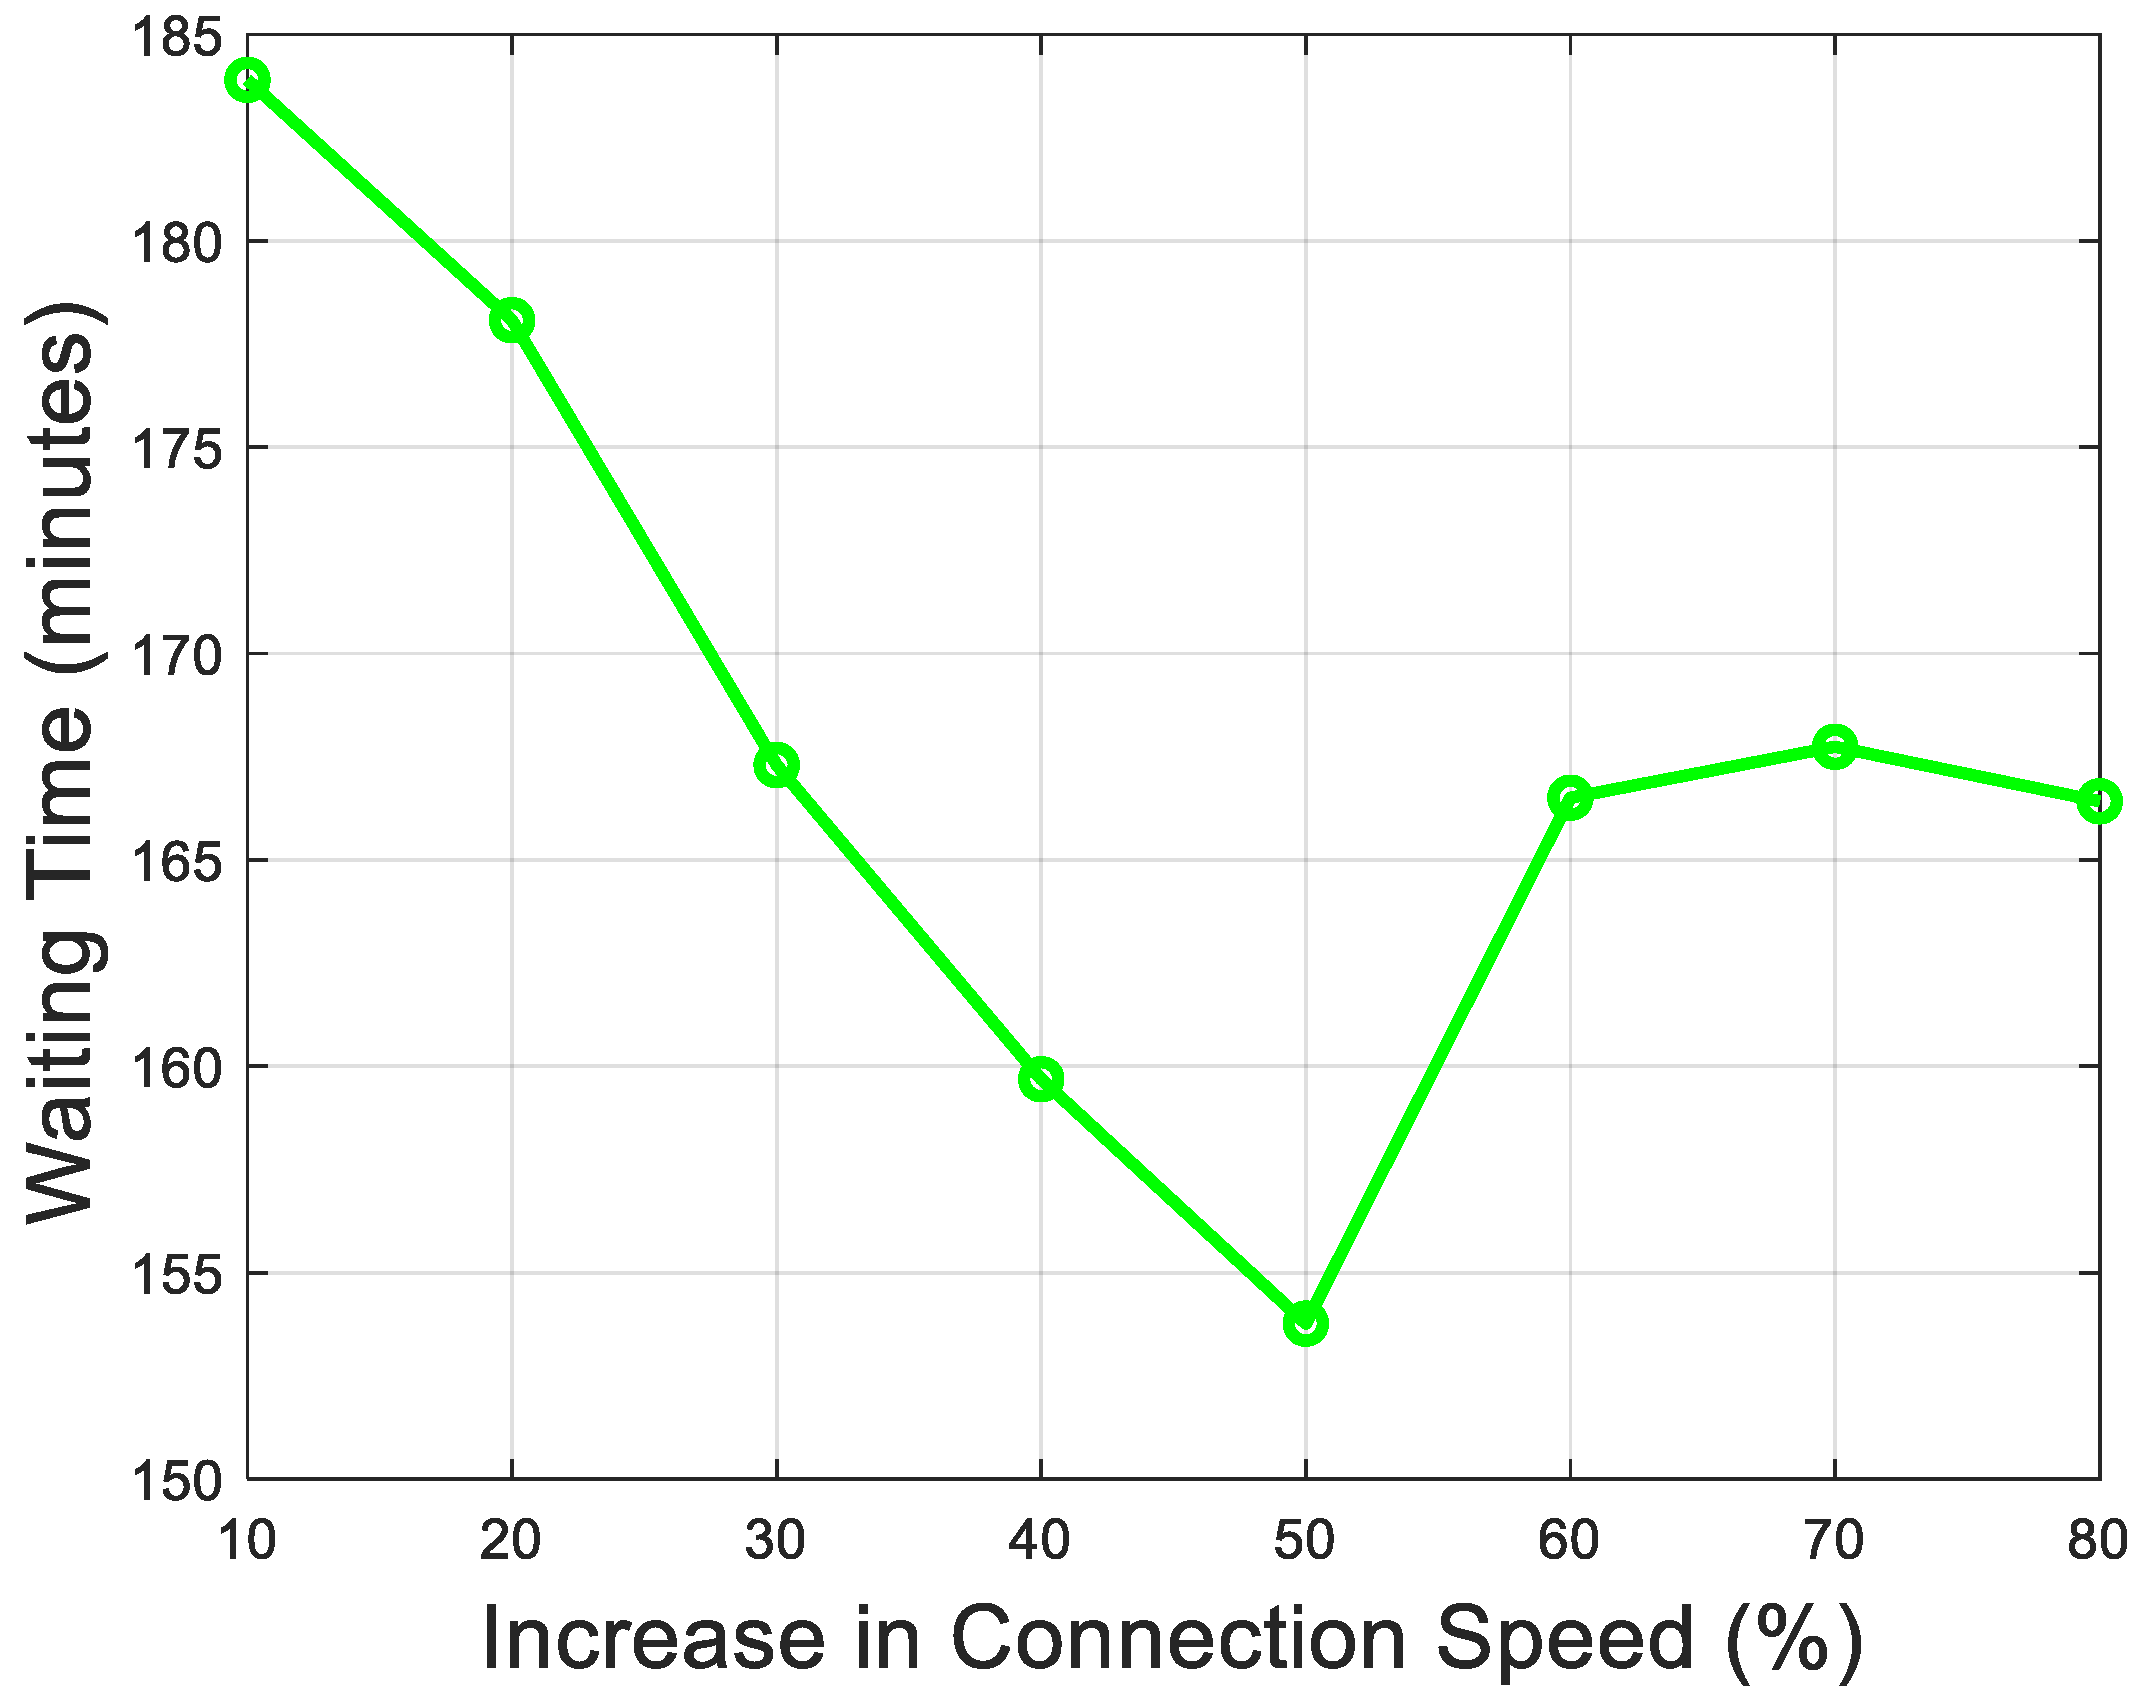
Currently, slow shore power connection speeds lead to prolonged vessel waiting times. To optimize the operational efficiency and overall benefits of the port’s shore power system, 8 stages are set, with the connection speed increasing by 10% at each stage. The changes in shore power usage costs, pollutant emissions, and waiting times are illustrated in Figure 10, Figure 11 and Figure 12 respectively and the results for each stage are presented in Table 7.

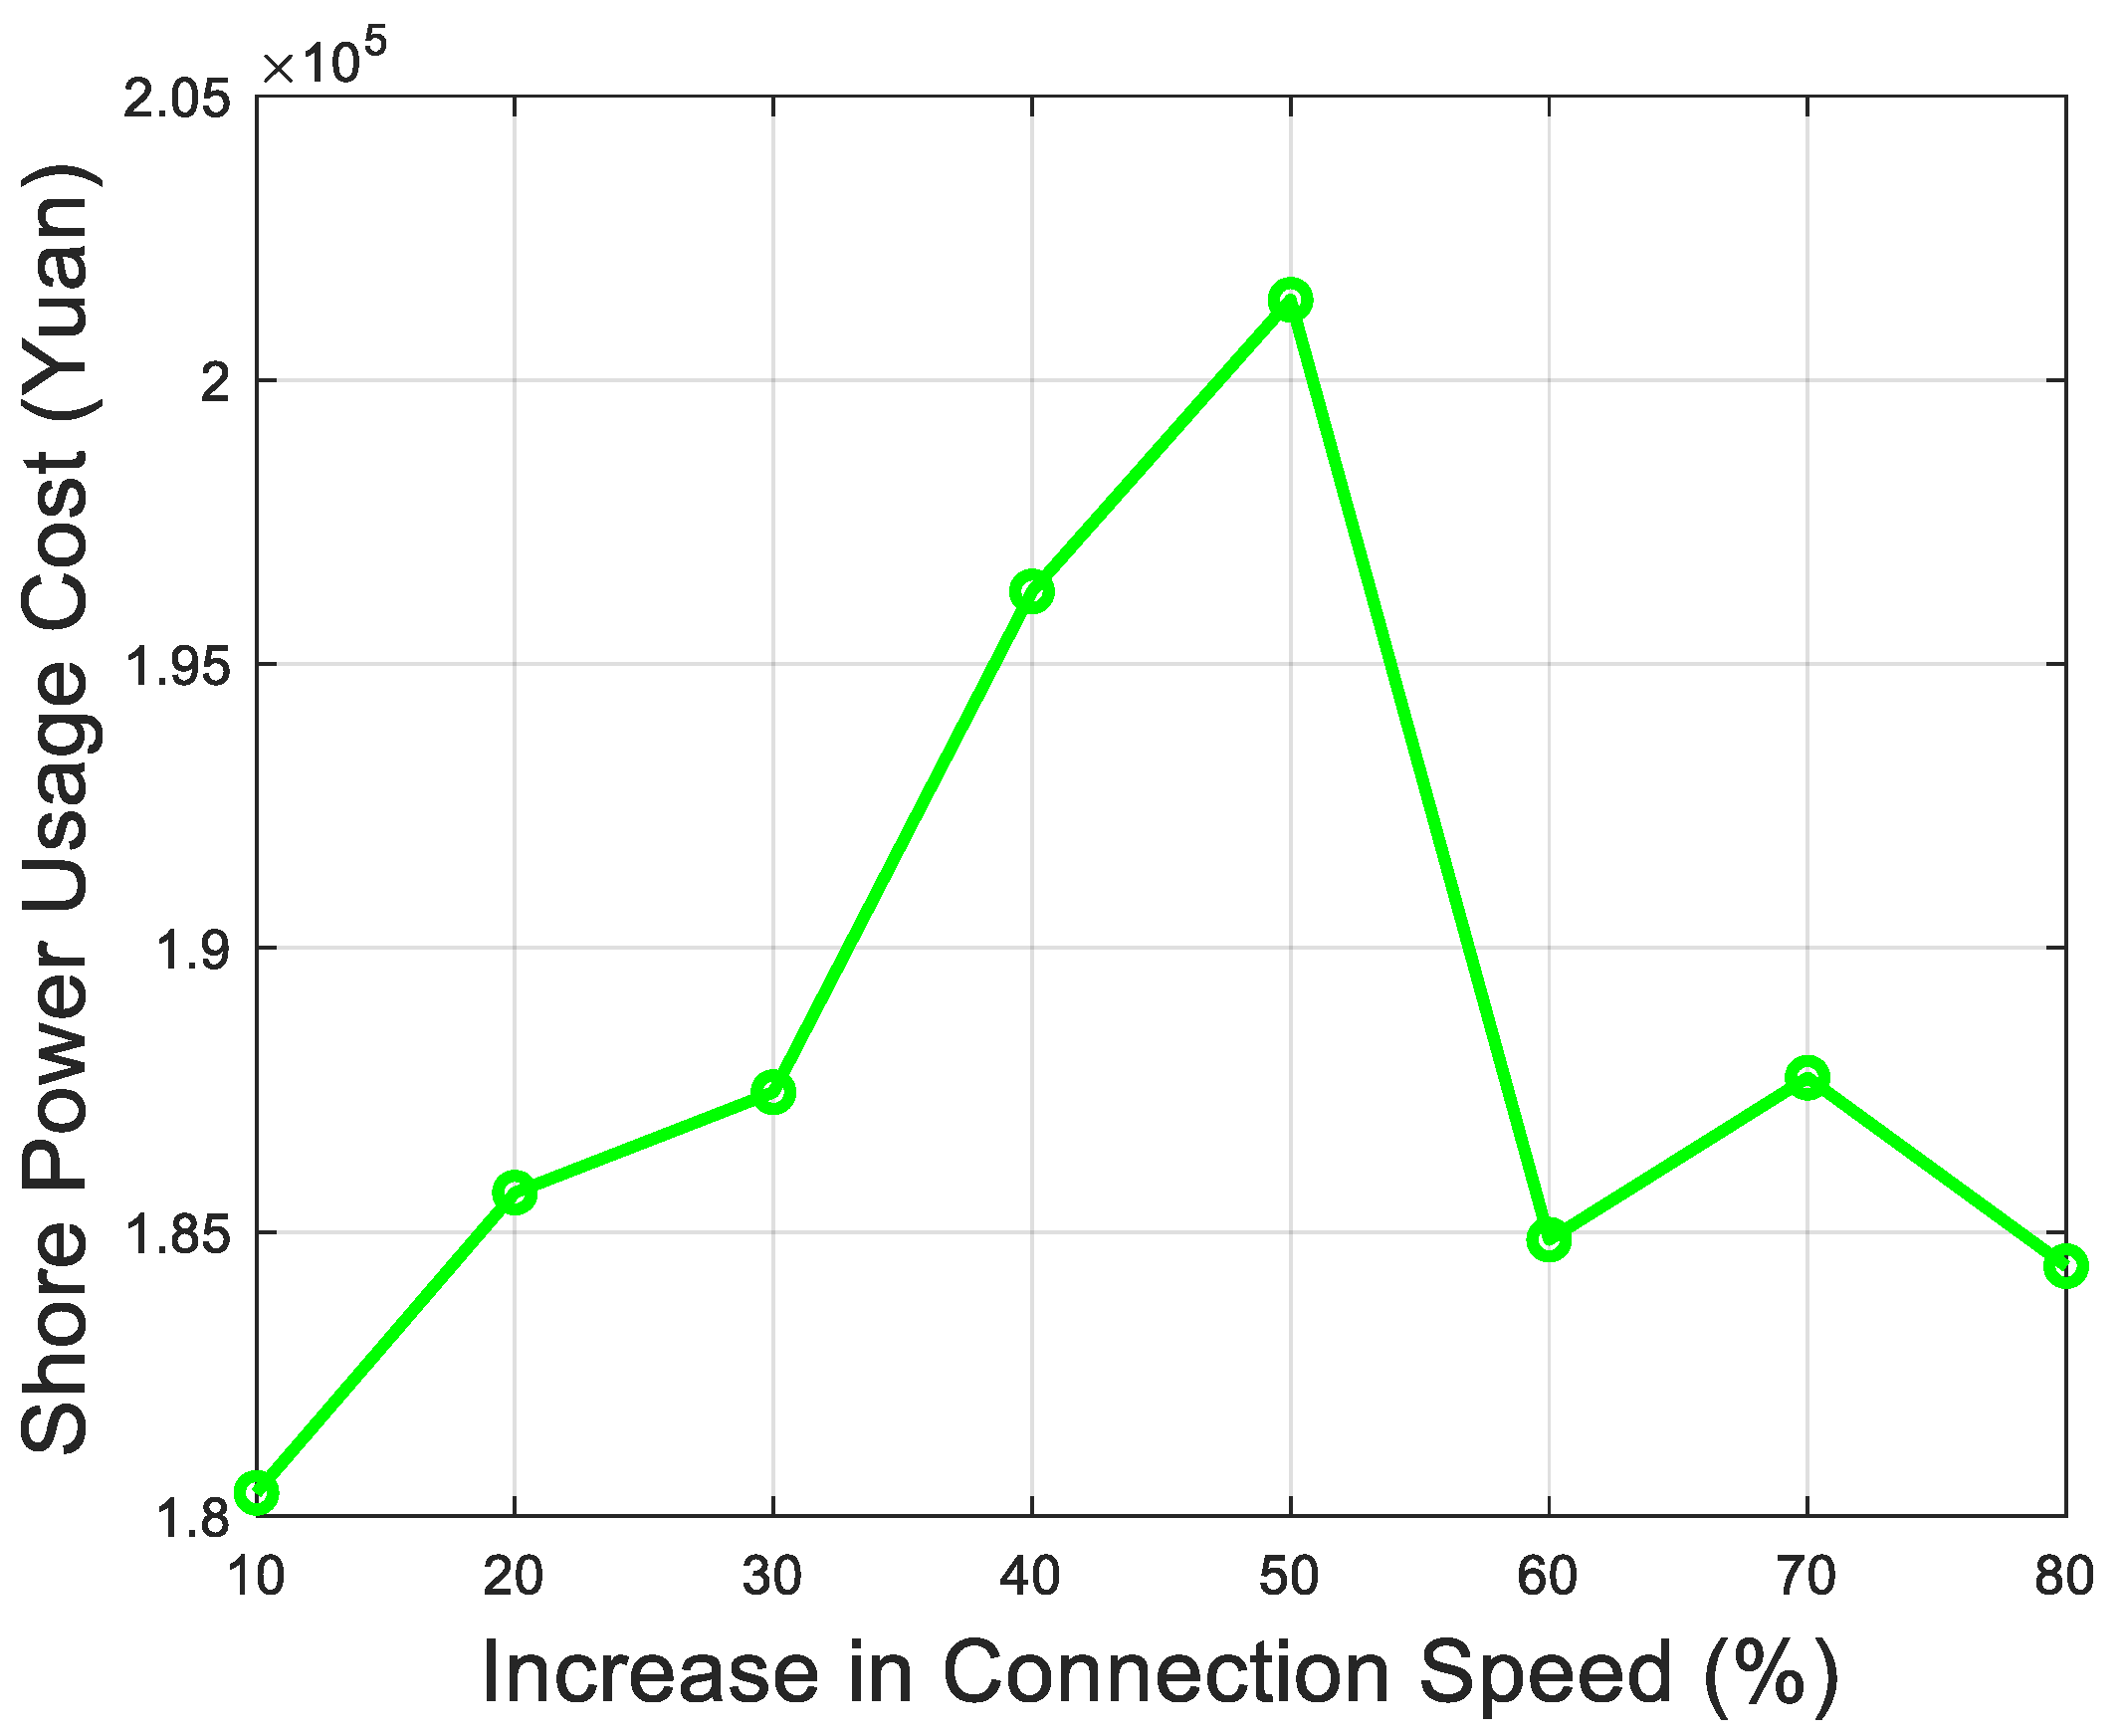
Figure 10.
Increase in connection speed changes in shore power costs.

Figure 11.
Increase in connection speed changes in pollutant emissions.

Figure 12.
Increase in connection speed changes in waiting time.
Table 7.
Results for each stage.
By increasing the shore power connection speed by 50%, pollutant emissions are reduced by 9.67% (from 15,807.48 kg to 14,034.92 kg), vessel waiting time is shortened by 16.39% (from 189.84 min to 153.76 min), and shore power usage costs rise by only 7.8% (from 175,467.69 CNY to 201,412.05 CNY). These data indicate that despite a moderate increase in costs, the significant reduction in pollutant emissions and substantial decrease in waiting time achieve a positive balance in overall improvements.
The 50% speed increase stands out as a sweet spot, delivering a robust efficiency gain without excessive cost escalation. Notably, the waiting time reduction (16.39%) outpaces the cost increase (7.8%), suggesting that operational savings—such as reduced idle time for vessels and labor—may partially offset the financial burden. The pollutant reduction (9.67%) is also meaningful, though less dramatic than the 28.9% achieved by increasing connections from 6 to 12 in the prior analysis. This indicates that connection speed improvements complement rather than fully substitute the benefits of additional infrastructure.
The curves in the figures reveal the positive impact of improved shore power connection speed on the overall operational efficiency of the port. While faster connection speeds are not always better, a moderate increase indeed provides a buffer for vessel waiting times, reducing delays. The figures demonstrate that increased connection speed not only optimizes the overall objective functions but also enhances multiple aspects of performance, rather than just a single metric.
The non-linear trends in Figure 11, Figure 12 and Figure 13 likely show diminishing returns beyond the 50% stage. For instance, at 60%–80% speed increases, waiting times plateau (around 166–167 min), and pollutant emissions hover between 14,637.93 kg and 14,850.43 kg, while costs fluctuate without a clear upward trend (e.g., dropping from 201,412.05 CNY at 50% to 184,397.73 CNY at 80%). This suggests an optimal range (40%–50%) where efficiency peaks before additional speed investments yield marginal benefits, possibly due to physical or logistical constraints in the connection process.
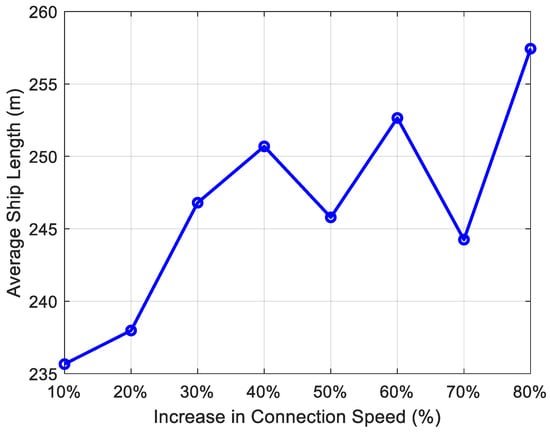
Figure 13.
Impact of connection speed on average vessel length.
Further analysis reveals that improving shore power connection speed directly enhances the overall efficiency of port operations, enabling vessels to complete port operations more quickly. This reduces waiting times and alleviates overall operational costs. During this process, a negative correlation between pollutant emissions and shore power usage costs is observed. Specifically, a reduction in pollutant emissions typically indicates improved efficiency in shore power utilization. This efficiency gain largely stems from an appropriate increase in connection speed.
The negative correlation between emissions and costs could reflect a shift in energy dynamics—faster connections reduce reliance on auxiliary engines, cutting emissions, while the cost increase ties to higher electricity demand or equipment upgrades. To quantify this, ports could assess the energy mix (e.g., renewable vs. fossil-based shore power) and its cost-emission trade-offs. Additionally, the efficiency gain might be amplified by streamlining connection protocols or training staff, further reducing operational bottlenecks.
The average vessel length changes are shown in Figure 13.
As the shore power connection speed increases, the number of vessels using shore power rises significantly, with a noticeable increase in the proportion of large vessels, while the willingness of smaller vessels to use shore power gradually decreases. In the lower connection speed stages (10%–50%), the participation rate of smaller vessels is relatively higher, especially in the 10% stage, where smaller vessels account for a larger proportion of the total length. However, as the connection speed improves, particularly in stages above 60%, the participation of large vessels gradually increases. The number of vessels using shore power rises to six, and the average length of vessels grows. For example, when the shore power connection speed increases to 80%, vessels using shore power include Vessel 1 (251.92 m) and Vessel 16 (270.73 m), resulting in an average vessel length of 257.43 m. Conversely, the participation rate of smaller vessels gradually declines, indicating a reduced willingness to use shore power at higher connection speeds.
The shift toward larger vessels at higher speeds aligns with their longer docking times, making shore power more cost-effective relative to fuel use. The data show the total vessel length peaking at 1,287.14 m (80% stage) versus 1178.3 m (10% stage), a 9.2% increase, driven by larger vessels like Vessel 16. This trend could reflect economies of scale—larger vessels benefit more from reduced emissions and fuel savings, outweighing connection time costs, while smaller vessels face a higher relative burden from setup time.
This trend can be attributed to the shorter docking times of smaller vessels. Compared to the environmental benefits and cost savings of using shore power, the time and operational costs required for shore power connection make smaller vessels more inclined to continue using traditional fuel-powered systems. Therefore, as the connection speed increases, the use of shore power becomes more favorable for large vessels, while the willingness of smaller vessels to adopt it diminishes.
Smaller vessels’ reluctance at higher speeds may also stem from fixed connection costs (e.g., labor or equipment fees) that disproportionately impact their shorter port stays. To counter this, ports could explore tiered pricing or faster, simplified connection systems for smaller vessels. Alternatively, incentives like emissions credits could boost their participation. For larger vessels, the trend suggests that shore power infrastructure should prioritize compatibility with their power demands, ensuring scalability as fleet sizes grow.
4. Discussion
The optimization of port shore power systems and berth allocation requires a balance between economic benefits, environmental effects, and operational efficiency. With the future development of greener, smarter, and more systematic ports [36], the number of shore power connections and their connection speed will play a key role in improving overall port performance.
Increasing the number of shore power connections significantly optimizes pollutant emissions and overall port operational efficiency. As the number of shore power connections increases from 6 to 12, pollutant emissions drop from 15,807.48 kg to 11,241.45 kg, a reduction of 28.9%. Meanwhile, shore power usage costs rise from 175,467.69 CNY to 203,801.53 CNY, an increase of 16.2%. However, the benefits of reduced emissions outweigh the cost increase, indicating that a moderate increase in shore power connections can significantly contribute to the development of green ports. The 28.9% emissions reduction highlights shore power’s potential as a cornerstone of decarbonization efforts. To contextualize the cost increase, ports could benchmark this against carbon credit markets or regulatory fines for emissions, potentially revealing a net financial gain over time. This reinforces the long-term value of scaling shore power infrastructure.
Sensitivity analysis further demonstrates that setting the number of shore power connections to 80% of the number of berths (i.e., 10 shore power connections for the current 12 berths) achieves the best balance between cost, pollutant emissions, and waiting time. At this point, pollutant emissions are reduced to 13,352.17 kg, close to the reduction achieved with 12 shore power connections. Costs rise to 191,081.87 CNY, only 8.88% higher than with 6 connections, and the waiting time increases to 257.01 min, significantly lower than the 61.9% increase seen with 12 connections. Therefore, setting the number of shore power connections to 80% of the number of berths is the optimal choice, effectively reducing pollutant emissions, controlling cost increases, and avoiding a decline in operational efficiency due to prolonged waiting times. This optimization strategy provides a scientific basis and practical guidance for green port development. The 80% threshold could serve as a scalable heuristic for ports of varying sizes, adjustable based on berth utilization rates or seasonal traffic patterns. Testing this ratio across diverse port profiles (e.g., cargo vs. passenger terminals) could validate its broader applicability, strengthening its role as a universal guideline.
Increasing the shore power connection speed can significantly reduce vessel waiting time and port operational costs. When the connection speed is increased by 50%, vessel waiting time decreases by 16.39%, and pollutant emissions are reduced by nearly 10%. This finding suggests that optimizing connection speed not only reduces vessel downtime but also enhances the overall efficiency of shore power utilization. Additionally, faster connection speeds provide greater flexibility for berth and shore power allocation during peak periods. However, excessively high connection speeds may lead to increased equipment wear or safety risks. It is therefore recommended to develop strategies for moderately improving connection speeds based on the port’s actual needs, balancing equipment lifespan and efficiency improvements. Faster connection speeds reduce non-productive time during vessel berthing, thereby improving berth utilization. Increased connection speed significantly lowers vessel waiting costs and operational losses, contributing to overall port efficiency. Higher operational efficiency also makes shore power more attractive to vessels, further improving the utilization rate of shore power systems. Promoting high-efficiency shore power connection equipment and adopting intelligent docking systems can minimize time lost to manual operations. Additionally, developing universal interface standards can enhance the general applicability of connection efficiency. For vessels that prioritize shore power use, providing fast connection services during berth allocation can further incentivize the use of shore power. Different connection speed levels can be set based on vessel type and pollution levels, prioritizing faster connections for high-pollution vessels. The 50% speed increase’s impact on waiting time (16.39% reduction) suggests a leverage point for operational savings, potentially quantifiable in terms of fuel costs avoided by vessels. Safety risks from excessive speeds could be mitigated through predictive maintenance or automated monitoring systems, ensuring reliability. Tailoring speeds to vessel pollution profiles is a proactive step—ports could integrate emissions data into berth allocation algorithms, prioritizing high-pollution vessels to maximize environmental gains.
The type of vessel is closely related to its willingness to adopt shore power, especially during connection speed optimizations. Larger vessels are more willing to connect to shore power as speeds increase, while smaller vessels, due to their shorter docking times and relatively lower economic benefits, show less willingness to use shore power. By optimizing connection speeds, ports can more effectively meet the needs of larger vessels. Meanwhile, flexible shore power allocation strategies tailored to vessel types can help balance environmental benefits and operational costs. In practice, ports should prioritize the needs of larger vessels and, based on optimized connection speeds, encourage smaller vessels to adopt shore power through policy incentives (e.g., subsidies or discounted electricity rates). The vessel-type divergence underscores the need for segmented strategies. For smaller vessels, time-sensitive incentives (e.g., expedited berthing for shore power users) could offset their reluctance, while larger vessels might benefit from bundled services (e.g., power and maintenance packages). Analyzing vessel-specific cost-benefit ratios could refine these incentives further.
The study reveals that increasing the number of shore power connections and improving connection speed contribute complementarily to reducing pollutant emissions and optimizing costs. Moderately increasing the number of shore power connections provides clean energy support to more vessels, while faster connection speeds effectively reduce vessel waiting costs and operational times. A comprehensive analysis shows that the optimized scheme reduces pollutant emissions by 7.31% and improves the TOPSIS score by 11.46% compared to the non-optimized scheme, indicating that the coordinated optimization of shore power and berth allocation can significantly enhance port operational efficiency and environmental benefits.
The complementary effect of optimizing shore power quantity and connection speed lies in addressing different aspects of port efficiency. Increasing shore power quantity resolves supply capacity issues, while improving connection speed optimizes resource utilization efficiency. Their combination reduces pollution while ensuring operational benefits. A single optimization approach may lead to bottlenecks, whereas the simultaneous optimization of both quantity and speed fully unleashes the potential of the shore power system, resulting in more significant overall improvements. This dual approach mirrors systemic optimization principles—capacity (quantity) and flow (speed) must align to avoid choke points. Ports could adopt a phased implementation, starting with quantity upgrades, followed by speed enhancements, to manage capital expenditure while building efficiency incrementally.
While the environmental benefits of pollutant reduction may not immediately offset the additional investment costs, the accumulated environmental gains significantly enhance the port’s social responsibility and competitiveness in the long run. In planning shore power systems, simultaneous optimization of quantity and connection speed should be considered to avoid resource wastage or bottlenecks caused by single-factor optimization. Provide emission reduction subsidies for vessels using shore power to attract broader participation. Offer low-interest loans or tax incentives to ports to support infrastructure upgrades. Dynamically monitor the utilization rate, operational efficiency, and environmental benefits of the shore power system, and periodically adjust resource allocation and operational strategies to ensure long-term sustainable development. This integrated approach ensures that the shore power system can achieve both economic and environmental goals effectively.
5. Conclusions
This study provides an in-depth exploration of the multi-objective optimization problem in port shore power systems and berth allocation, establishing a comprehensive optimization framework leveraging the NSGA-III algorithm. By employing the NSGA-III algorithm to generate a Pareto optimal solution set, followed by the TOPSIS method to identify the final optimal solution, this approach offers scientific and robust decision-making support for port managers. This framework enables ports to achieve green development, enhance environmental benefits, and reduce operational costs while balancing economic, environmental, and efficiency objectives. The methodology proposed in this study proves effective in addressing such complex multi-objective optimization challenges, as it efficiently reconciles trade-offs among conflicting goals and delivers practical solutions validated through simulation experiments. The key findings are as follows:
- Expanding Shore Power Capacity: While an increase in shore power connections may lead to higher operational costs, its positive impact on pollutant reduction becomes increasingly significant. Expanding shore power capacity plays a crucial role in environmental protection and pollution control, with a demonstrated 28.9% reduction in pollutant emissions when scaling from 6 to 12 connections (Table 6).
- Optimized Shore Power Allocation: Analyzing the impact of different shore power capacities on port operations reveals that when shore power capacity reaches 80% of the total number of berths (e.g., 10 connections for 12 berths), an optimal balance is achieved between cost, pollutant emissions, and vessel waiting time. This configuration reduces emissions by 15.54% compared to a 6-connection baseline while limiting cost increases to 8.88% (Table 6), serving as a practical reference for the development of green and intelligent ports.
- Shore Power Connection Speed: Enhancing shore power connection speed can significantly improve system efficiency and streamline overall port operations. A 50% increase in connection speed reduces vessel waiting time by 16.39% and pollutant emissions by 9.67%, with only a modest 7.8% rise in costs (Table 7). This well-calibrated increase is particularly crucial for port optimization, as larger vessels benefit more substantially from faster connections, leading to greater operational efficiency gains.
- Impact of Vessel Type: Vessel type significantly influences the willingness to adopt shore power, with larger vessels demonstrating a higher inclination to connect compared to smaller ones, especially as connection speeds improve (Figure 13). Ports should prioritize the needs of large vessels while encouraging smaller vessels to utilize shore power through enhanced connection speeds and policy incentives, such as subsidies or preferential pricing.
However, this study has certain limitations. First, it does not consider other types of pollution, such as water and noise pollution, nor does it factor in the power range of shore power systems. Future research could further evaluate the emission reduction benefits of shore power systems under uncertain power ranges and multiple pollution sources. Second, the simplification of the vessel service process may not fully reflect the complexity of real-world operations. Future studies should consider the potential impact of mobile shore power transformers on berth allocation and external factors such as weather. Furthermore, the categorization of vessel types in this study is relatively simplified, which may overlook service time differences caused by vessel type. The study also does not comprehensively account for the variety of port types. Future research could more precisely consider the characteristics of different vessel types and integrate port layouts and other operational conditions to further optimize the model’s accuracy and applicability.
In summary, this study conducts a multi-dimensional analysis of shore power quantity and connection speed, proposing an economic configuration of shore power at 80% of the number of berths. It also provides targeted and practical optimization strategies by considering the differences in vessel types. The effectiveness of the NSGA-III-based methodology is demonstrated through its ability to handle the complexity of multi-objective optimization, offering a solution that achieves a 7.31% reduction in pollutant emissions and an 11.46% improvement in the TOPSIS score compared to a non-optimized baseline (Table 5). Future research could build upon more real-world factors to further refine optimization strategies for port shore power systems and berth allocation, promoting green, intelligent, and sustainable port development.
Author Contributions
Conceptualization, Z.Z. and Y.Z.; methodology, Z.Z. and J.Z.; software, Z.Z.; validation, D.H., C.Y. and Y.Z.; formal analysis, J.Z.; investigation, Y.Z.; resources, D.H.; data curation, Z.Z.; writing—original draft preparation, Z.Z. and J.Z.; writing—review and editing, Y.Z., J.L., C.Y. and D.H.; visualization, Z.Z. and J.Z.; supervision, C.Y. and D.H.; project administration, Y.Z. and D.H.; funding acquisition, Y.Z. and D.H. All authors have read and agreed to the published version of the manuscript.
Funding
This research is sponsored by the National Natural Science Foundation of China (72074141) and Shanghai Pujiang Programme (23PJC053).
Data Availability Statement
The original contributions presented in this study are included in the article material. Further inquiries can be directed to the corresponding author.
Conflicts of Interest
The authors declare no conflicts of interest.
Abbreviations
The following abbreviations are used in this manuscript:
| PB | Preferred Berth |
| AB | Alternative Berth |
| AT | Arrival Time |
| BT | Berthing Time |
| ST | Loading/Unloading Service Time (min) |
| DT | Departure Time |
| WF | Weather Factor |
| DVC | Deviation Cost (CNY) |
| DMC | Demurrage Cost (CNY) |
| NSGA-III | elitist non-dominated sorting genetic algorithm-III |
| TOPSIS | Technique for Order Preference by Similarity to Ideal Solution |
References
- Feng, Y.; Huang, D.; Hong, X.; Wang, H.; Loughney, S.; Wang, J. Spatial-temporal evolution of maritime accident hot spots in the East China Sea: A Space-Time Cube Representation. J. Mar. Sci. Eng. 2025, 13, 233. [Google Scholar] [CrossRef]
- Yin, C.; Zhang, Z.A.; Fu, X.; Ge, Y.E. A low-carbon transportation network: Collaborative effects of a rail freight subsidy and carbon trading mechanism. Transp. Res. Part A Policy Pract. 2024, 184, 104066. [Google Scholar] [CrossRef]
- Yin, C.; Zhang, Z.; Zhang, X.; Chen, J.; Tao, X.; Yang, L. Hub seaport multimodal freight transport network design: Perspective of regional integration development. Ocean Coast. Manag. 2023, 242, 106675. [Google Scholar] [CrossRef]
- Lu, H.; Huang, L. Optimization of shore power deployment in green ports considering government subsidies. Sustainability 2021, 13, 1640. [Google Scholar] [CrossRef]
- Song, Z.; Tang, W.; Zhao, R.; Zhang, G. Implications of government subsidies on shipping companies’ shore power usage strategies in port. Transp. Res. Part E Logist. Transp. Rev. 2022, 165, 102840. [Google Scholar] [CrossRef]
- Peng, Y.; Liu, Q.; Xu, J. Dynamic incentive contract of government for port enterprises to reduce emissions in the blockchain era: Considering carbon trading policy. Sustainability 2023, 15, 12148. [Google Scholar] [CrossRef]
- Gu, Y.; Yu, X. A life cycle cost analysis of different shore power incentive policies on both shore and ship sides based on system dynamics and a Chinese port case. Environ. Sci. Pollut. Res. 2024, 31, 29563–29583. [Google Scholar] [CrossRef]
- Seddiek, I.S. Application of fuel-saving strategies onboard high-speed passenger ships. J. Mar. Sci. Technol. 2016, 21, 493–500. [Google Scholar] [CrossRef]
- Song, T.; Li, Y.; Zhang, X.P.; Wu, C.; Li, J.; Guo, Y.; Gu, H. Integrated port energy system considering integrated demand response and energy interconnection. Int. J. Electr. Power Energy Syst. 2020, 117, 105654. [Google Scholar] [CrossRef]
- Seddiek, I.S.; Mosleh, M.A.; Banawan, A.A. Cost and environmental benefit in the use of shore connection in BJTI port. J. Marit. Technol. Eng. 2020, 6, 41–48. [Google Scholar]
- Tarnapowicz, D.; German-Galkin, S. Energy optimization of the ‘shore to ship’ system—A universal power system for ships at berth in a port. Sensors 2020, 20, 3815. [Google Scholar] [CrossRef]
- Samosir, D.H.; Markert, M.; Busse, W. The technical and business analysis of using shore power connection in the port of Hamburg. J. Tek. ITS 2017, 5, 18860. [Google Scholar] [CrossRef]
- Rogosic, M.; Stanivuk, T.; Lucaci, D. A study on the application of shore-side power as a method to reduce the emissions of greenhouse gases by cruise ships. J. Mar. Sci. Eng. 2025, 13, 453. [Google Scholar] [CrossRef]
- Qu, S.; Li, X.; Liu, C.; Tang, X.; Peng, Z.; Ji, Y. Two-stage robust programming modeling for continuous berth allocation with uncertain vessel arrival time. Sustainability 2023, 15, 10560. [Google Scholar] [CrossRef]
- Wang, Z.; Hu, H.; Zhen, L. Berth and quay cranes allocation problem with on-shore power supply assignment in container terminals. Comput. Ind. Eng. 2024, 188, 109910. [Google Scholar] [CrossRef]
- Sheikholeslami, A.; Mardani, M.; Ayazi, E.; Arefkhani, H. A dynamic and discrete berth allocation problem in container terminals considering tide effects. Iran J. Sci. Technol. Trans. Civ. Eng. 2020, 44, 369–376. [Google Scholar] [CrossRef]
- Wang, P.; Li, J.; Cao, X. Discrete dynamic berth allocation optimization in container terminal based on Deep Q-Network. Mathematics 2024, 12, 3742. [Google Scholar] [CrossRef]
- Rodrigues, F.; Agra, A. Berth allocation and quay crane assignment/scheduling problem under uncertainty: A survey. Eur. J. Oper. Res. 2022, 303, 501–524. [Google Scholar] [CrossRef]
- Xu, Y. Multi-objective optimization of joint scheduling of berth and quay crane under green ports. In Proceedings of the 7th International Conference on Traffic Engineering and Transportation System (ICTETS 2023), Dalian, China, 22–24 September 2023; Volume 13064, pp. 190–197. [Google Scholar] [CrossRef]
- Cheimanoff, N.; Fontane, F.; Kitri, M.N.; Tchernev, N. A reduced VNS based approach for the dynamic continuous berth allocation problem in bulk terminals with tidal constraints. Expert Syst. Appl. 2021, 168, 114215. [Google Scholar] [CrossRef]
- Lin, X.; Pu, X.; Bai, X. On the efficiency impacts of berthing priority provision. Transp. Sci. 2024, 58, 557–683. [Google Scholar] [CrossRef]
- Chu, L.; Zhang, J.; Chen, X.; Yu, Q. Optimization of integrated tugboat–berth–quay crane scheduling in container ports considering uncertainty in vessel arrival times and berthing preferences. J. Mar. Sci. Eng. 2024, 12, 1541. [Google Scholar] [CrossRef]
- Yang, S.; Shen, H.; Zhong, Z.; Qian, X.; Wang, Y. Collaborative scheduling for Yangtze Riverport channels and berths using multi-objective optimization. Appl. Sci. 2024, 14, 6514. [Google Scholar] [CrossRef]
- Chang, S.-C.; Lin, M.-H.; Tsai, J.-F. An optimization approach to berth allocation problems. Mathematics 2024, 12, 753. [Google Scholar] [CrossRef]
- Wang, Y.; Zou, T. Optimization of berth-tug co-scheduling in container terminals under dual-carbon contexts. J. Mar. Sci. Eng. 2024, 12, 684. [Google Scholar] [CrossRef]
- Peng, Y.; Dong, M.; Li, X.; Liu, H.; Wang, W. Cooperative optimization of shore power allocation and berth allocation: A balance between cost and environmental benefit. J. Clean. Prod. 2020, 276, 123816. [Google Scholar] [CrossRef]
- Mo, A.; Zhang, Y.; Xiong, Y.; Ma, F.; Sun, L. Energy–Logistics cooperative optimization for a port-integrated energy system. Mathematics 2024, 12, 1917. [Google Scholar] [CrossRef]
- Zhang, Y.; Liang, C.; Shi, J.; Lim, G.; Wu, Y. Optimal port microgrid scheduling incorporating onshore power supply and berth allocation under uncertainty. Appl. Energy 2022, 313, 118856. [Google Scholar] [CrossRef]
- Yue, M.; Wang, Y.; Guo, S.; Dai, L.; Hu, H. A multi-objective optimization study of berth scheduling considering shore side electricity supply. Ocean Coast. Manag. 2025, 261, 107500. [Google Scholar] [CrossRef]
- Wang, W.; Liu, K.; Peng, Y.; Yu, Q.; Guo, J.; Yu, T. Investigating relationships between shore power utilization and characteristics of ships and berths. Transp. Res. Part D Transp. Environ. 2024, 136, 104446. [Google Scholar] [CrossRef]
- Guo, Q.; Yin, C.; Zheng, S. An intermodal transport network planning scheme considering carbon emissions. Energy 2025, 322, 135564. [Google Scholar] [CrossRef]
- Bierwirth, C.; Meisel, F. A survey of berth allocation and quay crane scheduling problems in seaport container terminals. Transp. Sci. 2010, 44, 312–329. [Google Scholar] [CrossRef]
- Dragović, B.; Park, N.K.; Radmilović, Z.; Maraš, V. Simulation modelling of ship-berth link with priority service. Marit. Econ. Logist. 2005, 7, 316–335. [Google Scholar] [CrossRef]
- Dragović, B.; Tzannatos, E.; Park, N.K. Simulation modelling in ports and container terminals: Literature overview and analysis by research field, application area and tool. Flex. Serv. Manuf. J. 2017, 29, 4–34. [Google Scholar] [CrossRef]
- GB/T 51305-2018; Technical Standard for Shore-To-Ship Power Supply System Engineering. China Planning Press: Beijing, China, 2018.
- Yin, C.; Zeng, L.; Fu, X.; Zhong, M. Transition of multimodal transport network under different carbon price scenarios. Transp. Policy 2025, 164, 1–26. [Google Scholar] [CrossRef]


Disclaimer/Publisher’s Note: The statements, opinions and data contained in all publications are solely those of the individual author(s) and contributor(s) and not of MDPI and/or the editor(s). MDPI and/or the editor(s) disclaim responsibility for any injury to people or property resulting from any ideas, methods, instructions or products referred to in the content. |
© 2025 by the authors. Licensee MDPI, Basel, Switzerland. This article is an open access article distributed under the terms and conditions of the Creative Commons Attribution (CC BY) license (https://creativecommons.org/licenses/by/4.0/).