Entity Model Test and Analysis of Local Scour of Three Different Structures of Artificial Reefs


Abstract
1. Introduction
2. Materials and Methods
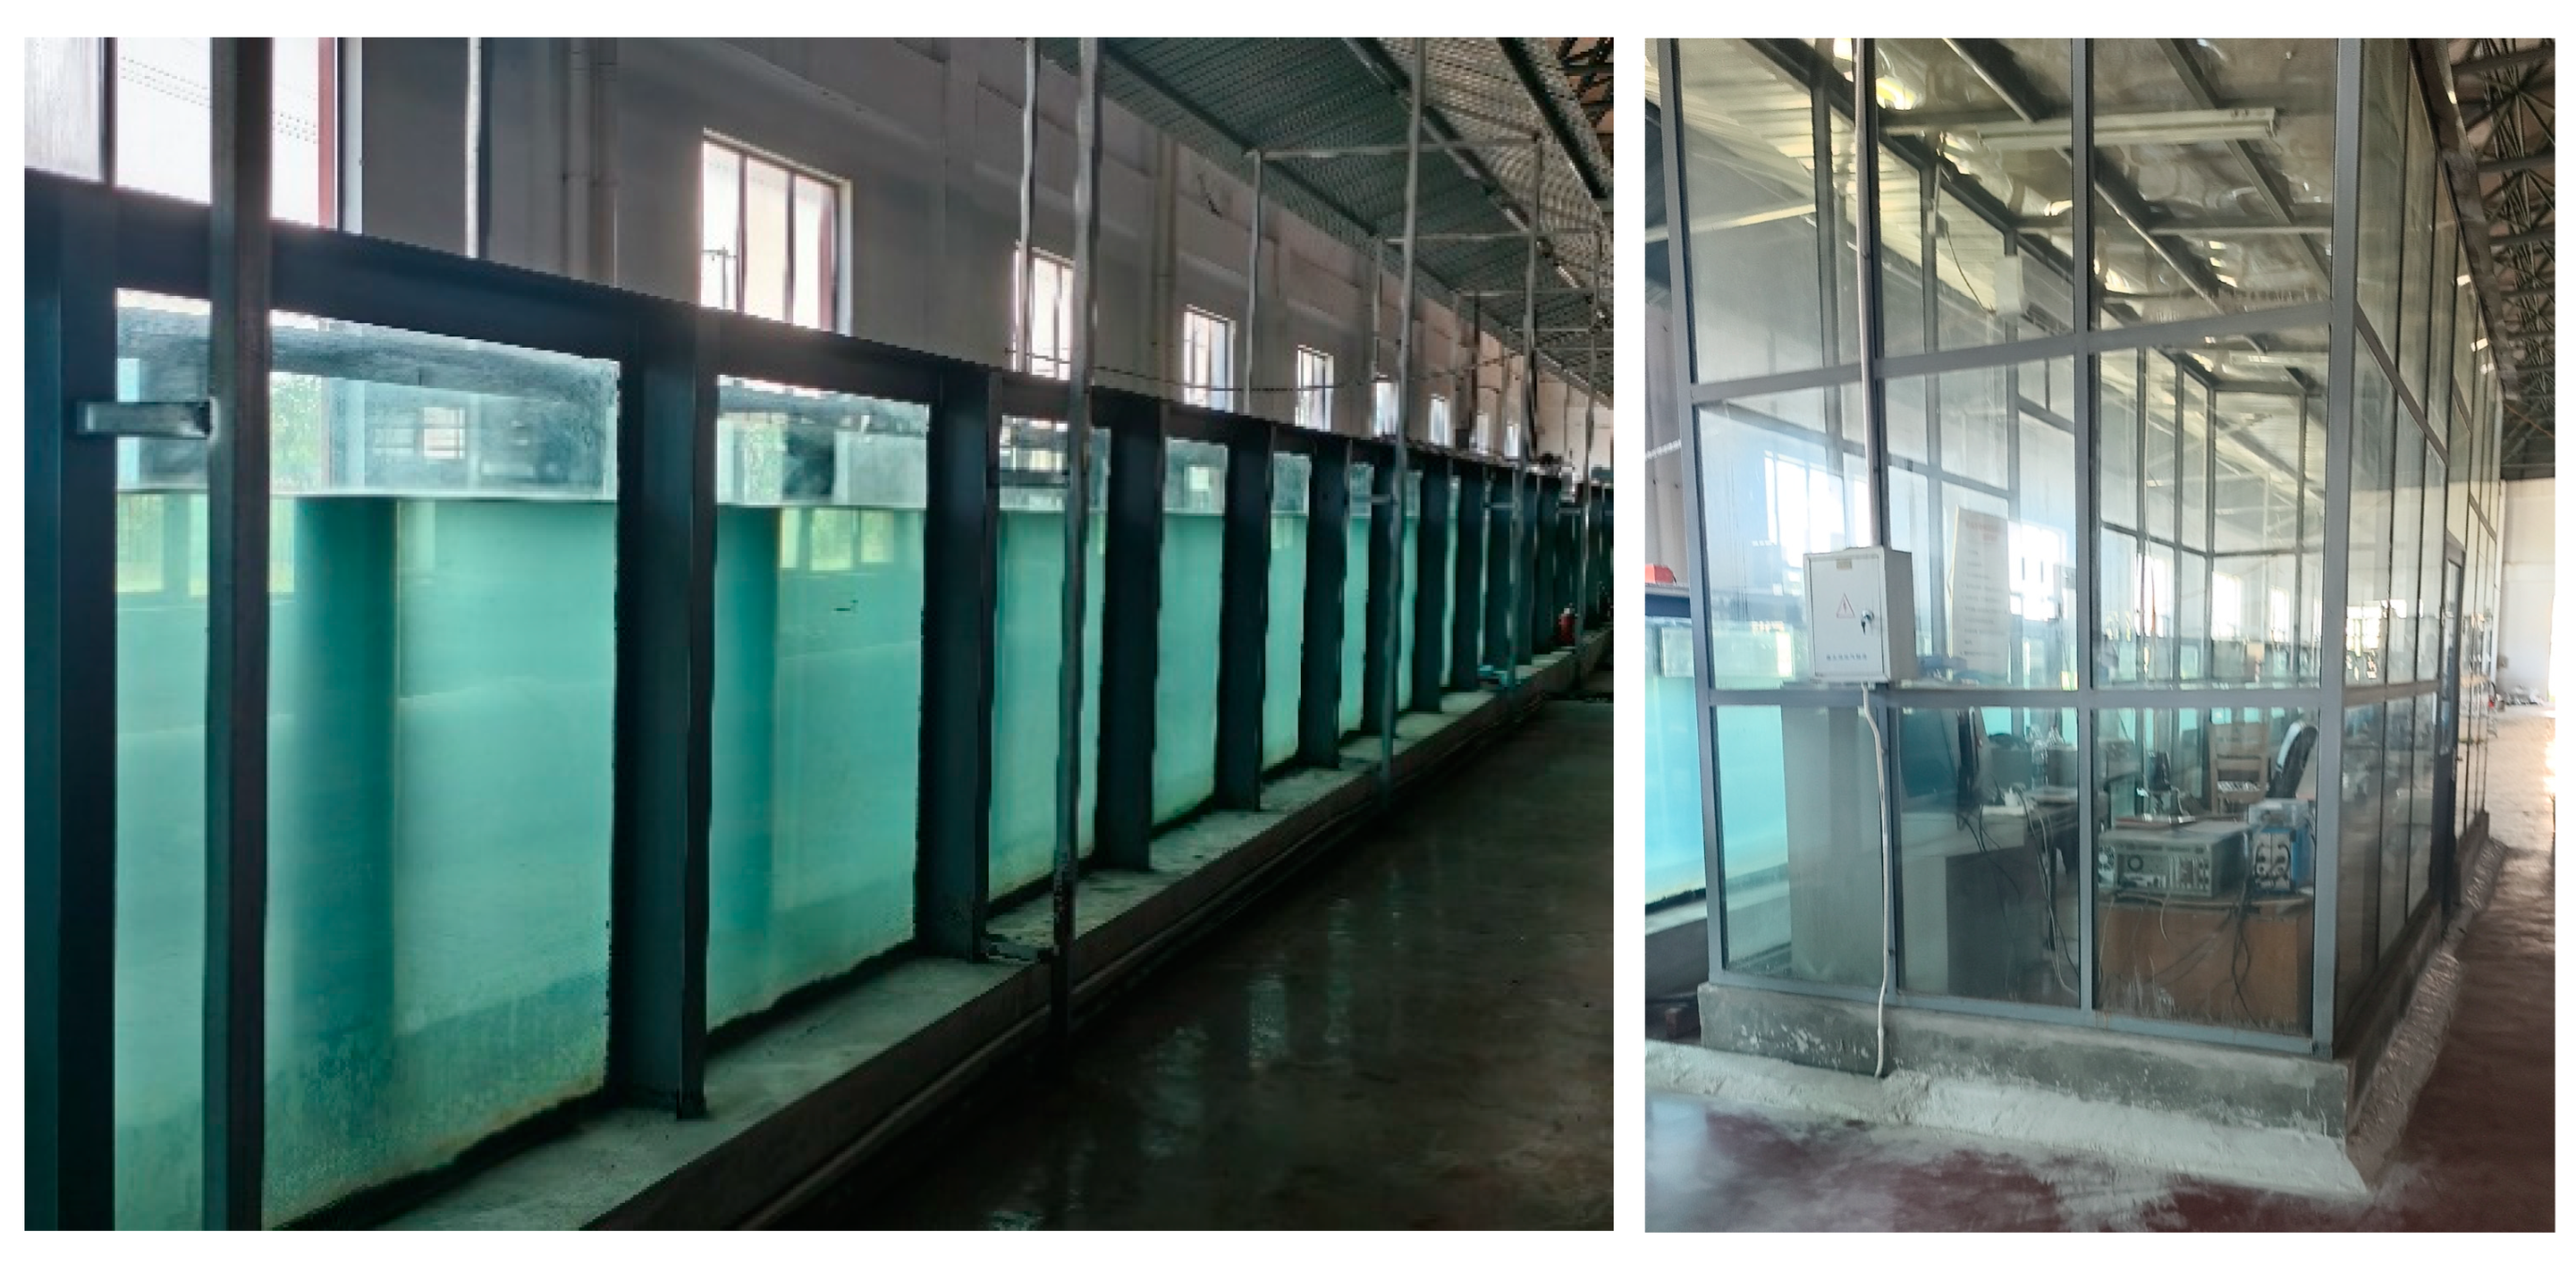
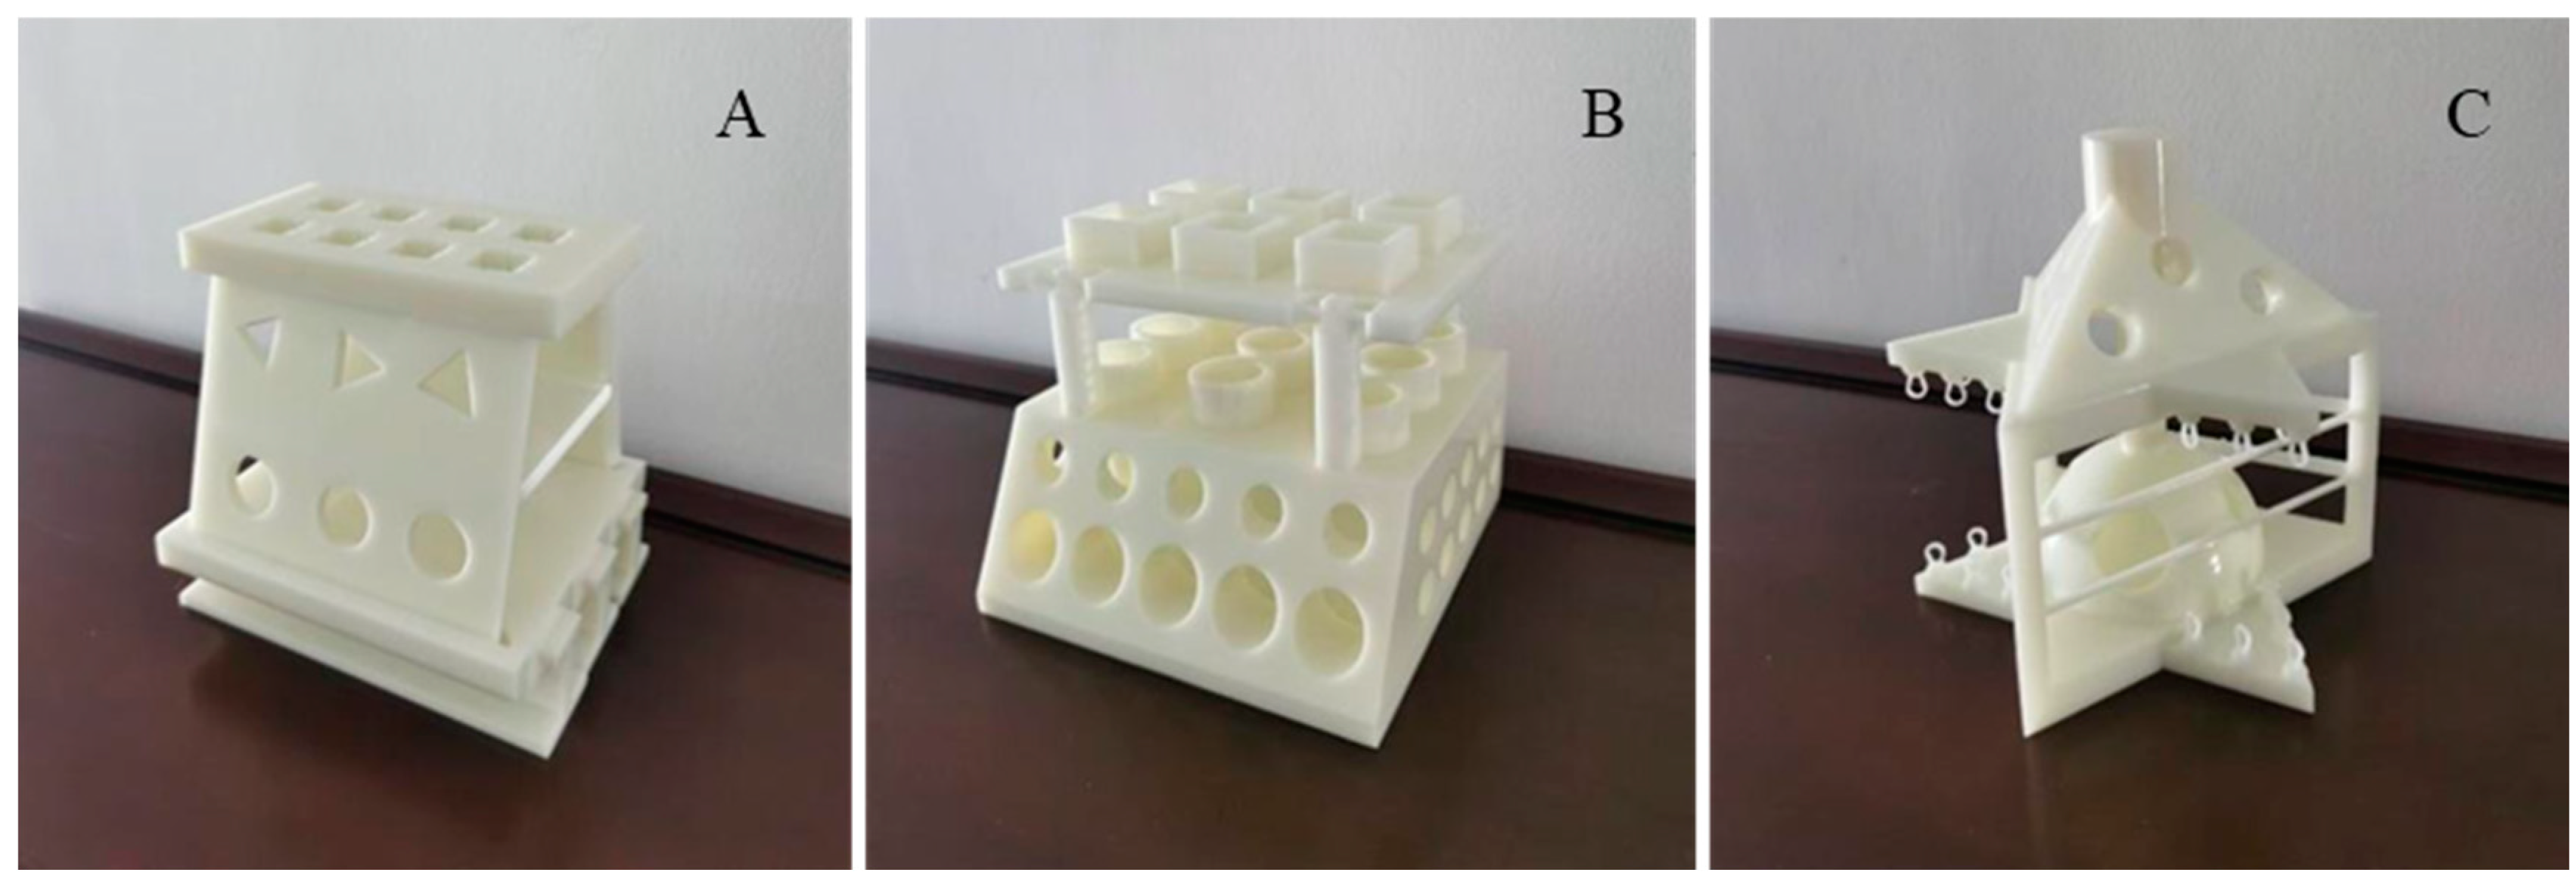
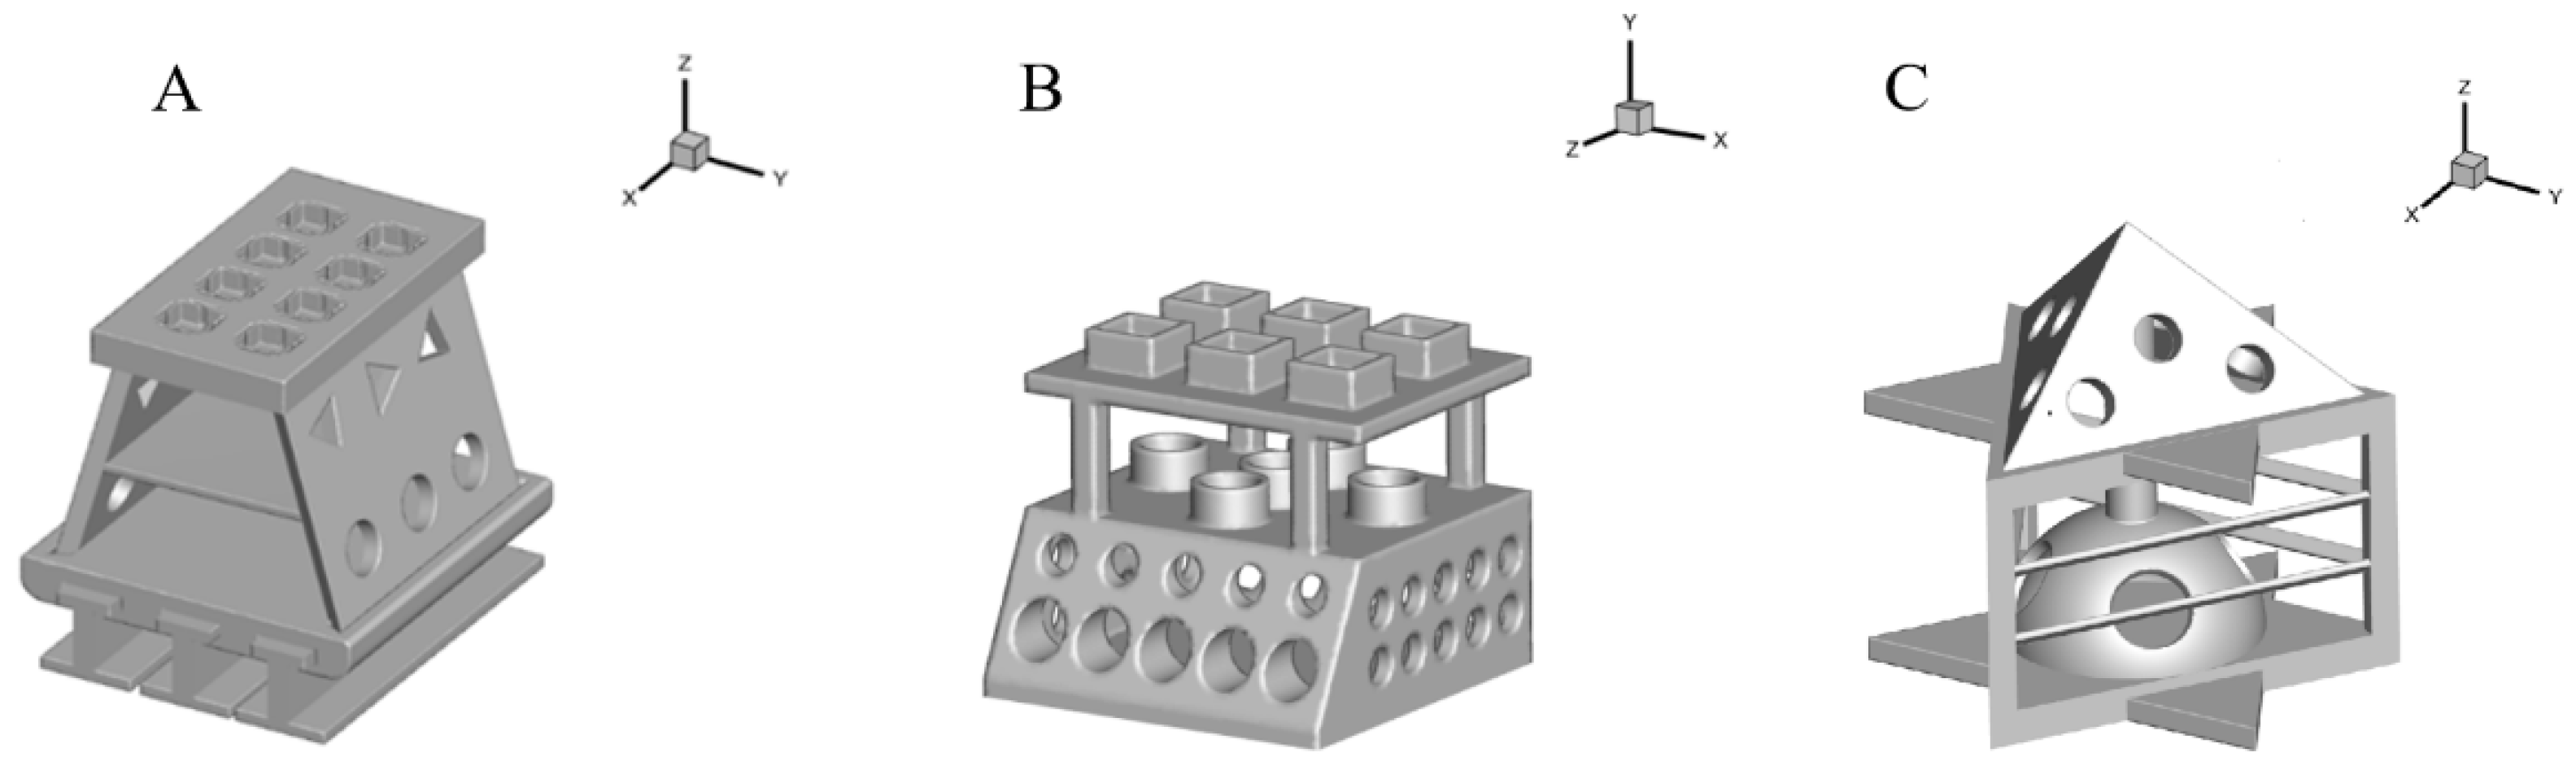
2.1. Test Conditions and Model Parameters
2.2. Test Methods and Data Acquisition
- (1)
- Based on the target flow velocity (e.g., 0.2–0.8 m/s), the required current value was calculated.
- (2)
- The flow generation system was adjusted iteratively, and repeated sampling was performed to correct deviations.
- (3)
- The calibrated flow data were transmitted to the computer-controlled interface to ensure precise flow rate settings.
- (1)
- Soak the test sand in the water tank and then spread it out;
- (2)
- Put the test water into the test model water level; the water level is 0.7 m;
- (3)
- When the water is still, slowly place the reef model in the water tank;
- (4)
- After the reef is completely immersed, start the flow generation system to flush it;
- (5)
- Each group of flow rate scouring 20 h, scouring time continuous action cumulative every 5 h with a stylus instrument for data collection and scouring photos.
2.3. Theoretical Calculation of Starting Flow Rate
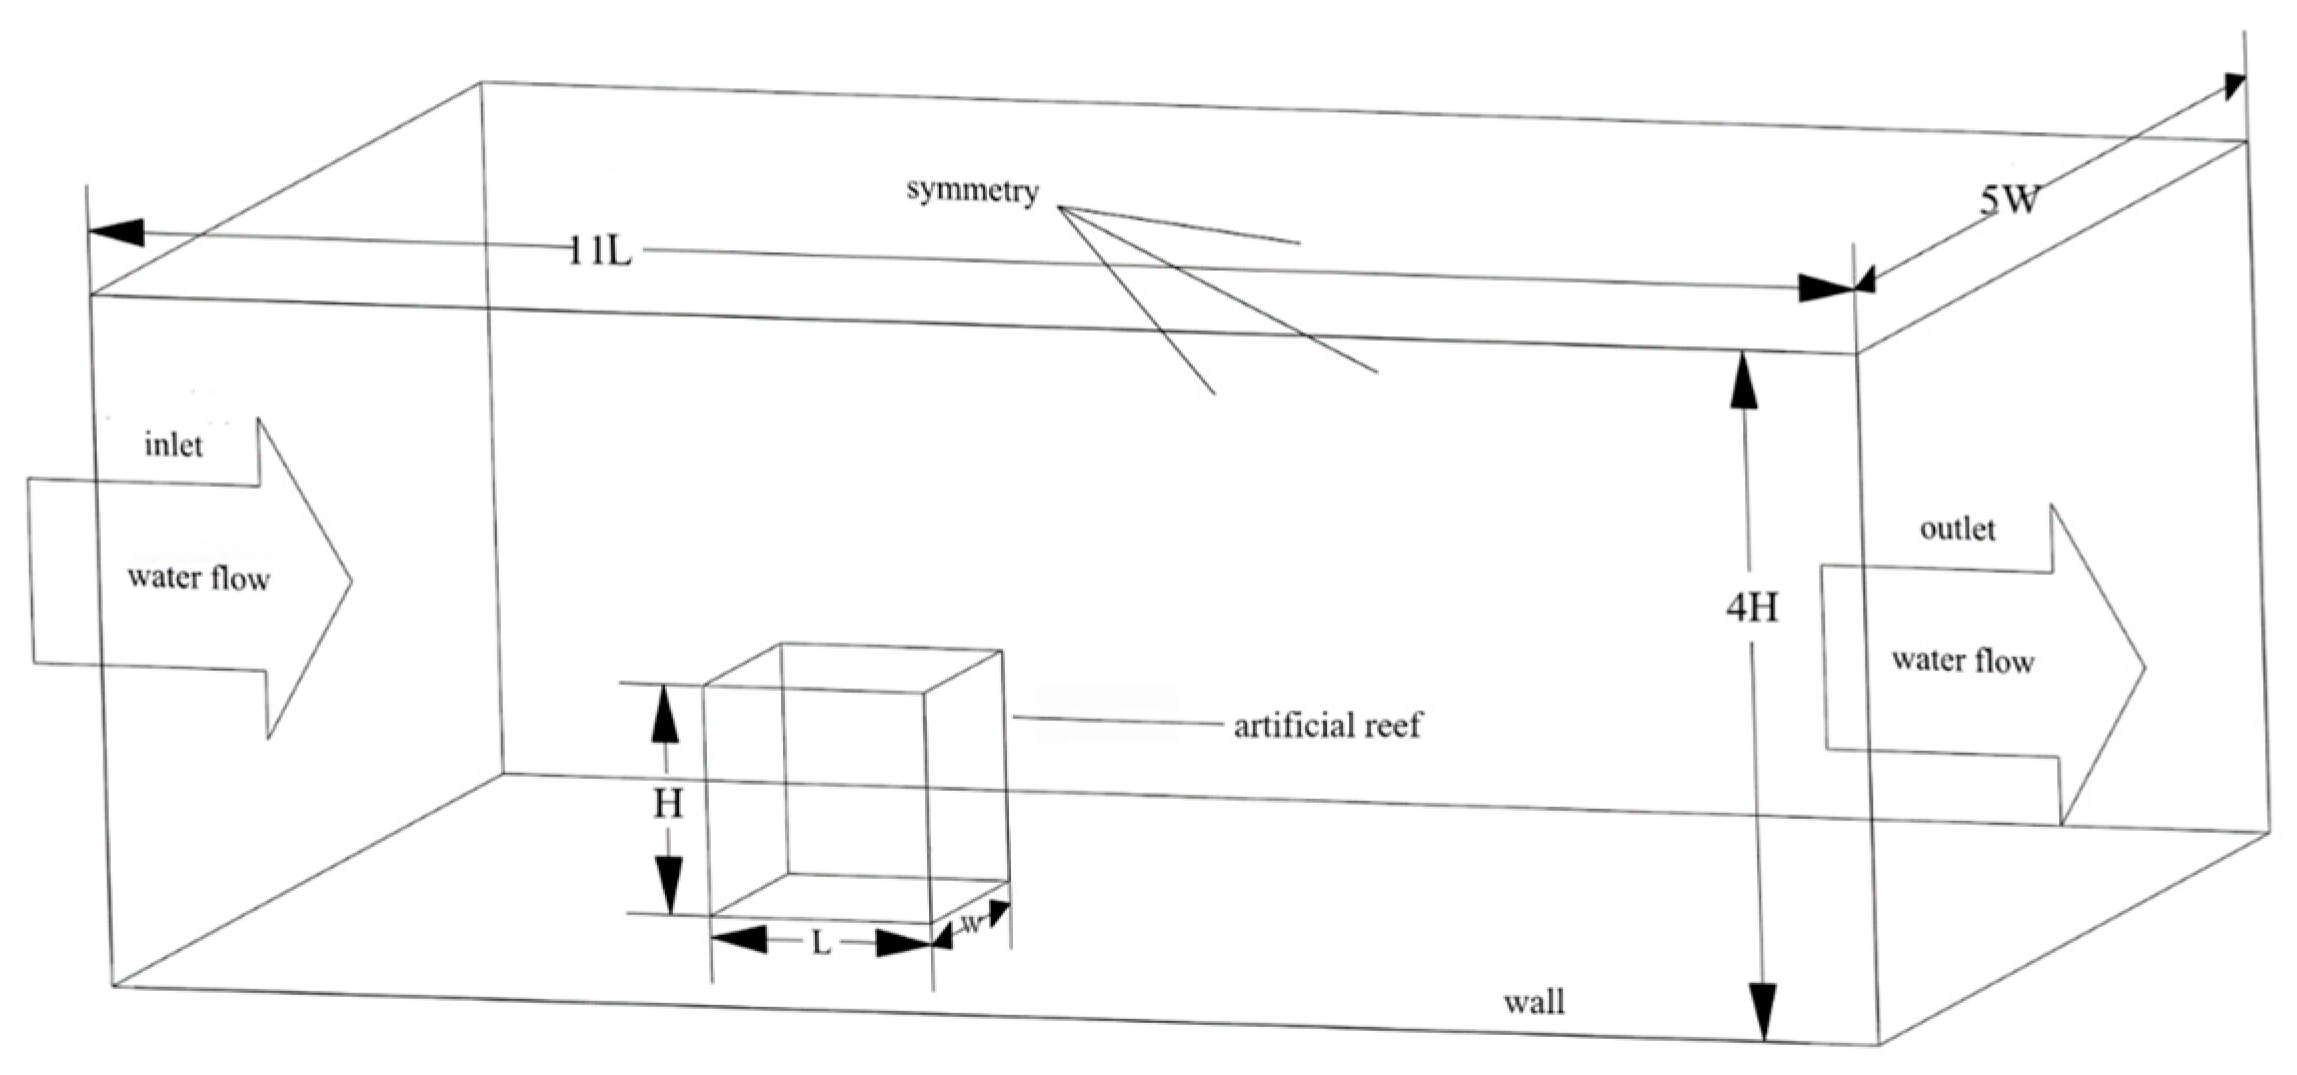
2.4. Numerical Simulation Methods
3. Results
3.1. Model Test Results
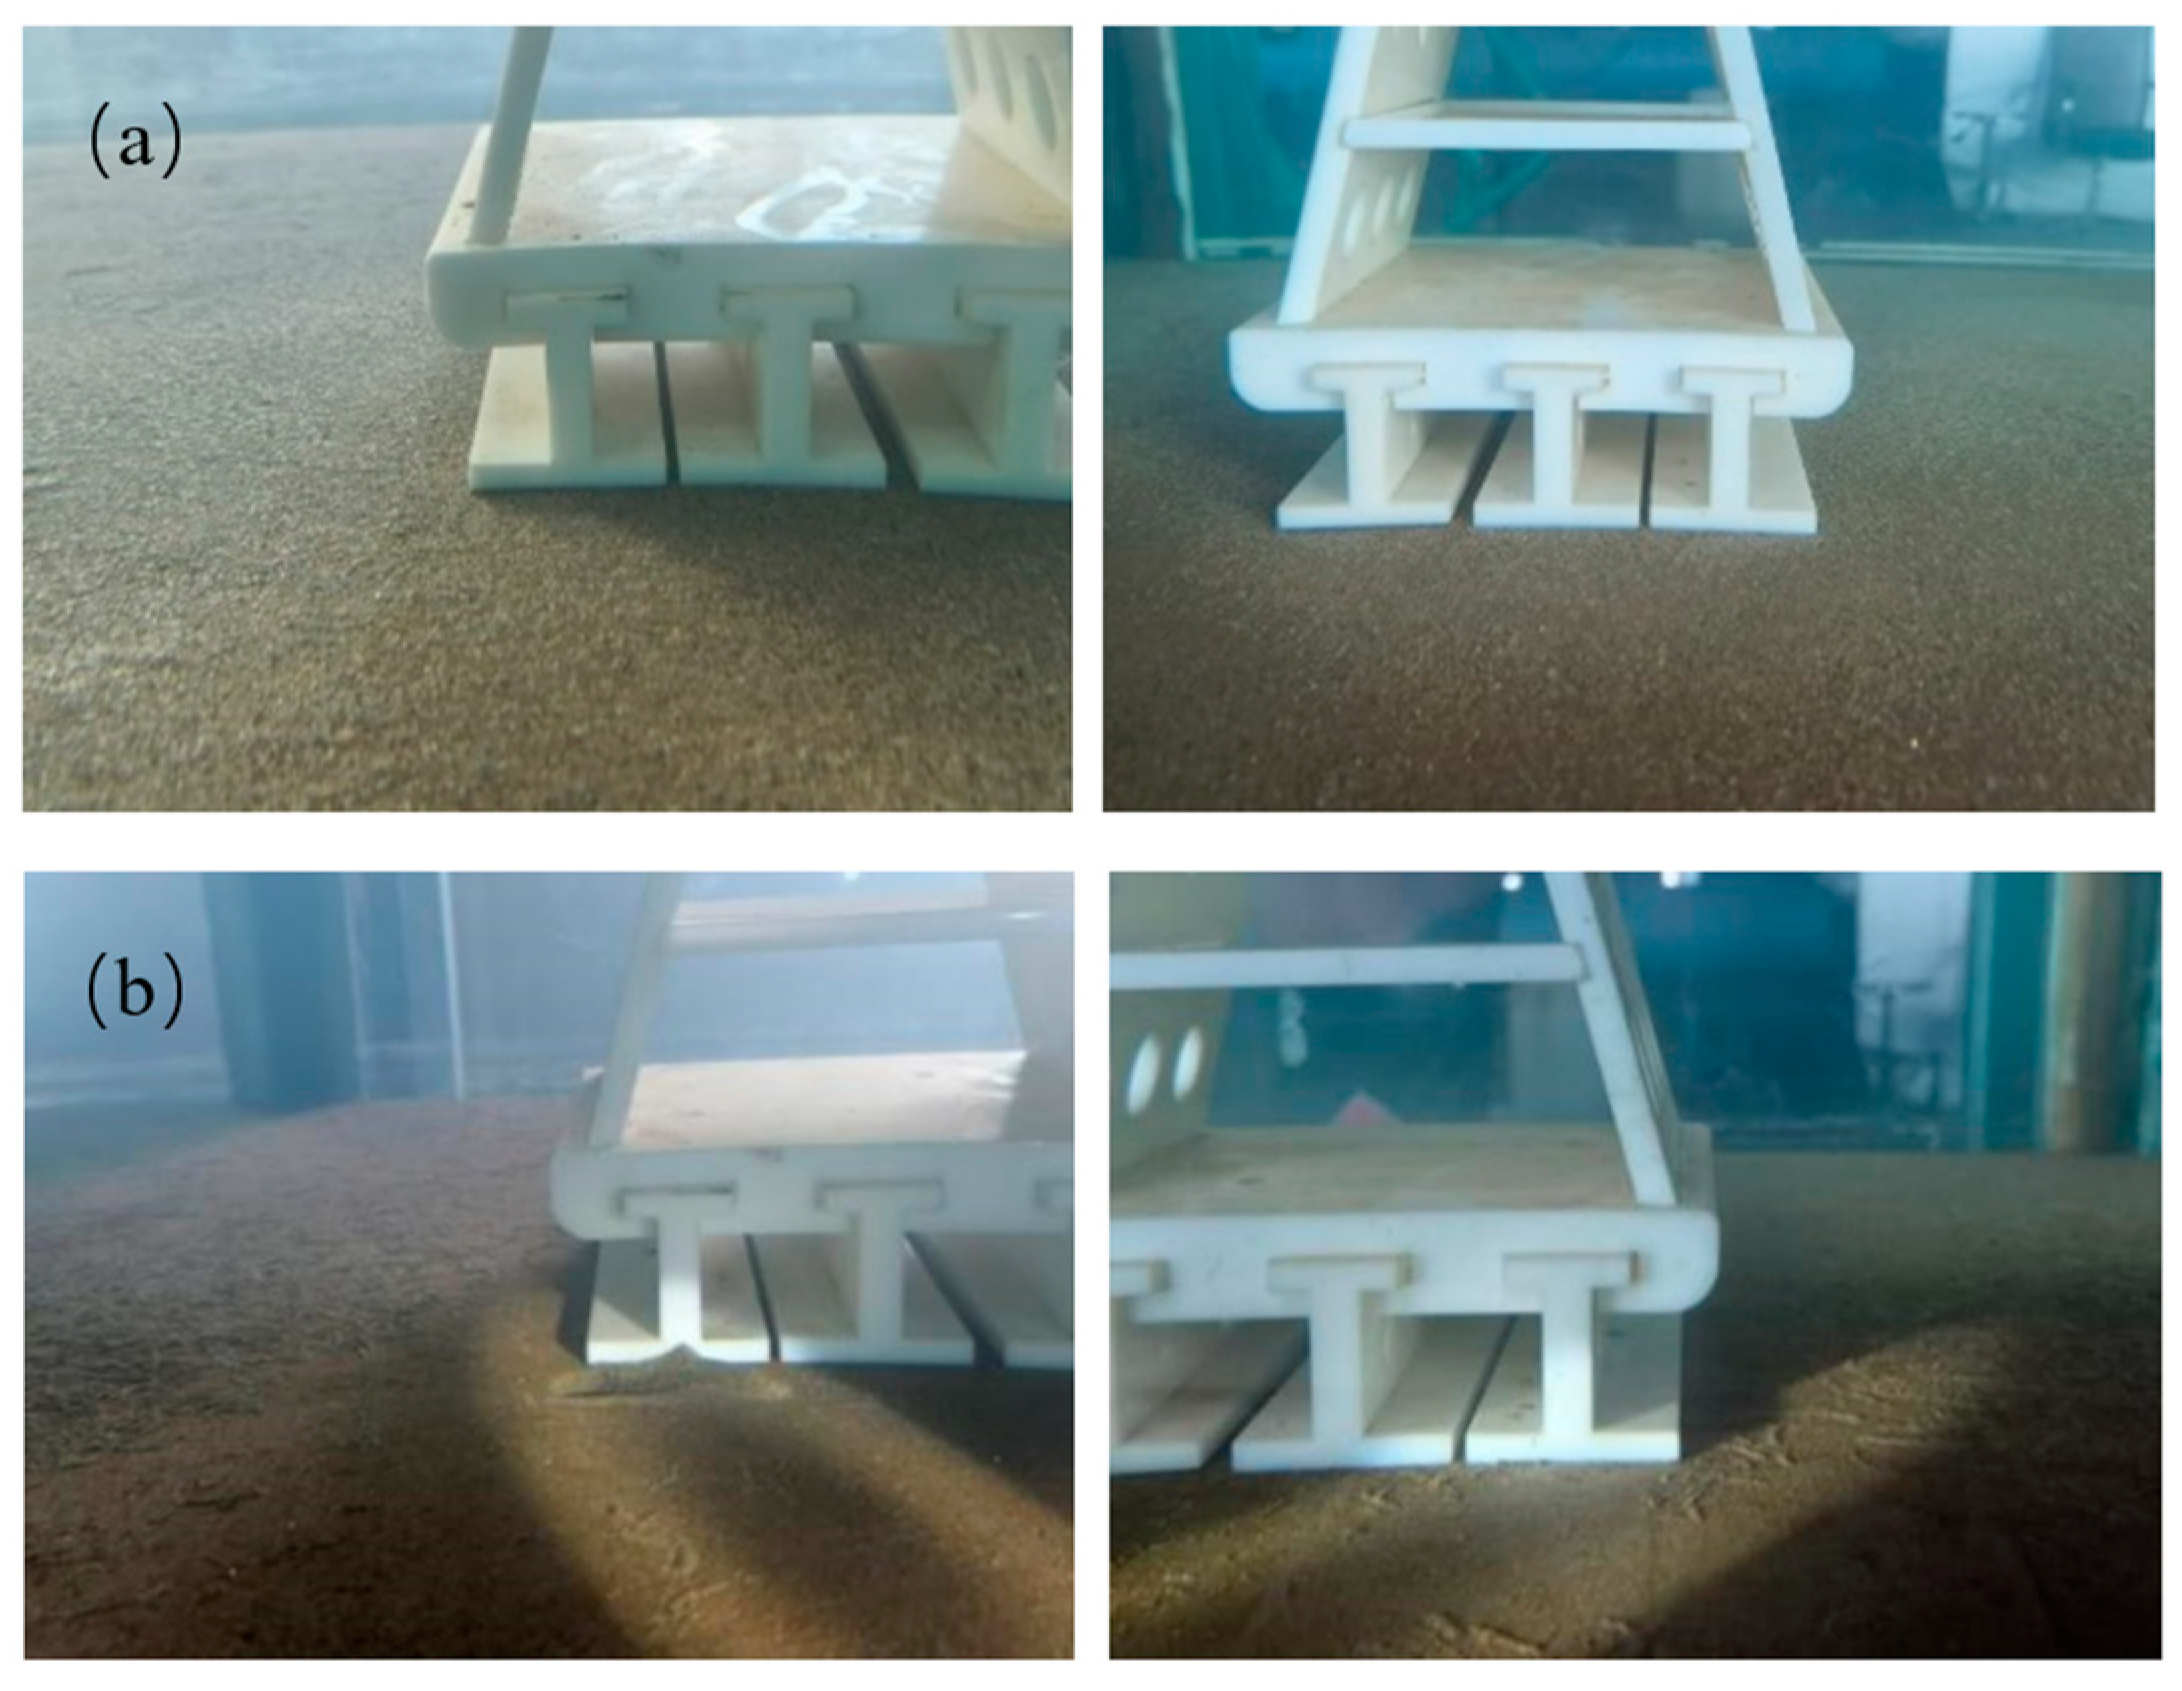
3.1.1. Reef A
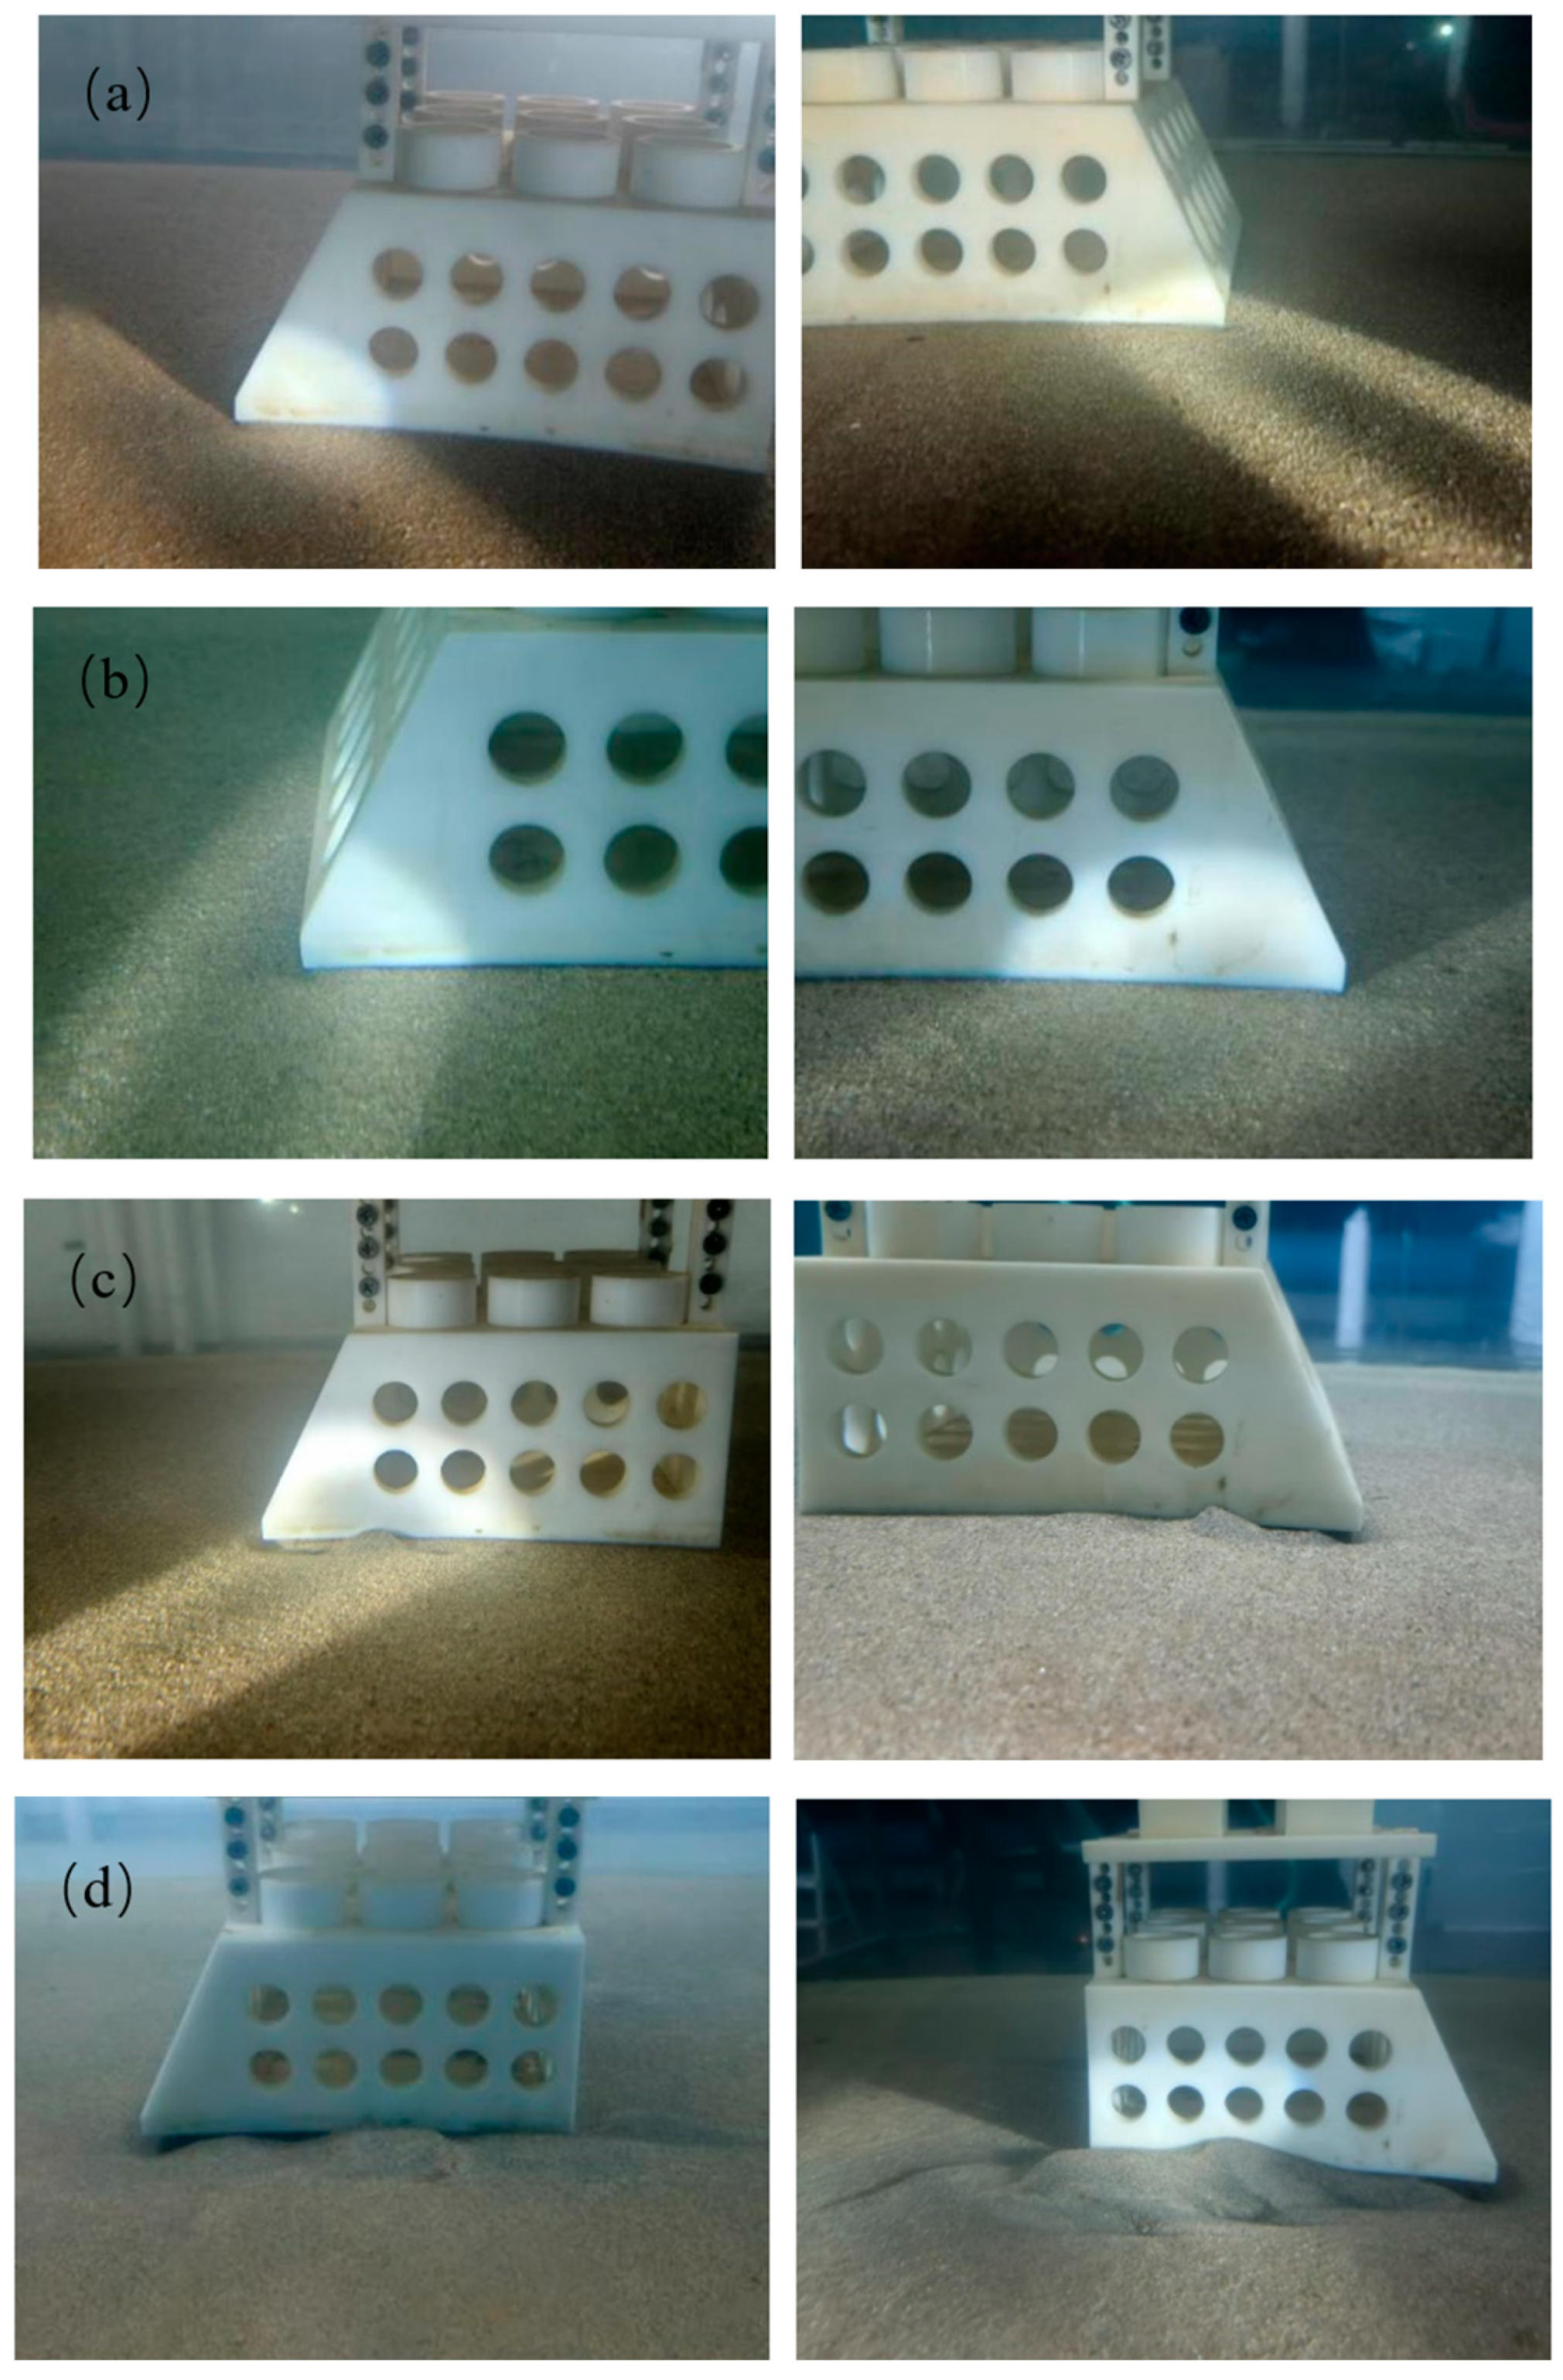
3.1.2. Reef B
3.1.3. Reef C
3.1.4. Calculation of Starting Flow Rate
3.2. Numerical Simulation
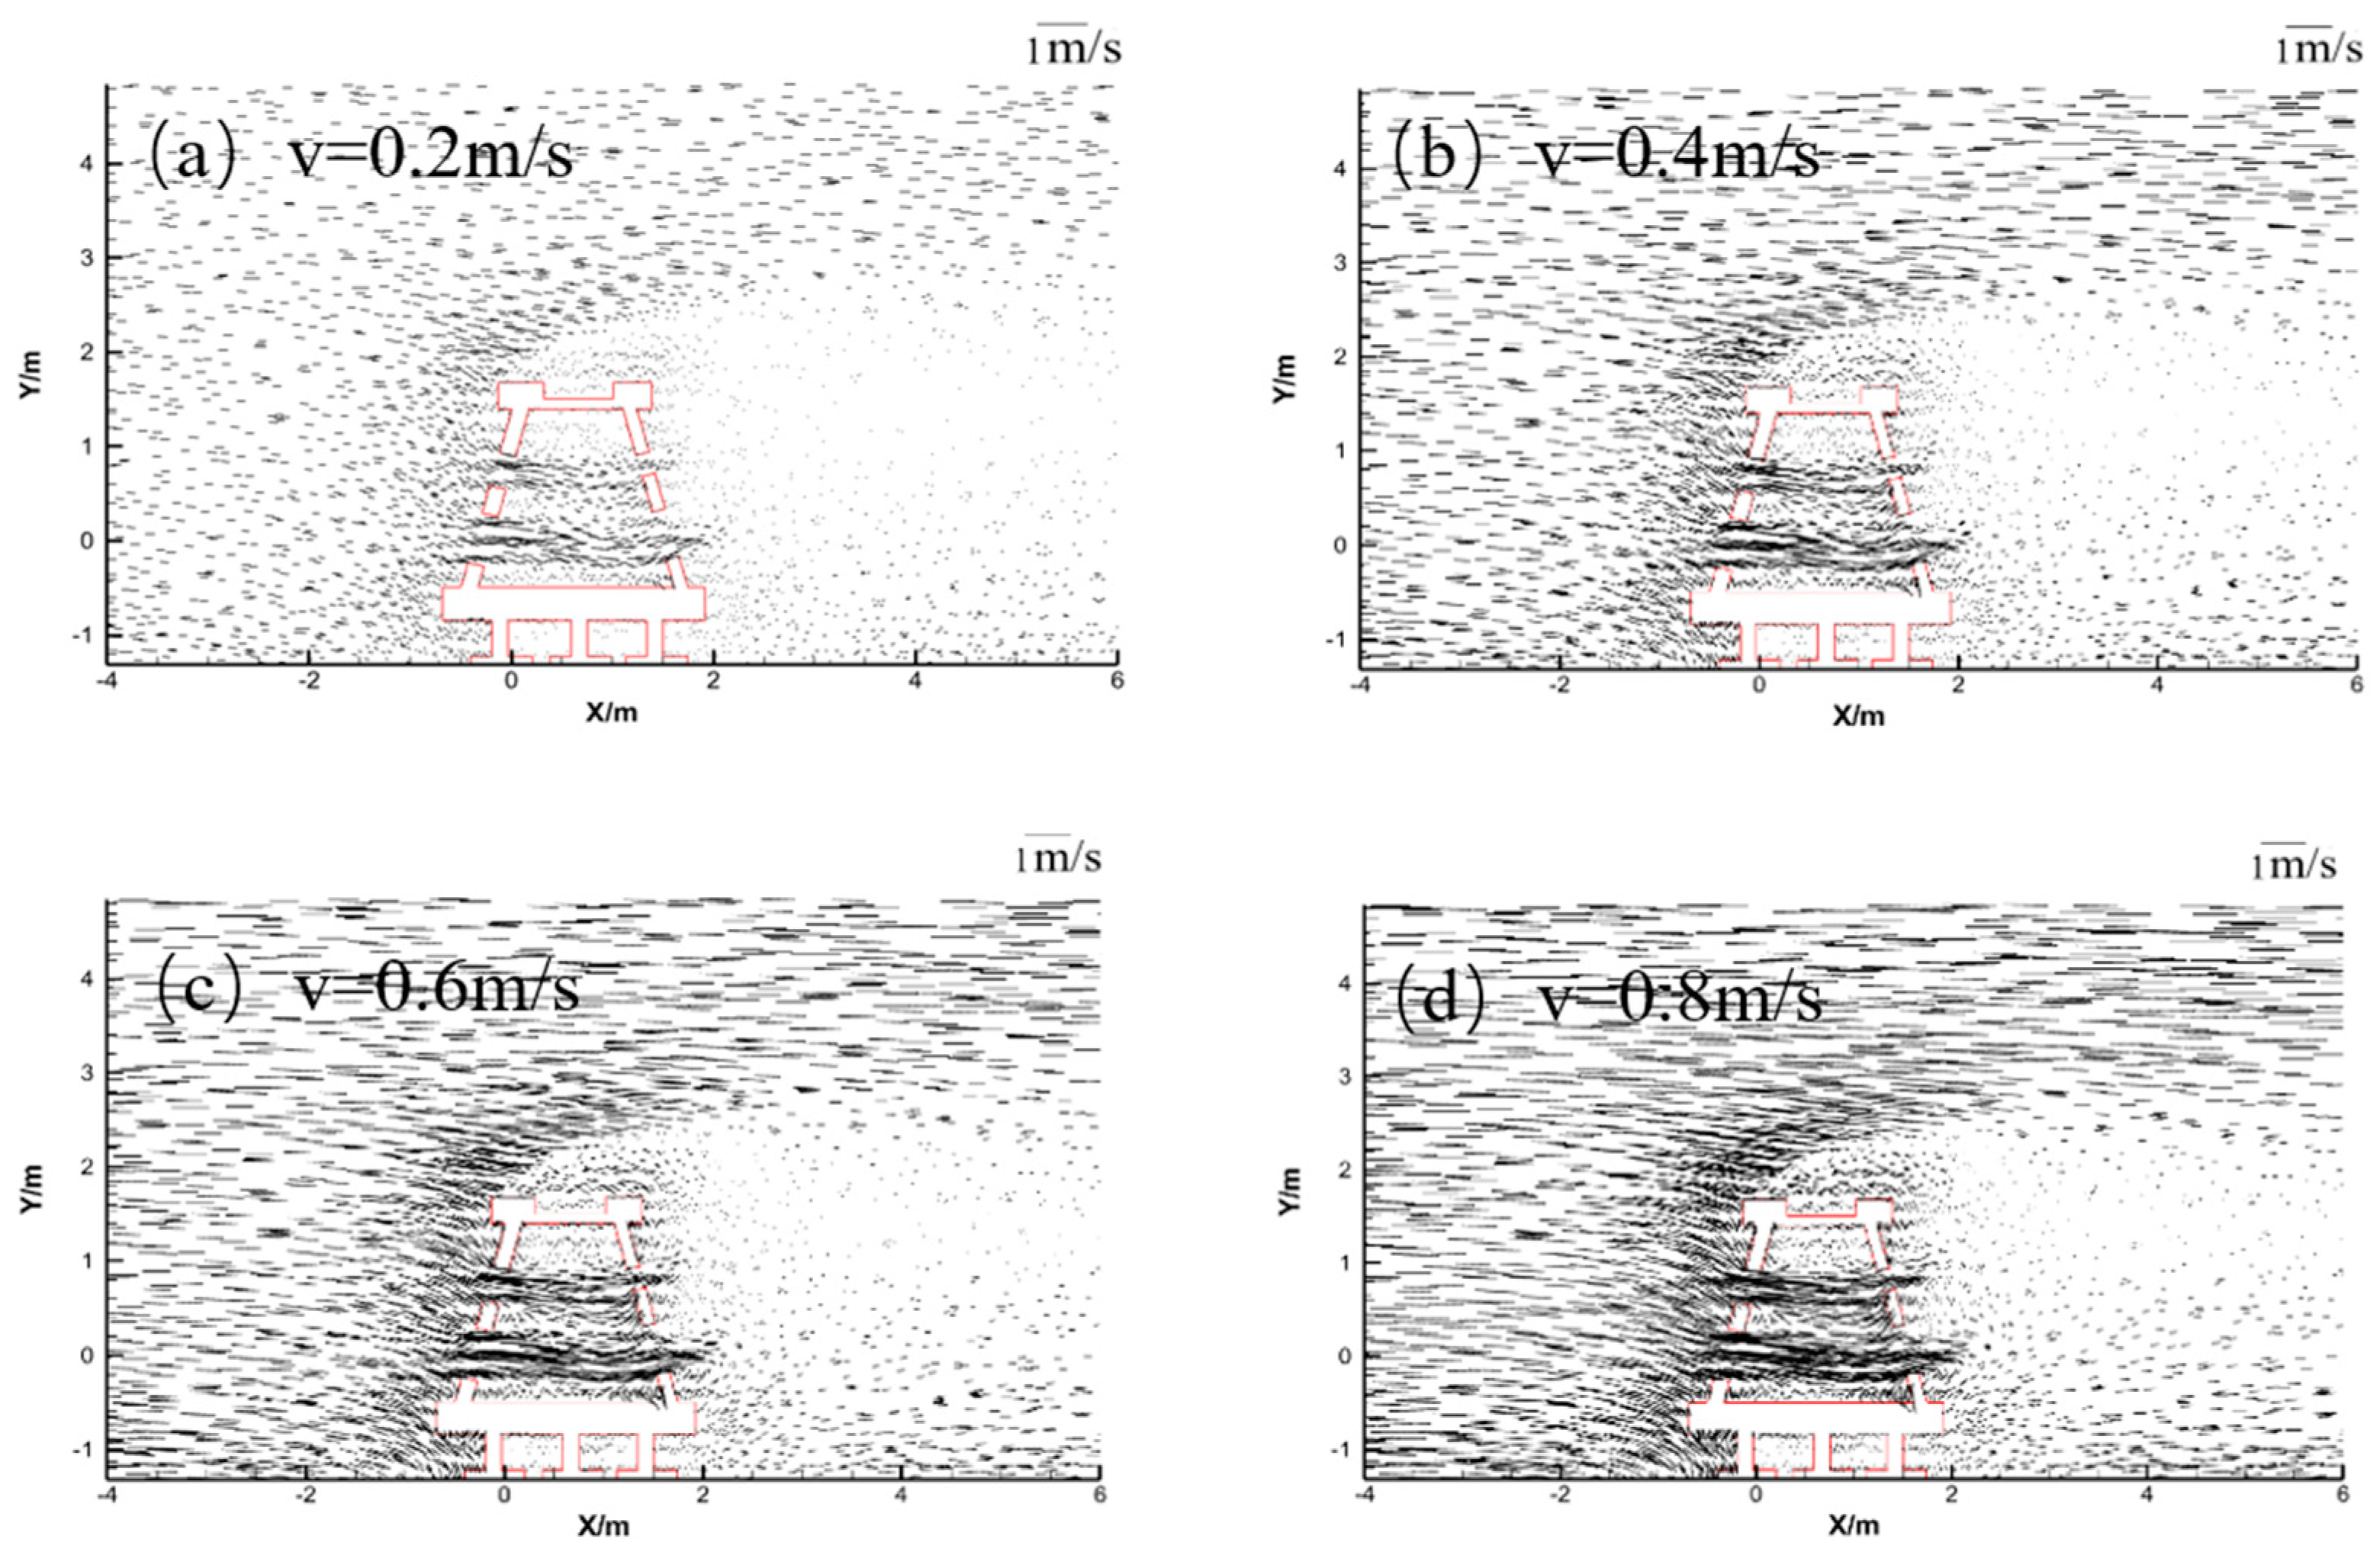
3.2.1. Analysis of Numerical Simulation Results for Reef A
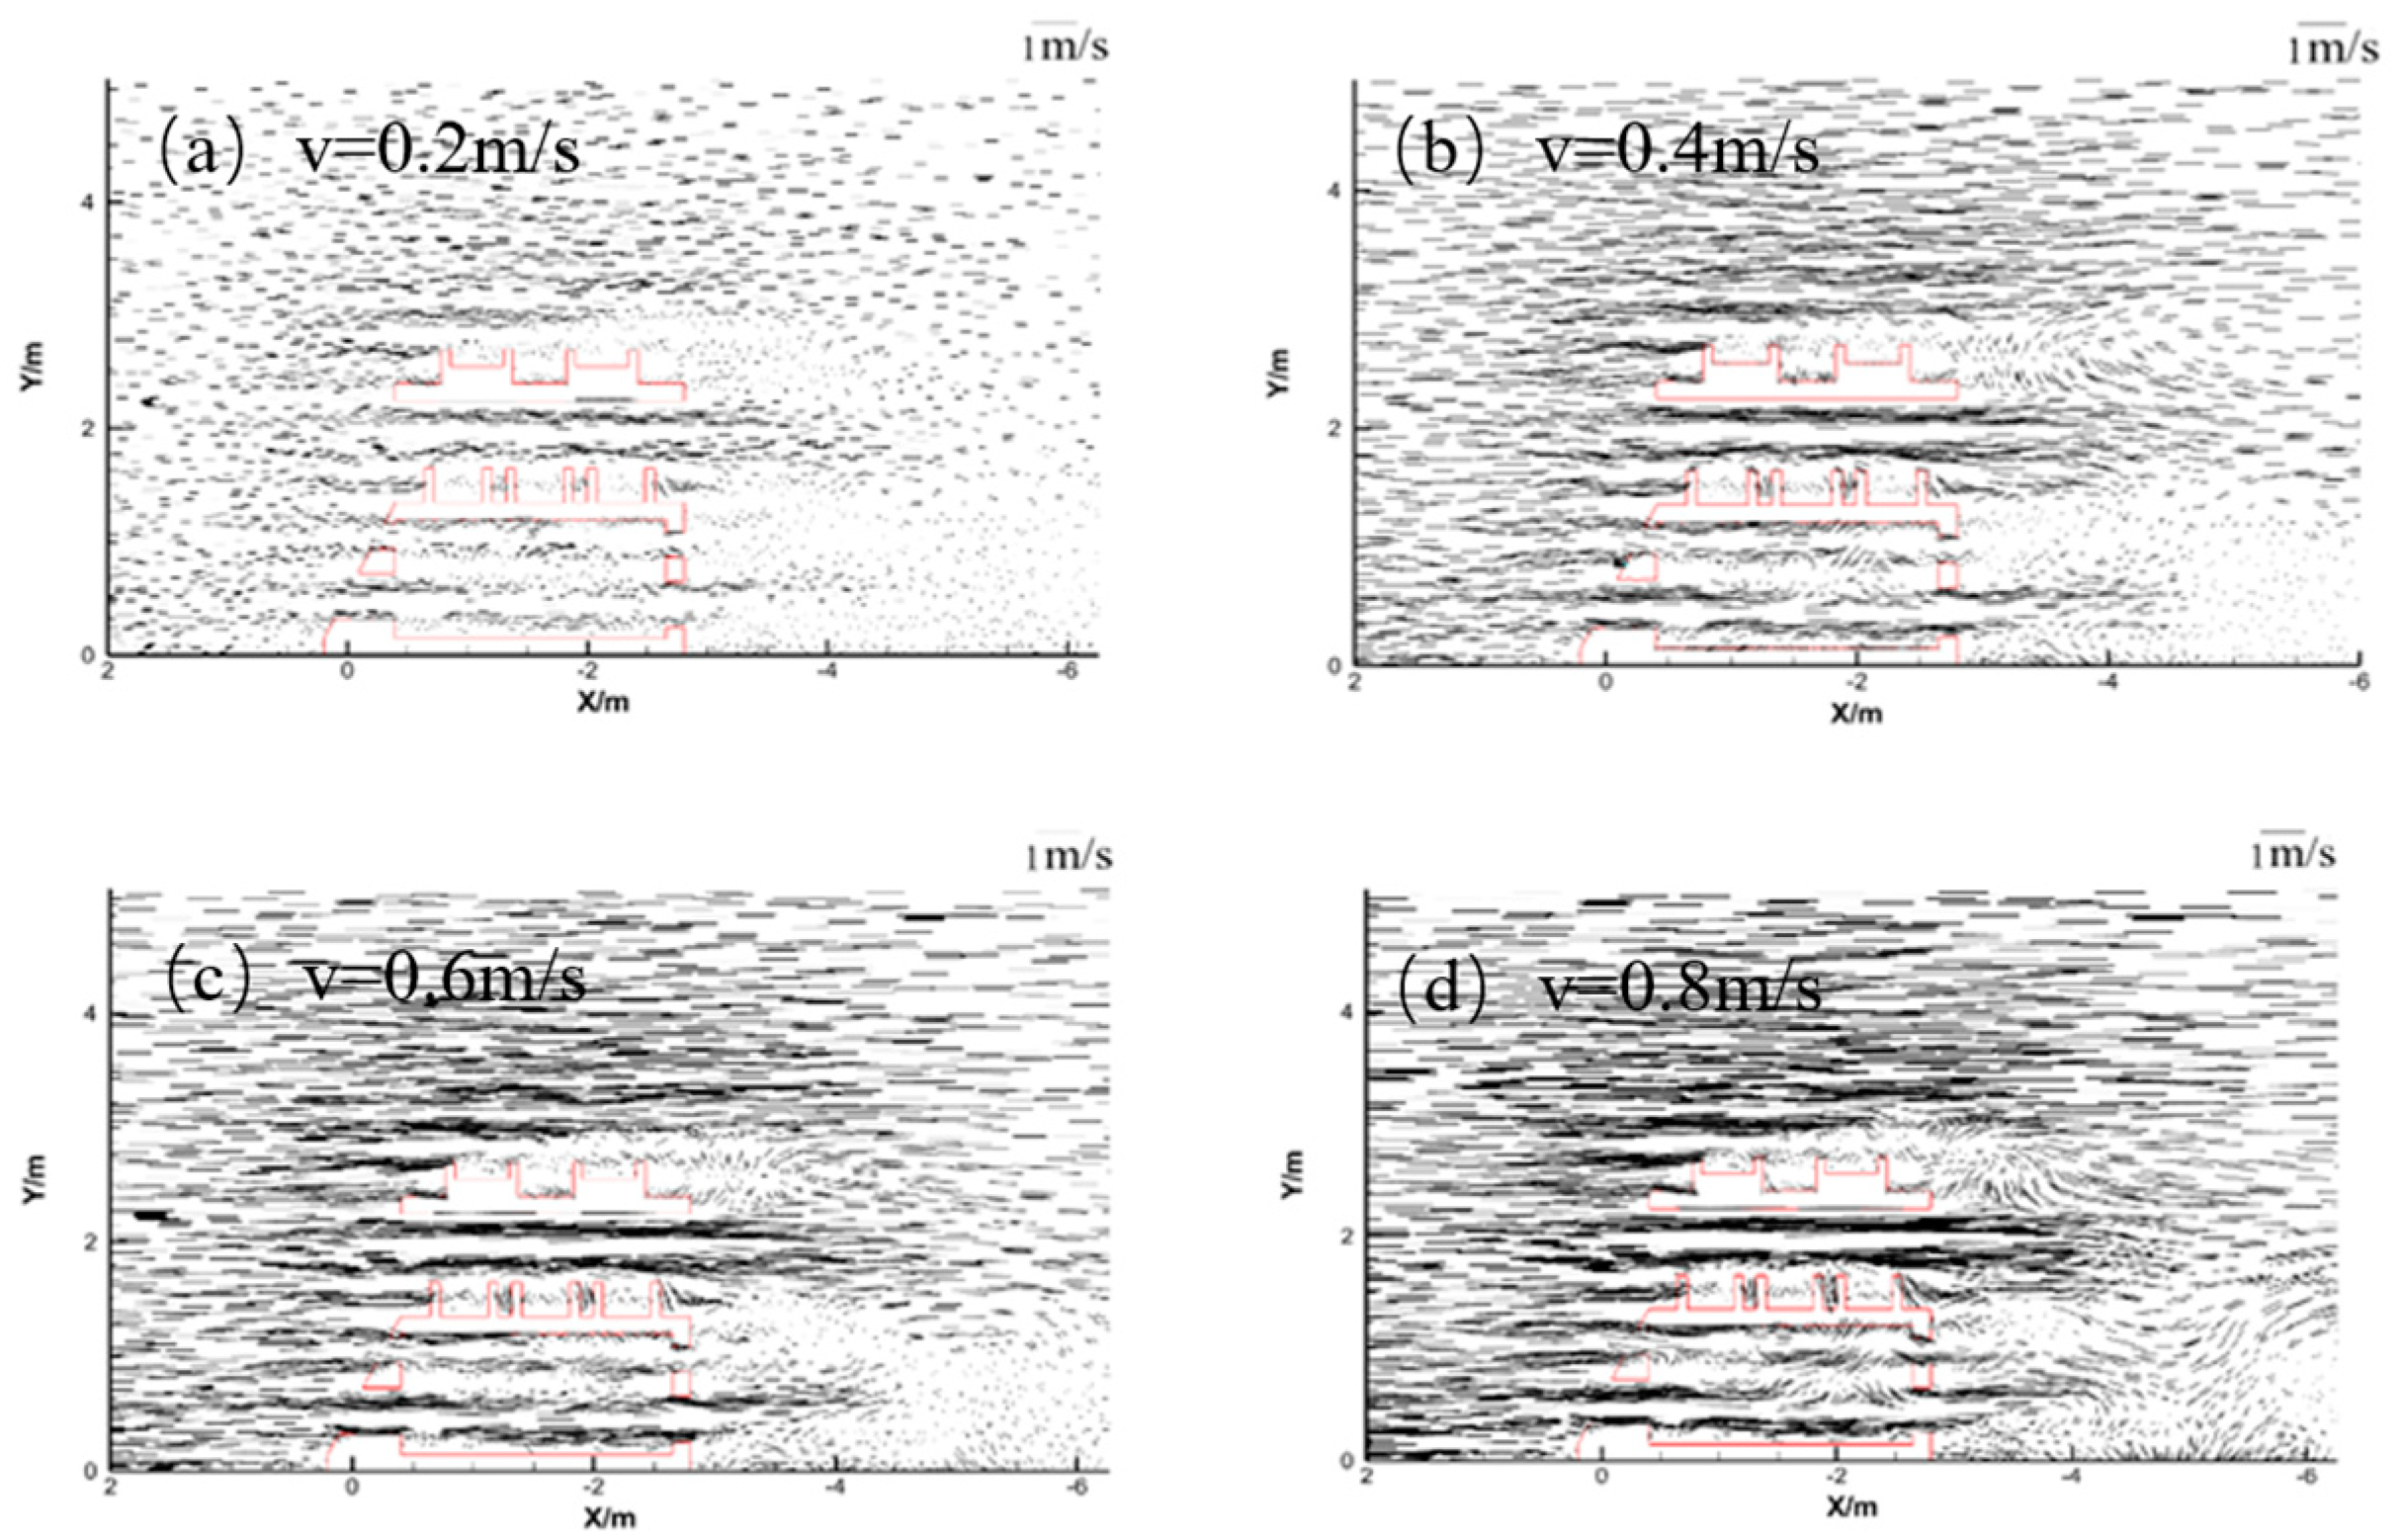
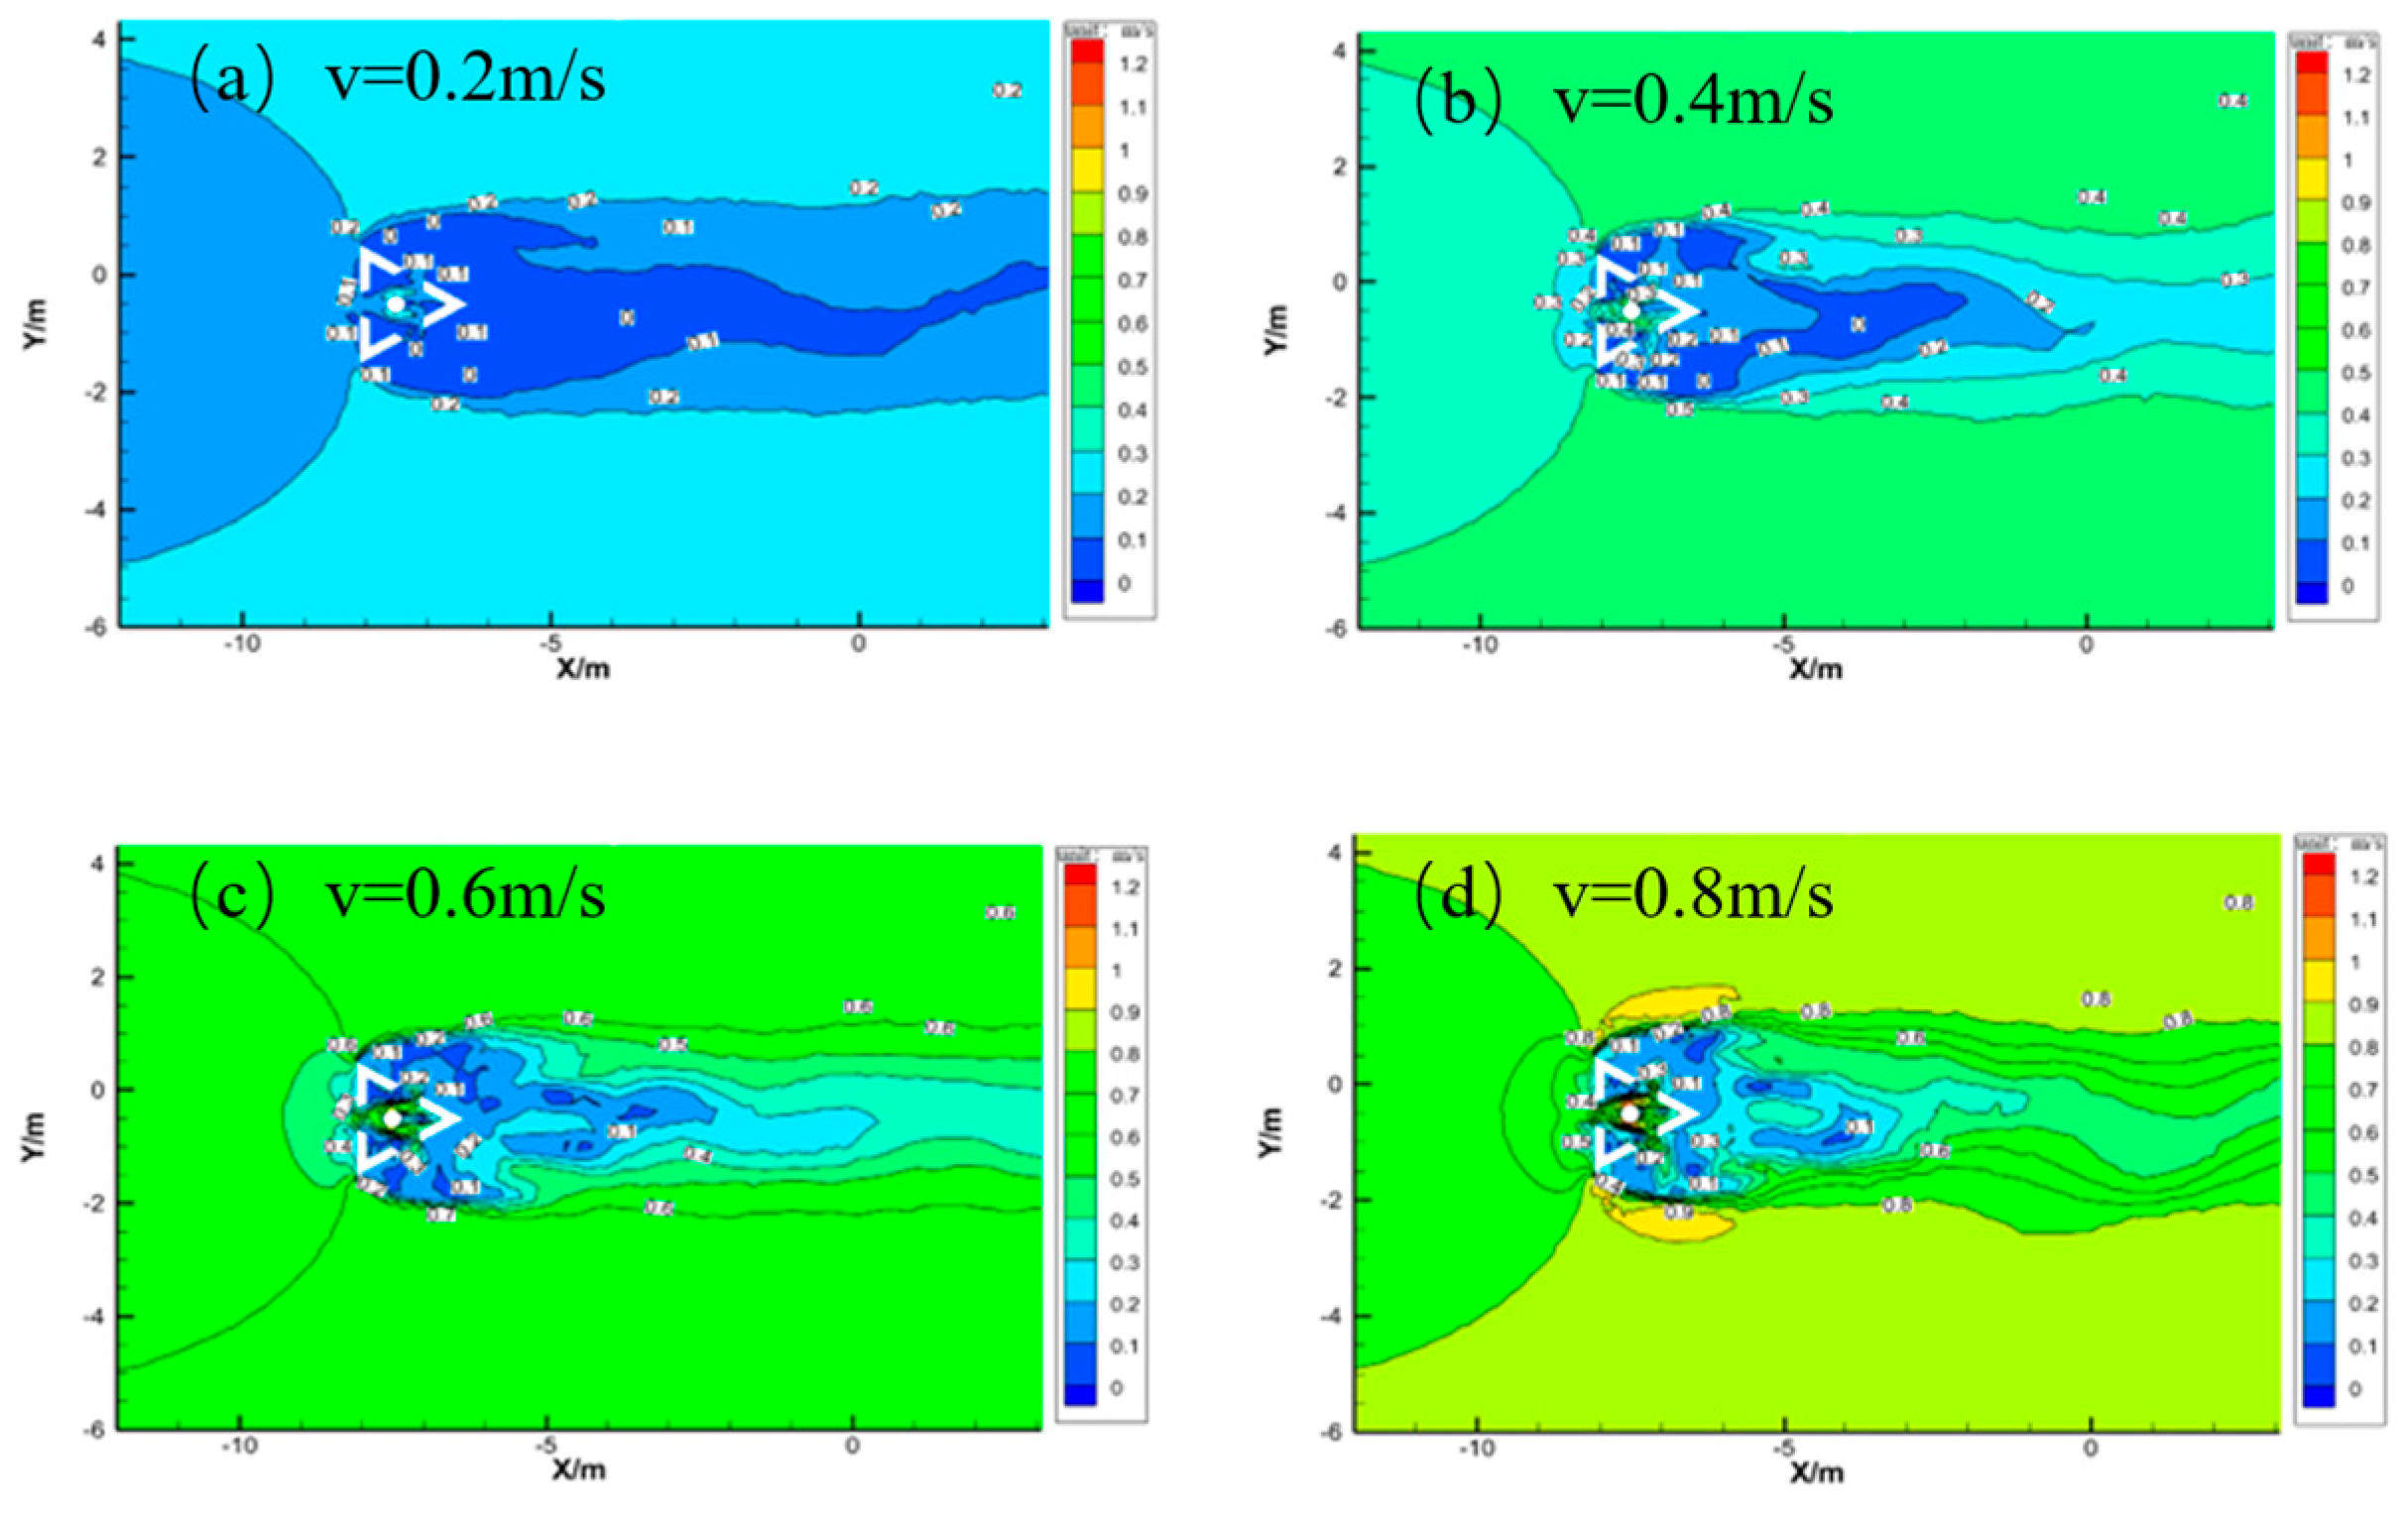
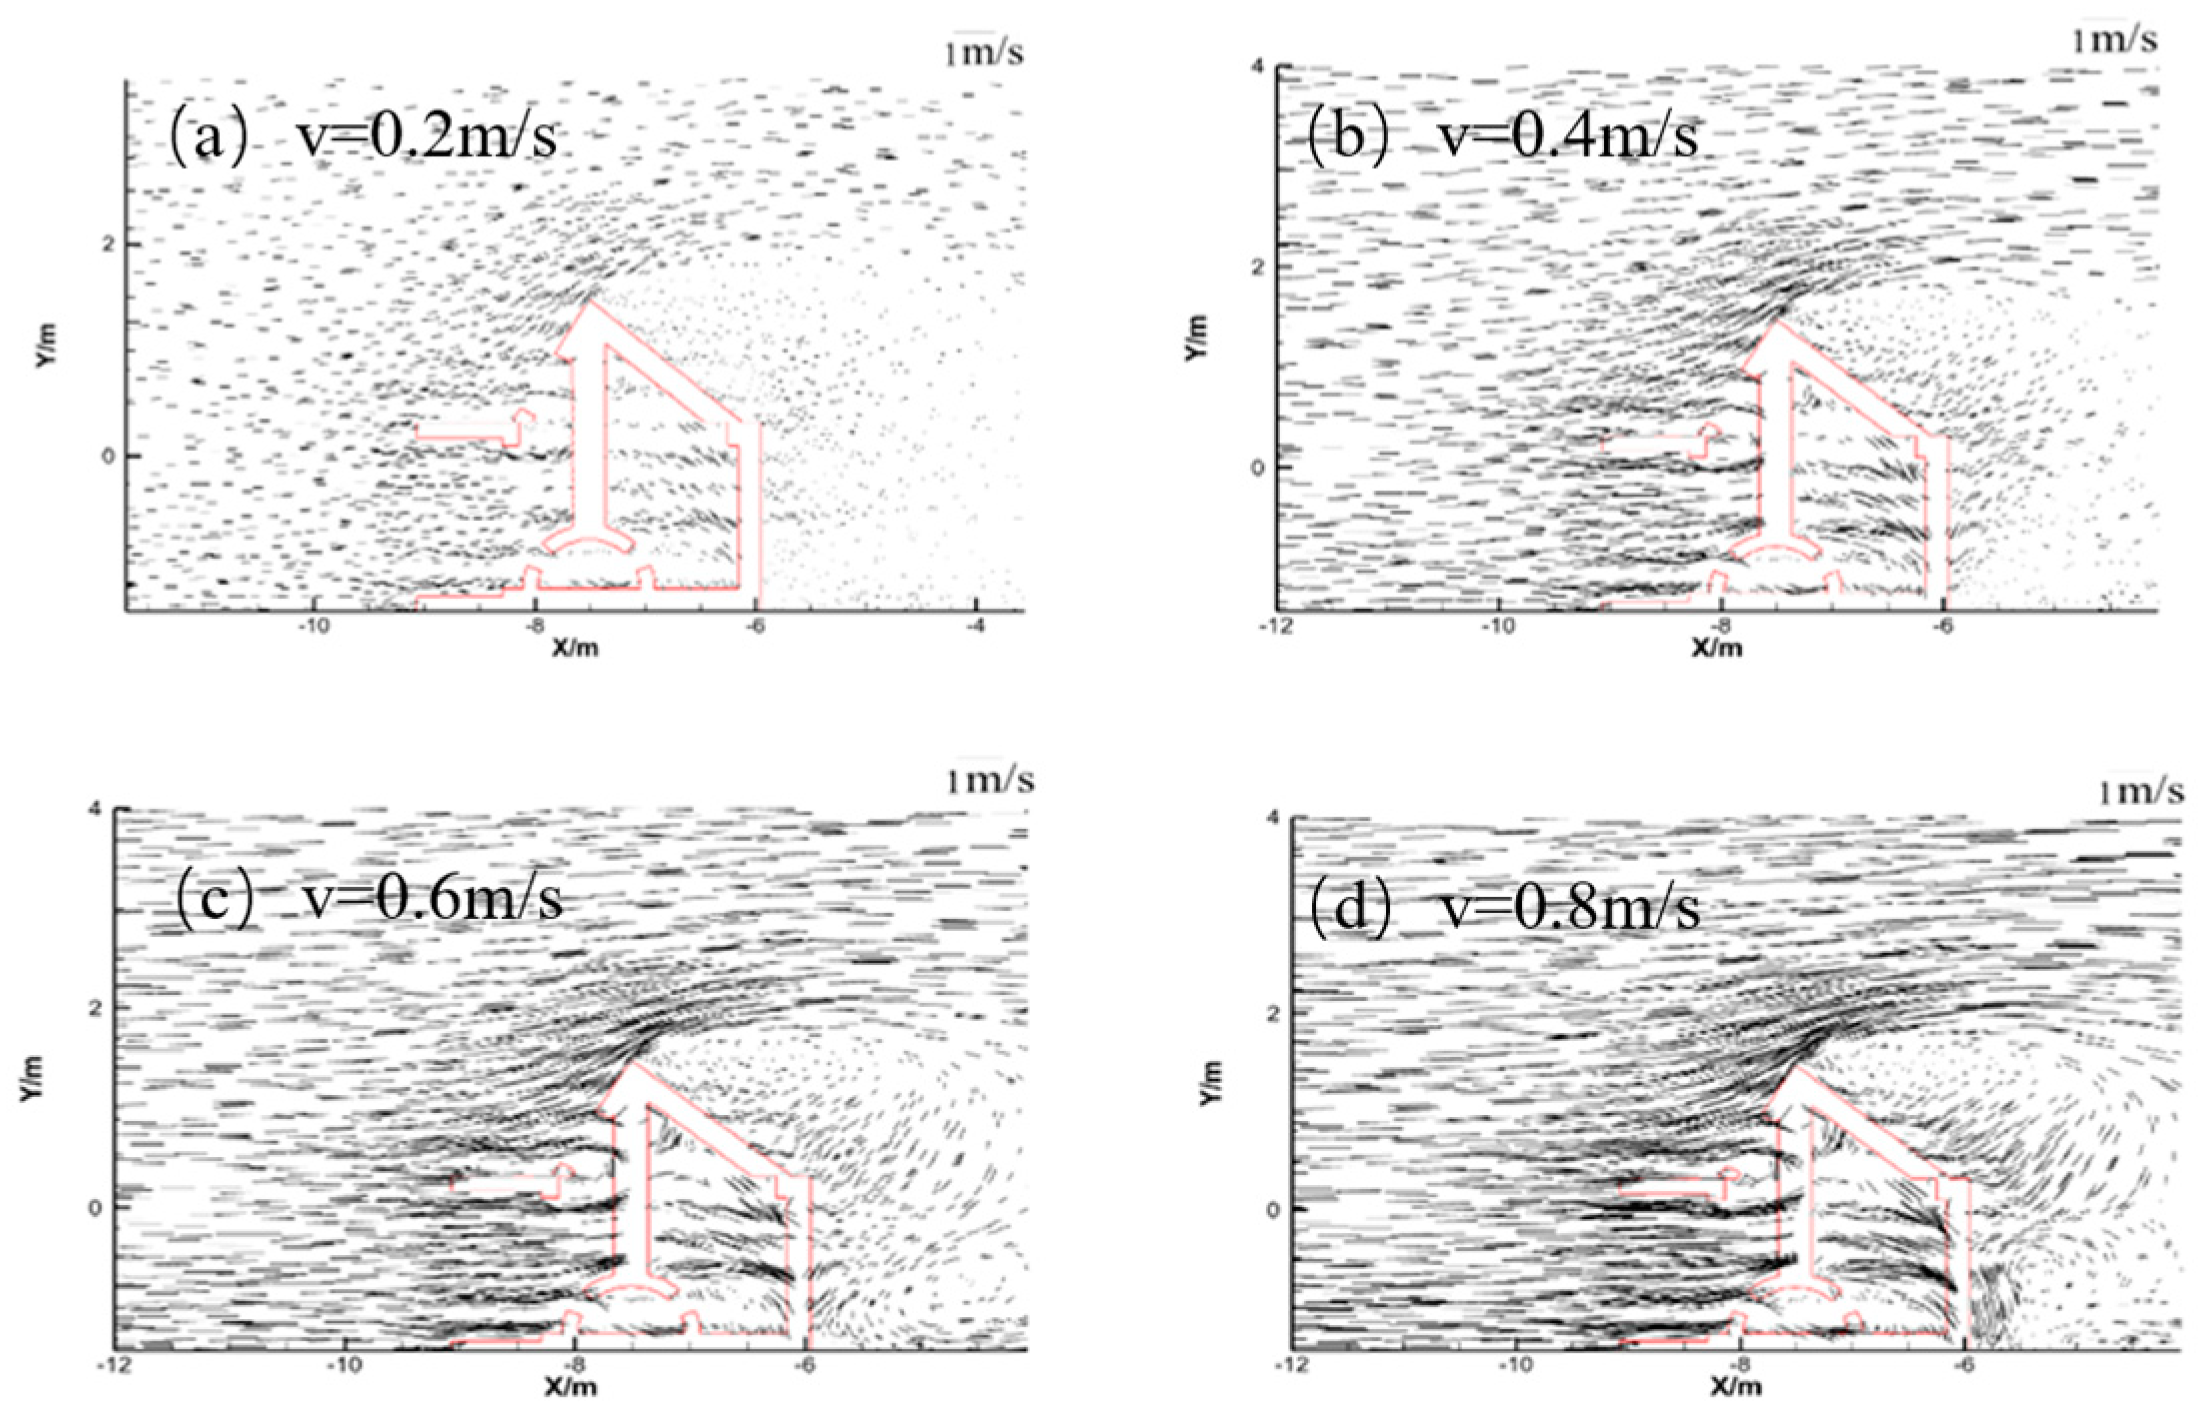
Velocity Field
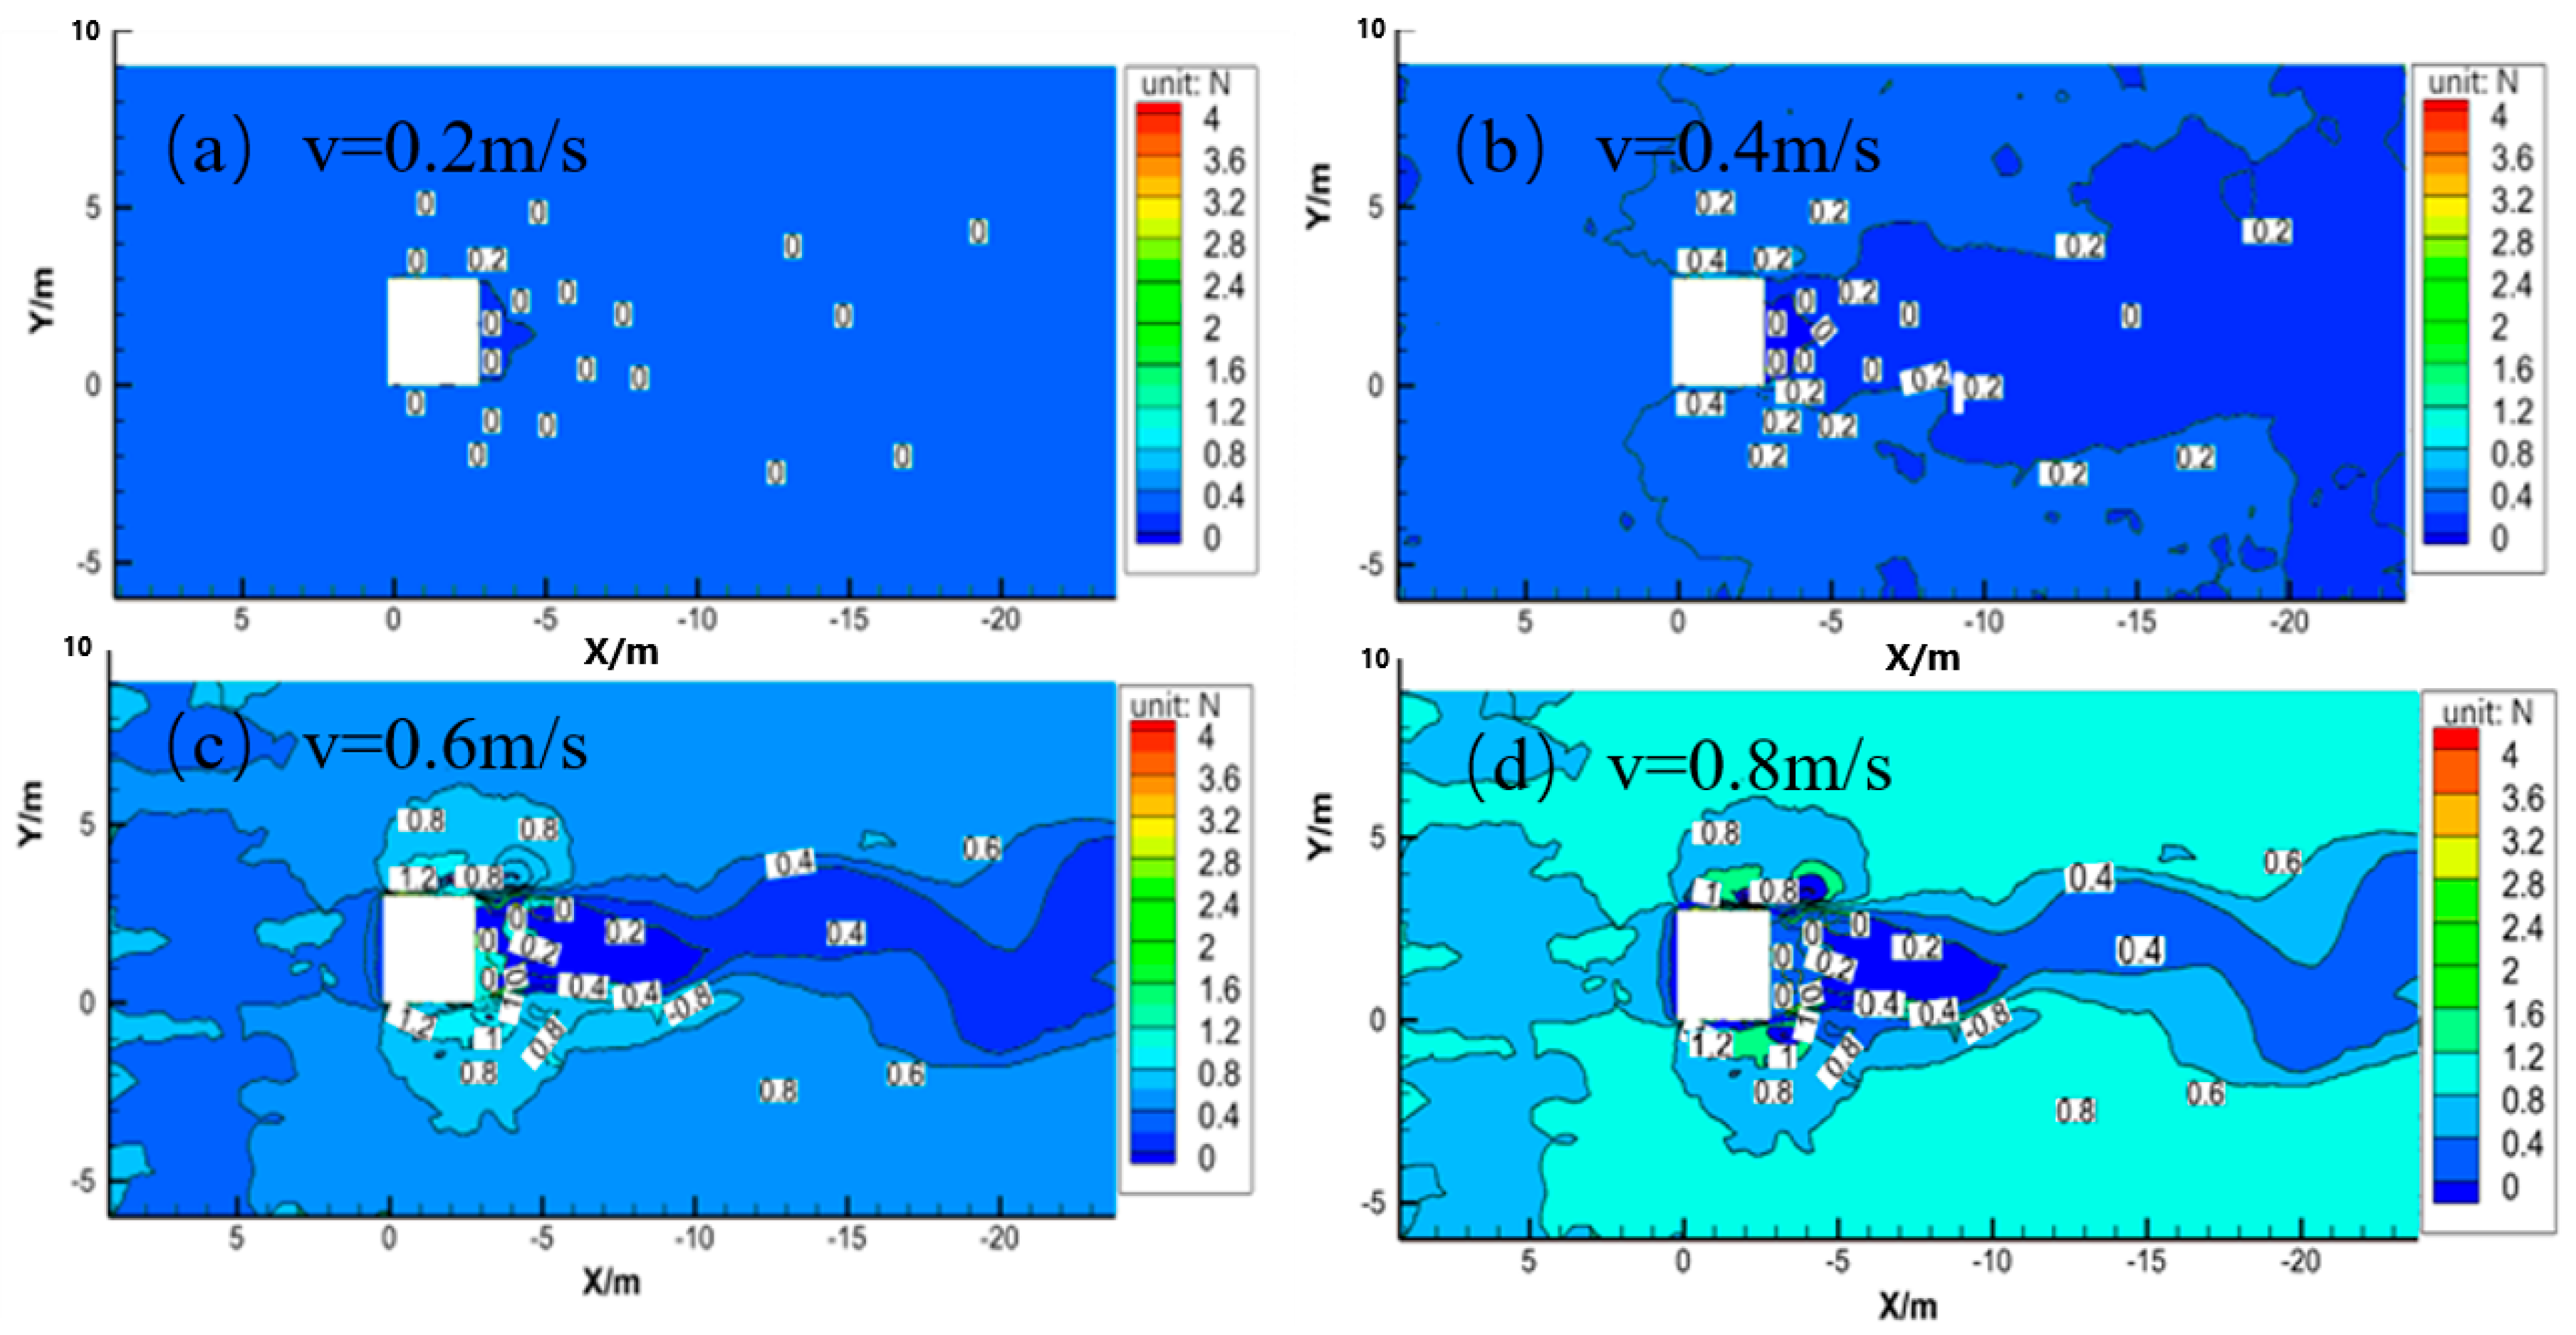
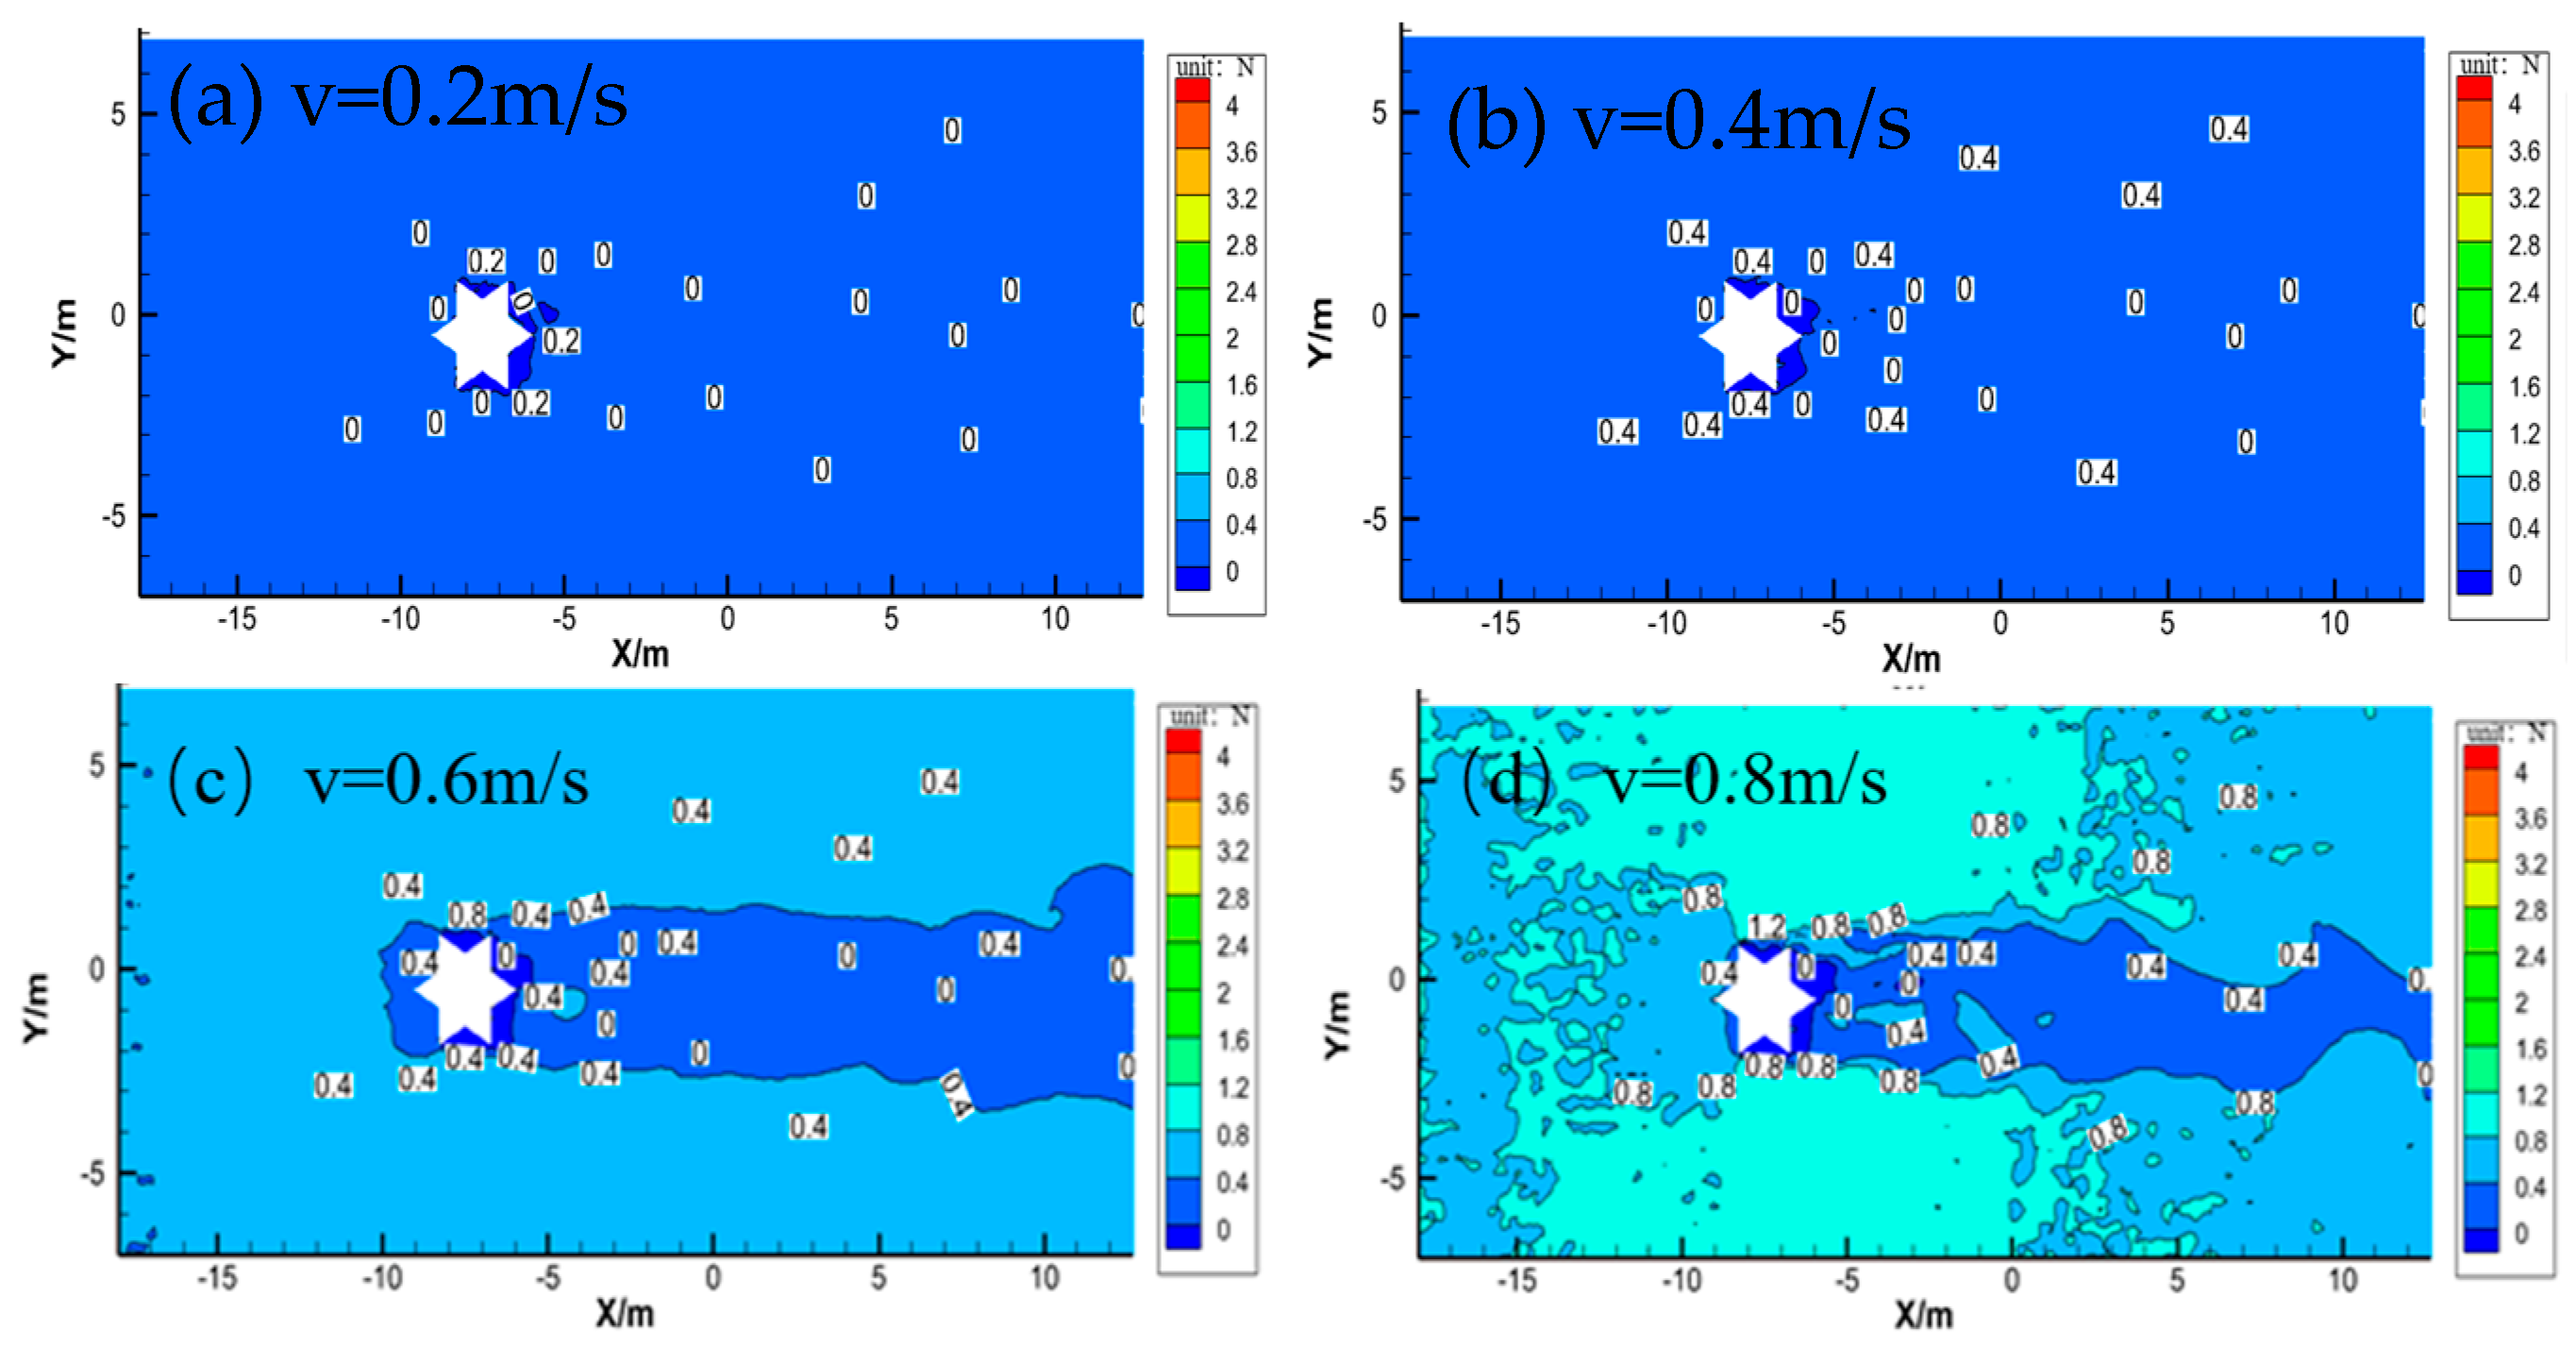
Bed Shear Force
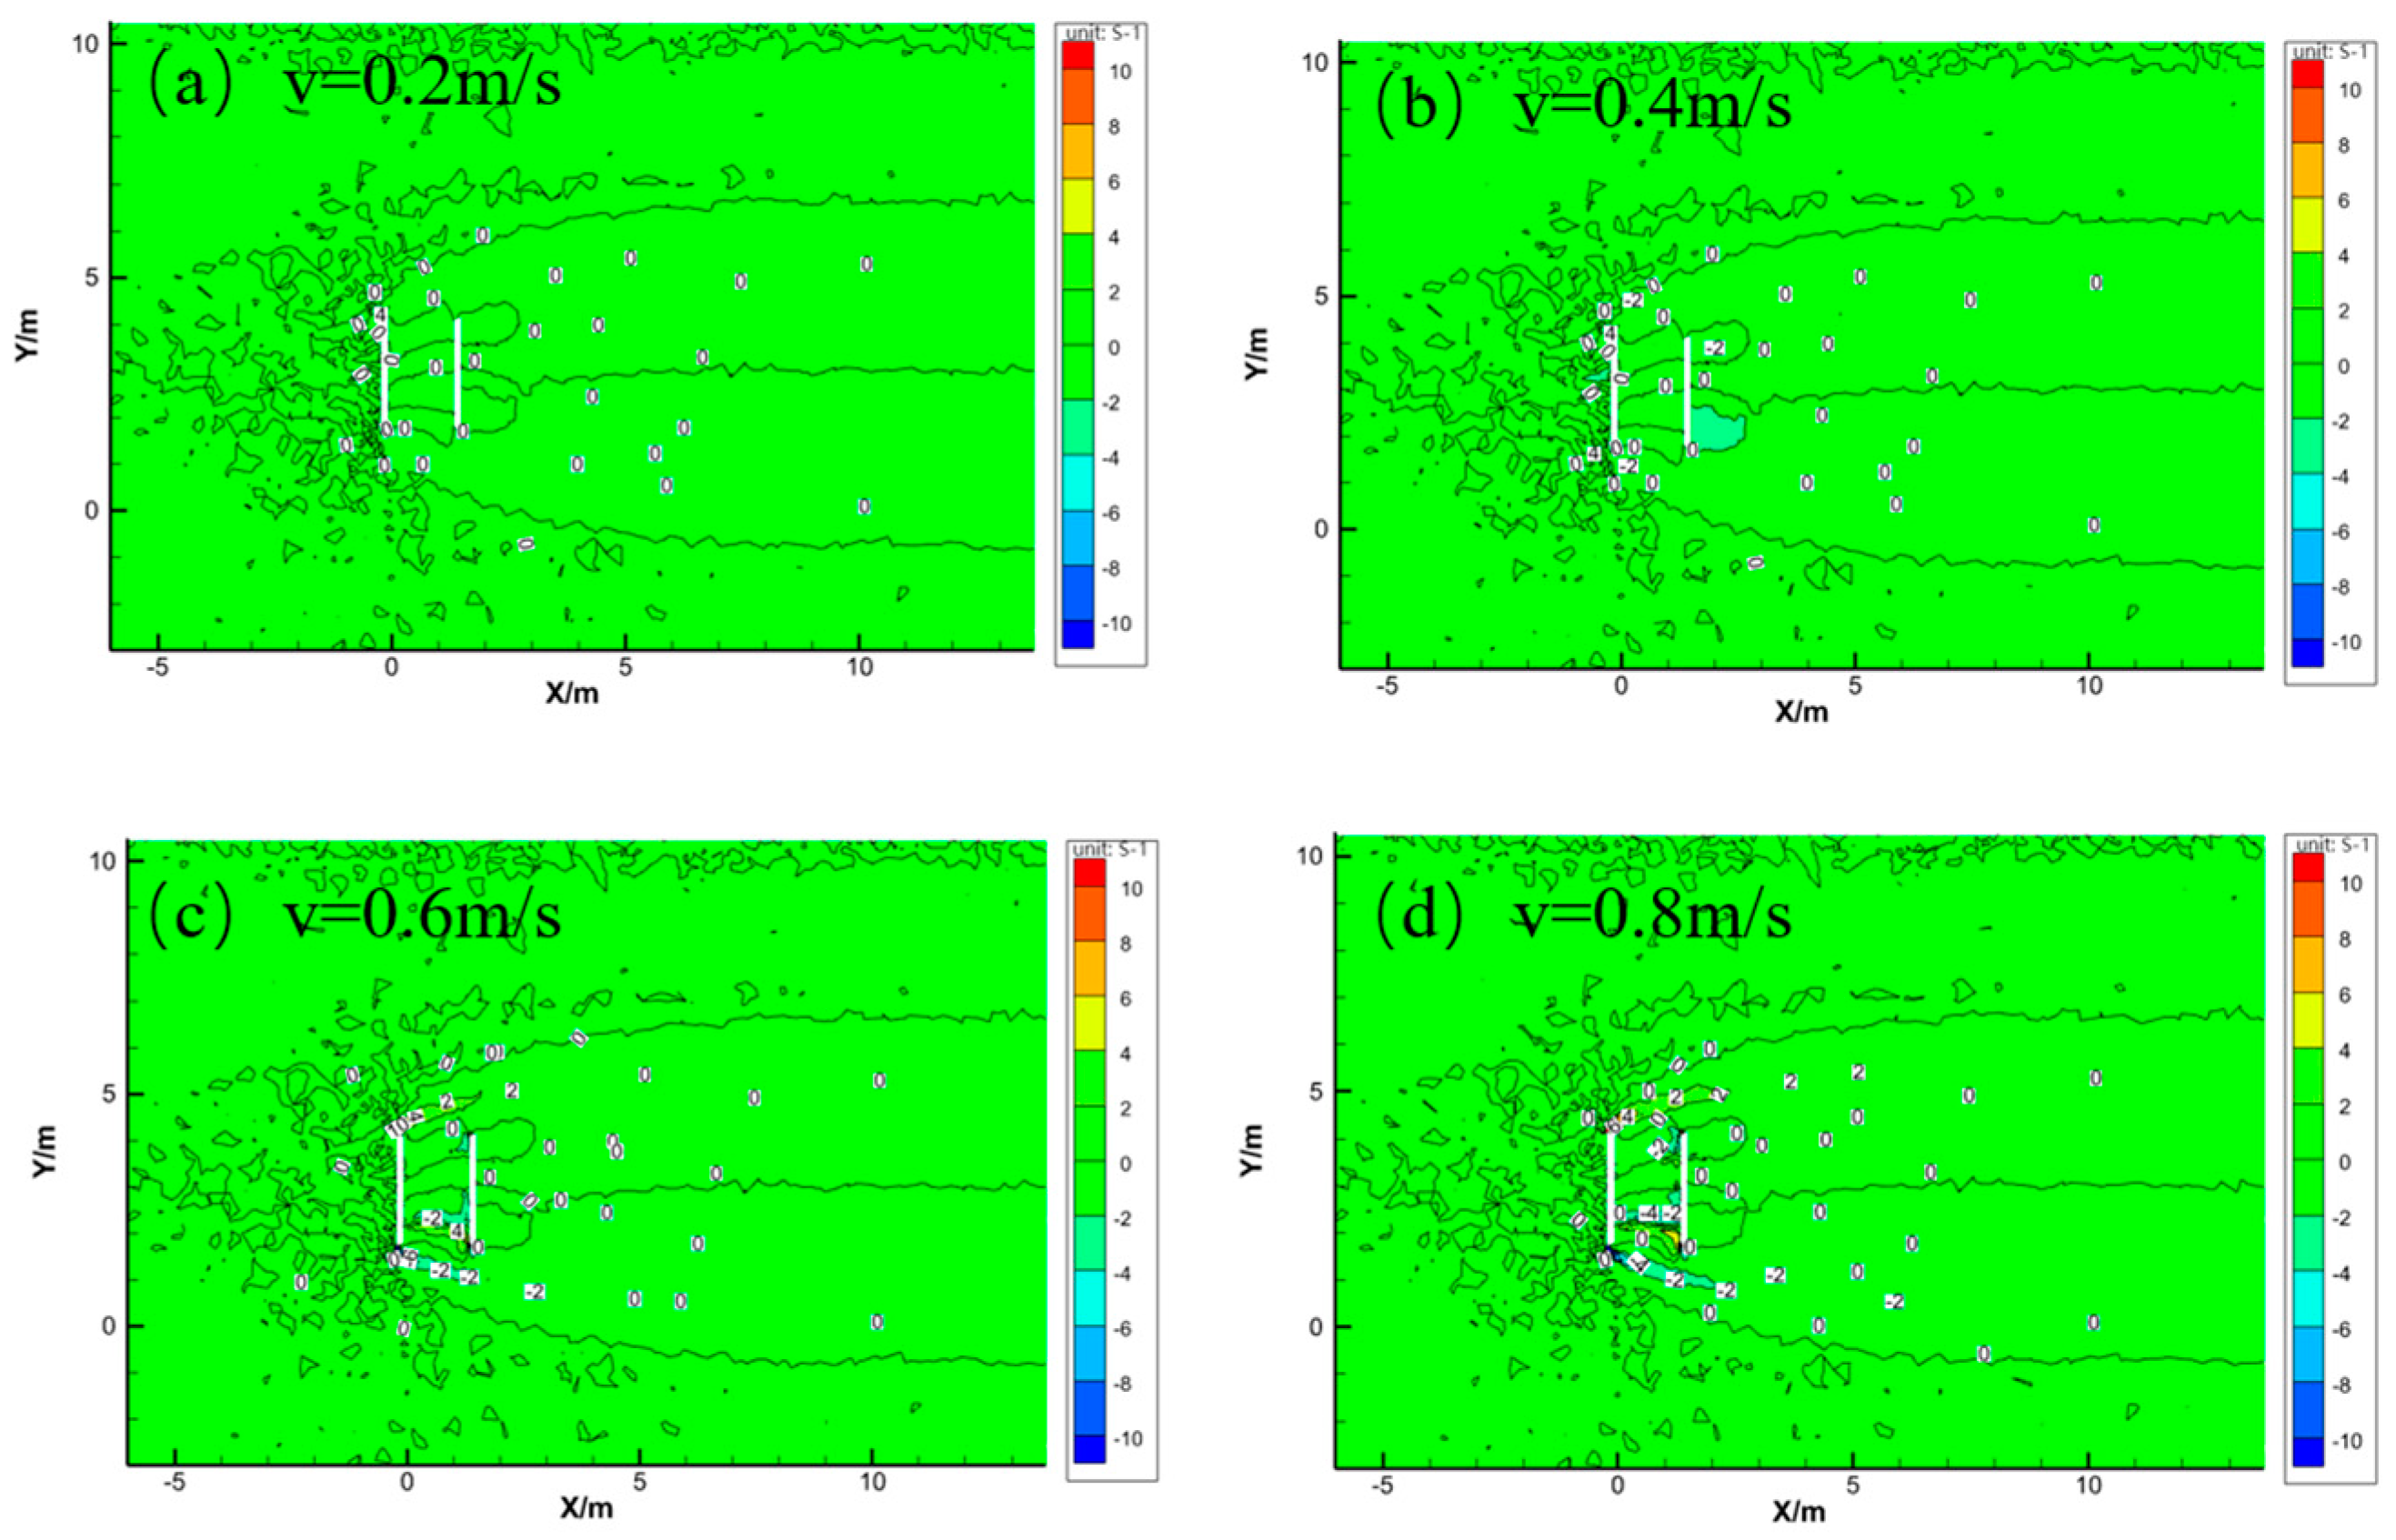
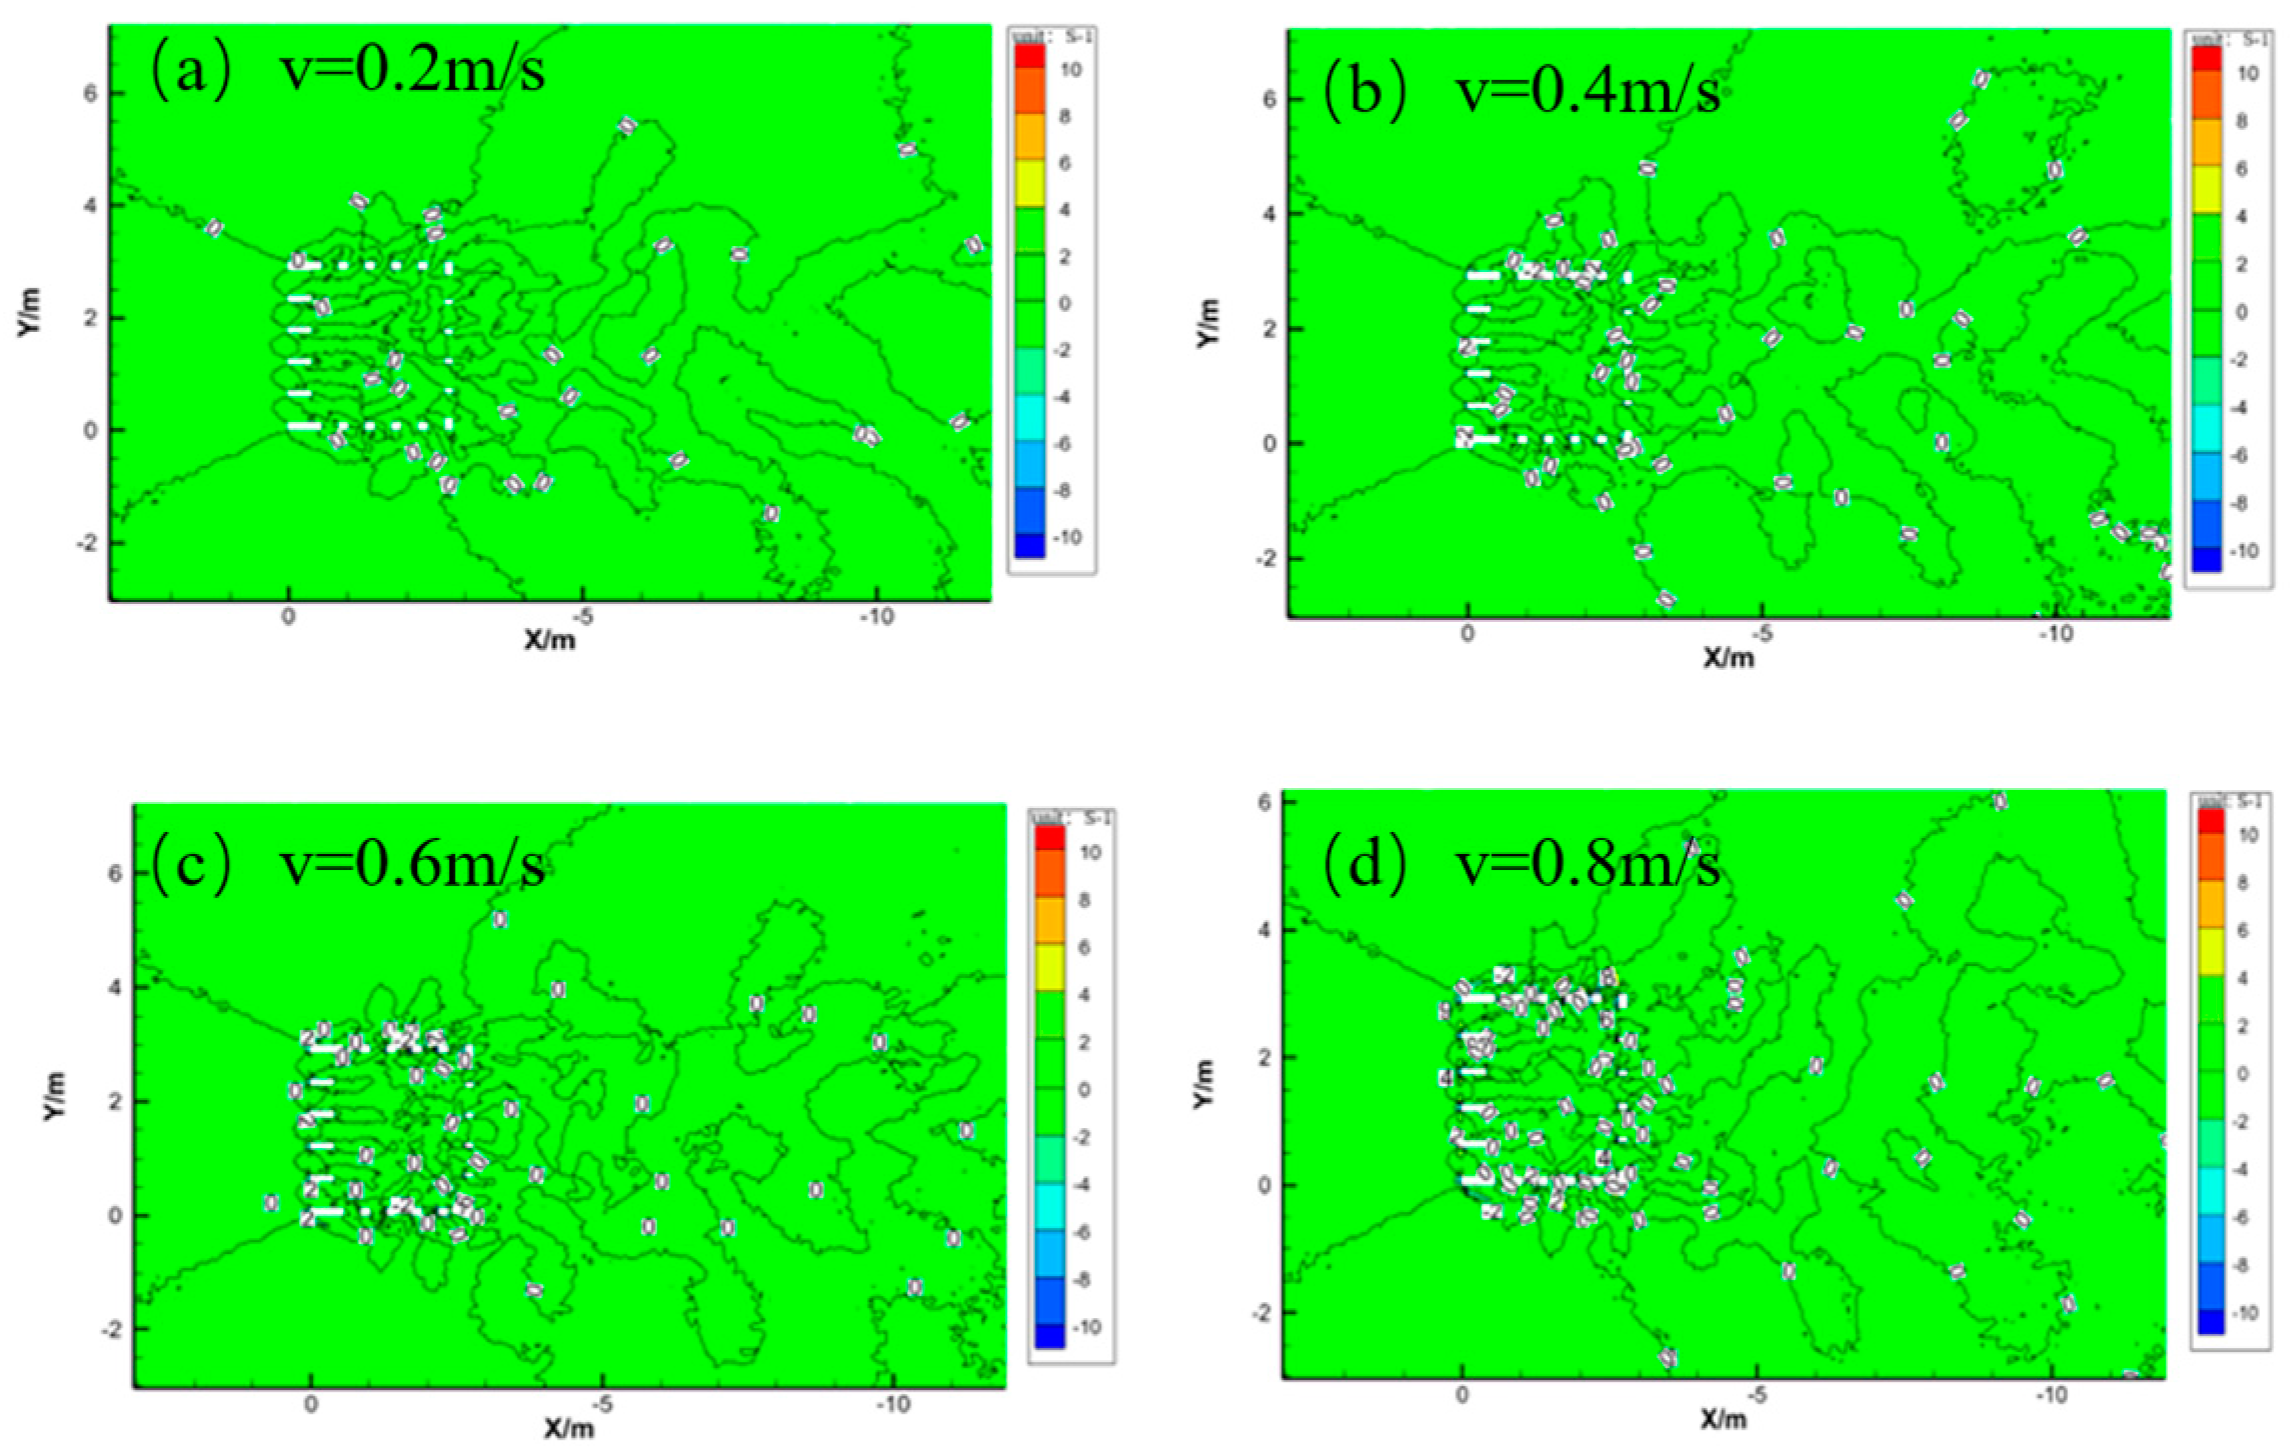
Vorticity Field
3.2.2. Numerical Simulation Analysis of Reef B
Velocity Field
Bed Shear Force
Vorticity Field
3.2.3. Numerical Simulation Analysis of Reef C
Velocity Field
Bed Shear Force
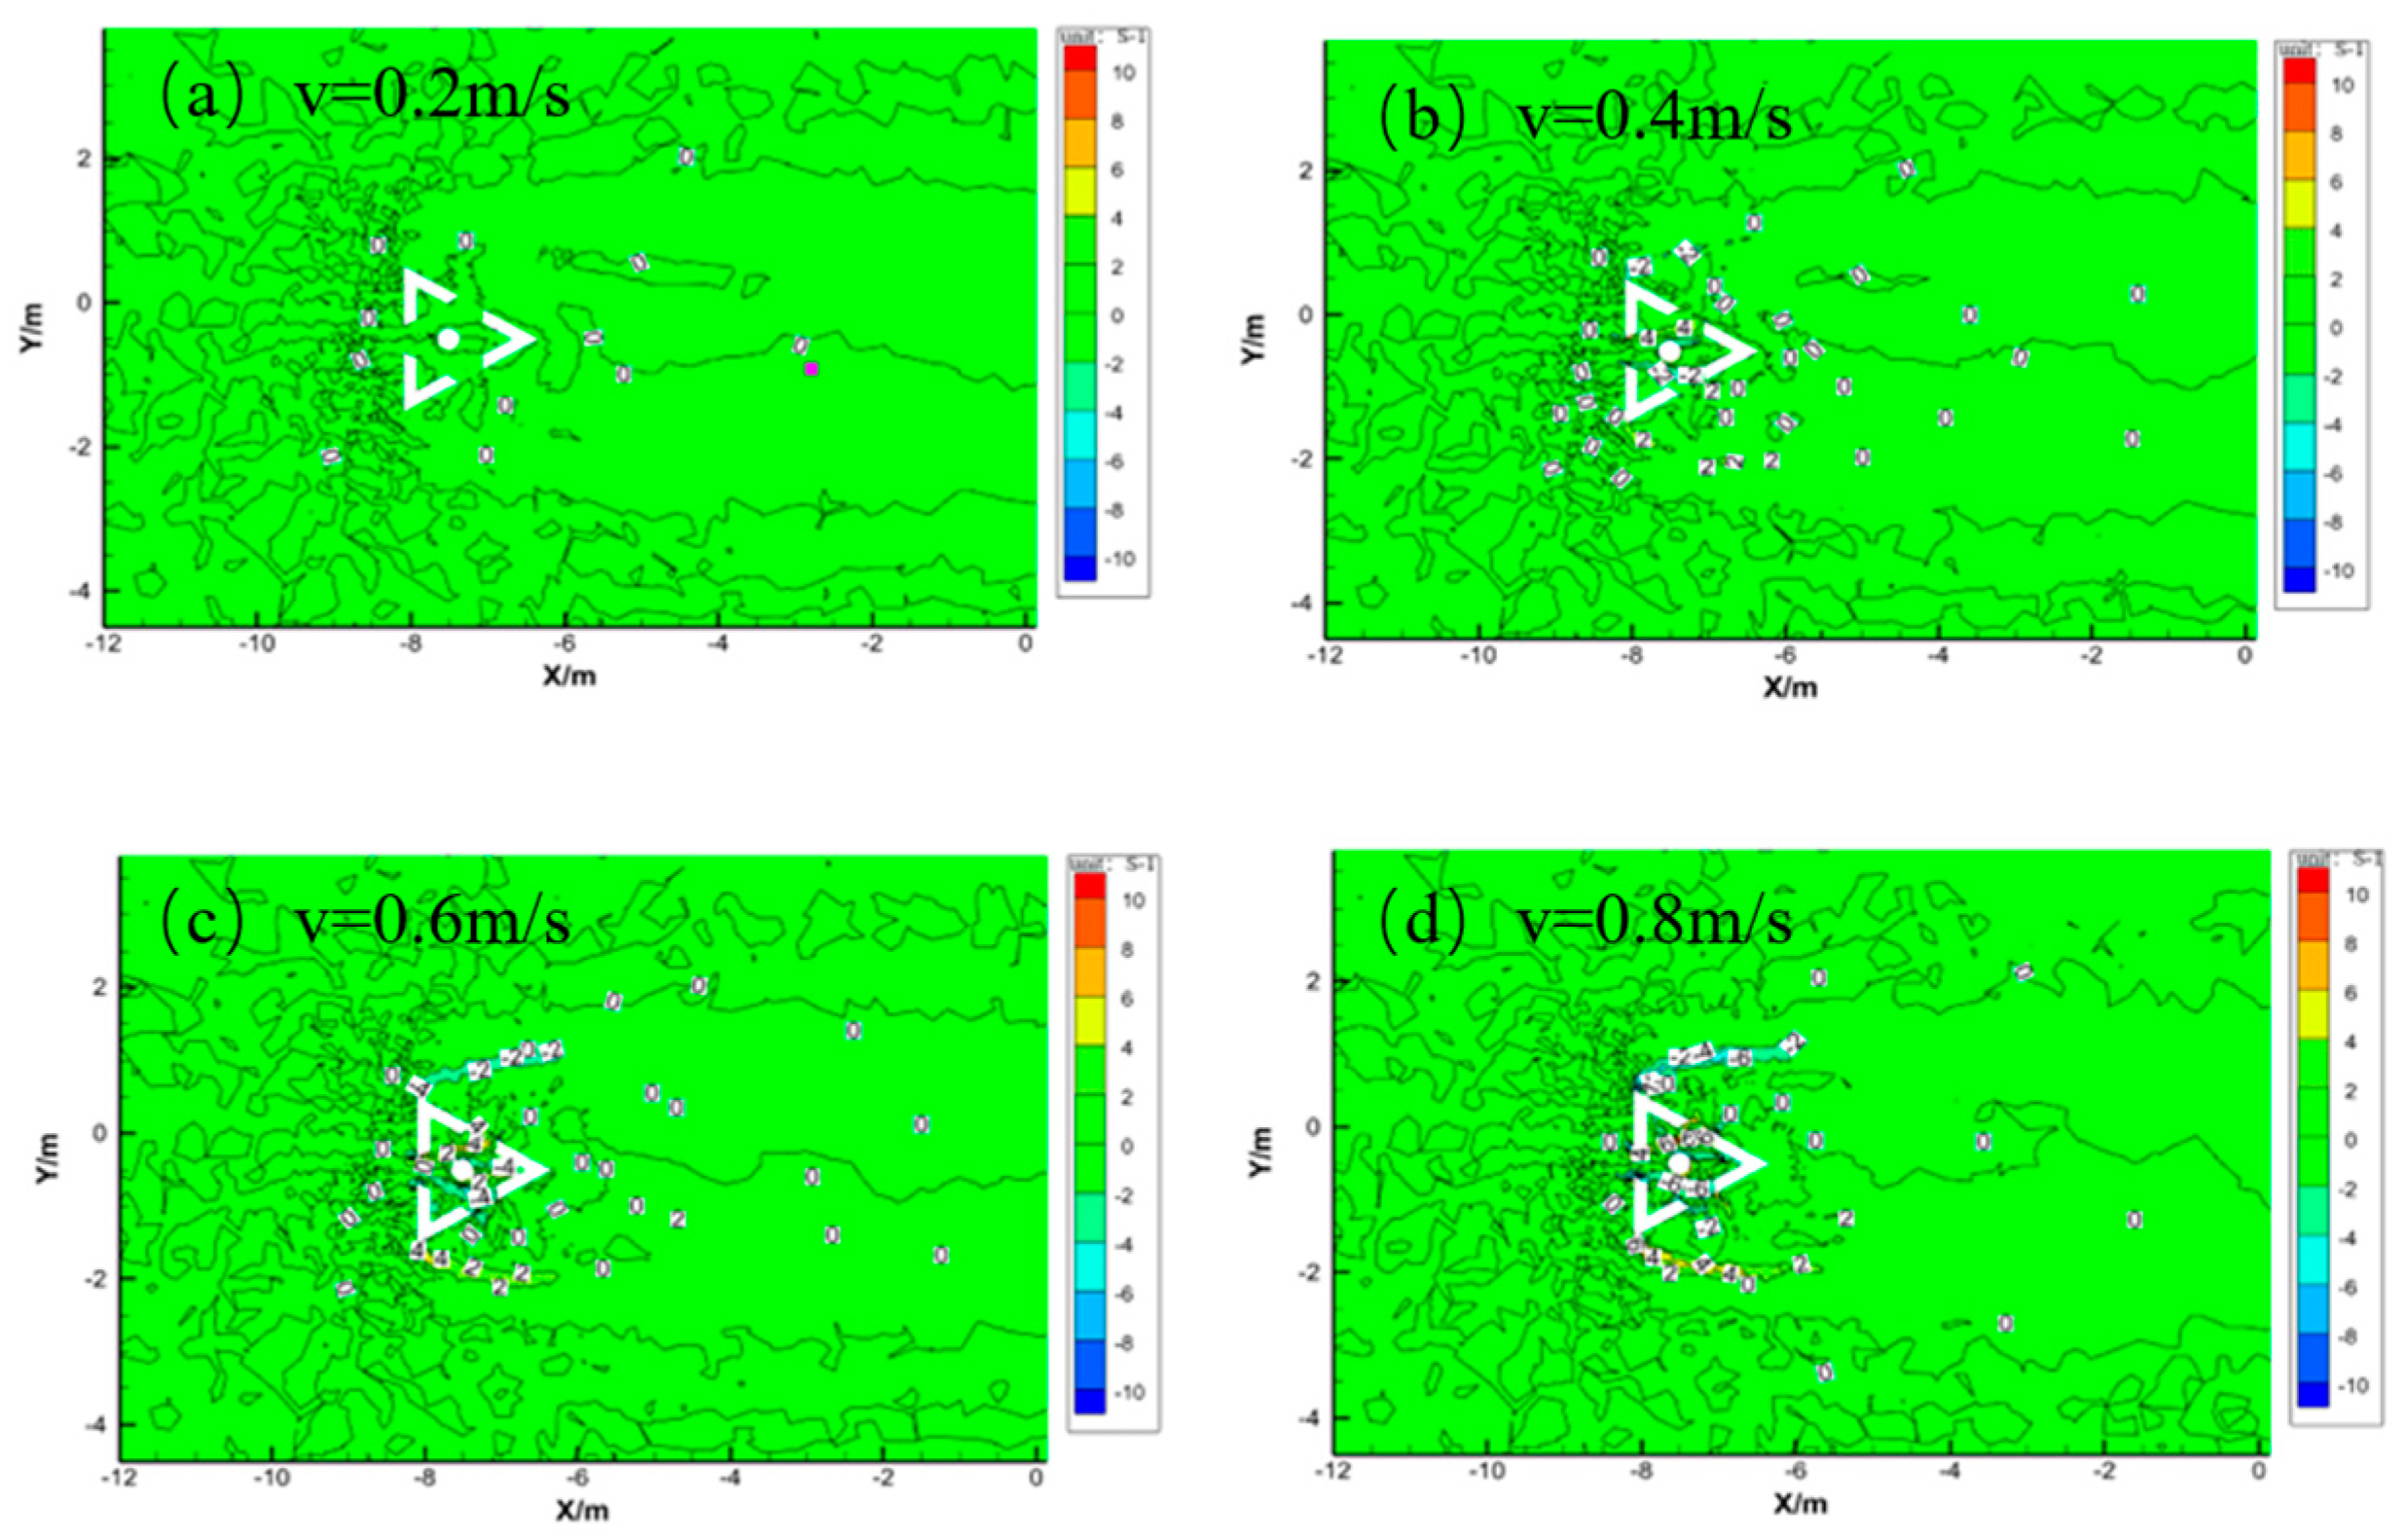
Vorticity Field
4. Discussions
4.1. Effects of Water Flow on Scouring
4.2. Effects of Reef Structure on Scouring
5. Conclusions
- The degree of local scour around the artificial reef is directly proportional to the flow velocity, and a scour’s scope and depth increase with a flow velocity increase. When the flow velocity is less than 0.8 m/s, the local scour around the reef is not apparent; when the flow velocity is 0.8 m/s, the scouring around the reef is severe. When selecting a site, analyze the relationship between the flow velocity in the chosen area and the starting speed of sediment in the area to avoid severe scouring and reduce the reef’s service life and ecological benefits.
- The degree of scouring of the reef has a significant relationship with its structure, and the multi-column support structure of the reef can form a complex flow field. Still, its flow-blocking effect is not too noticeable, and it is easy to cause suspended sediment to settle and accumulate. It should also be combined with sand content for design. The bottom of the three reefs in this test were solid structures, and no tilting occurred when they were scoured with a high flow rate of 0.8 m/s on a medium sand substrate. Therefore, in an open bottom design of the reefs, we can try to minimize the bottom opening while reducing the construction cost, and the bottom opening ratio can be designed according to the characteristics of the substrate to reduce the chance of the bottom being hollowed out.
- The numerical simulations of the flow fields of the three reefs show that the high and low values of the flow field, bed shear, and vorticity field correspond to the local scour strengths and weaknesses of the three reefs in the experiment. A numerical simulation can effectively illustrate the scouring conditions of the reefs, and more critically, it can significantly reduce the actual cost of reef tests. This opens up a new path for related research and practice to be conducted efficiently and economically.
Author Contributions
Funding
Data Availability Statement
Acknowledgments
Conflicts of Interest
References
- IUCN. Global Standard for Nature-Based Solutions A User-Friendly Framework for the Verification Design Scaling up of N.b.S.; International Union for Conservation of Nature: Gland, Switzerland, 2020. [Google Scholar]
- Sutton-Grier, A.E.; Wowk, K.; Bamford, H. Future of our coasts: The potential for natural and hybrid infrastructure to enhance the resilience of our coastal communities, economies and ecosystems. Environ. Sci. Policy 2015, 51, 137–148. [Google Scholar] [CrossRef]
- Chen, Y.H. Analysis of the Ecological Effects of the Artificial Fish Reef Zone at Dalioga South, Daya Bay; Jinan University: Guangzhou, China, 2009. [Google Scholar]
- Yang, J.L.; Wu, X.Y.; Shi, G.F.; Chen, Y. Research status and development trend of ocean ranching technology. China Fish. Econ. 2004, 5, 48–50. [Google Scholar]
- Zhang, H.H.; Sun, L. Study on the utilization of artificial reef project to increase marine aquatic resources. Resour. Sci. 2001, 23, 6–10. [Google Scholar]
- Zalmon, I.R.; Boina, C.D.; Almeida, T.C.M. Artificial reef influence on the surrounding infauna—North Coast of Rio de Janeiro State, Brazil. J. Mar. Biol. Assoc. United Kingd. 2012, 92, 1289–1299. [Google Scholar]
- Cenci, E.; Pizzolon, M.; Chimento, N.; Mazzoldi, C. The influence of a new artificial structure on fish assemblages of adjacent hard substrata. Estuar. Coast. Shelf Sci. 2011, 91, 133–149. [Google Scholar]
- Zhang, S.Y.; Xu, M.; Wang, Z.H. Construction of artificial reefs and resource enhancement in China. Fish. Mod. 2010, 37, 55–58. [Google Scholar]
- Tang, Y.L.; Wei, S.W.; Yang, M.D.; Wang, X.X.; Zhao, F.F. Experimental investigation of local scour around artificial reefs in steady currents. J. Ocean Univ. China 2022, 21, 445–456. [Google Scholar]
- Lai, M.X. Behavioral Analysis of Artificial Reef Engineering in the Southwest Waters of Taiwan. Master’s Thesis, National Shan University, Taiwan, China, 2000. [Google Scholar]
- Lin, Y.J.; Lin, C. Scour effects on lateral behavior of pile groups in sands. Ocean Eng. 2020, 208, 107420. [Google Scholar]
- Ding, L.; Wang, J.M.; Tang, Z.Z.; Chen, H.G.; Jia, X.P. Modeling test and analysis of local scouring of artificial reefs on chalk sand seabed under water current. J. Aquac. 2019, 43, 2015–2024. [Google Scholar]
- Gong, P.H.; Zheng, Y.X.; Li, J.; Guan, C.T.; Cui, Y.; Li, Q. Flow field effect and stability of tower truss artificial reef. Chin. Aquat. Sci. 2019, 26, 1021–1028. [Google Scholar]
- Liu, Z.; Cheng, Y.Z.; Lu, C.T.; Luo, X.F.; Qi, Y. Response of local scour of artificial reefs in the South Yellow Sea to the hydrodynamics of the sea. Waterw. Harb. 2021, 42, 588–595. [Google Scholar]
- Woo, J.; Kim, D.; Yoon, H.-S.; Na, W.-B. Characterizing Korean general artificial reefs by dray coefficients. Ocean Eng. 2014, 82, 105–114. [Google Scholar] [CrossRef]
- Wang, S.; Wei, K.; Shen, Z.; Xiang, Q. Experimental investigation of local scour protection for cylindrical bridge piers using anti-scour collars. Water 2019, 11, 1515. [Google Scholar] [CrossRef]
- Li, X.Y. Numerical Simulation of Flow Field Effect and Its Local Scour of Artificial Fish Reef under Wave Action; Tianjin University: Tianjin, China, 2016; pp. 42–48. [Google Scholar]
- Yun, D.H.; Kim, Y.T. Experimental study on settlement and scour characteristics of artificial reef with different reinforcement type and soil type. Geotext. Geomembr. 2018, 46, 448–454. [Google Scholar] [CrossRef]
- Khosronejad, A.; Kang, S.; Sotiropoulos, F. Experimental and computational investigation of local scour around bridge piers. Adv. Water Resour. 2012, 37, 73–85. [Google Scholar] [CrossRef]
- Yang, M.; Tang, Y.; Zhao, S.F.G. Numerical simulation of local scour around a square artificial reef. J. Offshore Mech. Arct. Eng. 2024, 146, 021202. [Google Scholar] [CrossRef]
- Gong, Z.; Wang, Z.M.; Jin, G.; Shao, J. Experimental study on the local scour protection effect of artificial reef swarm on monopile foundation. J. Southeast Univ. (Nat. Sci. Ed.) 2024, 54, 870–876. [Google Scholar]
- Mohapatra, S.C.; Amouzadrad, P.; Bispo IB d, S.; Guedes Soares, C. Hydrodynamic Response to Current and Wind on a Large Floating Interconnected Structure. J. Mar. Sci. Eng. 2025, 13, 63. [Google Scholar] [CrossRef]
- Li, D.; Hou, X.Y.; Tang, C.; Zhang, H. Current status and future prospects of artificial reef research. Mar. Sci. 2019, 43, 81–87. [Google Scholar]
- Yudhistira, Y.C. Sea Urchins as a Potential Fishery Resource and Their Management Approaches. Doctoral Dissertation, Xiamen University, Xiamen, China, 2019. [Google Scholar]
- JTJ/T 234-2001; Wave model test procedure. China Communications Press: Beijing, China, 2001.
- Moreno-Sanchez, X.G.; Perez-Rojo, P.; Irigoyen-Arredondo, M.S.; Marin-Enriquez, E.; Abitia-Cárdenas, L.A.; Escobar-Sanchez, O. Feeding habits of the leopard grouper, Mycteroperca rosacea (Actinopterygii: Perciformes: Epinephelidae), in the central Gulf of California, BCS, Mexico. Acta Ichthyol. Piscat. 2019, 49, 9–22. [Google Scholar] [CrossRef]
- Fadli, N.; Campbell, S.J.; Ferguson, K.; Keyse, J.; Rudi, E.; Riedel, A.; Baird, A.H. The role of habitat creation in coral reef conservation: A case study from Aceh, Indonesia. Oryx 2012, 46, 501–507. [Google Scholar]
- Li, W.J.; Yang, S.F.; Li, B.Q.; Fu, X. Experimental study of fine-grained sediment washout model in Three Gorges reservoir area based on prototype sand. Sediment Res. 2016, 3, 17–23. [Google Scholar]
- Wang, Q.S. Research on Nearshore Seabed Fine Sediment Transport and Scour Protection; Dalian University of Technology: Dalian, China, 2015; pp. 83–87. [Google Scholar]
- Cai, R.R.; Zhang, L.Y. Zhang Hongwu. Study on the correction of sediment starting flow rate formula of Li Baoru. J. Water Resour. 2019, 50, 547–554. [Google Scholar]
- Li, B.R. Calculation method of sediment starting flow rate. Sediment Res. 1959, 4, 71–77. [Google Scholar]
- Wang, J.M.; Tang, Z.Z.; Ding, L.; Jia, X.P.; Zhang, Z.Z. Study on localized siltation of artificial reefs based on flume modeling. South. Aquat. Sci. 2020, 16, 32–38. [Google Scholar]
- Burkow, M.; Griebel, M. A full three dimensional numerical simulation of the sediment transport and the scouring at a rectangular obstacle. Comput. Fluids 2016, 125, 1–10. [Google Scholar] [CrossRef]
- Guo, L.D. Experimental and Numerical Simulation Study on Local Scour of Double Cylindrical Bridge Pier; Southwest Jiaotong University: Chengdu, China, 2023. [Google Scholar]
- Liu, Q.Q. Mechanical characterization of sediment movement near bed surface. J. Appl. Basic Eng. Sci. 1997, 5, 56–66. [Google Scholar]
- Liu, G.Y. Numerical Simulation Study on Foundation Scour of Offshore Platform; University of Technology: Dalian, China, 2022. [Google Scholar]
- Wang, S.Y.; Mou, L.; Wei, K.; Qin, L.; Xiang, Q.Q. Experimental study on local scour of cylindrical bridge piers under different hydraulic conditions. J. Disaster Prev. Mitig. Eng. 2020, 40, 425–431. [Google Scholar]
- Cui, Y.; Guan, C.T.; Wan, R.; Li, J.; Huang, B. Numerical simulation of the effect of spacing on the flow field of artificial reefs. Mar. Lakes Marshes Bull. 2011, 11, 59–65. [Google Scholar]


| Prototype | Model | |||
|---|---|---|---|---|
| Dimensions/m (L × W × H) | Weight/t | Dimensions/m (L × W × H) | Weight/t | |
| A | 3 × 2.7 × 3 | 8.44 | 0.2 × 0.18 × 0.2 | 2.5 × 10⁻³ |
| B | 3 × 3 × 3 | 7.09 | 0.2 × 0.2 × 0.2 | 2.1 × 10⁻³ |
| C | 3 × 2.7 × 3 | 3.44 | 0.2 × 0.18 × 0.2 | 1.02 × 10⁻³ |
Disclaimer/Publisher’s Note: The statements, opinions and data contained in all publications are solely those of the individual author(s) and contributor(s) and not of MDPI and/or the editor(s). MDPI and/or the editor(s) disclaim responsibility for any injury to people or property resulting from any ideas, methods, instructions or products referred to in the content. |
© 2025 by the authors. Licensee MDPI, Basel, Switzerland. This article is an open access article distributed under the terms and conditions of the Creative Commons Attribution (CC BY) license (https://creativecommons.org/licenses/by/4.0/).
Share and Cite
Zhu, S.; Yao, Y.; Li, Z.; Zhang, S.; Gao, S. Entity Model Test and Analysis of Local Scour of Three Different Structures of Artificial Reefs. J. Mar. Sci. Eng. 2025, 13, 694. https://doi.org/10.3390/jmse13040694
Zhu S, Yao Y, Li Z, Zhang S, Gao S. Entity Model Test and Analysis of Local Scour of Three Different Structures of Artificial Reefs. Journal of Marine Science and Engineering. 2025; 13(4):694. https://doi.org/10.3390/jmse13040694
Chicago/Turabian StyleZhu, Shishi, Yongqi Yao, Zheng Li, Shuo Zhang, and Shike Gao. 2025. "Entity Model Test and Analysis of Local Scour of Three Different Structures of Artificial Reefs" Journal of Marine Science and Engineering 13, no. 4: 694. https://doi.org/10.3390/jmse13040694
APA StyleZhu, S., Yao, Y., Li, Z., Zhang, S., & Gao, S. (2025). Entity Model Test and Analysis of Local Scour of Three Different Structures of Artificial Reefs. Journal of Marine Science and Engineering, 13(4), 694. https://doi.org/10.3390/jmse13040694