Abstract
To achieve the aims of the Convention on Biological Diversity’s 2030 Global Biodiversity Framework, the management of marine areas requires the use of cost- and time- effective monitoring of biodiversity. Marine observation platforms are increasingly used for such monitoring activities. These platforms allow data to be collected from a variety of sensors simultaneously in real-time and in situ, providing the opportunity for both adapting where and when sampling is performed and for using multiple data streams for more comprehensive information to be collected on marine biodiversity. While some recent monitoring activities are following an adaptive sampling approach (in which sampling is adapted to ecological phenomena such as diel vertical migration), most still do not use a data-driven approach (in which multiple data streams are used to inform sampling). In this study, we performed eDNA metabarcoding to monitor the community of copepods found in the high-latitude environment near Trondheim, Norway. We applied an adaptive sampling approach to detect calanoid copepods at seasonally contrasting time points using real-time acoustic sensor data. Acoustic sensor data were used to inform when plankton net samples were collected in a 24 h period, as Calanoid copepods migrate through the water column throughout the day to avoid predation. These results demonstrate how multiple information streams from complimentary monitoring methods can be combined for more robust monitoring of biodiversity by confirming the presence (or absence) of relevant taxa.
1. Introduction
The pressing issue of biodiversity loss has reached a pivotal moment. Achieving the targets of the 2030 Global Biodiversity Framework and the European Biodiversity Strategy demands more than a political commitment [1,2,3]; it necessitates vigilant monitoring of changes to biodiversity [4,5]. The intensification of human activities within our marine environments are reshaping ecosystems, making effective monitoring crucial. Through regular monitoring of biodiversity, we can gain insights into the state, trends and subtle shifts within ecosystems, and pinpoint areas where conservation efforts are most urgently needed [6]. As biodiversity varies across different spatial and temporal scales, selecting representative sites and time points that capture this variation is crucial to obtaining a comprehensive understanding of a given ecosystem. Biodiversity monitoring activities are, however, often resource limited and face practical constraints such as budget, time, and available resources. Balancing these limitations with the need for comprehensive information on biodiversity is a constant challenge.
The ability to collect vast amounts of data on biodiversity has reached unprecedented levels. Many different technological solutions are currently used to monitor biodiversity in our oceans (e.g., acoustics [7], remote sensing [8], molecular methods [9], in situ imaging [10]). Today, (semi)-autonomous marine observation platforms (such as data buoys) are increasing in popularity as they allow for the collection of real-time data from several sensors simultaneously [11]. New techniques, such as automated data collection from in-situ sensors and DNA-based techniques with high quality standard reference libraries, have improved and overcome laborious and costly traditional sampling and data acquisition techniques [12,13]. These new techniques have made collecting specific, relevant data that is representative of the state of an ecosystem at contrasting time points more possible than previously.
However, both traditional and new monitoring methods have shortcomings for monitoring marine biodiversity [14]. For example, using DNA-based techniques for characterizing marine communities is challenging as physical factors such as salinity and currents impact the transport and degradation of eDNA [15]. eDNA metabarcoding is also a highly disputed method for abundance assessments due to a lack of knowledge on factors including eDNA decay rates and variations in DNA shedding rates across species and life stages [12,14]. Zooplankton in the ocean are diverse and abundant, and maintaining this diversity is crucial for maintaining the health of marine ecosystems [16]. Zooplanktonic species have an intermediary role in the aquatic food webs, linking primary producers with higher trophic levels. Thus, they play an important role in biogeochemical cycling [17,18], contribute to energy transfer in pelagic food webs, and impact prey-predators dynamics and distributions [19]. Furthermore, zooplankton, and specifically copepods, are sensitive to changing environmental conditions, which makes them a suitable bioindicator [20,21]. Yet, the abundance and distribution of zooplankton is known to be highly variable across spatial and temporal scales due to behaviors such as seasonal and diel vertical migration as well as small-scale aggregations across horizontal and vertical dimensions. This variability makes it often difficult to assess where and when to sample to obtain a representative understanding of the system in a time- and cost-effective manner. Indeed, many monitoring programs currently rely on regular collection of data from standard stations and of the whole water column which may not accurately capture the dynamics of zooplankton.
Here, we use calanoid copepods as model taxon for testing a data-driven, adaptive sampling approach in connection to a marine observation platform that provides a blueprint for a more precise sampling technique than is currently employed. Calenoid copepods were the taxa of choice due to their importance in North Atlantic and Arctic systems as phytoplankton grazers and prey for higher trophic levels [22]. Calanoid copepods (i.e., Calanus finmarchichus, C. glacialis, and C. helgolandicus) are widely distributed in the North Atlantic with a high degree of overlap in their spatial distributions [23]. Molecular methods have been used to determine a strong degree of genetic differentiation between species [23], although there are small morphological differences [24].
The data-driven approach utilized in this study relies on the use of real-time data from an acoustic sensor, attached to the marine observation platform, to inform the sampling timing and depth for each sampling campaign. The sampling itself involved collecting water for environmental DNA (eDNA) metabarcoding to assess the presence of different marine Calanoid copepods, and plankton net samples for traditional taxonomic identification to validate the presence/absence assessments of specifically Calanoid copepods from the genera Calanus made using eDNA metabarcoding. The adaptive sampling approach (which combines complimentary monitoring methods) presented in this study could serve as a basis for the development of more accurate and adaptive future biodiversity monitoring programs.
2. Materials and Methods
2.1. Sample and Data Collection
Two sampling campaigns were performed during seasonally and environmentally contrasting time points at an Ocean Data Buoy station [11] located near Munkholmen island in Trondheim fjord, Norway (located approximately at 63°27′26.921″, 10°22′20.179″). The first sampling campaign was performed on 1 February 2023 (“winter”) and the second on 8 May 2023 (“summer”, see Figure 1). Data on environmental conditions were collected using a conductivity, temperature, and depth (CTD; SeaCAT Plus V2) sensor on a profiler. CTD data were used to assess whether conditions were sufficiently seasonally contrasting. Profiles were taken from −50 m to 0 m.
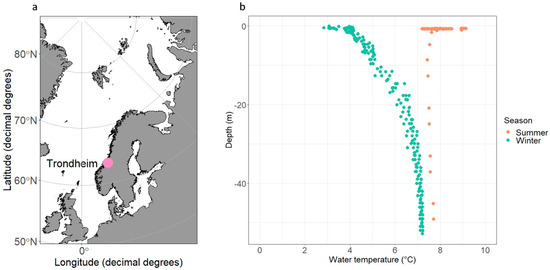
Figure 1.
The case study location was collected is shown in panel (a). The case study is located near Munkholmen islet in Trondheimfjorden near the city of Trondheim. Temperature across water depths from CTD profiles is shown in panel (b) for the two seasonally contrasting sampling campaigns to demonstrate seasonal differences in water temperature.
An acoustic sensor (Nortek Signature 100 echosounder, Rud, Norway) attached to the Ocean Data Buoy at approximately a depth of −2 m using the optional sensor beam (70–120 Hz) was used to select the sampling timing and depth for the eDNA and plankton net sampling. Real-time data from the acoustic sensor over the previous week were visually inspected to determine where high areas of biological activity occurred in the water column and to track the dynamics of high activity changed over time. Both during winter and summer, one week of continuous acoustic sensor data were used to guide the timing of sampling at certain depths, based on time frames with high amount of activity in the ecograms (see Figure 2). Echograms were used to determine the timing and depth where high areas of biological activity occurred in the water column and to track the dynamics of high activity over time. Water samples for eDNA metabarcoding were collected using a 11.300 series Van Dorn water sampler with a volume of 5 L (KC Denmark A/S, Silkeborg, Denmark). Zooplankton were collected using a custom-made plankton net (200 µm, Ø55 cm, 1 L non-filtering cod-end).
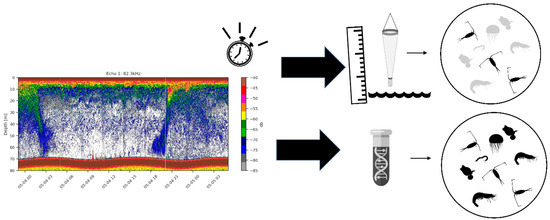
Figure 2.
Real-time data from an acoustic sensor was used to inform the timing and depth of sampling both for eDNA metabarcoding and for plankton net sampling. Results from eDNA metabarcoding were used to assess the diversity of copepods in samples while plankton net samples were used to validate the occurrence of calanoid copepods detected through metabarcoding.
Water samples and plankton nets were deployed at predetermined depths informed by echograms. Water sampler was targeted to the specific depth which showed high level biomass aggregation in the echograms. Within sampling campaigns, the window of high activity identified using ecograms remained relatively stable. However, the periods of high activity differed between sampling campaigns. Thus, as the use of ecograms informed the time of day during which sampling was conducted, contrasting time points were sampled during the winter and summer sampling campaigns. As zooplankton sampling was conducted with a non-closing plankton net, the water column at the target depth through to the surface was sampled. While the use of a non-closing net does not allow for sampling at specific depth only, the plankton net samples were deemed sufficient for validating that the time where ecograms showed high activity and biomass moving up and down in the water column due to diel vertical migration.
All samplings were performed in triplicates, and samples were stored in the dark at the deck of the boat until return to the laboratory within ~2 h. Water samples were kept at 4 °C until filtering using glass fiber filters with binder, 2.0 µm (Millipore, St. Louis, MO, USA). Filtering was performed within 3 h after retrieval, and each filter was stored at −20 °C in 4.05 mL Qiagen (Hilden, Germany) ATL buffer.
2.2. Metabarcoding
DNA from filtered water samples was extracted using NucleoSpin Plant II Midi kit (Macherey-Nagel, Dueren, Germany), according to the producers’ manuals with minor modifications. Final elution of DNA was performed in 200 µL PE-buffer. Filtering and extraction controls were included. Eluted DNA was quantified using a NanoDrop 1000 Spectrophotometer (ThermoFisher Scientific, Wilmington, DE, USA). Average concentrations obtained were 8.5 ± 1.7 and 30.8 ± 16.4 ng/µL in samples from the Munkholmen area in winter and summer, respectively. A ~313 bp fragment of the mitochondrial Cytochrome c Oxidase subunit I gene (mtCOI) were amplified using the degenerated Leary-XT primer set, consisting of the reverse primer jgHCO2198 5′-TAIACYTCIGGRTGICCRAARAAYCA-3′ [25] and the forward primer mlCOIintF-XT 5′-GGWACWRGWTGRACWITITAYCCYCC-3′ [26]. Metabarcoding was performed using standard 16S Metagenomic Sequencing Library preparation protocol from Illumina [27] with some minor modifications. The 1st stage amplification mix contained 2x KAPA HiFi HotStart ReadyMix (Roche Sequencing Solutions, Cape Town, South Africa) with 1.25 µL of each 5 µM forward and reverse primer (jgHCO2198 and mlCOIintF-XT) and 2.5 µL template DNA (≤10 ng/µL) and dH2O to a total volume of 25 µL. The PCR program included 5 min at 95 °C, 16 cycles of 95 °C for 10 s, 62 °C (touchdown, with 1 °C reduction in temperature pr cycle) for 30 s and 72 °C for 1 min, followed by 25 cycles of 95 °C for 10 s, 46 °C for 30 s and 72 °C for 1 min. The program ended with 72 °C for 5 min. In the second amplification, samples were dual indexed using dual indexer (IDT for Illumina, Unique dual indexes), and a PCR program as described in the protocol. After PCR, the quality of amplifications was assessed by electrophoresis using Tape Station (Agilent, Santa Clara, CA, USA), and PCR products were purified after each step using MagBind TotalPure NGS magnetic beads (Omega Bio-tek, Norcross, GA, USA). Indexed amplicons were normalized and pooled into a library before sequencing, using NovaSeq SP paired end 250 bp (Illumina, San Diego, CA, USA) at the Norwegian Sequencing Centre (NSC), Oslo, Norway.
Paired end Ilumina Novaseq data were processed following the DADA2 pipeline [28]. Primers were removed using the cutadapt package (V 5.0) [29] before sequences were filtered and trimmed. Reads with a length between 50 and 210 base pairs were retained for analyses. Next merging of forward and reverse sequences was performed, and amplicon sequence variant (ASV) tables were constructed. After the removal of chimeras, taxonomy was assigned to the remaining sequence variants. The highly curated MetaZooGene Barcode Atlas and Database [30] reference database was used for taxonomic assignment. Sequences retained in the assignment step were not limited to being collected in the North Atlantic Ocean. Within-sample richness estimates were not sub-sampled to an equal sequencing depth (i.e., rarefied) as sample-wise processing of data produced by DADA2 may show spurious correlations between richness metrics and sequencing depth [31]. Analyses of data following taxonomic assignment were conducted on relative abundances within samples.
2.3. Plankton Net Samples
The plankton net samples were used to validate and complement the results from eDNA metabarcoding. Calanoid copepods were identified and counted using a stereomicroscope (Wild Heerbrugg, Leica Microsystems, Lysaker, Norway). The calanoid copepods were categorized as juvenile and adult, with females and males differentiated. Counts of individuals were aggregated across net samples for each sex and life-stage in each sampling campaign.
3. Results
3.1. Adaptive Sampling
The sampling depth for water collection was in the vicinity of the points where high aggregation of biomass were identified using echograms (see Supplementary Figure S1). The periods of high activity differed between sampling campaigns. Thus, as the use of ecograms informed the time of day during which sampling was conducted, contrasting time points were sampled during the winter and summer sampling campaigns. Water samples for eDNA metabarcoding were collected at −2 m and −10 m in both sampling campaigns. The sampling campaign in winter was conducted approximately between 13:00–14:00 and in summer between 22:00–23:00. Collecting samples from two different depths near the area of high biomass aggregations rather than the depth of high activity itself was preferred for the samples collected for metabarcoding due to uncertainty around DNA sinking rates [32]. Plankton nets were placed at depths of −30 m in winter and −10 m in summer where high activity was detected in the echograms in the week preceding each planned sampling campaign.
3.2. Metabarcoding
The Illumina run produced 19,083,277 reads from all samples collected. Following filtering, the dataset consisted of 15,109,500 reads. These reads were then denoised in DADA2 resulting in an average of 1,026,101.5 reads (minimum = 474,990, maximum = 1,880,193) in the final dataset and 97% of reads remained following the removal of chimeras.
Following taxonomic assignment, Calanus finmarchichus, C. glacialis, and C. helgolandicus were differentiated in samples collected in both the summer and winter (see Figure 3a). Data were then filtered to contain ASVs that accounted for 5% or more of a given sample to determine the relative abundance of ASVs identified as Calanoida in each sampling campaign (Figure 3b). When data were filtered to contain ASVs that accounted for 5% or more of a given sample, three genera were abundant in the samples collected in the summer (Oithona, Centropages, and Calanus) and four genera were abundant in the samples collected in the winter (Oithona, Centropages, Acartia, and Microcalanus). An abundance of “other” taxa were also detected in samples collected in winter and summer which were not possible to identify to the genus level. There was a relatively higher abundance of “other” taxa in the summer than winter samples (Figure 3b).
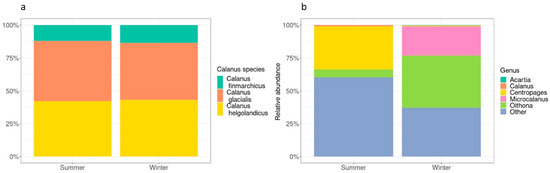
Figure 3.
Panel (a) depicts the relative abundance of all ASVs identified as Calanus with species-level information. Panel (b) depicts the relative abundances of taxa (ASVs identified at the genus level) in the order Calanoida that represent 5% or more of a sample, separated by sampling campaign. All other genera are grouped as “other”.
3.3. Validation Data
Calanoid copepods of the genus Calanus were detected in all plankton net samples. We present the net-sample data as calanoid copepods by life stage, without species-level information (see Figure 4) as very small differences in morphological characteristics are used to differentiate Calanus species, which risks misidentification even by specialized taxonomists [24]. Morphological characteristics that may lead to misclassification of species include ambiguous pigmentation in females, similarities in body size across females, and similarities in coloration of antennae.
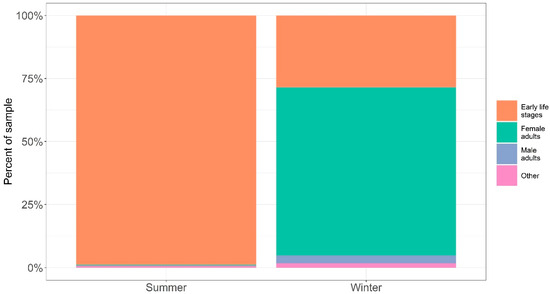
Figure 4.
Relative proportions of copepod early life stages, adult males, adult females, and other organisms from plankton net samples separated by sampling campaign. In the samples collected in the winter, the majority of calanoid copepods identified were adult females (66.70%), with a large amount of early life stage calanoid copepods being the next most represented group (28.50%) with adult males representing just 3.11% of the samples. In the samples collected in the summer, the majority of the sample was early life stage calanoid copepods (98.80%), with adult female calanoid copepods representing just 0.50% of samples and male adults 0.02%.
4. Discussion
4.1. Improving Sampling Using Information Fusion
In this study, we were able to monitor the community composition of calanoid copepods, which are important bioindicators for different stressors [33,34] and water masses [35]. Furthermore, we used complimentary marine biodiversity monitoring methods to provide presence/absence assessments for the genus Calanus. Indeed, results from eDNA metabarcoding were used to provide information on the diversity of calanoid copepods in each sampling campaign (Figure 3) while plankton net samples were used to provide information on the life stages of calanoid copepods in samples (Figure 4). We applied a data-driven sampling approach; one week of continuously collected acoustic sensor data were used to inform the suitable timing (time point with high activity within a 24 h window) and depth (at, and above areas where a high amount of biomass were detected) combined with water sampling for eDNA metabarcoding (see Figure 2 and Figure 3). Using metabarcoding, we were successfully able to detect the three Calanus species known to occur in the North and Norwegian seas (C. finmarchicus, C. glacialis, and C. helgolandicus; [36]). eDNA metabarcoding was the method selected for monitoring the diversity of calanoid copepods in this high-latitude environment as it may provide more information on the presence of Calanus species than traditional taxonomic assessments, as was seen in the morphological species identification of the plankton net samples, when high-quality reference libraries are available [37,38]. In traditional visual morphological analysis, the ability to identify taxa to the species-level can be challenging, especially for groups like Calanus, due to the small variations in their morphological characteristics ([39] and references therein). In addition, it requires highly specialized taxonomic knowledge, and it has been demonstrated to not be effective for distinguishing certain species [40,41]. Indeed, it is likely that C. finmarchicus can be over-estimated in studies that rely on net samples collected in Northern Seas as it has been reported that the morphological species identification systematically overestimates the abundance of C. finmarchicus [42,43] species.
The results from the sampling campaigns performed here were more robust when the information obtained using each method is used together. While each method employed here (i.e., eDNA metabarcoding, acoustic sensors, traditional taxonomic assessments) provides some information, each method has its weaknesses. Metabarcoding, while useful for providing information at the community-level, may not represent the current state of groups of marine organisms such as Calanoids due to variation in DNA sinking and degradation rates [44]. Acoustic sampling may be useful for determining the time and location in the water column where there are high amounts of activity. However, echograms in themselves do not provide information on the source(s) of high aggregations of biomass (e.g., diel vertical migration). Finally, while traditional taxonomic assessments provide high quality information on the presence of target taxa and/or communities, it remains difficult to differentiate groups (e.g., Calanus) and it requires significant time and expertise to collect accurate information on biodiversity. Thus, studies that rely on traditional taxonomic assessments may underestimate the occurrence of some species of Calanus [40,41]. By combining information from each method, we were able to have more confidence in the resulting assessments than would be possible if we had relied on a single method.
4.2. Suggestions for Future Work
The data-driven approach to sampling presented here is likely more time- and cost-effective compared to sampling campaigns that are not based on local, fresh, real-time data. Opportunistic sampling or sampling based on historical data may lead to false-negatives (where a target species is missed) and low reproducibility among replicates [45,46]. Groups such as calanoid copepods which descend into the water column below the depth that is normally sampled by plankton nets for a portion of each day to avoid predation are particularly difficult to monitor [47]. In high latitude environments where biological activity is particularly seasonal, it is important that real-time data are used to inform the timing and depth of sampling as the timing of migrations can be highly dynamic [48]. Therefore, the collection of real-time data rather than the use of historical data are particularly encouraged.
A shortcoming of this study is a lack of random sampling to compare to the results of samples collected using a data-driven approach. Thus, future studies seeking to explore how to expand on using echograms to inform sampling depth and timing should include a random sampling to test whether samples collected opportunistically capture the same events. While a comparison of a random and adaptive sampling would be beneficial for validation of a data-driven approach, future studies should account for the possibility of detection of calanoid copepods by chance. Detection of calanoids when sampling randomly may result in false positive results, which may result in a misinterpretation of the effectiveness of a random sampling approach for monitoring specific taxa (such as calanoid copepods). Future developments of the data-driven approach to sampling that would reduce the manual work of collecting water samples could include the use of autonomous underwater vehicles [49,50]. Rather than relying on the manual inspection of echograms, an autonomous vehicle could be deployed automatically when a certain threshold value from acoustic sensors is reached for a consecutive amount of time comparable to the biological event that is undergoing monitoring (e.g., diurnal vertical migration).
4.3. Conclusions
These results demonstrate that multiple data streams can be used together to improve the accuracy of biodiversity monitoring campaigns. We specifically demonstrate how a data-driven approach can be applied for monitoring calanoid copepods although the use of multiple data streams to inform sampling campaigns can be applied to other taxonomic groups. As the number of automated monitoring platforms that host multiple sensors is increasing internationally, we encourage other monitor programs to use multi-sensor fusion to use multiple data streams to inform marine biodiversity monitoring programs.
Supplementary Materials
The following supporting information can be downloaded at: https://www.mdpi.com/article/10.3390/jmse13040685/s1, Figure S1: An example of an echogram used for adapting sampling depth and timing.
Author Contributions
Conceptualization, L.V, S.P., S.M. and S.H.; methodology, L.V., S.P., S.M. and S.H.; software, L.V.; validation, S.P., S.M. and S.H.; formal analysis, L.V.; investigation, J.F., E.J.D., R.S.-J. and M.A.; data curation, L.V. and S.M.; writing—original draft preparation, L.V., S.P., J.F., E.J.D., S.M. and S.H.; writing—review and editing, L.V, S.H., S.M. and S.P.; visualization, L.V.; supervision, S.H.; project administration, L.V.; funding acquisition, L.V., S.P., S.H. and S.M. All authors have read and agreed to the published version of the manuscript.
Funding
This work is funded in part by SINTEF Ocean’s fundamental research funding (GM), the Research Council of Norway (315728), and this work made use of Norwegian National Research Infrastructure provided by OceanLab (https://oceanlabobservatory.no/).
Data Availability Statement
Data and code are available at Lara Veylit/adaptive_sampling·GitLab (https://gitlab.sintef.no/Lara.Veylit/adaptive_sampling, accessed on 1 February 2025). DOIs will be generated using Zenodo when the data and code are archived following publication.
Acknowledgments
We would like to sincerely thank the Biology Department at the Norwegian University of Science and Technology (NTNU) for access to their Calanus cultures during the planning phase of this project. In addition, we would like to thank Ida Beathe Øverjordet for her expertise with calanoid copepods. We would also like to thank the NINAGEN laboratory, and Markus Majaneva in particular, for providing DNA sequencing services and OceanLab (https://oceanlabobservatory.no/) for access to their ocean data buoy.
Conflicts of Interest
Sanna Majaneva was employed by Akvaplan-niva AS. Lara Veylit, Stefania Piarulli, Julia Farkas, Emlyn J. Davies, Ralph Stevenson-Jones, Marianne Aas, Sanna Majaneva, and Sigrid Hakvåg was employed by SINTEF Ocean. All authors declare that the research was conducted in the absence of any commercial or financial relationships that could be construed as a potential conflict of interest.
References
- Yates, K.L.; Clarke, B.; Thurstan, R.H. Purpose vs. Performance: What Does Marine Protected Area Success Look Like? Environ. Sci. Policy 2019, 92, 76–86. [Google Scholar] [CrossRef]
- Guidetti, P.; Milazzo, M.; Bussotti, S.; Molinari, A.; Murenu, M.; Pais, A.; Spanò, N.; Balzano, R.; Agardy, T.; Boero, F.; et al. Italian Marine Reserve Effectiveness: Does Enforcement Matter? Biol. Conserv. 2008, 141, 699–709. [Google Scholar] [CrossRef]
- Rinaldi, A. Biodiversity 2030: A Road Paved with Good Intentions. EMBO Rep. 2021, 22, e53130. [Google Scholar] [CrossRef] [PubMed]
- Perino, A.; Pereira, H.M.; Felipe-Lucia, M.; Kim, H.J.; Kühl, H.S.; Marselle, M.R.; Meya, J.N.; Meyer, C.; Navarro, L.M.; van Klink, R.; et al. Biodiversity Post-2020: Closing the Gap between Global Targets and National-Level Implementation. Conserv. Lett. 2022, 15, e12848. [Google Scholar] [CrossRef]
- Knight, K.; Seddon, E.S.; Toombs, T.P. A Framework for Evaluating Biodiversity Mitigation Metrics. Ambio 2020, 49, 1232–1240. [Google Scholar] [CrossRef]
- Proença, V.; Martin, L.J.; Pereira, H.M.; Fernandez, M.; McRae, L.; Belnap, J.; Böhm, M.; Brummitt, N.; García-Moreno, J.; Gregory, R.D.; et al. Global Biodiversity Monitoring: From Data Sources to Essential Biodiversity Variables. Biol. Conserv. 2017, 213, 256–263. [Google Scholar] [CrossRef]
- Powell, J.R.; Ohman, M.D. Use of Glider-Class Acoustic Doppler Profilers for Estimating Zooplankton Biomass. J. Plankton Res. 2012, 34, 563–568. [Google Scholar] [CrossRef]
- Basedow, S.L.; McKee, D.; Lefering, I.; Gislason, A.; Daase, M.; Trudnowska, E.; Egeland, E.S.; Choquet, M.; Falk-Petersen, S. Remote Sensing of Zooplankton Swarms. Sci. Rep. 2019, 9, 686. [Google Scholar] [CrossRef]
- Langlois, V.S.; Allison, M.J.; Bergman, L.C.; To, T.A.; Helbing, C.C. The Need for Robust QPCR-Based EDNA Detection Assays in Environmental Monitoring and Species Inventories. Environ. DNA 2021, 3, 519–527. [Google Scholar] [CrossRef]
- Picheral, M.; Catalano, C.; Brousseau, D.; Claustre, H.; Coppola, L.; Leymarie, E.; Coindat, J.; Dias, F.; Fevre, S.; Guidi, L.; et al. The Underwater Vision Profiler 6: An Imaging Sensor of Particle Size Spectra and Plankton, for Autonomous and Cabled Platforms. Limnol. Oceanogr. Methods 2022, 20, 115–129. [Google Scholar] [CrossRef]
- SINTEF OceanLab Observatory. Available online: https://www.oceanlabobservatory.no/ (accessed on 1 February 2025).
- Capurso, G.; Carroll, B.; Stewart, K.A. Transforming Marine Monitoring: Using EDNA Metabarcoding to Improve the Monitoring of the Mediterranean Marine Protected Areas Network. Mar. Policy 2023, 156, 105807. [Google Scholar] [CrossRef]
- Fu, M.; Hemery, L.; Sather, N. Cost Efficiency of Environmental DNA as Compared to Conventional Methods for Biodiversity Monitoring Purposes at Marine Energy Sites; Pacific Northwest National Laboratory (PNNL): Richland, WA, USA, 2021. [Google Scholar]
- McGeady, R.; Runya, R.M.; Dooley, J.S.G.; Howe, J.A.; Fox, C.J.; Wheeler, A.J.; Summers, G.; Callaway, A.; Beck, S.; Brown, L.S.; et al. A Review of New and Existing Non-Extractive Techniques for Monitoring Marine Protected Areas. Front. Mar. Sci. 2023, 10, 1126301. [Google Scholar]
- Deiner, K.; Bik, H.M.; Mächler, E.; Seymour, M.; Lacoursière-Roussel, A.; Altermatt, F.; Creer, S.; Bista, I.; Lodge, D.M.; de Vere, N.; et al. Environmental DNA Metabarcoding: Transforming How We Survey Animal and Plant Communities. Mol. Ecol. 2017, 26, 5872–5895. [Google Scholar] [CrossRef] [PubMed]
- Charron, D.F. Ecosystem Approaches to Health for a Global Sustainability Agenda. Ecohealth 2012, 9, 256–266. [Google Scholar]
- Roman, M.R.; Adolf, H.A.; Landry, M.R.; Madin, L.P.; Steinberg, D.K.; Zhang, X. Estimates of Oceanic Mesozooplankton Production: A Comparison Using the Bermuda and Hawaii Time-Series Data. Deep Sea Res. Part II Top. Stud. Oceanogr. 2002, 49, 175–192. [Google Scholar]
- Steinberg, D.K.; Lomas, M.W.; Cope, J.S. Long-Term Increase in Mesozooplankton Biomass in the Sargasso Sea: Linkage to Climate and Implications for Food Web Dynamics and Biogeochemical Cycling. Glob. Biogeochem. Cycles 2012, 26, 11. [Google Scholar] [CrossRef]
- McQuatters-Gollop, A.; Mitchell, I.; Vina-Herbon, C.; Bedford, J.; Addison, P.F.E.; Lynam, C.P.; Geetha, P.N.; Vermeulan, E.A.; Smit, K.; Bayley, D.T.I.; et al. From Science to Evidence—How Biodiversity Indicators Can Be Used for Effective Marine Conservation Policy and Management. Front. Mar. Sci. 2019, 6, 109. [Google Scholar]
- Batten, S.D.; Abu-Alhaija, R.; Chiba, S.; Edwards, M.; Graham, G.; Jyothibabu, R.; Kitchener, J.A.; Koubbi, P.; McQuatters-Gollop, A.; Muxagata, E.; et al. A Global Plankton Diversity Monitoring Program. Front. Mar. Sci. 2019, 6, 321. [Google Scholar]
- Thackeray, S.J.; Henrys, P.A.; Hemming, D.; Bell, J.R.; Botham, M.S.; Burthe, S.; Helaouet, P.; Johns, D.G.; Jones, I.D.; Leech, D.I.; et al. Phenological Sensitivity to Climate across Taxa and Trophic Levels. Nature 2016, 535, 241–245. [Google Scholar] [CrossRef]
- Reygondeau, G.; Beaugrand, G. Future Climate-Driven Shifts in Distribution of Calanus Finmarchicus. Glob. Change Biol. 2011, 17, 756–766. [Google Scholar] [CrossRef]
- Choquet, M.; Hatlebakk, M.; Dhanasiri, A.K.S.; Kosobokova, K.; Smolina, I.; Søreide, J.E.; Svensen, C.; Melle, W.; Kwasniewski, S.; Eiane, K.; et al. Genetics Redraws Pelagic Biogeography of Calanus. Biol. Lett. 2017, 13, 20170588. [Google Scholar] [CrossRef]
- Nielsen, T.G.; Kjellerup, S.; Smolina, I.; Hoarau, G.; Lindeque, P. Live Discrimination of Calanus Glacialis and C. Finmarchicus Females: Can We Trust Phenological Differences? Mar. Biol. 2014, 161, 1299–1306. [Google Scholar] [CrossRef]
- Geller, J.; Meyer, C.; Parker, M.; Hawk, H. Redesign of PCR Primers for Mitochondrial Cytochrome c Oxidase Subunit I for Marine Invertebrates and Application in All-Taxa Biotic Surveys. Mol. Ecol. Resour. 2013, 13, 851–861. [Google Scholar] [CrossRef] [PubMed]
- Wangensteen, O.S.; Palacín, C.; Guardiola, M.; Turon, X. DNA Metabarcoding of Littoral Hardbottom Communities: High Diversity and Database Gaps Revealed by Two Molecular Markers. PeerJ 2018, 2018, e4705. [Google Scholar] [CrossRef]
- Illumina. 2013. Available online: https://www.illumina.com/ (accessed on 1 February 2025).
- Callahan, B.J.; McMurdie, P.J.; Rosen, M.J.; Han, A.W.; Johnson, A.J.A.; Holmes, S.P. DADA2: High-Resolution Sample Inference from Illumina Amplicon Data. Nat. Methods 2016, 13, 581–583. [Google Scholar] [CrossRef]
- Martin, M. Cutadapt Removes Adapter Sequences from High-Throughput Sequencing Reads. EMBnet J. 2011, 17, 10. [Google Scholar] [CrossRef]
- Bucklin, A.; Peijnenburg, K.T.C.A.; Kosobokova, K.N.; O’Brien, T.D.; Blanco-Bercial, L.; Cornils, A.; Falkenhaug, T.; Hopcroft, R.R.; Hosia, A.; Laakmann, S.; et al. Toward a Global Reference Database of COI Barcodes for Marine Zooplankton. Mar. Biol. 2021, 168, 78. [Google Scholar] [CrossRef]
- Bardenhorst, S.K.; Vital, M.; Karch, A.; Rübsamen, N. Richness Estimation in Microbiome Data Obtained from Denoising Pipelines. Comput. Struct. Biotechnol. J. 2022, 20, 508–520. [Google Scholar] [CrossRef]
- Stewart, K.A. Understanding the Effects of Biotic and Abiotic Factors on Sources of Aquatic Environmental DNA. Biodivers. Conserv. 2019, 28, 983–1001. [Google Scholar]
- Farkas, J.; Svendheim, L.H.; Øverjordet, I.B.; Davies, E.J.; Altin, D.; Nordtug, T.; Olsvik, P.A.; Jager, T.; Hansen, B.H. Effects of Mine Tailing Exposure on the Development of Early Life Stages of the Marine Copepod Calanus Finmarchicus. J. Toxicol. Environ. Health—Part A Curr. Issues 2023, 88, 85–93. [Google Scholar] [CrossRef]
- Hansen, B.H.; Altin, D.; Rørvik, S.F.; Øverjordet, I.B.; Olsen, A.J.; Nordtug, T. Comparative Study on Acute Effects of Water Accommodated Fractions of an Artificially Weathered Crude Oil on Calanus Finmarchicus and Calanus Glacialis (Crustacea: Copepoda). Sci. Total Environ. 2011, 409, 704–709. [Google Scholar] [CrossRef] [PubMed]
- Strand, E.; Bagøien, E.; Edwards, M.; Broms, C.; Klevjer, T. Spatial Distributions and Seasonality of Four Calanus Species in the Northeast Atlantic. Prog. Oceanogr. 2020, 185, 102344. [Google Scholar] [CrossRef]
- Skreslet, S.; Olsen, K.; Mohus, Å.; Tande, K.S. Stage-Specific Habitats of Calanus Finmarchicus and Calanus Helgolandicus in a Stratified Northern Norwegian Fjord. ICES J. Mar. Sci. 2000, 57, 1656–1663. [Google Scholar]
- Djurhuus, A.; Pitz, K.; Sawaya, N.A.; Rojas-Márquez, J.; Michaud, B.; Montes, E.; Muller-Karger, F.; Breitbart, M. Evaluation of Marine Zooplankton Community Structure through Environmental DNA Metabarcoding. Limnol. Oceanogr. Methods 2018, 16, 209–221. [Google Scholar] [CrossRef]
- Suter, L.; Polanowski, A.M.; Clarke, L.J.; Kitchener, J.A.; Deagle, B.E. Capturing Open Ocean Biodiversity: Comparing Environmental DNA Metabarcoding to the Continuous Plankton Recorder. Mol. Ecol. 2021, 30, 3140–3157. [Google Scholar]
- Nielsen, K.M.; Johnsen, P.J.; Bensasson, D.; Daffonchio, D. Release and Persistence of Extracellular DNA in the Environment. Environ. Biosaf. Res. 2007, 6, 37–53. [Google Scholar] [CrossRef]
- Lindeque, P.K.; Harris, R.P.; Jones, M.B.; Smerdon, G.R. Simple Molecular Method to Distinguish the Identity of Calanus Species (Copepoda: Calanoida) at Any Developmental Stage. Mar. Biol. 1999, 133, 91–96. [Google Scholar]
- Choquet, M.; Kosobokova, K.; Kwaśniewski, S.; Hatlebakk, M.; Dhanasiri, A.K.S.; Melle, W.; Daase, M.; Svensen, C.; Søreide, J.E.; Hoarau, G. Can Morphology Reliably Distinguish between the Copepods Calanus Finmarchicus and C. Glacialis, or Is DNA the Only Way? Limnol. Oceanogr. Methods 2018, 16, 237–252. [Google Scholar] [CrossRef]
- Gabrielsen, T.M.; Merkel, B.; Søreide, J.E.; Johansson-Karlsson, E.; Bailey, A.; Vogedes, D.; Nygård, H.; Varpe, Ø.; Berge, J. Potential Misidentifications of Two Climate Indicator Species of the Marine Arctic Ecosystem: Calanus Glacialis and C. Finmarchicus. Polar Biol. 2012, 35, 1621–1628. [Google Scholar] [CrossRef]
- Lindeque, P.K.; Harris, R.P.; Jones, M.B.; Smerdon, G.R. Distribution of Calanus Spp. as Determined Using a Gnetic Identification System. Sci. Mar. 2004, 68 (Suppl. 1), 121–129. [Google Scholar]
- Holman, L.E.; Parker-Nance, S.; De Bruyn, M.; Creer, S.; Carvalho, G.; Rius, M. Managing Human-Mediated Range Shifts: Understanding Spatial, Temporal and Genetic Variation in Marine Non-Native Species. Philos. Trans. R. Soc. B Biol. Sci. 2022, 377, 20210025. [Google Scholar] [CrossRef]
- Xiong, W.; Li, H.; Zhan, A. Early Detection of Invasive Species in Marine Ecosystems Using High-Throughput Sequencing: Technical Challenges and Possible Solutions. Mar. Biol. 2016, 163, 139. [Google Scholar] [CrossRef]
- Zhou, J.; Wu, L.; Deng, Y.; Zhi, X.; Jiang, Y.H.; Tu, Q.; Xie, J.; Van Nostrand, J.D.; He, Z.; Yang, Y. Reproducibility and Quantitation of Amplicon Sequencing-Based Detection. ISME J. 2011, 5, 1303–1313. [Google Scholar] [CrossRef] [PubMed]
- Berge, J.; Cottier, F.; Varpe, Ø.; Renaud, P.E.; Falk-Petersen, S.; Kwasniewski, S.; Griffiths, C.; SØreide, J.E.; Johnsen, G.; Aubert, A.; et al. Arctic Complexity: A Case Study on Diel Vertical Migration of Zooplankton. J. Plankton Res. 2014, 36, 1279–1297. [Google Scholar] [CrossRef]
- Bandara, K.; Varpe, Ø.; Wijewardene, L.; Tverberg, V.; Eiane, K. Two Hundred Years of Zooplankton Vertical Migration Research. Biol. Rev. 2021, 96, 1547–1589. [Google Scholar] [CrossRef]
- Yamahara, K.M.; Preston, C.M.; Birch, J.; Walz, K.; Marin, R.; Jensen, S.; Pargett, D.; Roman, B.; Ussler, W.; Zhang, Y.; et al. In Situ Autonomous Acquisition and Preservation of Marine Environmental Dna Using an Autonomous Underwater Vehicle. Front. Mar. Sci. 2019, 6, 373. [Google Scholar] [CrossRef]
- Hendricks, A.; Mackie, C.M.; Luy, E.; Sonnichsen, C.; Smith, J.; Grundke, I.; Tavasoli, M.; Furlong, A.; Beiko, R.G.; LaRoche, J.; et al. Compact and Automated EDNA Sampler for in Situ Monitoring of Marine Environments. Sci. Rep. 2023, 13, 5210. [Google Scholar] [CrossRef]
Disclaimer/Publisher’s Note: The statements, opinions and data contained in all publications are solely those of the individual author(s) and contributor(s) and not of MDPI and/or the editor(s). MDPI and/or the editor(s) disclaim responsibility for any injury to people or property resulting from any ideas, methods, instructions or products referred to in the content. |
© 2025 by the authors. Licensee MDPI, Basel, Switzerland. This article is an open access article distributed under the terms and conditions of the Creative Commons Attribution (CC BY) license (https://creativecommons.org/licenses/by/4.0/).