Article

The Mooring Optimization and Hydrodynamic Characteristics of the Combined Concept of a 15 MW FOWT with WECs

1
China Southern Power Grid Technology Co., Ltd., Guangzhou 510080, China
2
National Institute of Guangdong Advanced Energy Storage Co., Ltd., Guangzhou 510410, China
3
School of Ocean Engineering and Technology, Sun Yat-sen University, Zhuhai 519082, China
4
Southern Marine Science and Engineering Guangdong Laboratory (Zhuhai), Zhuhai 519082, China
*
Author to whom correspondence should be addressed.
J. Mar. Sci. Eng. 2025, 13(3), 545; https://doi.org/10.3390/jmse13030545
Submission received: 20 February 2025 / Revised: 8 March 2025 / Accepted: 10 March 2025 / Published: 12 March 2025
(This article belongs to the Special Issue Floating Wave–Wind Energy Converter Plants)

Abstract

:
To reduce the cost of offshore wind and wave power, an innovative combined wind–wave energy generation system constituting of a 15 MW semi-submersible floating offshore wind turbine (FOWT) and four torus-type wave energy converters (WECs) is proposed. A wholly coupled numerical model of aero-hydro-elastic-servo-mooring was built to evaluate the mooring line and motion dynamics of this novel combined system. Additionally, a practical mooring optimization framework is proposed with the Latin Hypercube sampling method, Kriging model, and the combined optimization techniques of the Genetic Algorithm and Gradient Algorithm. The optimization results demonstrate that the optimized mooring scheme satisfies all the strict constraints, validating the effectiveness of the optimization method. Moreover, the hydrodynamic characteristics of the combined system and the effects of the WECs on the mooring system under both rated and extreme conditions are discussed, including changes in time-series mooring tension, power spectral density, and statistical characteristics. The research findings provide a reference for the further development and optimization of this novel combined system, contributing to the efficient utilization of offshore renewable energy.

1. Introduction

The Paris Agreement, reached in 2015, aims to achieve the goal of zero net carbon emissions by 2050, mainly by reducing the emission levels of the greenhouse gases that contribute to global warming. The development of clean energy conversion systems constitutes an important means by which to attain this objective. Wind energy and wave energy are two significant clean and renewable energy sources with huge potential. Nevertheless, cost reduction is of paramount importance to guarantee that green and safe electricity remains affordable for consumers. In recent years, the rapid expansion of offshore wind power has led to the deployment of FOWTs into deeper waters. And the IEA Wind Task 49 has developed open-access reference information and designs that aim to accelerate the sustainable commercialization of floating wind arrays [1]. However, this advancement is accompanied by considerable energy costs. Regarding the capture of wave energy, numerous concepts for wave energy converters have been proposed in recent years. For example, several promising types of WECs are identified [2]. Despite their significant potential, the adoption of these concepts in the market is still limited, largely due to their relatively low efficiency and the high energy costs associated with them.
As forms of offshore renewable energy, there is no doubt that wind and wave energies possess substantial potential. Thus, the concept of an integrated offshore energy system for harnessing both wind and wave power is particularly appealing in regions abundant in these resources [3]. This concept can bring considerable financial benefits and reduce the levelized cost of energy (LCOE) by leveraging the shared infrastructure, such as the platform and mooring systems. With its attractive advantages, many scholars have put forward a series of combined concepts for FOWT and WECs. These concepts can synergistically capture energy, share facilities, and enhance power generation efficiency [4,5]. Among them, the European project (MARINA Platform, 2018) has proposed several innovative concepts, encompassing the technology of the Oscillating Water Column (OWC) detailed by Aubault et al. (2011) [6] and Peiffer et al. (2012) [7], the semi-submersible flap combination (SFC) further elaborated by Michailides et al. (2016) [8], and the spar-torus combination (STC) with contributions from Muliawan et al. (2012) [9]. In addition, another attractive concept is the combination of FOWTs and torus-type WECs. For this combined concept, wave energy is extracted by taking advantage of the relative vertical motion between the floating torus and the platform’s columns. Additionally, the local wave height augmented by the platform’s diffraction and radiation effects can also subsequently enhance the energy generation of the WECs [10]. Consequently, the combined concept of a FOWT with torus-type WECs has been regarded as an encouraging strategy to optimize energy yield and load performance [11].
The combined concept holds promise for multiple instances of the extraction of ocean renewable energy [12]. However, it should be noted that it is presently in the nascent stage of research and development and is encountering complex external environments and challenges in coupling analysis. The research on the full-process numerical simulation method still remains insufficient [13]. The hydrodynamic characteristics and performance of various combinations of FOWT and WEC demand extensive and in-depth numerical and experimental analyses and optimizations.
Most of the existing research in recent studies has been centered around the 5 MW wind turbine [14,15,16,17]. With the continuous expansion of the power capacity scale of wind turbines, units ranging from 8 to 15 MW have become prevalent in recent years. Moreover, the detailed data for high-power wind turbines such as the IEA 15 MW have been open sourced to engineers [18]. In an effort to maximize the utilization of diverse renewable energy sources, a novel combined wind–wave energy generation system is proposed in this research. This system comprises a 15 MW semi-submersible floating offshore wind turbine and four heaving torus-type WECs. It represents an ideal solution for comprehensively harnessing wind and wave energy in the deep sea with a reduced LCOE through enhanced renewable energy generation and the sharing of platform and mooring system infrastructure. The FOWT employs the UMaine VolturnUS-S platform, which supports the IEA 15 MW wind turbine [19]. It is important to observe that the initial chain mooring system for the UMaine VolturnUS-S, consisting of three 850 m-long chains at a depth of 200 m, will not fulfill the requirements for the rated and extreme conditions of the novel combined system. In other words, the mooring system must be redesigned and optimized to the greatest extent possible to achieve a cost reduction. The hydrodynamic characteristics and mooring performance under the new mooring arrangement also need to be evaluated for the novel combined system.
Optimization techniques present a highly appealing alternative for the expeditious design and cost optimization of the mooring system within this combined system. In the automotive, shipping, and aerospace industries, optimization techniques have been extensively applied [20]. In contrast to traditional iterative design methodologies, this process can explore a broader design space within a shorter period of time, rendering it attractive to less mature industries [20]. Given the similarities and the dearth of experience, the author anticipates that optimization techniques will evolve into a potent tool and will shape the correct growth trajectory for ascertaining the optimal design schemes for novel combined wind–wave energy generation systems. Specifically, the mooring system merits comprehensive optimization as the mooring cost constitutes more than 10% of the total cost of the FOWT [21]. It is noteworthy that the mooring design is, to a great extent, highly reliant on water depth [22], and the selection process remains predominantly a manual operation method [23]. Consequently, implementing an automatic procedure for mooring optimization is of paramount significance for augmenting the efficiency of the design process [24,25,26]. This facilitates the achievement of more robust and cost-efficient mooring solutions across diverse water depths and environmental conditions.
Mooring optimization is aimed at seeking the optimum of the objective function within the design space while adhering to the constraint conditions. Typically, the objective function pertains to either the economic cost of the mooring system or the associated mass of the mooring line [27]. The design variables can contain aspects such as the azimuth angle, pretension, diameter, mooring line length, and mooring radius, etc. [23]. The constraint conditions are linked to various requirements of the offshore floating system, including motion and mooring line responses.
When it comes to explicitly evaluating the mooring lines and motion response of the proposed combined concept under rated and extreme conditions, the fully time-domain coupled simulations can be carried out under turbulent wind, steady current, and irregular wave conditions [28,29]. To curtail the numerous time-domain calculations during the mooring optimization process, surrogate models prove to be the optimal choice for rapidly predicting the dynamic responses when searching for the optimal solution regarding mooring line configurations. Commonly utilized surrogate models comprise the Kriging model [30,31], the Artificial Neural Network (ANN) model [32,33], the Polynomial Response Surface (PRS) model [12], and the Radial Basis Function (RBF) model [34].
Once the surrogate model is constructed, an appropriate mooring optimization strategy can be employed to find the optimal solution. Generally, optimization methods can be classified into global and local search methods. Global search methods primarily consist of evolutionary algorithms such as Particle Swarm Optimization (PSO) [35], Genetic Algorithm (GA) [36], and Harmony Search (HS) [37]. These algorithms are suitable for locating the global optimal solution. On the other hand, local search methods such as the Gradient method [38] and Sequential Quadratic Programming (SQP) method [39] are appropriate for finding the local optimal solution.
In the current study, a fully coupled numerical model of aero-hydro-elastic-servo-mooring is built to evaluate the mooring line and motion dynamics of the innovative combined system, which consists of a 15 MW semi-submersible FOWT and four torus-type WECs. Moreover, a practical and feasible framework for mooring optimization is put forward for the design of the mooring system. The constrained objective function is converted into an unconstrained function through the application of the penalty function. The Kriging model is employed to construct a surrogate model based on the computational data of samples acquired by the Latin Hypercube method. The combined approach of two optimization techniques, namely the Genetic Algorithm and the Gradient Algorithm, is utilized to search for the global and local optimal solutions in a step-by-step manner. The entire procedure is implemented via self-written Matlab code. Subsequently, the hydrodynamic characteristics of the combined system, as well as the effects of the WECs on the mooring system, are discussed under both rated and extreme conditions.
Based on the research motivation, the organizational structure of this paper is presented as follows. Section 2 elaborates on the description and the numerical model for the combined system of the 15 MW FOWT and WECs. Section 3 describes the optimization problem and the procedure for mooring optimization. Section 4 discusses the mooring optimization results, the hydrodynamic characteristics, and the effects of the WECs on the mooring system. Finally, Section 5 summarizes the conclusions of this study.

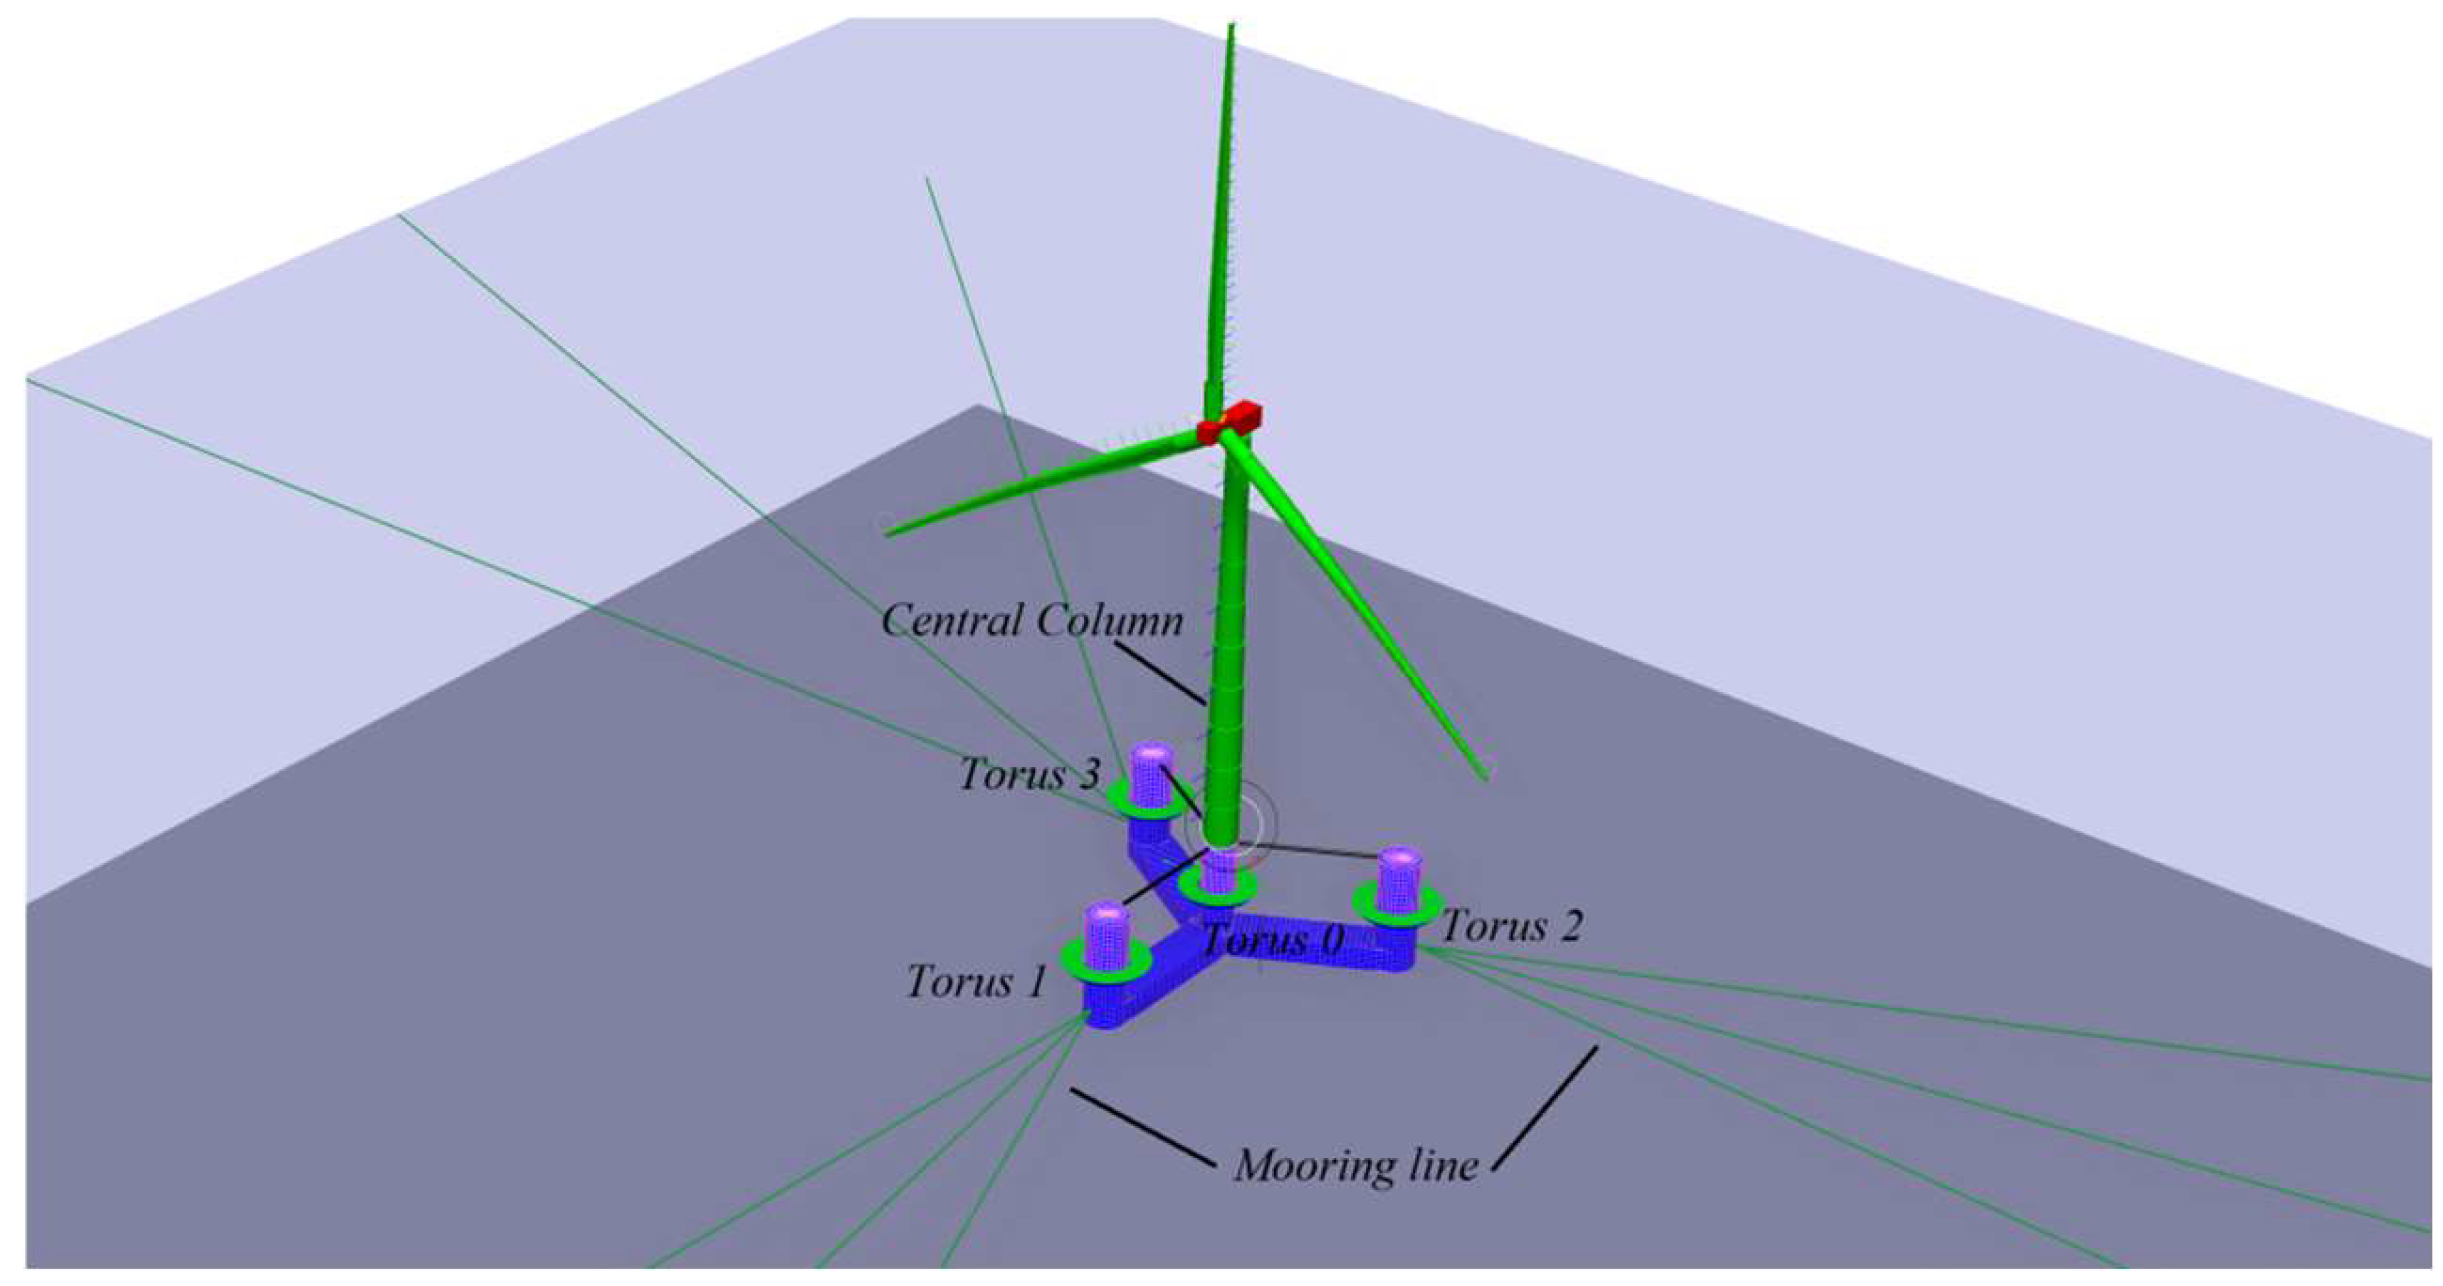
2. The Combined System of the 15 MW FOWT and WECs

2.1. Description

The combined system of the 15 MW FOWT and WECs is depicted in Figure 1. It is composed of a Horizontal Axis Wind Turbine (HAWT) equipped with the NREL Reference OpenSource Controller (ROSCO), a semi-submersible support platform, a mooring system, and four torus-shaped WECs positioned on each column of the platform. The FOWT adopts the platform named UMaine VolturnUS-S, and the IEA-15-240-RWT reference wind turbine is mounted on the central column. Table 1 showcases the key details related to the FOWT. For more comprehensive information, please refer to (Allen et al., 2020) [19].
The torus-shaped WEC is the type that has been studied most extensively, featuring strong adaptability and low cost. It can convert wave energy into electrical power by taking advantage of the relative heave motion between the WEC and the platform columns while the turbine is in operation. As shown in Figure 1, the schematic diagram of the combined system illustrates that each WEC is placed in a geometrically concentric arrangement with respect to its corresponding column. The main parameters of the four torus-shaped WECs are elaborated in Table 2.

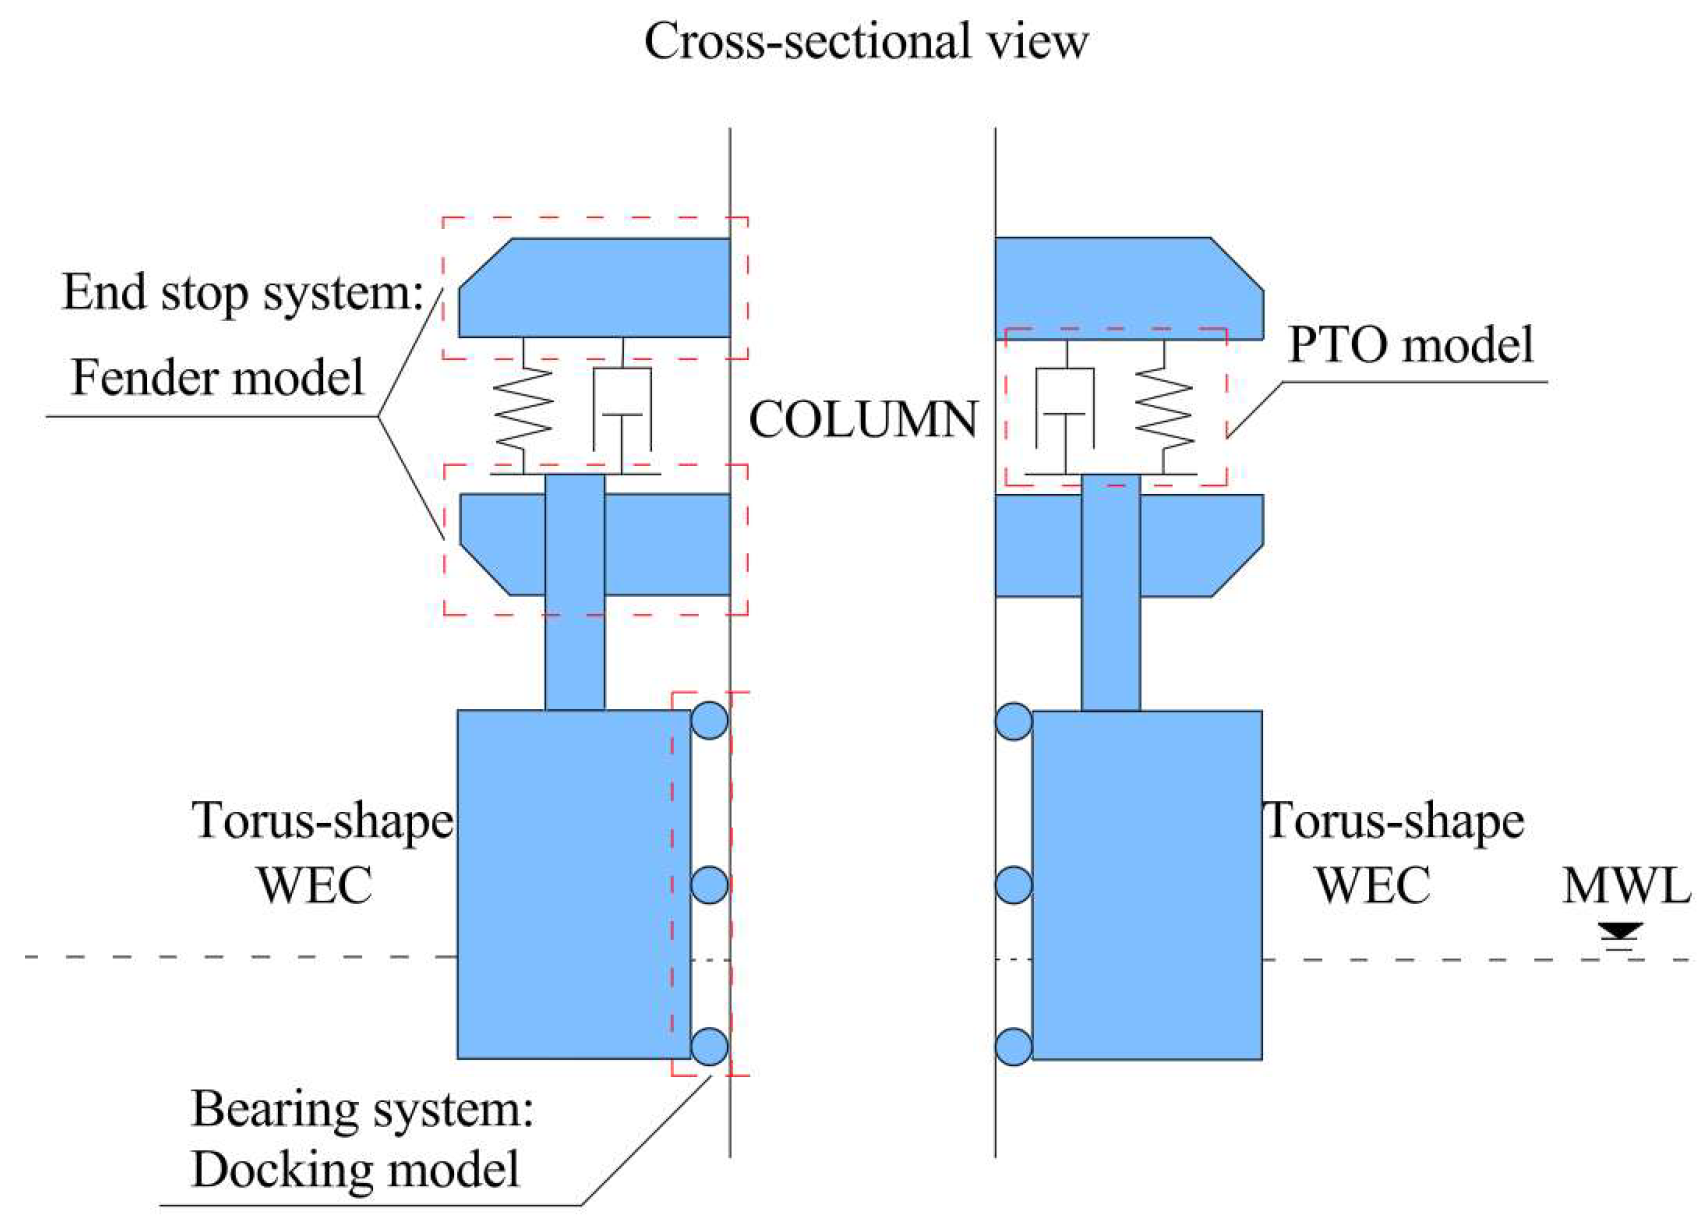
2.2. Numerical Model of the Innovative Combined System

During its operation, the innovative combined system is simultaneously subjected to aerodynamic load, wave load, current load, and mooring load. The most prevalent and efficient practical form of multi-body coupling numerical calculation involves performing a coupled solution for hydrodynamics and aerodynamics in the time domain, which is based on the three-dimensional Potential theory and the Blade Element Momentum (BEM) theory [40,41,42]. In this study, a comprehensive integrated numerical model of aero-hydro-elastic-servo-mooring is fully established by utilizing the SIMO-RIFLEX simulation framework. The time-domain simulation is adopted to statistically analyze the behavior and dynamic response of this novel combined system [43]. Specifically, SIMO deals with hydrodynamic loads on the FOWT and WECs using the three-dimensional Potential theory in the time domain, covering both first- and second-order wave loads acting on the moored combined system. As a flexible-body nonlinear finite-element solver, RIFLEX invokes SIMO to conduct the coupled calculation. Eventually, the fully coupled simulation is solved in the direct nonlinear time domain, incorporating all interaction effects within RIFLEX. The entire numerical model consists of the semi-submersible platform and floating WECs, which are regarded as rigid bodies, the wind turbine blades and tower, which are depicted as nonlinear beam elements, and the mooring lines, which are simulated with nonlinear bar elements.
The time-domain coupled motion equation for the FOWT can be expressed as a convolution integral with the form with the acceleration impulse function matrix.
( M + A ) x ¨ ( t ) + c x ˙ ( t ) + K x ( t ) + 0 t h ( t τ ) x ¨ ( τ ) d τ = F e ( t )
where M and A are the mass matrix and the added mass matrix at infinite frequency of the FOWT, respectively. c is the damping matrix except for the linear radiation damping effects due to diffraction panels. K is the total restoring matrix. F e represents the external forces such as the excitation force, second-order difference-frequency force, viscous drag force, wind load induced by the wind turbine, mooring force, and the coupling force between the FOWT and WECs. x , x ˙ , and x ¨ represent the motion, velocity, and acceleration of the FOWT, respectively. h is the acceleration impulse function matrix, which can be defined by the function of added mass matrices A ω or hydrodynamic damping matrices B ω .
h ( t ) = 2 π 0 B ( ω ) sin ( ω t ) ω d ω = 2 π 0 ( A ( ω ) A ) cos ( ω t ) d ω
where ω is the angular frequency.
Regarding the dynamics of mechanical coupling, the FOWT and the WECs only display relative vertical motion. The remaining five degrees of freedom of the WECs are restricted by the bearing system, which serves as a horizontal limiter, and the end stop mechanism, which acts as a vertical limiter, as depicted in Figure 2. The behavior of the bearings is emulated through a combination of springs and dampers within the docking model. Meanwhile, the end stop mechanism is replaced by a fender model, which defines the maximum allowable vertical displacement as ±3 m.
The Power Take-Off (PTO) model is a part of the WEC transmitting forces and torques. Similar to most studies, the equivalent simplification method is generally used to model the PTO system with a linear damping coefficient BPTO and a linear spring coefficient KPTO in the coupled simulation. The internal force F i n exerted on the combined system can be delineated as follows:
F i n = F B + F K = B P T O η ˙ r + K P T O η r
where η r and η ˙ r represent the relative heave displacement/velocity between the platform and the torus-type WEC. The terms FB and FK correspond to the damping and spring forces, respectively. They are proportional to the velocity and displacement of the relative heave directly. For detailed information about modeling, please refer to (Muliawan et al., 2011) [45].

3. The Optimization of the Mooring System

3.1. Initial Mooring System Properties

The combined system needs to withstand the harsh environment in the deep seas with a mooring system that usually adopts a redundant design [46,47]. More than one mooring line is often set on each column of a semi-submersible platform in the deep seas. The more mooring lines there are, the better the positioning ability of the anchoring system will be. Moreover, the less environmental load each mooring line bears, the better the safety performance will be. In addition, the optimal design of the mooring system should ensure its economy as much as possible, based on the premise of considering the safety and positioning performance. This study abandons the original 3 × 1 spread mooring system and adopts the 3 × 3 mooring type, as shown in the Figure 1.
The rated and extreme environmental conditions, based on the extreme conditions of 1- and 50-year-round periods, respectively, are considered for the mooring combined system, as described in Table 3. Coupled time-domain simulations are conducted to forecast the dynamic responses under both conditions with turbulent wind, steady current, and irregular waves. Turbulent wind fields are created by employing the TurbSim v3.0 software. These wind fields are grounded in the Kaimal wind spectrum model. In the case of irregular waves, the wave forces exerted on the combined system constitute a complex and time-varying force system due to the presence of wave components with different frequencies and amplitudes. And the second-order wave forces can induce low drift motion, leading to dynamic tension variations in the mooring chains. In this study, the irregular wave is represented by the pre-configured JONSWAP wave spectra.
As illustrated in Figure 3, the initial 3 × 3 mooring system is initially determined by the Trial-and-Error method. Each set of three lines is connected at the fairlead with an installed azimuth angle of Aml to each respective outer column of the FOWT at a water depth of 14 m. The mooring lines extend radially towards the anchors within the surge-sway plane. The coefficients for mooring line drag and added mass, as specified in Table 4, are in accordance with the guidelines set forth by DNVGL-OS-E301 [48]. It should be emphasized that the coefficients described in the above-mentioned standards are correlated to the nominal diameter of the chain.
All lines use a studless R4 chain and the weight in water is given by Equation (4) with the unit N/m.
w = 21900 D m l 2 g ( 1 ρ w / ρ s )
where ρ w is the density of water, ρ S is the densities of the chain in air.
To ensure accuracy in material properties, the actual elastic modulus for the mooring line component must be sourced directly from its manufacturer generally. In the phase of preliminary design, the stiffness (EA) for the studless chain R4 can be approximated as follows [48]:
E A = ( 27.25 0.0125 · D m l ) · π · D m l 2 k N
where Dml is the chain diameter in mm.
The load and breaking strength of the unit N/m are given in Equations (6) and (7), respectively. Where Dml is the chain diameter in mm here [48].
F 1 = 21.6 ( 44 0.08 D m l ) D m l 2
F 2 = 27.4 ( 44 0.08 D m l ) D m l 2
In time-domain analyses of mooring line tension, 10 sufficient realizations of duration 3 h simulation length are simulated to provide adequate statistics. Once the extreme sample value, as the maximum value observed in each simulation, has been established, the Gumbel distribution is usually an appropriate method for modeling the distribution of extreme values. The most probable maximum (MPM) can be determined as [48]:
M P M = μ 0.45 · σ
where µ and σ correspond to the mean and standard deviation of the peaks extracted from each simulation, respectively.

3.2. Optimization Problem

A general optimization problem takes the following form:
min : F ( x ) subject   to : g j ( x ) < 0 , j = 1 , , n ;   x L x x U
F(x) is the objective function to be minimized in a range xLxxU. gj(x) is the constraint function. x is the design variable vector. xL and xU are the lower and upper bounds of the design variable vector, respectively.
The objective function could be the cost of the mooring system for the mooring line optimization, including the manufacturing and installation of the mooring lines. In the present study, the objective function is expressed as the total steel mass of the nine mooring lines and takes the form shown in Equation (10).
F ( x ) = 9 × 10 6 × 0.0219 D m l 2 L m l
The design variable vector x = (Dml, Aml, Lml, PTml) and the bounds of the mooring line configuration are shown in Table 5. The initial value of the 3 × 3 mooring system is decided by the Trial-and-Error method. As can be seen from the objective function, the mooring line azimuth angle and pretension do not contribute to the objective function. However, these two design variables contribute to the constraints in Equation (9).
The constraints in the general form of Equation (9) can be summarized in Table 6. During the initial design phase, for the combined system, it may be acceptable to assume some limit values for the serviceability limit state that are subjected to further adjustments at later stage. Table 6 shows the constraints related to the motions of the combined system and the mooring system.
The minimum touch-down length Lmin of a mooring line is evaluated by considering the maximum tension Tmax at the fairlead. The evaluation is based on the quasi-static assumption for the mooring lines and the catenary theory. A negative value implies that the Lmin is zero.
L m i n = L m l h 2 + 2 T m a x w h h
where h is the vertical distance between the fairlead and anchor.
The combined system is subjected to a harsh irregular wind–wave environment, and the coupling effect within the system is highly complex. For instance, the slow-variable forces acting on the combined system govern the low-frequency surge and sway motions. Moreover, the slow drift motions significantly influence the tension in the mooring lines. Undoubtedly, these factors exert a substantial impact on the constraints presented in Table 6, such as mooring tension and surge/sway displacements. Therefore, it is extremely challenging to identify the optimal solution for the optimization problem using the traditional Trial-and-Error method. To efficiently address this optimization problem, an optimization procedure is proposed in the subsequent section.

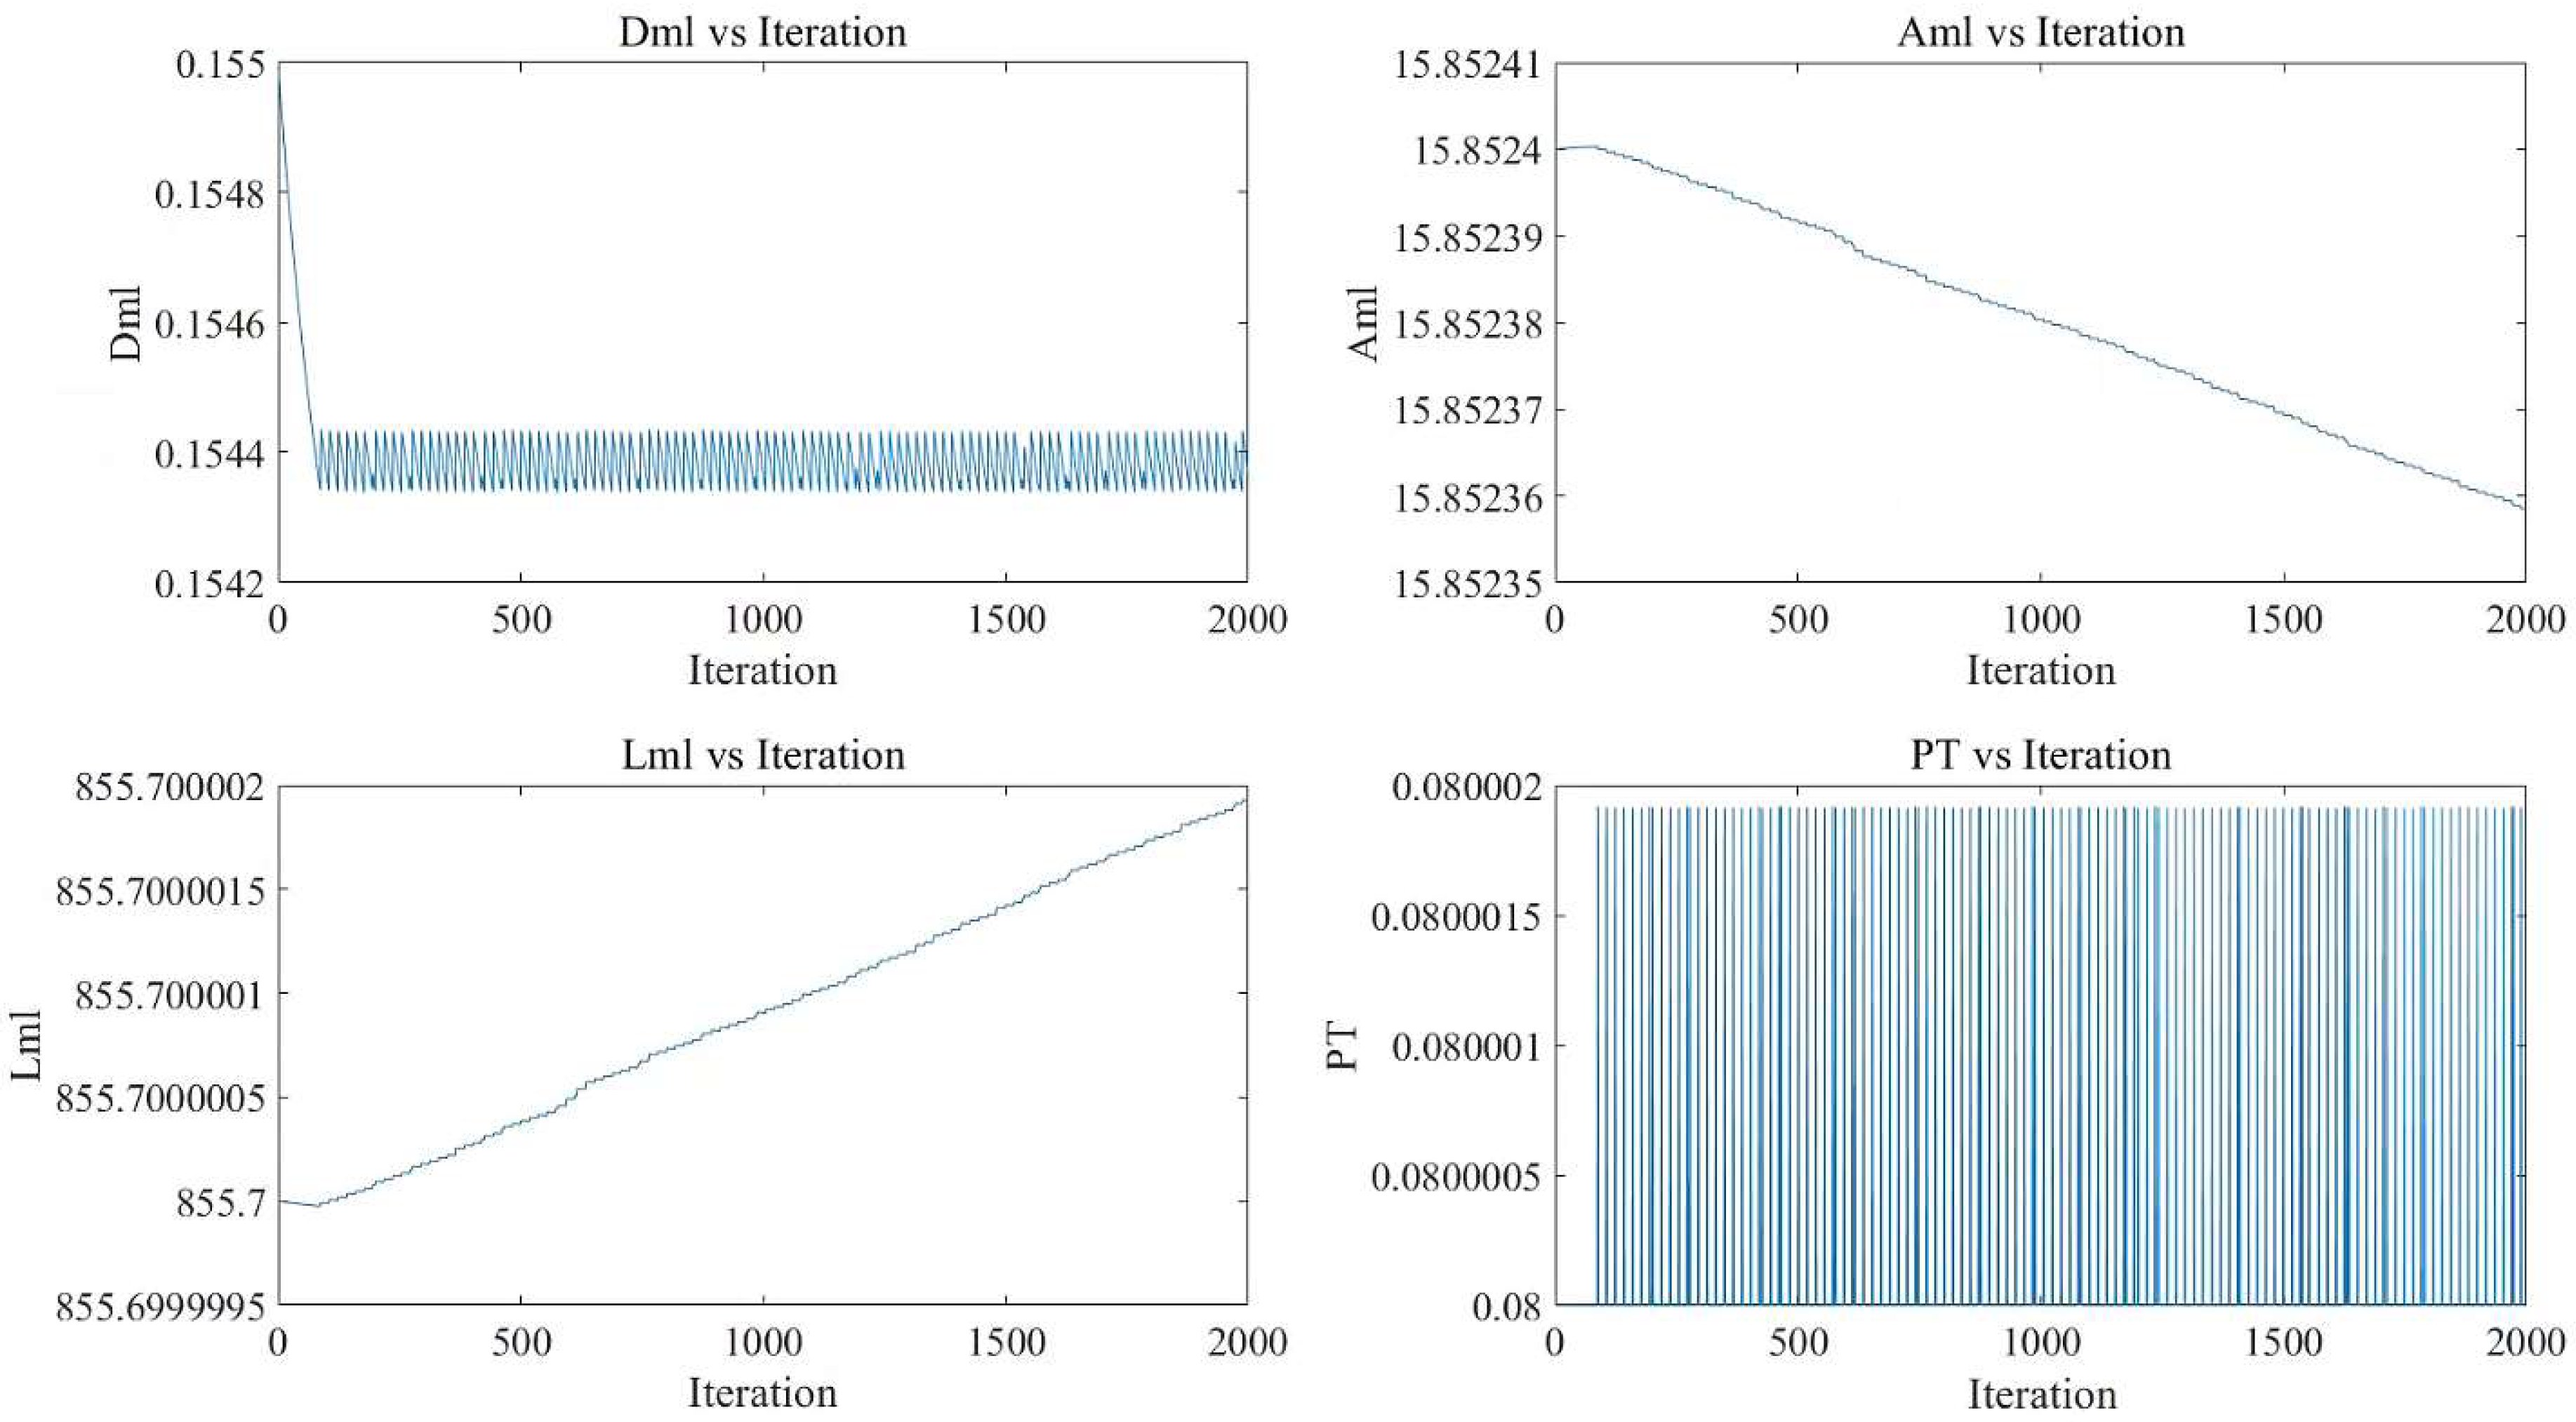
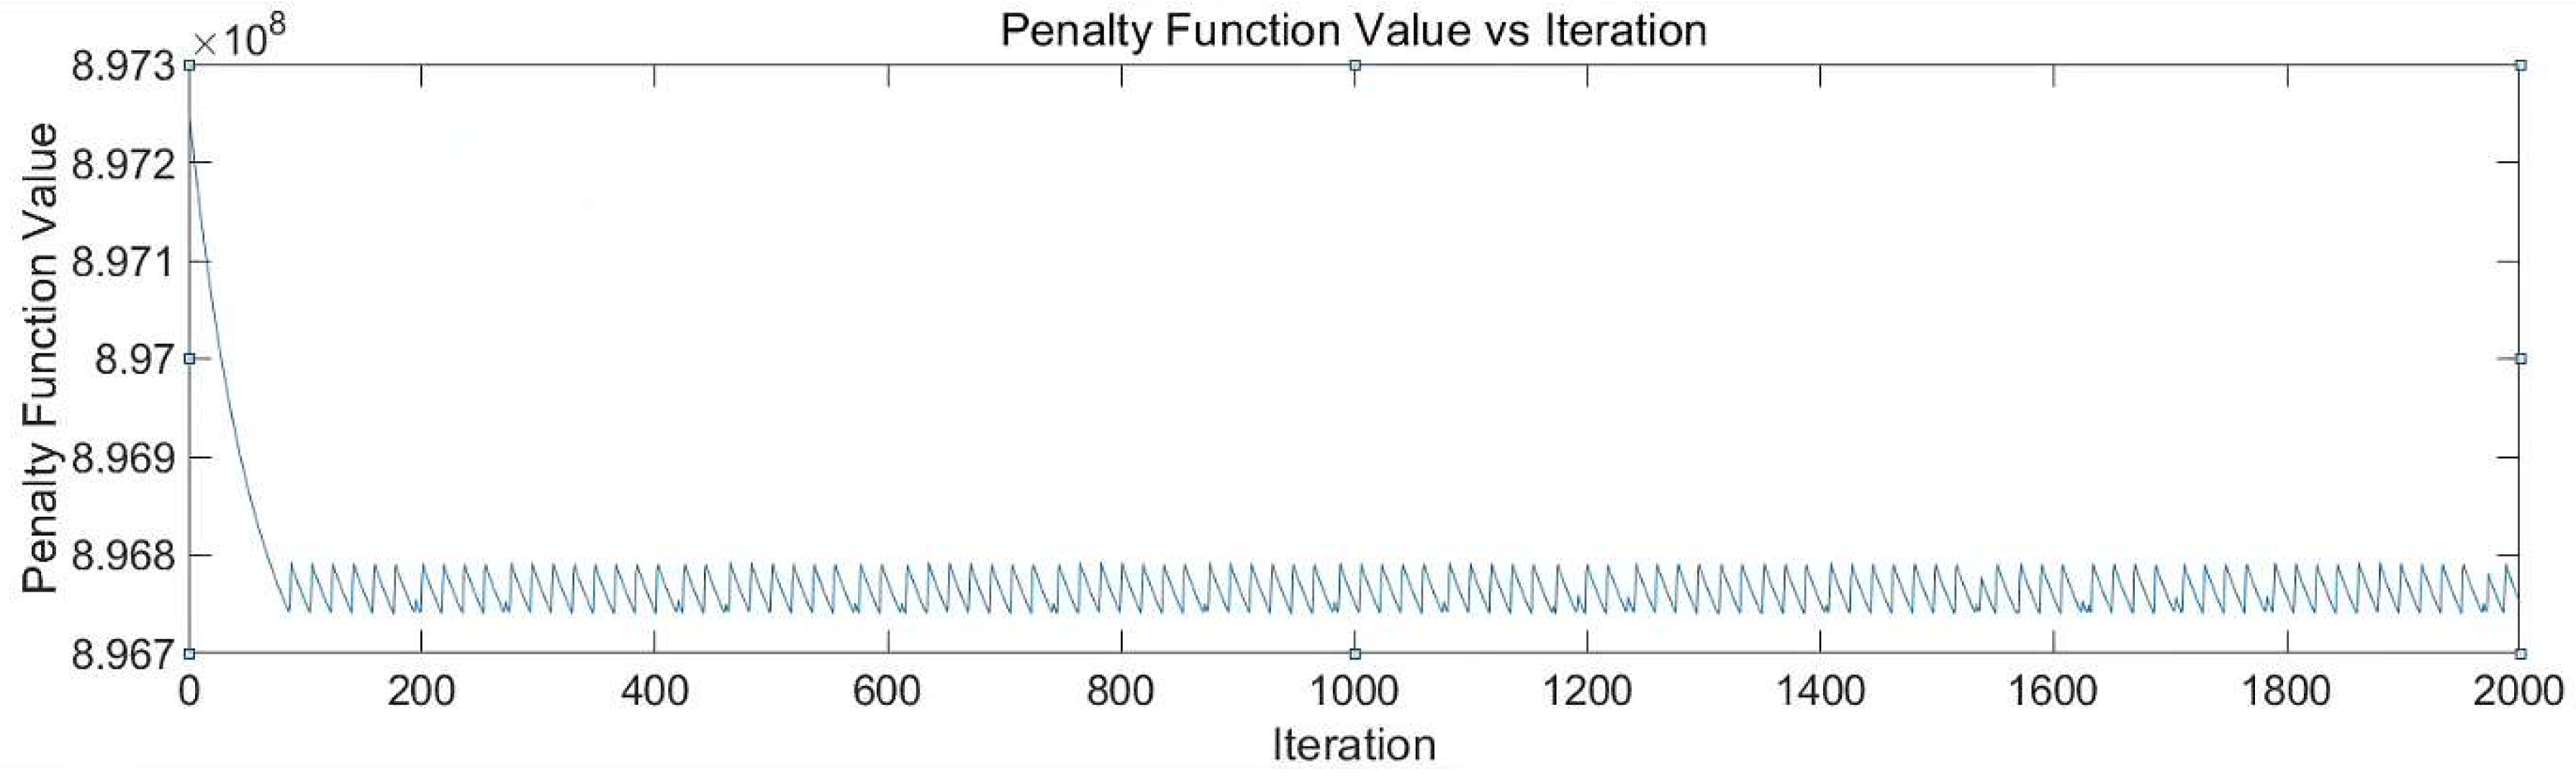
3.3. Optimization Procedure

The workflow of the current optimization procedure is illustrated in Figure 4.
A Latin Hypercube sampling (LHS) procedure is carried out for the four design variables x = ( D m l , A m l , L m l , PT m l ) . The initial sample set is denoted as X = { x ( 1 ) , x ( 2 ) , , x ( n ) } , where n represents the initial sampling number. The values of all the constraints y ( i ) = ( g 1 ( i ) , g 2 ( i ) , , g 10 ( i ) ) T for each input x ( i ) = ( D m l ( i ) , A m l ( i ) , L m l ( i ) , P T m l ( i ) ) T are evaluated by performing the coupled time-domain simulations of the rated and extreme conditions. The numerical modeling for the dynamic simulation of the combined system has been detailed in the previous section.
A Kriging model was adopted to establish a surrogate model between the inputs for the sample set x ˜ = { x ( 1 ) , , x ( n ) } and the outputs of the constraint values Y ˜ = { y ( 1 ) , , y ( n ) } . The optimization will be conducted based on this surrogate model, which can cut down the cost by predicting responses instead of running SIMA simulations for every combination. The Kriging model is an interpolation method based on the assumption of spatial correlation among model predictions.
Based on the objective function given in Equation (10) and the constraints given in Table 6, a newly defined objective function is proposed, as shown in Equation (12), to consider the constraints as penalty functions [33], with a magnification factor of 107 being adopted:
F ˜ ( X ) = F ( X ) + 1 × 10 7 i = 1 10 θ i [ q i ( X ) ] g ˜ i ( X ) γ i ( X ) where   g ˜ i ( X ) = max { 0 , g i ( X ) } , θ i ( X ) = 10 , g ˜ i ( X ) 0.001 20 , 0.001 < g ˜ i ( X ) 0.1 100 , 0.1 < g ˜ i ( X ) 1 200 , g ˜ i ( X ) > 1 , γ i ( X ) = 1 , g ˜ i ( X ) 1 2 , g ˜ i ( X ) > 1
The combined approach of two optimization techniques, namely the Genetic Algorithm and the Gradient Algorithm, is employed to generate the optimal input, x = (Dml, Aml, Lml, PTml), based on the penalty objective function. This combined method searches for the global and local optimal solutions of the objective function step by step. The Genetic Algorithm, which is developed from evolutionary biology (including aspects such as heredity, variation, and Darwin’s principle of selection), is among the most widely utilized methods for finding the optimal solution in prediction or pattern matching [49]. The Gradient method makes use of the gradients of a function to search for the optimal design within the given design space.
The entire procedure is carried out by means of a self-written Matlab code. The optimized configuration acquired through the combined optimization method for the mooring lines will be further verified via SIMA-based time-domain simulations [50]. The corresponding constraint values are examined to guarantee that all the constraints are fulfilled.

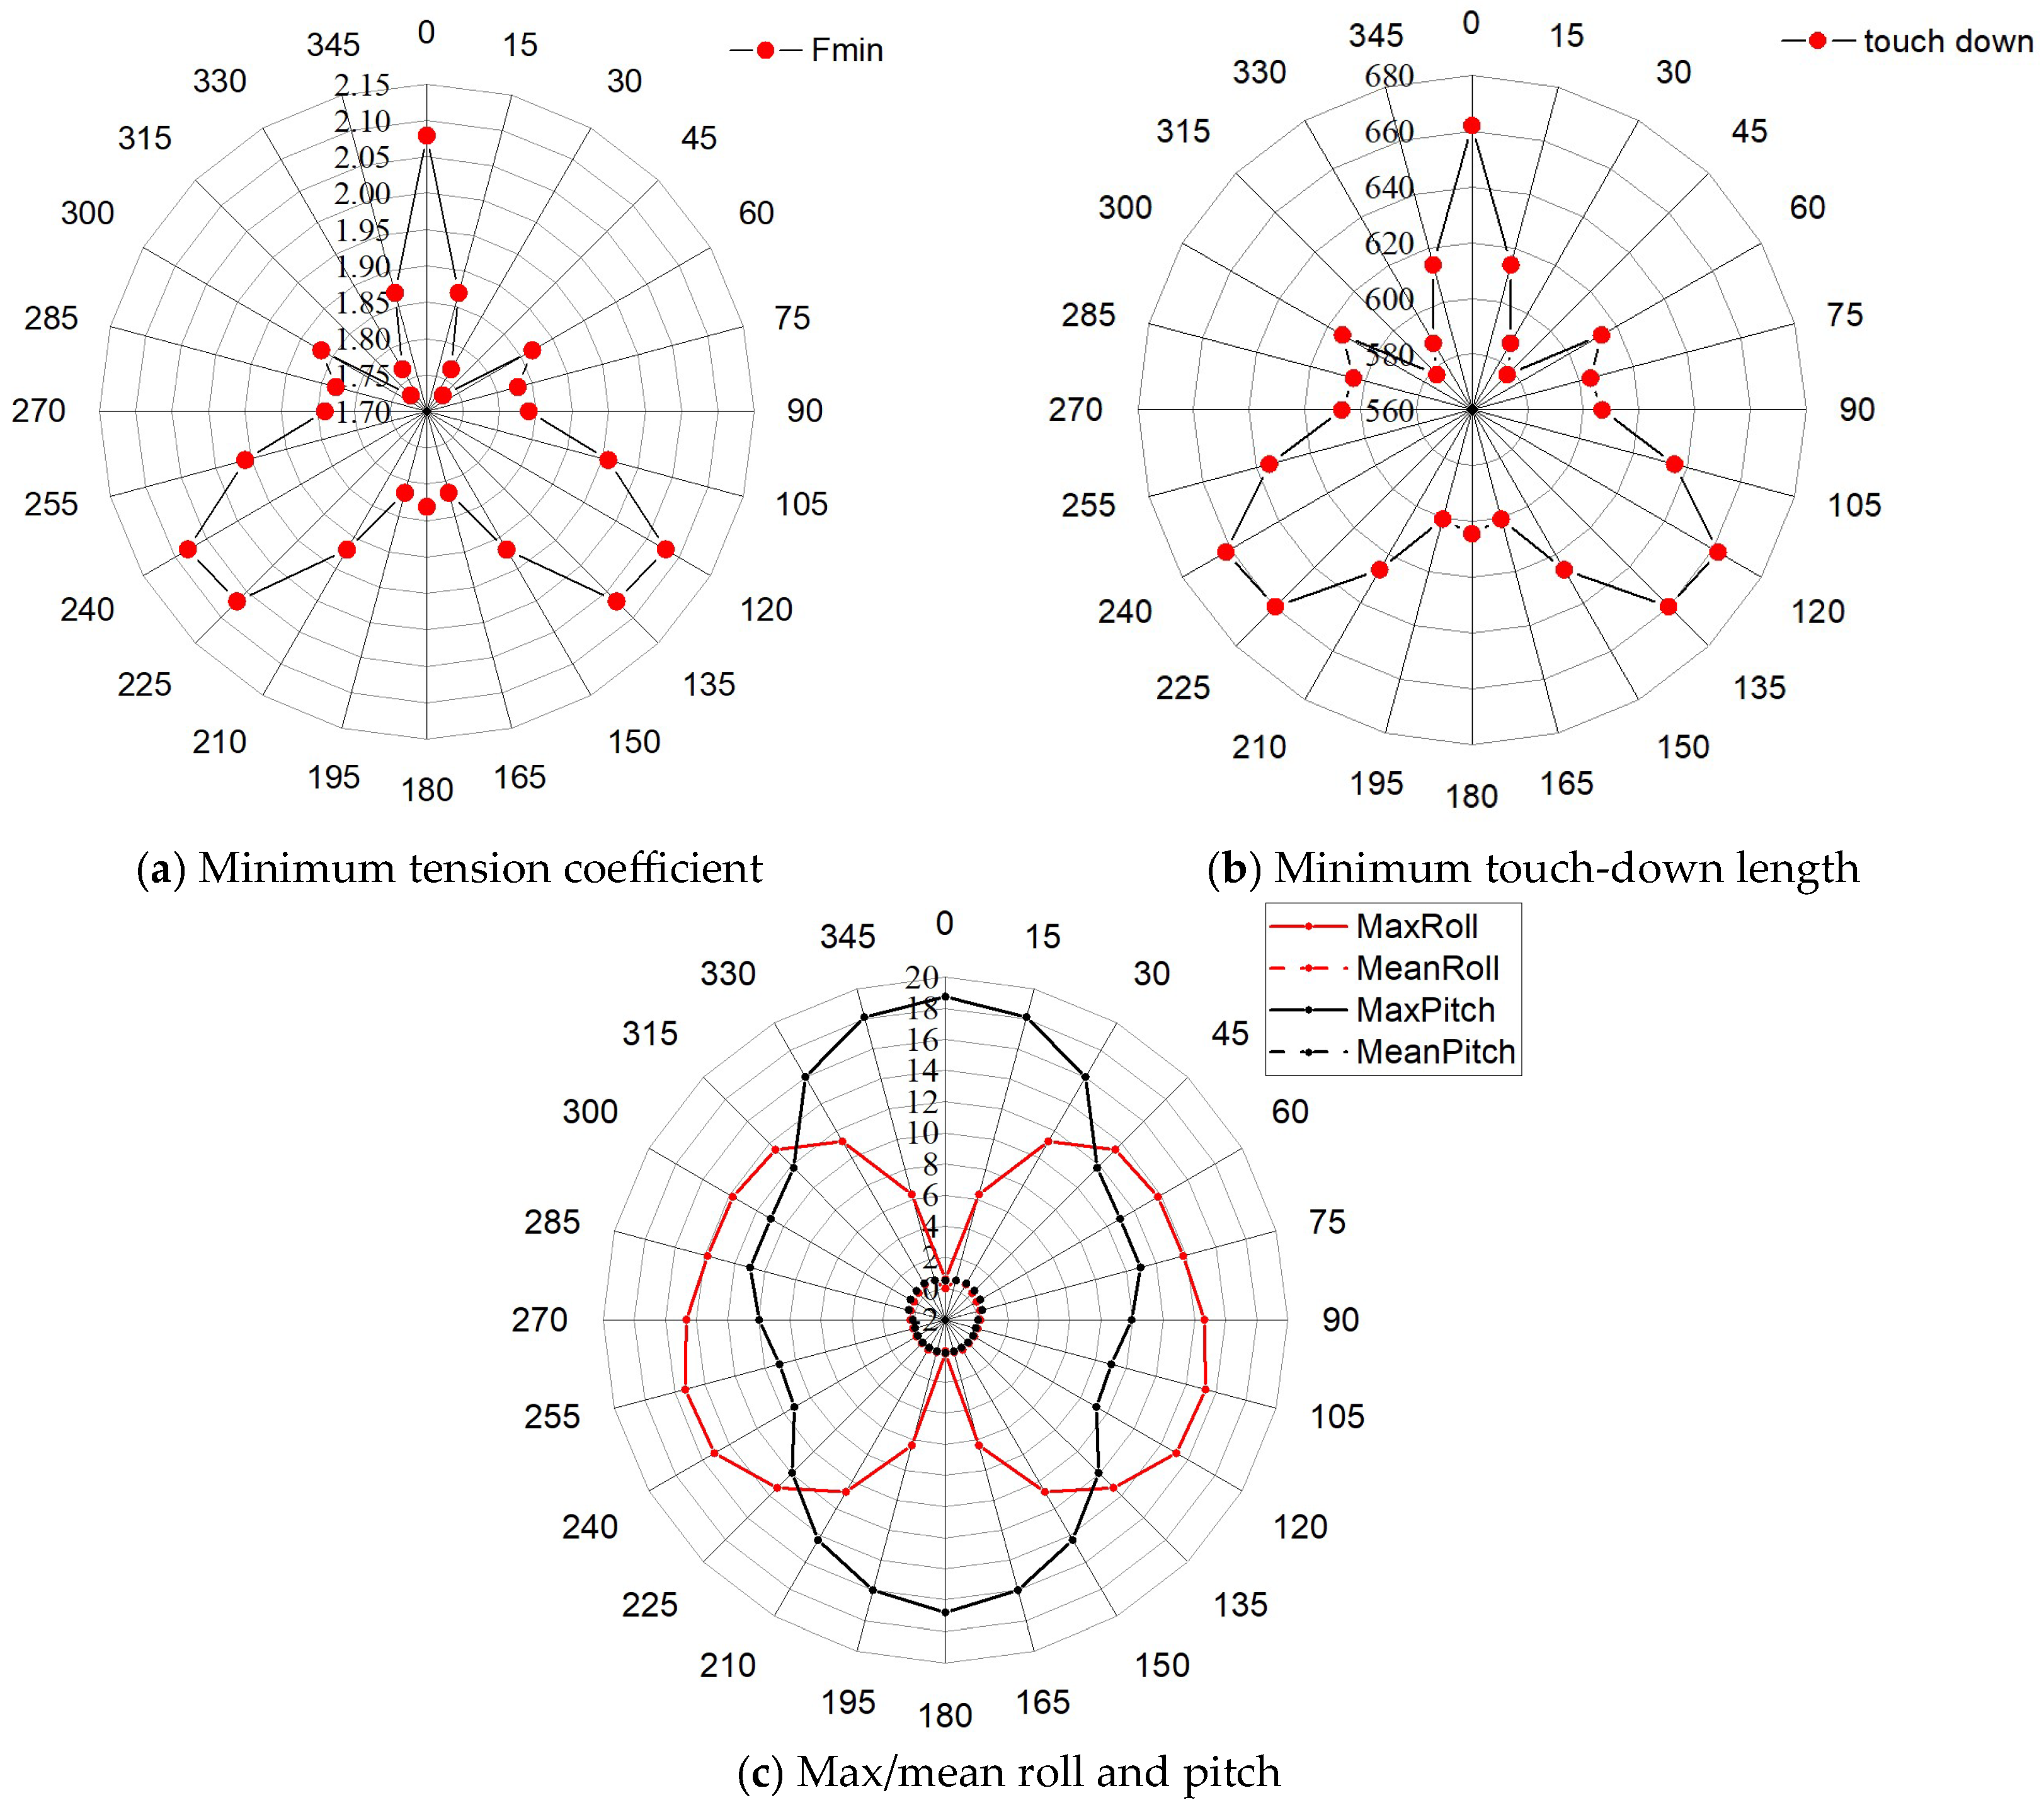
4. Results and Discussions

4.1. Dynamic Analysis of the Initial Mooring Configuration

The original 3 × 1 spread mooring system is discarded and the 3 × 3 mooring type is adopted instead, as depicted in Figure 1. The initial values of the mooring parameters presented in Table 5 are determined by the Trial-and-Error method. It is worth noting that, during the initial design stage, only the constraint regarding the strength of the mooring lines is taken into account under both rated and extreme conditions, while the other constraints shown in Table 6 are neglected.
Under the extreme conditions, the wind turbines of the combined system are shut down, with the blades pitched to 90 degrees. Meanwhile, the PTO system is released and the WEC is locked with the corresponding column at the free surface so that they move together as a rigid body. Figure 5 illustrates the tension safety factors and the minimum touch-down lengths of the mooring line under different wind, wave, and current directions in the extreme conditions, along with the average and maximum values of the platform’s roll, pitch, surge, and sway. As can be observed from the Figure:
(1) The minimum value of the mooring line safety factor is 1.73, which occurs in the 45 degrees direction.
(2) The minimum touch-down length is 578 m, with a certain degree of redundancy.
(3) The average values of the platform’s roll and pitch are very small, and can easily meet the constraint requirements in Table 6. However, their maximum amplitudes are relatively large.
Under the rated conditions, the wind turbines and WECs of the combined system are in normal operational mode, and the wind turbines are able to yaw autonomously in accordance with the wind direction. Figure 6 displays the tension safety factors and the minimum touch-down lengths of the mooring line under different directions, along with the average and maximum values of the platform’s roll, pitch, surge, and sway. As can be seen from the figure:
(1) The minimum value of the mooring line safety factor is 4.75, which occurs in the 45 degrees direction.
(2) The minimum touch-down length of the mooring lines is above 1000 m, with a relatively large degree of redundancy.
(3) The average values of the platform’s roll and pitch are very small, and can easily meet the constraint requirements in Table 6. However, their maximum amplitudes are relatively large.
(4) Under the preliminary mooring configuration, the maximum amplitudes of the platform’s surge and sway greatly surpass the limit requirements specified in Table 6. Specifically, the maximum value for the surge is 54.7 m, and this occurs in the 180 degrees direction.
It can be seen from Figure 5 and Figure 6 that the preliminarily proposed mooring scheme has a certain degree of redundancy in terms of the length of the mooring lines, but its surge and sway cannot meet the constraint requirements in Table 6. In order to carry out the optimization design of the mooring system under the given constraint conditions, it is necessary to select the most unfavorable directions under rated and extreme conditions, respectively. According to the results in Figure 5 and Figure 6, the most unfavorable direction under the extreme conditions is selected as the 45 degrees direction, which has the greatest impact on the mooring line safety factor, and the most unfavorable direction for the rated conditions is selected as the 180 degrees direction, which has the greatest impact on the platform’s surge amplitude. The rated and extreme conditions with the most unfavorable direction are shown in Figure 7 and Figure 8, respectively.

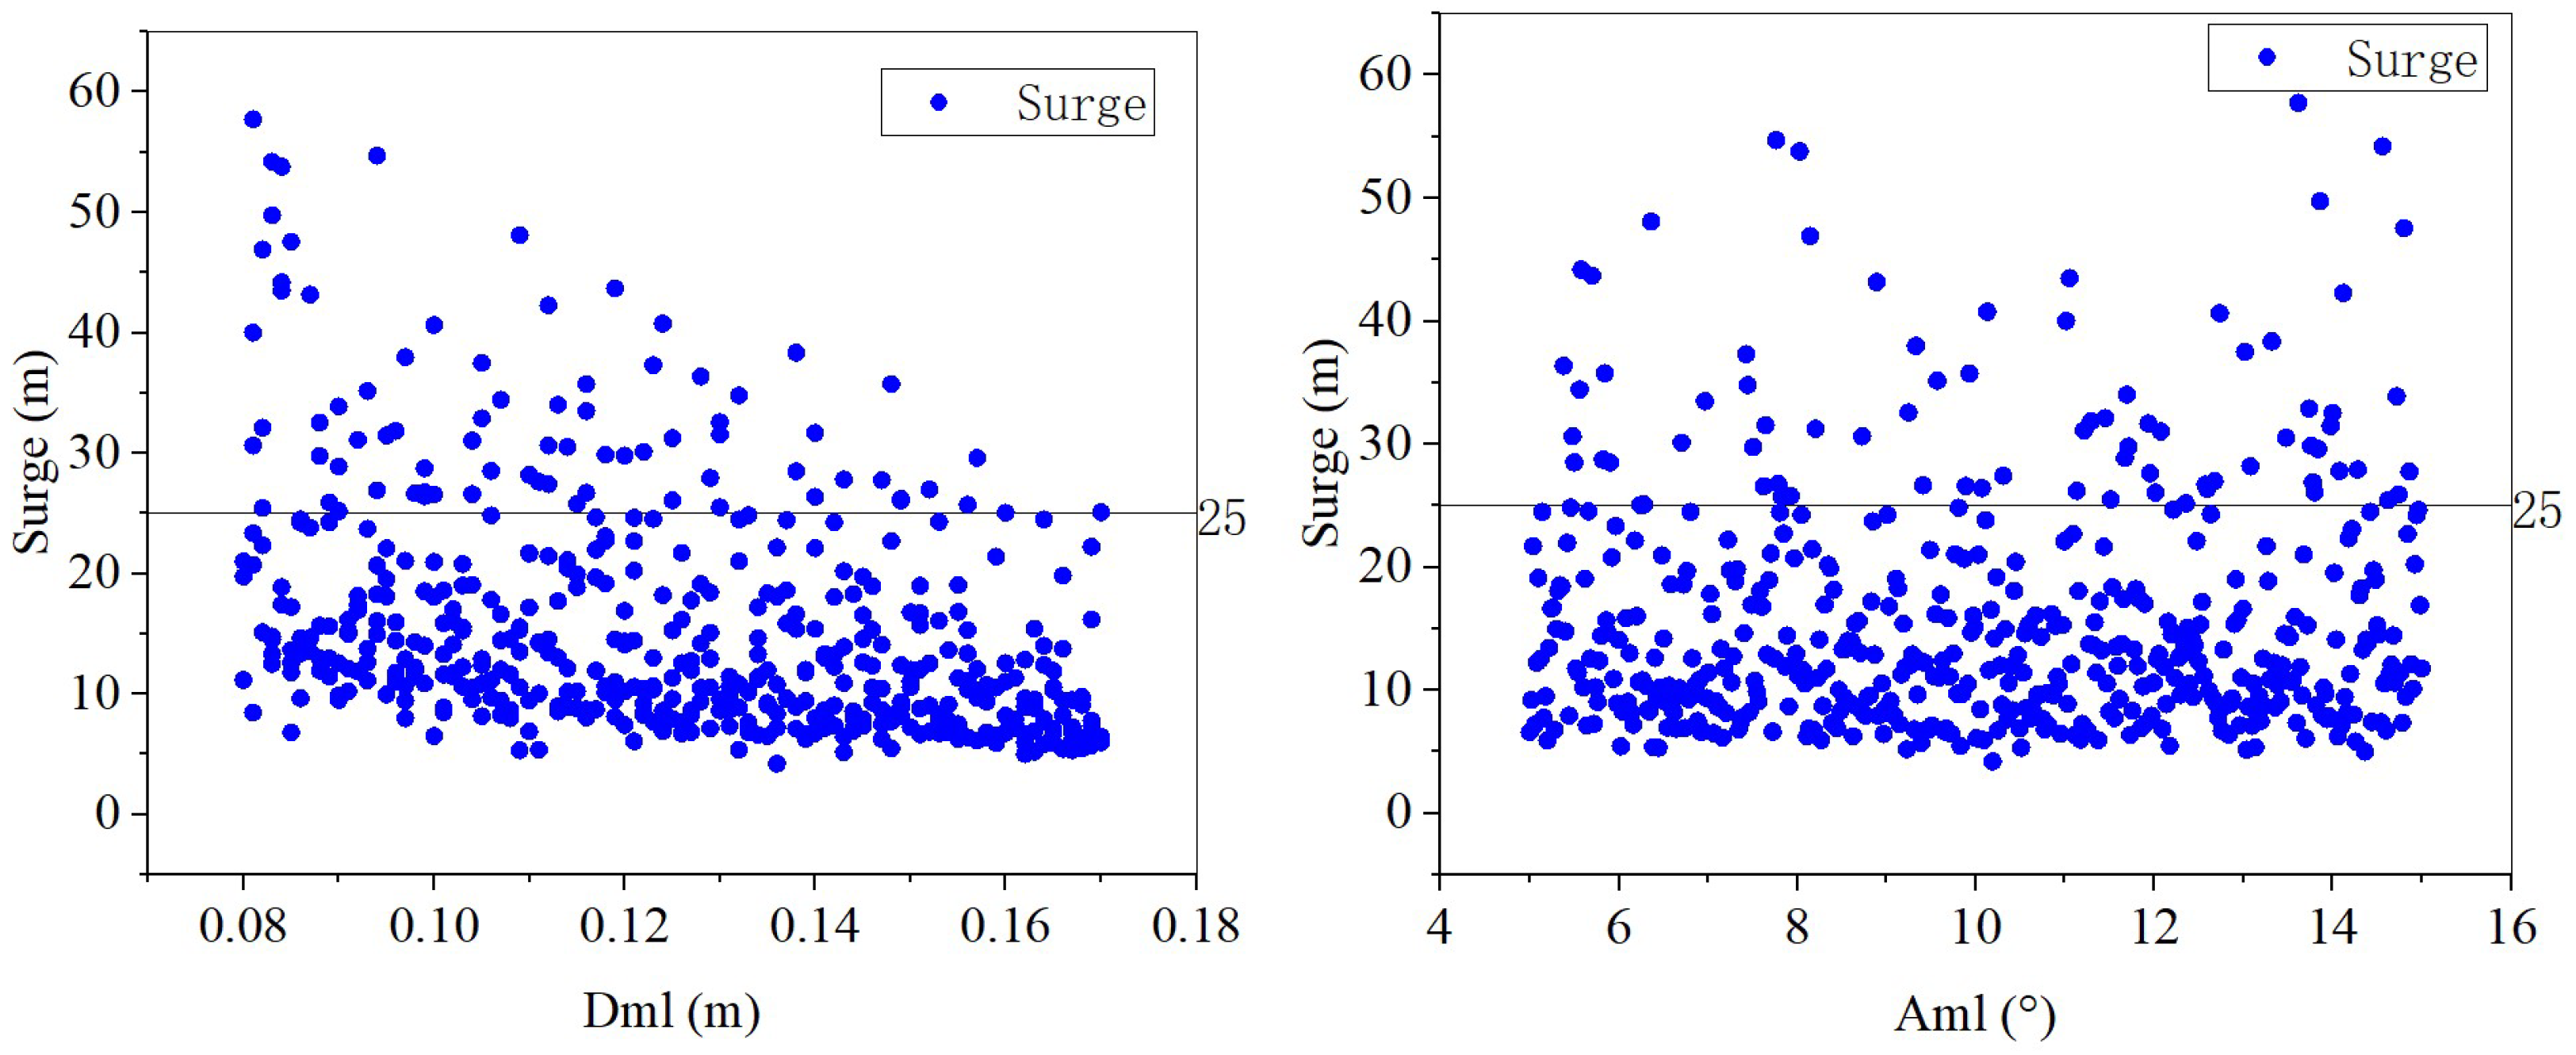
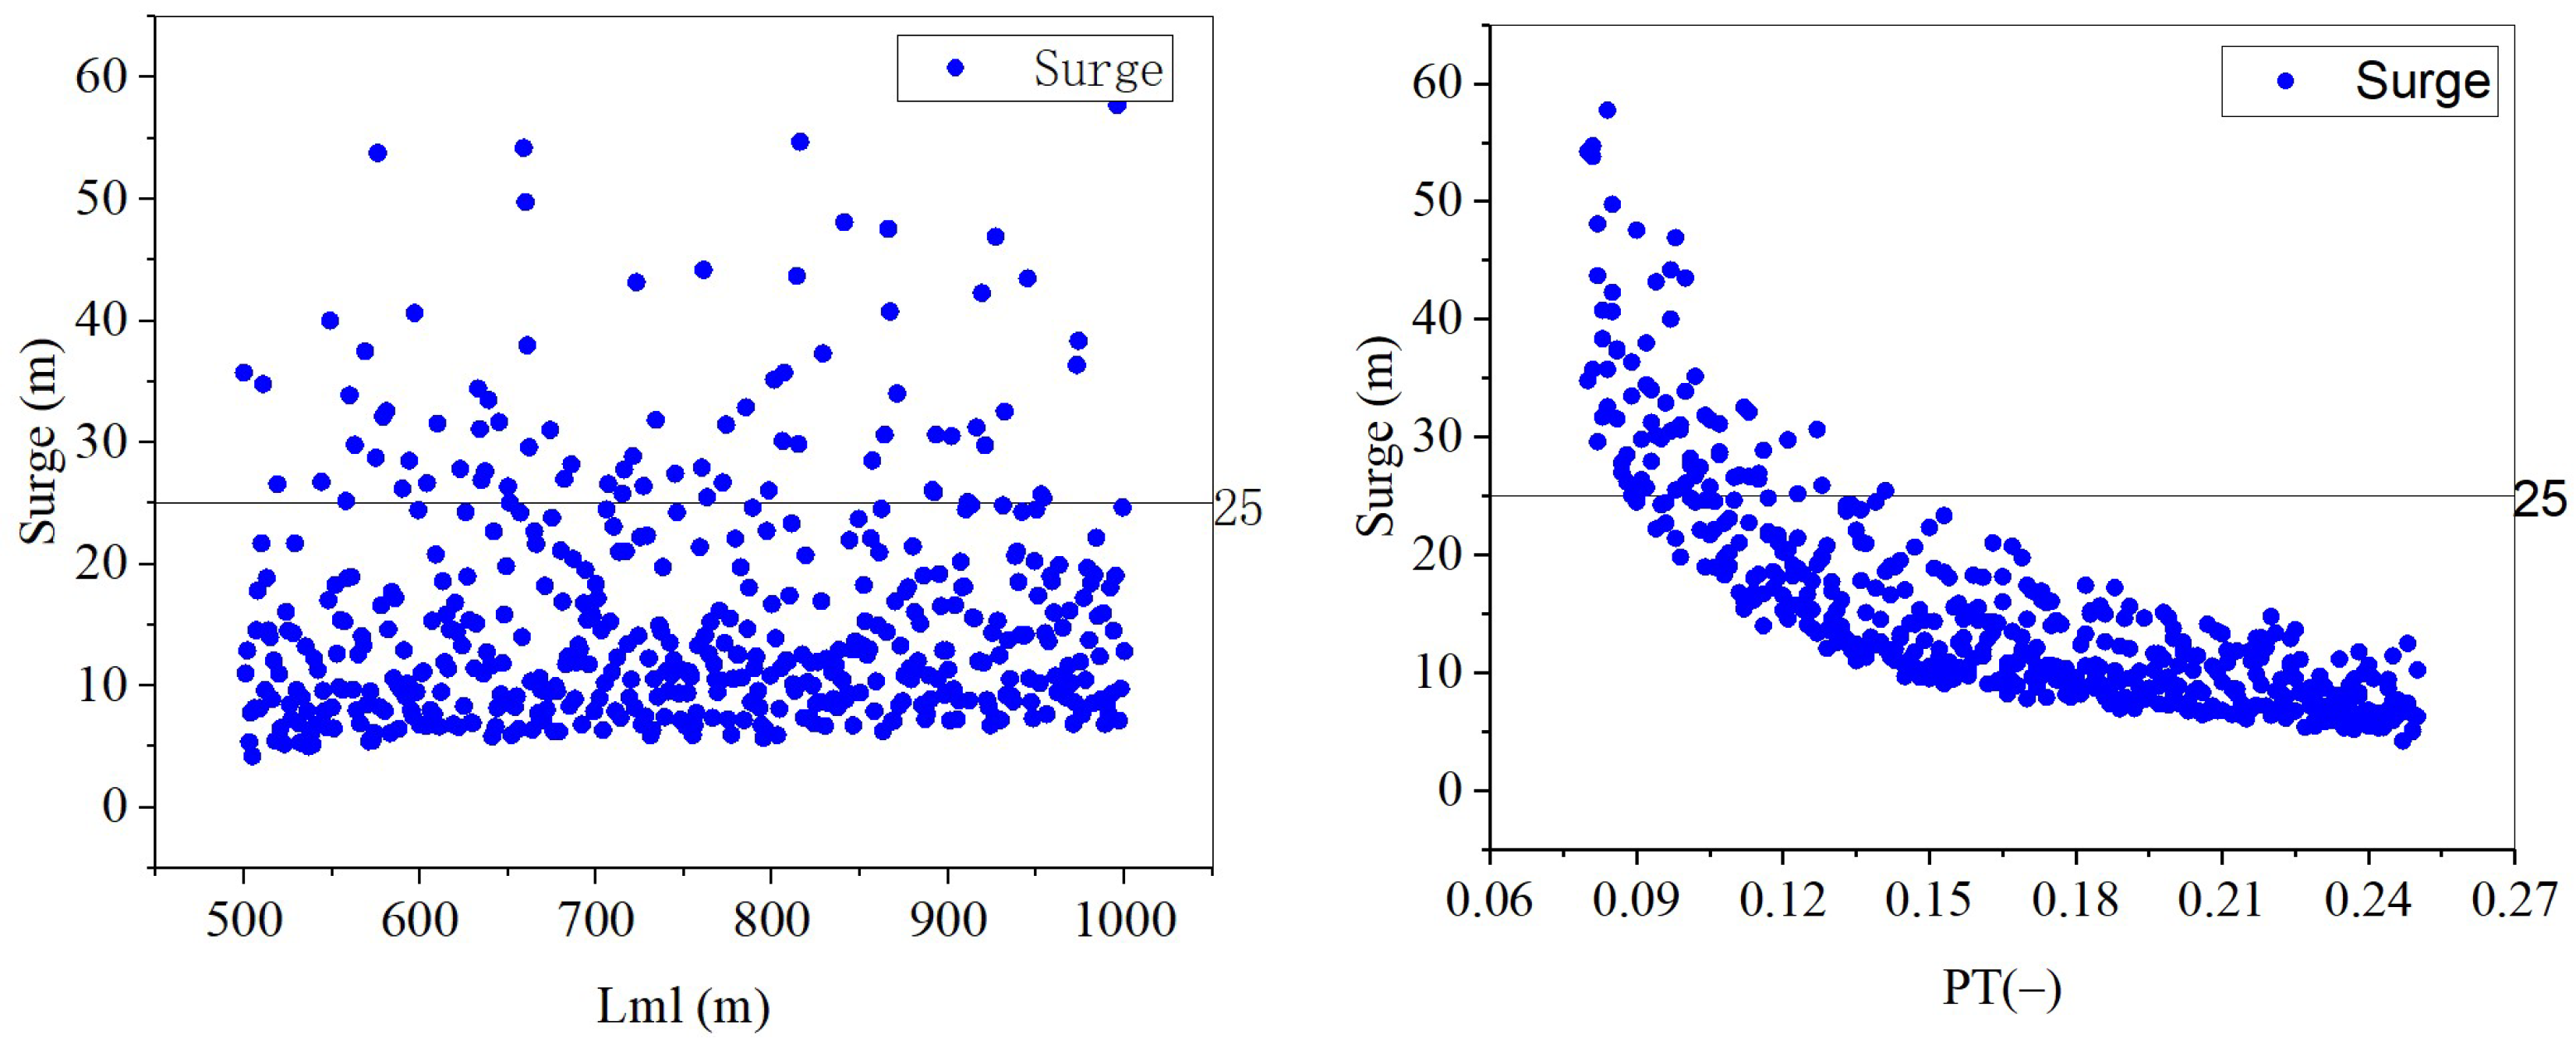
4.2. Latin Hypercube Sampling (LHS) Results and Verification of Kriging Model

LHS is an experimental design method used for sampling in multi-dimensional spaces, as shown in Figure 4. the first step in the current optimization procedure is to generate 500 samples of x = (Dml, Aml, Lml, PTml) with the LHS method and then conduct the simulation with SIMA. The time-domain analysis for each case lasts for 3 h. The unstable period of the first 600 s is excluded when the time-domain response results are statistically analyzed.
Figure 8 shows the relationship of distribution between four independent variables and the minimum tension coefficient Fmin among 500 samples in the extreme conditions. It can be seen that there is a strongly correlated linear relationship between the Dml and the Fmin. As the Dml increases, the Fmin also increases accordingly. It can also be observed from Figure 8 that the range of the sample space is relatively reasonable as the number of samples that meet the requirements accounts for about half. Figure 9 shows the distribution relationship between four independent variables and the maximum surge among 500 samples in the rated conditions. It can be seen that there is a strongly correlated nonlinear relationship between the pretension PTml and the maximum surge. As the PTml increases, the maximum surge decreases nonlinearly.
Once the results of these 500 samples are obtained, the Kriging model can be employed to build an approximate model, which can then be used to replace the SIMA simulation for predicting dynamic responses under different combinations of design variables. However, strict verification must be carried out to ensure its accuracy and reliability before applying the Kriging model. In this study, the verification of the Kriging model is based on the initial LHS samples. Specifically, 99% of the samples are selected to construct the Kriging model, while the remaining 1% of the samples are used as verification cases. Figure 10 and Figure 11 clearly show the verification results of the Kriging model and SIMA in the rated and extreme conditions. Through the verification analysis of these five samples, it can be found that the results of the Kriging model are almost exactly the same as those of SIMA. This phenomenon indicates that the Kriging model, as a surrogate model for SIMA simulation, is highly reliable and can provide relatively accurate predictions of dynamic response to support the next optimization process.

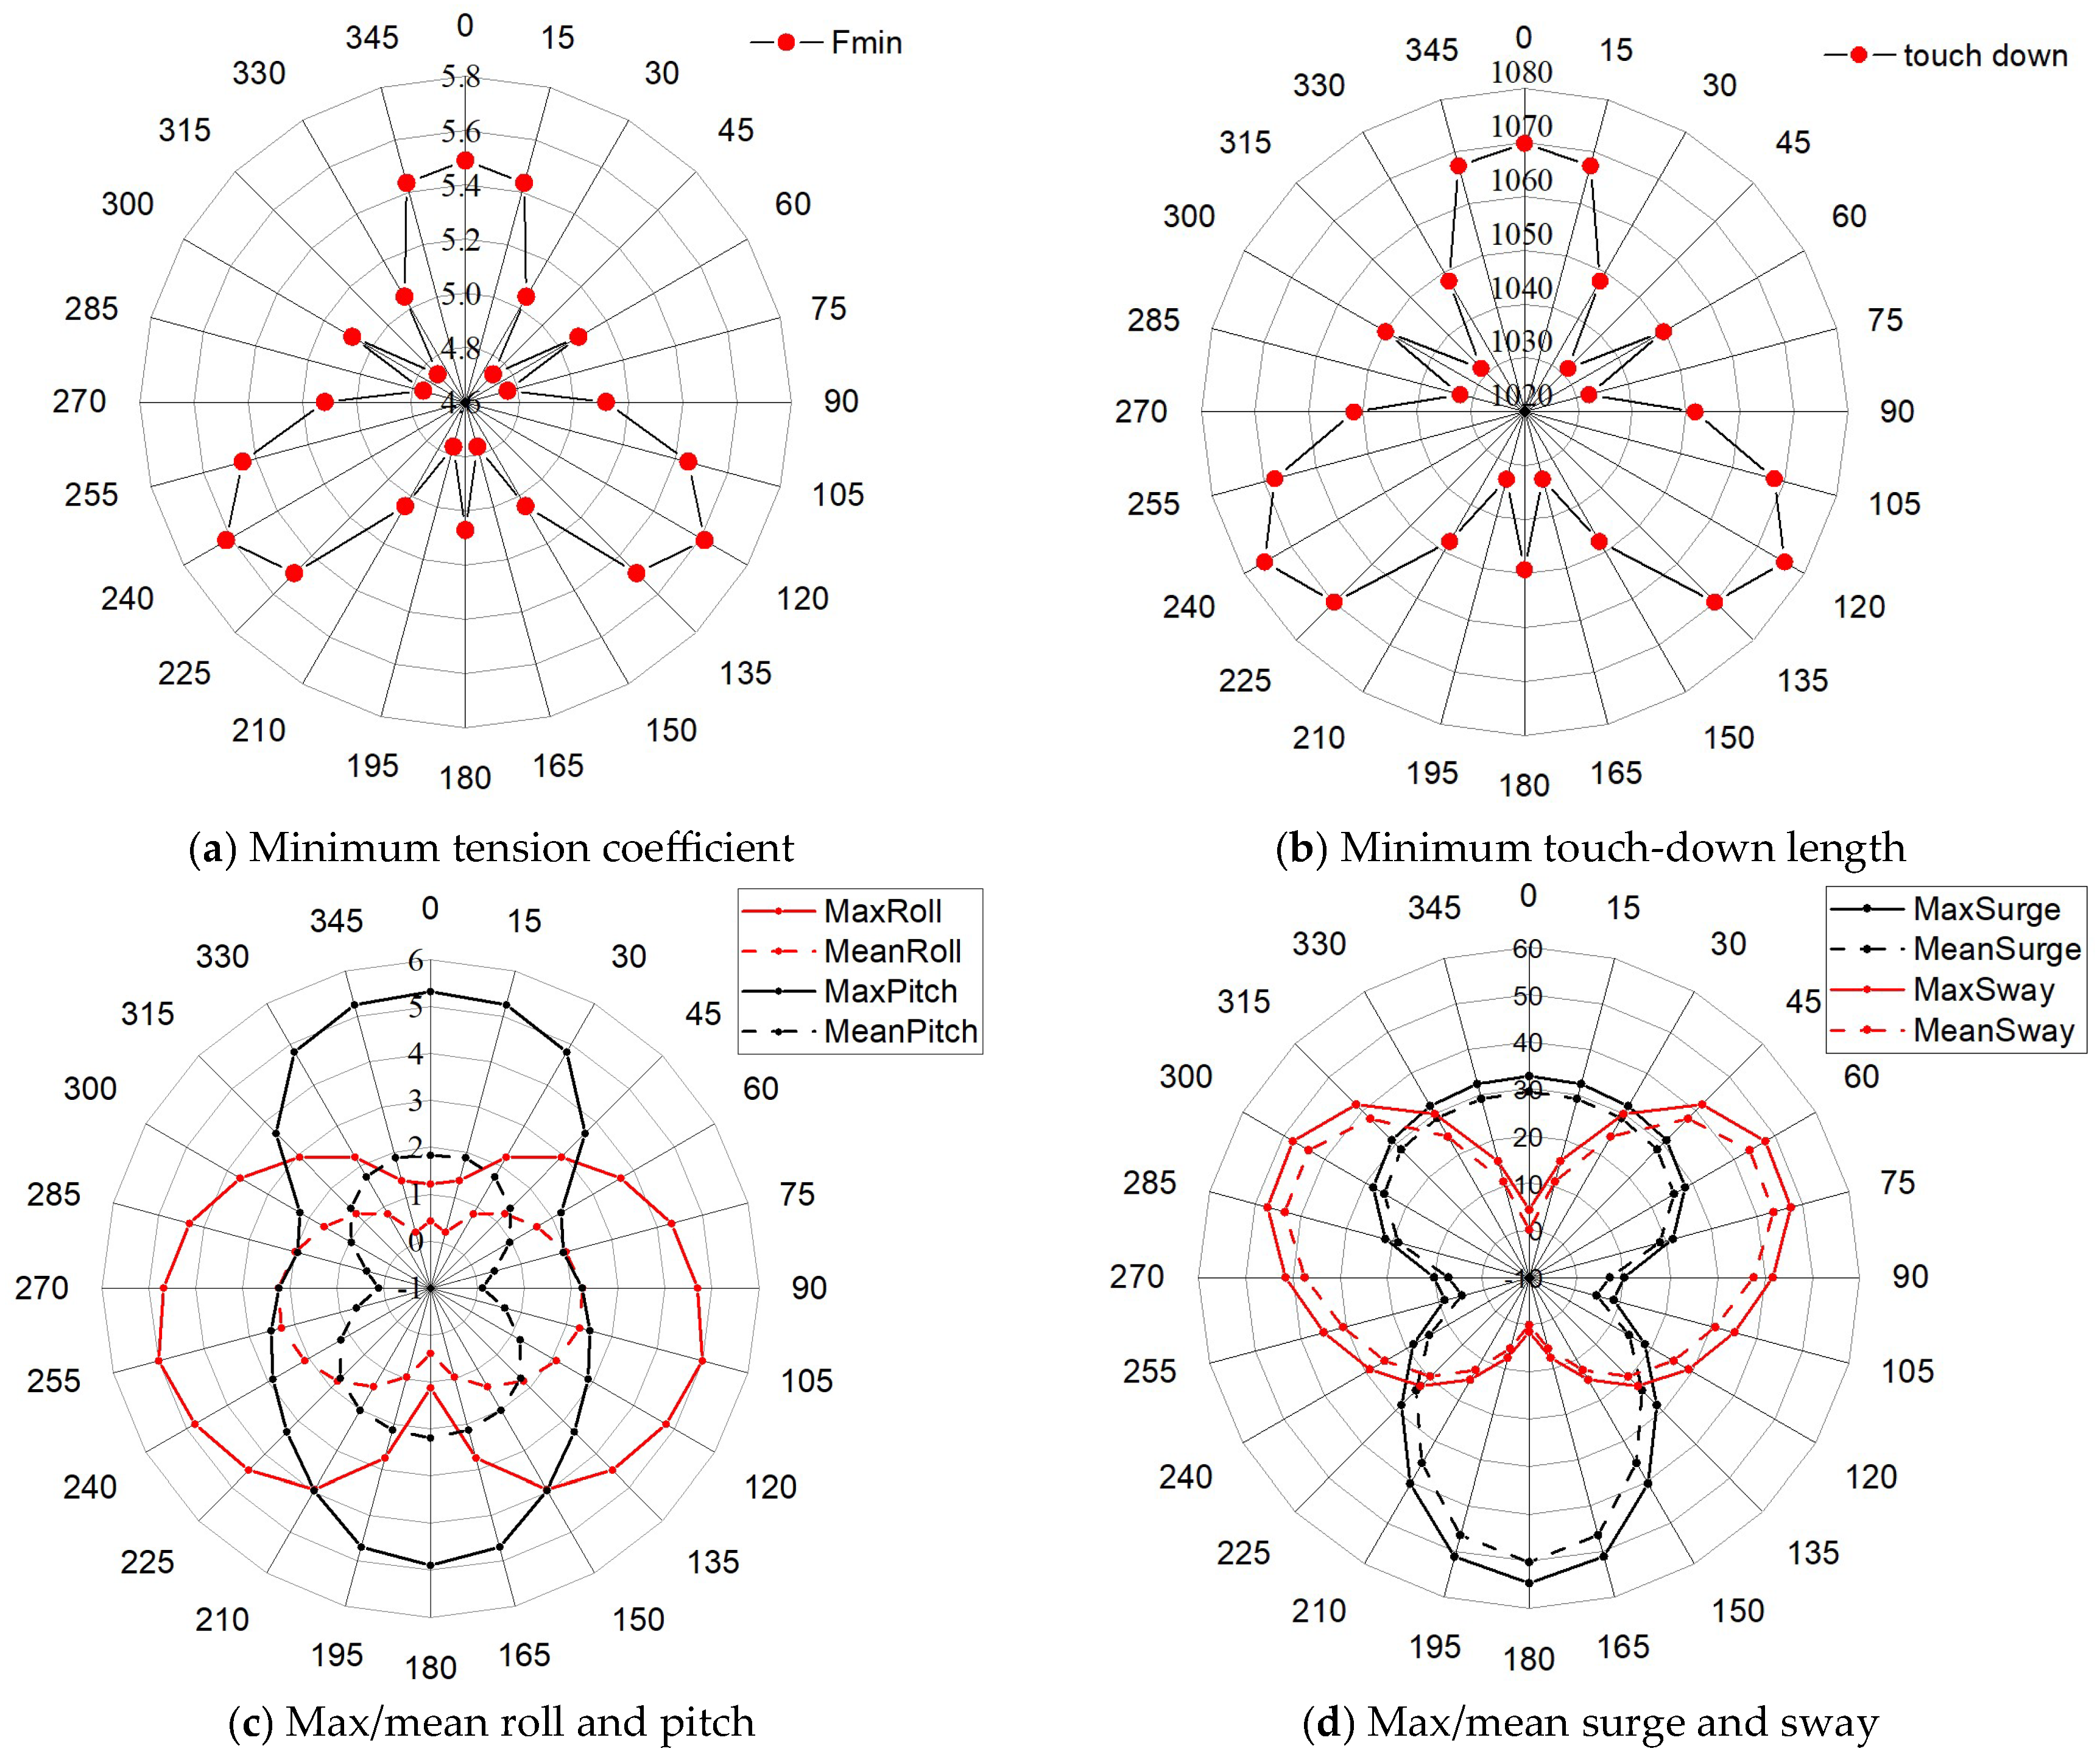
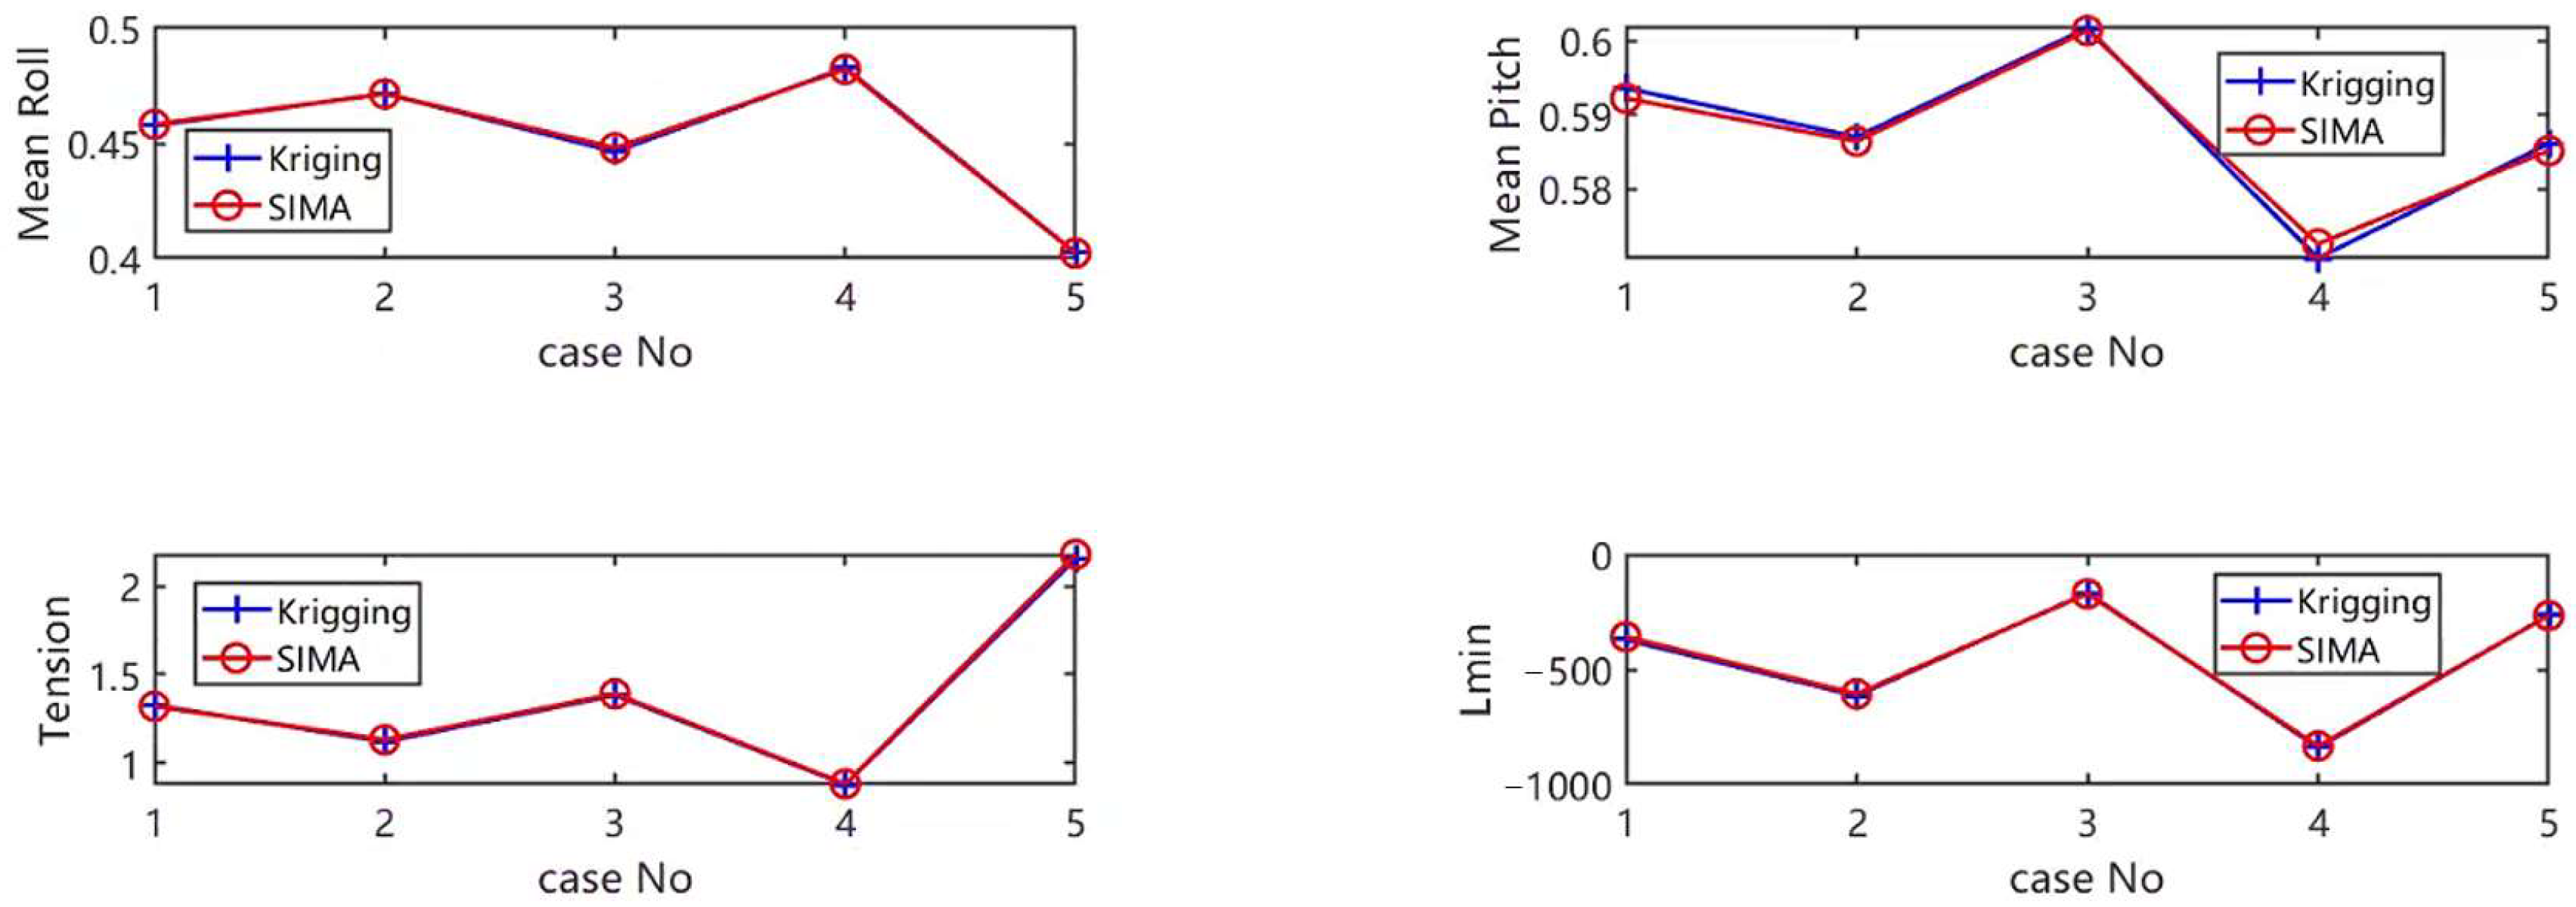
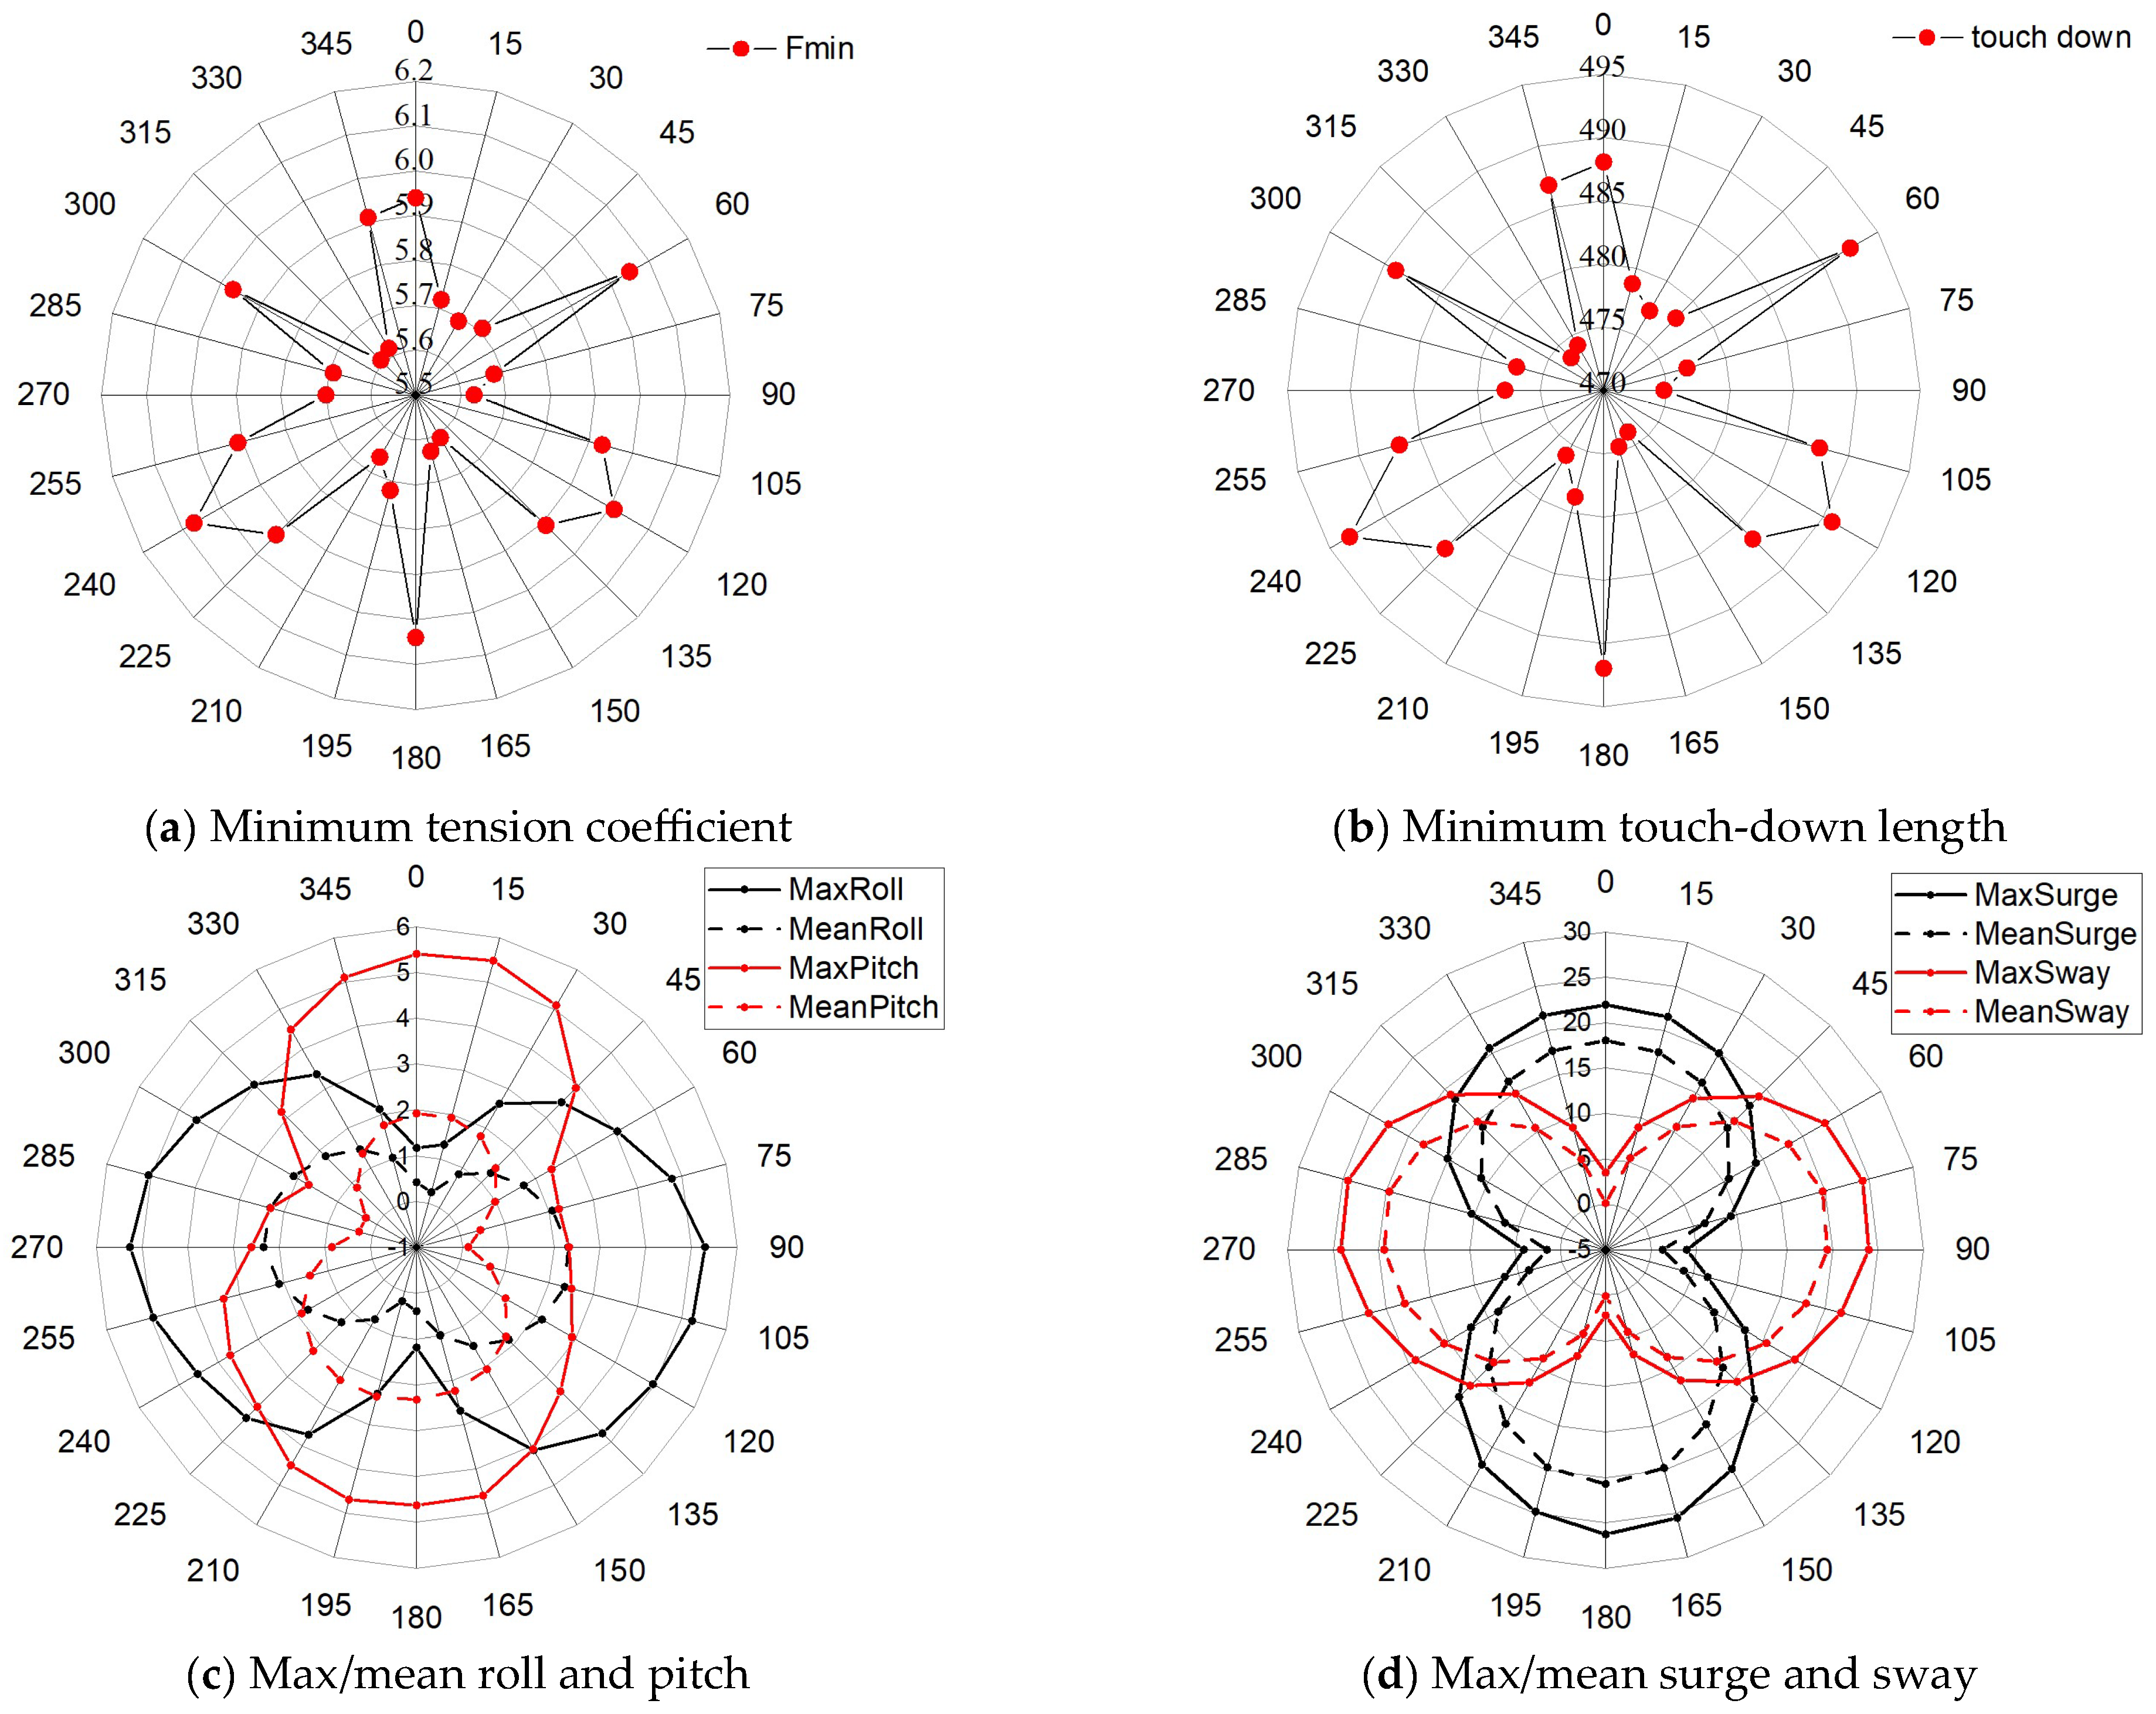
4.3. Optimization Results

Figure 12 illustrates the optimization iteration process of the Genetic Algorithm with a population size of 100 and a maximum of 300 iterations. As iterations proceed, the best and mean fitness values decrease. In the first 20 generations, the decrease is rapid, meaning that the algorithm quickly discards poorly performing individuals. After about 50 generations, the decrease slows, suggesting the algorithm is approaching an optimum. The best fitness stabilizes, and the algorithm converges by about generation 130. The best variable combination for algorithm optimization is x = (Dml, Aml, Lml, PTml) = (0.155, 15.8524, 855.7, 0.08).
Figure 13 and Figure 14 illustrate the iterative optimization process utilizing the Gradient method with multiple sub-plots showing the changes in various variables and the penalty function over iterations. The Dml and penalty function have a draw down and converge at a small range, while the Aml, Lml, and PTml almost keep the same during the iteration. The best variable combination for algorithm optimization is x = (Dml, Aml, Lml, PTml) = (0.1544, 15.8524, 855.7, 0.08).
The optimization results of the mooring configuration are verified by comparing with the SIMA results to check whether the corresponding constraints are satisfied. The SIMA results indicate that the length of the mooring line is slightly shorter in the extreme conditions; the maximum surge is still slightly greater than 30 m in the rated conditions. This difference might be caused by the interpolation error of the Kriging model. Since the pretension PTml was strongly correlated with the platform offset (as shown in Figure 9), the improved mooring configuration obtained after appropriately lengthening the mooring line and changing the pretension from 8% of the MBL to 9% can just meet all the constraint conditions in Table 6. The final optimization scheme is x = (Dml, Aml, Lml, PTml) = (0.1544, 15.8524, 895.7, 0.09).
Generally speaking, a smaller angle Aml can reduce the maximum mooring tension, which is more conducive to the objective function. However, the optimal angle Aml within the design space is approximately 15 degrees as a larger angle Aml is beneficial for meeting the requirements of the platform’s horizontal offset. Therefore, the objective function and the horizontal offset constraint have a principal contradiction relationship. Automatic optimization is of great significance for handling this kind of optimization problem with contradictory relationships better. More details about the results of the hydrodynamic characteristics and mooring tension are fully discussed in the next sections.

4.4. Hydrodynamic Characteristics of the Optimized Combined System

The combined system of the FOWT and WECs operate normally in the rated conditions, and the wind turbine can yaw autonomously with the wind direction. It can be seen from Figure 15 that the minimum safety coefficient of tension, the minimum touch-down length, the mean values of roll and pitch, and the peak values of surge and sway meet all the constraint conditions specified in Table 6. In Figure 15a,b, the distribution values of the minimum safety coefficient of tension and the minimum touch-down length are relatively scattered in all directions. The distribution characteristics show that the values are larger in some directions and smaller in other directions, indicating that the mooring system is highly sensitive to the direction of environmental action. When the environmental direction is consistent with the direction of the anchor chain, the mooring system has a higher safety coefficient and touch-down length. This finding can provide guidance for the mooring system to make the most favorable arrangement for the orientation according to the distribution characteristics of the marine environment.
As can be seen from Figure 15d, the average and maximum values of surge and sway in all directions, respectively, present an almost symmetrical “8” shape about the 90 and the 0 degrees directions. The average and maximum values of surge and sway are also within almost the same drift radius. For example, their maximum drift radii are all near 25 m. This indicates that the optimized mooring scheme makes the drift motion in all directions in the environment show good consistency, and there will be no situation similar to that in Figure 6d where the maximum surge in the 180 degrees direction is significantly greater than that in the 0 degrees direction. The roll and pitch in Figure 15c also have similar characteristics.
The floating wind turbine is shut down with its blades pitched to 90 degrees, and the WECs are locked at the free surface in the extreme conditions. It can be seen from Figure 16 that the minimum safety factor for the mooring line, the minimum touch-down length, as well as the average values of roll and pitch meet all the requirements of the constraint conditions specified in Table 6. From Figure 16a,b, it can be observed that the distribution values of the minimum safety coefficient and the minimum touch-down length of the mooring line are relatively scattered in all directions and lack symmetry. This indicates that, when the wind turbine is shut down, the mooring system is highly sensitive to the directions of forces and shows significant differences. With the restoring stiffness added to the combined system by the WECs, Figure 16c shows that the roll and pitch can still maintain relatively small average inclination angles in extreme conditions. However, the hydrodynamic force contributed by the WECs also leads to a significant increase in the maximum values of roll and pitch. It can be seen from Figure 16d that the sway is symmetrical and the maximum value of surge in the 180 degrees direction is greater than 50 m, which is more than 60% larger than the value in the 0 degrees direction.

4.5. Discussion of the Effects of the WECs on the Optimal Mooring System

Figure 17 shows the results for the most unfavorable directions of mooring tension for the combined system under extreme conditions in three cases: with WECs in locked mode at free surface, with WECs in released mode, and without the action of WECs.
(1)
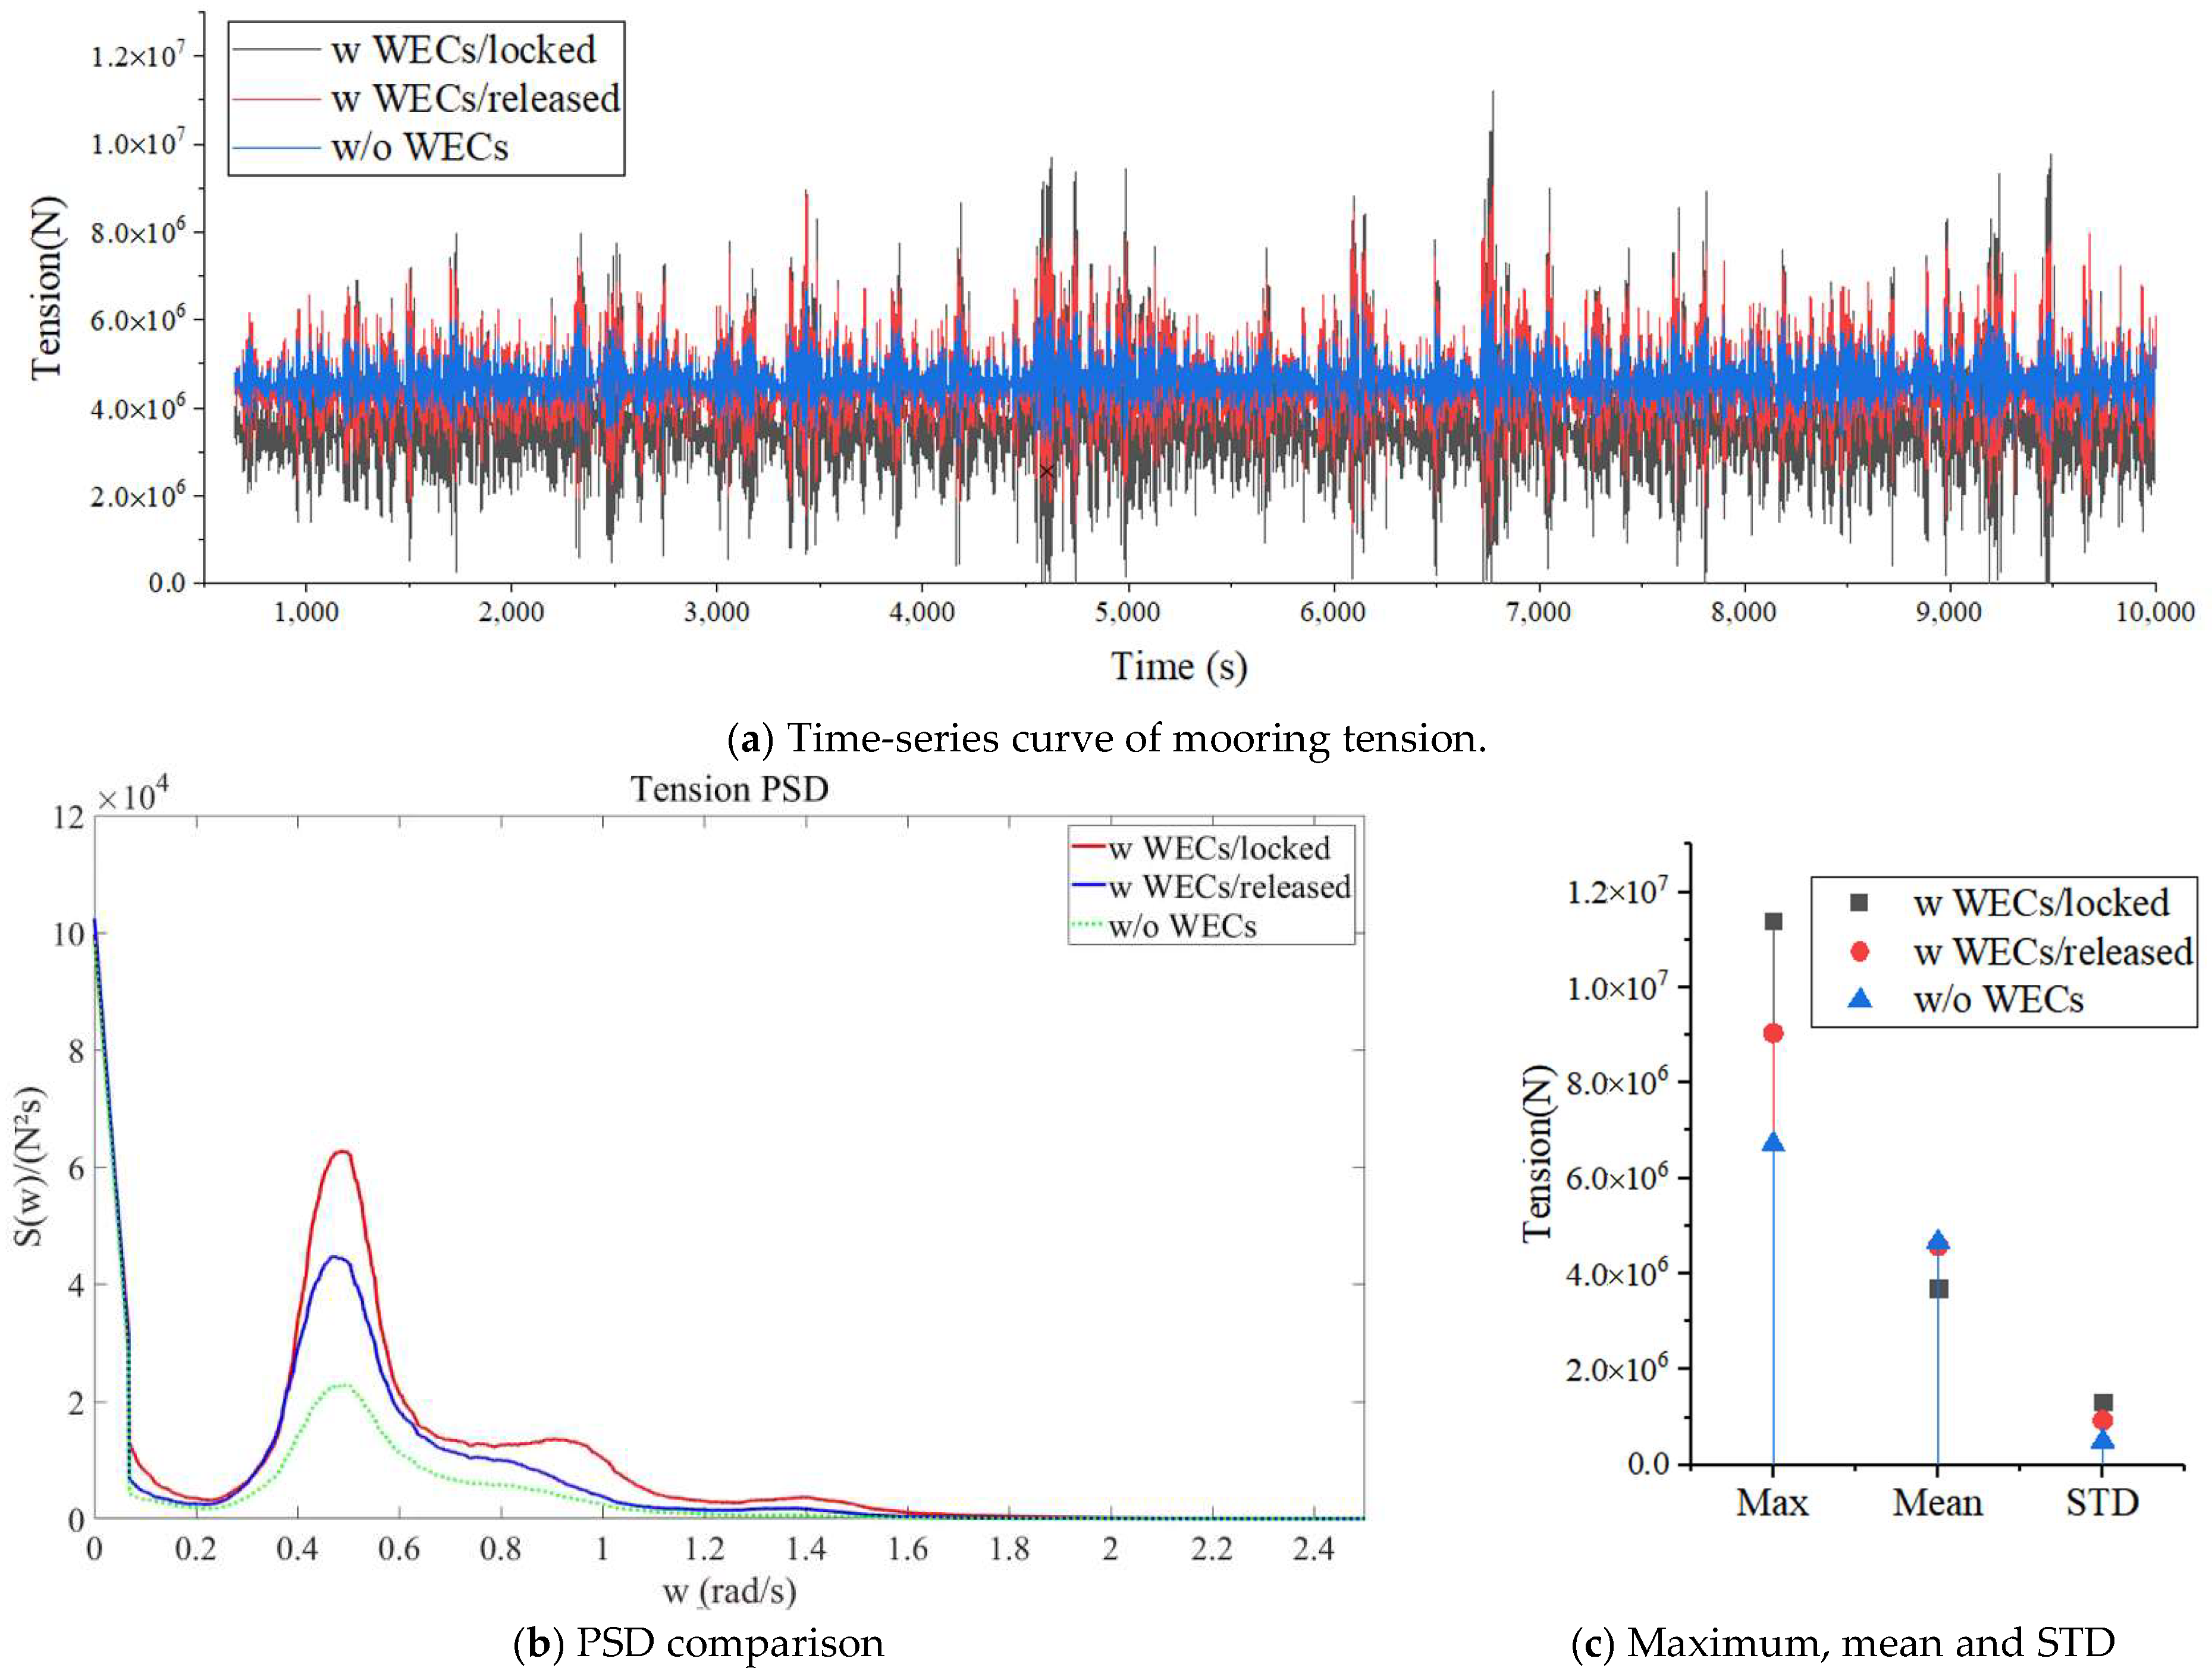
Time-series analysis
It can be found from Figure 17a that the average value of the tension response in the case with the WECs in locked mode is lower than that of the latter two cases. In this figure, the fluctuation amplitude of the black curve (without WECs) is relatively small, while the fluctuation amplitudes of the red and blue curves (with WECs) are larger. This indicates that the presence of WECs will result in a more intense variation in mooring tension.
(2)
Power spectral density (PSD) analysis
The PSD curves in Figure 17b acquired by means of Fourier-transforming can be employed to analyze the influence of WECs on the hydrodynamic force and mooring tension of the entire combined system. Within the wave-frequency range of 0.2–1.2 rad/s, the PSD curves for the cases with WECs (the red and blue ones) are noticeably higher than the black curve representing the situation without WECs. This indicates that WECs exert a significant influence on mooring tension within this wave-frequency range. Moreover, the tension spectral density for the case with WECs in locked mode is substantially higher than that for the case with WECs in released mode.
(3)
Statistical characteristics
Comparison of maximum values: the maximum values of the two cases with WECs (red and blue) are significantly higher than that of the case without WECs (black), indicating that the WECs will cause larger peaks in mooring tension.
Comparison of average values: there is no significant difference in the average values of mooring tension between the case with WECs in released mode and the case without WECs, and both are about 20% higher than that of the case with WECs in free-surface locked mode.
Comparison of standard deviations: the standard deviations of the two cases with WECs (red and blue) are larger, indicating that the dispersion degree of mooring tension is greater and the fluctuation is more intense when there are WECs. Among them, the standard deviation of mooring tension in the case with WECs in locked mode is the largest. This makes the maximum value of the case with WECs in locked mode larger than that of the case with WECs in released mode, with the former being about 25% larger than the latter (Similar results also appear in the STC system [9]). The relevant values of the cases with WECs are both larger than those of the case without WECs. Compared with the case without WECs, the maximum values of the cases with WECs in locked mode and released mode increase by about 69% and 35%, respectively.
In summary, whether in terms of time-series, PSD, or statistical characteristics, the changes in mooring tension are more intense and complex when WECs exist compared with when there are no WECs. The influence of WECs in different modes on mooring tension is different. The factors mentioned above need to be fully considered in the design and analysis of mooring systems. For example, the presence of WECs can lead to elevated maximum tensions and more significant tension variations in the mooring chains. Additionally, higher spectral density within specific wave-frequency ranges implies a greater number of stress cycles and higher stress levels. All these factors may increase the fatigue and failure risks of the chains.
Figure 18 presents the results of the most unfavorable directions of mooring tension for the combined system under the rated conditions in two cases: with WECs in released mode and without WECs. In Figure 18a, the dynamic changes in mooring tension over time for these two cases can be witnessed. The difference in their average values is not significant, but the fluctuation amplitude of the red curve (with WECs in released mode) is relatively larger, while the fluctuation amplitude of the black curve (without WECs) is smaller, indicating that the existence of WECs will lead to more intense changes in mooring tension. Since the sea state under rated conditions is better than that under extreme conditions, the peaks of the tension spectral density curves of the two cases in Figure 18b are significantly lower compared with those in Figure 17b, which can be verified by the mooring tension statistical values in Figure 18c. The average value of mooring tension with WECs in released mode is slightly larger than that without WECs, and the maximum mooring tension increases by about 9.5%. Compared with the 35% increase under the extreme conditions, this indicates that as the severity of the sea state grows, the influence of WECs on the entire mooring system also tends to increase.

5. Conclusions

This research develops a fully coupled numerical model of aero-hydro-elastic-servo-mooring for the purpose of evaluating the mooring line and motion dynamics of a novel combined system, which consists of a 15 MW semi-submersible FOWT along with four torus-type WECs. Moreover, a practical optimization framework is put forward to design and optimize the mooring system of this combined system. The optimization program is implemented through a self-written Matlab code, which incorporates the LHS method for generating samples, the Kriging model for constructing a surrogate model, and the combined optimization techniques of the Genetic Algorithm and the Gradient Algorithm to search for the optimal solution.
With the numerical coupled model of the combined system and the optimization program, the optimal solution of the proposed 3 × 3 spread mooring configuration is efficiently obtained with the objective of minimizing the total steel mass of the mooring lines while adhering to the strict constraints regarding mooring tension and motions. Moreover, it was discovered that the optimal angle Aml reveals the contradictory relationship between the objective and horizontal offset. The proposed optimization framework can effectively balances this relationship between the objectives and constraints and finds the optimal solution. This framework can be further extended to handle more complex optimization problems.
Subsequently, the hydrodynamic characteristics of the combined system and the impacts of the WECs on the mooring system are discussed under both rated and extreme conditions. The relevant key conclusions are summarized as follows:
(1)
The maximum value for the case with WECs in locked mode is about 25% larger than that for the case with WECs in released mode in the extreme conditions. This demonstrates that the influence of WECs in different modes on mooring tension is different, and these factors need to be fully considered in the design and analysis of mooring systems.
(2)
Within the wave-frequency range of 0.2–1.2 rad/s, the PSD of the mooring tension for the cases with WECs is significantly higher than that of the case without WECs, meaning that WECs have a prominent influence on mooring tension in the wave frequency range.
(3)
Whether in terms of time-series, PSD, or statistical characteristics, the changes in mooring tension are more intense and complex when WECs exist compared with when there are no WECs. Compared with the case without WECs, the maximum values of the cases with WECs in locked mode and released mode increase by about 69% and 35% under the extreme conditions, respectively.
(4)
The maximum mooring tension of the case with WECs in released mode increases by about 9.5% when it is compared to that of the case without WECs under rated conditions. When compared with the 35% increase observed under the extreme conditions, it indicates that, as the severity of the sea state rises, the influence of WECs on the entire mooring system also tends to grow.

Author Contributions

Conceptualization, Y.Y., K.W., S.L., W.C., X.G. and T.T.; methodology, H.W.; software, H.W.; validation, S.L. and W.C.; formal analysis, T.T.; investigation, X.G.; resources, K.W.; data curation, H.W.; writing—original draft preparation, Y.Y. and H.W.; writing—review and editing, Y.Y., S.L., W.C., X.G., T.T., K.W. and H.W.; visualization, H.W.; supervision, K.W.; project administration, K.W.; funding acquisition, Y.Y. All authors have read and agreed to the published version of the manuscript.

Funding

This research was funded by Key Technology Research and Demonstration Project of 10 MW Deep-Sea Floating Offshore Wind Turbines (grant number DTGD-2023-10174)—Key Technology Research Task of Floating Offshore Combined Wind and Wave Power Generation; Guangdong Basic and Applied Basic Research Foundation, China, grant number 2022B1515250005; National Natural Science Foundation of China, grant number 52171289.

Institutional Review Board Statement

Not applicable.

Informed Consent Statement

Not applicable.

Data Availability Statement

Request to corresponding author of this article.

Acknowledgments

Sincere gratitude is extended to the Funding Agencies for providing financial support for this research.

Conflicts of Interest

Author Y.Y., S.L., W.C., X.G. and T.T. are employed by the company China Southern Power Grid Technology Co., Ltd. & National Institute of Guangdong Advanced Energy Storage Co., Ltd. The remaining authors declare that the research was conducted in the absence of any commercial or financial relationships that could be construed as a potential conflict of interest.

References

  1. Hall, M.; Kölle, K.; Lozon, E.; Lee, C.F.; McAuliffe, F.D.; Lekkala, M.R.; Bessone, M.B.; Liang, G.; Bayati, I.; Mahfouz, M.Y.; et al. The IEA Wind Task 49 Reference Floating Wind Array Design Basis; NREL/TP-5000-89709; U.S. Department of Energy Office of Scientific and Technical Information: Way Oak Ridge, TN, USA, 2024. [CrossRef]
  2. French, M.J. On the difficulty of inventing an economical sea wave energy converter: A personal view. Proc. Inst. Mech. Eng. Part M J. Eng. Marit. Environ. 2006, 220, 149–155. [Google Scholar] [CrossRef]
  3. Lee, C.F.; Tryfonidis, C.; Ong, M.C. Power performance and response analysis of a semi-submersible wind turbine combined with flap-type and torus wave energy converters. J. Offshore Mech. Arct. Eng. 2023, 145, e102412. [Google Scholar] [CrossRef]
  4. Hu, J.; Zhou, B.; Vogel, C.; Liu, P.; Willden, R.; Sun, K.; Zang, J.; Geng, J.; Jin, P.; Cui, L.; et al. Optimal design and performance analysis of a hybrid system combining a floating wind platform and wave energy converters. Appl. Energy 2020, 269, e114998. [Google Scholar] [CrossRef]
  5. Sun, K.; Yi, Y.; Zheng, X.; Cui, L.; Zhao, C.; Liu, M.; Rao, X. Experimental investigation of semisubmersible platform combined with point-absorber array. Energy Convers. Manag. 2021, 245, e114623. [Google Scholar] [CrossRef]
  6. Aubault, A.; Alves, M.; Sarmento, A.; Roddier, D.; Peiffer, A. Modeling of an oscillating water column on the floating foundation Windfloat. In Proceedings of the ASME 2011 30th International Conference on Ocean, Offshore and Arctic Engineering, Rotterdam, The Netherlands, 19–24 June 2011; pp. 235–246. [Google Scholar] [CrossRef]
  7. Peiffer, A.; Roddier, D. Design of an oscillating wave surge converter on the WindFloat* structure. In Proceedings of the 4th International Conference on Ocean Energy, Dublin, Ireland, 17 October 2012. [Google Scholar]
  8. Michailides, C.; Gao, Z.; Moan, T. Experimental study of the functionality of a semisubmersible wind turbine combined with flap-type wave energy converters. Renew. Energy 2016, 93, 675–690. [Google Scholar] [CrossRef]
  9. Muliawan, M.J.; Karimirad, M.; Moan, T. STC (Spar-Torus Combination): A combined spar-type floating wind turbine and large point absorber floating wave energy converter—Promising and challenging. In Proceedings of the 31st International Conference on Ocean, Offshore and Arctic Engineering, Rio de Janeiro, Brazil, 17–22 June 2012. [Google Scholar]
  10. Zhou, B.; Hu, J.; Jin, P.; Sun, K.; Li, Y.; Ning, D. Power performance and motion response of a floating wind platform and multiple heaving wave energy converters hybrid system. Energy 2023, 265, e126314. [Google Scholar] [CrossRef]
  11. Astariz, S.; Iglesias, G. Selecting optimum locations for co-located wave and wind energy farms. Part I: The Co-Location Feasibility index. Energy Convers. Manag. 2016, 122, 589–598. [Google Scholar] [CrossRef]
  12. Jin, P.; Zheng, Z.; Zhou, Z.; Zhou, B.; Wang, L.; Yang, Y.; Liu, Y. Optimization and evaluation of a semi-submersible wind turbine and oscillating body wave energy converters hybrid system. Energy 2023, 282, e126314. [Google Scholar] [CrossRef]
  13. Cao, F.; Yu, M.; Liu, B.; Wei, Z.; Xue, L.; Han, M.; Shi, H. Progress of combined wind and wave energy harvesting devices and related coupling simulation techniques. J. Mar. Sci. Eng. 2023, 11, 212. [Google Scholar] [CrossRef]
  14. Zhang, H.J.; Zhang, N.C.; Cao, X.Y. Conceptualization and dynamic response of an integrated system with a semi-submersible floating wind turbine and two types of wave energy converters. Ocean Eng. 2023, 269, e109031. [Google Scholar] [CrossRef]
  15. Shi, Y.F.; Lin, J.H.; Zhuge, Z.X.; Zheng, R.Y.; Zhang, J. Conceptual design and dynamic analysis of a wind-wave energy converter with a mass-adjustable buoy. J. Mar. Sci. Eng. 2024, 12, 679. [Google Scholar] [CrossRef]
  16. Yang, B.; Li, Y.; Zhang, H.; Wang, L. EMCO-Based Optimal Layout Design of Hybrid Wind-Wave Energy Converters Array. Prot. Control Mod. Power Syst. 2024, 9, 142–161. [Google Scholar] [CrossRef]
  17. Wang, K.; Li, Y.; Zhang, H.; Wang, L. Extreme responses of an integrated system with a semi-submersible wind turbine and four torus-shaped wave energy converters in different survival modes. China Ocean Eng. 2024, 38, 877–892. [Google Scholar] [CrossRef]
  18. Definition of the IEA 15-Megawatt Offshore Reference Wind Turbine. Available online: https://www.nrel.gov/docs/fy20osti/75698.pdf (accessed on 2 May 2020).
  19. Allen, C.K.; Viscelli, A.; Dagher, H.J.; Goupee, A.J.; Gaertner, E.; Abbas, N.J.; Hall, M.; Barter, G.E. Definition of the UMaine VolturnUS-S reference platform developed for the IEA wind 15-Megawatt offshore reference wind turbine. J. Offshore Mech. Arct. Eng. 2020, 142, 041702. [Google Scholar] [CrossRef]
  20. Muskulus, M.; Schafhirt, S. Design optimization of wind turbine support structures—A review. J. Ocean Wind Energy 2014, 1, 12–22. [Google Scholar]
  21. OES. Task 7: Cost of Energy Assessment for Wave, Tidal and OTEC at an International Level. Ocean Energy Systems. 2015. Available online: https://report2015.ocean-energy-systems.org/main-achievements-in-2015/task-7-cost-of-energy-assessment-for-wave-tidal-and-otec/ (accessed on 10 November 2024).
  22. Butterfield, S.; Musial, W.; Jonkman, J.; Sclavounos, P. Engineering challenges for floating offshore wind turbines. In National Renewable Energy Laboratory (NREL), Proceedings of the 2005 Copenhagen Offshore Wind Conference, Copenhagen, Denmark, 26–28 October 2005; Midwest Research Institute: Golden, CO, USA, 2005. Available online: https://www.osti.gov/biblio/917212 (accessed on 10 November 2024).
  23. Ja’e, I.A.; Ali, M.O.A.; Yenduri, A.; Nizamani, Z.; Nakayama, A. Optimisation of mooring line parameters for offshore floating structures: A review paper. Ocean Eng. 2022, 247, 110644. [Google Scholar] [CrossRef]
  24. Schnepf, A.; Giljarhus, K.E.T.; Johnsen, Ø.; Lopez-Pavon, C. Dynamic power cable configuration design for floating offshore wind turbines using gradient-based optimization. In Proceedings of the ASME 2023 42nd International Conference on Ocean, Offshore and Arctic Engineering (OMAE2023), Boston, MA, USA, 25 June 2023. [Google Scholar] [CrossRef]
  25. Jiang, Y.C.; Duan, Y.; Li, J.; Chen, M.; Zhang, X. Optimization of mooring systems for a 10MW semisubmersible offshore wind turbines based on neural network. Ocean Eng. 2024, 296, 107335. [Google Scholar] [CrossRef]
  26. Meduri, A.; Kang, H. Synergistic integration of multiple wave energy converters with adaptive resonance and offshore floating wind turbines through Bayesian optimization. J. Mar. Sci. Eng. 2024, 12, 678. [Google Scholar] [CrossRef]
  27. Benassai, G.; Campanile, A.; Piscopo, V.; Scamardella, A. Optimization of mooring systems for floating offshore wind turbines. Coastal Eng. J. 2015, 57, 1550021. [Google Scholar] [CrossRef]
  28. Li, L.; Jiang, Z.; Ong, M.C.; Hu, W. Design optimization of mooring system: An application to a vessel-shaped offshore fish farm. Eng. Struct. 2019, 197, 109363. [Google Scholar] [CrossRef]
  29. Zhou, Y.; Yan, C.; Shi, W.; Han, X.; Jiang, Z.; Michailides, C. A surrogate optimization modeling method for floating wind turbine mooring line design. In Proceedings of the 34th International Ocean and Polar Engineering Conference (ISOPE), Rhodes, Greece, 15–20 June 2024. [Google Scholar]
  30. Cressie, N. Spatial prediction and ordinary kriging. Math. Geol. 1988, 20, 405–421. [Google Scholar] [CrossRef]
  31. Kleijnen, J.P. Kriging metamodeling in simulation: A review. Eur. J. Oper. Res. 2009, 192, 707–716. [Google Scholar] [CrossRef]
  32. De Pina, A.A.; da Fonseca Monteiro, B.; Albrecht, C.H.; de Lima, B.S.L.P.; Jacob, B.P. Artificial Neural Networks for the analysis of spread mooring configurations for floating production systems. Appl. Ocean Res. 2016, 59, 254–264. [Google Scholar] [CrossRef]
  33. Trubat, P.; Herrera, A.; Molins, C. Mooring optimization using ML techniques. In Proceedings of the 4th International Offshore Wind Technical Conference (IOWTC2022), Boston, MA, USA, 27–30 June 2022. [Google Scholar]
  34. Yu, Y.; Zhao, M.; Li, Z.; Zhang, B.; Pang, H.; Xu, L. Optimal design of asymmetrically arranged moorings in a floating production system based on improved particle swarm optimization and RBF surrogate model. Mar. Struct. 2024, 94, 103576. [Google Scholar] [CrossRef]
  35. Kennedy, J.; Eberhart, R. Particle swarm optimization. In Proceedings of the ICNN’95 International Conference on Neural Networks, Perth, Australia, 27 November–1 December 1995. [Google Scholar] [CrossRef]
  36. Holland, J.H. Adaptation in natural and artificial systems. Artif. Intell. 1976, 7, 1–24. [Google Scholar]
  37. Geem, Z.W.; Kim, J.H.; Loganathan, G.V. A new heuristic optimization algorithm: Harmony search. Simulation 2001, 76, 60–68. [Google Scholar] [CrossRef]
  38. Dou, S.; Pegalajar-Jurado, A.; Wang, S.; Bredmose, H.; Stolpe, M. Optimization of floating wind turbine support structures using frequency-domain analysis and analytical gradients. J. Phys. Conf. Ser. 2020, 1618, 042028. [Google Scholar] [CrossRef]
  39. Ma, Y.; Gao, X.; Liu, C.; Li, J. Improved SQP and SLSQP algorithms for feasible path-based process optimization. Comput. Chem. Eng. 2024, 188, 108751. [Google Scholar] [CrossRef]
  40. Chen, M.; Xiao, P.; Zhou, H.; Li, C.B.; Zhang, X. Fully Coupled Analysis of an Integrated Floating Wind-Wave Power Generation Platform in Operational Sea-States. Front. Energy Res. 2022, 10, 931057. [Google Scholar] [CrossRef]
  41. Zhang, X.; Li, B.; Hu, Z.; Deng, J.; Xiao, P.; Chen, M. Research on Size Optimization of Wave Energy Converters Based on a Floating Wind-Wave Combined Power Generation Platform. Energies 2022, 15, 8681. [Google Scholar] [CrossRef]
  42. Chen, M.; Deng, J.; Yang, Y.; Zhou, H.; Tao, T.; Liu, S.; Sun, L.; Lin, H. Performance Analysis of a Floating Wind-Wave Power Generation Platform Based on the Frequency Domain Model. J. Mar. Sci. Eng. 2024, 12, 0206. [Google Scholar] [CrossRef]
  43. Jiang, W.; Liang, C.; Tao, T.; Yang, Y.; Liu, S.; Deng, J.; Chen, M. Fully Coupled Analysis of a 10MW Floating Wind Turbine Integrated with Multiple Wave Energy Converters for Joint Wind and Wave Utilization. Sustainability 2024, 16, 9172. [Google Scholar] [CrossRef]
  44. Gu, X.; Lin, F.; Jiang, W.; Xu, J. Power performance and dynamic characteristics of a 15 MW floating wind turbine with wave energy converter combined concept. Sustain. Horiz. 2025, 13, 100125. [Google Scholar] [CrossRef]
  45. Muliawan, M.J.; Gao, Z.; Moan, T.; Babarit, A. Analysis of a two-body floating wave energy converter with particular focus on the effects of power take-off and mooring systems on energy capture. In Proceedings of the ASME 2011 30th International Conference on Ocean, Offshore and Arctic Engineering, Rotterdam, The Netherlands, 19–24 June 2011. [Google Scholar] [CrossRef]
  46. Chen, M.; Huang, W.; Liu, H.; Hallak, T.S.; Liu, S.; Yang, Y.; Tao, T.; Jiang, Y. A Novel SPM Wind-Wave-Aquaculture System: Concept Design and Fully Coupled Dynamic Analysis. Ocean Eng. 2025, 315, 119798. [Google Scholar] [CrossRef]
  47. Chen, M.; Yun, Q.; Hallak, T.S.; Zhou, H.; Zhang, K.; Yang, Y.; Tao, T.; Liu, S.; Jiang, W.; Li, C. Comparative Study on the Performances of a Hinged Flap-Type Wave Energy Converter Considering Both Fixed and Floating Bases. J. Mar. Sci. Eng. 2024, 12, 1416. [Google Scholar] [CrossRef]
  48. Position Mooring: DNVGL-OS-E301. Available online: https://www.document-center.com/standards/show/DNV-OS-E301 (accessed on 1 July 2021).
  49. Benifla, V.; Adam, F. Development of a genetic algorithm code for the design of cylindrical buoyancy bodies for floating offshore wind turbine substructures. Energies 2022, 15, 1181. [Google Scholar] [CrossRef]
  50. Wen, X.; Yin, G.; Liu, T.; Ong, M.C.; Wang, C.; Wang, K. An Optimization Framework for Mooring Design of Floating Offshore Wind Turbines Using a Genetic Algorithm based on a Surrogate Model. Renew. Energy 2025, 245, 122807. [Google Scholar] [CrossRef]
Figure 1. Schematic of the combined system of the 15 MW FOWT and WECs.
Jmse 13 00545 g001
Figure 2. Diagram of the mechanical constraints between WEC and platform column [44].
Jmse 13 00545 g002
Figure 3. Illustrations of mooring lines for the combined system and the studless chain.
Jmse 13 00545 g003
Figure 4. Workflow of the present optimization procedure.
Jmse 13 00545 g004
Figure 5. (a) Minimum tension coefficient; (b) minimum touch-down length; as well as (c), the max/mean roll and pitch in different directions due to the turbulent wind, irregular waves, and steady current in the extreme conditions.
Jmse 13 00545 g005
Figure 6. (a) Minimum tension coefficient; (b) minimum touch-down length; (c) max/mean roll and pitch; as well as (d), the max/mean surge and sway in different directions due to the turbulent wind, irregular waves, and steady current in the rated conditions.
Jmse 13 00545 g006
Figure 7. The extreme (Left) and rated (Right) conditions with the most unfavorable direction.
Jmse 13 00545 g007
Figure 8. Minimum tension coefficient of the 500 samples in the extreme conditions.
Jmse 13 00545 g008
Figure 9. Maximum surge of the 500 samples in the rated conditions.
Jmse 13 00545 g009aJmse 13 00545 g009b
Figure 10. Verification of the Kriging model in the extreme conditions.
Jmse 13 00545 g010
Figure 11. Verification of the Kriging model in the rated conditions.
Jmse 13 00545 g011
Figure 12. The iteration of the Genetic Algorithm.
Jmse 13 00545 g012
Figure 13. The iteration of the four variables.
Jmse 13 00545 g013
Figure 14. The iteration of the penalty function.
Jmse 13 00545 g014
Figure 15. (a) Minimum tension coefficient; (b) minimum touch-down length; (c) max/mean roll and pitch; as well as (d), the max/mean surge and sway in different directions due to the turbulent wind, irregular waves, and steady current in the rated conditions.
Jmse 13 00545 g015
Figure 16. (a) Minimum tension coefficient; (b) minimum touch-down length; (c) max/mean roll and pitch; as well as (d), the max/mean surge and sway in different directions due to the turbulent wind, irregular waves, and steady current in the extreme conditions.
Jmse 13 00545 g016
Figure 17. Comparison of the most unfavorable directions of mooring tension among the three cases: with WECs/locked mode at the free surface, with WECs/released mode, and without the action of WECs in the extreme conditions.
Jmse 13 00545 g017
Figure 18. Comparison of the most unfavorable directions of mooring tension among the three cases: with WECs/locked mode at the free surface, with WECs/released mode, and without the action of WECs in the rated conditions.
Jmse 13 00545 g018
Table 1. Principal Parameters of the UMaine VolturnUS-S and IEA-15-240-RWT.
ModuleParameterValueUnit
UMaine VolturnUS-SDisplacement20,206[m3]
Draft20[m]
Vertical gravity center relative to SWL−14.94[m]
Vertical buoyancy center relative to SWL−13.63[m]
Water depth200[m]
IEA-15-240-RWTRated power15[MW]
Cut-in, rated, and cut-out wind speed3, 10.59, 25[m/s]
Rated rotor speed7.55[rpm]
Blade length120[m]
Hub height relative to SWL150[m]
Tower length129.5[m]
Table 2. Principal Parameters of the torus-shape WECs.
ParameterValueUnit
Torus 0The Rest of Torus
Outer and inner diameter at SWL24/1226/14[m]
Mass Displacement4.7956 × 1055.1145 × 105[t]
Height88[m]
Draft22[m]
Vertical gravity center relative to SWL−0.9−0.9[m]
Stroke length66[m]
End stop spring stiffness of upper and lower ends1 × 1061 × 106[kN/m]
Linear damping coefficient of PTO10,00010,000[KN·s/m]
Linear stiffness coefficient of PTO1010[kN/m]
Table 3. Specifications of environmental conditions of the combined system.
ConditionSignificant Waves HeightPeak PeriodCurrent SpeedMean Wind Speed at Hub
Rated conditions6.6 m11.6 s1.33 m/s10.59 m/s
Extreme conditions11.7 m13.3 s2.40 m/s51.2 m/s
Table 4. Drag and Added Mass Coefficients of the Mooring Line.
Mooring Line CoefficientsValue Related to the Nominal Chain Diameter
Normal and tangential Drag2.40/1.15
Normal and Tangential Added Mass1.00/1.00
Table 5. Design variables and bounds.
Design VariableInitial ValueLower BoundUpper BoundUnit
Azimuth angle Aml5516deg
Diameter Dml0.1470.080.17m
Length Lml15005001000m
Pretension coefficient PTml8%8%25%MBL
Table 6. Constraint related to the combined system’s motions and the mooring line system.
No.ConstraintDescription
The combined system’s motions1q1 < 25 m, q2 < 25 mKeep the system’s peak surge-sway offset under 25 m in the rated conditions to limit design constraints on a dynamic electrical umbilical [19].
2q4 < 4 deg, q5 < 4 degThe mean roll and pitch value at tower top in the time series are less than 4 deg in the rated conditions.
3q4 < 5 deg, q5 < 5 degThe mean roll and pitch value at tower top in the time series are less than 5 deg in the extreme conditions.
Mooring line system5F = Fbreakstrenth/Tmax > 1.67The safety coefficient of tension larger than 1.67 in the extreme conditions.
6F= Floadstrenth/Tmax > 1.67The safety coefficient of tension larger than 1.67 in the rated conditions.
7Lmin = LmlFVfmax/w ≥ 100 mThe minimum touch-down length larger than 100 m in the rated conditions.
8FVamax < GanchorThe vertical force at the anchor less than the anchor gravity force in the extreme conditions.
Where Tmax is the maximum tension of the mooring line, FVfmax is the maximum vertical mooring force at the fairlead, FVamax is the maximum vertical mooring force at the anchor, and Ganchor is the gravity force of the anchor. The constraint of FVamax < Ganchor in this study is replaced with a stricter constraint of Lmin > 0.
Disclaimer/Publisher’s Note: The statements, opinions and data contained in all publications are solely those of the individual author(s) and contributor(s) and not of MDPI and/or the editor(s). MDPI and/or the editor(s) disclaim responsibility for any injury to people or property resulting from any ideas, methods, instructions or products referred to in the content.

