
Quantitative Analysis of Bound Water Content in Marine Clay and Its Influencing Factors During the Freezing Process by Nuclear Magnetic Resonance

 ,
, 
Abstract
1. Introduction
2. Materials and Methods
2.1. NMR Method
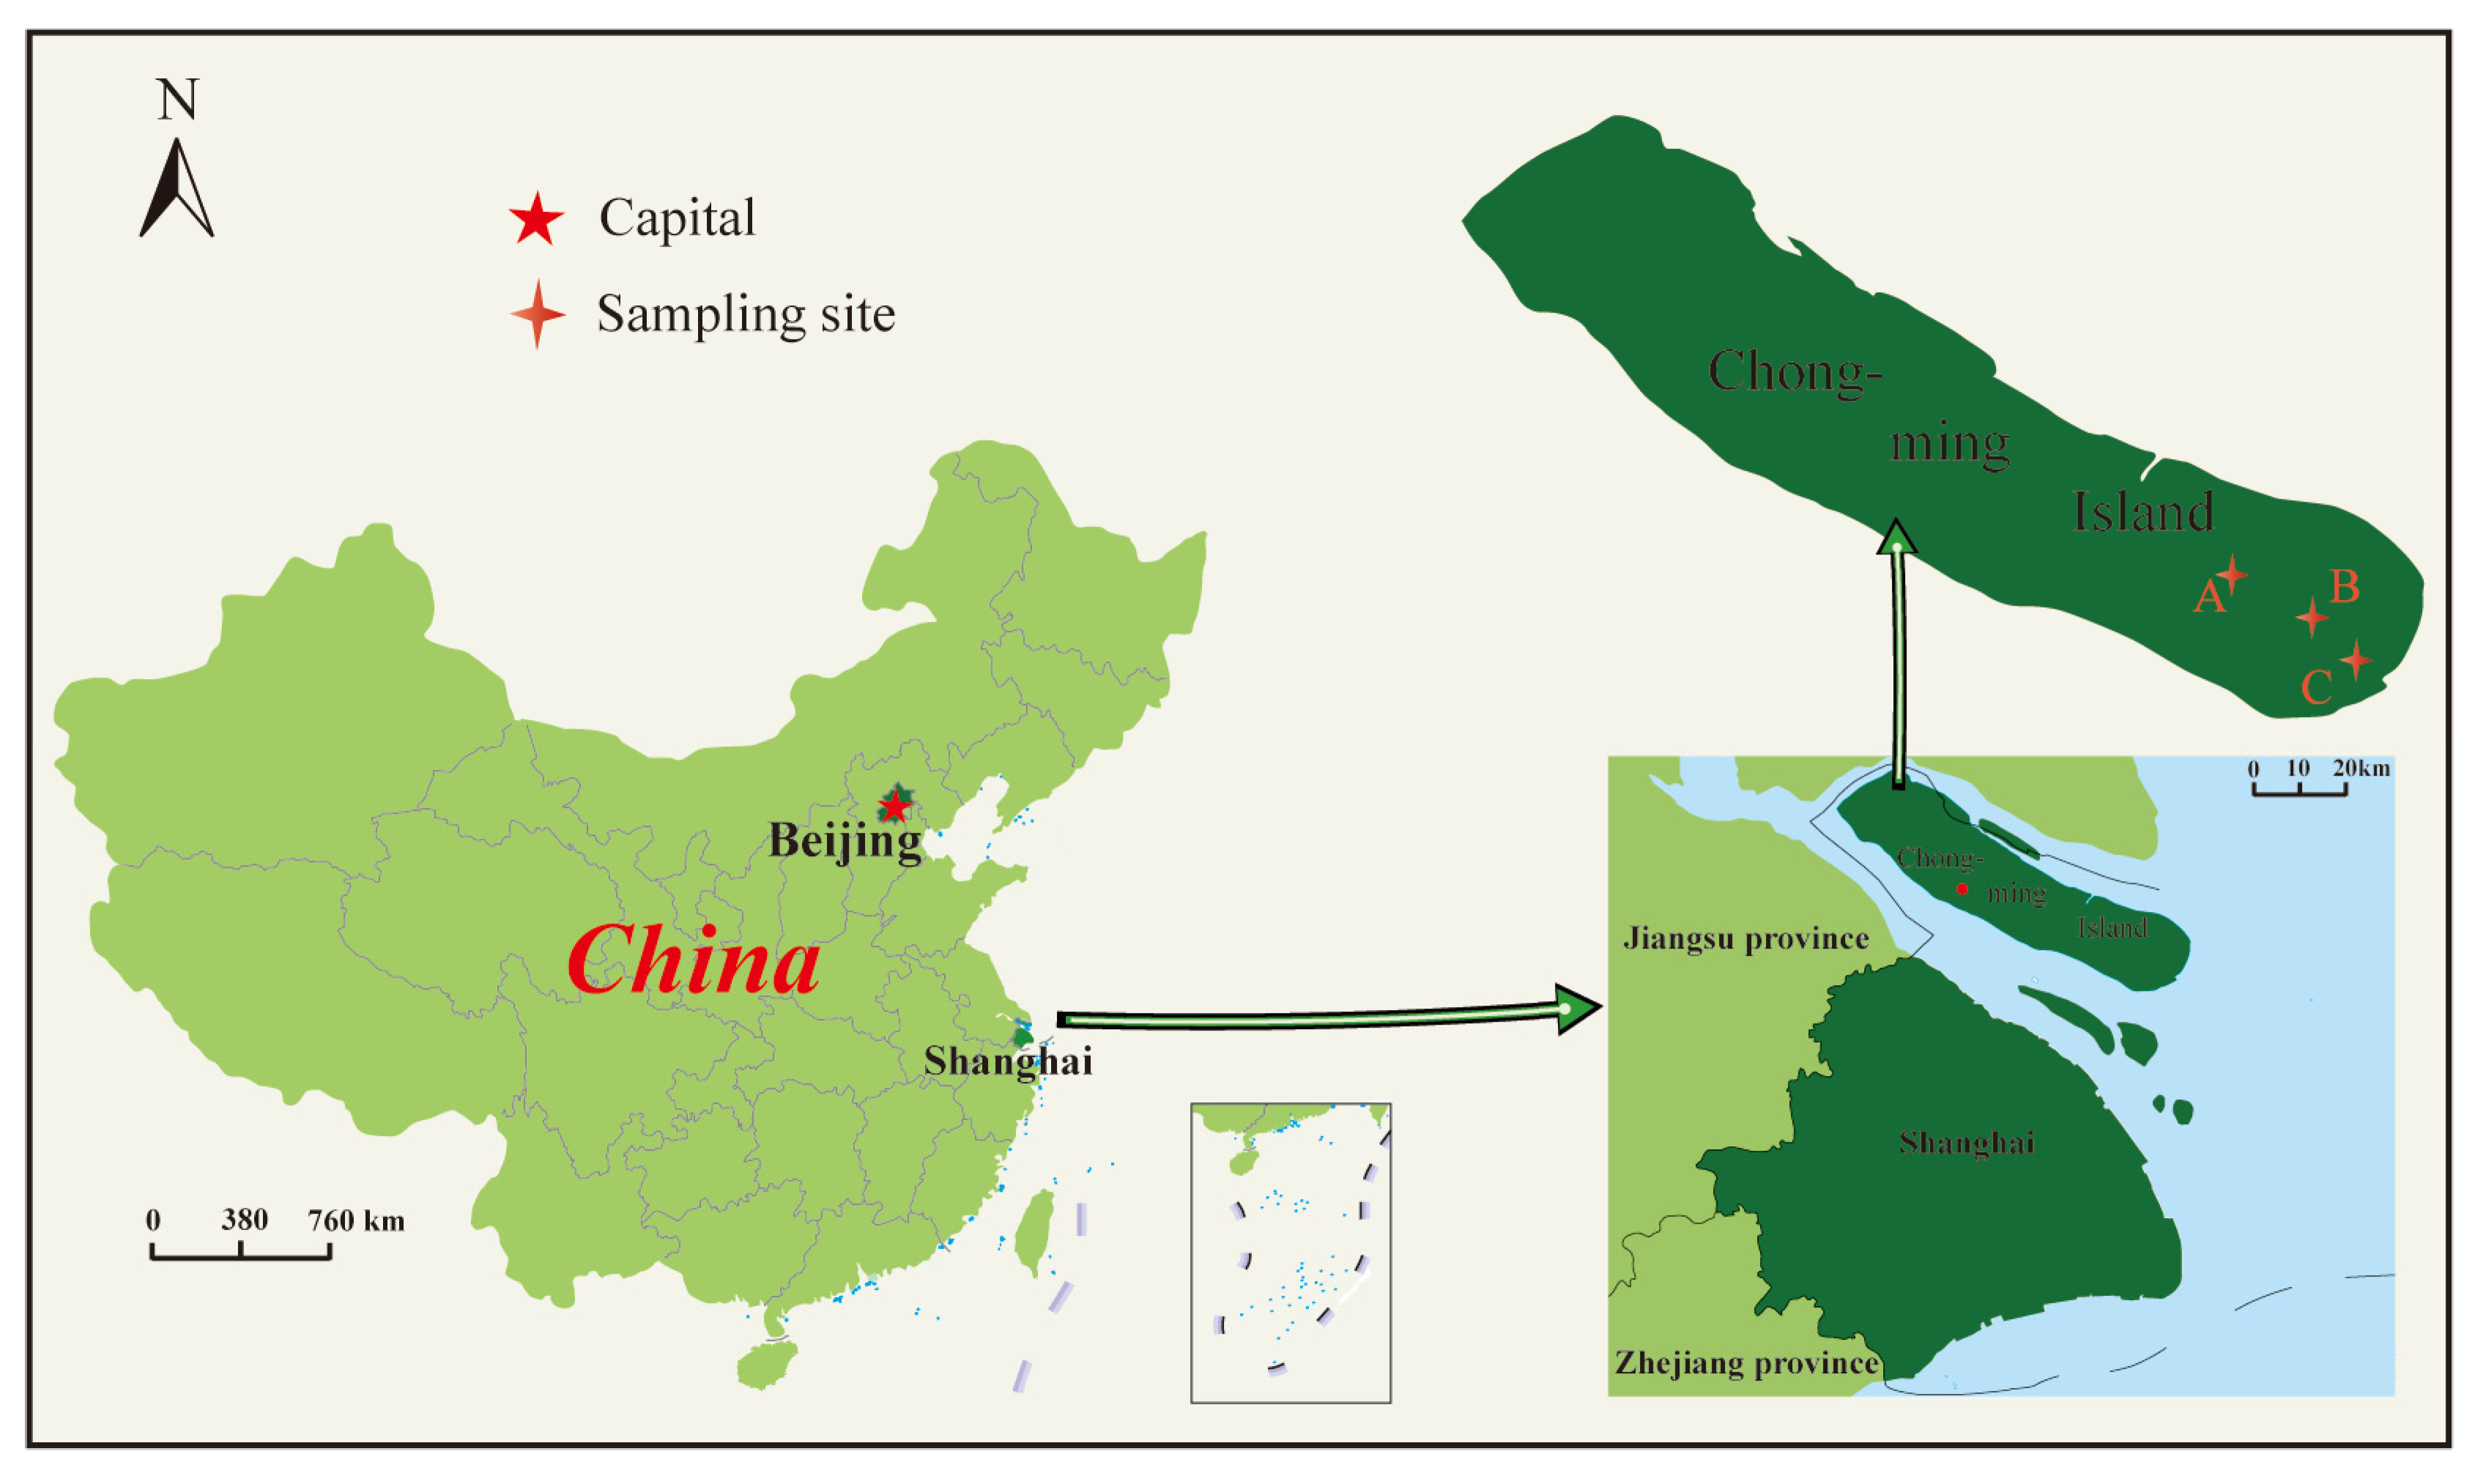
2.2. Soil Samples
2.3. NMR Test
3. Results and Discussion
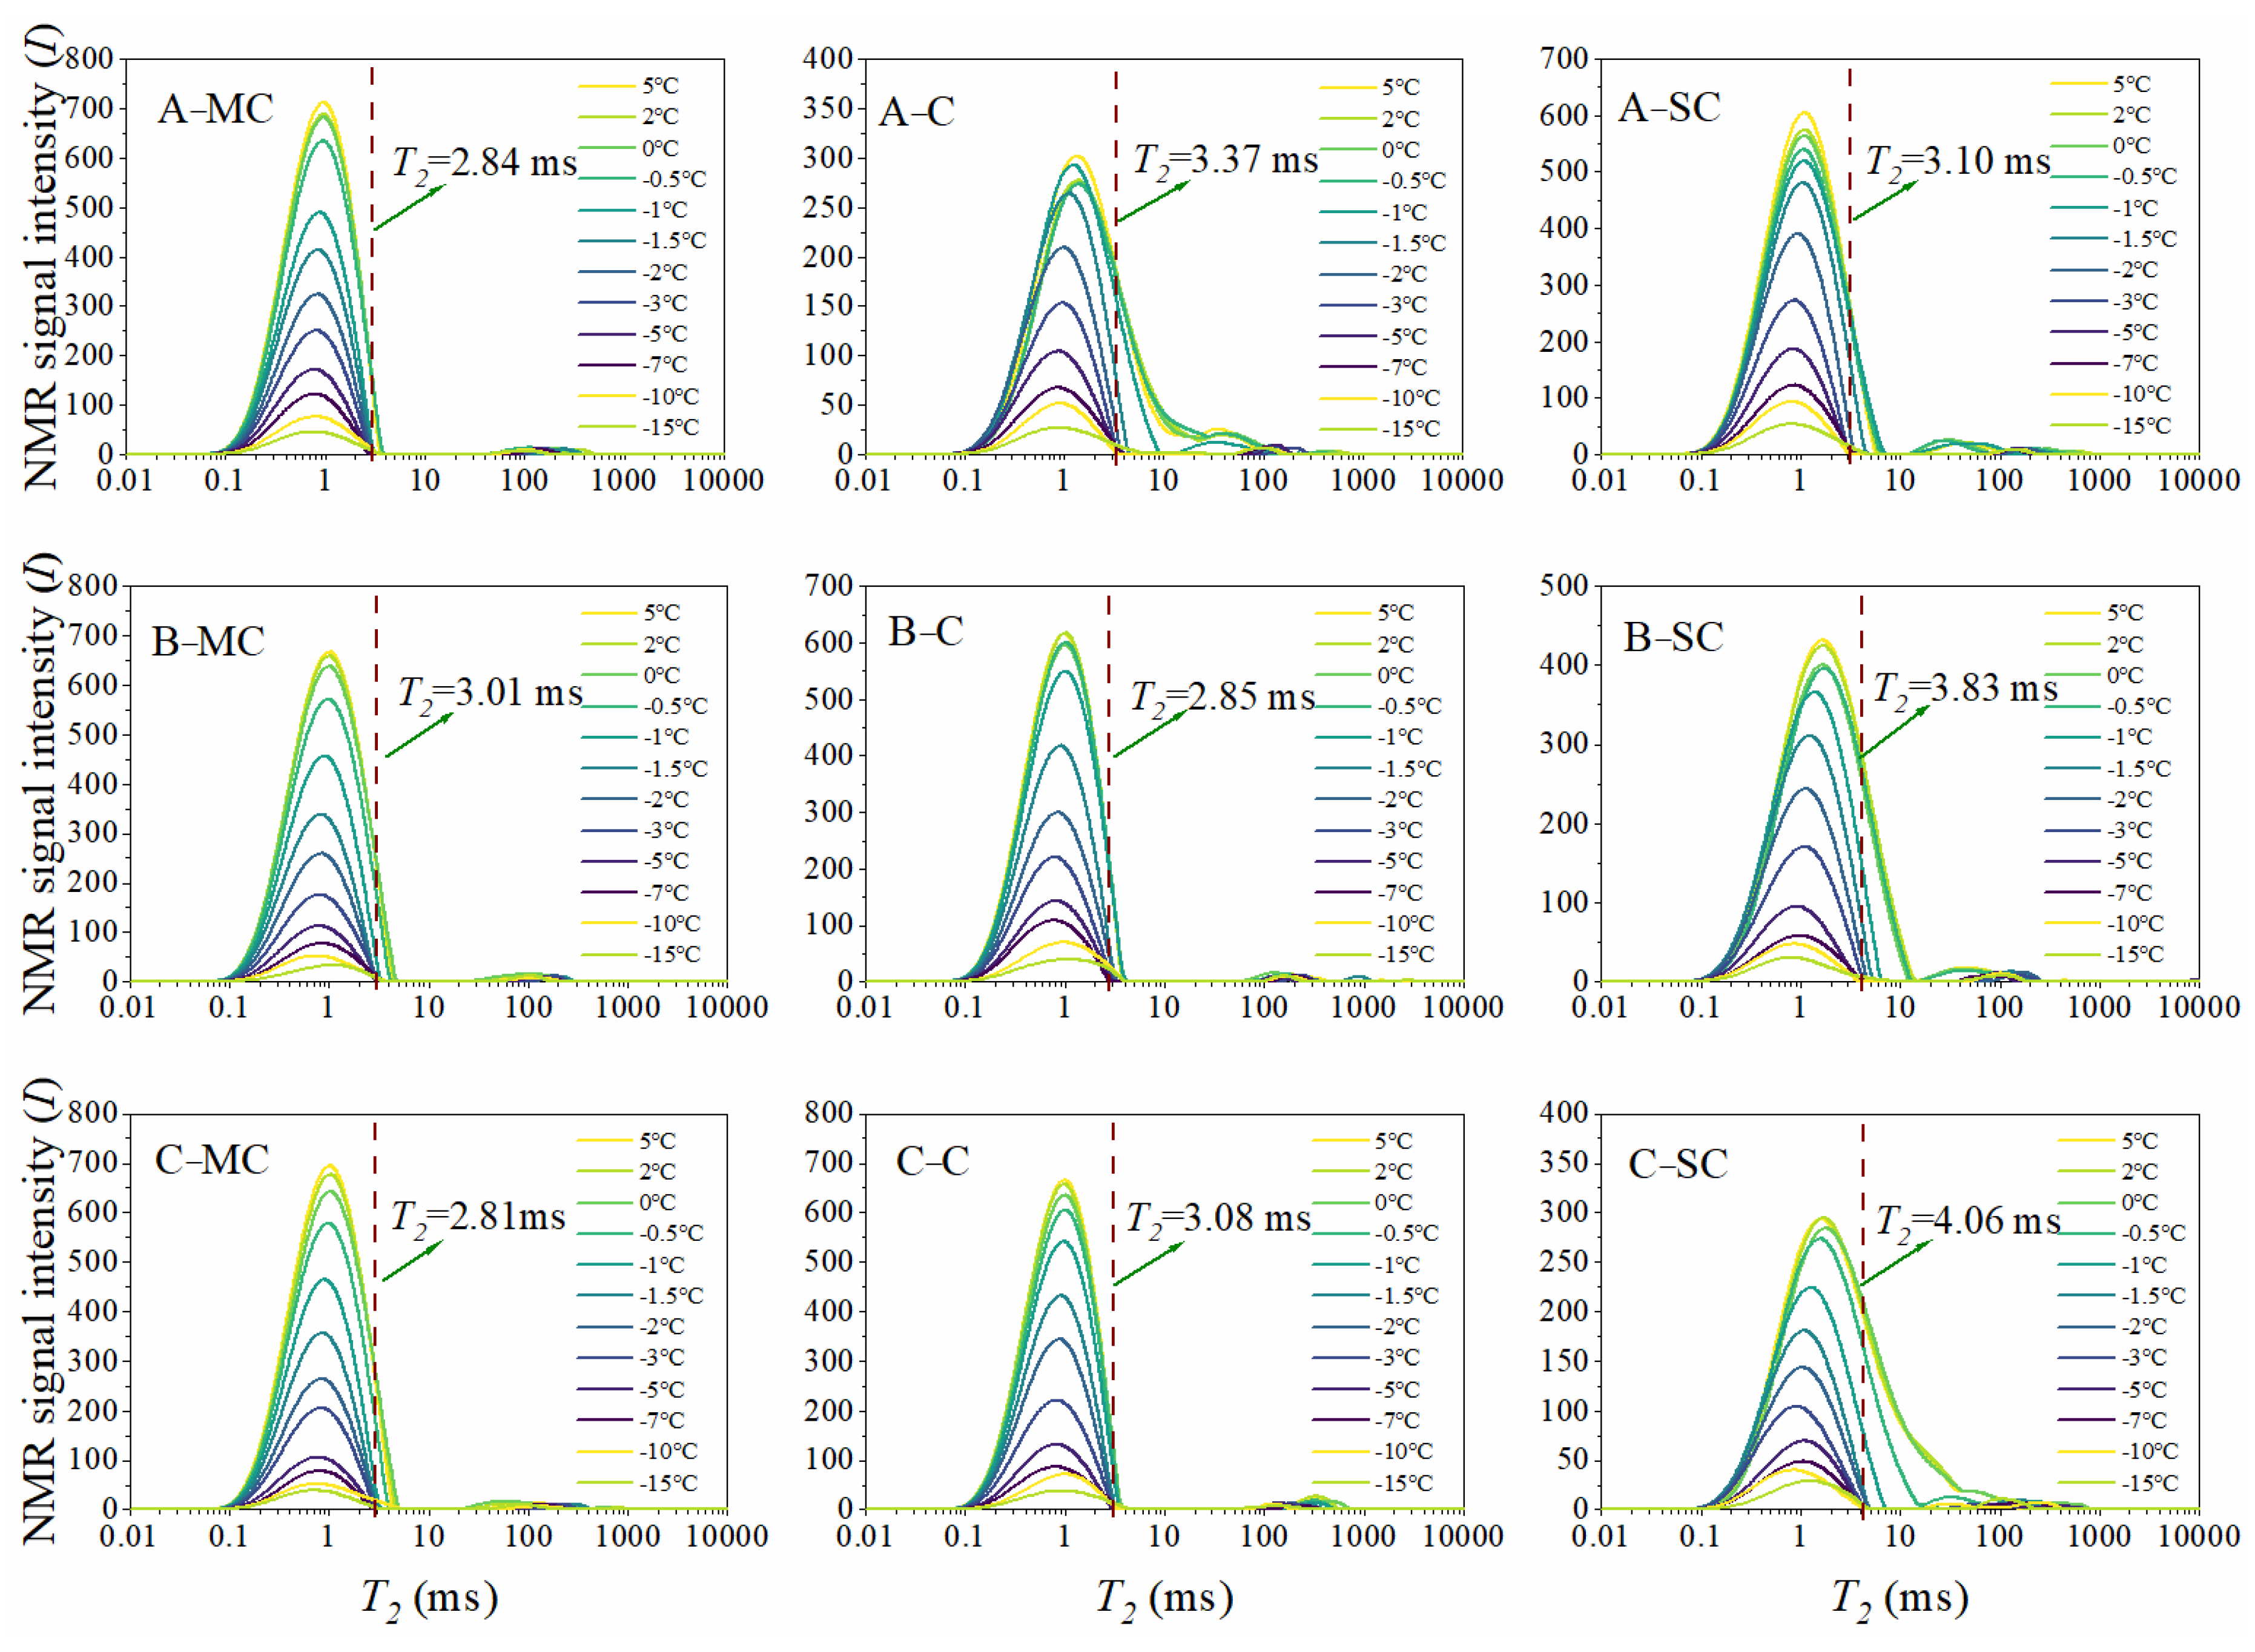
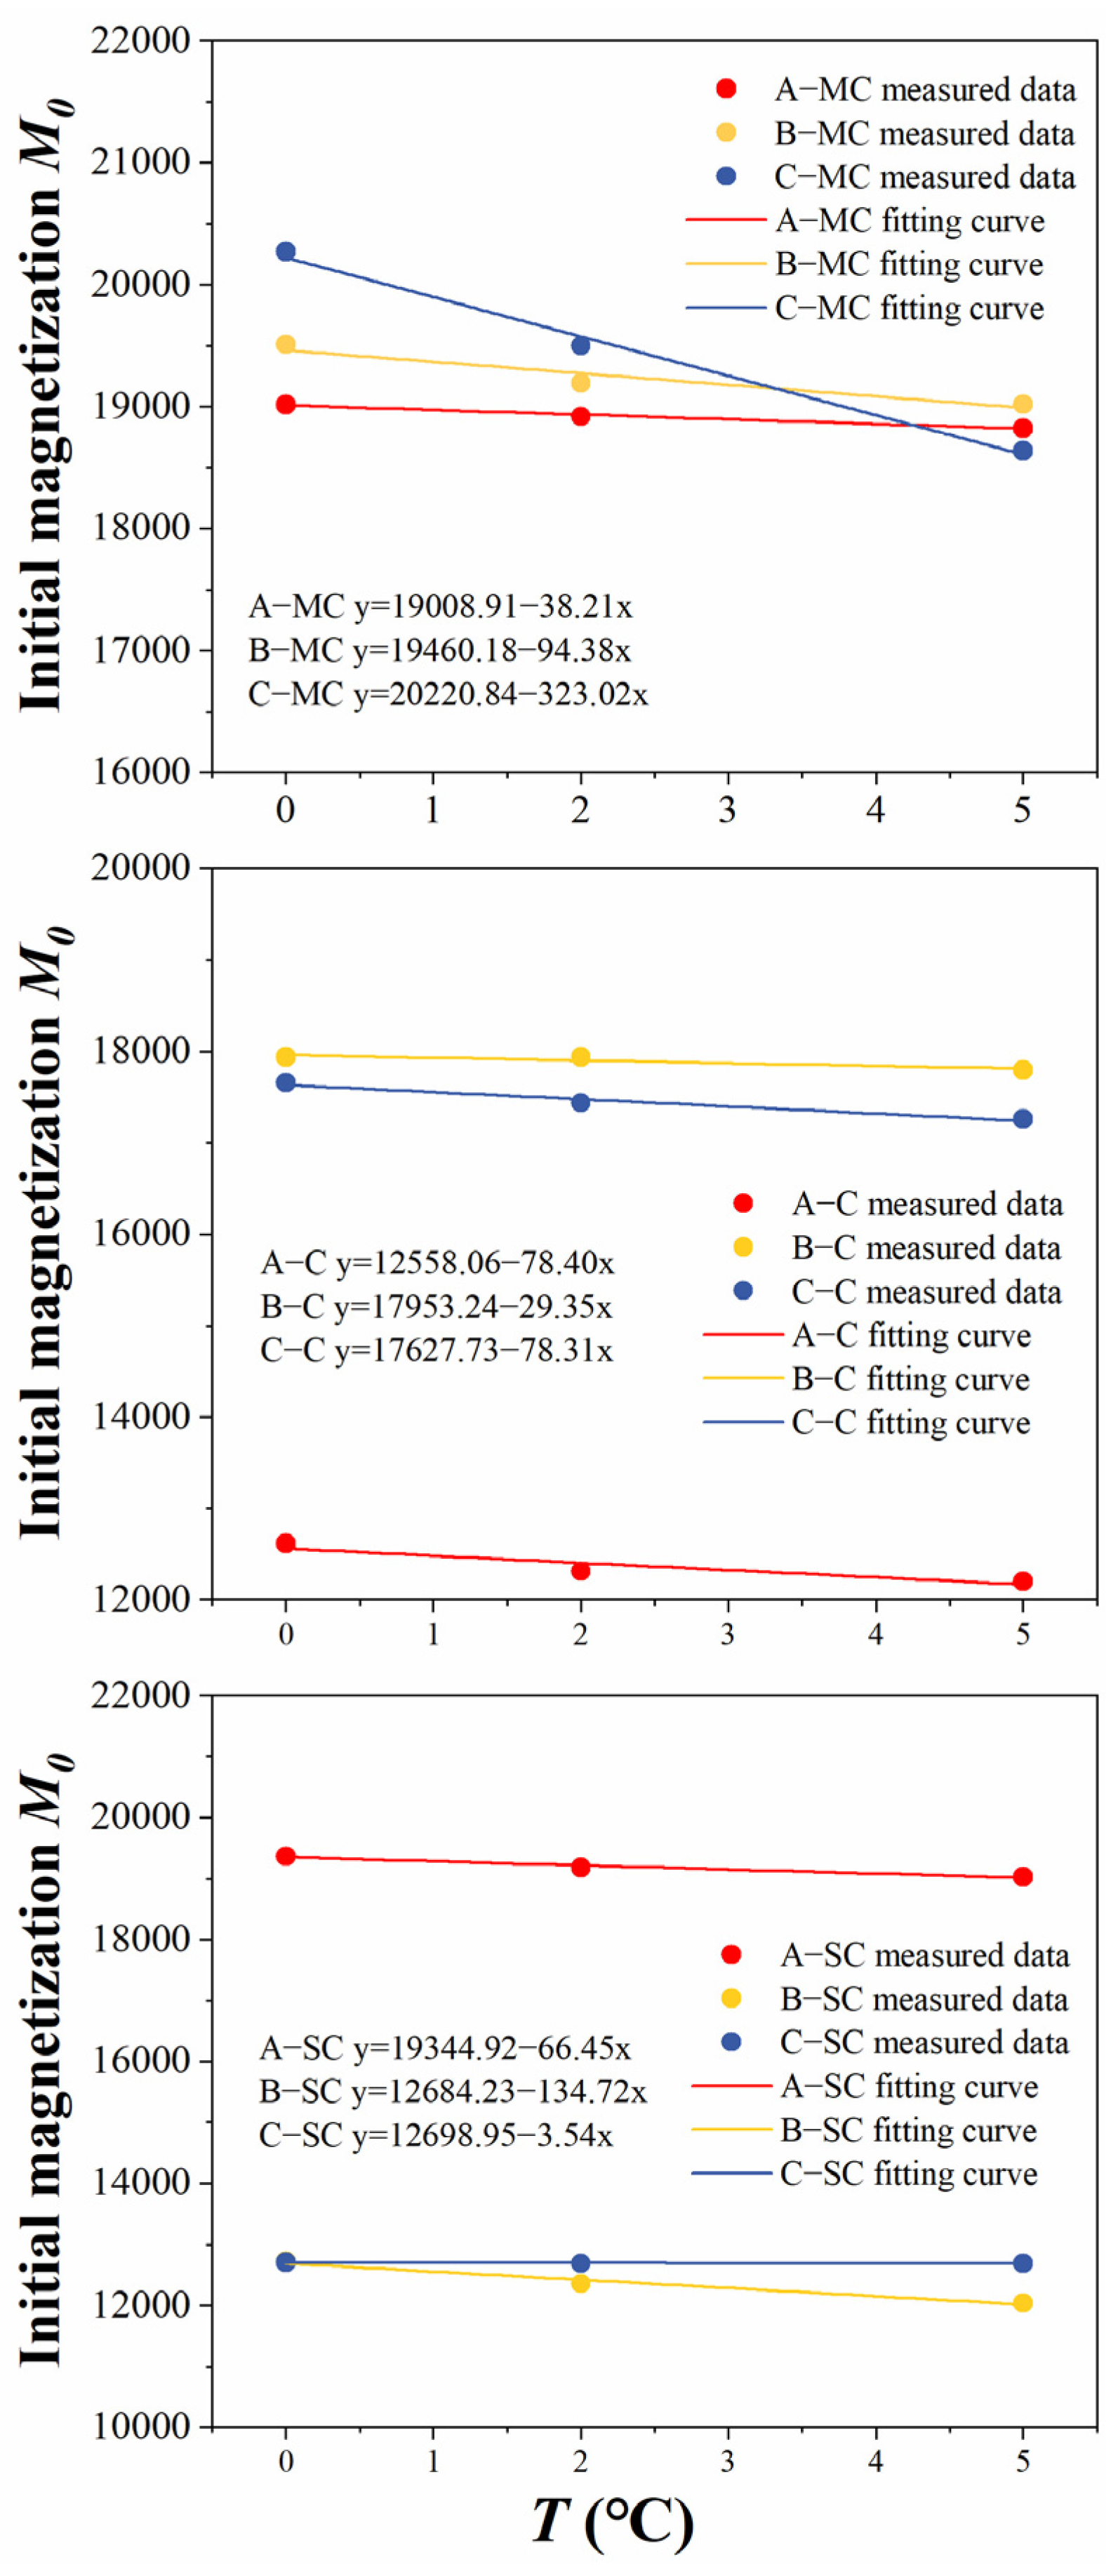
3.1. Determination of T2 Cutoff Values for Different Types of Pore Water in Soils
3.2. Changing Behavior of Bound Water Content and Unfrozen Water Content
3.3. Influence of Clay Content on Bound Water Content
3.4. Influence of Micro-Structure on Bound Water Content
3.5. Influence of Soil Properties on Bound Water Content
3.5.1. Effect of Organic Matter
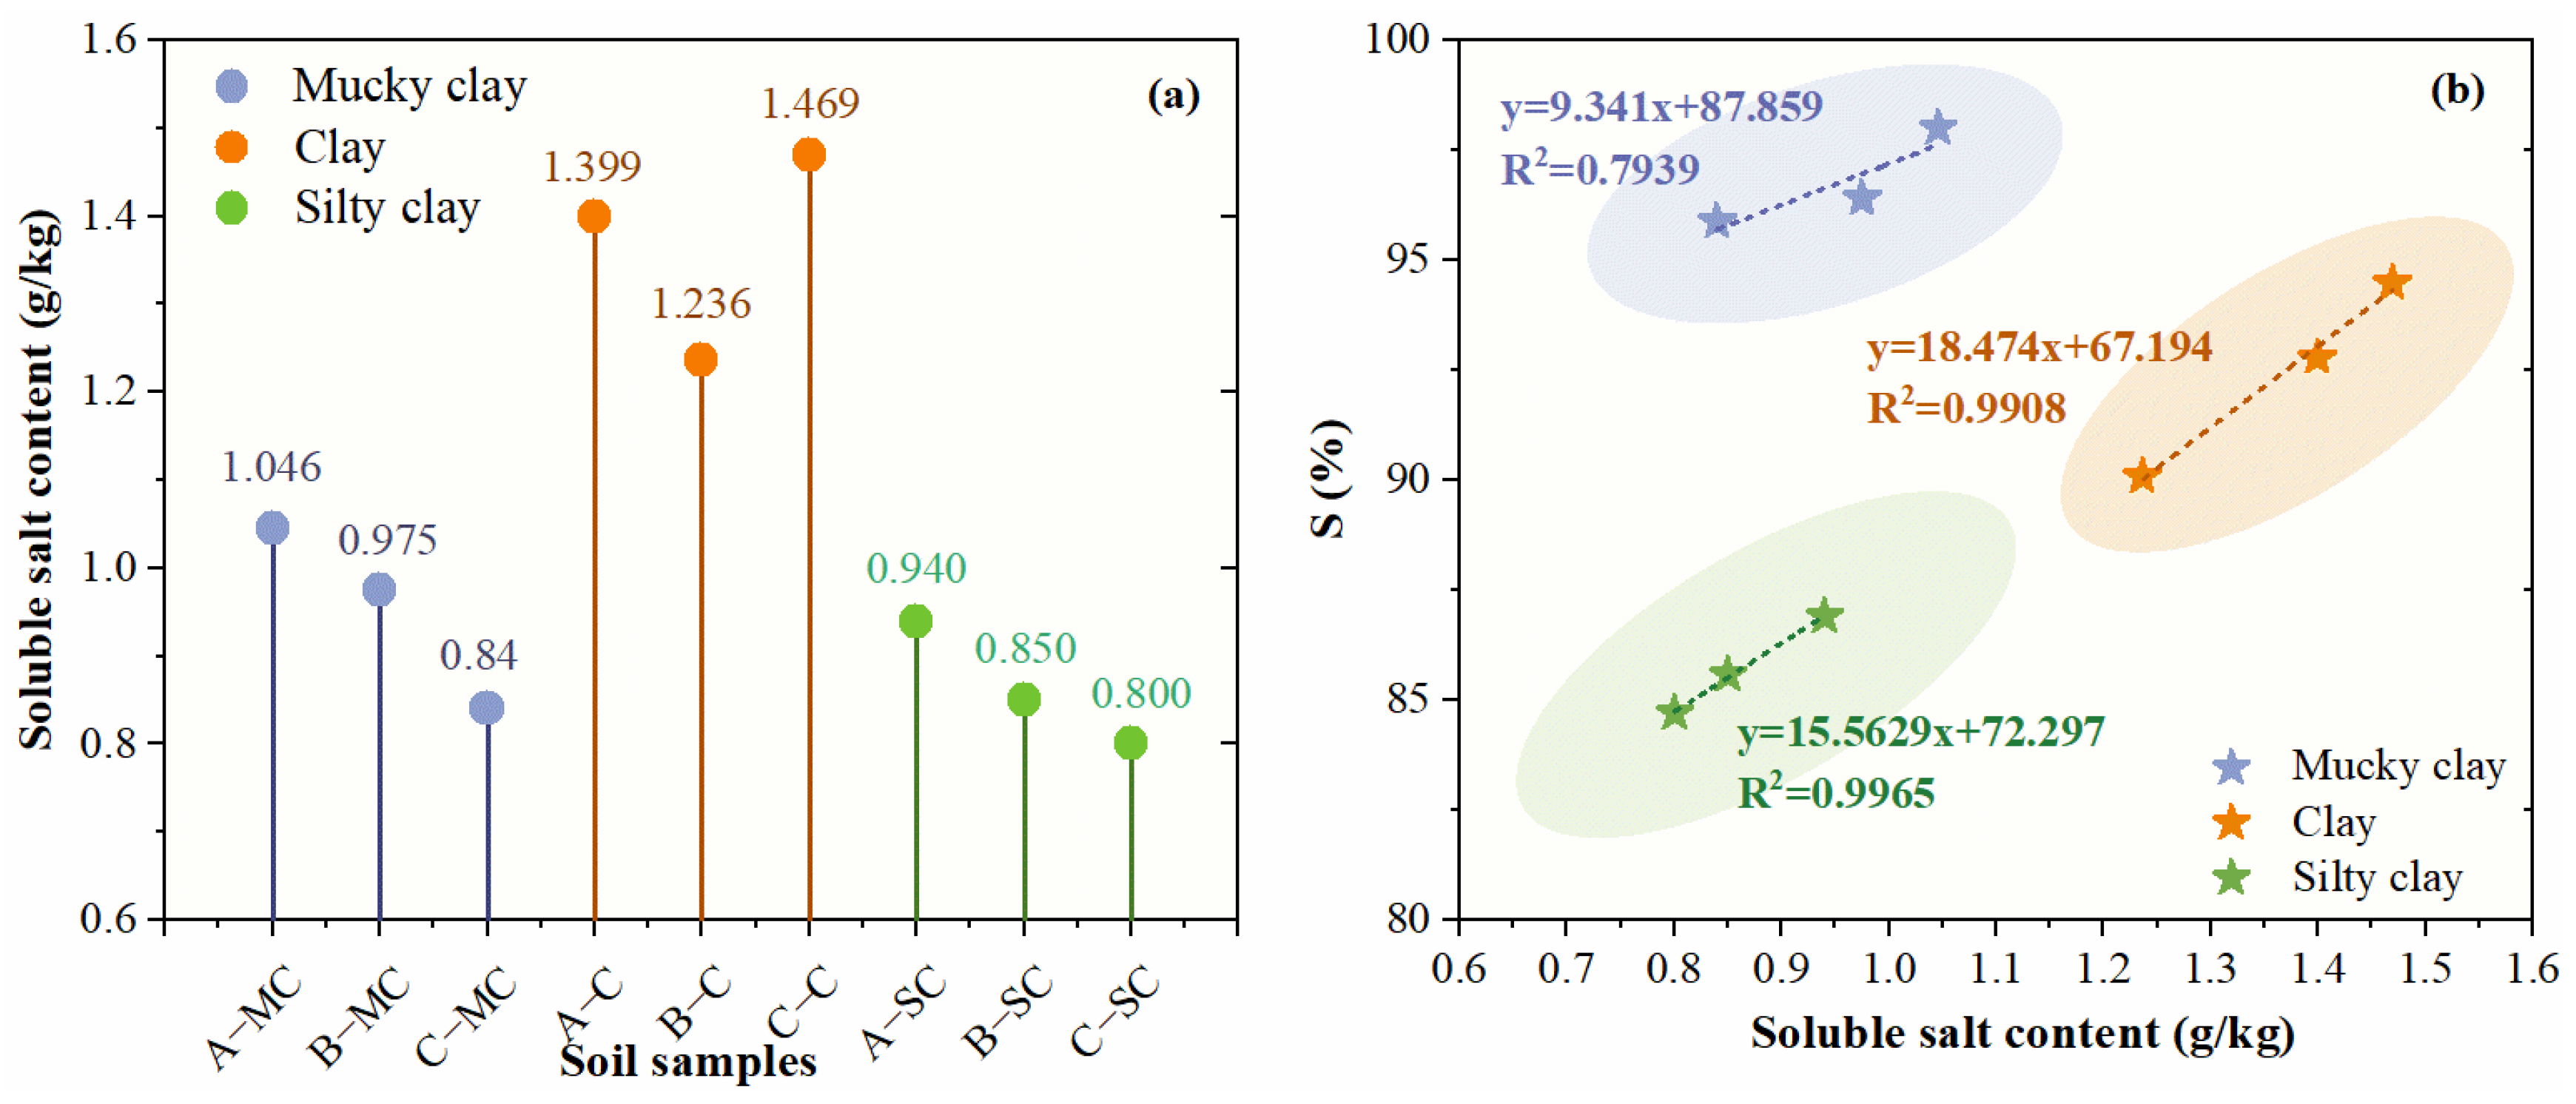
3.5.2. Effect of Soluble Salt Content
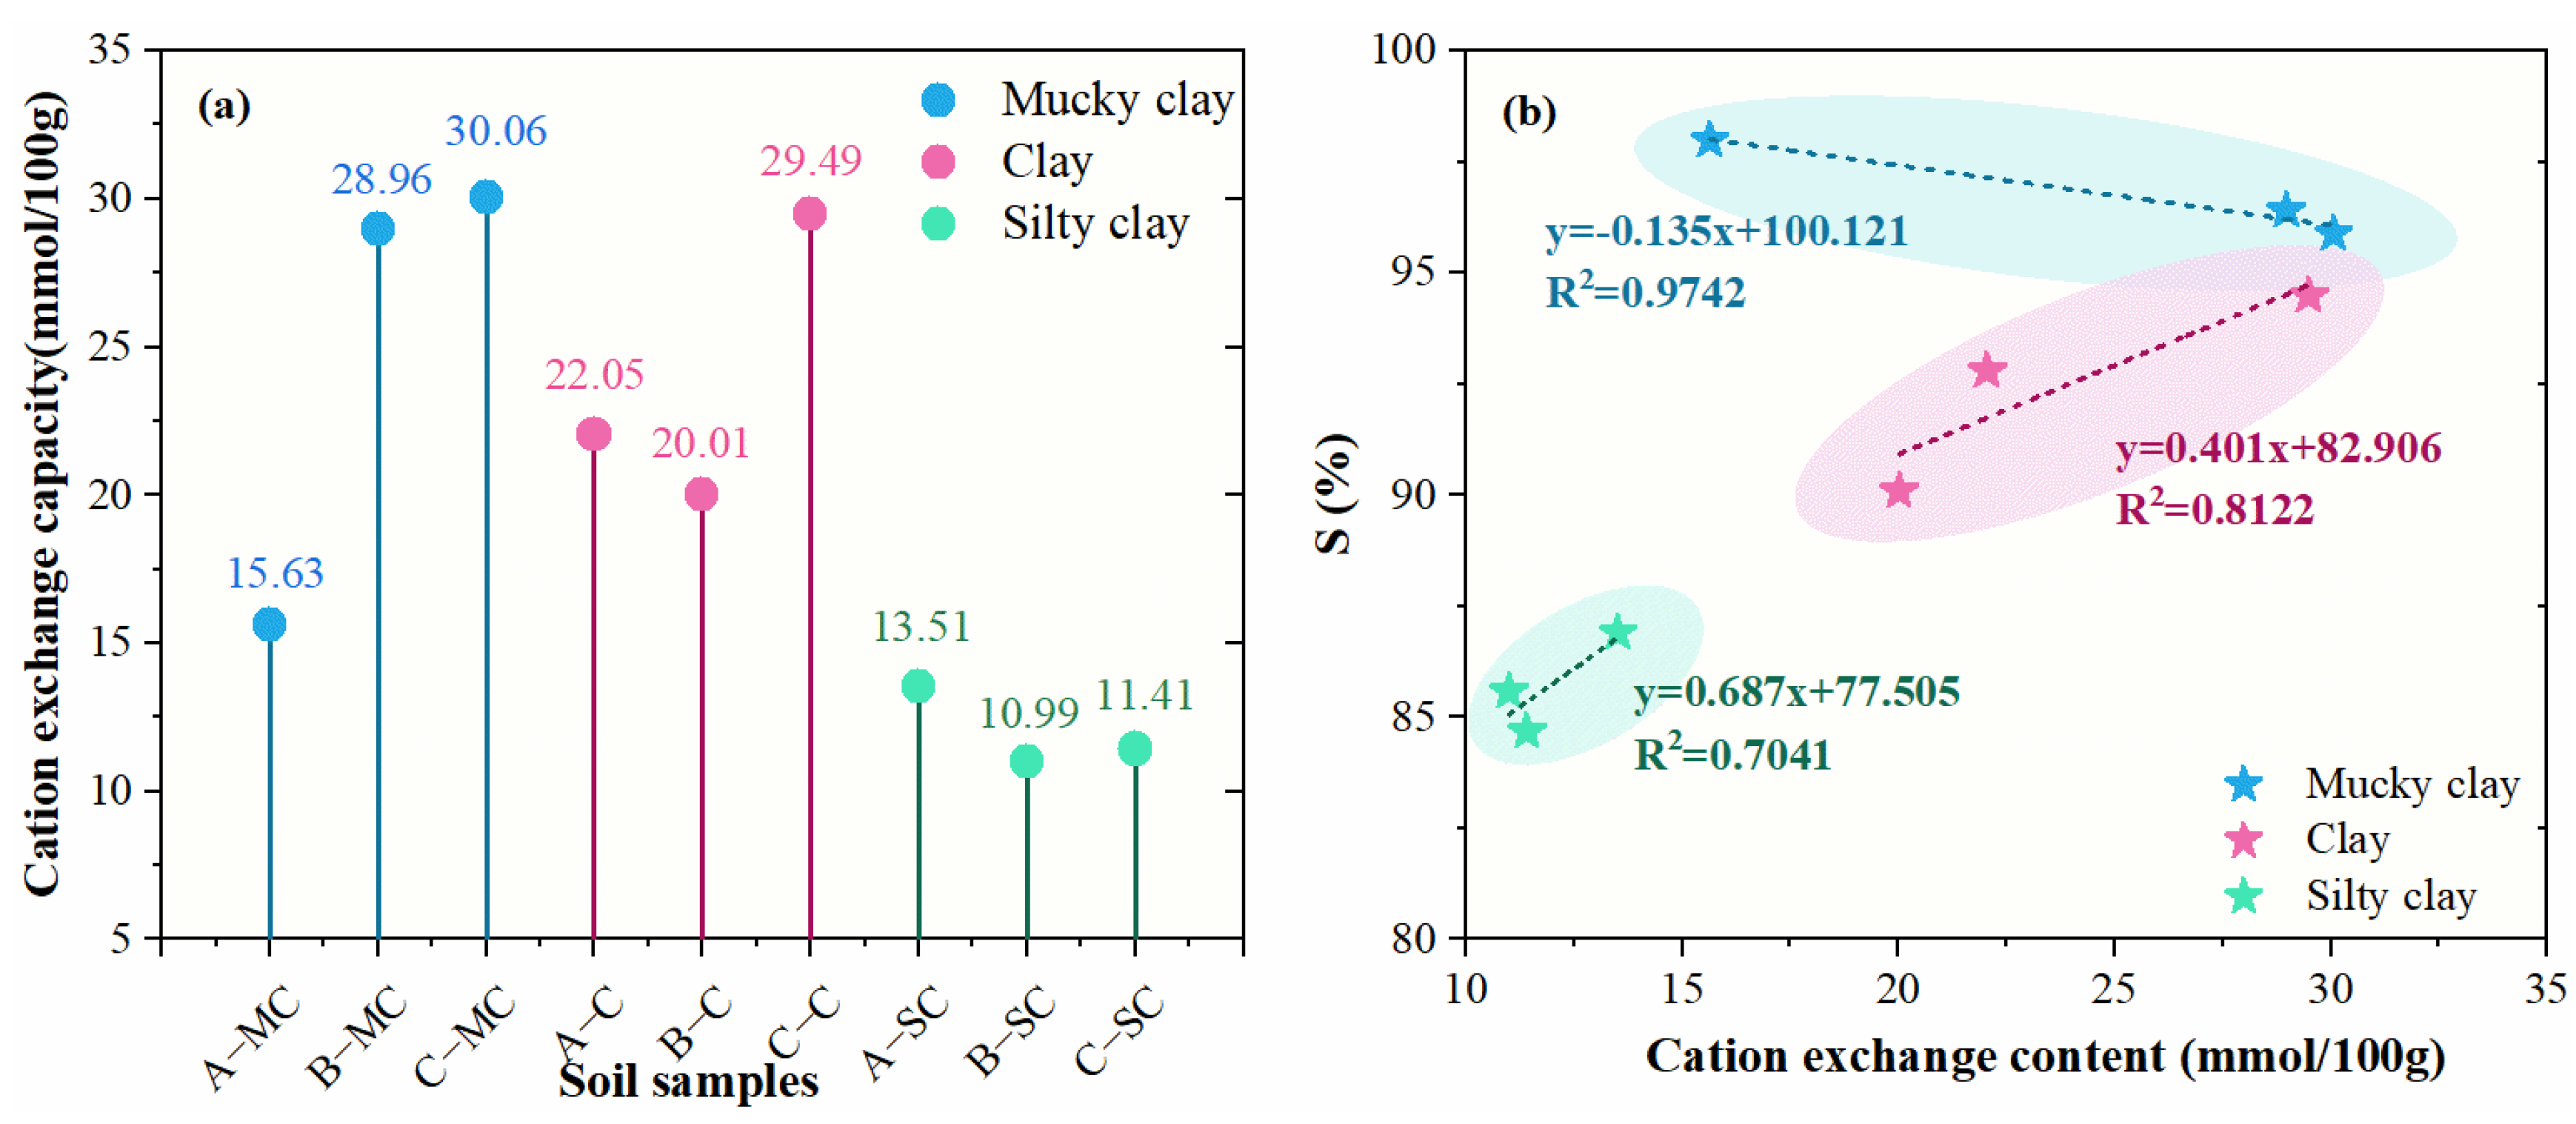
3.5.3. Effect of Cation Exchange Capacity
4. Conclusions
- T2 thresholds were determined to differentiate between bound water and capillary water in marine clays. In particular, the T2 cutoff values for the mucky clay layer range from 2.81 to 3.01 ms; for the clay layer, they range from 2.85 to 3.37 ms; and for the silty clay layer, they range from 3.10 to 4.06 ms.
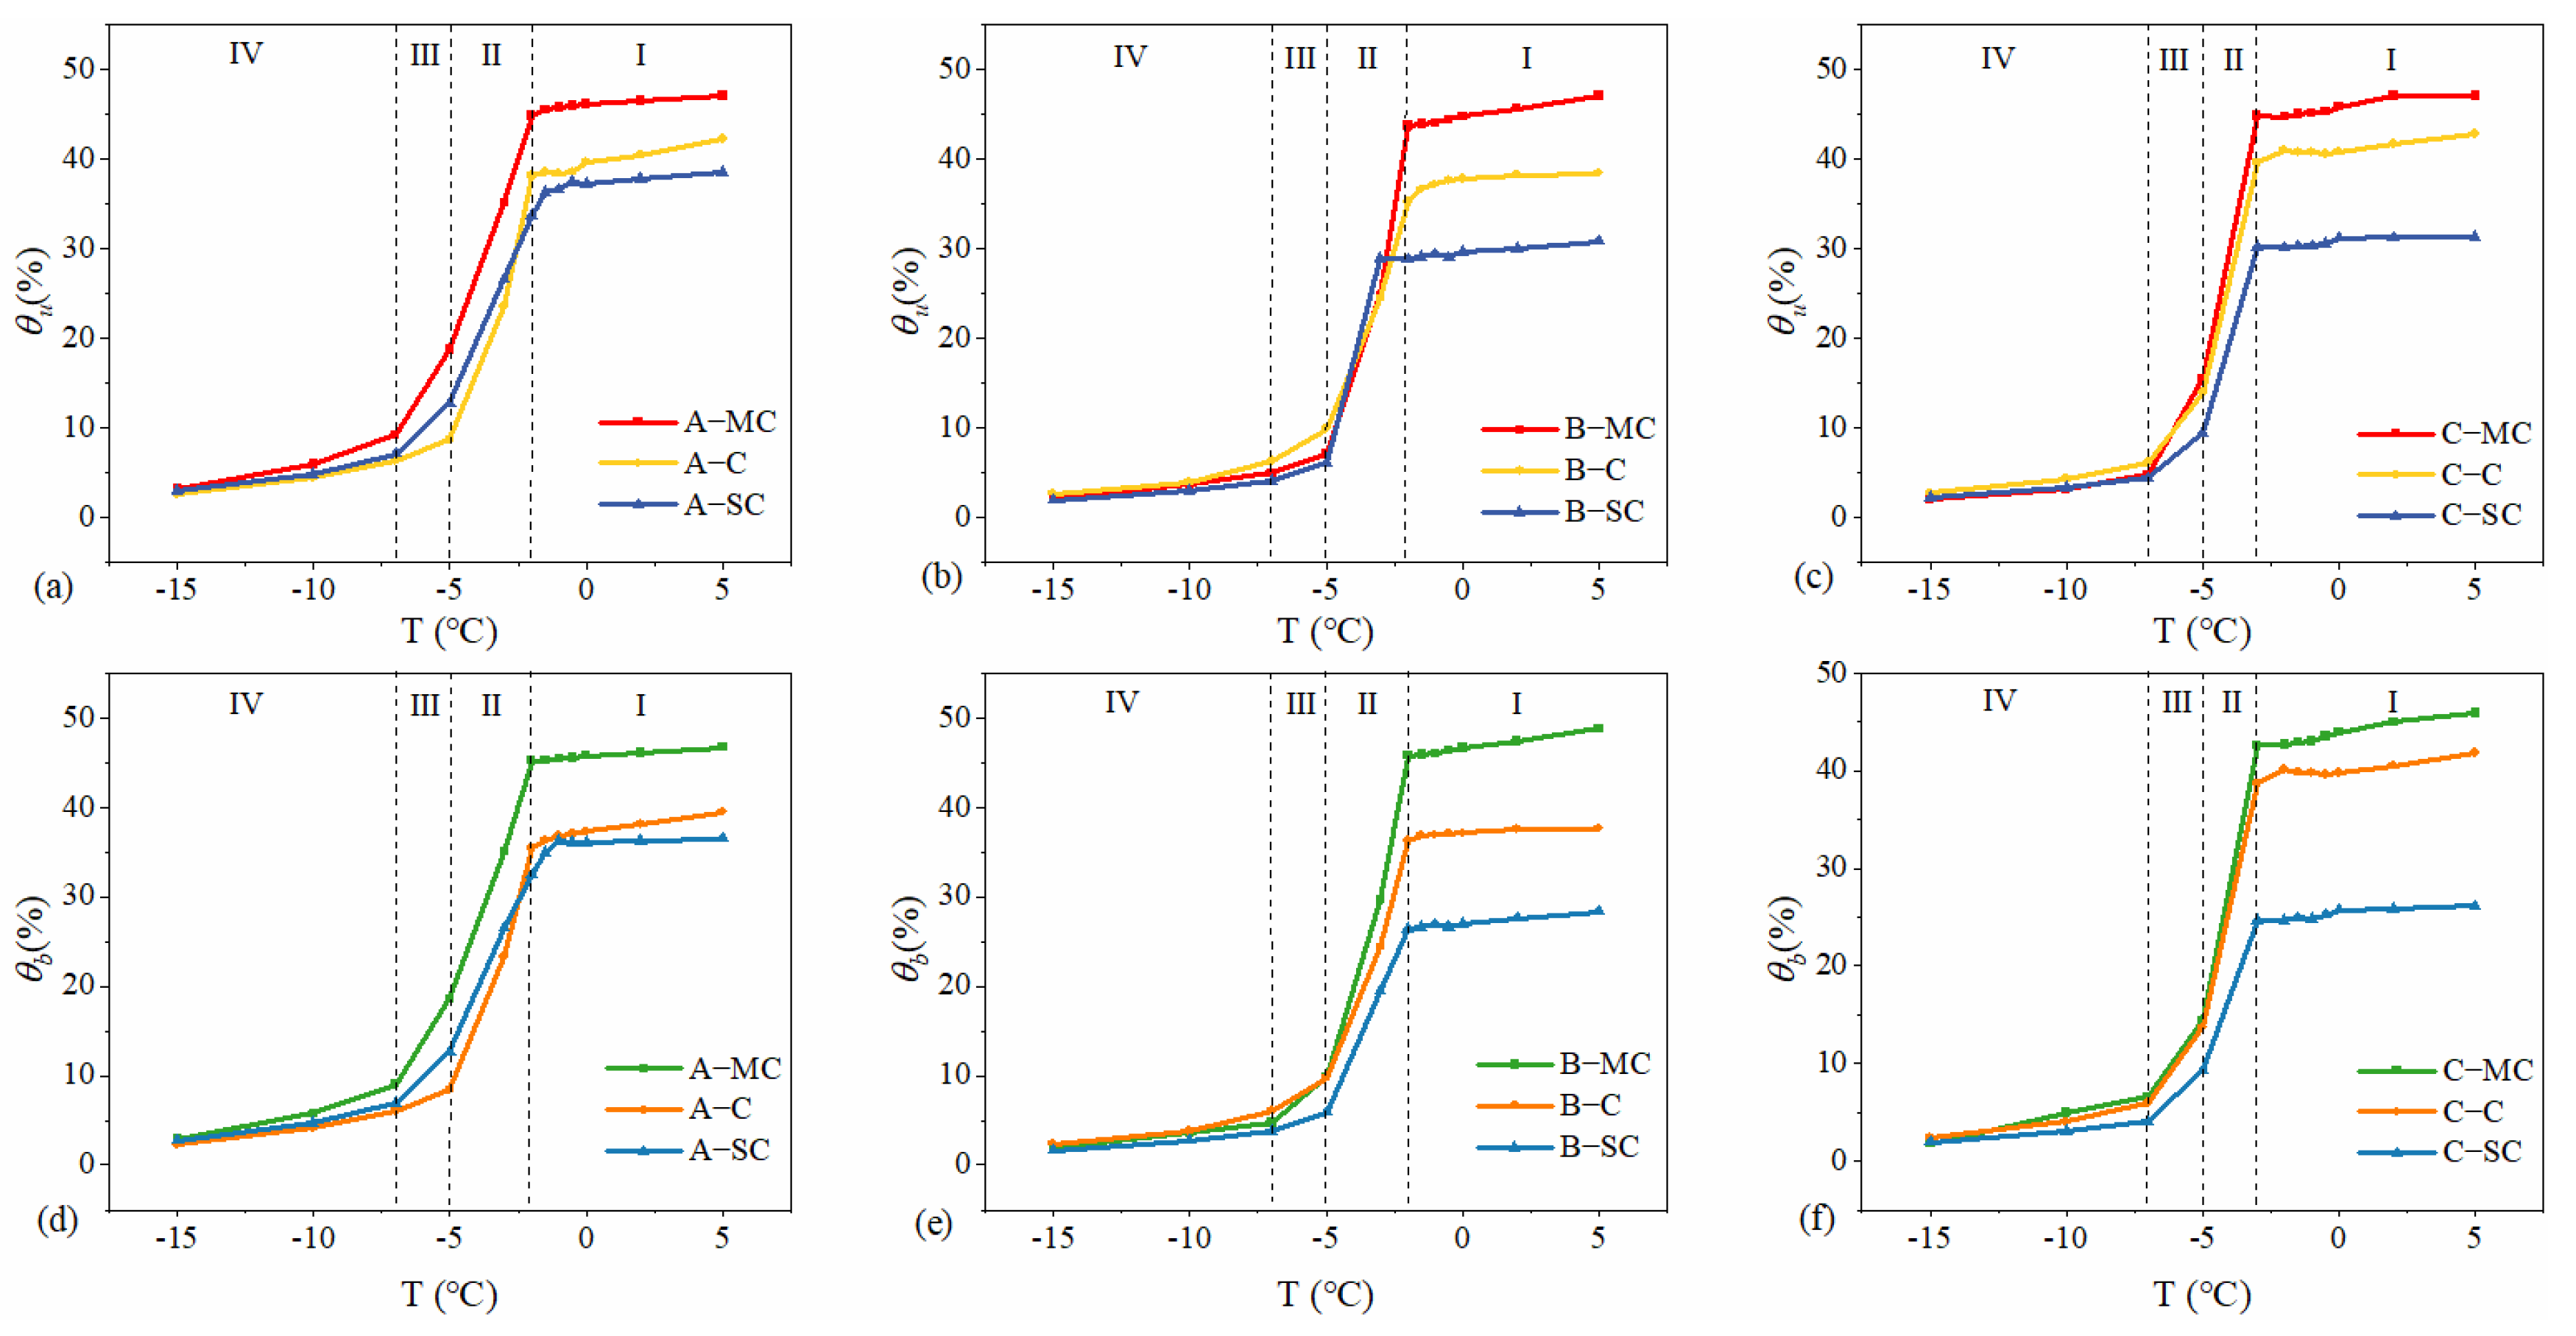
- The content of unfrozen water and bound water at different temperatures during the freezing process was calculated, and the change curves of unfrozen water content and bound water content with temperature were divided into four stages: the trace phase change stage, the intense phase change stage, the transitional phase change stage, and the stabilizing stage. In the trace phase change stage, soil samples with different initial water contents have significant differences in unfrozen water and bound water. However, as the temperature decreases, this difference also gradually decreases until reaching the stabilizing stage, where the unfrozen water in the soil is dominated by the bound water, and the content tends to be close to zero.
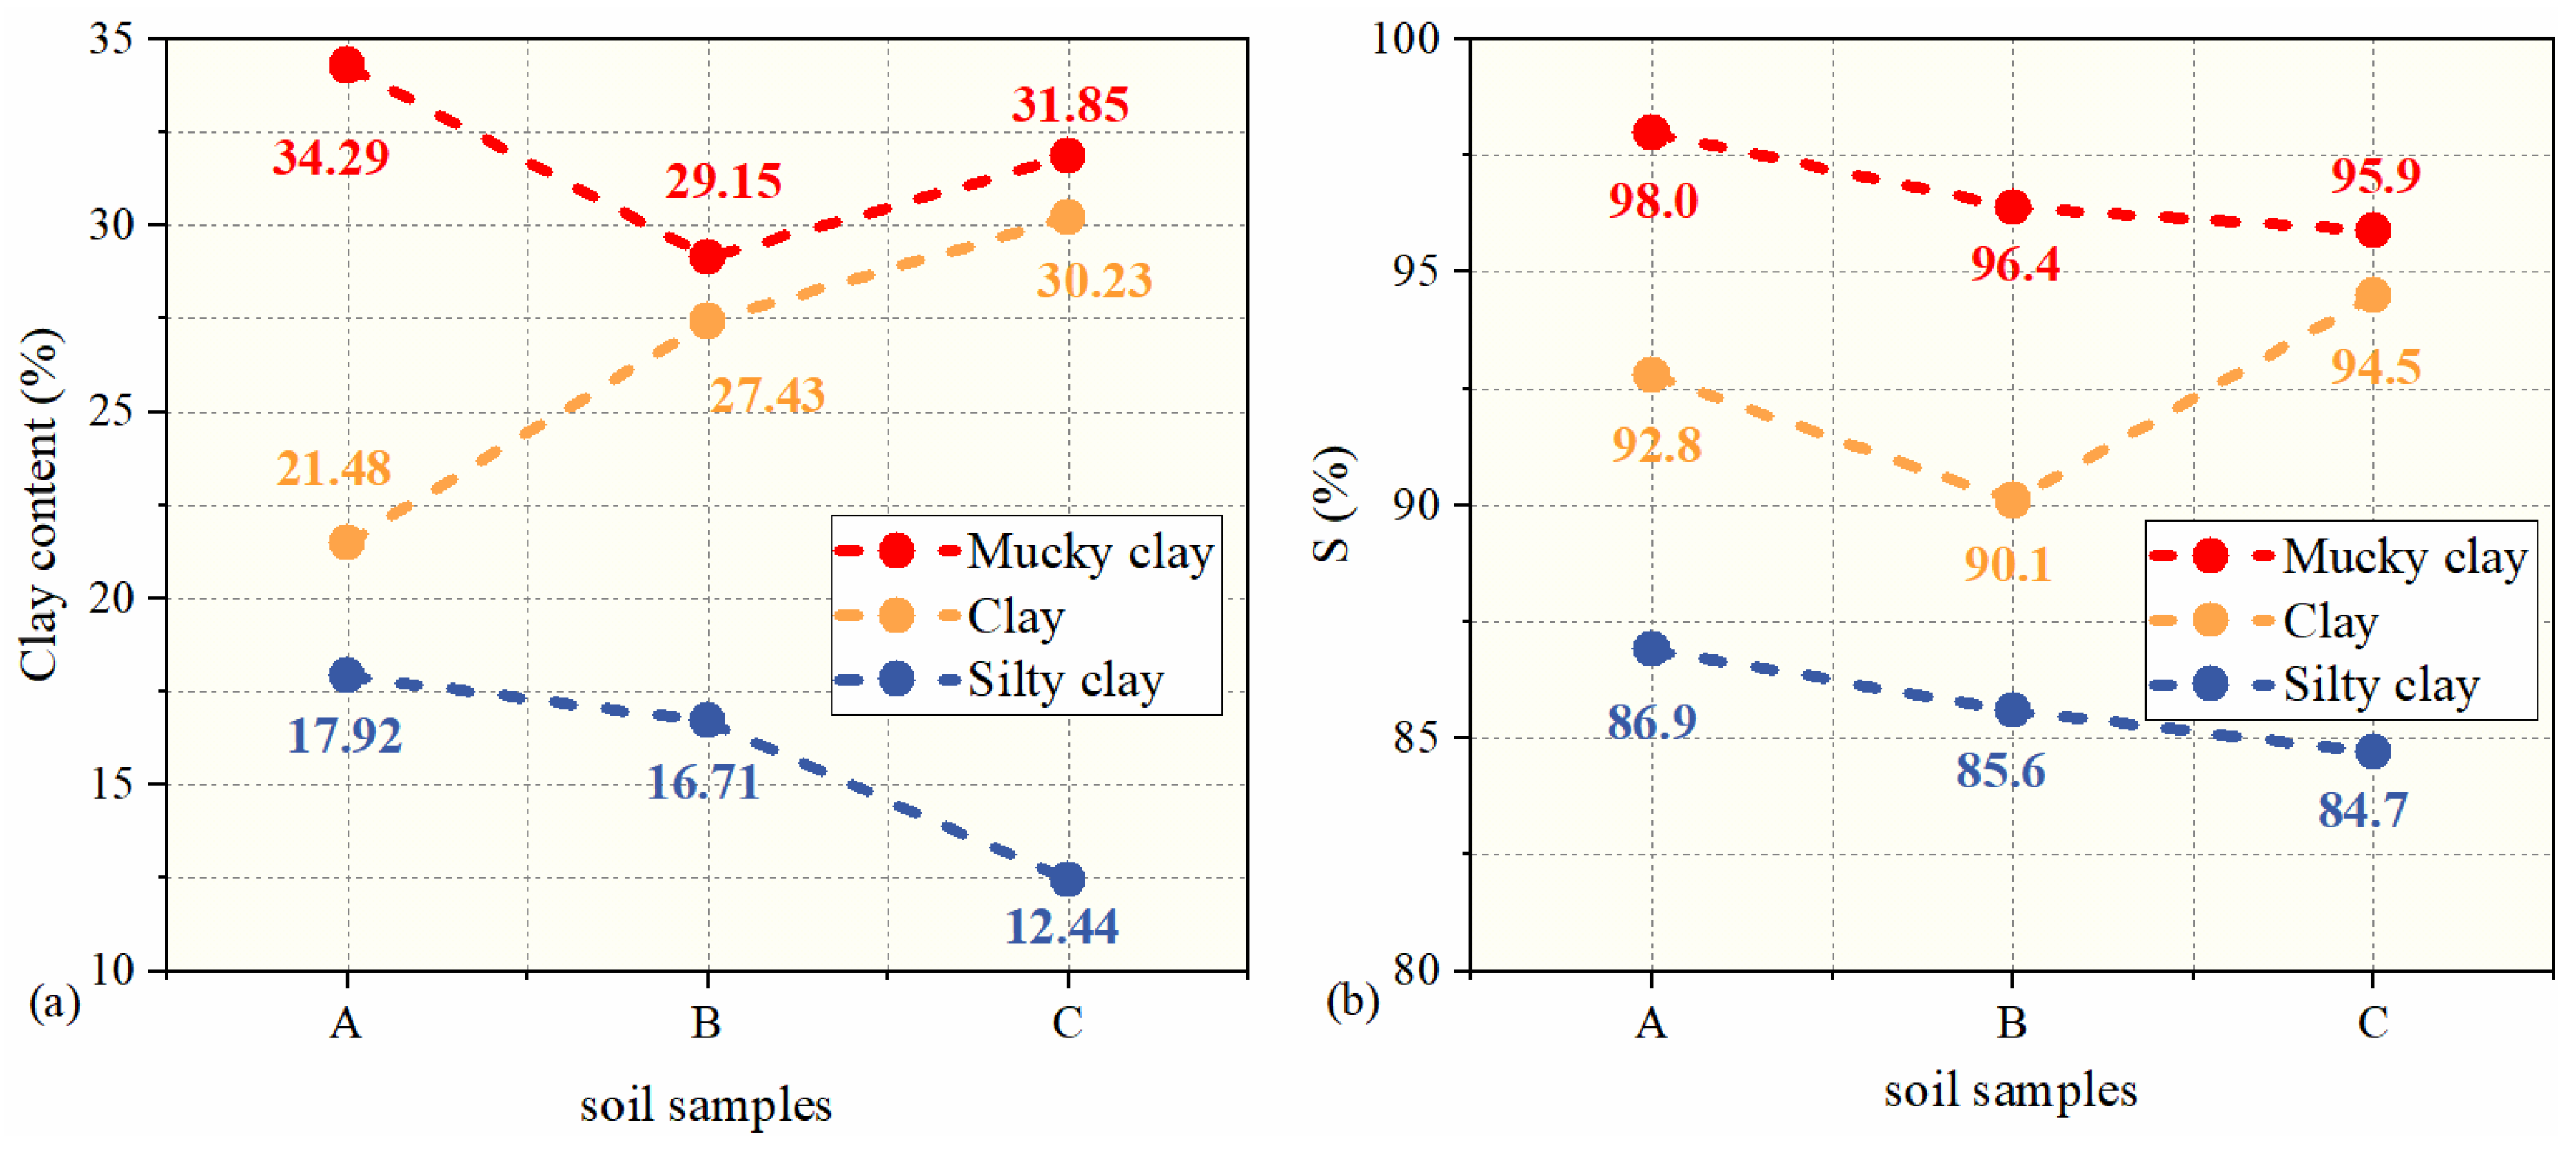
- Quantitatively analyzed the bound water fraction (S) of the soil samples, and found that the bound water fraction of each soil sample was greater than 80%. This indicates that the pore water in marine clays is dominated by bound water.
- The clay content and clay types greatly determine the content of bound water in the soil. Generally, the higher the clay content, the higher the bound water content. However, due to the differences in the microstructure of the soil, the clay content is not strictly positively correlated with the bound water content of the soil.
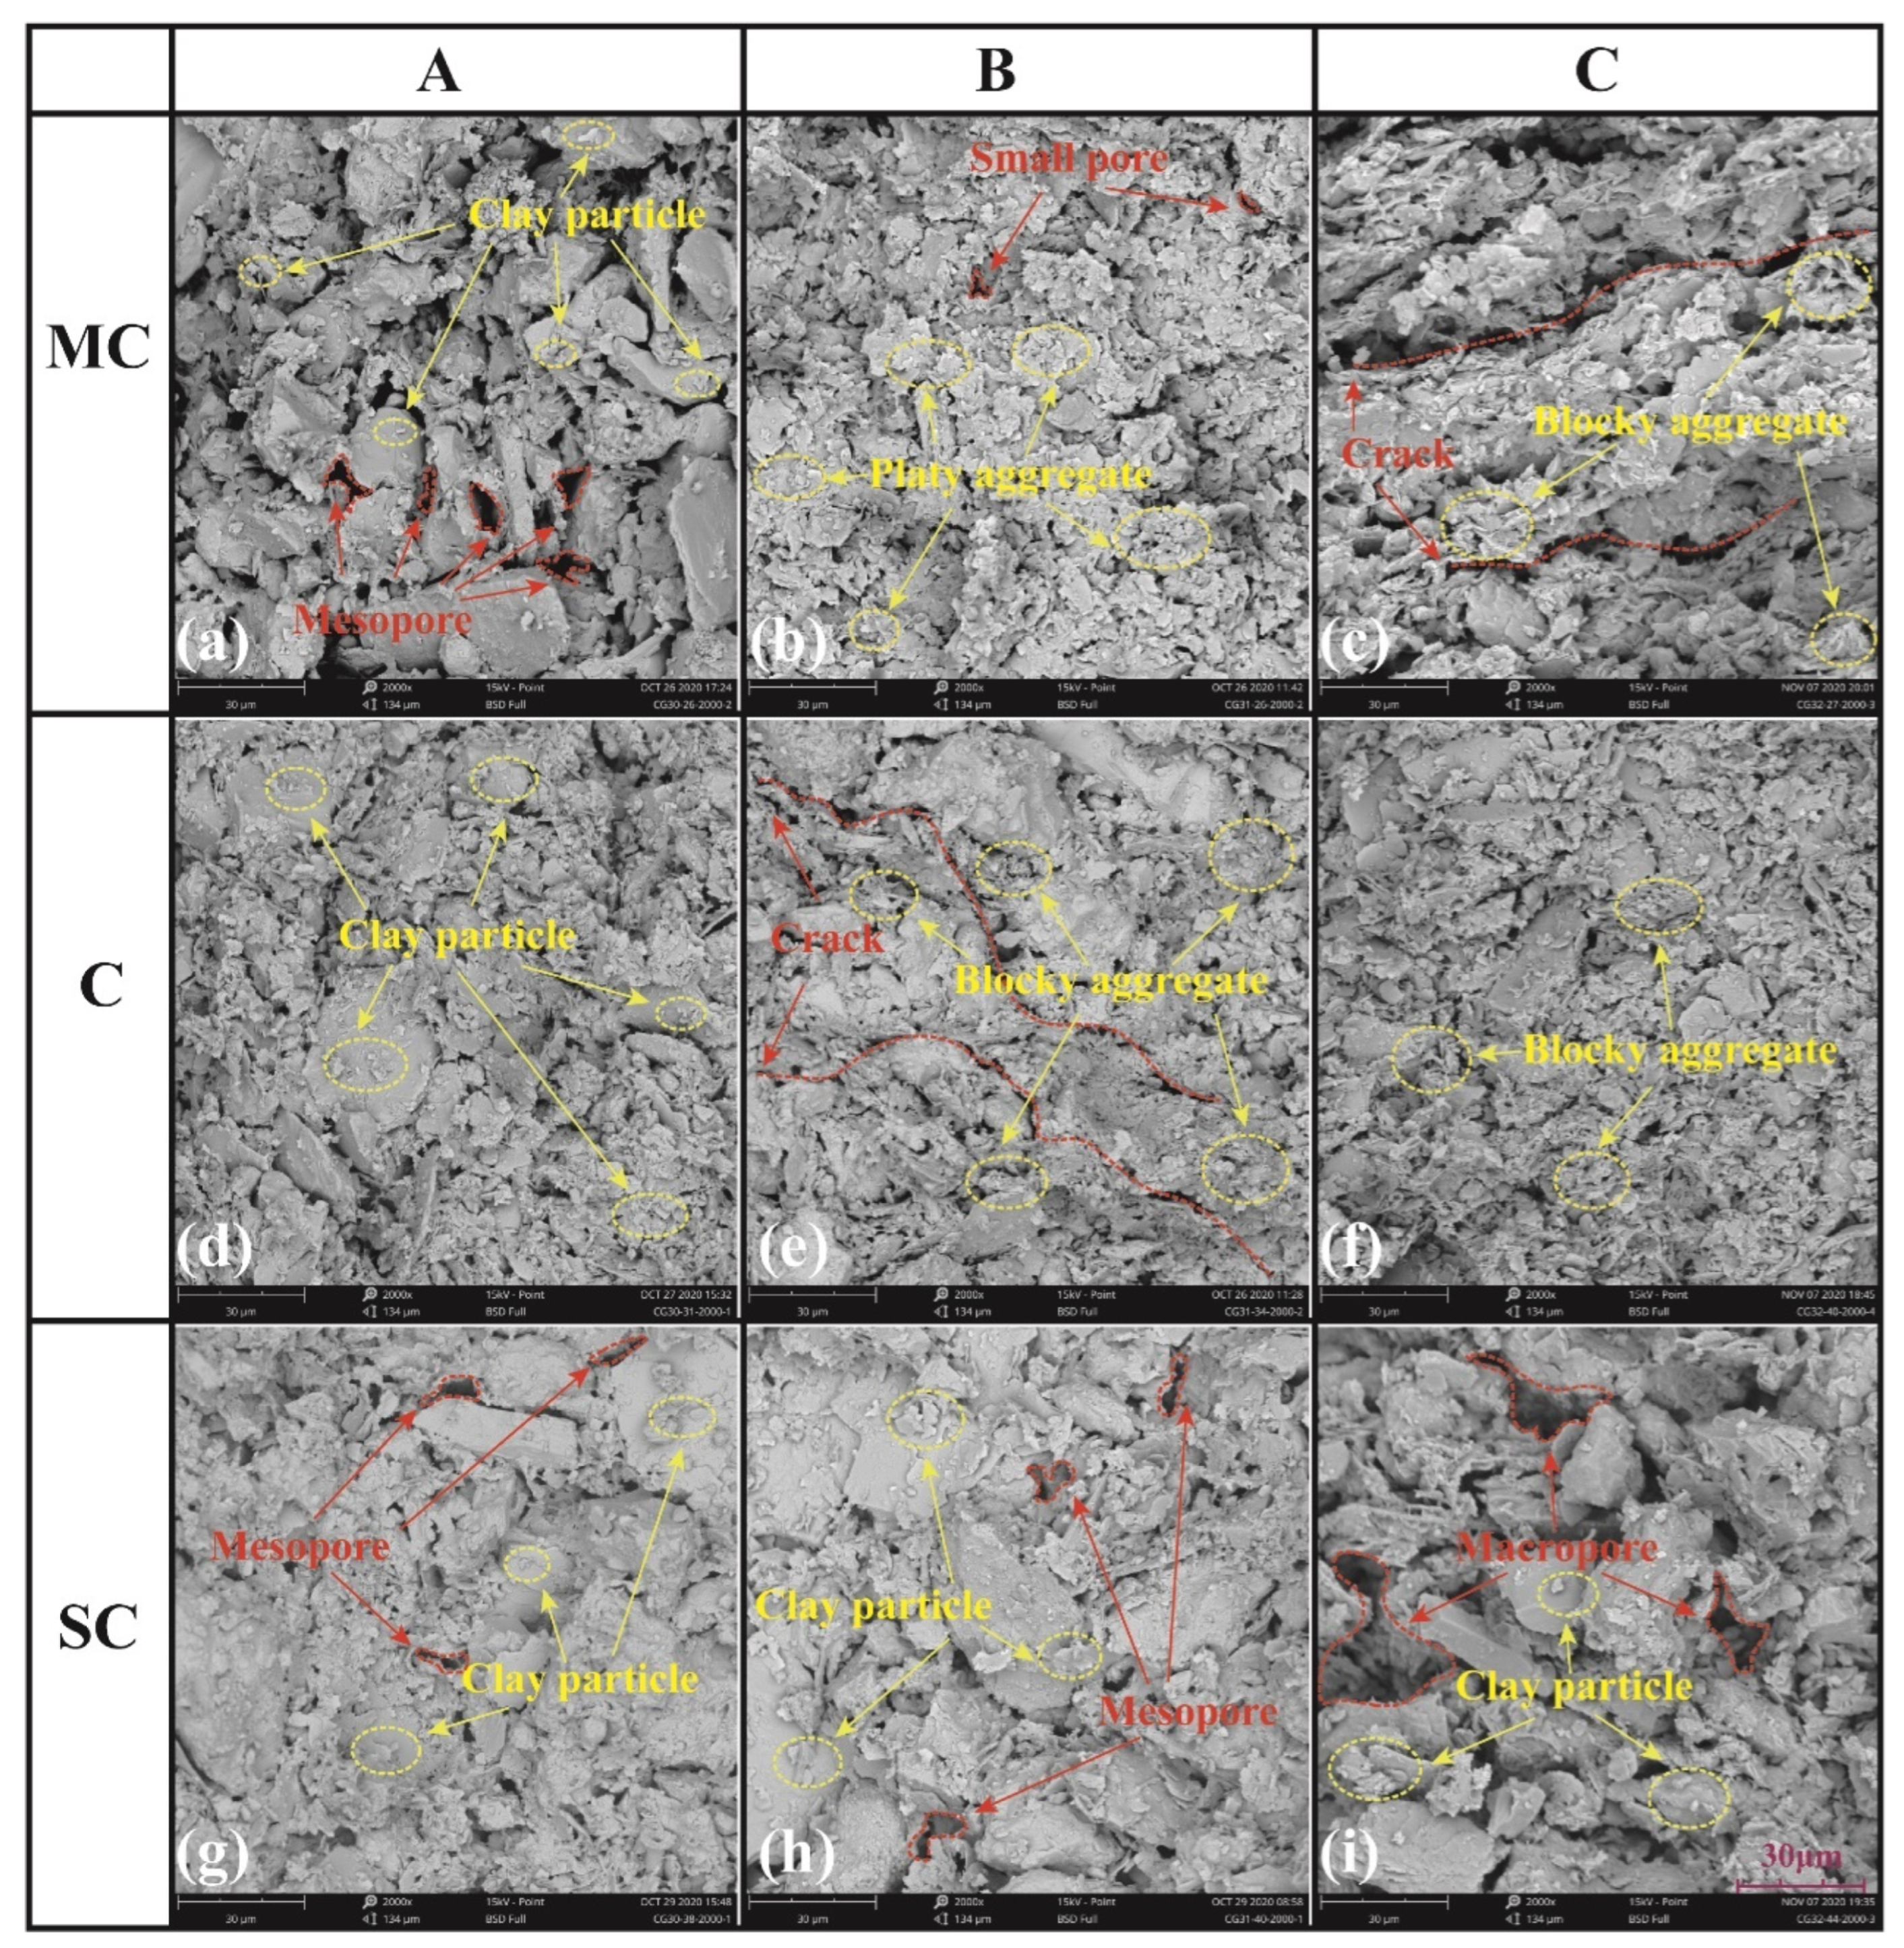
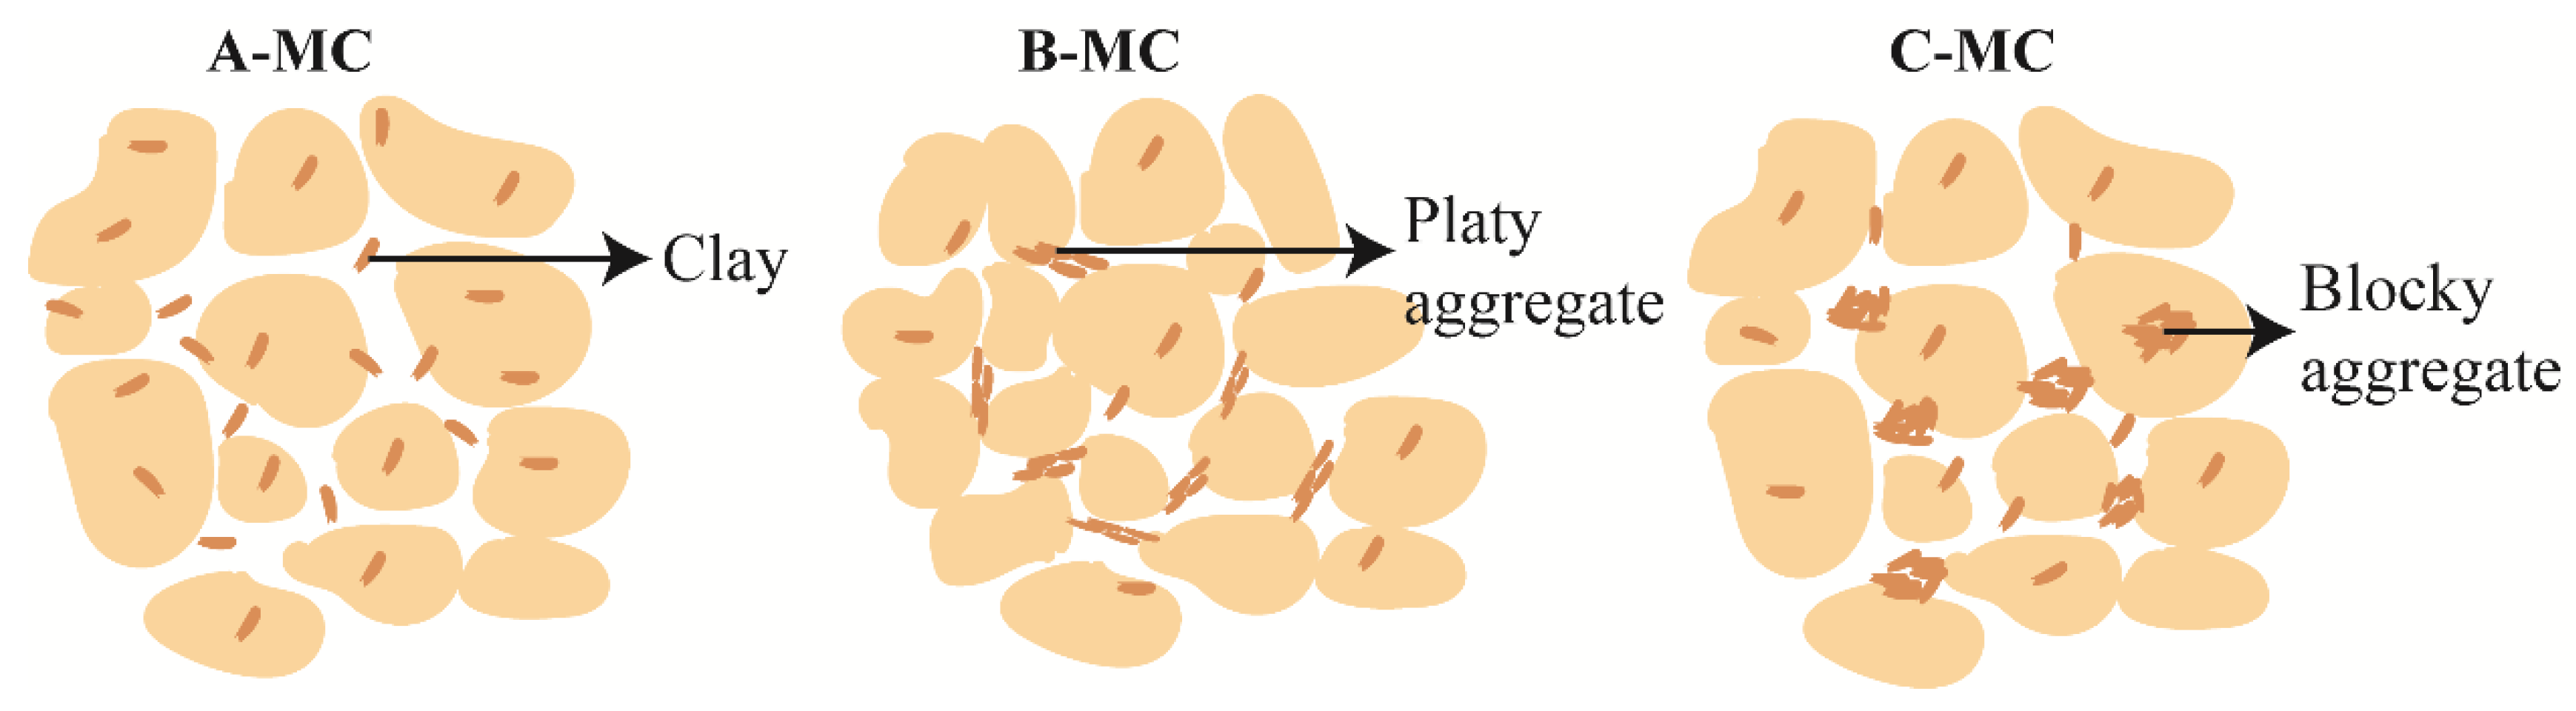
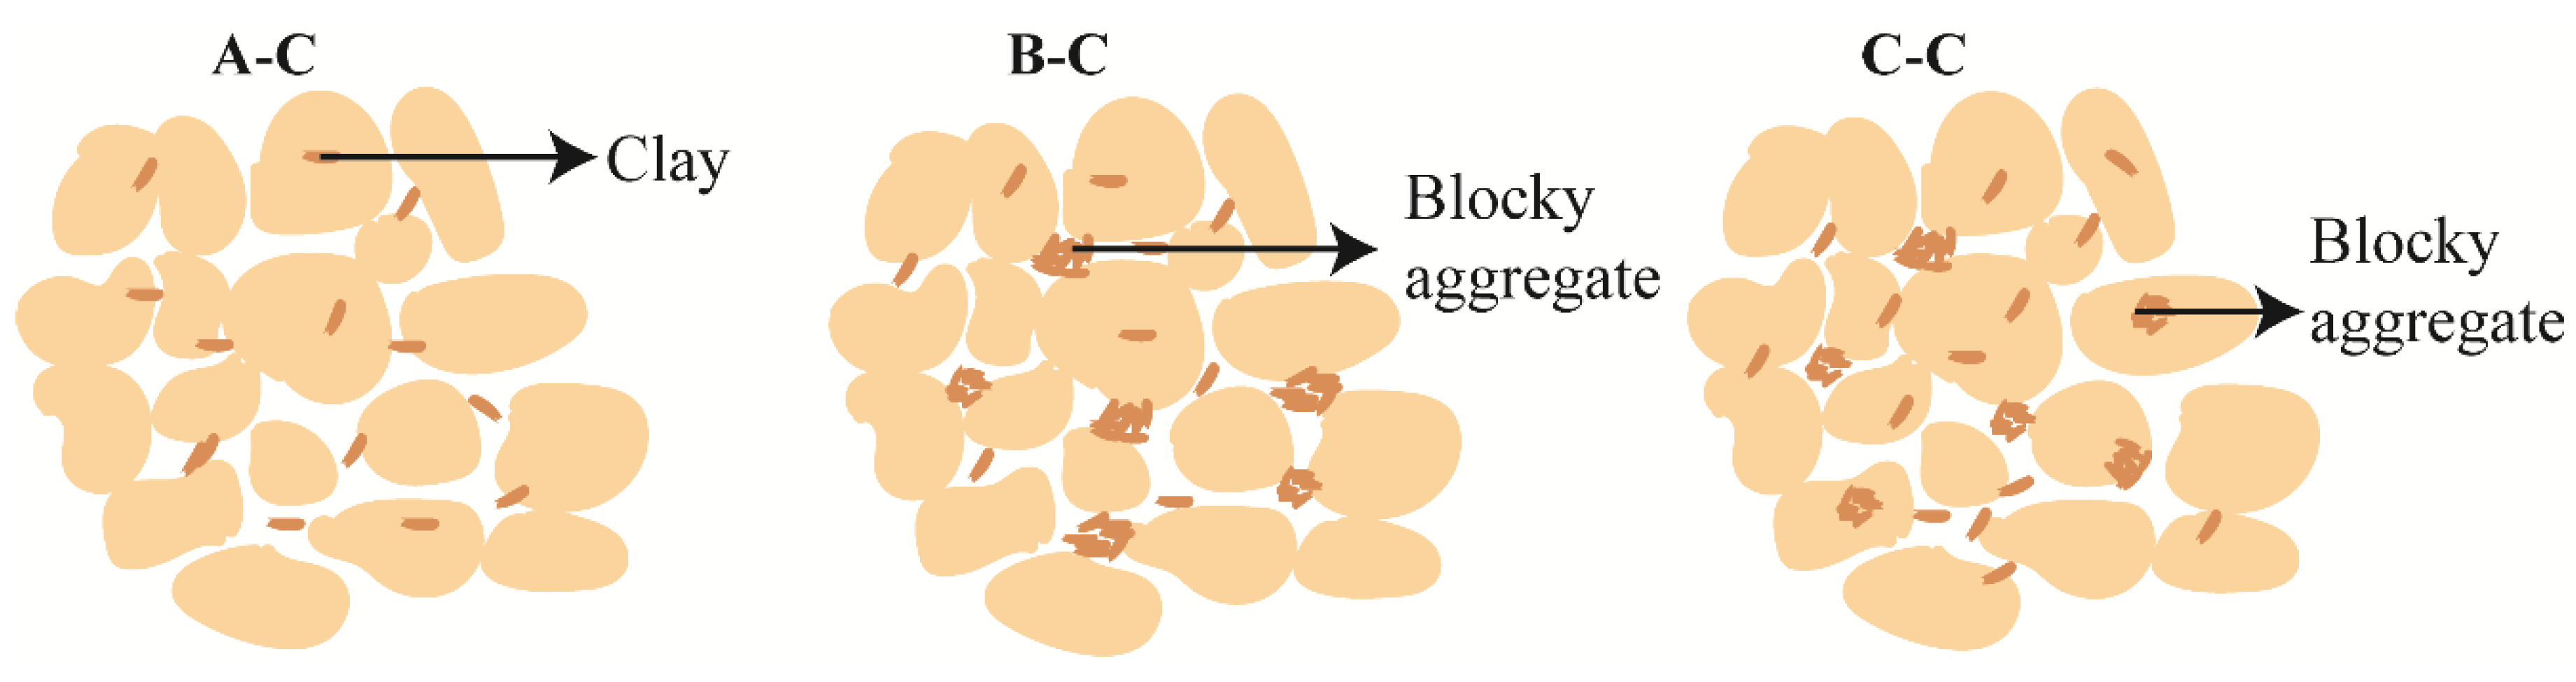
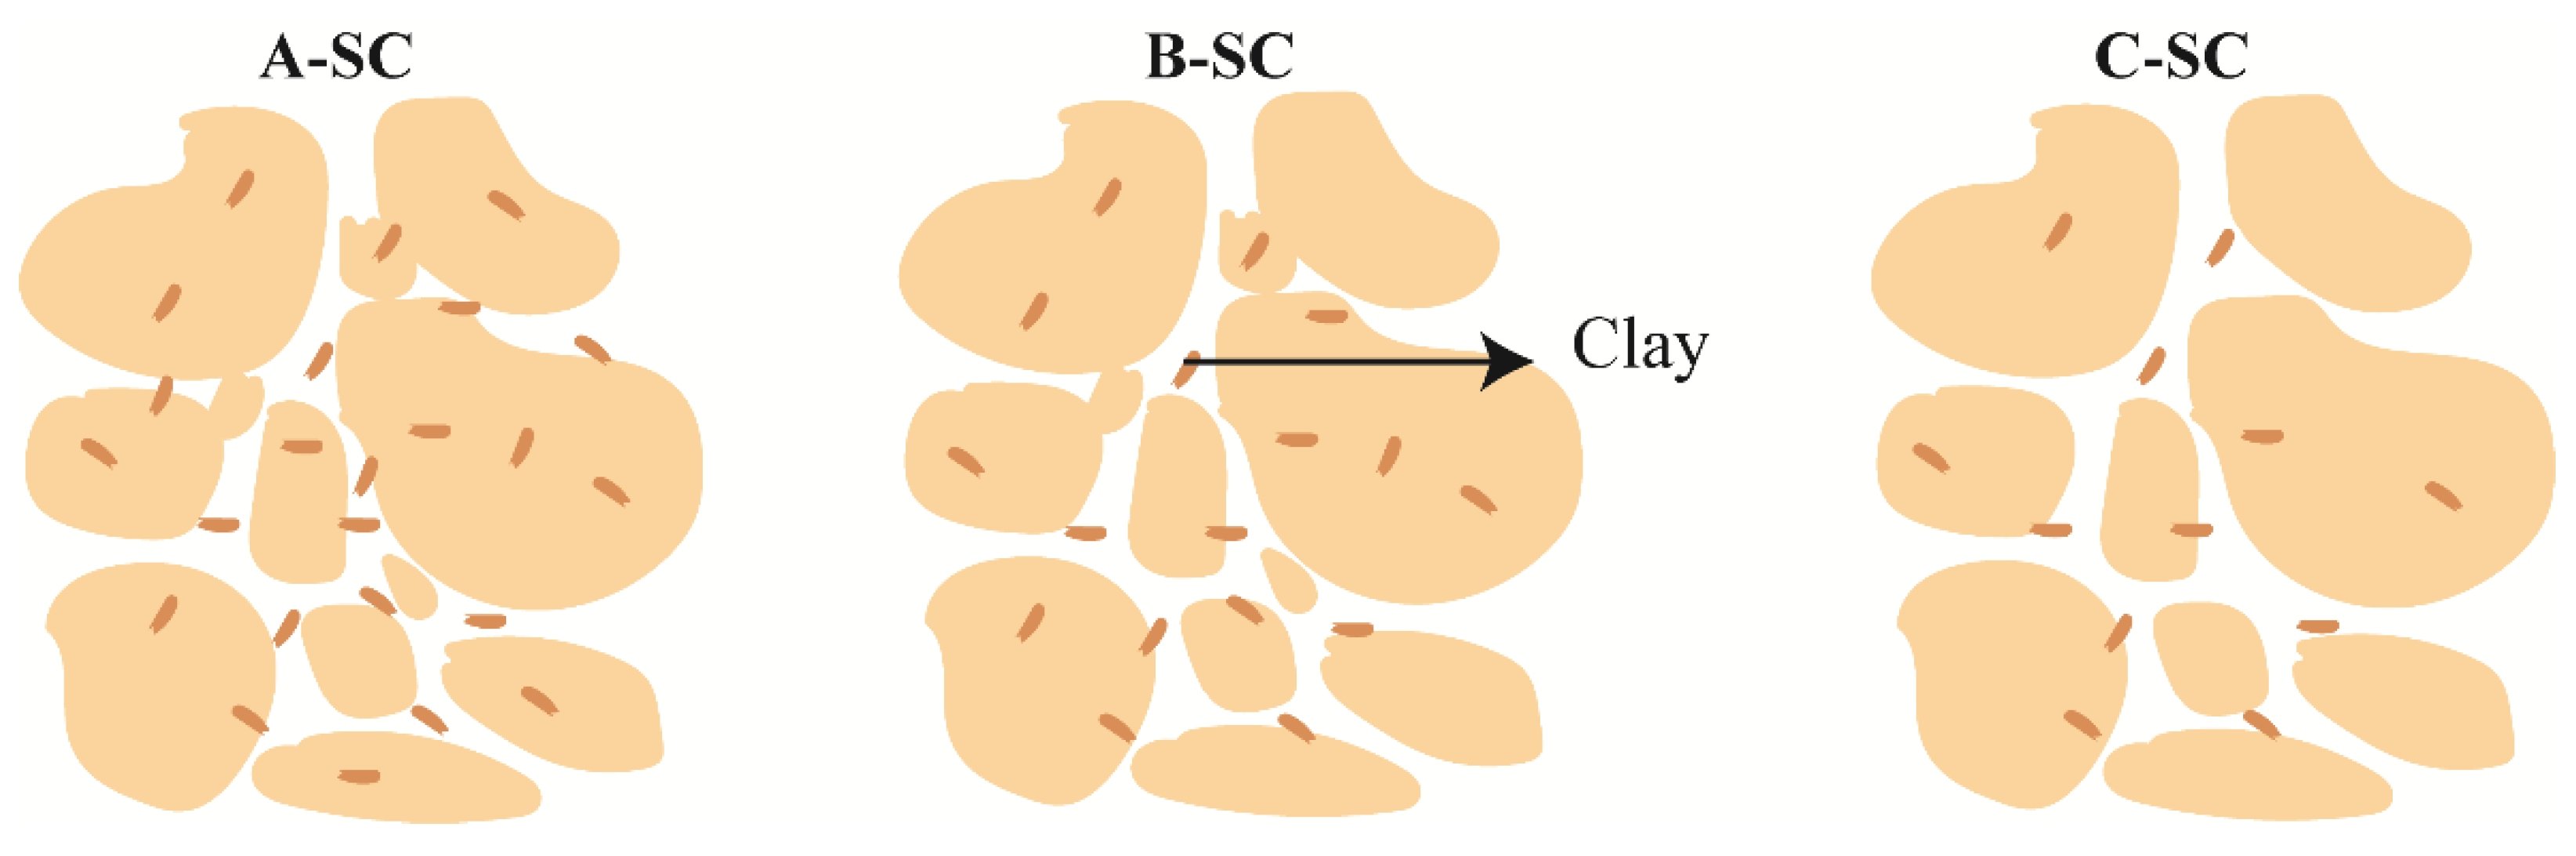
- The microstructure of the soil also has a certain effect on the bound water content. Larger pores lead to thicker bound water films, while smaller pores result in thinner films. For the same layer of soil with similar material composition, the dispersed arrangement of clay particles can adsorb more bound water, while the formation of clay aggregates will reduce the bound water content. Platy aggregates tend to adsorb more bound water compared to blocky aggregates.
- The properties of the soil also have a great influence on the bound water content. For the same layer of soil, the changing trends of organic matter content, soluble salt content, and cation exchange capacity are almost consistent with the changes in the bound water fraction. However, the cation exchange capacity and the bound water fraction in the mucky clay layer showed a negative correlation.
Author Contributions
Funding
Institutional Review Board Statement
Informed Consent Statement
Data Availability Statement
Acknowledgments
Conflicts of Interest
References
- Feng, W.-Q.; Zheng, X.-C.; Yin, J.-H.; Chen, W.-B.; Tan, D.-Y. Case study on long-term ground settlement of reclamation project on clay deposits in Nansha of China. Mar. Georesources Geotechnol. 2021, 39, 372–387. [Google Scholar] [CrossRef]
- Li, S.; Wang, C.; Guo, F.; Liu, X.; Han, S.; Gao, R. Effect of Bound Water Content on Secondary Compression of Three Marine Silty Clays. J. Mar. Sci. Eng. 2022, 10, 261. [Google Scholar] [CrossRef]
- Rao, S.N.; Panda, A.P. Non-linear analysis of undrained cyclic strength of soft marine clay. Ocean Eng. 1999, 26, 241–253. [Google Scholar]
- Rattan Lal, M.K.S. Principles of Soil Physics; CRC Press: New York, NY, USA, 2004. [Google Scholar] [CrossRef]
- Marshall, T.J.; Holmes, J.W.; Rose, C.W. Soil Physics; Cambridge University Press: London, UK, 1996. [Google Scholar]
- Wang, H.; Qian, H.; Gao, Y.; Li, Y. Classification and physical characteristics of bound water in loess and its main clay minerals. Eng. Geol. 2020, 265, 105394. [Google Scholar] [CrossRef]
- Yang, E.-J.; Zeng, Z.-T.; Mo, H.-Y.; Hu, T.; Yang, C.-L.; Tang, S.-H. Analysis of Bound Water and Its Influence Factors in Mixed Clayey Soils. Water 2021, 13, 2991. [Google Scholar] [CrossRef]
- Li, S.; Wang, C.; Zhang, X.; Zou, L.; Dai, Z. Classification and characterization of bound water in marine mucky silty clay. J. Soils Sediments 2019, 19, 2509–2519. [Google Scholar] [CrossRef]
- Yan-long, L.; Tie-hang, W.; Li-jun, S. Determination of Bound Water Content of Loess Soils by Isothermal Adsorption and Thermogravimetric Analysis. Soil Sci. 2015, 180, 90–96. [Google Scholar] [CrossRef]
- Low, P.F. Nature and Properties of Water in Montmorillonite-Water Systems. Soil Sci. Soc. Am. J. 1979, 43, 651–658. [Google Scholar] [CrossRef]
- Etzler, F.M. A statistical thermodynamic model for water near solid interfaces. J. Colloid Interface Sci. 1983, 92, 43–56. [Google Scholar] [CrossRef]
- Yamaguchi, S. On the Sensitivity of Clay. Bull. Disaster Prev. Res. Inst. Kyoto Univ. 1959, 28, 1–30. [Google Scholar]
- Wagner, N.; Scheuermann, A. On the relationship between matric potential and dielectric properties of organic free soils: A sensitivity study. Rev. Can. Géotech. 2009, 46, 1202–1215. [Google Scholar] [CrossRef]
- Escorihuela, M.J.; de Rosnay, P.; Kerr, Y.H.; Calvet, J.-C. Influence of Bound-Water Relaxation Frequency on Soil Moisture Measurements. IEEE Trans. Geosci. Remote Sens. 2007, 45, 4067–4076. [Google Scholar] [CrossRef]
- Zhang, S.; Pei, H. Determining the bound water content of montmorillonite from molecular simulations. Eng. Geol. 2021, 294, 106353. [Google Scholar] [CrossRef]
- Chai, M.; Zhang, J.; Zhang, H.; Mu, Y.; Sun, G.; Yin, Z. A method for calculating unfrozen water content of silty clay with consideration of freezing point. Appl. Clay Sci. 2018, 161, 474–481. [Google Scholar] [CrossRef]
- Wang, S.; Zhu, W.; Qian, X.; Xu, H.; Fan, X. Temperature effects on non-Darcy flow of compacted clay. Appl. Clay Sci. 2017, 135, 521–525. [Google Scholar] [CrossRef]
- Singh, P.N.; Wallender, W.W. Effects of adsorbed water layer in predicting saturated hydraulic conductivity for clays with Kozeny-Carman equation. J. Geotech. Geoenviron. Eng. 2008, 134, 829–836. [Google Scholar] [CrossRef]
- Ren, X.; Zhao, Y.; Deng, Q.; Kang, J.; Li, D.; Wang, D. A relation of hydraulic conductivity—Void ratio for soils based on Kozeny-Carman equation. Eng. Geol. 2016, 213, 89–97. [Google Scholar] [CrossRef]
- Zhu, W.; Zhang, C.L.; Chiu, A.C.F. Soil-water transfer mechanism for solidified dredged materials. J. Geotech. Geoenviron. Eng. 2007, 133, 588–598. [Google Scholar] [CrossRef]
- Ye, C.; Guo, Z.; Cai, C.; Wang, J.; Deng, J. Effect of water content, bulk density, and aggregate size on mechanical characteristics of Aquults soil blocks and aggregates from subtropical China. J. Soils Sediments 2016, 17, 210–219. [Google Scholar] [CrossRef]
- Yen, P.S.; Lee, D.J. Errors in bound water measurements using centrifugal settling method. Water Res. 2001, 35, 4004–4009. [Google Scholar] [CrossRef]
- Jin, B.; Wilen, B.M.; Lant, P. Impacts of morphological, physical and chemical properties of sludge flocs on dewaterability of activated sludge. Chem. Eng. J. 2004, 98, 115–126. [Google Scholar] [CrossRef]
- Liu, H.; Liu, P.; Hu, H.; Zhang, Q.; Wu, Z.; Yang, J.; Yao, H. Combined effects of Fenton peroxidation and CaO conditioning on sewage sludge thermal drying. Chemosphere 2014, 117, 559–566. [Google Scholar] [CrossRef] [PubMed]
- Logsdon, S.D.; Laird, D.A. Electrical conductivity spectra of smectites as influenced by saturating cation and humidity. Clays Clay Miner. 2004, 52, 411–420. [Google Scholar] [CrossRef]
- Lee, D.J. Interpretation of bound water data measured via dilatometric technique. Water Res. 1996, 30, 2230–2232. [Google Scholar] [CrossRef]
- Koopmans, R.W.R.; Miller, R.D. Soil Freezing and Soil Water Characteristic Curves. Soil Sci. Soc. Am. J. 1966, 30, 680–685. [Google Scholar] [CrossRef]
- Spaans, E.J.A.; Baker, J.M. Examining the use of time domain reflectometry for measuring liquid water content in frozen soil. Water Resour. Res. 1995, 31, 2917–2925. [Google Scholar] [CrossRef]
- Williams, P.J. Experimental Determination of Apparent Specific Heats of Frozen Soils. Geotechnique 1964, 14, 133–142. [Google Scholar] [CrossRef]
- He, D.-Q.; Zhang, Y.-J.; He, C.-S.; Yu, H.-Q. Changing profiles of bound water content and distribution in the activated sludge treatment by NaCl addition and pH modification. Chemosphere 2017, 186, 702–708. [Google Scholar] [CrossRef]
- Su, Z.; Tan, X.; Chen, W.; Jia, H.; Xu, F. A model of unfrozen water content in rock during freezing and thawing with experimental validation by nuclear magnetic resonance. J. Rock Mech. Geotech. Eng. 2022, 14, 1545–1555. [Google Scholar] [CrossRef]
- Kozlowski, T. A comprehensive method of determining the soil unfrozen water curves 2. Stages of the phase change process in frozen soil-water system. Cold Reg. Sci. Technol. 2003, 36, 81–92. [Google Scholar] [CrossRef]
- Zhou, X.; Zhou, J.; Kinzelbach, W.; Stauffer, F. Simultaneous measurement of unfrozen water content and ice content in frozen soil using gamma ray attenuation and TDR. Water Resour. Res. 2014, 50, 9630–9655. [Google Scholar] [CrossRef]
- Dirksen, C.; Dasberg, S. Improved Calibration of Time Domain Reflectometry Soil Water Content Measurements. Soil Sci. Soc. Am. J. 1993, 57, 660. [Google Scholar] [CrossRef]
- Osipov, V.I. Nanofilms of adsorbed water in clay: Mechanism of formation and properties. Water Resour. 2012, 39, 709–721. [Google Scholar] [CrossRef]
- Yuan, Y.; Rezaee, R.; Verrall, M.; Hu, S.-Y.; Zou, J.; Testmanti, N. Pore characterization and clay bound water assessment in shale with a combination of NMR and low-pressure nitrogen gas adsorption. Int. J. Coal Geol. 2018, 194, 11–21. [Google Scholar] [CrossRef]
- Kong, L.; Wang, Y.; Sun, W.; Qi, J. Influence of plasticity on unfrozen water content of frozen soils as determined by nuclear magnetic resonance. Cold Reg. Sci. Technol. 2020, 172, 102993. [Google Scholar] [CrossRef]
- Tian, H.; Wei, C.; Lai, Y.; Chen, P. Quantification of Water Content during Freeze–Thaw Cycles: A Nuclear Magnetic Resonance Based Method. Vadose Zone J. 2018, 17, 160124. [Google Scholar] [CrossRef]
- Wang, Y.; Lu, S.; Ren, T.; Li, B. Bound Water Content of Air-Dry Soils Measured by Thermal Analysis. Soil Sci. Soc. Am. J. 2011, 75, 481–487. [Google Scholar] [CrossRef]
- Zhang, M.; Pei, W.; Li, S.; Lu, J.; Jin, L. Experimental and numerical analyses of the thermo-mechanical stability of an embankment with shady and sunny slopes in a permafrost region. Appl. Therm. Eng. 2017, 127, 1478–1487. [Google Scholar] [CrossRef]
- Kozlowski, T. A semi-empirical model for phase composition of water in clay-water systems. Cold Reg. Sci. Technol. 2007, 49, 226–236. [Google Scholar] [CrossRef]
- Anderson, D.M.; Tice, A.R. Predicting unfrozen water contents in frozen soils from surface area measurements. Highw. Res. Rec. 1972, 393, 12–18. [Google Scholar]
- McKenzie, J.M.; Voss, C.I.; Siegel, D.I. Groundwater flow with energy transport and water-ice phase change: Numerical simulations, benchmarks, and application to freezing in peat bogs. Adv. Water Resour. 2007, 30, 966–983. [Google Scholar] [CrossRef]
- Xiao, Z.; Lai, Y.M.; Zhang, J. A thermodynamic model for calculating the unfrozen water content of frozen soil. Cold Reg. Sci. Technol. 2020, 172, 103011. [Google Scholar] [CrossRef]
- Yang, G.C.; Bai, B. A thermodynamic model to simulate the thermo-mechanical behavior of fine-grained gassy soil. Bull. Eng. Geol. Environ. 2020, 79, 2325–2339. [Google Scholar] [CrossRef]
- Li, K.Y.; Wang, C.; Wu, Y.M.; Lin, Z.K.; Ren, J.P.; Gao, J.; Li, S.Y. Study on the supercooling and crystallization mechanism of saline soil based on thermodynamic framework. J. Hydrol. 2024, 628, 130451. [Google Scholar] [CrossRef]
- Chen, Y.; Zhou, Z.; Wang, J.; Zhao, Y.; Dou, Z. Quantification and division of unfrozen water content during the freezing process and the influence of soil properties by low-field nuclear magnetic resonance. J. Hydrol. 2021, 602, 126719. [Google Scholar] [CrossRef]
- Cowan, B. Nuclear Magnetic Resonance and Relaxation; Cambridge University Press: Cambridge, UK, 1997. [Google Scholar]
- Lv, Z. Study on the Characteristics of Bound Water and Secondary Consolidation of Cohesive Soil in the Southeast of Chongming Island. Master’s Thesis, Jilin University, Changchun, China, 2022. [Google Scholar]
- Dastidar, R. Nuclear Magnetic Resonance (NMR) Study of Freezing and Thawing of Saturated Porous Media and Application to Shale and Pore Volume Compressibility Estimation. Ph.D. Thesis, The University of Oklahoma, Norman, OK, USA, 2007. [Google Scholar]
- Bayer, J.V.; Jaeger, F.; Schaumann, G.E. Proton Nuclear Magnetic Resonance (NMR) Relaxometry in Soil Science Applications. Open Magn. Reson. J. 2010, 3, 15–26. [Google Scholar] [CrossRef]
- Bird, N.R.A.; Preston, A.R.; Randall, E.W.; Whalley, W.R.; Whitmore, A.P. Measurement of the size distribution of water-filled pores at different matric potentials by stray field nuclear magnetic resonance. Eur. J. Soil Sci. 2005, 56, 135–143. [Google Scholar] [CrossRef]
- Jaeger, F.; Shchegolikhina, A.; As, H.V.; Schaumann, G.E. Proton NMR Relaxometry as a Useful Tool to Evaluate Swelling Processes in Peat Soils. Open Magn. Reson. J. 2010, 3, 27–45. [Google Scholar] [CrossRef]
- Zhou, J.; Zhou, H.D. Quantitative Analysis of Unfrozen Water Content of Muddy Clay Under Extremely Low Temperature Freezing Conditions. In Proceedings of the 20th International Conference on Cold Regions Engineering (ICCRE), Univ Alaska Anchorage, Coll Engn, Anchorage, AK, USA, 13–16 May 2024; pp. 79–93. [Google Scholar]
- An, R.; Gao, H.D.; Chen, C.; Zhang, X.W. Quantification and division of unfrozen water content of frozen soils during freezing and the influence of freeze-thaw cycles. Bull. Eng. Geol. Environ. 2024, 83, 440. [Google Scholar] [CrossRef]
- Jaeger, F.; Bowe, S.; Van As, H.; Schaumann, G.E. Evaluation of 1H NMR relaxometry for the assessment of pore-size distribution in soil samples. Eur. J. Soil Sci. 2009, 60, 1052–1064. [Google Scholar] [CrossRef]
- Pajzderska, A.; Gonzalez, M.A.; Mielcarek, J.; Wąsicki, J. Water Behavior in MCM-41 As a Function of Pore Filling and Temperature Studied by NMR and Molecular Dynamics Simulations. J. Phys. Chem. C 2014, 118, 23701–23710. [Google Scholar] [CrossRef]
- Kiwilsza, A.; Pajzderska, A.; Gonzalez, M.A.; Mielcarek, J.; Wąsicki, J. QENS and NMR Study of Water Dynamics in SBA-15 with a Low Water Content. J. Phys. Chem. C 2015, 119, 16578–16586. [Google Scholar] [CrossRef]
- Han, Y.; Wang, Q.; Kong, Y.; Cheng, S.; Wang, J.; Zhang, X.; Wang, N. Experiments on the initial freezing point of dispersive saline soil. CATENA 2018, 171, 681–690. [Google Scholar] [CrossRef]
- Zhang, S.Q.; Pei, H.F.; Ploetze, M.; Zhang, C.; Tan, D.Y. Investigation of Bound Water in Clay Based on Isothermal Adsorption Experiments and Metadynamics Studies from the Perspective of Water Potential. J. Geotech. Geoenviron. Eng. 2024, 150, 04024113. [Google Scholar] [CrossRef]
- Han, M.; Peng, W.; Ma, B.; Yu, Q.; Kasama, K.; Furukawa, Z.; Niu, C.; Wang, Q. Micro–composition evolution of the undisturbed saline soil undergoing different freeze–thaw cycles. Cold Reg. Sci. Technol. 2023, 210, 103825. [Google Scholar] [CrossRef]
- Mitchell, J.K. Fundamentals of soil behavior. Soil Sci. Soc. Am. J. 1976, 40, 827–866. [Google Scholar]
- Shen, J.; Wang, Q.; Chen, Y.; Han, Y.; Zhang, X.; Liu, Y. Evolution process of the microstructure of saline soil with different compaction degrees during freeze-thaw cycles. Eng. Geol. 2022, 304, 106699. [Google Scholar] [CrossRef]
- Keller, G.H. Organic matter and the geotechnical properties of submarine sediments. Geo-Mar. Lett. 1982, 2, 191–198. [Google Scholar] [CrossRef]
- Zhang, S.; Zhang, J.; Gui, Y.; Chen, W.; Dai, Z. Deformation properties of coarse-grained sulfate saline soil under the freeze-thaw-precipitation cycle. Cold Reg. Sci. Technol. 2020, 177, 103121. [Google Scholar] [CrossRef]


| Soil Type | Sampling Site A | Sampling Site B | Sampling Site C |
|---|---|---|---|
| Mucky clay | A-MC | B-MC | C-MC |
| Clay | A-C | B-C | C-C |
| Silty clay | A-SC | B-SC | C-SC |
| Soil Type | Water Content (%) | Density (g/cm3) | Liquid Limit (%) | Plasticity Limit (%) | Total Soluble Salts (g/kg) | Cation Exchange Capacity (mmol/100 g) |
|---|---|---|---|---|---|---|
| A-MC | 40.81 | 1.83 | 40 | 21 | 0.957 | 15.63 |
| A-C | 46.63 | 1.78 | 58 | 30 | 1.469 | 29.49 |
| A-SC | 37.93 | 1.82 | 44 | 23 | 0.940 | 13.51 |
| B-MC | 45.88 | 1.77 | 49 | 32 | 1.046 | 28.96 |
| B-C | 39.22 | 1.83 | 44 | 24 | 1.399 | 20.05 |
| B-SC | 29.18 | 2.05 | 31 | 23 | 0.850 | 10.99 |
| C-MC | 43.28 | 1.75 | 51 | 29 | 0.840 | 30.06 |
| C-C | 41.78 | 1.80 | 48 | 25 | 1.236 | 20.01 |
| C-SC | 31.30 | 1.80 | 26 | 21 | 0.800 | 11.14 |
| Sampling Site A | Sampling Site B | Sampling Site C | |||||||
|---|---|---|---|---|---|---|---|---|---|
| A-MC | A-C | A-SC | B-MC | B-C | B-SC | C-MC | C-C | C-SC | |
| Clay content (%) | 34.29 | 21.48 | 17.92 | 29.15 | 27.43 | 16.71 | 31.85 | 30.23 | 12.44 |
Disclaimer/Publisher’s Note: The statements, opinions and data contained in all publications are solely those of the individual author(s) and contributor(s) and not of MDPI and/or the editor(s). MDPI and/or the editor(s) disclaim responsibility for any injury to people or property resulting from any ideas, methods, instructions or products referred to in the content. |
© 2025 by the authors. Licensee MDPI, Basel, Switzerland. This article is an open access article distributed under the terms and conditions of the Creative Commons Attribution (CC BY) license (https://creativecommons.org/licenses/by/4.0/).
Share and Cite
Shan, X.; Chen, H.; Meng, C.; Lv, Z.; Yu, Q.; Wang, Z.; Wang, Q. Quantitative Analysis of Bound Water Content in Marine Clay and Its Influencing Factors During the Freezing Process by Nuclear Magnetic Resonance. J. Mar. Sci. Eng. 2025, 13, 546. https://doi.org/10.3390/jmse13030546
Shan X, Chen H, Meng C, Lv Z, Yu Q, Wang Z, Wang Q. Quantitative Analysis of Bound Water Content in Marine Clay and Its Influencing Factors During the Freezing Process by Nuclear Magnetic Resonance. Journal of Marine Science and Engineering. 2025; 13(3):546. https://doi.org/10.3390/jmse13030546
Chicago/Turabian StyleShan, Xuehan, Huie Chen, Chuqiao Meng, Zuojun Lv, Qingbo Yu, Zhaoxi Wang, and Qing Wang. 2025. "Quantitative Analysis of Bound Water Content in Marine Clay and Its Influencing Factors During the Freezing Process by Nuclear Magnetic Resonance" Journal of Marine Science and Engineering 13, no. 3: 546. https://doi.org/10.3390/jmse13030546
APA StyleShan, X., Chen, H., Meng, C., Lv, Z., Yu, Q., Wang, Z., & Wang, Q. (2025). Quantitative Analysis of Bound Water Content in Marine Clay and Its Influencing Factors During the Freezing Process by Nuclear Magnetic Resonance. Journal of Marine Science and Engineering, 13(3), 546. https://doi.org/10.3390/jmse13030546