1. Introduction
The underwater glider has emerged as an indispensable tool in marine observation and detection [
1]. Due to its ability to move exclusively in water at relatively low speeds, underwater gliders equipped with acoustic sensors have been regarded as optimal platforms because of their significantly reduced hydrodynamic noise [
2]. However, the operation of underwater gliders involves diving and climbing through adjustments in the oil volume within the bladder, as well as attitude changes achieved via the translation and rotation of the battery pack or mass block [
3]. Consequently, vibrations induced by mechanical excitation constitute the primary source of radiation noise in gliders. The investigation of the vibroacoustic response of underwater gliders under mechanical sources can provide valuable insights for evaluating and controlling their acoustic performance.
The concept of underwater gliders was first proposed by Stommel. Since then, many types of underwater gliders have been used for marine observation and exploration, serving scientific applications such as monitoring ocean mesoscale eddies, tracking underwater objects, conducting underwater archaeology, studying internal waves, and measuring turbulent dissipation. Significant technological advancements have driven the development of commercially available underwater gliders, with research efforts focusing on hydrodynamic characterization, nonlinear dynamic modeling, material selection, path planning algorithms, and fleet management [
4,
5,
6,
7].
The traditional design of an underwater glider typically comprises a streamlined body shell, wings, and stabilizers. The streamlined body mainly influences the glider’s drag force, while the wings, as the main component generating lift force, play a critical role in determining motion performance [
8,
9]. Notable examples include the Slocum, Spray, Seaglider, and Petrel, performing zigzag motion as the main operation mode. Breaking the shape of traditional underwater gliders, a disc-type glider was designed for virtual mooring [
10]. When external disturbances cause the vehicle to deviate from its target position, it is designed to autonomously return to the original position. The shape of the disc-type glider is axisymmetric, and it does not have any appendages, such as propellers and rudders. By adjusting the mass center of the glider, it can glide in any direction around the disk. In other words, the disc-type underwater glider has greater maneuverability than the traditional one [
11].
As a fundamental structural component, thin-walled shells have been extensively utilized across various engineering fields, including civil engineering, aerospace, chemical engineering, shipbuilding, and underwater vehicles [
12]. Early research on the dynamic characteristics concentrates on infinitely long cylindrical shells in a vacuum or air, taking no account of the fluid loading. When fluid loads act on a shell, they induce vibrations, that, in turn, generate sound radiation into the water. This sound pressure can subsequently act on the elastic shell, altering its vibrational behavior. As a result, structural vibration and acoustic radiation are inherently coupled phenomena. Regarding acoustic-structural coupling effects, previous studies have mainly focused on fully submerged shells. These systems have been investigated using a variety of methods, including analytical methods [
13], wave-propagation methods [
14], the finite element method (FEM) [
15], the boundary element method (BEM) [
16], and experimental methods [
17,
18]. Recent research has focused on more complex structures, including ring-stiffened cylindrical shells, resonant-coated cylindrical shells, and doubly curved shells [
19,
20,
21].
The water entry process is accessed after the underwater glider is deployed from research vessels; therefore, the impact of the water surface on the structure’s vibroacoustic response cannot be ignored. The cases of semi-submerged and partially immersed cylindrical shells with a flat and static-free surface have gradually aroused the interest of scholars [
22]. An analytical form of the vibro-acoustic coupling equation is developed using the wavenumber transformation and separation of variables for the sound pressure, along with mode expansion for the shell’s motion. Then the far-field radiation sound pressure and the radial vibration velocity derived from this equation are compared with experimental results for a half-submerged shell in water. Due to the wet surface area varying with immersion depth, and the sound pressure can no longer be separated in the cylindrical coordinate system when the shell’s centerline is positioned above or below the free surface, it is more challenging to build an analytical model for a partially submerged cylindrical shell. To address the non-coplanar characteristics between the free surface and the shell’s centerline, an effective approach to studying the influence of immersion depth on the vibroacoustic response of a submerged cylindrical shell is the image method. In this method, the acoustic pressure at a receiver location is calculated as the superposition of sound waves from the submerged shell and its virtual image above the free surface [
20]. Alternatively, the acoustic-structure coupling can be derived using the Galerkin method, which is particularly effective for handling the continuity conditions at the fluid-structure interaction interface [
23].
Previous research on underwater gliders has predominantly neglected the impact of mechanical vibrations on the acoustic performance of onboard sensors. Additionally, studies on vibroacoustic coupling have mainly focused on regular structures, such as cylindrical shells, with limited attention given to irregular structures like disc-type configurations and their associated coupling characteristics. The effects of acoustic-structure coupling and the free surface on the vibrational performance of a disc-type glider are discussed by FEM in the present work. The simulations begin with convergence tests for a cylindrical shell’s eigenfrequency in vacuo. The coupled modes and eigenfrequencies are compared with experimental or analytical solutions under three conditions: half-filled, half-submerged and partially submerged in fluid. The numerical solution agrees well with the verification data. Then the frequency–depth spectra of the sound pressure radiated from a partially immersed disc-type glider are obtained. The investigation of the vibroacoustic response of underwater gliders under mechanical excitation provides critical insights for evaluating and controlling their acoustic performance.
2. Dynamic Characteristics of Cylindrical Shells for Validation
The cylindrical shell’s vibrational characteristics have been introduced by various authors. The analytical and experimental results provide a comprehensive database to evaluate our numerical models based on FEM [
18,
24]. The shell’s dimensions and material properties for simulations are listed in
Table 1. Two steel plates of the example shell, each with a thickness of 0.4 mm, were welded to both ends of the shell, approximating a simply supported boundary condition. All simulations are performed using COMSOL Multiphysics v6.3.
2.1. The Mathematical Formulation
The shell’s motion is governed by
where
M,
C,
K is the mass, damping, stiffness matrix, which contains the geometrical dimensions of the shell, the shell’s density ρs, the Young’s modulus E, and the Poisson ratio σ.
F is the external force, and
U is the displacement vector. The undamped eigenvalue problem is commonly written as
where ω = 2π
f is the angular frequency.
The sound propagation is governed by
where
p is the pressure sound and
c is the sound speed in the fluid. The acoustic-structure coupling includes the fluid load on the structure and the structural acceleration as experienced by the fluid. The mathematical formulation on the coupling boundary condition is expressed as
where
Utt is the structural acceleration,
n is the surface normal, and
FA is the load (force per unit area) experienced by the structure. The sound soft boundary sets the sound pressure
p = 0 at the liquid-gas interface.
2.2. Convergence Tests for Natural Frequencies in Vacuo
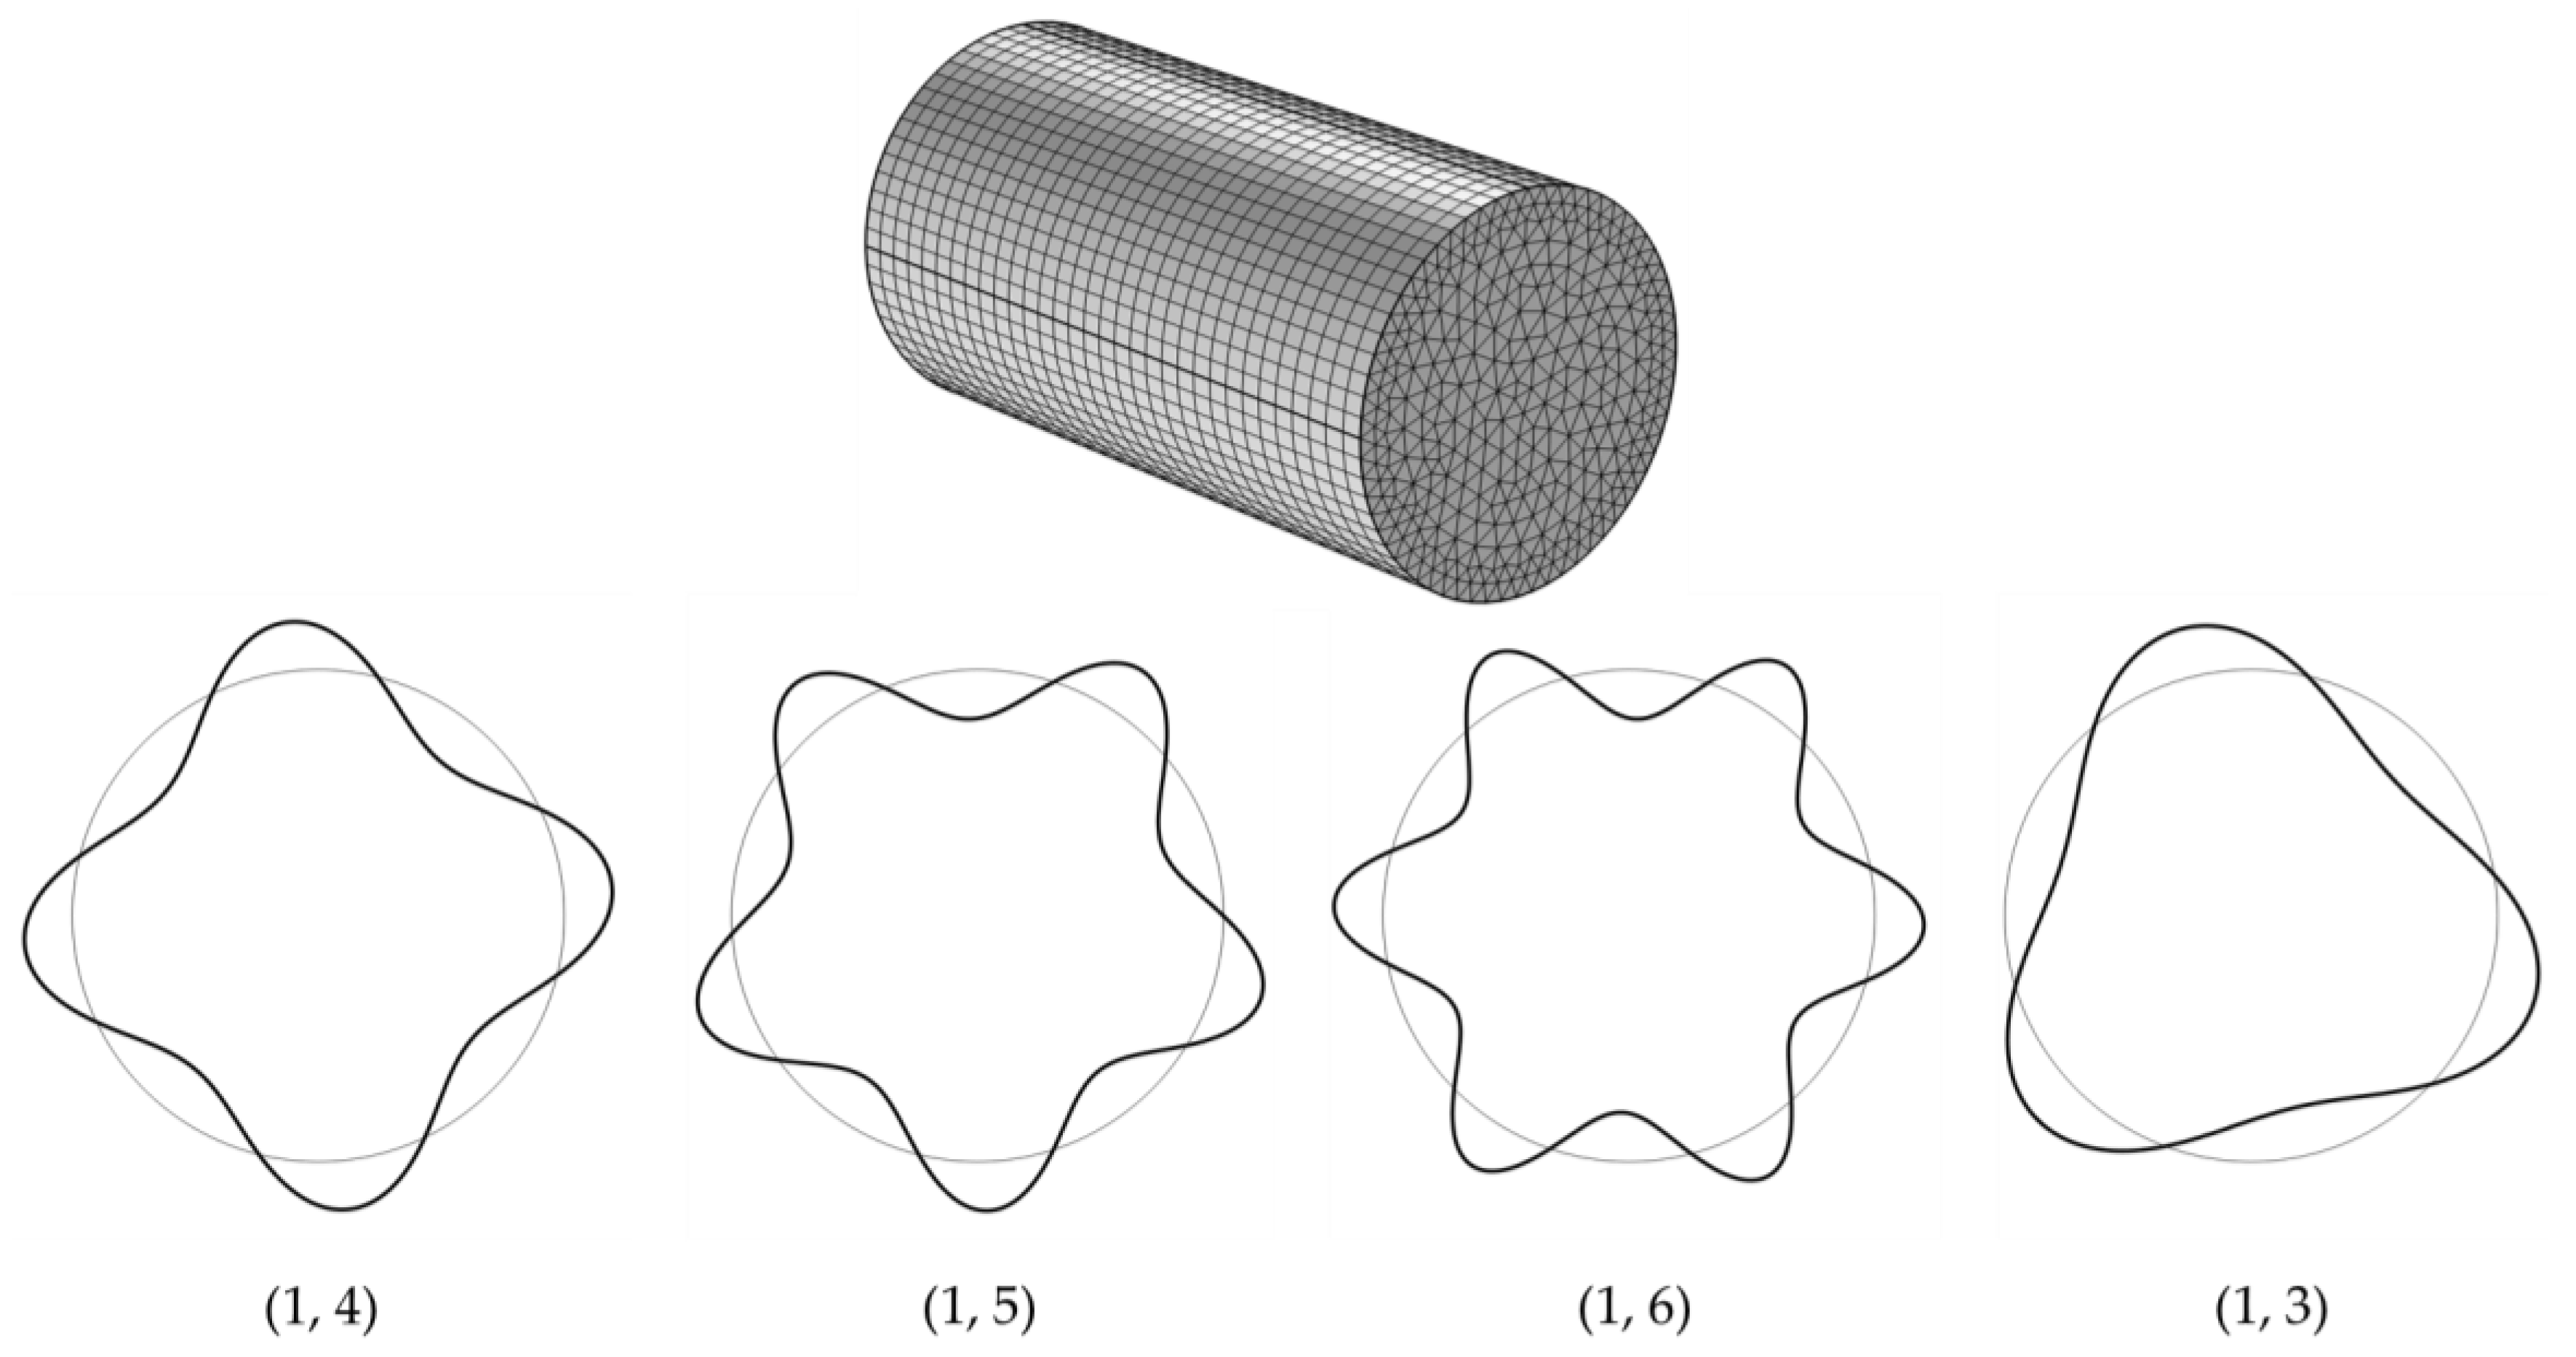
The thin cylindrical shell is discretized with four-node quadrilateral elements, and the two steel plates at both ends are discretized with three-node triangular elements. To test the convergence of the empty structure in vacuo, the initial mesh configuration consists of 16 equally spaced elements around the circumference and 16 equally spaced elements along the length of the shell, denoted as 16 × 16. The mesh density is subsequently increased to 32 × 32, and the final configuration is set to 64 × 32.
The derived eigenfrequency using COMSOL’s Shell Module is compared with analytical results for the first eight vibrational modes, as shown in
Table 2. The differences between the results indicate that the FEM-derived values converge gradually as the number of elements increases. The final mesh configuration (64 × 32) was adopted due to its good agreement with the analytical calculations, ensuring the accuracy of the numerical model.
The mesh and mode shapes of the shell are illustrated in
Figure 1, where the notation (m, n) represents the mode order, with m denoting the axial order and n denoting the circumferential order. It is important to note that the circumferential order n does not necessarily follow a sequential pattern.
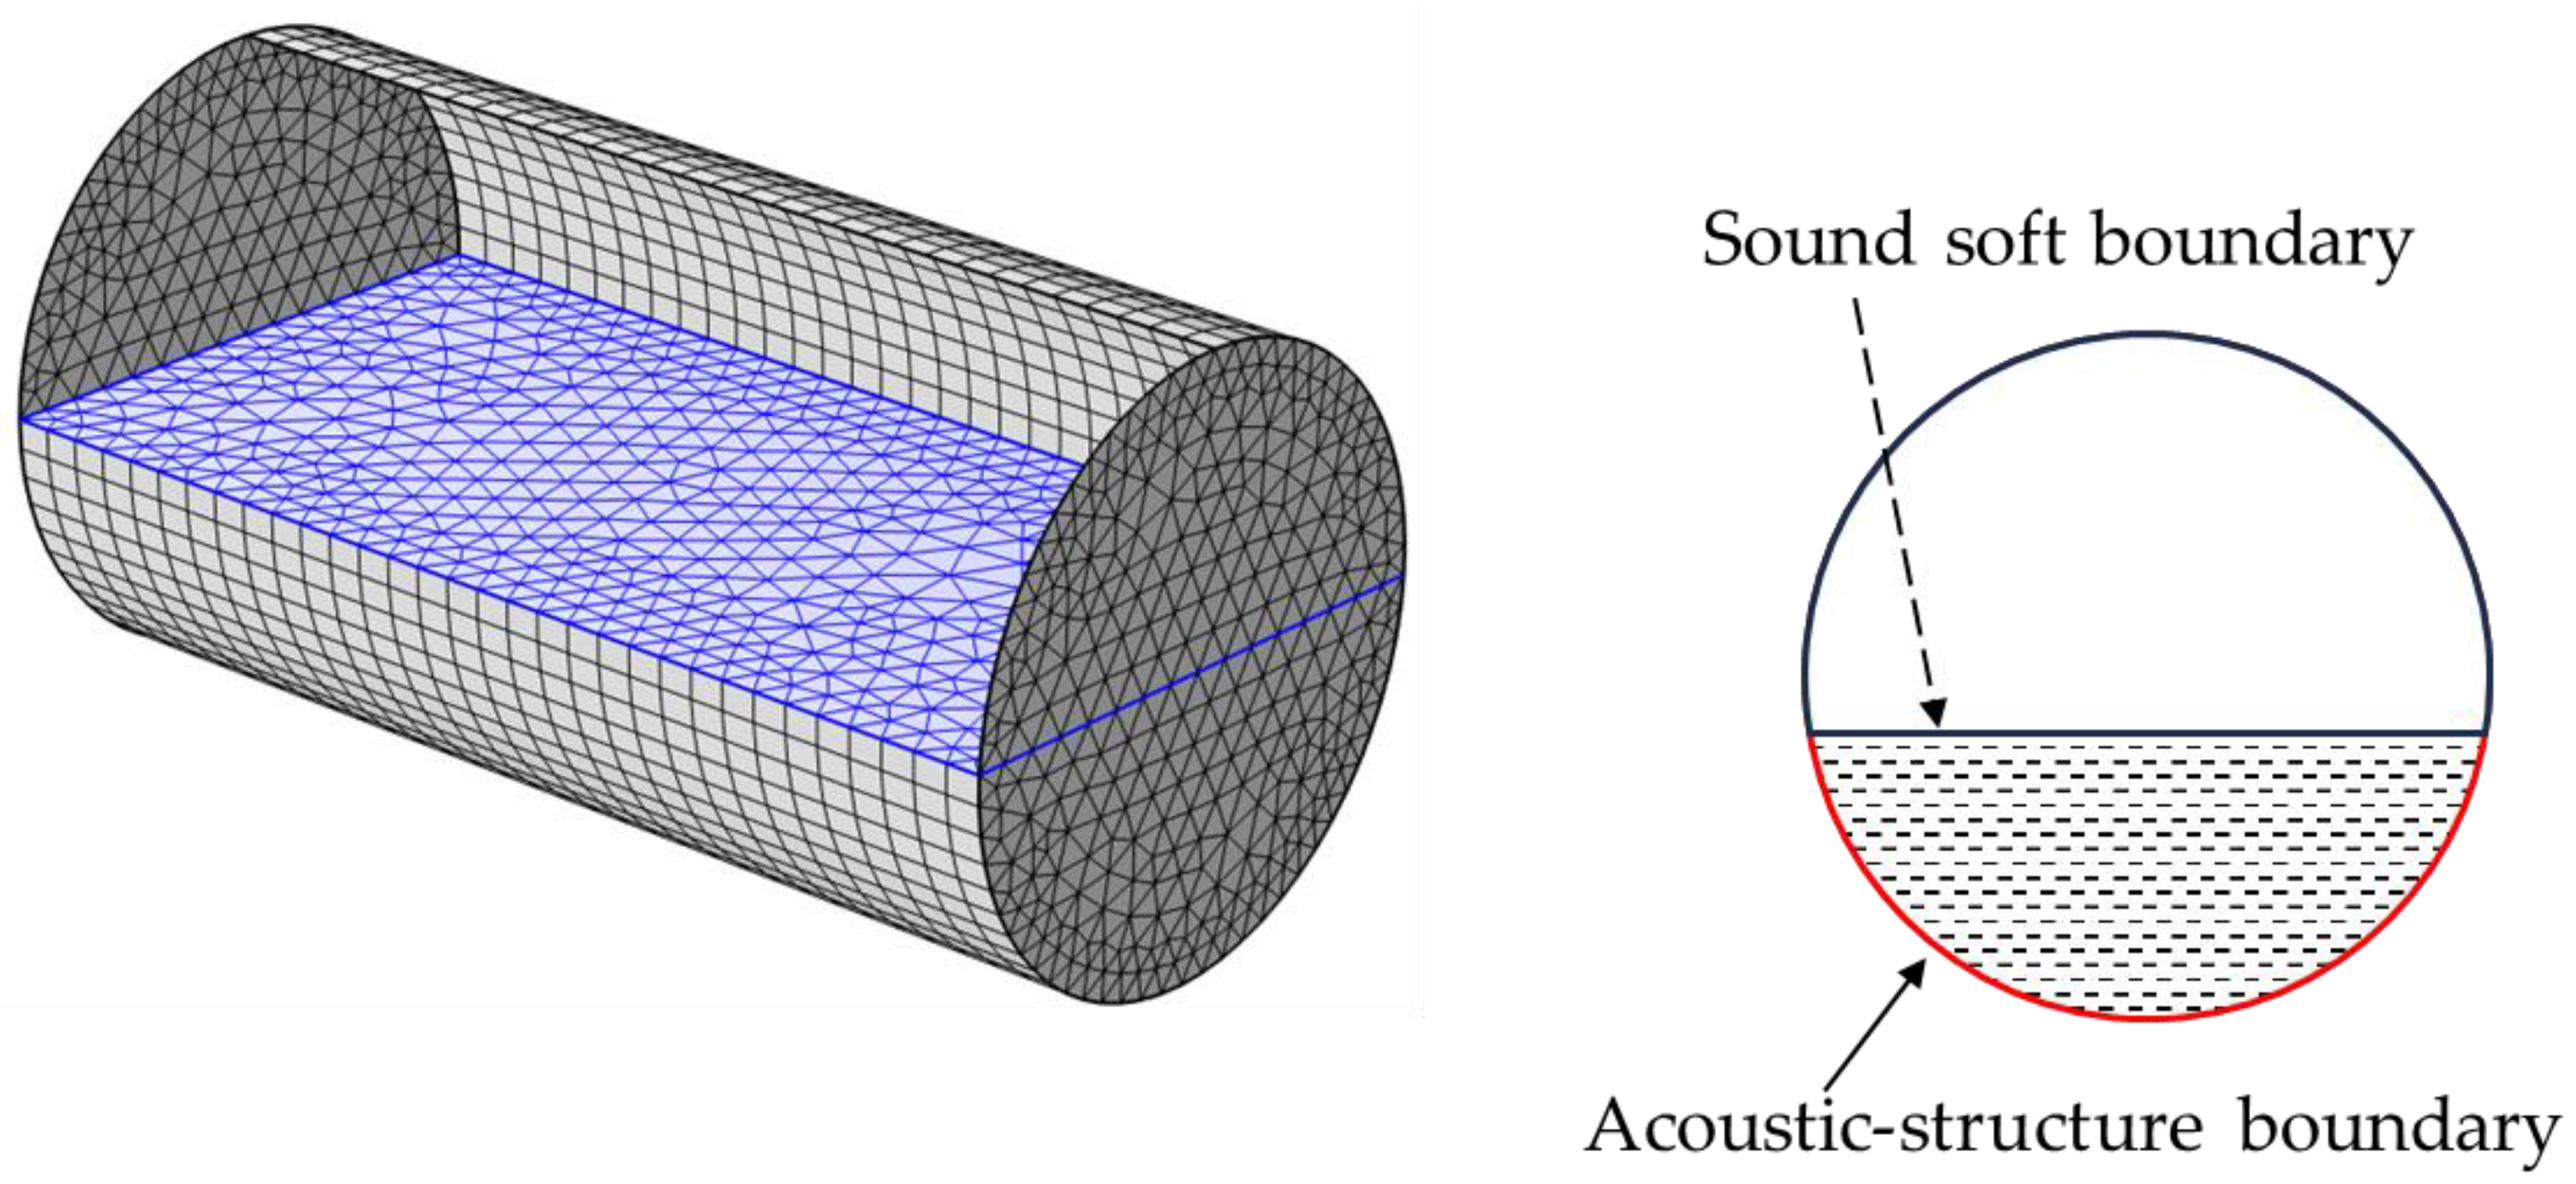
2.3. Comparisons with Experimental Results for Half-Filled Case
Experimental modal tests were conducted by using an impact excitation, which was applied on a grid with six equidistant points in longitudinal direction and fourteen points around the circumference, so the upper limit of detecting circumferential order is seven. This experimental configuration sets an upper limit of seven for detecting the circumferential order of vibration modes.
In order to compare with the experimental results, the cylindrical shell is modeled as a linear elastic material using the Shell module. The Pressure Acoustics module is available to model the sound field. A sound-soft condition is applied on the free surface. A coupling condition is applied on the wet part of the shell, where acoustic pressure causes a fluid load on the shell domain, and the structural acceleration acts on the fluid domain as a normal acceleration across the fluid-solid boundary. Based on the convergence tests for natural frequencies in vacuo, the same mesh division is recommended, as illustrated in
Figure 2.
The differences are shown in
Figure 3. The numerical modes agree well with experimental results [
18], except for the third mode. Both sets of mode shapes demonstrate symmetry about the plane passing through the center of the shell and perpendicular to the water surface. The maximum deviations in natural frequencies between the two solutions are observed in the third and fourth modes, where the relative error reaches approximately 3%.
2.4. Comparisons with Analytical Results for Half-Submerged Case
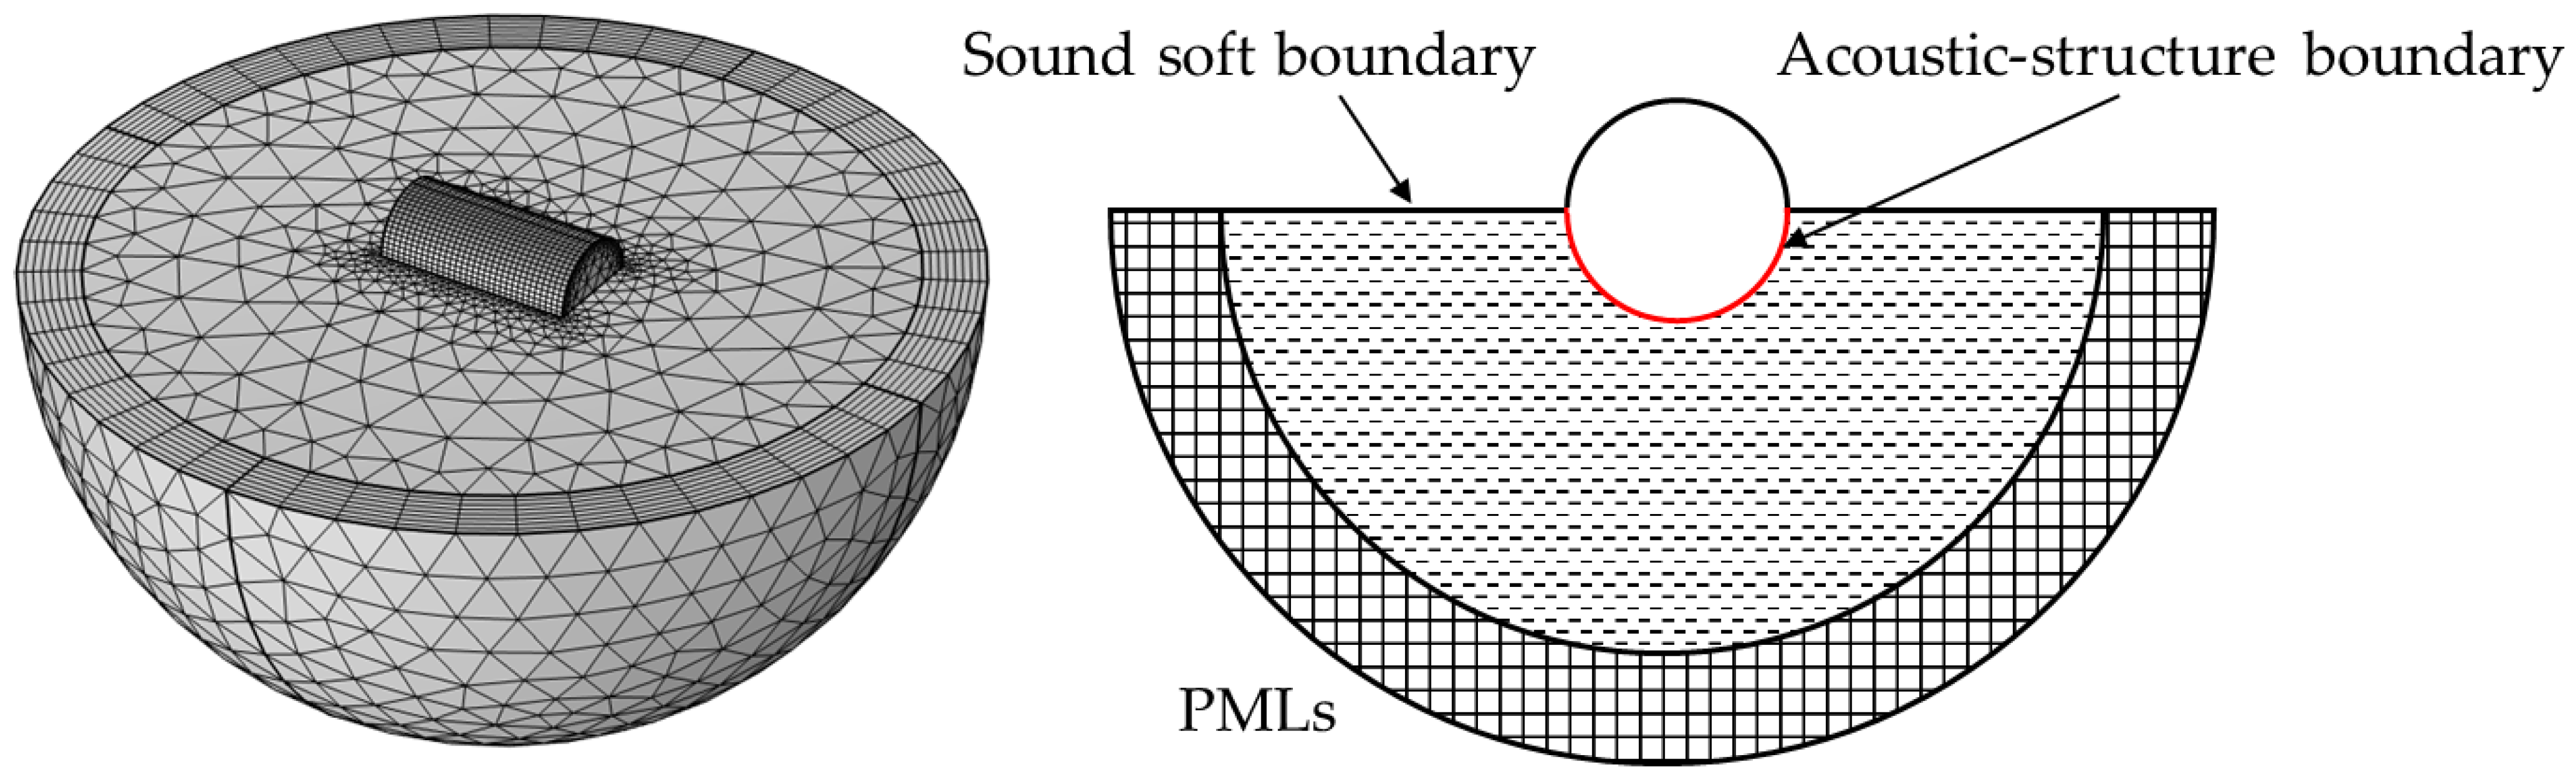
The analytical solutions were introduced by Ergin to calculate the dynamic characteristics of a half-submerged shell [
24]. The fluid-structure interaction effects are discussed in terms of generalized added mass. The added mass values exhibit a gradual decrease as the circumferential order n increases. Two methods were developed; the first one takes this frequency dependence into consideration, and the other one uses the final constant values directly.
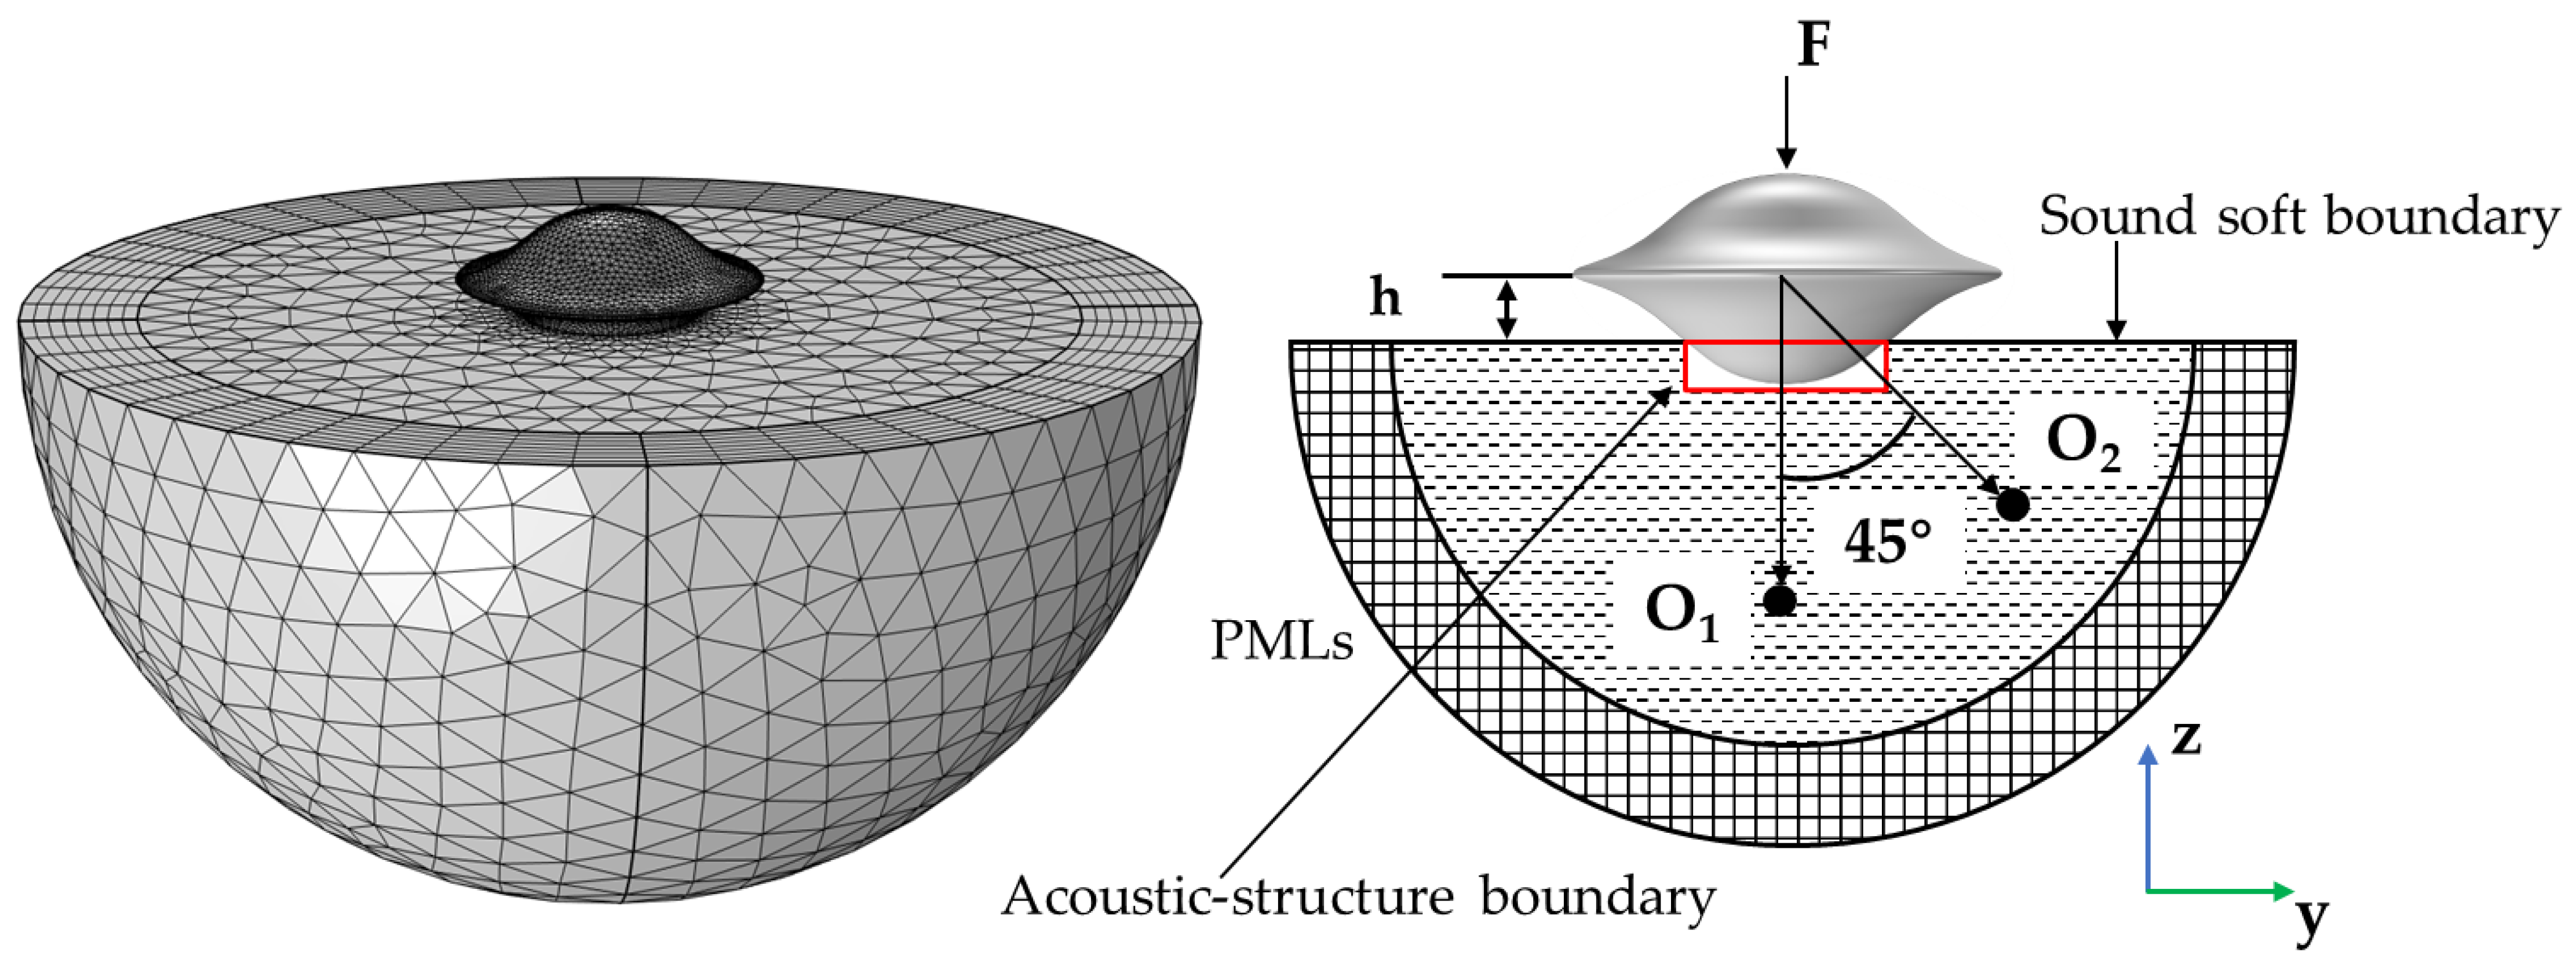
The FEM settings are subsequently extended to the half-submerged case. The computational domain is truncated by a hemisphere, and Perfect Matching Layers (PMLs) are added in the outer space to prevent the reflections back into the computational domain. FEM settings of the half-submerged case are shown in
Figure 4.
The comparisons between the analytical and numerical solutions are demonstrated in
Figure 5. A phase difference of 180° is observed in the circumferential direction for the second and third modes between the numerical and analytical results. This phenomenon also occurs at the sixth mode between the first and second methods of analytical solutions. However, the mode shapes of analytical and numerical solutions are either symmetric or antisymmetric about the plane through the center of the shell and perpendicular to the water surface. The differences in the natural frequency values lie in the range between 0.4% and 3%. Those deviations in vibration characteristics between the analytical and numerical solutions may be caused by the attendance of steel plates at both ends of the shell in simulations.
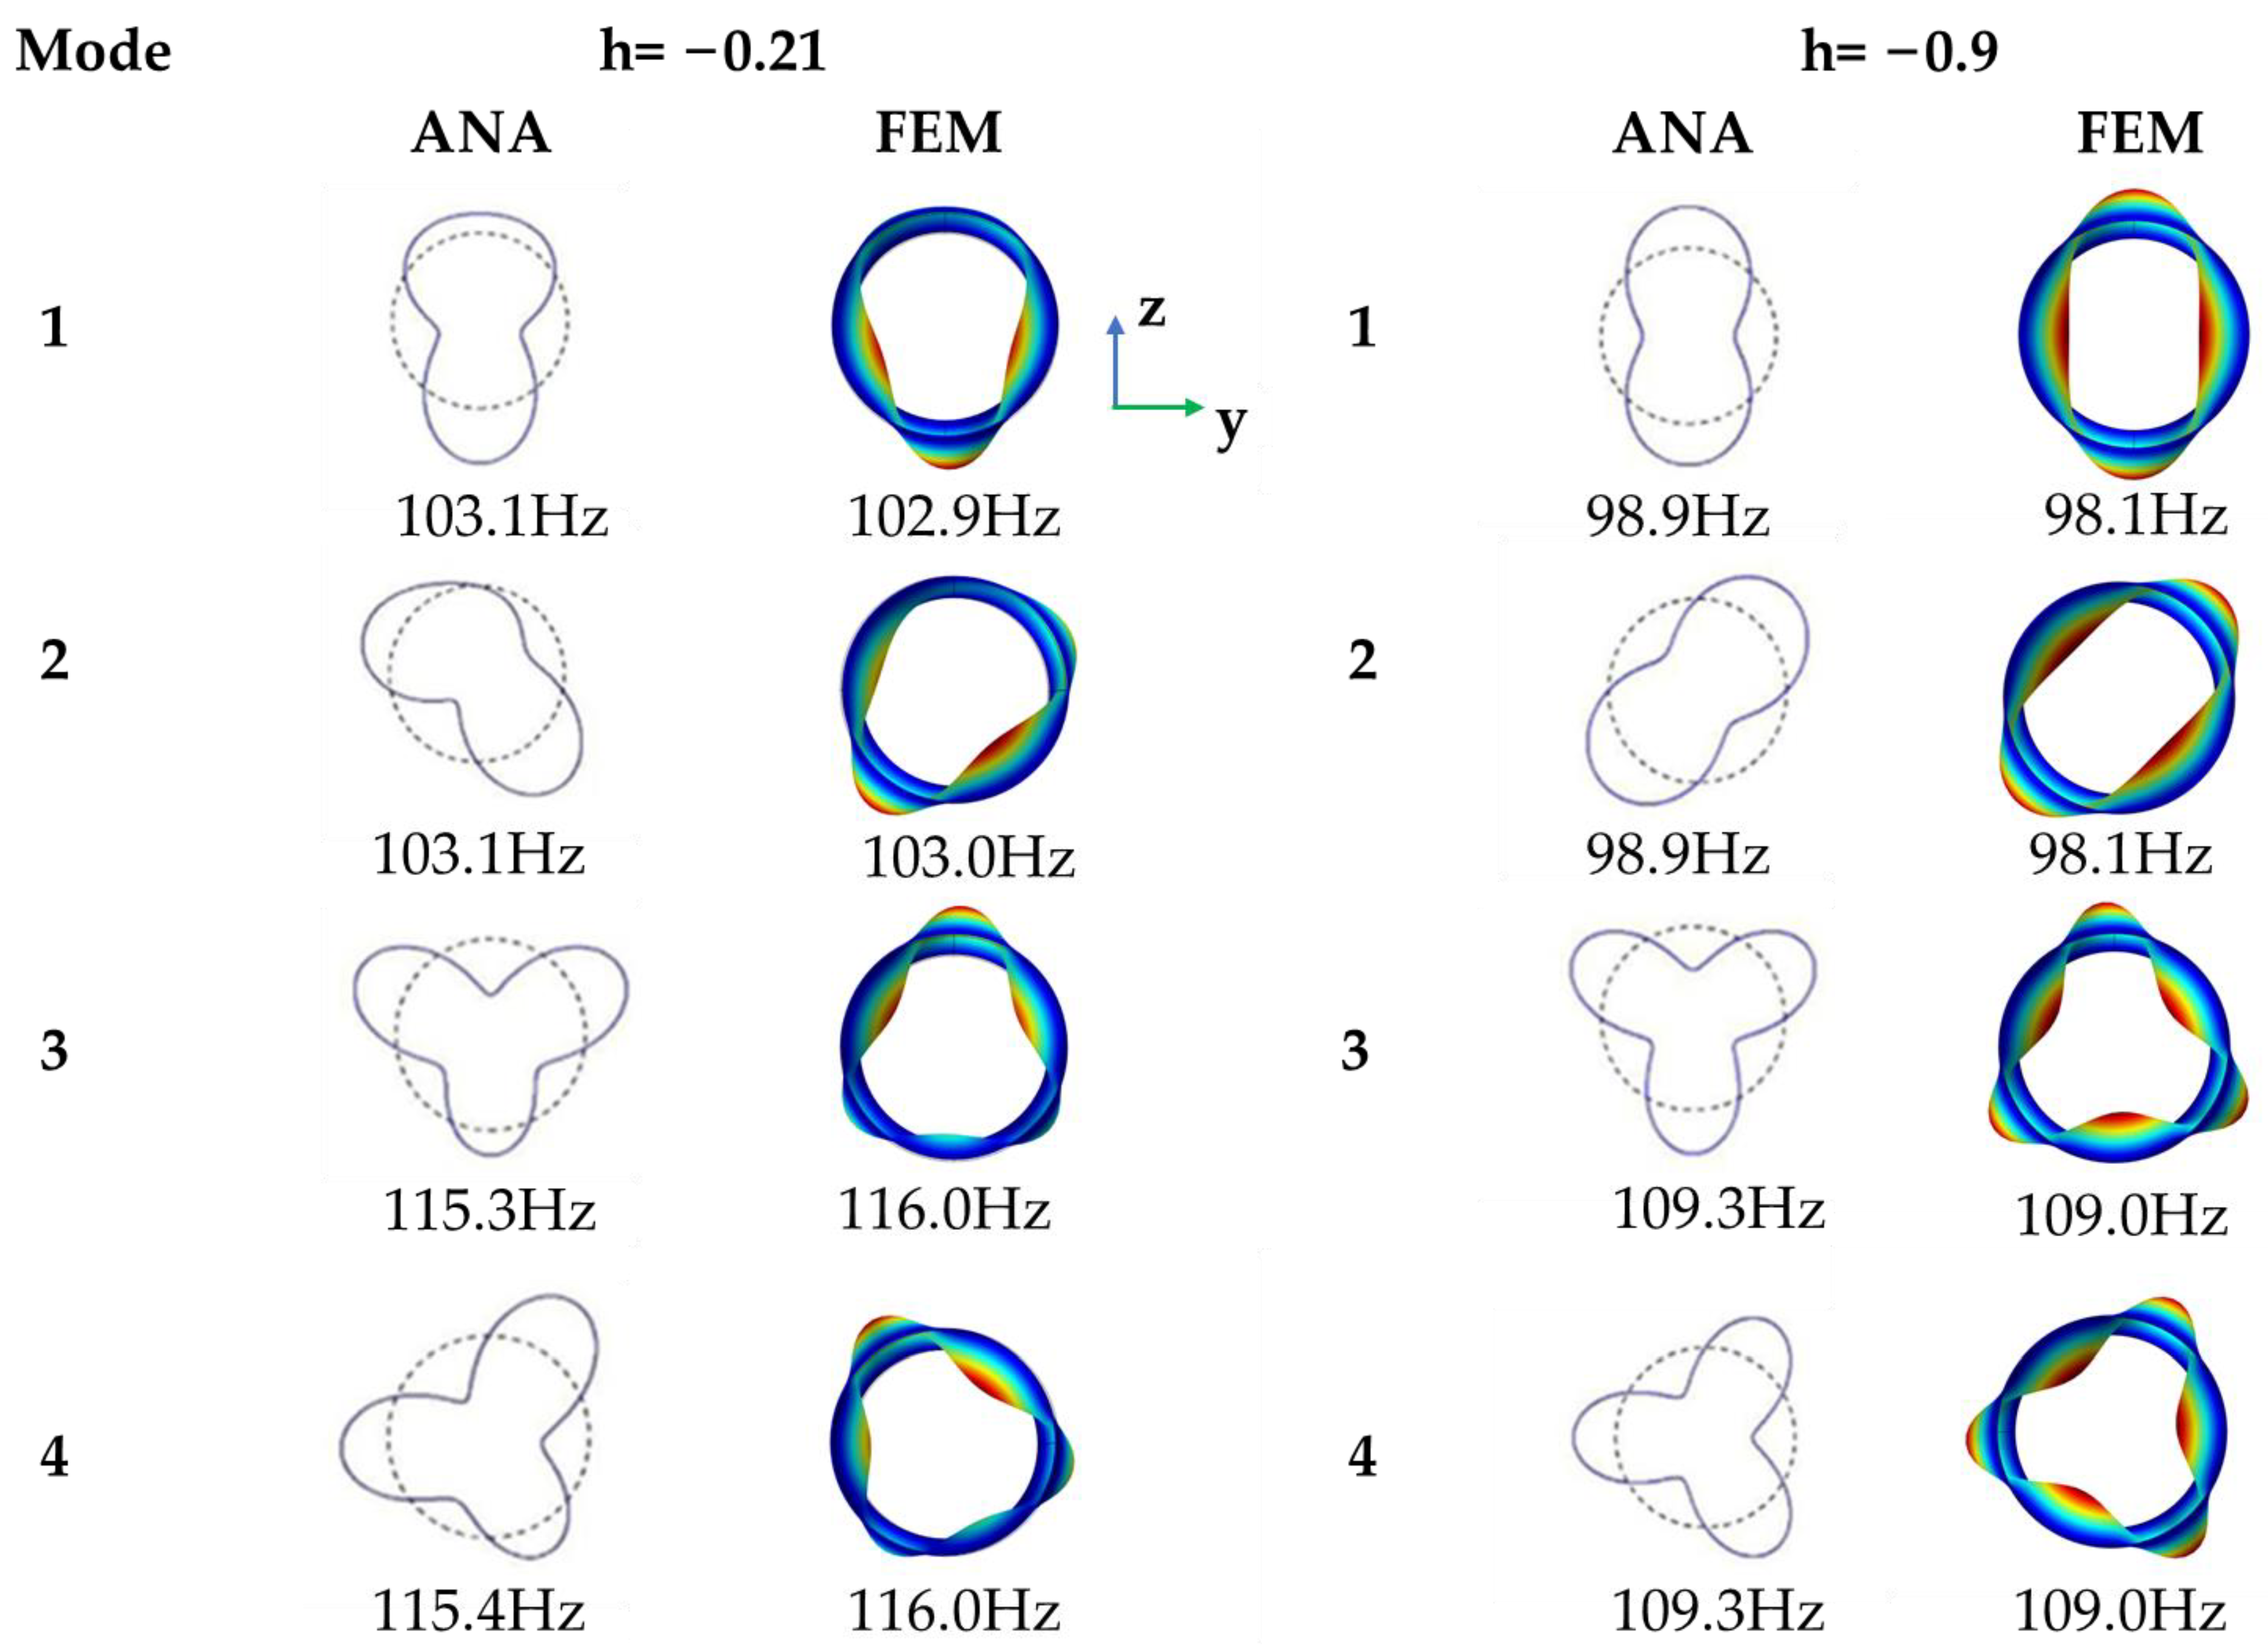
2.5. Comparisons with Analytical Results of Partially Submerged
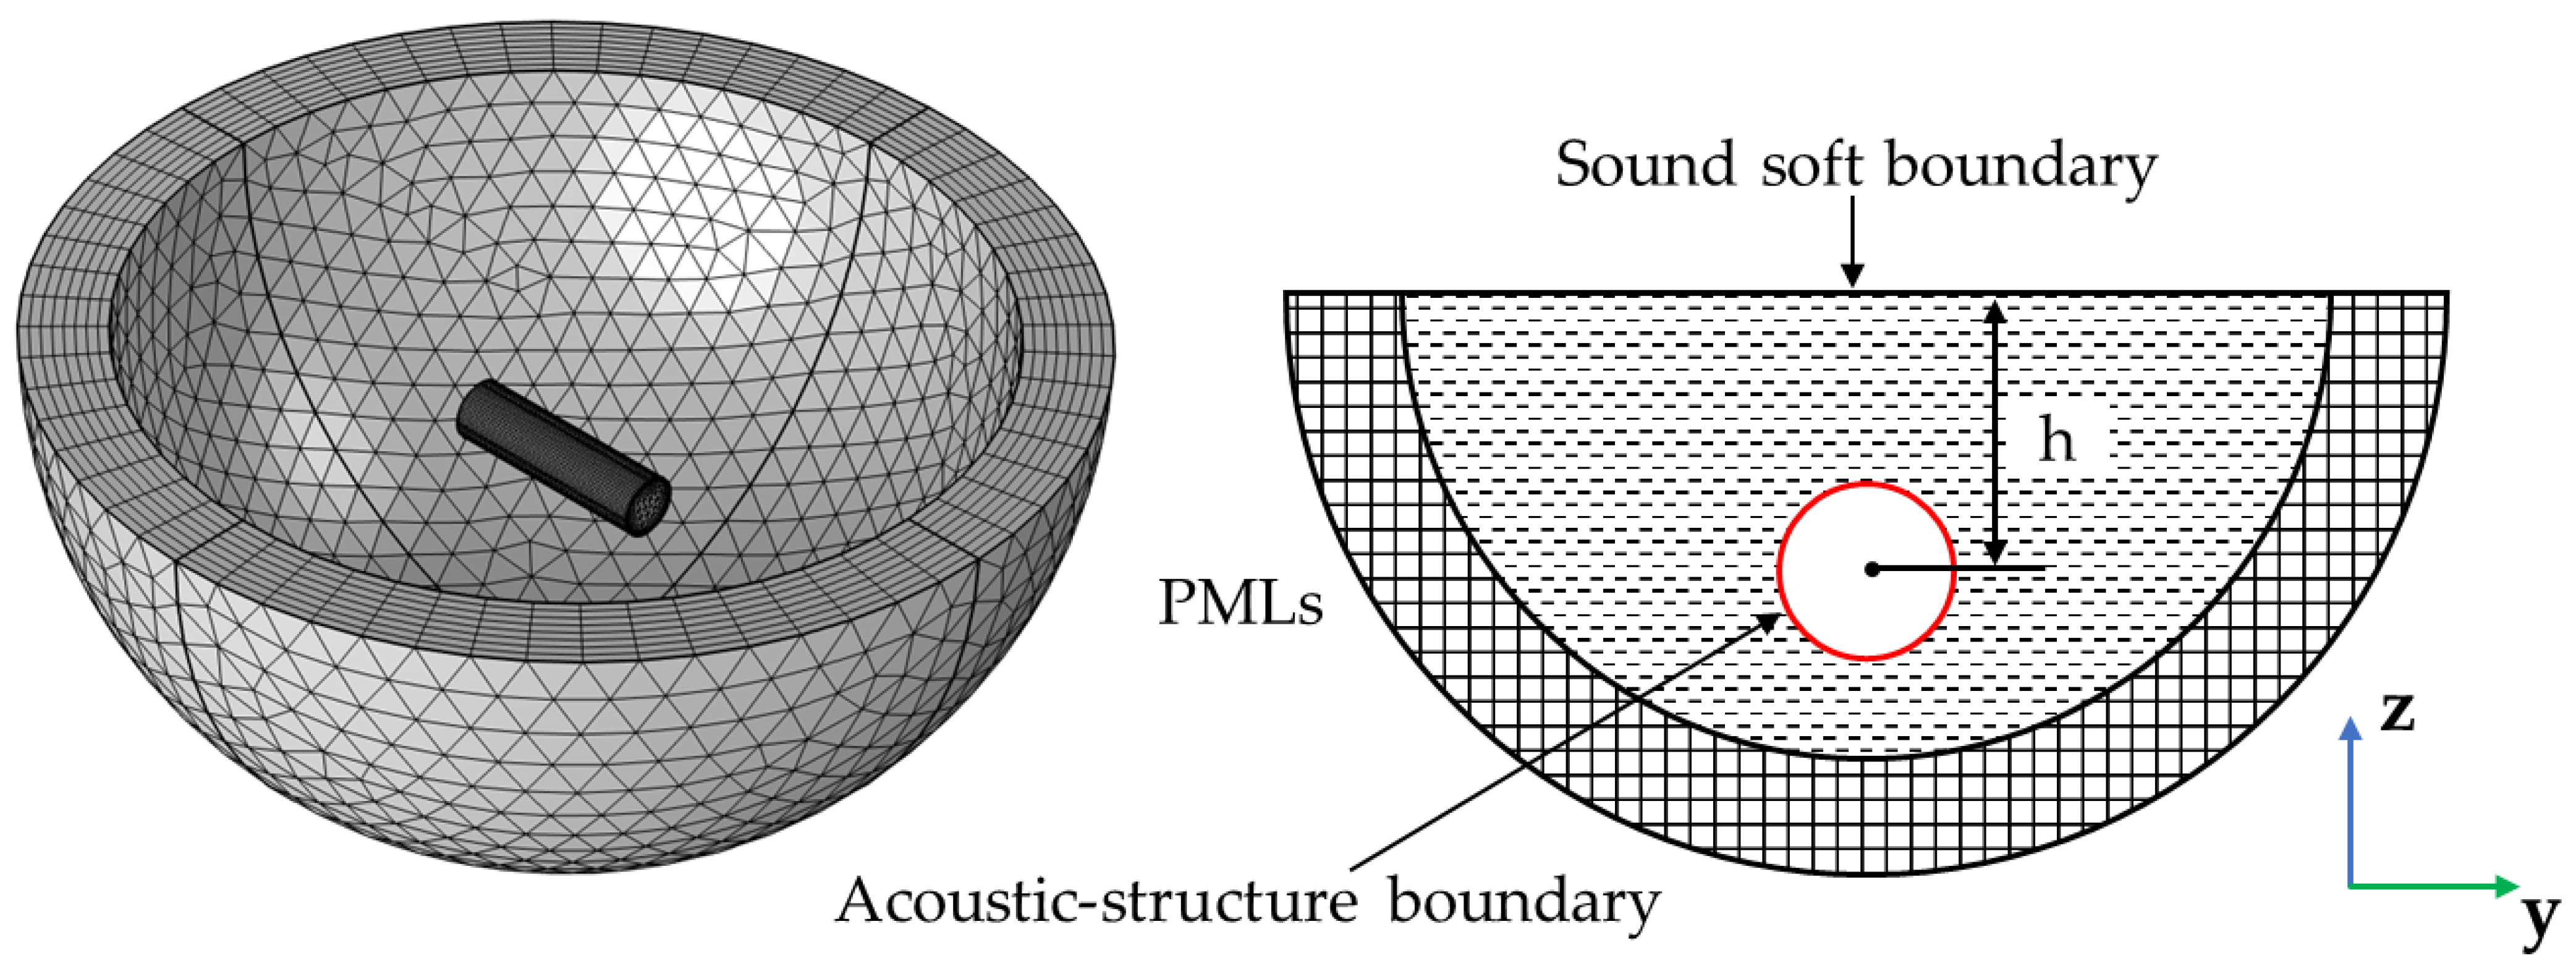
The parameters of the partially submerged shell are shown in
Table 3. The depth h is expressed as the vertical length between the free surface and the center of the shell. A positive depth value indicates that the cylindrical shell is fixed above the water surface, while a negative depth value indicates that it is positioned below the water surface. FEM settings of h = −0.9 m are shown in
Figure 6.
The eigenfrequencies of the first ten modes are compared between analytical and numerical solutions in
Table 4 [
21], where
fANA and
fFEM represent the analytical results and numerical results, respectively. The eigenfrequency of the same order under different depths decreases as the submerged depth increases. It tends to be steady when h = −0.9 m, which corresponds to five times the radius of the shell. The relative error between the analytical and numerical results is less than 1%.
The mode shapes at two depths are compared between the analytical and numerical results, pictured in
Figure 7. ANA and FEM in
Figure 7 represent the analytical and numerical solutions, respectively. It is clear that the results obtained from FEM agree well with those derived from the analytical method.
In conclusion, the accuracy of the FEM in calculating the dynamic characteristics of cylindrical shells is proved through comparisons with the analytical or experimental results under four cases: in vacuo, half-filled, half-submerged, and partially submerged. The relative error in natural frequency between the numerical and verification results is less than 3%. The shell’s modes between the numerical and verification results are either symmetric or antisymmetric about the plane through the center of the shell and perpendicular to the water surface. Therefore, the application of the FEM in calculating the dynamic characteristics of a cylindrical shell is extended to that of a disc-type underwater glider.
3. Results and Discussion
3.1. FEM Application on the Underwater Glider
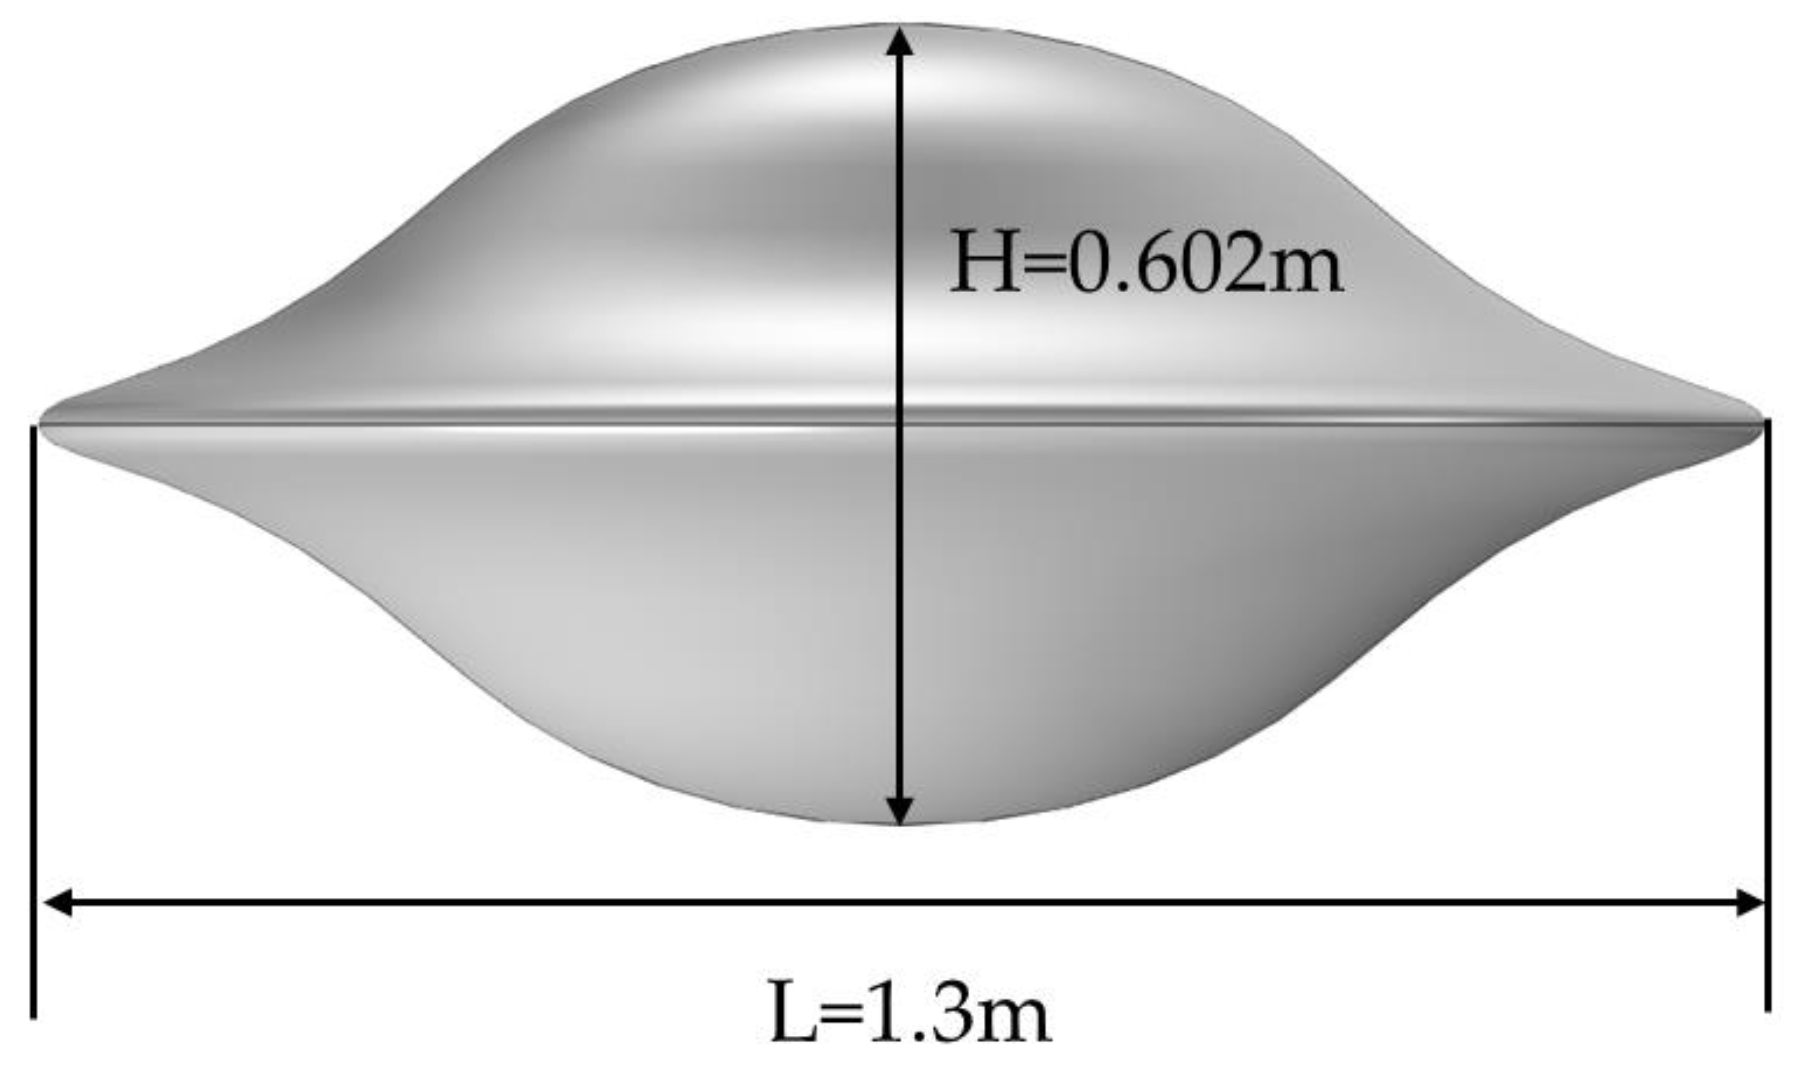
Based on our previous work, a multi-objective optimization model for improving the adaptability of airfoils under various operating conditions has been extended to optimize the outline of the disc-type glider [
25]. In this adaptation, the optimization objectives shift from the lift drag ratio and the minimum pressure coefficient to the lift drag ratio only. The optimized shape of the glider is presented in
Figure 8. The parameters of the underwater glider are listed in
Table 5. The imaginary part of Young’s modulus represents the damping of the shell. A damping loss factor of 0.01 is applied, consistent with the values used in Refs. [
13,
17].
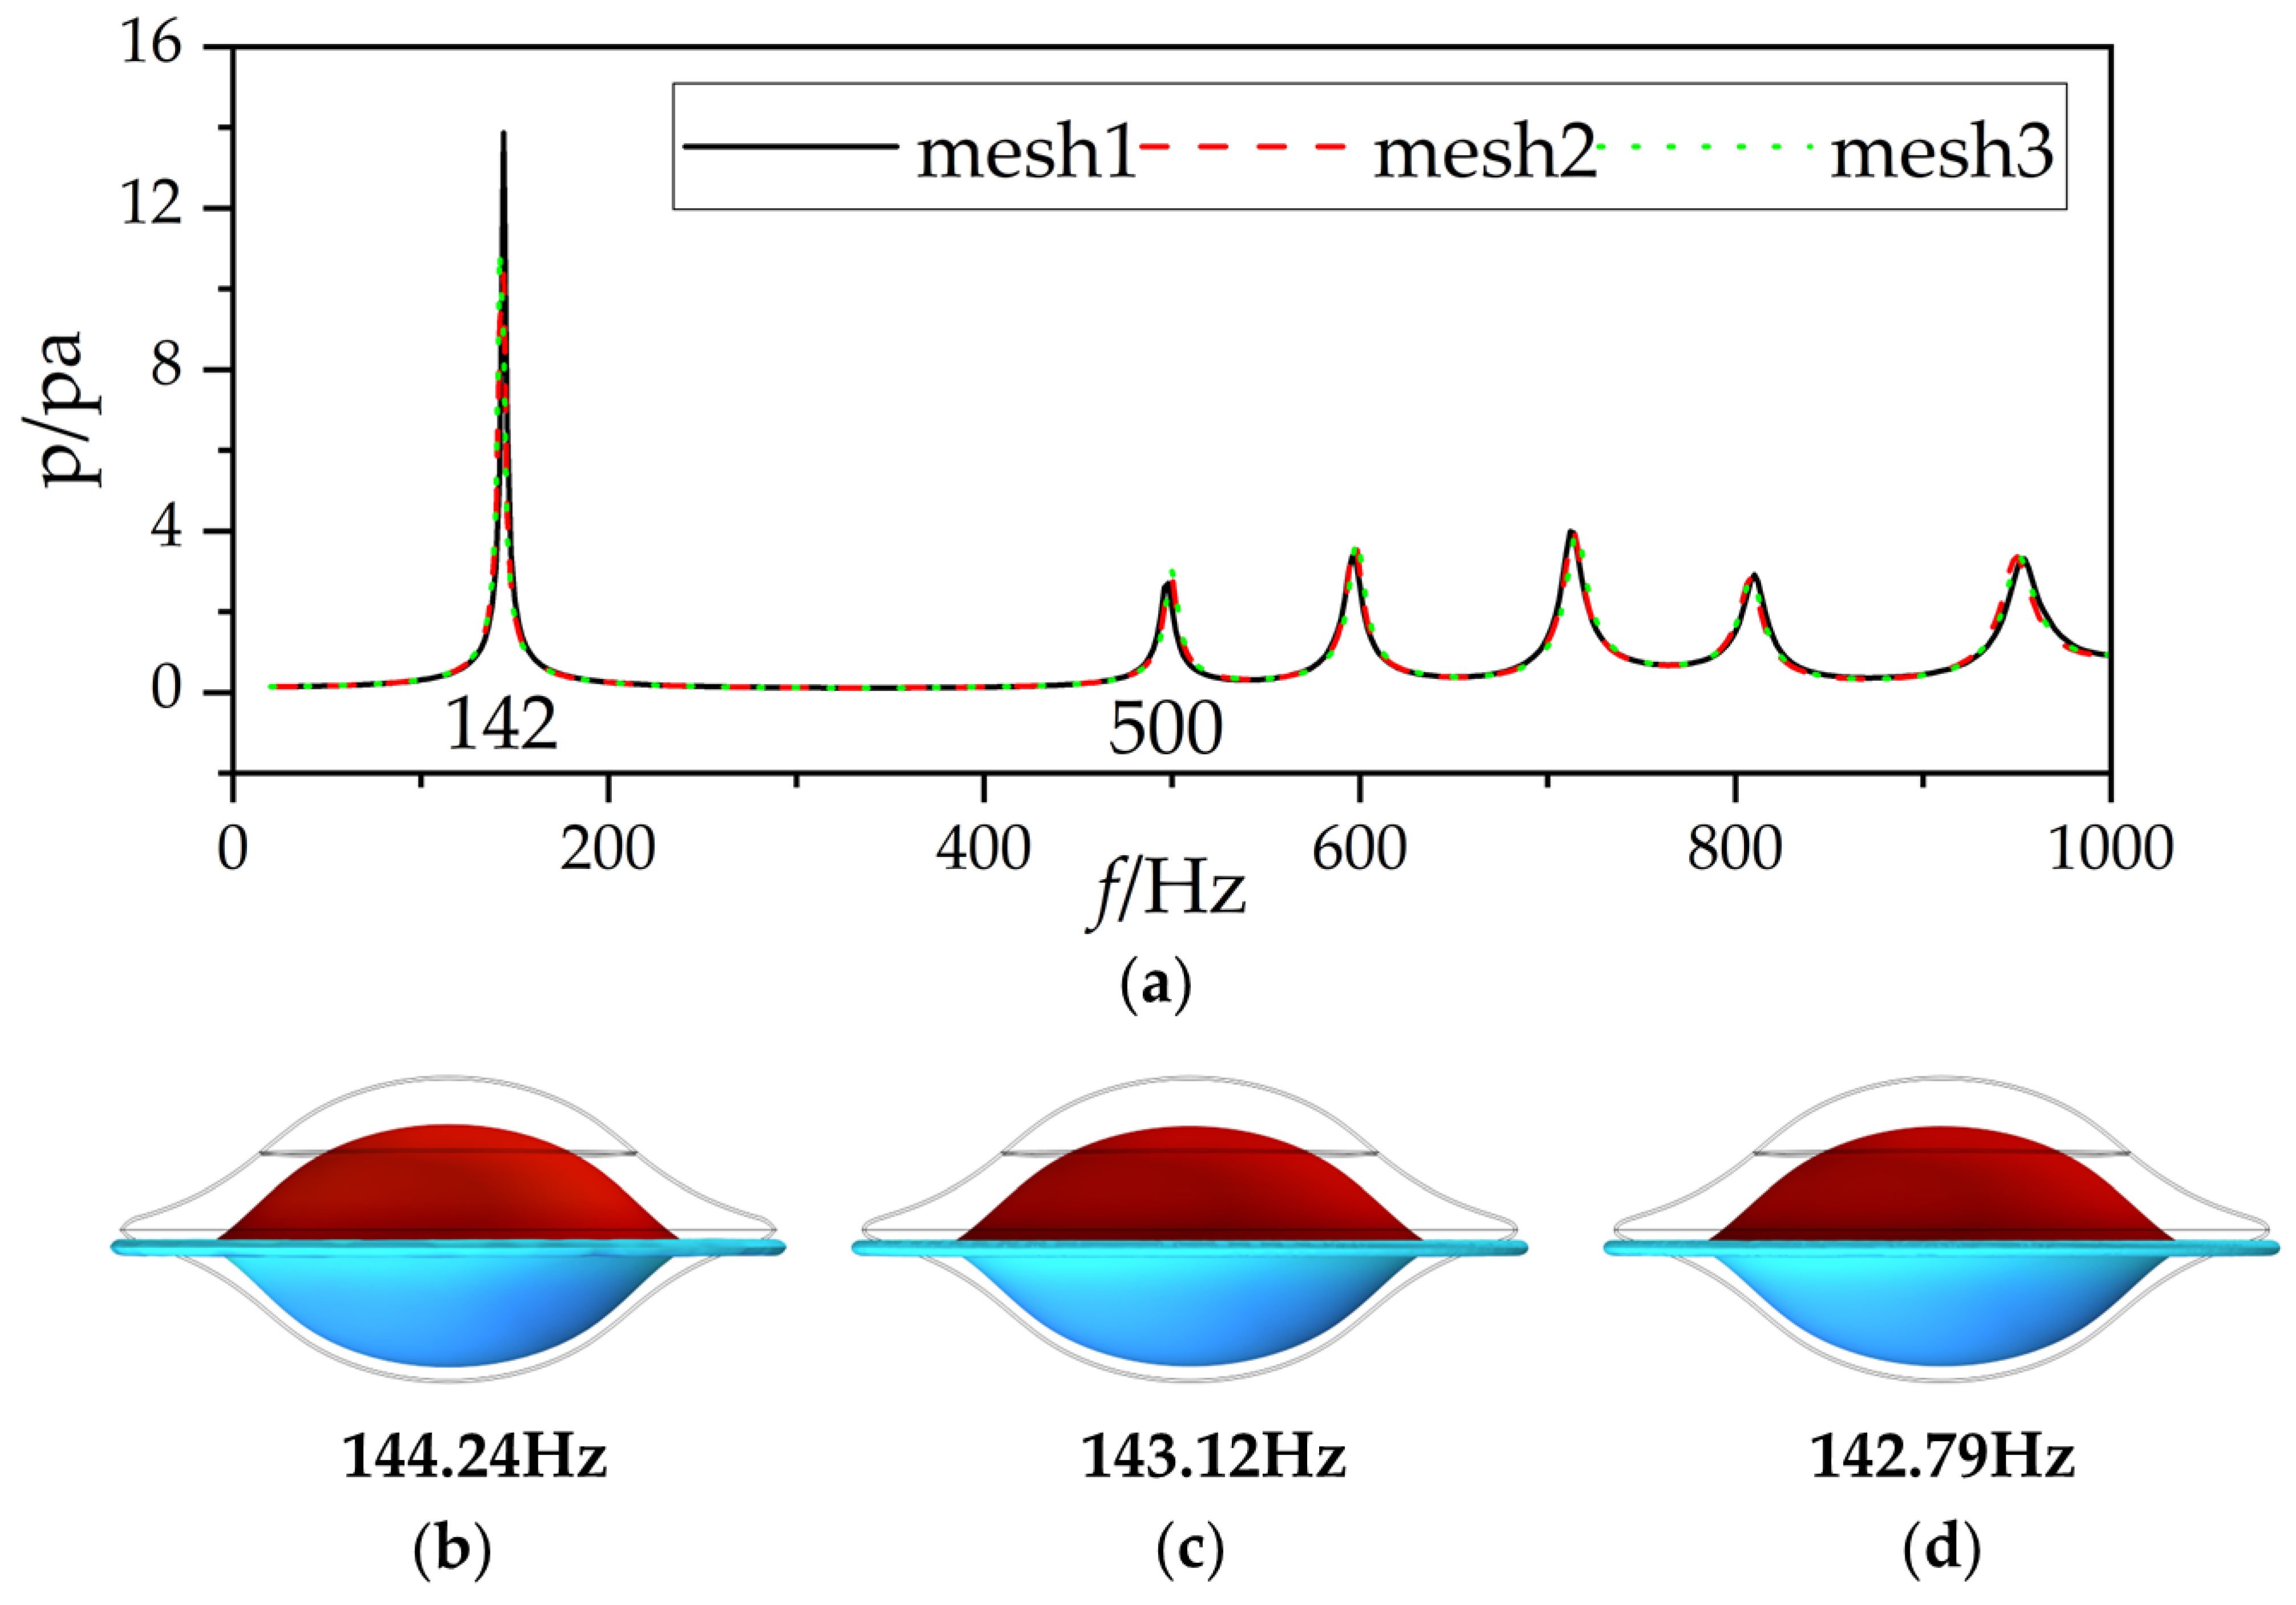
3.2. Convergence Tests for the Underwater Glider
The glider’s depth divided by half of its height is known as a dimensionless parameter H’ (H’ = 2 h/H), where H’ = 0 represents the half-submerged configuration. By adopting the mesh division and boundary conditions used for a cylindrical shell, convergence tests for the underwater glider are shown in
Table 6. The meshes of the shell and fluid domain are determined by the maximum and minimum element sizes. Three pairs of mesh divisions are selected for the shell of the underwater glider. In the water domain, the mesh size is determined to ensure that there are at least five grid points per wavelength, following COMSOL’s acoustic module guidelines. The element sizes are maintained within the range of six to eight elements per wavelength.
Two depths, H’ = 0.5 and H’ = −0.5, are utilized for convergence tests; the sound pressure at point O
1 and the mode shapes of the first formant are compared in
Figure 9 and
Figure 10. In the first depth, the frequency corresponding to the initial extreme point is overestimated when utilizing the primary mesh partitioning method, whereas the frequencies of subsequent extreme points are underestimated. As the mesh density increases, the primary resonance frequency exhibits a gradual decrease, with a relative error of 0.19% observed between the second and third mesh partitioning approaches. Similarly, in the second depth, the sound pressure amplitude at the initial extreme point is overestimated, with minimal discrepancies noted among the other extreme points. As the number of mesh elements increases, the primary resonance frequency decreases incrementally, accompanied by a relative error of 0.23% between alternative mesh partitioning strategies. Thus, the Mesh2 is considered optimal, given that the total number of elements in the Mesh3 is 2.5 times that of Mesh2 under H’ = −0.5. FEM settings of the underwater glider under H’ = 0.5 are shown in
Figure 11.
3.3. Effect of Water Depth on Vibration Characteristics
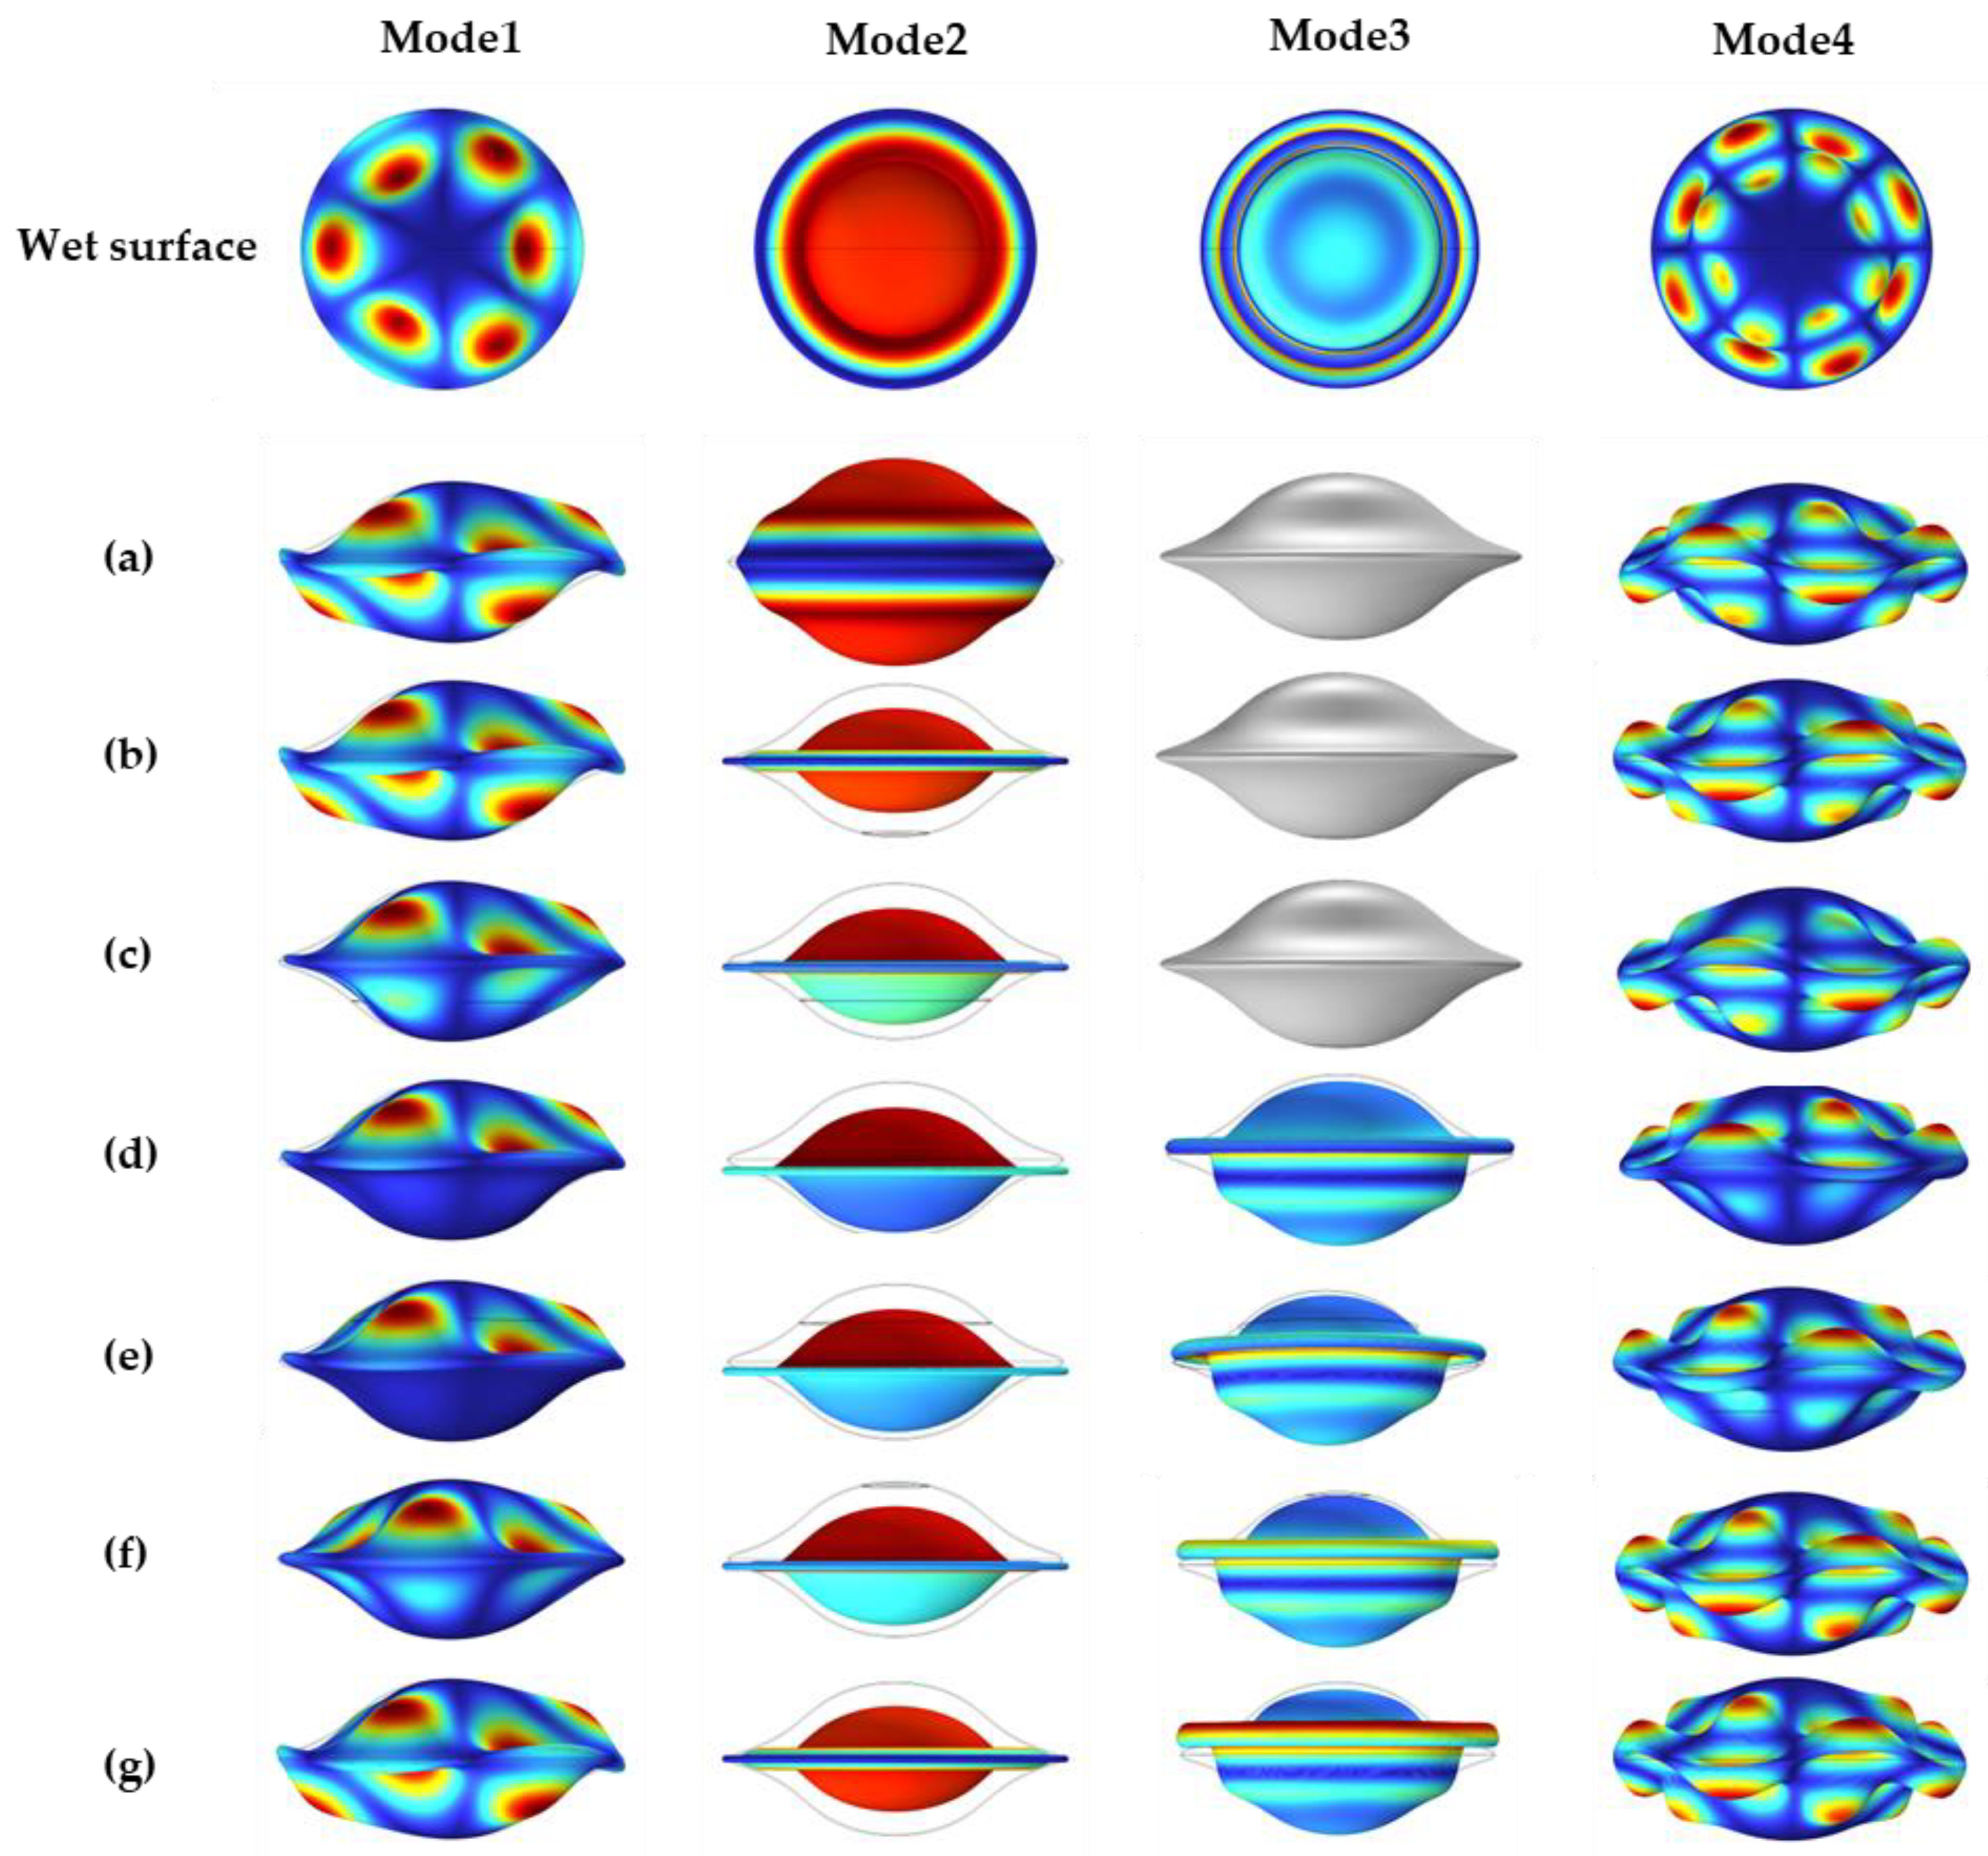
The mode shapes of the glider under seven cases are shown in
Figure 12. Modes 1 and 4 can be characterized as bending vibration patterns on the surface of a disc-type shell. The water depth primarily influences the symmetry of the upper and lower sections of the shell. The presence of a heavy fluid, such as water, suppresses the shell’s vibrations, resulting in smaller vibrational displacements on the side in contact with the fluid. Mode2 represents a pure displacement vibration pattern, where the shell surface expands outward in air but contracts inward when submerged in water. Mode3 is a hybrid vibration pattern, with the upper part of the shell compressing inward and the lower part expanding outward. This mode is only observed under conditions where H’ < 0; for H’ > 0, the shell’s geometric structure replaces this behavior. These observations demonstrate that water depth has a significant impact on the characteristics of this mixed vibration mode.
3.4. Vibroacoustic Response of the Underwater Glider
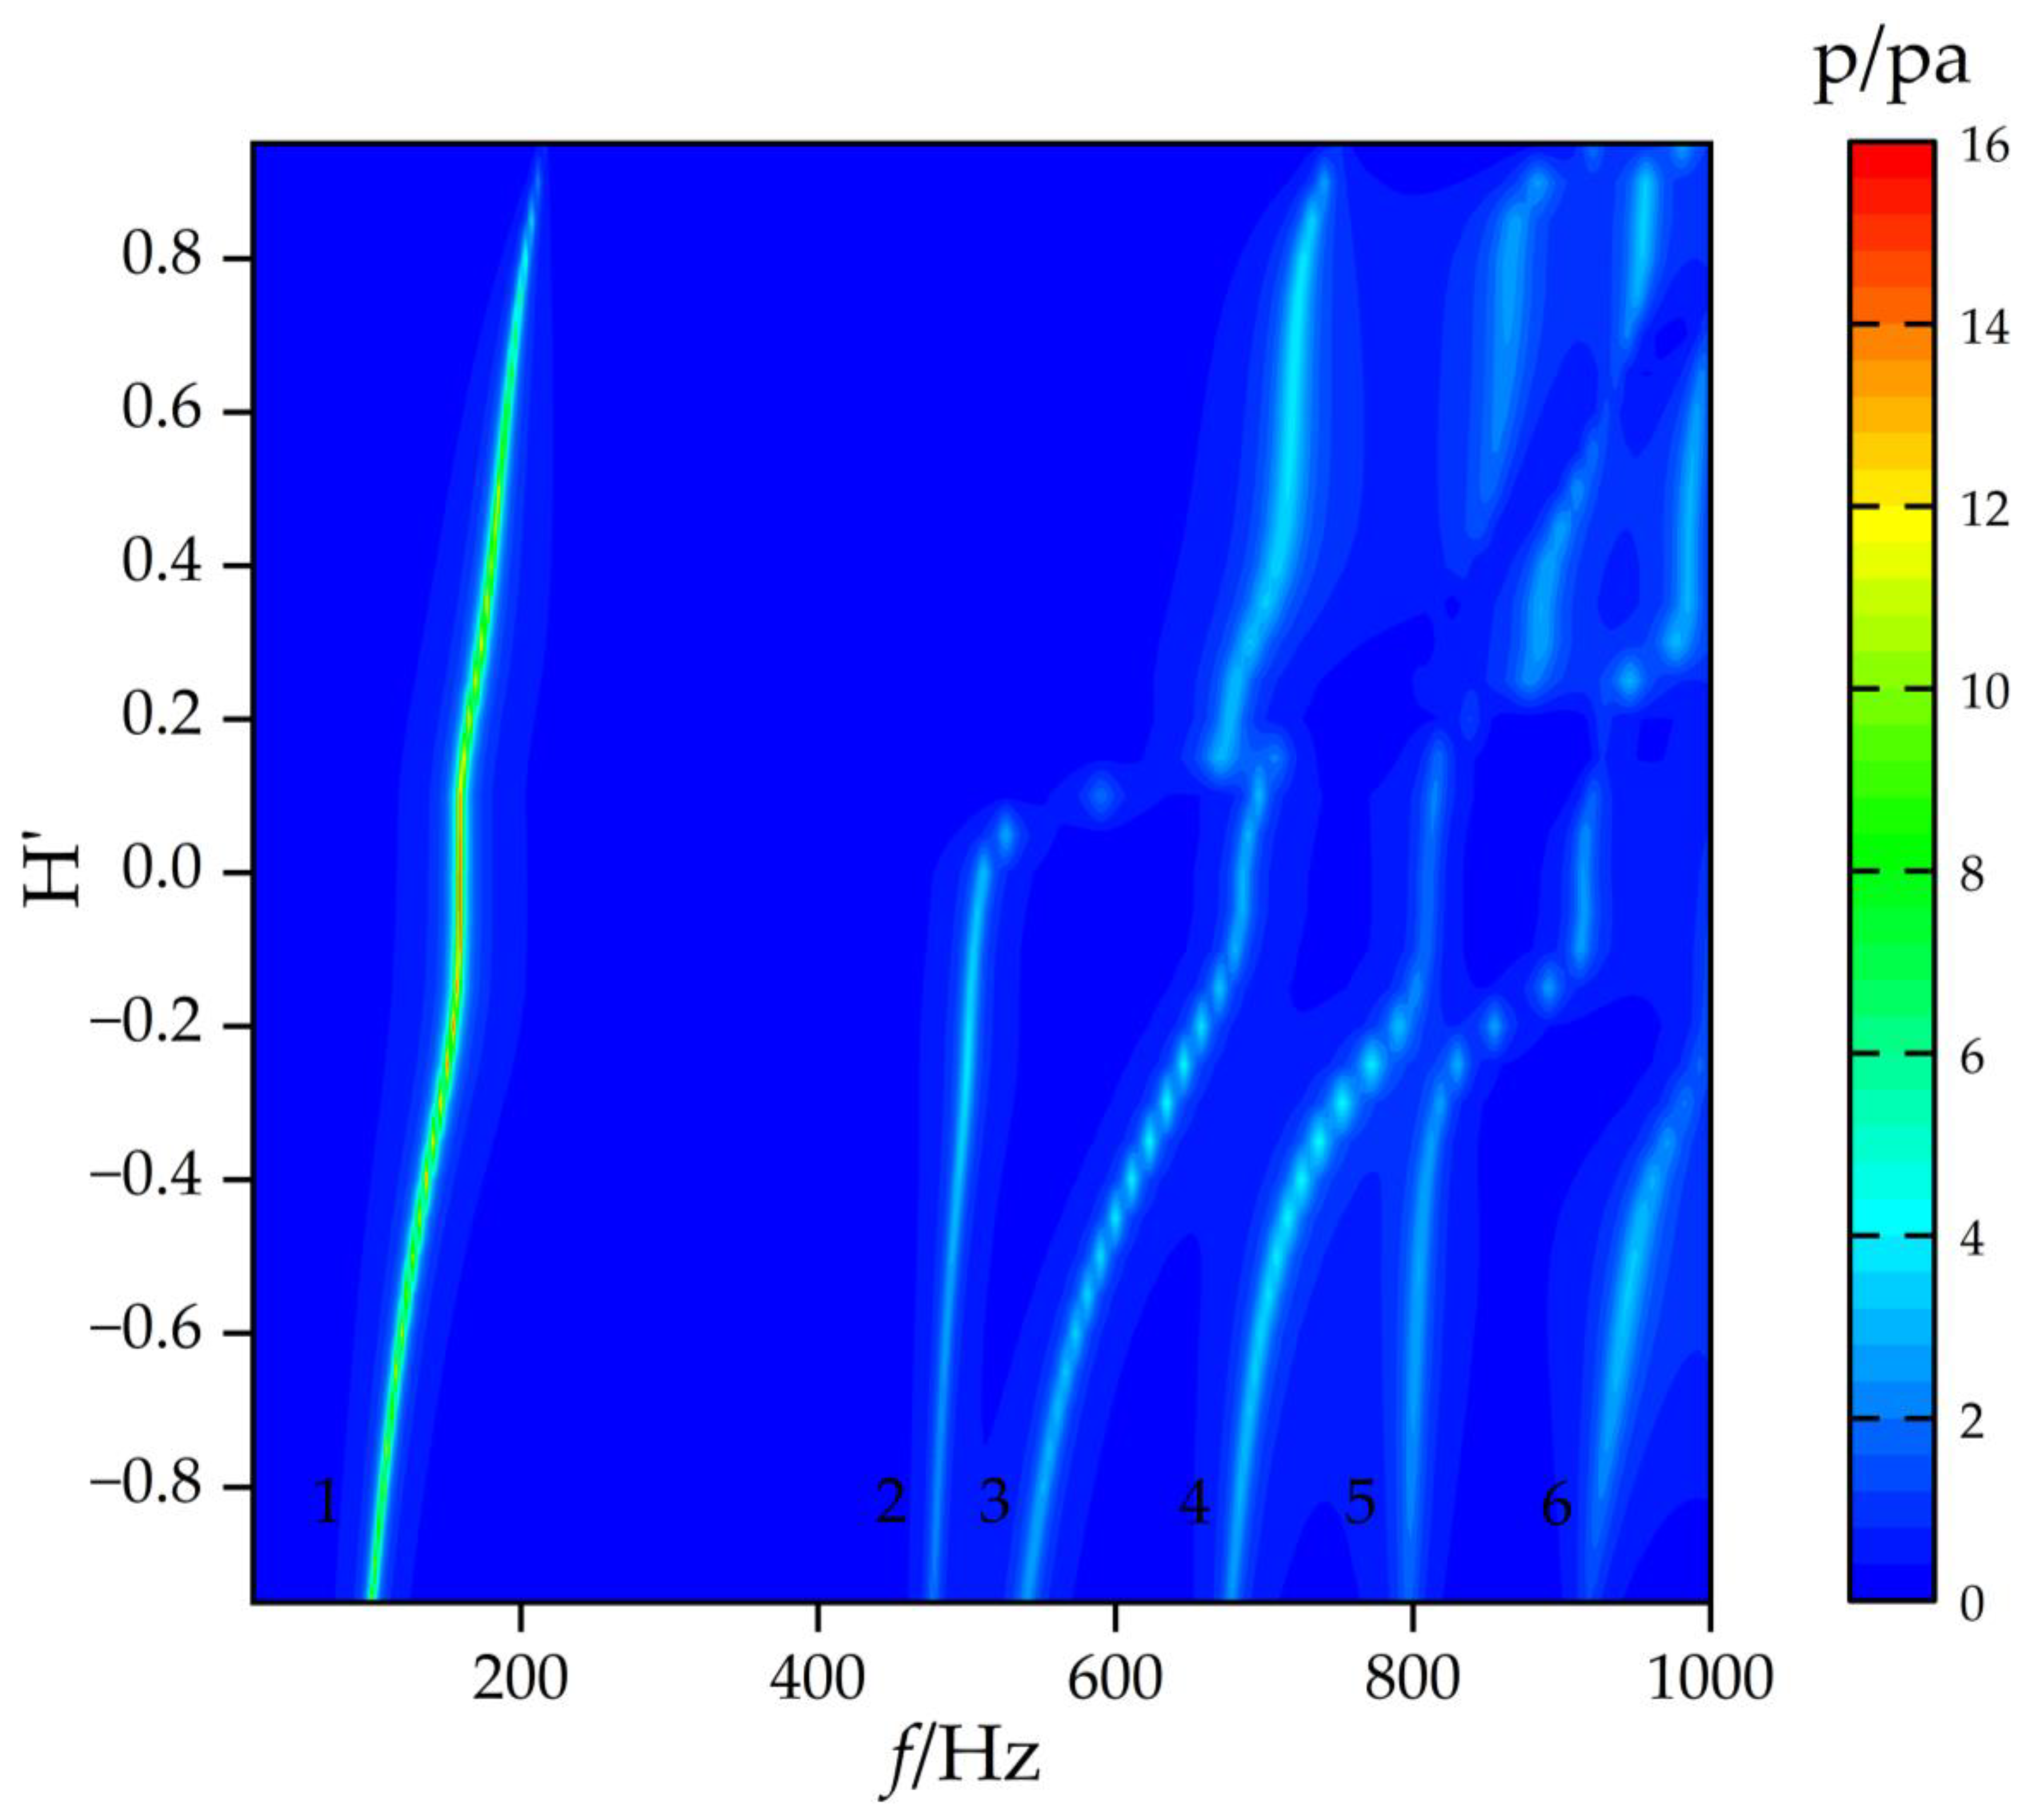
The amplitude of the excitation force is 1 N, applied at the top of the disc-type underwater glider. During the water entry process, the dimensionless parameter H’ varies from −0.95 to 0.95 in the simulations. The sound pressure at observation point O
1 is corrected to a distance of 1 m from the center of the glider, as illustrated in
Figure 13. The results exhibit six distinct bright curves within the range from 20 to 1000 Hz. The first curve is continuous, while the remaining five curves display discontinuities near H’ = 0.
As the glider enters the water, the wetted surface area expands, resulting in an increase in the added mass due to the surrounding fluid. This causes a shift in the resonance frequencies, as evidenced by the curves transitioning from higher to lower frequencies. A vertical line segment is observed between H’ = −0.1 and H’ = 0.1, corresponding to a region where the geometric curvature changes gradually. This indicates a relatively stable acoustic response in this range. Based on the analysis in
Section 3.3, certain modal vibration patterns only exist under conditions where H’ < 0. As a result, the detectable acoustic signals excited by these modal shapes are also discontinuous.
The acoustic pressure of observation point O
2 is shown in
Figure 14. The same phenomenon is also observed in
Figure 14. The primary differences between
Figure 13 and
Figure 14 lie in the amplitude of the sound pressure. The angle between the lines connecting points O
1 and O
2 to the center of the underwater glider is 45°.
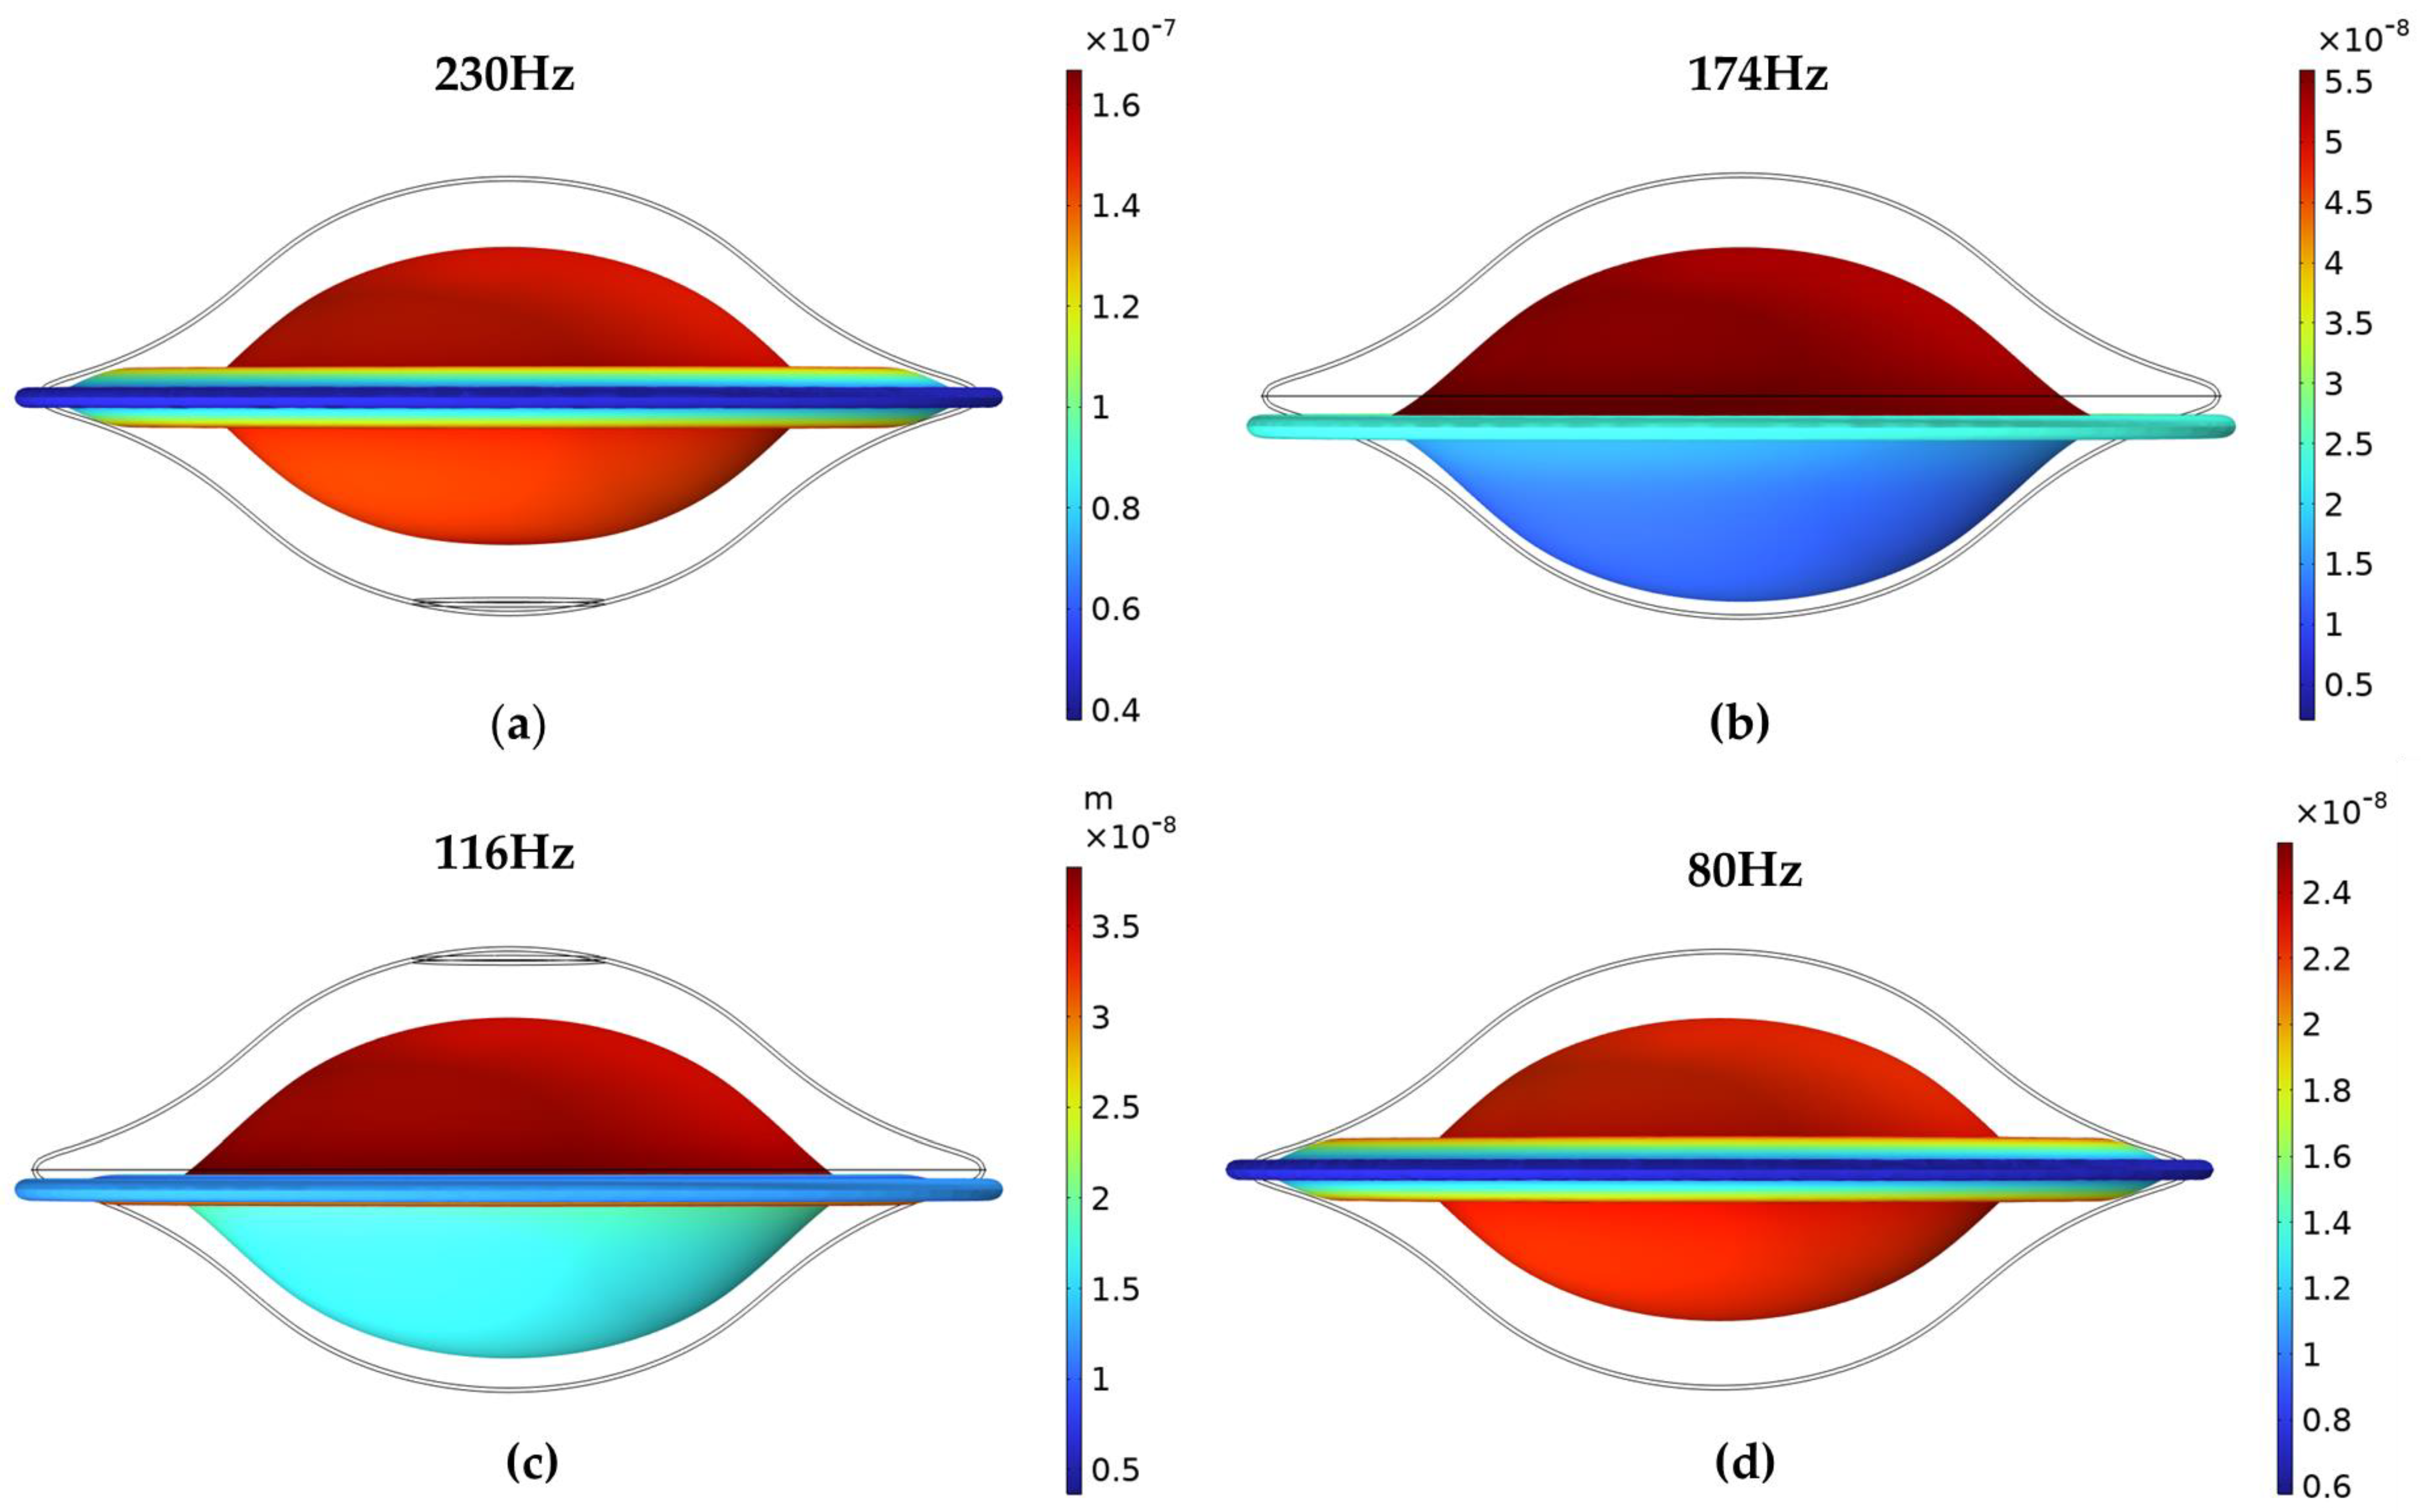
As depicted in
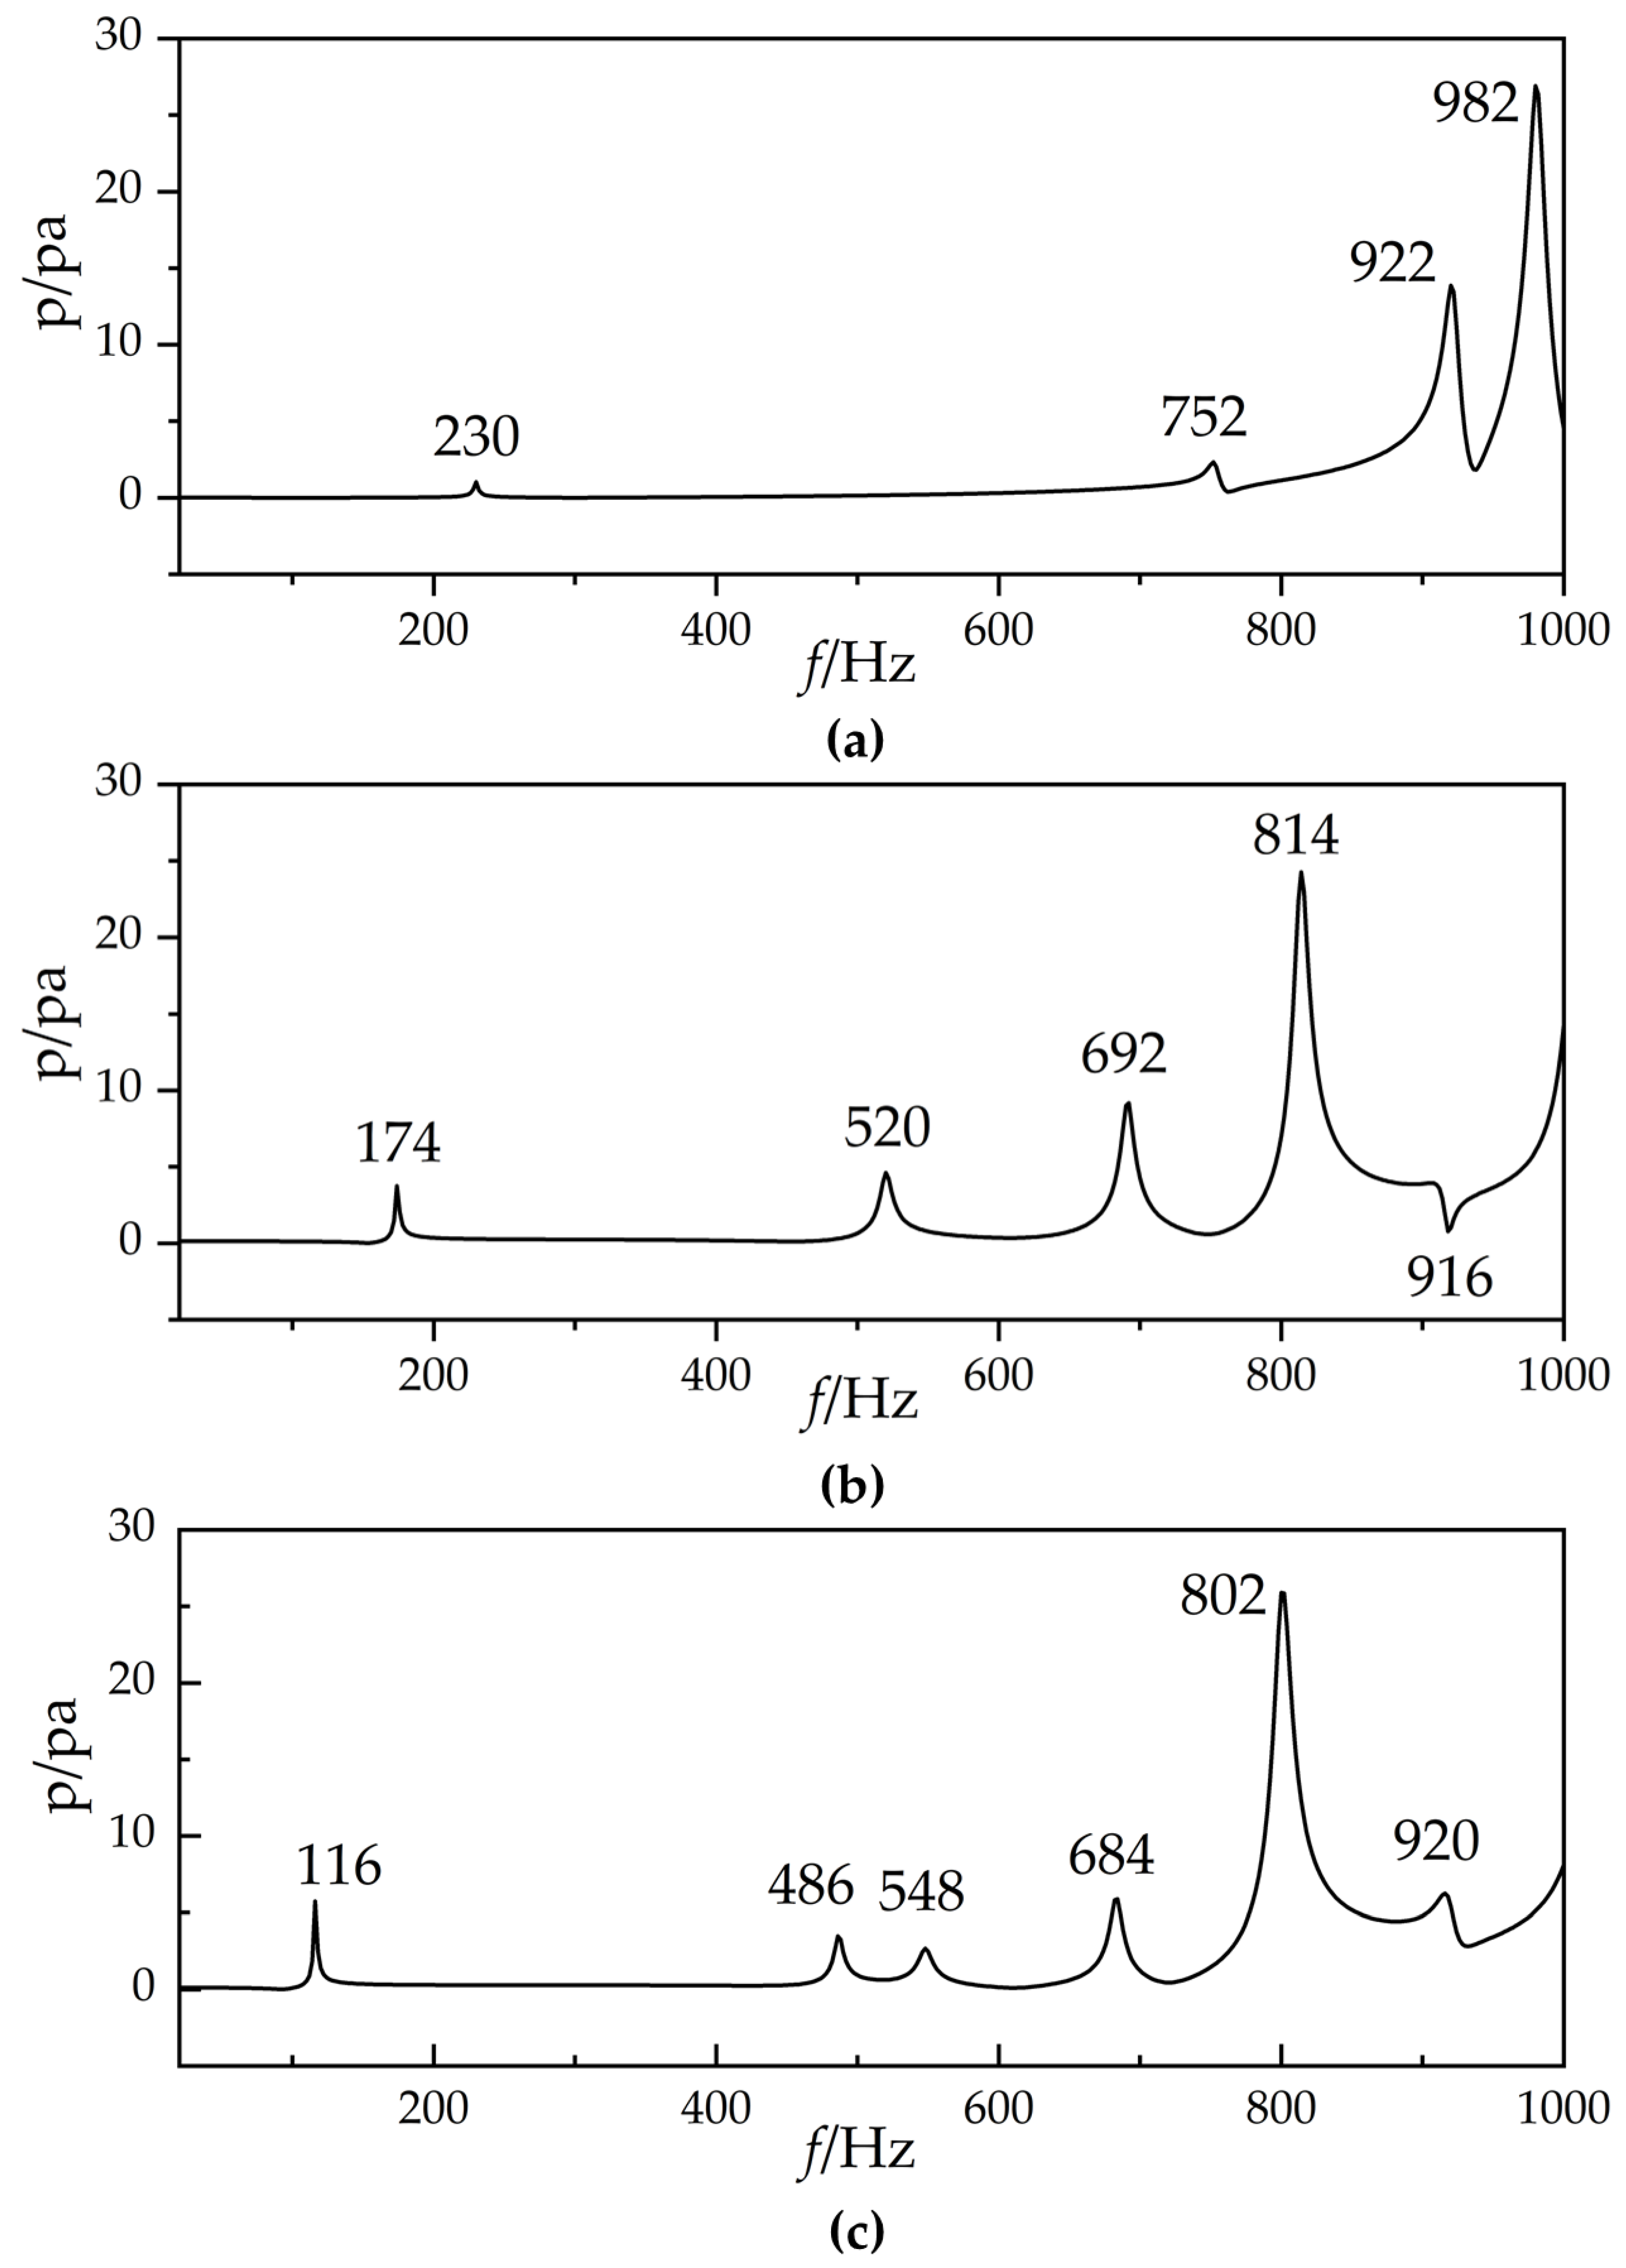
Figure 15, the sound pressures are analyzed and compared at three distinct depths. At a depth of H’ = 0.95, four extremum points are observed at frequencies of 230 Hz, 752 Hz, 922 Hz, and 982 Hz. At H’ = 0, five extremum points are identified at frequencies of 174 Hz, 520 Hz, 692 Hz, 814 Hz, and 916 Hz. At H’ = −0.95, six extremum points are detected at frequencies of 116 Hz, 486 Hz, 548 Hz, 684 Hz, 802 Hz, and 920 Hz.
The modal shapes corresponding to the extreme points at three different depths are also illustrated in
Figure 13. A comparative analysis of the modal shapes associated with the first extreme point at these depths is presented in
Figure 14. According to the principle of modal consistency, the modes at 520 Hz for H’ = 0 and 486 Hz for H’ = −0.95 are correlated and belong to the second bright line. However, the eigenfrequency corresponding to this mode does not exhibit an extreme point at H’ = 0.95. The modal shapes at 752 Hz, 692 Hz, and 548 Hz are consistent across the three depths, and these frequency points are attributed to the third bright line.
The modal shapes near the first extremum point for three different depths and fully submerged conditions are shown in
Figure 16. The mode shapes under all four conditions exhibit a tendency to vibrate inward toward the shell. Among these, the amplitude is the largest at H’ = 0.95, primarily because the contact area between the shell and the fluid is the smallest at this depth, resulting in the weakest fluid-structure interaction effect. As the depth increases, the fluid-structure interaction effect intensifies, leading to a gradual reduction in vibration amplitude. If it is fully submerged in the water, the frequency corresponding to the first extremum point decreases to 80 Hz.
Additionally, the modal shapes under the conditions of H’ = 0.95 and H’ = ∞ exhibit symmetrical vibration characteristics between the upper and lower parts of the shell. In contrast, under the conditions of H’ = 0 and H’ = −0.95, the vibration amplitude in the upper part of the shell is greater than that in the lower part. This difference is attributed to the presence of a light fluid above the water surface and a denser fluid below it.
3.5. The Effect of Excitation Force Position on Vibroacoustic Response
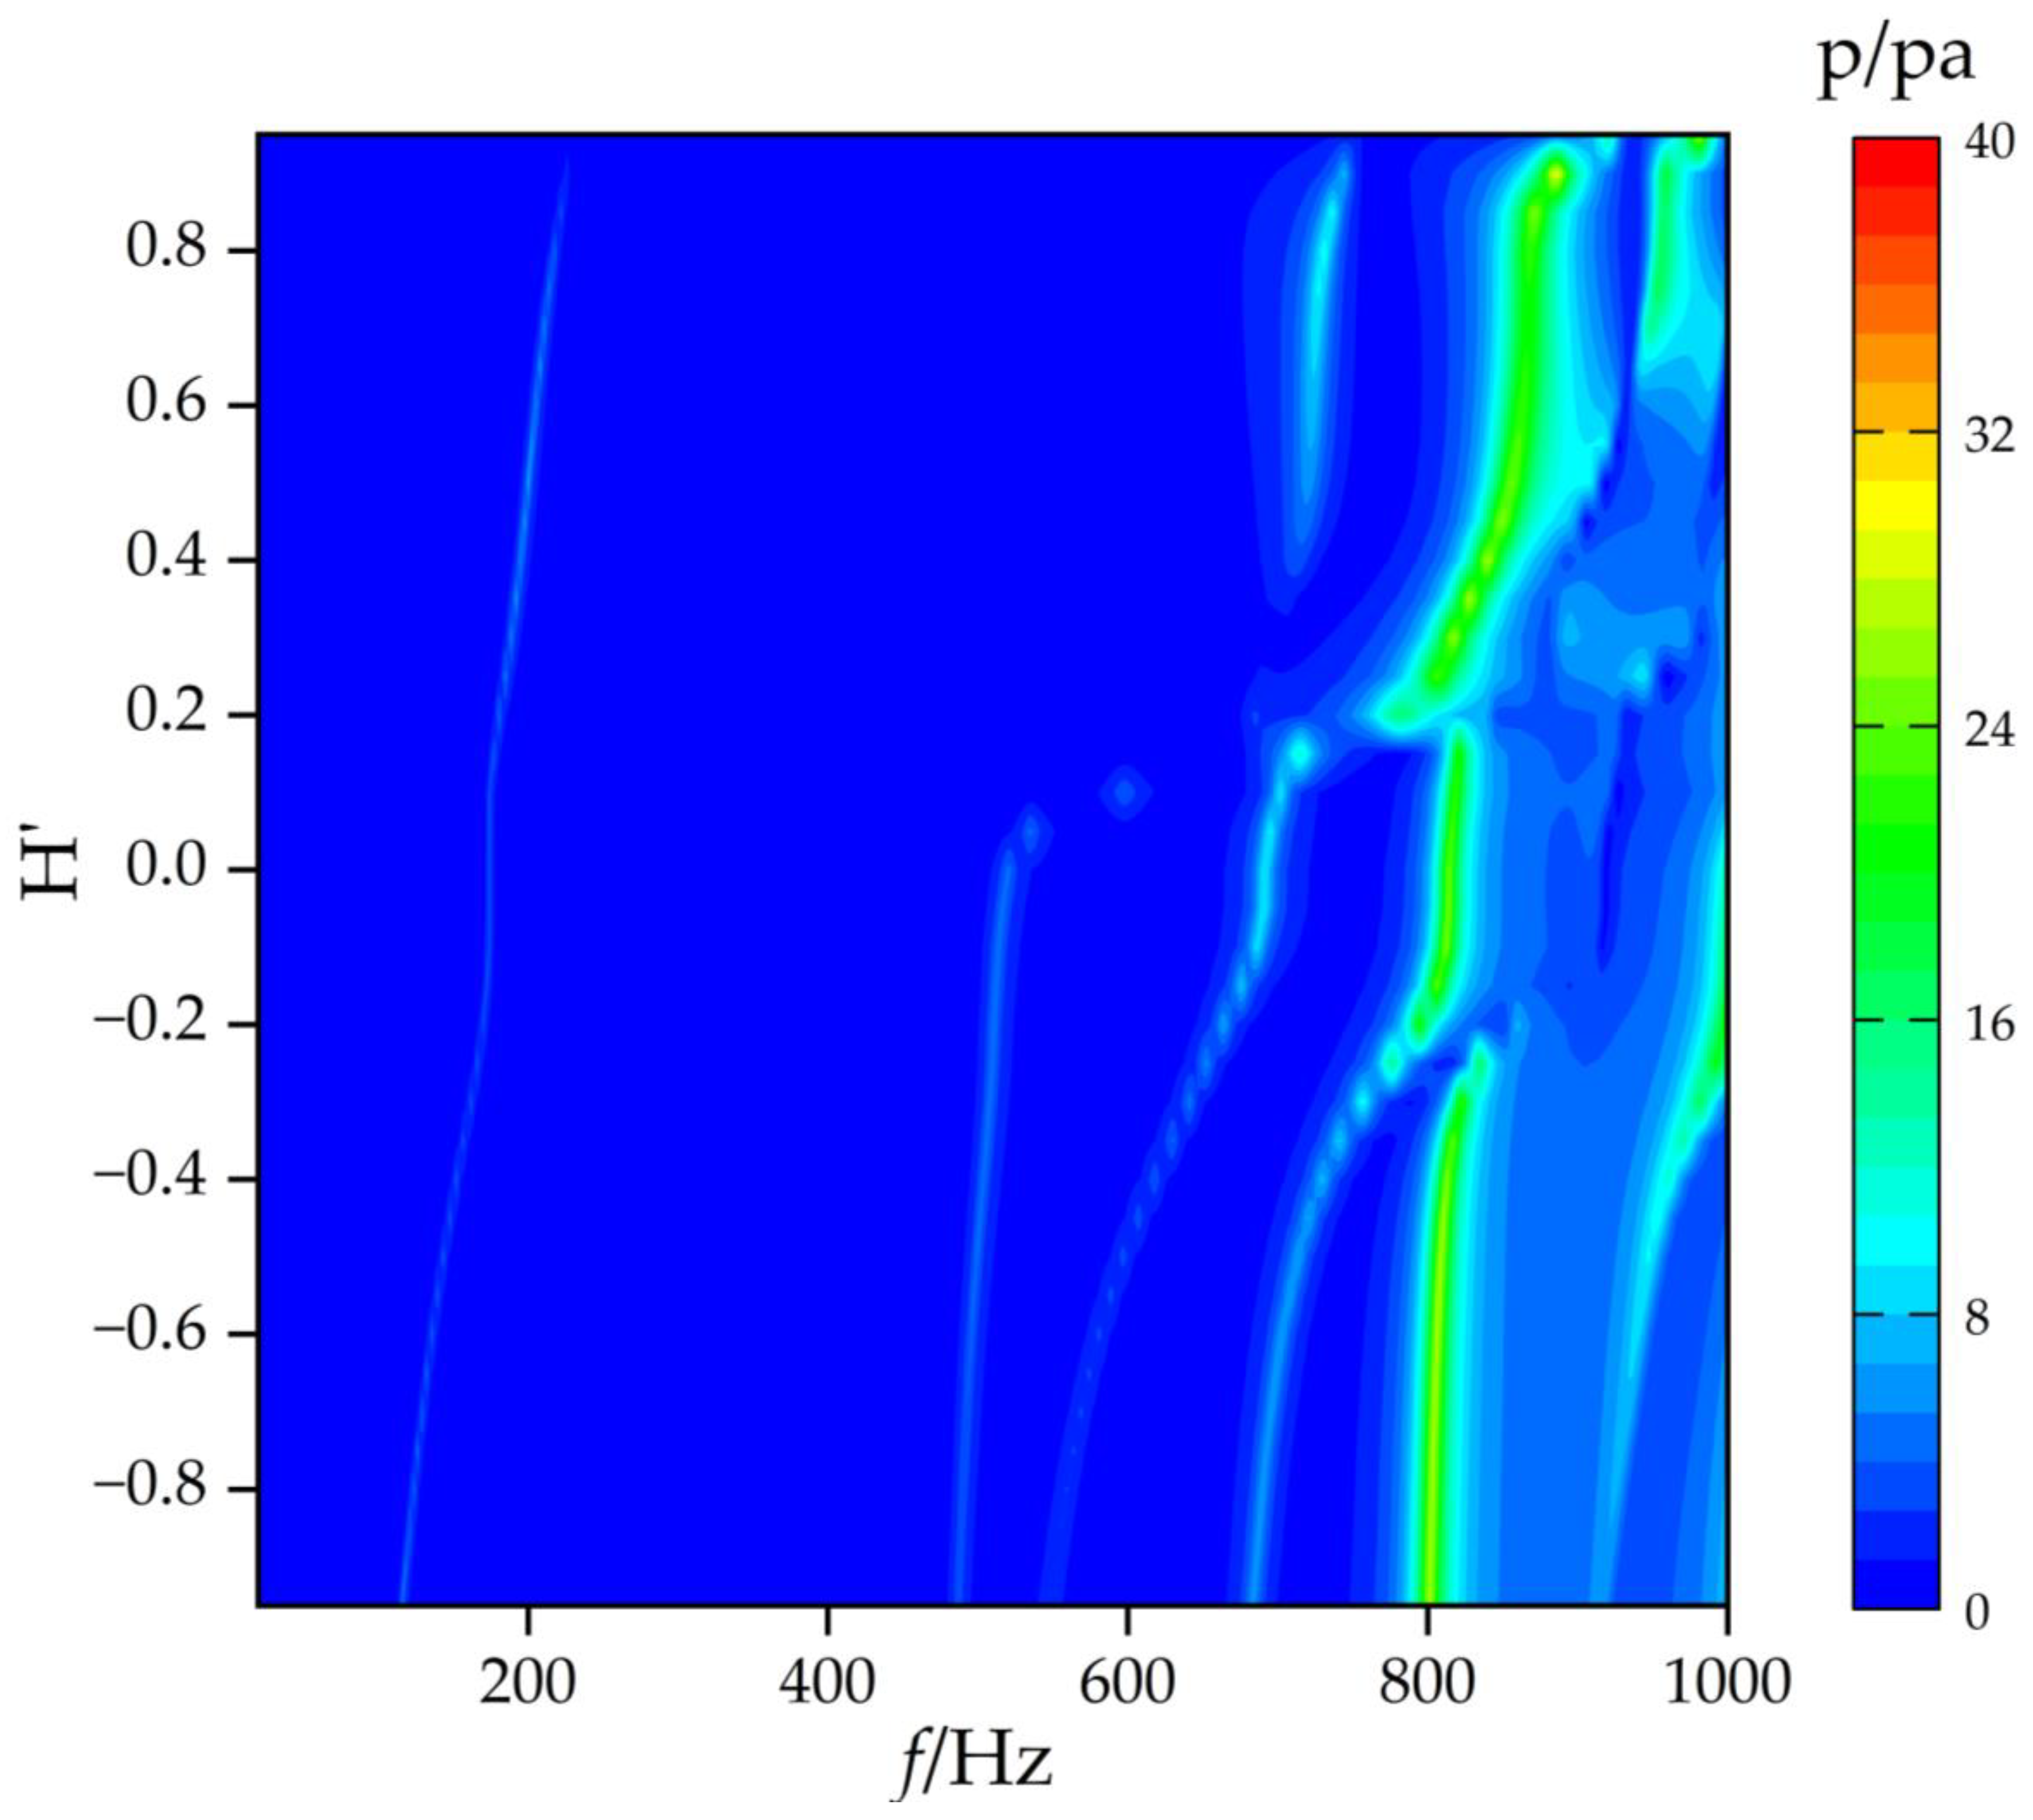
When the excitation force is shifted from the top to the bottom of the underwater glider, the corresponding vibroacoustic responses are illustrated in
Figure 17 and
Figure 18. Due to the closer proximity of the force to the fixed point, the magnitude of acoustic pressure increases across the entire frequency band. From the frequency-depth spectrum, six distinct bright lines can still be observed, although the amplitudes of the first two lines are relatively weaker. The sound pressure amplitude in the high-frequency region is greater than that in the low-frequency region, which is opposite to the phenomenon observed in
Figure 13.
By comparing the sound pressure curves at three different depths, it is found that at H’ = 0.95, there are four extreme points at 230, 752, 922, and 982 Hz. At H’ = 0, five extreme points are observed at 174, 520, 692, 814, and 916 Hz. At H’ = −0.95, six extreme points are identified at 116, 486, 548, 684, 802, and 920 Hz. This pattern is consistent with the phenomena observed under top excitation. In conclusion, changing the excitation point only alters the amplitude of acoustic pressure at the given point, while the corresponding extreme points remain aligned with the eigenfrequencies of the underwater glider.
4. Conclusions
The vibration characteristics of the cylindrical shell with different lengths are obtained by the finite element method. The acoustic-structure coupling, together with the effect of the water surface, is validated by comparisons with experimental or analytical solutions under three cases: half-filled, half-submerged, and partially submerged in fluid. Compared to the verification results, the relative error of the eigenfrequency derived from the numerical results is less than 3%. The cylindrical shell’s mode between the numerical and verification results is either symmetric or anti-symmetric about the plane through the center of the shell and perpendicular to the water surface. The numerical results show good agreement with the experimental or analytical results.
Then the application of the FEM in calculating the dynamic characteristics of a cylindrical shell is extended to that of a disc-type underwater glider. There are six distinct bright curves within the range of 20 to 1000 Hz, corresponding to its natural frequency. The first curve is continuous, while the remaining five curves display discontinuities near H’ = 0. Water depth has a significant impact on the vibrational characteristics of mixed modes, as these modes only exist under the condition of H’ < 0. As the glider enters the water, the wetted surface area expands, resulting in an increase in the added mass due to the surrounding fluid. This causes a shift in the resonance frequencies, as evidenced by the curves transitioning from higher to lower frequencies. A vertical line segment is observed between H’ = −0.1 and H’ = 0.1, corresponding to a region where the geometric curvature changes gradually. The observed phenomenon is independent of the orientation of the observation point and the location of the excitation force.


