Article

A Shoreline Screening Framework for Identifying Nature-Based Stabilization Measures Reducing Storm Damage in the Florida Keys

1
Department of Urban and Regional Planning, Florida Atlantic University, Boca Raton, FL 33431, USA
2
The Nature Conservancy, Arlington, VA 22203, USA
*
Author to whom correspondence should be addressed.
J. Mar. Sci. Eng. 2025, 13(3), 543; https://doi.org/10.3390/jmse13030543
Submission received: 13 February 2025 / Revised: 4 March 2025 / Accepted: 6 March 2025 / Published: 12 March 2025
(This article belongs to the Special Issue Movable Coastal Structures and Flood Protection)

Abstract

:
With elevations mostly less than 2 m, the Florida Keys, an island chain stretching nearly two hundred kilometers from Biscayne Bay to Key West, Florida, is among the most vulnerable coastal regions globally. As the threats from tropical cyclones, storm surges, and sea level rise intensify, urbanized areas increasingly rely on shoreline armoring, disregarding the negative effects on coastal habitats. Living shorelines, which integrate coastal vegetation to stabilize erodible shoreline segments or enhance existing grey infrastructure, have successfully addressed some of these challenges. We present a decision framework for evaluating the suitability of different stabilization methods for existing shoreline conditions. The framework incorporates a Shoreline Relative Exposure Index (SREI) based on shoreline orientation, wind and wave exposure, shoreline slope, bathymetry, nearshore habitat, and storm surge. To refine this framework, we conducted an expert opinion survey to determine parameter weights. The results will inform decisions on using vegetated shorelines alone or with structural elements to reduce wave action, control erosion, and protect Florida Keys communities from storm damage. Implementing innovative shoreline stabilization methods is crucial as climate change and population growth are expected to exacerbate flood management challenges.

1. Introduction

The coastal zone is desirable for habitation and recreation but is subject to various natural and anthropogenic pressures. Many of the largest and most populous cities globally are situated, partly or entirely, near the coast [1]. A recent study found that between 1990 and 2020, the US population living under 3 m elevation grew by 31% [2]. Sea level rise and the increasing frequency and intensity of tropical storms are expected to worsen flood risks in densely populated areas, increasing the exposure of people, infrastructure, economic activities, and natural resources to coastal hazards [3,4,5,6,7,8]. Coastal ecosystems abutting large metropolitan areas have been degraded by unchecked urban development and abundant construction of seawalls and bulkheads. As an alternative to hard armoring, restoration and shoreline enhancement provide ecosystem services as well as the potential for protection against climate hazards, including sea level rise [9,10,11,12,13,14,15]. Natural shorelines can mitigate some of these processes by dissipating wave action, supporting shallow intertidal habitats, and providing conditions for biogenic sediment build-up [16,17].
Perigean tides, marine traffic, and extreme events (e.g., hurricane storm surges) often alter the shoreline position. Combined with the anticipated effects of sea level rise, such phenomena can result in sizable land loss [18,19]. To prevent such loss, considerable portions of the shoreline in urbanized areas are fortified to mitigate the risks from erosion, flood events, and storm surge [20,21]. With the increased threats of coastal hazards, shoreline hardening (e.g., seawalls, levees, breakwater systems, and riprap revetments) is expected to become even more pervasive [22]. Despite the effectiveness of hard armoring, particularly along shorelines with high wave energy conditions, the adverse effects of structural erosion control measures are well documented, including further shoreline retreat in some shoreline segments, scouring, and loss of habitat [23]. At the same time, coastal areas with bulkhead armor are often suitable for living shorelines or hybrid solutions depending on nearshore bathymetry, slope, and habitat conditions [13,24].
An innovative form of hard infrastructure coastal protection is associated with storm surge barriers. Storm surge barriers help mitigate the risk of flooding caused by extreme tidal events, protecting densely populated areas in back bay and estuarine environments [25,26,27,28]. These barriers typically comprise modular gates that remain open during typical meteorological conditions, allowing navigation and natural currents to flow [25,26]. Alternatively, when high tides or storm surges are forecasted to exceed a predetermined safe waterline, the gates are closed to prevent flooding. Among the best-known such projects around the world are the Delta Works projects in the Netherlands, the Thames River Barrier in the U.K., the MOSE project in the Venetian Lagoon, Italy, and the Inner Harbor Navigation Canal (IHNC) Lake Borgne Surge Barrier in New Orleans [26]. Storm surge barriers can shield the entrance of large bays, potentially eliminating the need for the construction of other coastal storm risk management measures [25]. The MOSE project, which became partially operational in 2020, has already been activated over 30 times (despite a projected use of approximately five closures a year) to prevent high-tide flooding into Venice [29].
Despite their notable advantages, storm surge barriers are not without drawbacks. An analysis of the proposed outer and inner Boston Harbor storm surge barriers indicated that, due to high operational and maintenance costs, the projected long-term cost-effectiveness of the project would be marginal. Their environmental impacts, however, could be wide-ranging. Storm surge barriers can limit flow between the ocean and bay, causing disruptions to the nutrient cycles essential for marine ecosystem productivity [28]. Storm surge barriers can also impede the natural migration patterns of aquatic species and cause changes in sediment dynamics, potentially affecting erosion, habitat formation, and ecosystem services [27,28]. Although minimal, with less frequent openings and closures, it is expected that environmental impacts could be amplified by more frequent storms and movable gate operations [26]. A study of the salt marshes adjacent to the flood barrier protecting the Venice Lagoon revealed a process of sediment starvation, which can diminish their ability to offset the effect of rising sea levels [27]. Rather than implementing them alone, combining storm surge barriers with an array of waterfront nature-based and hybrid options offers highly cost-effective alternatives with several key advantages, making them, in a sense, “movable” dynamic responses to flood risks. A holistic flood management approach would integrate structural and non-structural measures to provide protection at multiple scales, manage storm and tidal swells, remain flexible and adaptable in the face of changing environmental conditions, ensure long operational lifespans, and minimize coastal habitat impacts [26].
As an emerging alternative to conventional seawall armoring, “living shorelines” integrate natural habitats into shoreline reinforcement infrastructure [23,30,31,32,33,34]. This supports the long-term survival of coastal habitats, even in the face of tropical storms and sea level rise [34,35]. Research has shown that vegetated shorelines and salt marshes help mitigate wave propagation time, height, and energy during storms, reducing their impact on surrounding areas [36,37,38,39]. Smith et al. [38] investigated vegetation-induced wave attenuation of a hypothetical wetland, finding a 65 to 75% reduction in 100-year storm wave height along the restored shoreline. Similarly, Yang [39] compared the benefits of marsh vegetation in reducing wave height, sedimentation rates, and bottom current velocity. Results show lower current velocities in the tidal marsh and wave attenuation, which is more than 40% lower in the seagrass community [39]. Similarly, oyster reef living shorelines can attenuate wave action and, unlike traditional seawalls and bulkheads, adapt and rapidly recruit, keeping up with the rate of sea level rise [40]. Vegetated shorelines generally exhibit measurably lower erosion rates than adjacent erodible, unvegetated segments, further highlighting the effectiveness of living shorelines [20,41]. Mangroves, strategically placed along existing seawalls, can help extend their life while simultaneously providing ecosystem services.
Consequently, nature-based stabilization can be integrated into hybrid control measures that combine natural features with structural elements, which may be more suitable for higher-energy environments [23,30,42]. For example, in high-energy coastal areas (those with fetches exceeding 1 nautical mile), marsh fringes can be combined with breakwaters [43]. When choosing hybrid over entirely natural stabilization methods, it is essential to weigh potential trade-offs in biodiversity and habitat services [17]. Morris et al. [40] emphasize that combining engineering and ecological approaches in designing oyster reef living shorelines maximizes their ability to attenuate wave energy and support oyster habitat revitalization. For instance, New York’s Living Breakwaters project combines hard, ecologically enhanced concrete armoring units with oyster shells and spat to increase biogenic build-up, strengthening the hard structure over time and increasing biodiversity [44].
Advancements in geospatial technologies have created the ability to combine anthropogenic stressor data with site-specific terrestrial and marine environmental data on a regional scale [45]. This knowledge can help coastal resource managers systematically evaluate priority areas for coastal resource protection and/or commercial and recreational services, potentially averting or alleviating conflict from competing uses and facilitating a flexible, proactive, and sustainable governance structure [45,46]. Important criteria when determining the applicability of nonstructural and hybrid shoreline stabilization options include slope/elevation, substrate, salinity regime, vegetation, surrounding uses, bank conditions, existing protection structures, and level of protection required for existing or future development [42]. Furthermore, design requirements for storm surge conditions and risk protection must be considered [47].
The Virginia Institute of Marine Science’s (VIMS) Center for Coastal Resources Management (CCRM) developed one of the first GIS suitability models for living shorelines, the Living Shoreline Suitability Model (LSSM), that provided homeowners and environmental managers with shoreline analysis and proposed stabilization solutions [30,47]. It has since been utilized and adapted in various studies [9,10,14]. More recently, the shoreline management model (SMM) was introduced in response to a 2011 Virginia law identifying living shorelines as the preferred erosion control method statewide [48]. In addition to variables included in the LSSM, the SMM includes riparian land use/land cover, public boat ramp, road, structure, canal, and tributary designation data [13,48]. However, unlike the LSSM, which produces three generic outputs (soft stabilization, hybrid options, or unsuitable), the SMM generates thirteen possible recommendations: three living shoreline options, three traditional management approaches, two options maintaining existing treatments, and five cases of special consideration. The comprehensive model is based on flow diagrams developed by CCRM at VIMS [48].
Prior living shoreline suitability assessments have largely explored coastal bays, barrier islands, and estuarine environments [9,10,11,12,13,14,15]. Our study builds on previous efforts with a specific focus on unique challenges presented by the Florida Keys, a tropical archipelago. Effective coastal flood control is imperative throughout the Florida Keys, particularly because the low-lying island chain faces serious threats from compound flood events. Multiple flood drivers happening concurrently or within close succession (e.g., rain, storm surge, and high tides), known as compound flooding, is an increasing concern for coastal communities [49,50]. The interaction of drivers that influence compound flooding is complex [51,52], and the impacts of compound floods are usually more serious [52]. Compound flooding is influenced by the nature and number of physical factors involved, the temporal and spatial scale of these factors, and the extent of dependence among the processes [51]. Within the Florida Keys, coinciding the annual king tides with the height of the hurricane season elevates the risk of coastal flooding. Furthermore, compound flooding will be amplified by sea level rise and climate change, underscoring the need to enhance coastal resilience in this at-risk region.
The primary objective of this research is to aid in the development of spatial decision-support tools for shoreline management, promoting coastal resilience and sustainability. This project has three primary objectives: (1) construct a Shoreline Relative Exposure Index (SREI) that combines physical shoreline characteristics with a weighting scheme drawn from an expert opinion survey; (2) develop a decision tree for the selection of the most suitable stabilization option; using subject expert input; and (3) evaluate the viability of the proposed solutions across different land use types.

2. Materials and Methods
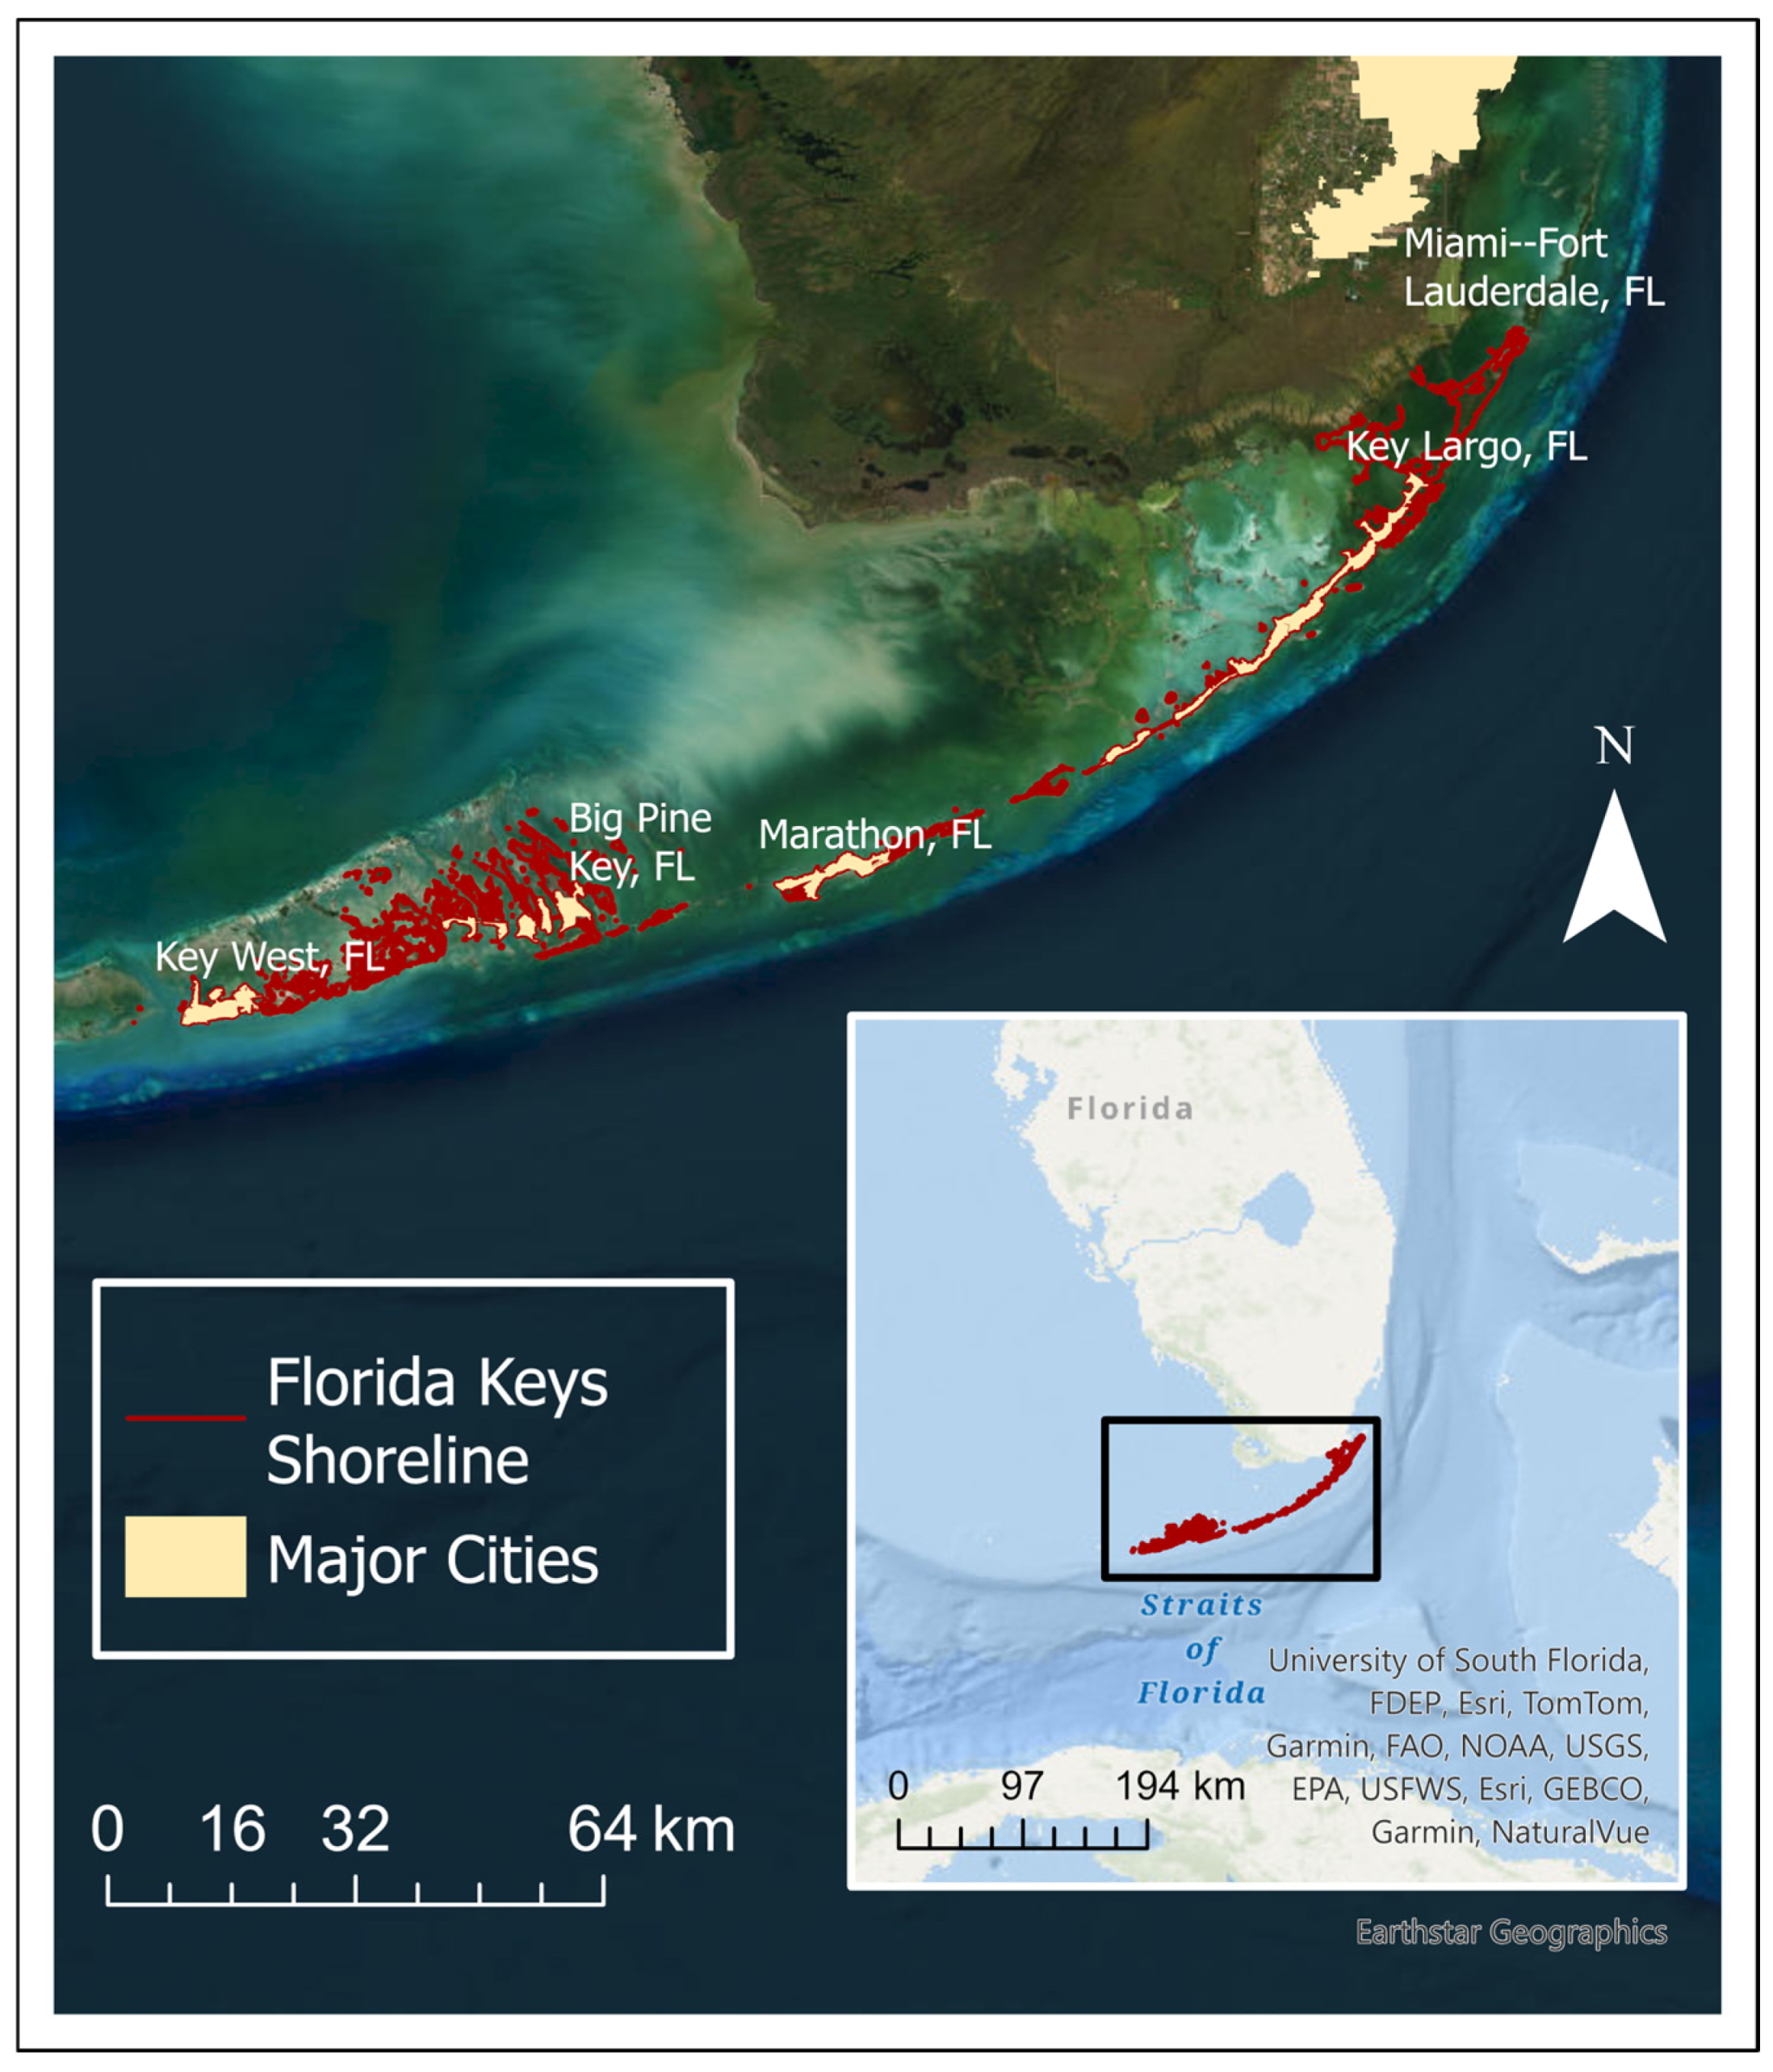
2.1. Study Area

The Florida Keys (Figure 1) is a low-lying limestone archipelago that extends approximately 200 km off the tip of the Florida Peninsula. It is located in Monroe County, Florida, which has a population of 80,614 [53], most of whom reside in several urban areas, including Key West, Big Pine Key, Key Largo, and Marathon. Residents of the Florida Keys typically live under 2 m elevation. The Overseas Highway (U.S. Highway 1) is the primary transportation link for the region and the exclusive land-based connection to mainland Florida [54]; it spans over 180 km and includes more than 40 bridges. This unique geography and infrastructure, coupled with a tropical climate, puts the Florida Keys at an extreme risk of environmental threats associated with climate change (e.g., hurricanes and sea level rise).
Since 2015, the Florida Keys has experienced four hurricanes—Irma (2017), Ian (2022), Helene (2024), and Milton (2024)—as well as multiple tropical storms. Hurricane Irma, which reached Category 4 status with sustained winds of 209 kmph and storm surge heights up to 2.4 m [National Weather Service, Monroe County], severely damaged built and natural spaces throughout the island chain. A coinciding of the October-November perigean high (king) tides, usually the highest annual tides when seawater overtops property walls, backs up storm drains and inundates streets, and the peak of the hurricane season, when heavy rainfall and storm swells are common, heightens flood risks in communities regionwide. As sea levels rise, these threats are expected to intensify, compounding coastal management challenges in the Florida Keys.
This chain of small islands is ecologically rich and features various habitats: mangroves, salt marshes, coral reefs, seagrasses, upland forests, and inland wetlands. Its shallow waters host the only coral barrier reef in the continental U.S. and a wide range of aquatic species, and its hardwood hammocks provide crucial habitat for migratory birds and other land-based species. Many threatened and endangered species are found there (e.g., Key deer, sea turtles, roseate tern). Additionally, the Florida Keys has one of the most expansive seagrass beds worldwide. Due to its southern location, it is a part of the only region within the mainland U.S. with tropical flora and fauna. The ecological diversity and warm climate make the Florida Keys a popular tourist destination.
However, in addition to coastal flooding, the region faces other environmental challenges, such as water quality decline, overfishing, and habitat degradation/fragmentation. Large areas of its limited land have been developed to support population growth and tourism. Meanwhile, human activities like boating can damage seagrass beds and coral. To protect marine environments, more than 11,600 km2 of waters surrounding the Florida Keys was designated as the Florida Keys National Marine Sanctuary, while some remaining terrestrial ecosystems are protected at the federal, state, and local levels. Habitat restoration and protection are identified as major regional conservation goals by agencies, including the National Oceanic and Atmospheric Administration (NOAA) and the Florida Fish and Wildlife Conservation Commission (FFWCC) [NOAA, FFWCC].

2.2. Methods

2.2.1. Conceptual Decision Framework for Nature-Based Solutions

Previous research identifies multiple factors that characterize the potential for coastal erosion, such as fetch, nearshore substrate, bathymetry, shoreline configuration and orientation, elevation, sediment type, submerged and fringing vegetation, boat wakes, and storm surge [11,13,23,30,42,55,56,57,58]. High fetch values or average open water distances exceeding ~300 m (1000 feet) are associated with greater erosion potential [42,58]. Lower elevations and unconsolidated sand/peat are associated with higher erosion rates, while shallow water and gradual slopes in nearshore areas reduce erosion compared to deeper water and steeper slopes [55]. Furthermore, the straight-line configuration of the shoreline and its location on a headland create conditions where erosion is more likely to occur compared to irregularly shaped coasts. Abundant, dense fringing vegetation (aquatic plants, marsh grasses, shrubs, and trees) [30] and submerged aquatic vegetation [57] are known factors that can mitigate shoreline erosion. Low-wave energy systems like bays and estuaries are less susceptible to erosion than open ocean coasts, where intensity, duration, and frequency of storms can trigger severe erosional events [42,56,59].
The physical shoreline analysis was combined with a stakeholder engagement process and an expert opinion survey to develop a generic suitability model for nature-based shoreline stabilization options in coastal environments that incorporates three components: (1) shoreline exposure variables; (2) prioritization and assignment of weights to variables using expert opinion; and (3) multi-objective/multi-criteria suitability analysis and mapping. The Shoreline Relative Exposure Index (SREI) calculation integrates shoreline orientation, wind and wave exposure, nearshore slope, water depth, nearshore habitat, and storm surge. The index was rescaled to a five-point scale, where 1 stands for very low exposure to 5 (very high exposure). Weights for selected variables were determined using an expert opinion survey. We summarized the survey responses using the Analytic Hierarchy Process (AHP) [60] by constructing a reciprocal matrix of pairwise comparisons. The weights are determined using eigenvectors derived from the pairwise comparisons matrix [61].
We evaluated the outcomes of the analysis (composite SREI and underlying factors) in relation to the existing shoreline types to identify coastline segments suitable for soft stabilization, hybrid treatments, or shoreline enhancements and to assess the feasibility of implementation. The decision framework was applied to a range of shoreline types (Table 1). Figure 2 describes the decision factors and how they are applied to various types of broadly defined nature-based and hybrid shoreline stabilization categories.

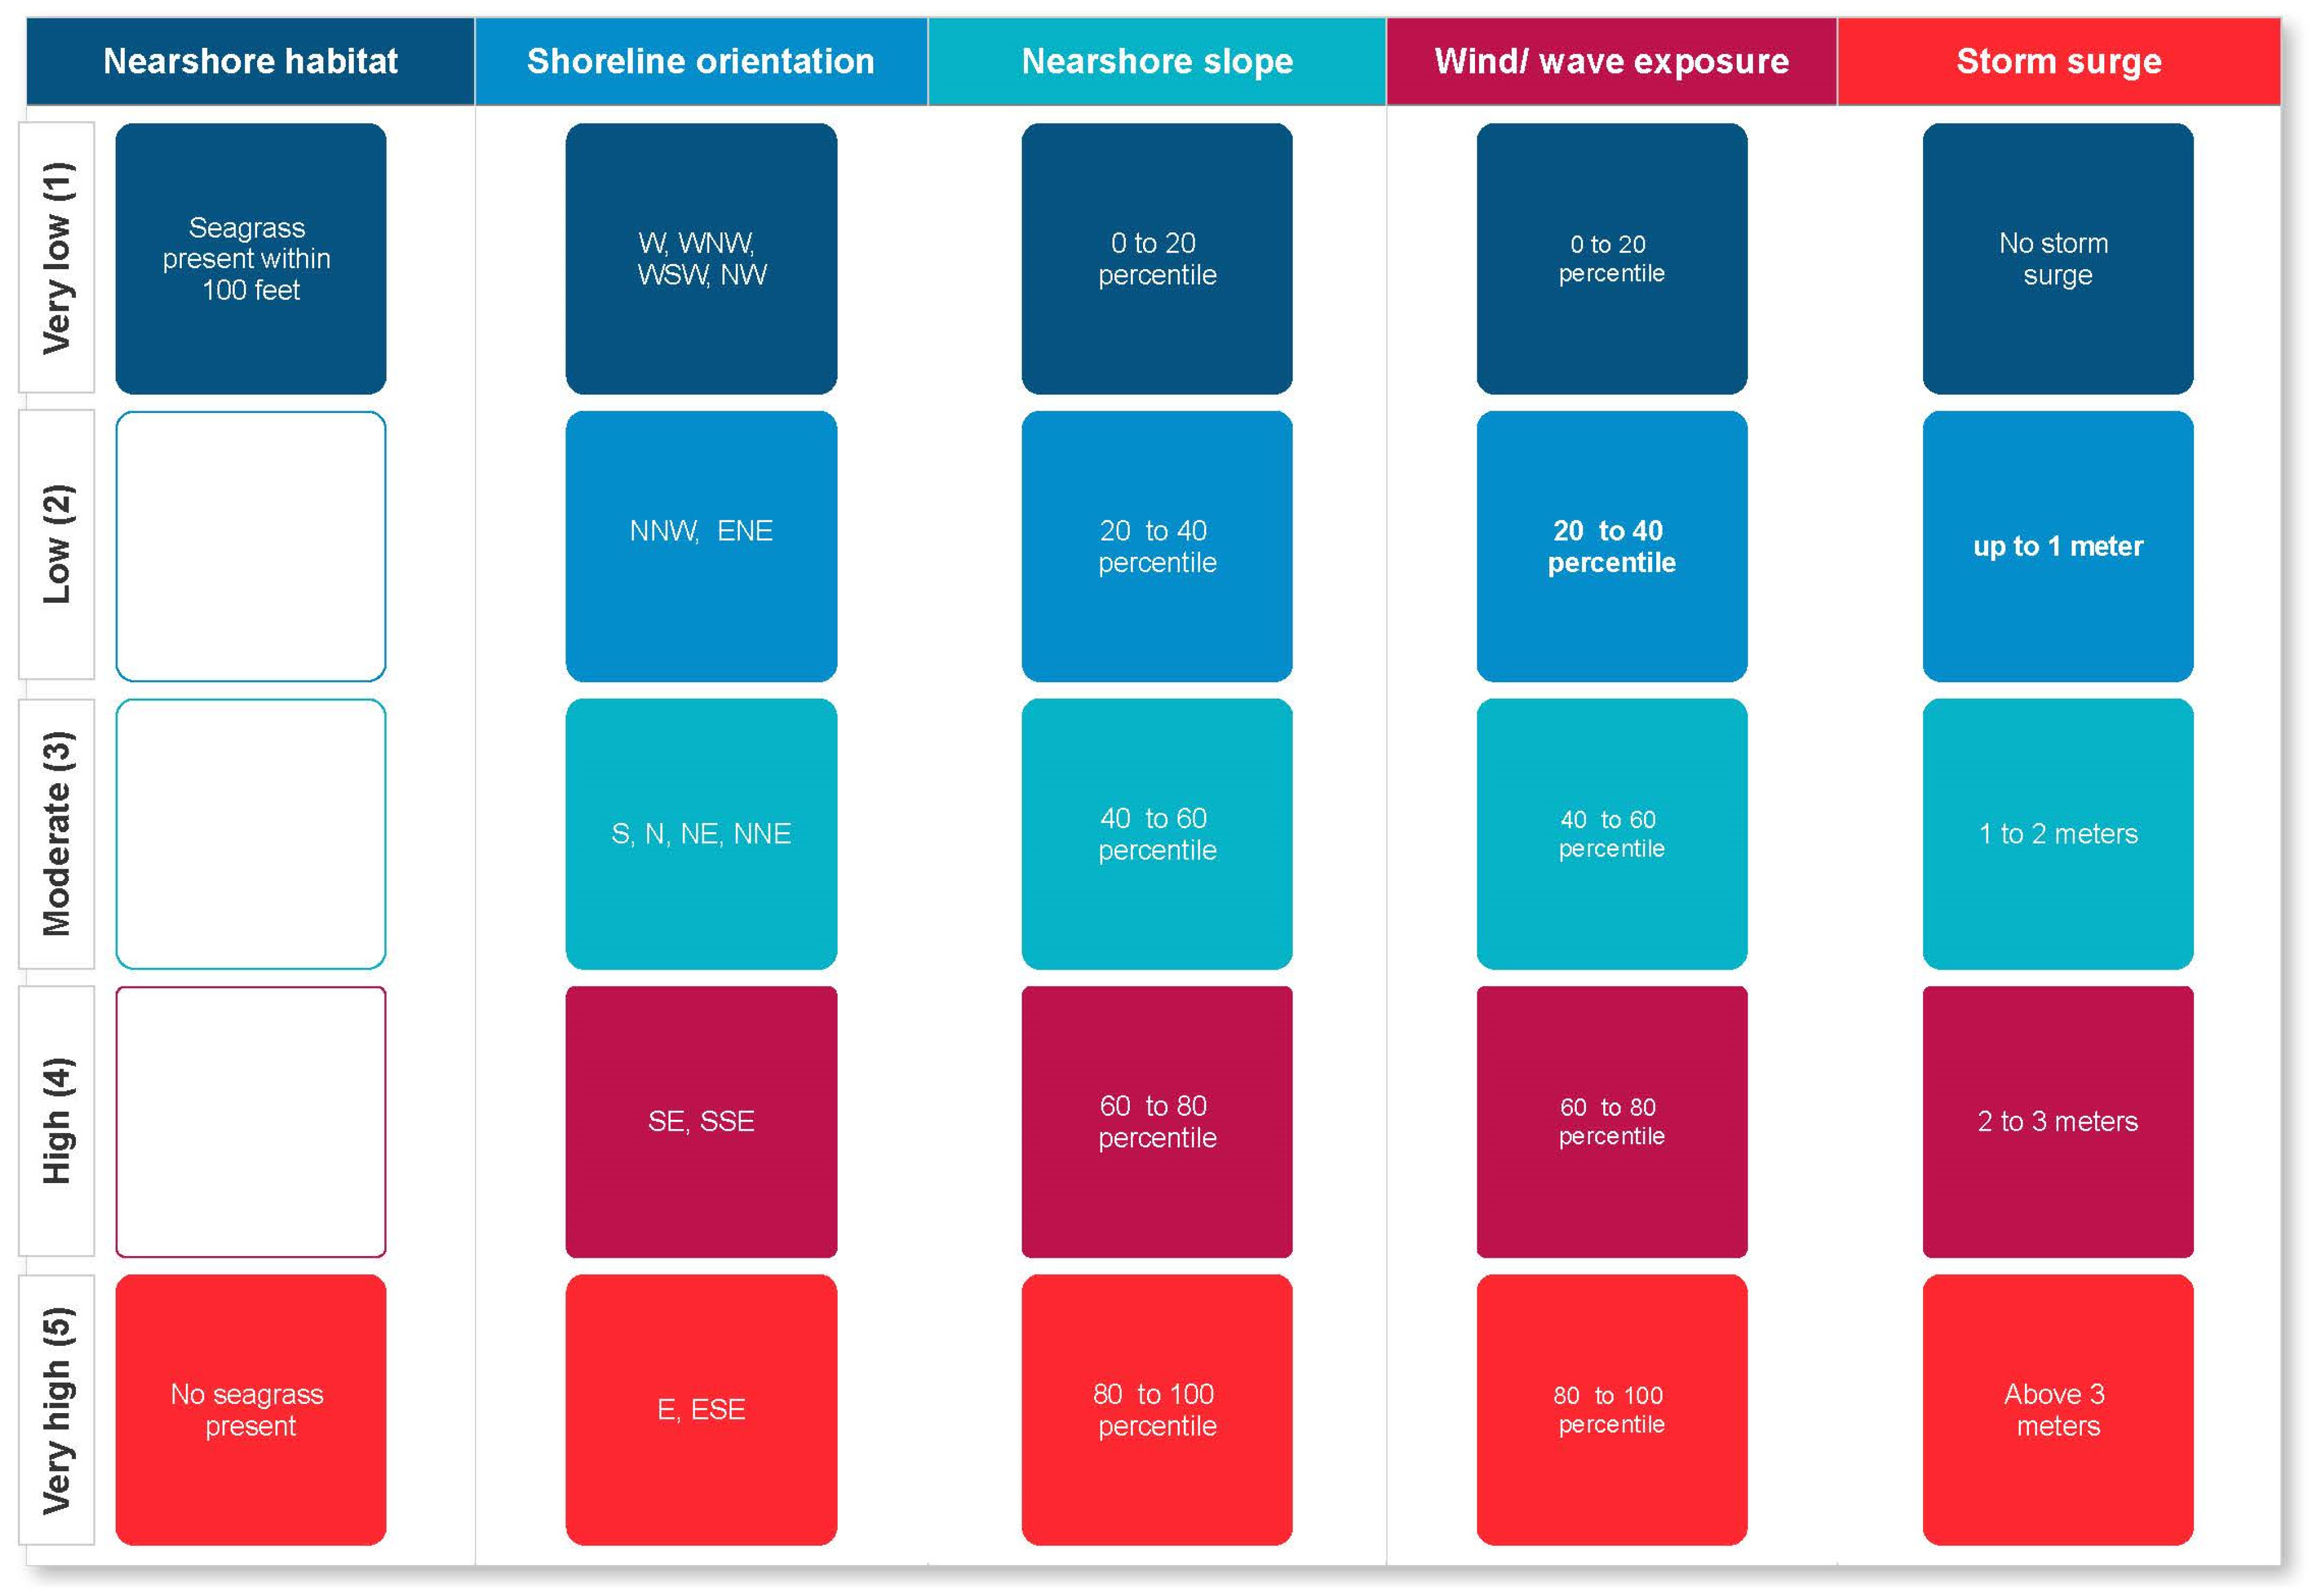
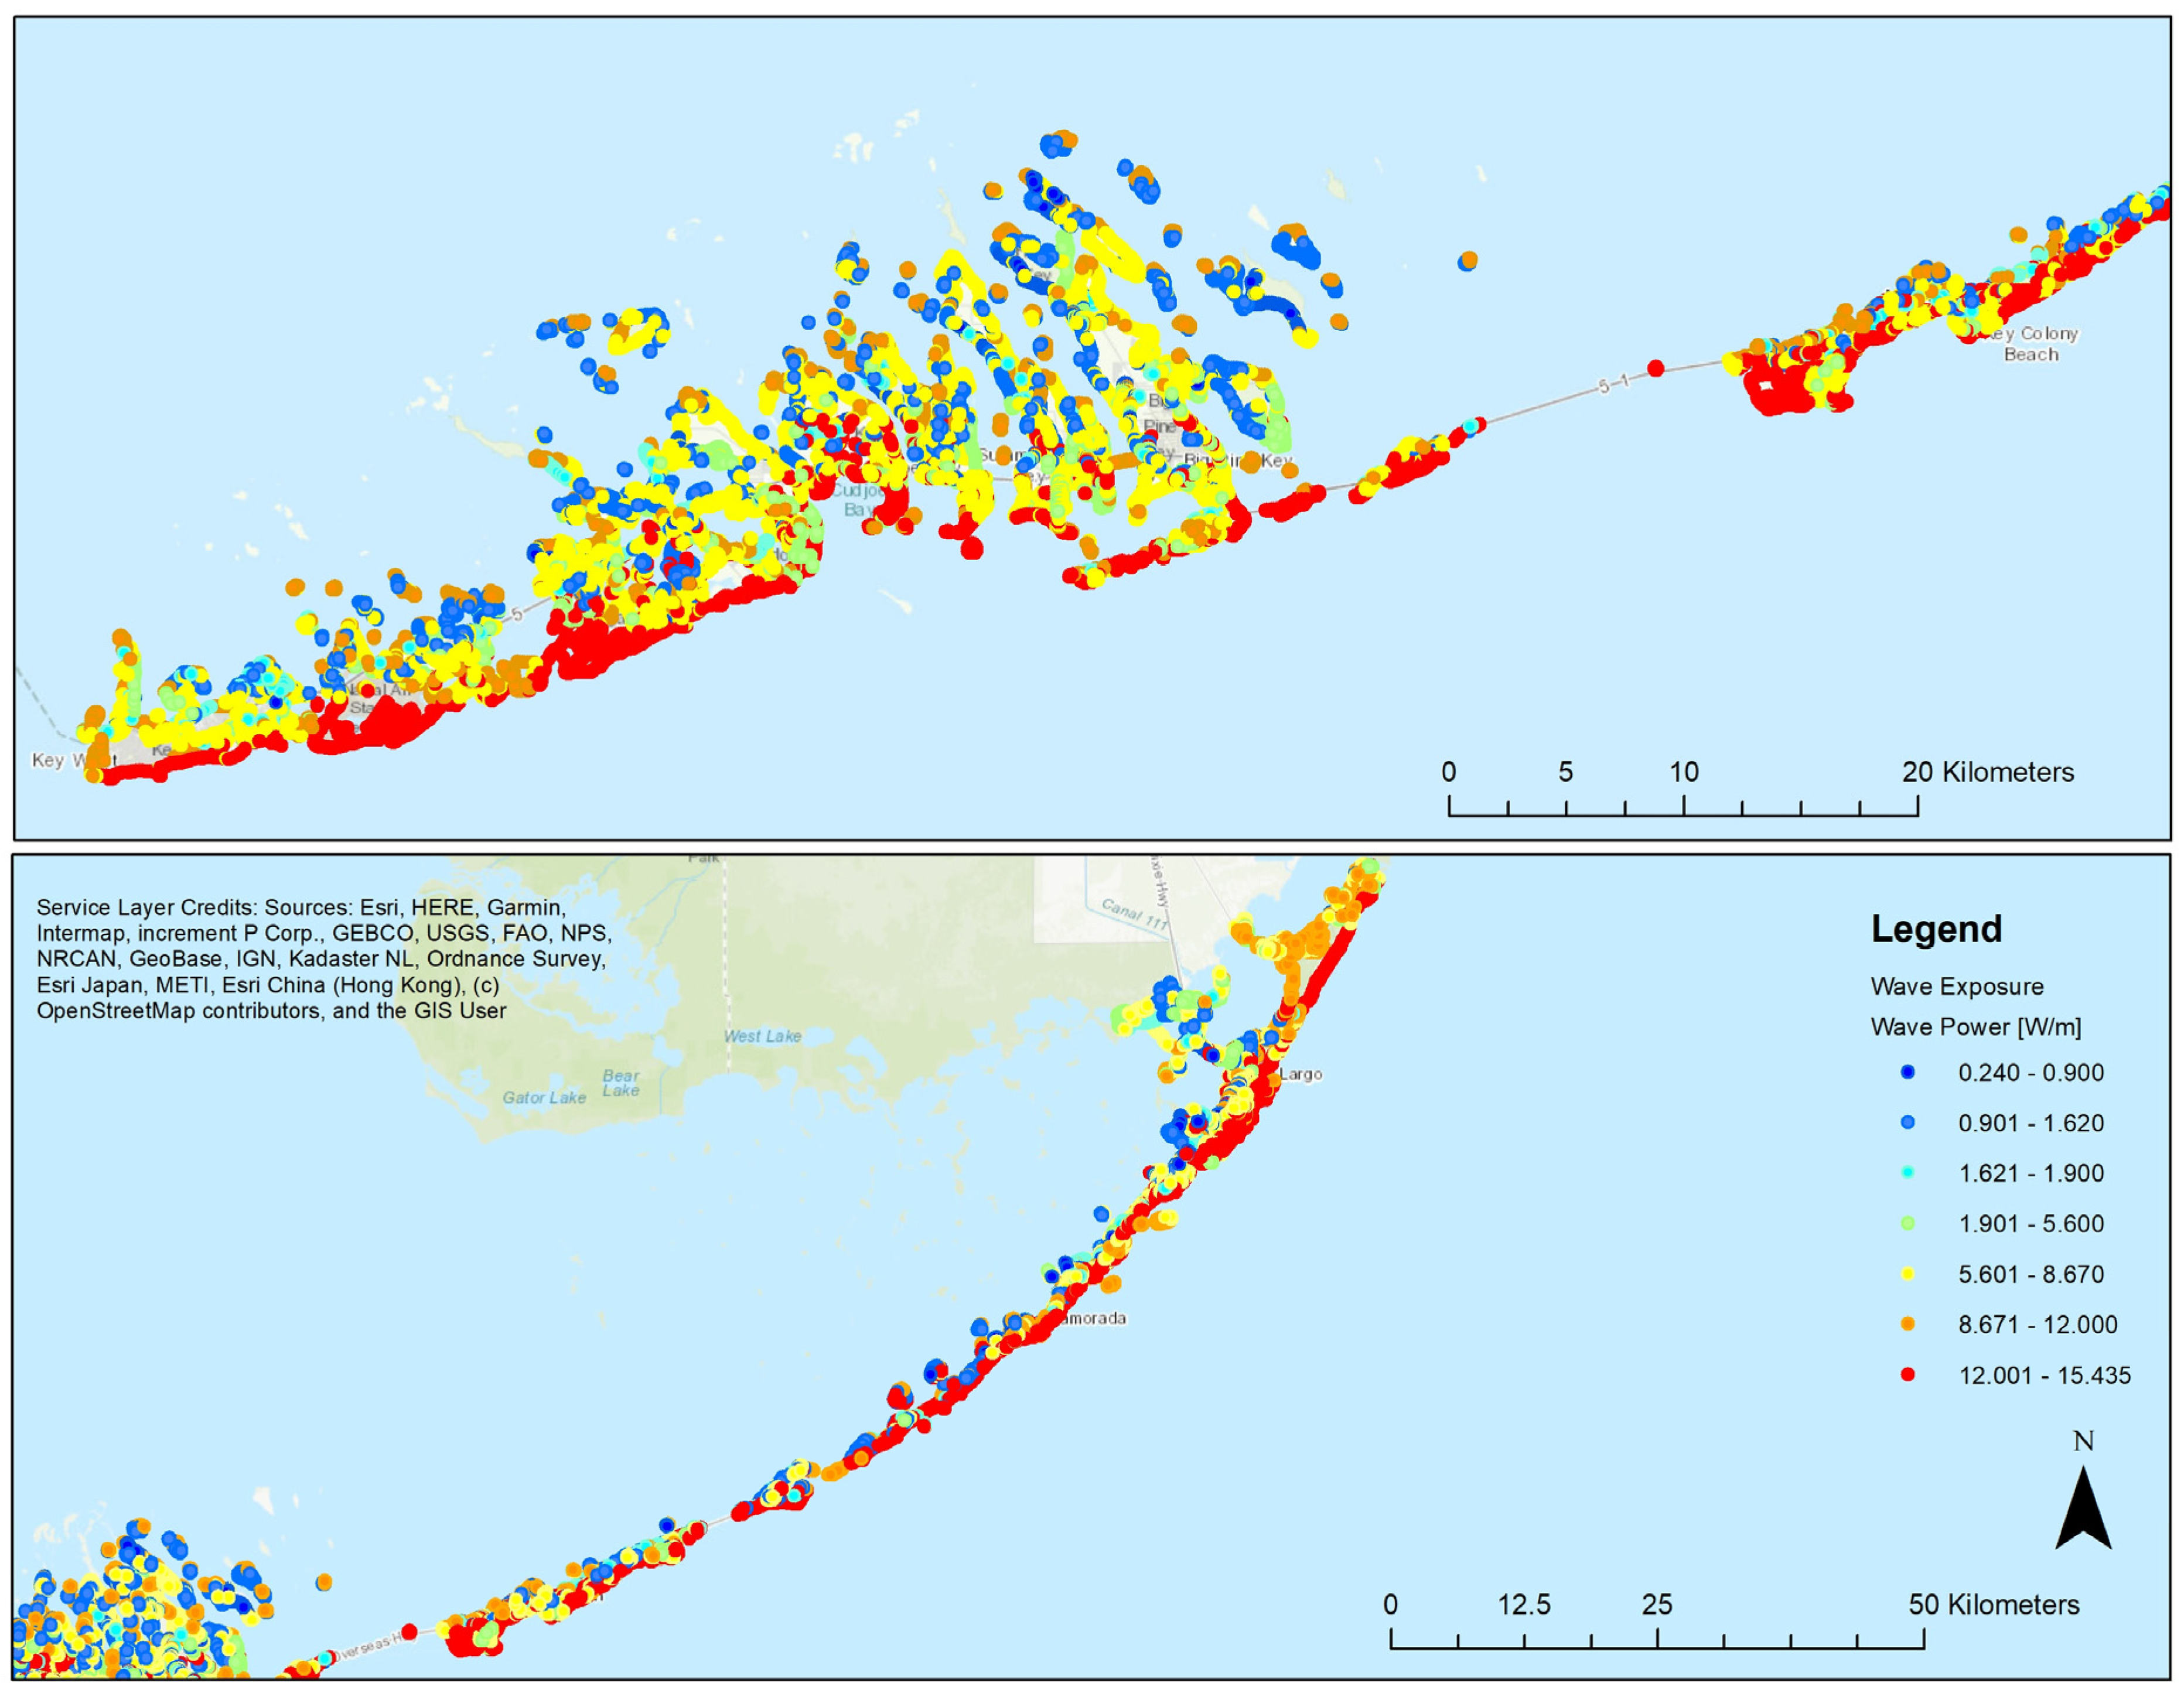
2.2.2. Shoreline Relative Exposure Index (SREI)

The Shoreline Relative Exposure Index is a modified version of the Exposure Index [11], which draws from InVEST’s Coastal Vulnerability Model constructed by the Natural Capital Project [62]. SREI is conceptually and algorithmically different from EI [11] in several aspects: (i) it is applicable to open ocean coasts while EI was designed for estuarine environments; (ii) it incorporated shoreline orientation and seasonal wind analysis while EI emphasized the impact of recreational marine traffic and boat wakes; (iii) SREI includes shallow-water wave forecasting models [63] while EI relied on the Coastal Vulnerability Model (CVM) (http://releases.naturalcapitalproject.org/invest-userguide/latest/en/coastal_vulnerability.html, accessed on 12 February 2025) developed by Sharp et al. [62]; and (iv) EI derived storm surge risk from the generalized output of the SLOSH model while here hindcast output from US Army Corps of Engineers (USACE) ADCIRC (Advanced CIRCulation Model) (https://adcirc.org/) [64] for the Category 4 Hurricane Irma provided the basis for the storm surge exposure analysis. A key difference with InVEST® v3.14.3 was the computation of weights derived from an anonymous survey of coastal managers, planners, environmental specialists, and developers. Furthermore, instead of rankings based on a geometric mean, we used the weighted rank scores as indicated by Equation (1):
S R E I = ( i = 1 n R i w i + + R n w n ) / n
in which n represents the number of variables, Ri is the rank score denoting the degree of shoreline exposure where 1 stands for a very low exposure and 5 (very high exposure), and w i is the parameter weight derived from the expert survey and the AHP. The variables included in the exposure analysis are shown in Figure 3.
Shoreline data were obtained from the Florida Fish and Wildlife Conservation Commission [65]. The shoreline descriptions included in the Environmental Sensitivity Index (ESI) [66] were updated using aerial imagery and local expert knowledge. In order to estimate exposure, the shoreline file was converted to equally spaced (every 100 m) point features. In addition, two polylines were generated parallel to the shoreline file, straight transects extending perpendicularly from the baseline were added, and additional points were inserted where the transect line intersected the parallel lines. Seagrass habitat data were obtained from the Florida Fish and Wildlife Commission.
Using LiDAR data from the South Florida Water Management District [67], the elevation of the point features was determined. Elevation is a major factor impacting the species distribution of mangroves and marsh plants that must be considered. Due to the history of disturbance and urbanization in Florida, many restoration sites require clearance of invasive vegetation and re-grading by scraping back soils to elevations appropriate for native plants to recruit [68]. We extracted the elevation of points located 10 m from the shoreline point in the landward direction, then used a topobathymetric LiDAR compiled by Taylor Engineering for FEMA (unofficial release) to extract water depths at a distance of 10 m seaward from each shoreline point (Figure 4). These elevations were then employed when calculating nearshore and landward slopes. The slope angle was found using the equation:
( α ) = tan 1 y x
The slope was estimated using slope angle. A shallow nearshore environment suitable for nature-based stabilization measures was defined by water depths under 1 m, approximately 10 m from the waterline and a gradient angle below 6 degrees (10% slope). Contrarily, coastal areas not meeting this threshold were deemed unsuitable.
Daily summaries of local climatological data (2015 and 2016) were downloaded from the National Environmental Satellite, Data, and Information Service, National Oceanic and Atmospheric Administration, and National Centers for Environmental Information (NOAA-NCEI). The data were collected at Key West International Airport, FL (WBAN: 12836). Wind exposure for May–October and November–April was calculated based on wind direction and velocity. Probability density functions based on wind speed were estimated for each of the 16 cardinal directions (Table 2). The wind speed probability density functions determine the conditional probability that the wind will exceed a certain velocity, given that it is coming from a particular direction. The conditional probability was rescaled from 0 to 100 using minimum-maximum standardization; rescaled values were converted on a 1 to 5 scale to be consistent with the suitability classification. We applied the Linear Directional Mean tool from the ArcGISTM 10.8.1 Spatial Statistics toolset to estimate the shoreline orientation. Features were grouped for separate linear directional mean calculations using the case field.
Wave exposure was estimated based on the wave power equation shown below:
P = p g 2 H m 0 2 T 64 π 0.5 k w m 2 s H m 0 2 T
where Hm0 indicates significant wave height (in meters), T stands for wave period (in seconds), g stands for the acceleration of gravity (m/s2), ρ is the mass density of seawater (kg/m3), and π = 3.14159. We used average wind speed in each of the 16 cardinal directions with the USGS Fetch- and Depth-Limited Waves Javascript app to estimate wave height and wave period. The script implements Equations (3)–(28a) [63] to estimate adjusted wind speed UA and shallow-water wave forecasting models (Equations (3)–(39) and (3)–(40)) [63]. The inputs to the shallow-water wave forecasting models include adjusted wind speed UA, fetch f, and the water depth h. The computed results include the significant wave height (Hs) and wave period (T) used in Equation (3) to estimate wave power.
The analysis was performed under both non-storm and storm conditions. Whereas non-storm wind speed and direction are outlined above, to understand storm-related impacts, storm surge and wind were modeled reflecting conditions during Hurricane Irma, a devastating Category 4 storm. Storm surge data for Hurricane Irma were acquired from the Coastal Emergency Risks Assessment (CERA) [69]. The estimated maximum water height and maximum inundation above ground for the landfall, among other parameters, are derived from multiple runs of the US Army Corps of Engineers (USACE) ADCIRC (Advanced CIRCulation Model) [64]. ADCIRC is a hydrodynamic model certified by the Federal Emergency Management Agency (FEMA) to perform short- and long-term simulations of tides, as well as storm surge swell and velocity projections [64]. Using the hindcast modeling of Hurricane Irma, shoreline exposure was classified as very low (no impact), low (storm surge ≤ 1 m), medium (storm surge 1–2 m), high (storm surge 2–3 m), and very high (storm surge ≥ 3 m). Because of the circular rotation of hurricanes, shoreline orientation was not a major deciding factor when conducting the ADCIRC simulations.
Nearshore and upland habitat presence were also considered in the analysis to indicate that conditions to support the implementation of nature-based shoreline stabilization are present (Figure 5). Nearshore (aquatic) vegetation layers were downloaded from NOAA (ESI) and the Florida Fish and Wildlife Commission.

2.2.3. Parameter Weights from Expert Input

The assignment of variable weights is often at the discretion of the analyst. However, involving stakeholders and experts in the process can enhance participation and refine the influence of each variable on the composite score by incorporating local knowledge and experience. To achieve this, the Shoreline Resilience Working Group of the Southeast Florida Regional Climate Change Compact invited eighty-five experts to participate in an anonymous survey. In the survey, exposure variables were presented in pairwise comparisons, and respondents were asked to determine which parameter in each set was more important or if they held equal weight. Additionally, the respondents were prompted to consider factors such as land use, regulatory constraints, and ownership. A reciprocal pairwise comparison matrix, structured as AA−1 = 1, where A = [λab]nxn, was used to process survey responses. The matrix was then inverted so that λab = λab−1, where λab represents the pairwise comparison value between attributes a and b. The eigenvectors on which weights were based were calculated by squaring the matrix and normalizing the row values, yielding the final weight distribution.

3. Results

This section offers a comprehensive overview of the diverse shoreline types that define the Florida Keys, followed by a discussion of the wind analysis, shoreline orientation, wave power modeling, and the aggregated Shoreline Relative Exposure Index for the Florida Keys. Finally, the suitability analysis results will be discussed with the corresponding shoreline stabilization options.

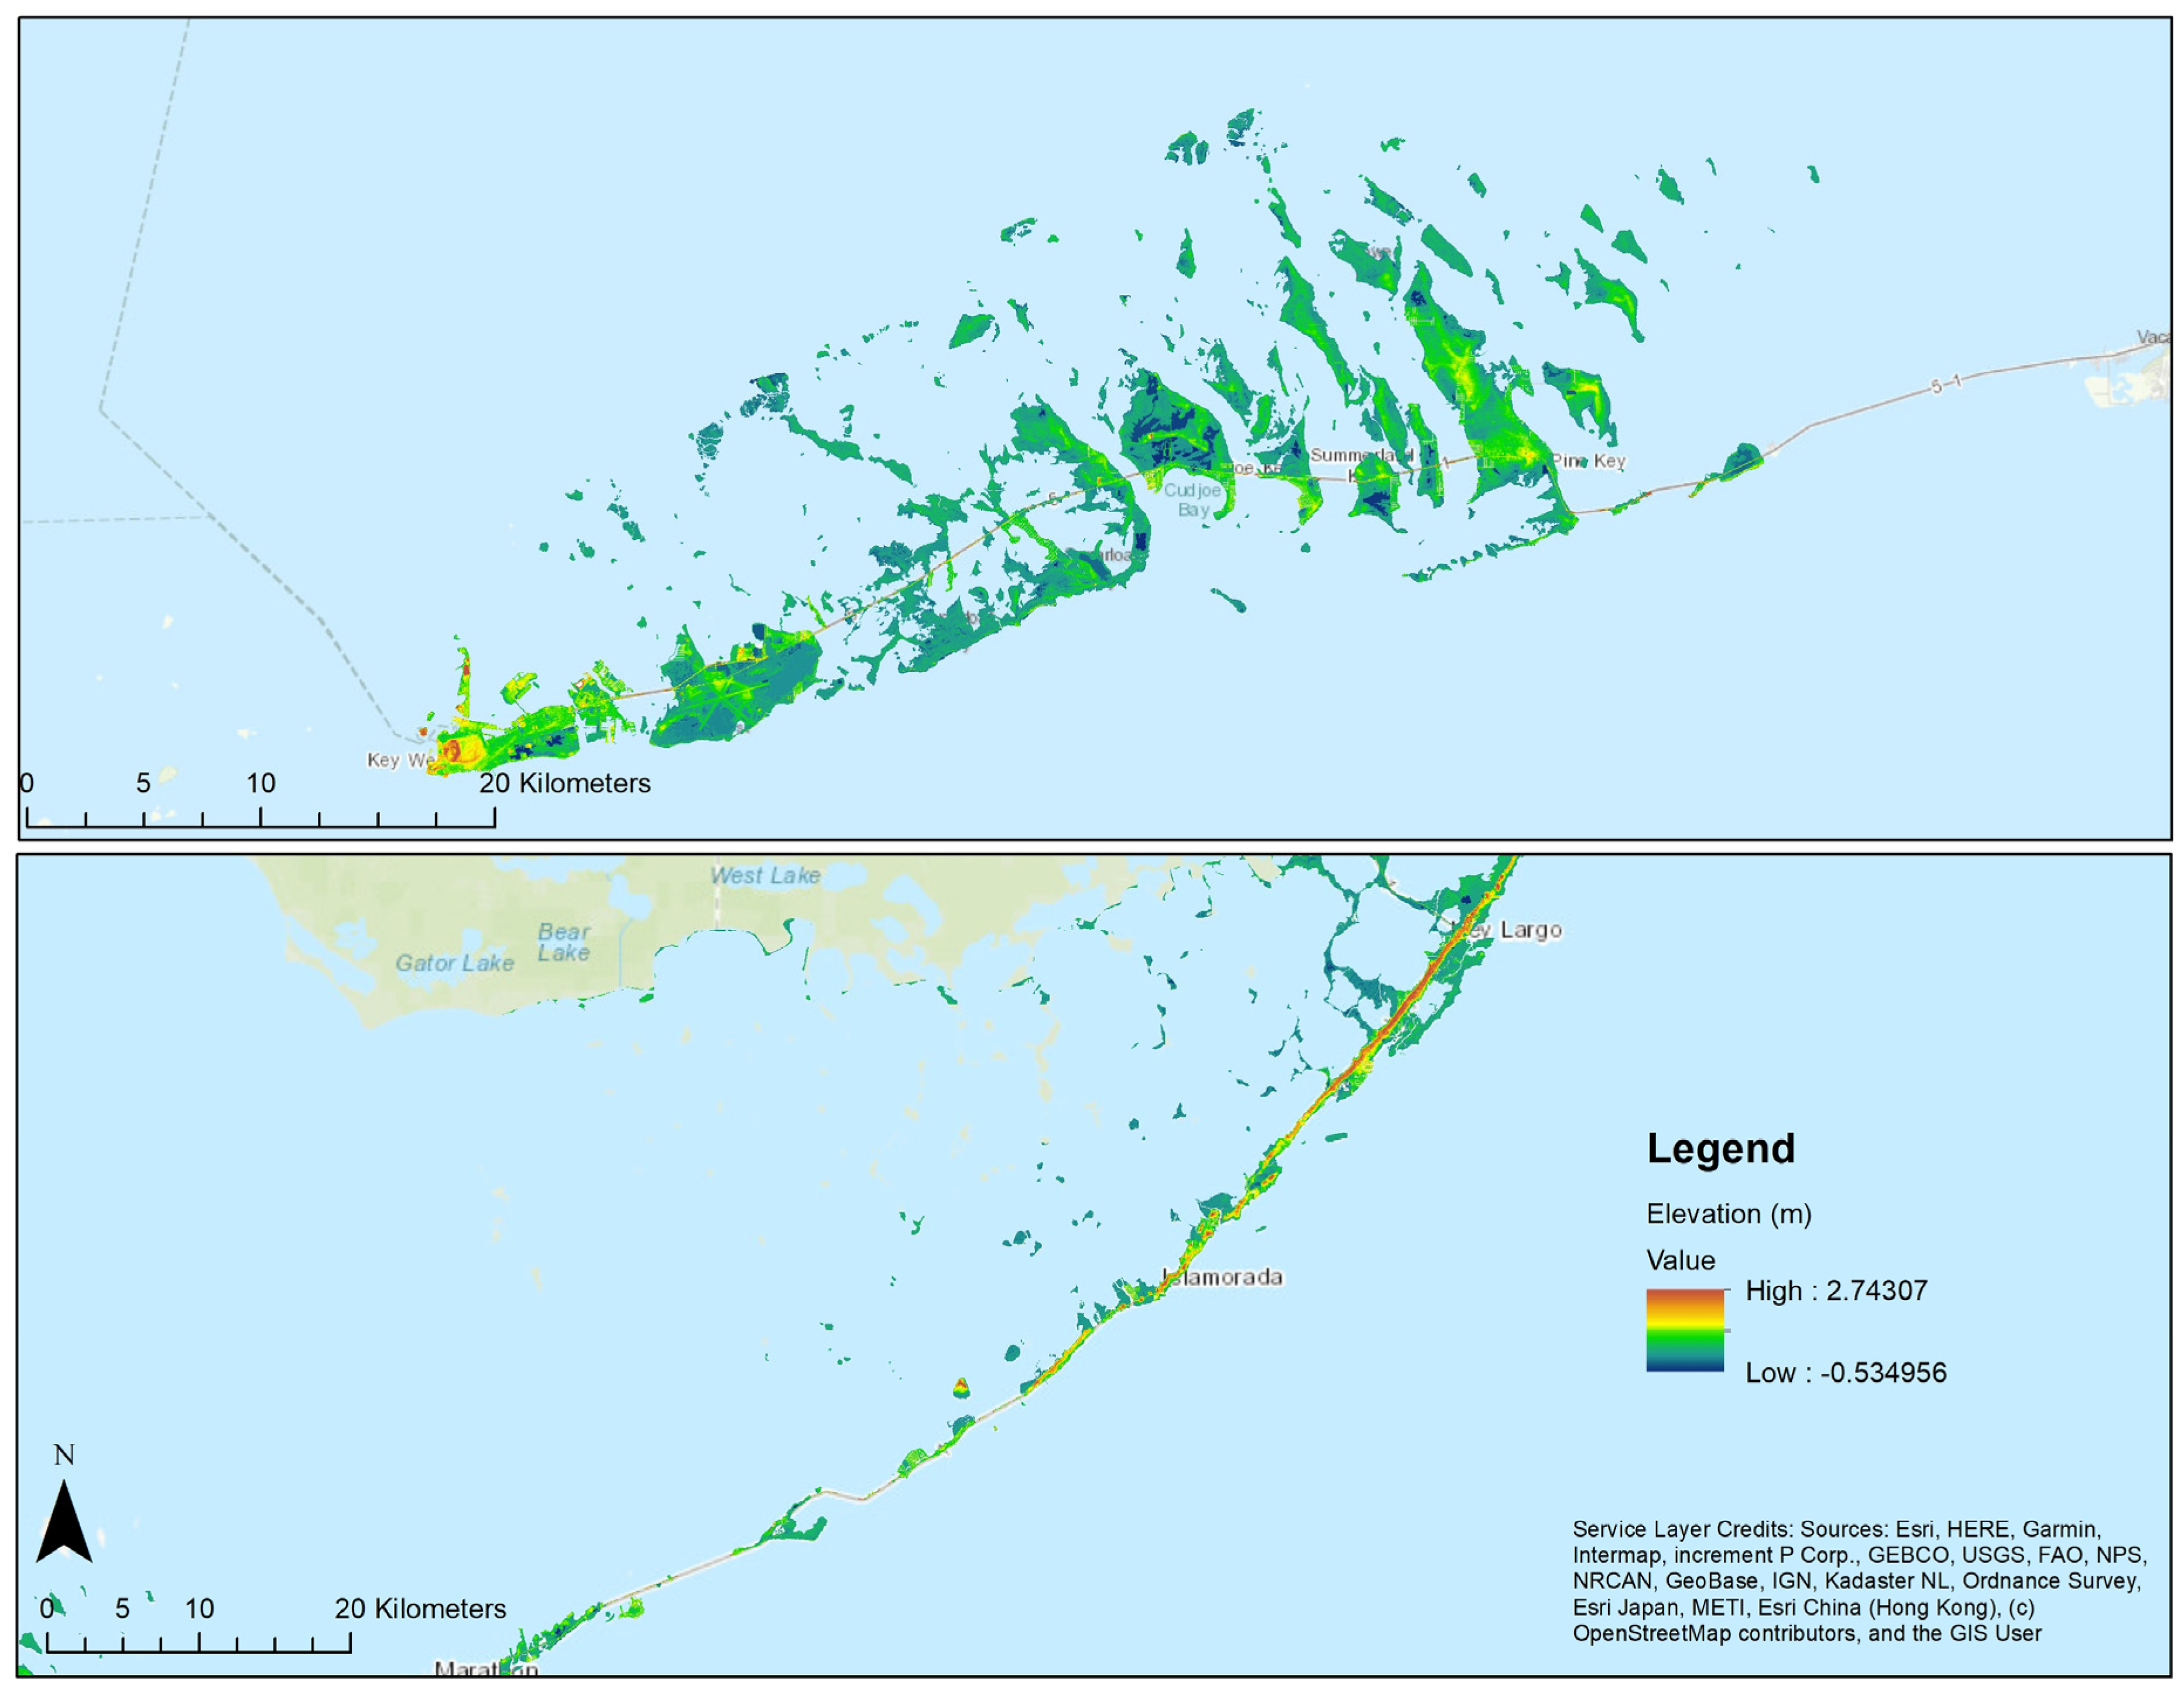
3.1. Elevation and Nearshore Habitat

The Florida Keys are characterized by low elevations and a shallow continental shelf that supports the largest coral reef in the U.S. and a variety of habitats. As Figure 4 indicates, most of the archipelago lies below one meter in elevation. Nearly 50% of the island chain is at sea level, which makes it extremely susceptible to storm surges and sea level rise. Nearshore slopes are an important factor that can facilitate or impede the self-recruitment of coastal vegetation. For example, the optimal nearshore landward elevation for self-recruitment of mangrove species lies between 0.3 m and 0.5 m with a nearshore water depth of less than 0.6 m.
Our analysis indicates that most of the landward slopes are less than 13%, and nearshore seaward slopes are less than 18%, which, together with the shallow water depths, present favorable conditions for self-recruitment of mangrove species. Data acquired from the Florida Fish and Wildlife Commission suggest that submerged aquatic vegetation (SAV) is present within 100 m along 70% of the Florida Keys shoreline.
The region features some of the most diverse coastal environments in Florida and nationwide (Figure 5). Detailed shoreline descriptions for the Florida Keys were obtained from NOAA’s Environmental Sensitivity Index [66]. Some of the ESI coding was aggregated into broader categories, and each description was verified using aerial imagery and local expert knowledge. As a result, a taxonomy of 15 shoreline descriptive categories was found to be the most applicable to the Florida Keys. Based on those descriptive categories, we estimated the distribution of the various types of shorelines in the Keys. The results indicate that the archipelago is heavily dominated by scrub-shrub wetlands (mangroves), which account for approximately 60% of the chain’s shoreline, followed by salt- and brackish water marshes constituting 10%. Nearly 530 km of the Florida Keys’ shoreline is armored, including sheltered and exposed human-made structures (~21.0%). Approximately 100 km (or 4%) of the shoreline consists of exposed or sheltered ripraps. Fine, coarse, and mixed sand and gravel beaches cover around 50 km of the shoreline (or 2.0%). Exposed wave-cut platforms in bedrock, mud, or clay, exposed tidal flats, sand flats, and sheltered rocky shores and scarps in bedrock, mud, or clay, scarps and steep slopes in sand cover approximately 15 km (or approximately 1%) of the Florida Keys shoreline.

3.2. Wind Wave Exposure

Wind exposure for May–October and November–April was determined using NOAA NCDC local meteorological data (Table 2). The wind exposure sub-index accounts for seasonal wind direction and maximum average wind speed, excluding tropical storm events. As shown in Figure 6, during the wet season (May–October), the prevailing wind directions are east (24%) and east-southeast (~25%). Winds predominantly from the southeast occur 10% of the time, while those from the south and south-southeast make up another 12%. In the dry season (November–April), winds primarily originate from the north, northeast, and north-northeast (35%), followed by east and east-southeast winds (~30%).
The wind exposure sub-index considers the estimated wind speed probability density function to calculate the conditional probability that the wind will exceed a certain velocity, given it is coming from a particular direction (Table 2). The conditional probability was rescaled from 0 to 100 using minimum-maximum standardization. The rescaled values were converted to a score from 1 to 5 to be consistent with the suitability classification.
Wave modeling was conducted using computed fetch distances, average wind speed, and measured water depths. Significant wave height (Hs) and wave period (T) were calculated along the prevailing wind direction. Wave power, representing the wave energy extracted per meter of the crest, was determined using Equation (3). Figure 7 displays the results of the wave power estimation. Shorelines with southeast and south-southeast have the highest degree of wind wave exposure. Approximately 34.7% of the island chain’s shoreline is exposed to high wave energy conditions 69.0% of the time annually (including both the wet and the dry seasons). Shorelines with a medium exposure comprise another 35%, while sheltered shorelines cover less than 30%. The wind wave exposure is a key factor when considering the type of stabilization measures. For shorelines exposed to high wave energy, hybrid stabilization measures such as breakwaters and revetments combined with mangrove planting may be appropriate compared to sheltered shorelines where stabilization with vegetation and sediment may be suitable.

3.3. Expert Opinion Weights and Composite Score

Results of the survey responses showed that 30% of participants primarily worked in the public sector, 9% worked in the private sector, and 61% worked in both sectors (past and current employment). Their expertise included coastal engineering, stormwater management, marine biology, habitat restoration, community resilience, urban planning, and sustainability. The survey response rate was 38.8%. Over half (54%) had 20+ years working in coastal restoration and management. Of the respondents, 39% reported having assisted efforts addressing coastal floods and other coastal hazards in their community within the last five years, and 47% within the past decade. Table 3 presents the reciprocal pairwise matrix and eigenvector-derived parameter weights. To distinguish between non-storm and storm effects, the storm surge was treated as a separate variable and was not included in the composite Shoreline Relative Exposure Index (SREI).
The highest weight (32%) was assigned to the wind and wave exposure, followed by the existing shoreline features (23%), nearshore gradient (20%), submerged aquatic vegetation (15%), and upland habitat (2%). The following equation aggregated exposure index variables (ST, WWE, NS, SAV, and UpH) into a composite score:
S R E I = ( 0.32 W W E + 0.23 S T + 0.20 N S + 0.15 S A V + 0.02 U p H ) n
Figure 8 displays the SREI score variation. Overall, approximately 209.7 km of shoreline has an exposure score below 1, indicating comparatively lower exposure; 1494.1 km of shoreline has an exposure score between 1 and 2; 792.8 km of shoreline has an exposure score between 2 and 3; 52.4 km of shoreline has an exposure score between 3 and 4; and 3.6 km of shoreline has an exposure score above 4, indicating relatively higher exposure. These distances correspond with 8.2%, 58.5%, 31.1%, 2.1%, and 0.1% of the total Florida Keys shoreline distance. In general, southern-facing shoreline segments have considerably higher exposure than shoreline segments facing other directions in the study area.

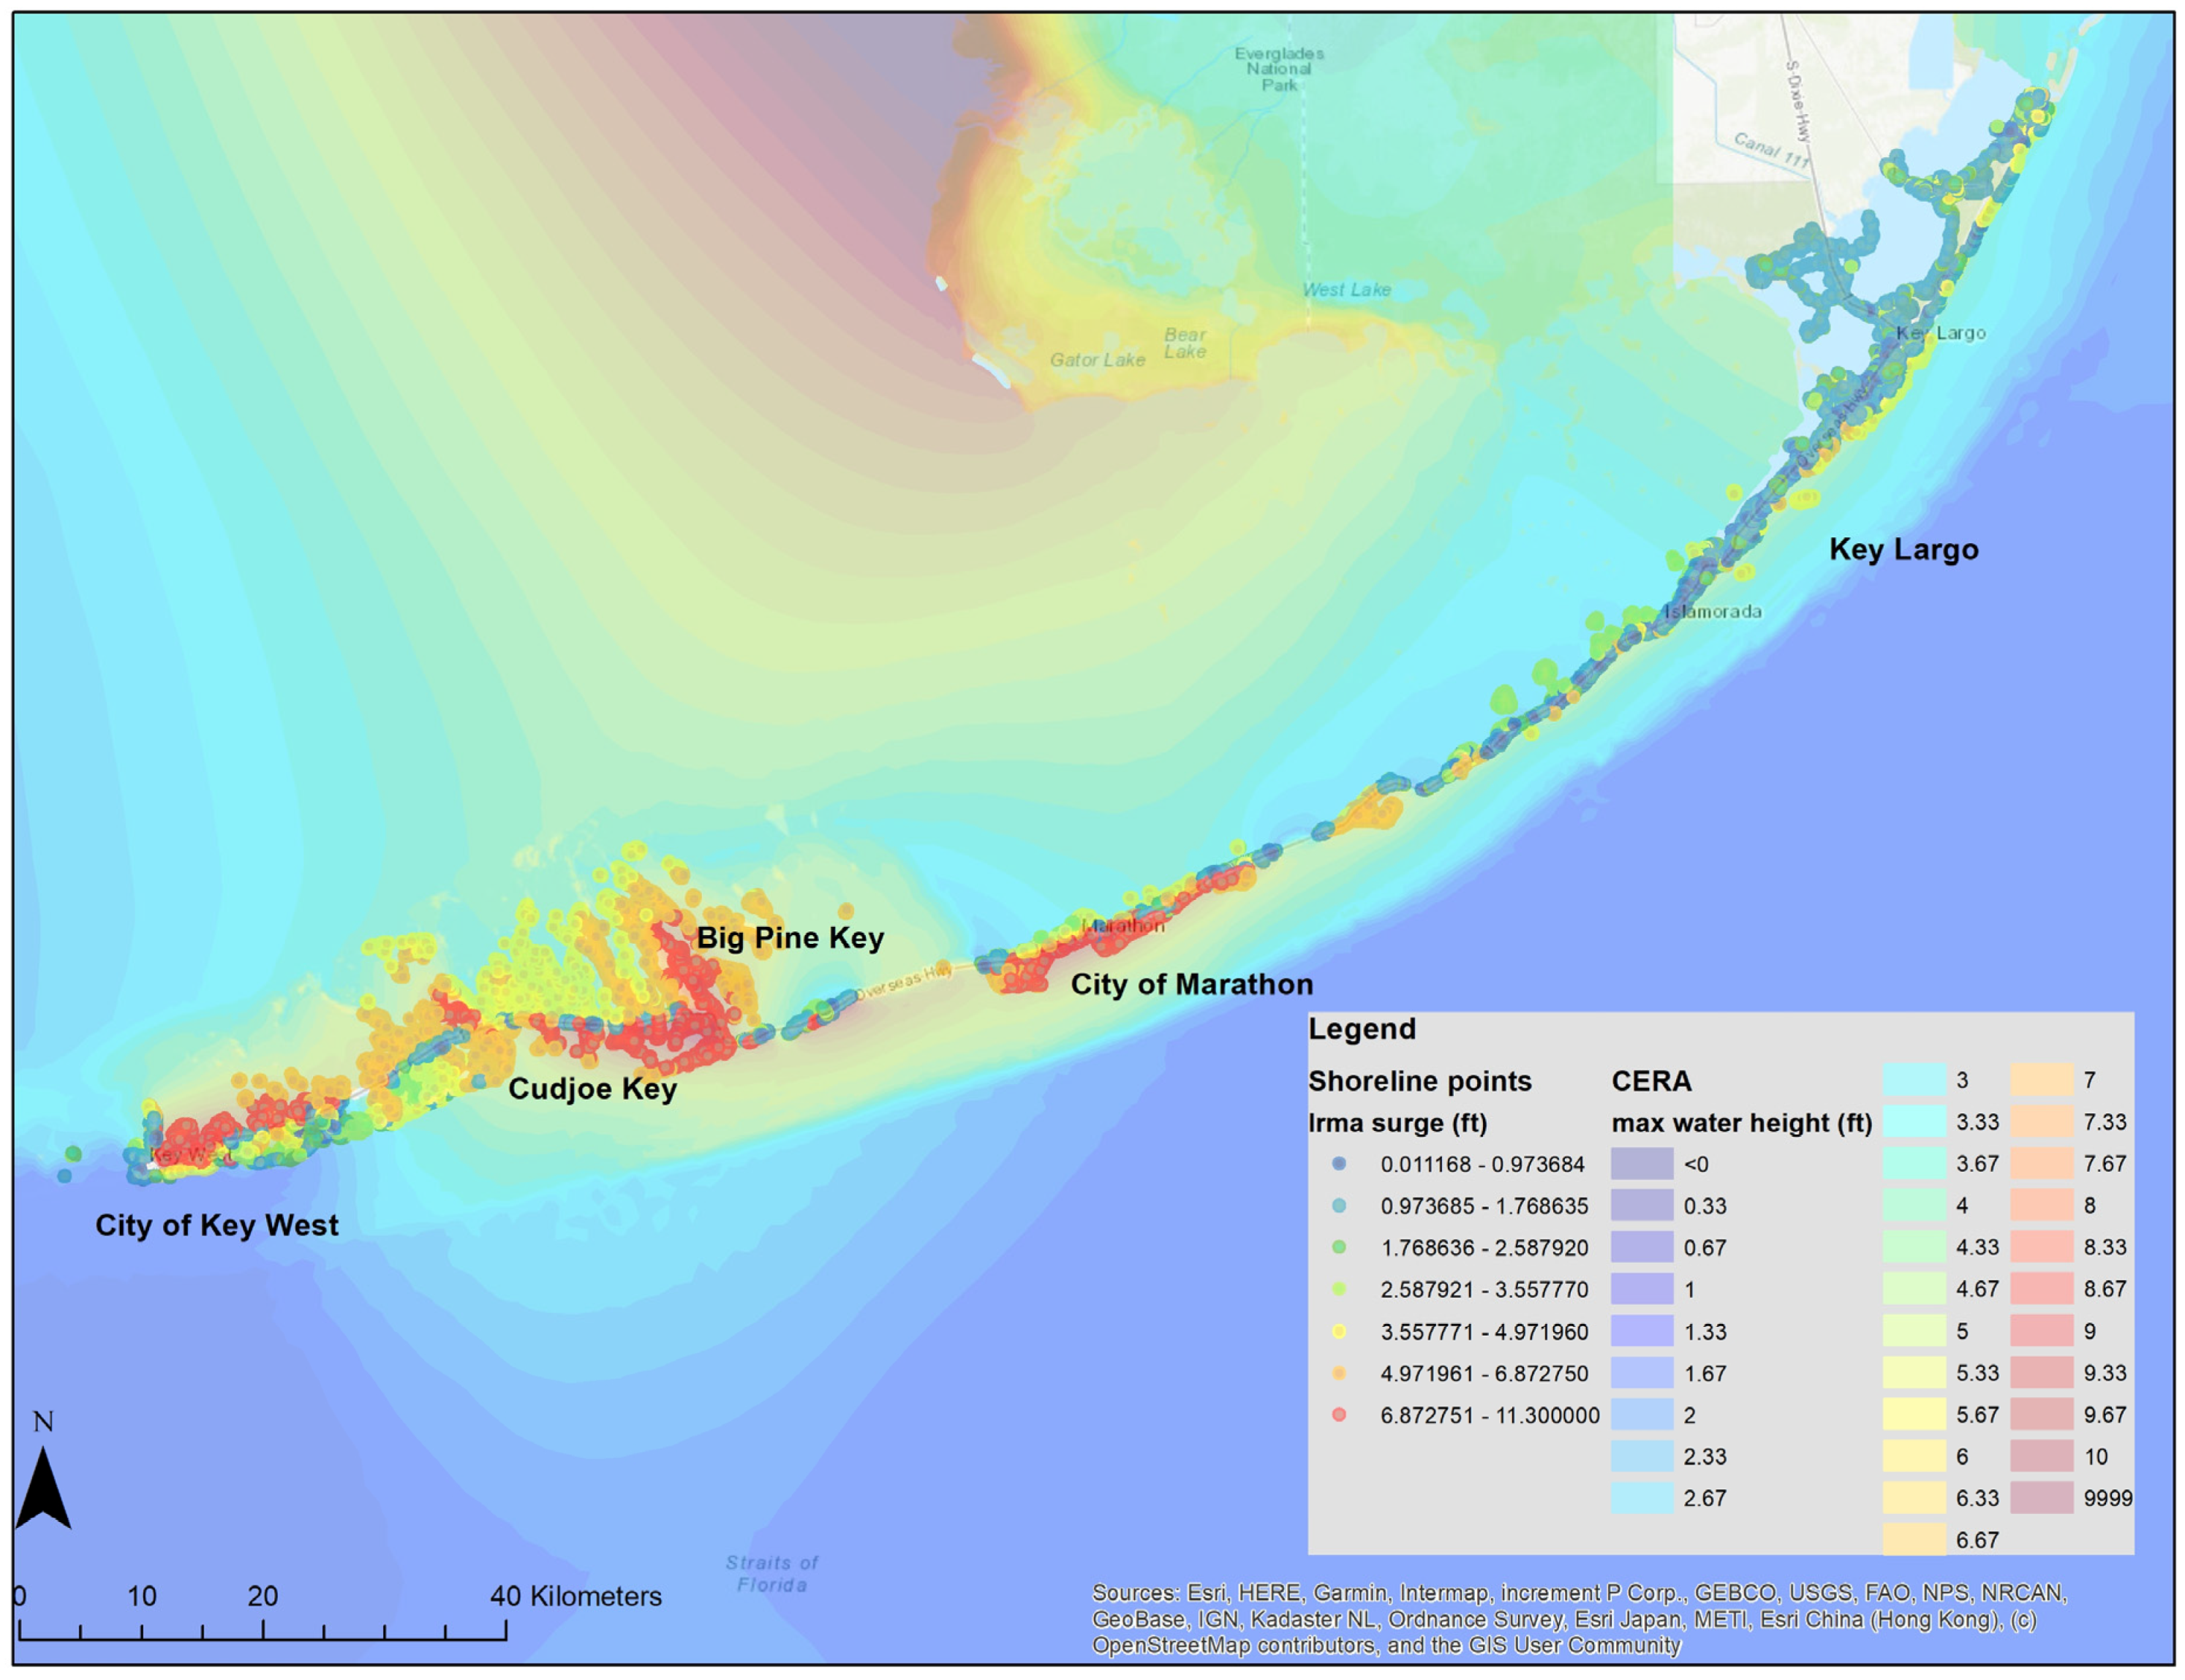
3.4. Storm Surge Exposure

SREI captures the non-storm exposure. Storm exposure was derived from the storm surge hindcast ADCIRC projections downloaded from CERA. Figure 9 shows the severity and extent of the storm surge generated by Hurricane Irma (30 August–12 September 2017), which made landfall on Cudjoe Key, Florida, on 10 September 2017, as a Category 4 storm. The storm brought in sustained winds of 210 km/h (130 mph) and a storm surge of up to 4 m, leaving an enduring mark on the Florida Keys. Among the hardest hit areas were Cudjoe Key, Big Pine Key, Marathon, and the surrounding islands. Hurricane Irma caused widespread destruction across the Lower Keys, leaving many areas largely uninhabitable for an extended period [70]. High winds and the storm surge led to significant damage, including severe structural damage to homes and businesses, power, water, and communication outages throughout the Lower Keys, extensive flooding, downed trees, and widespread debris. On Cudjoe Key, 81 homes were destroyed, and 624 were severely damaged [71]. On Big Pine Key, 473 residences were destroyed, and 299 sustained major damages [71]. In the city of Marathon, 394 houses were destroyed, and 1402 suffered extensive damage [71]. Altogether, 1180 homes were destroyed, nearly 3000 were severely damaged, and 55,000 suffered less extensive damages [71]. According to FEMA, 90% of houses in Monroe County were affected, 65% sustained major damages, and 25% of buildings were destroyed [70].

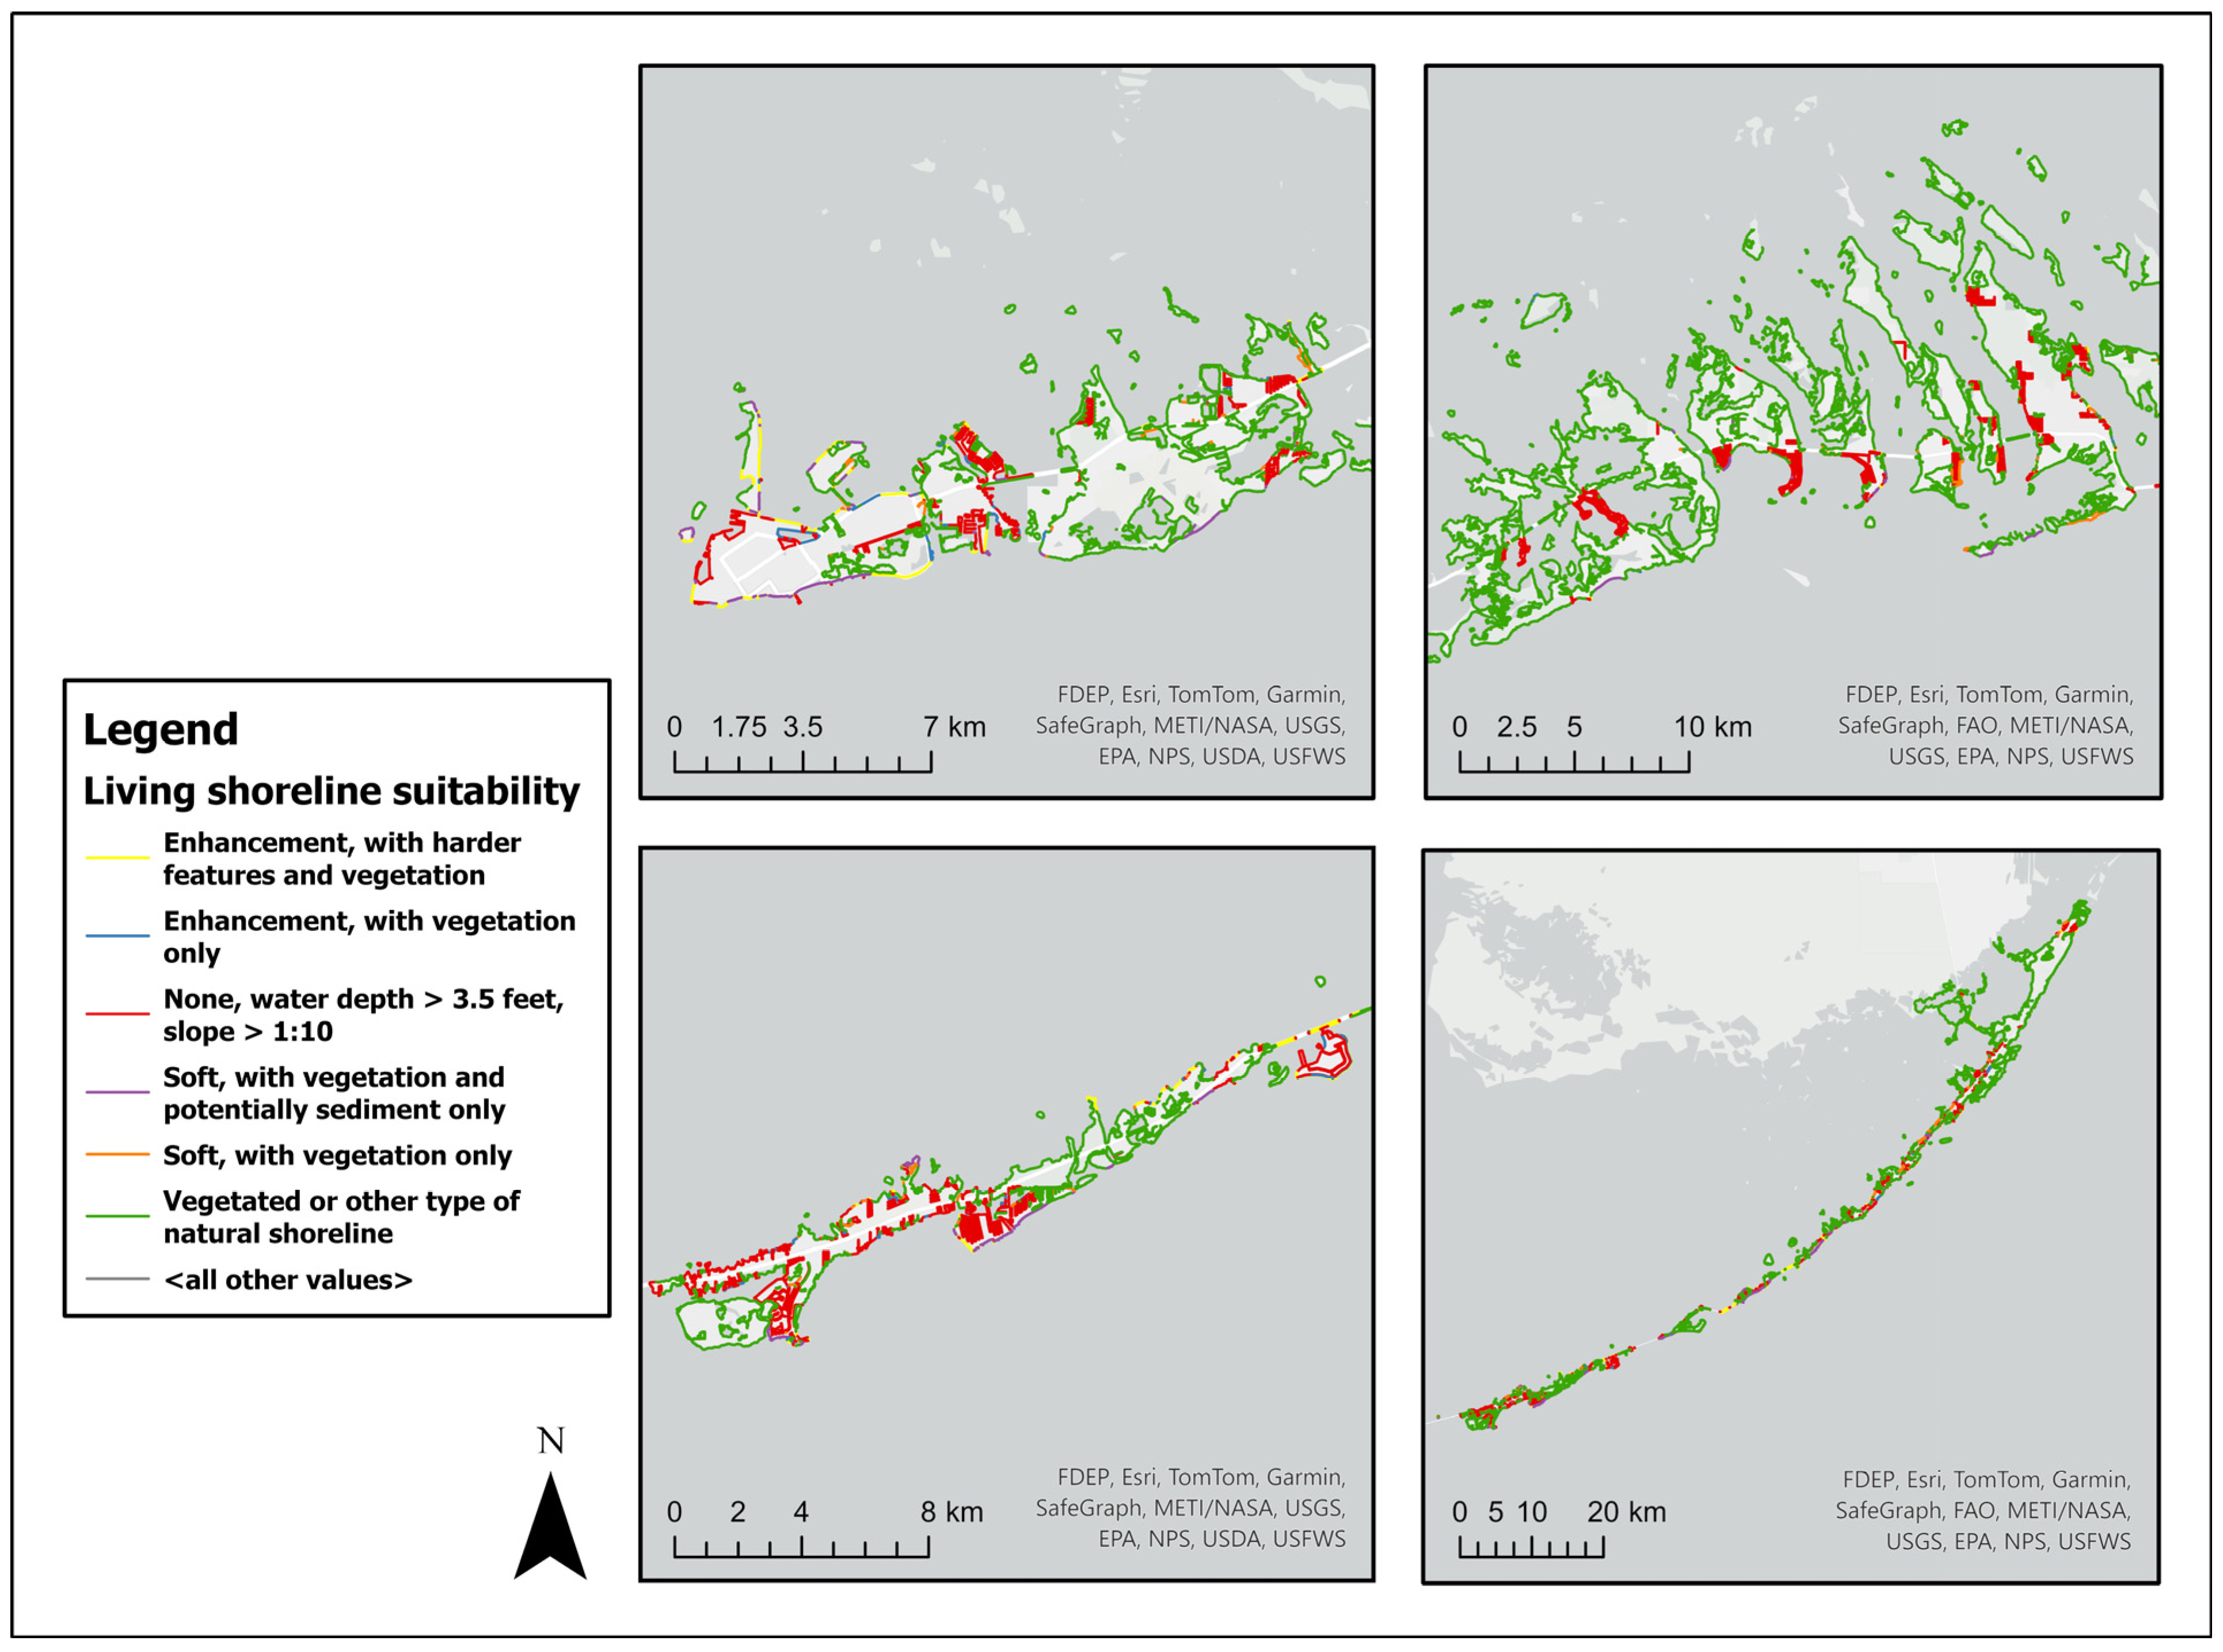
3.5. Living Shorelines Suitability
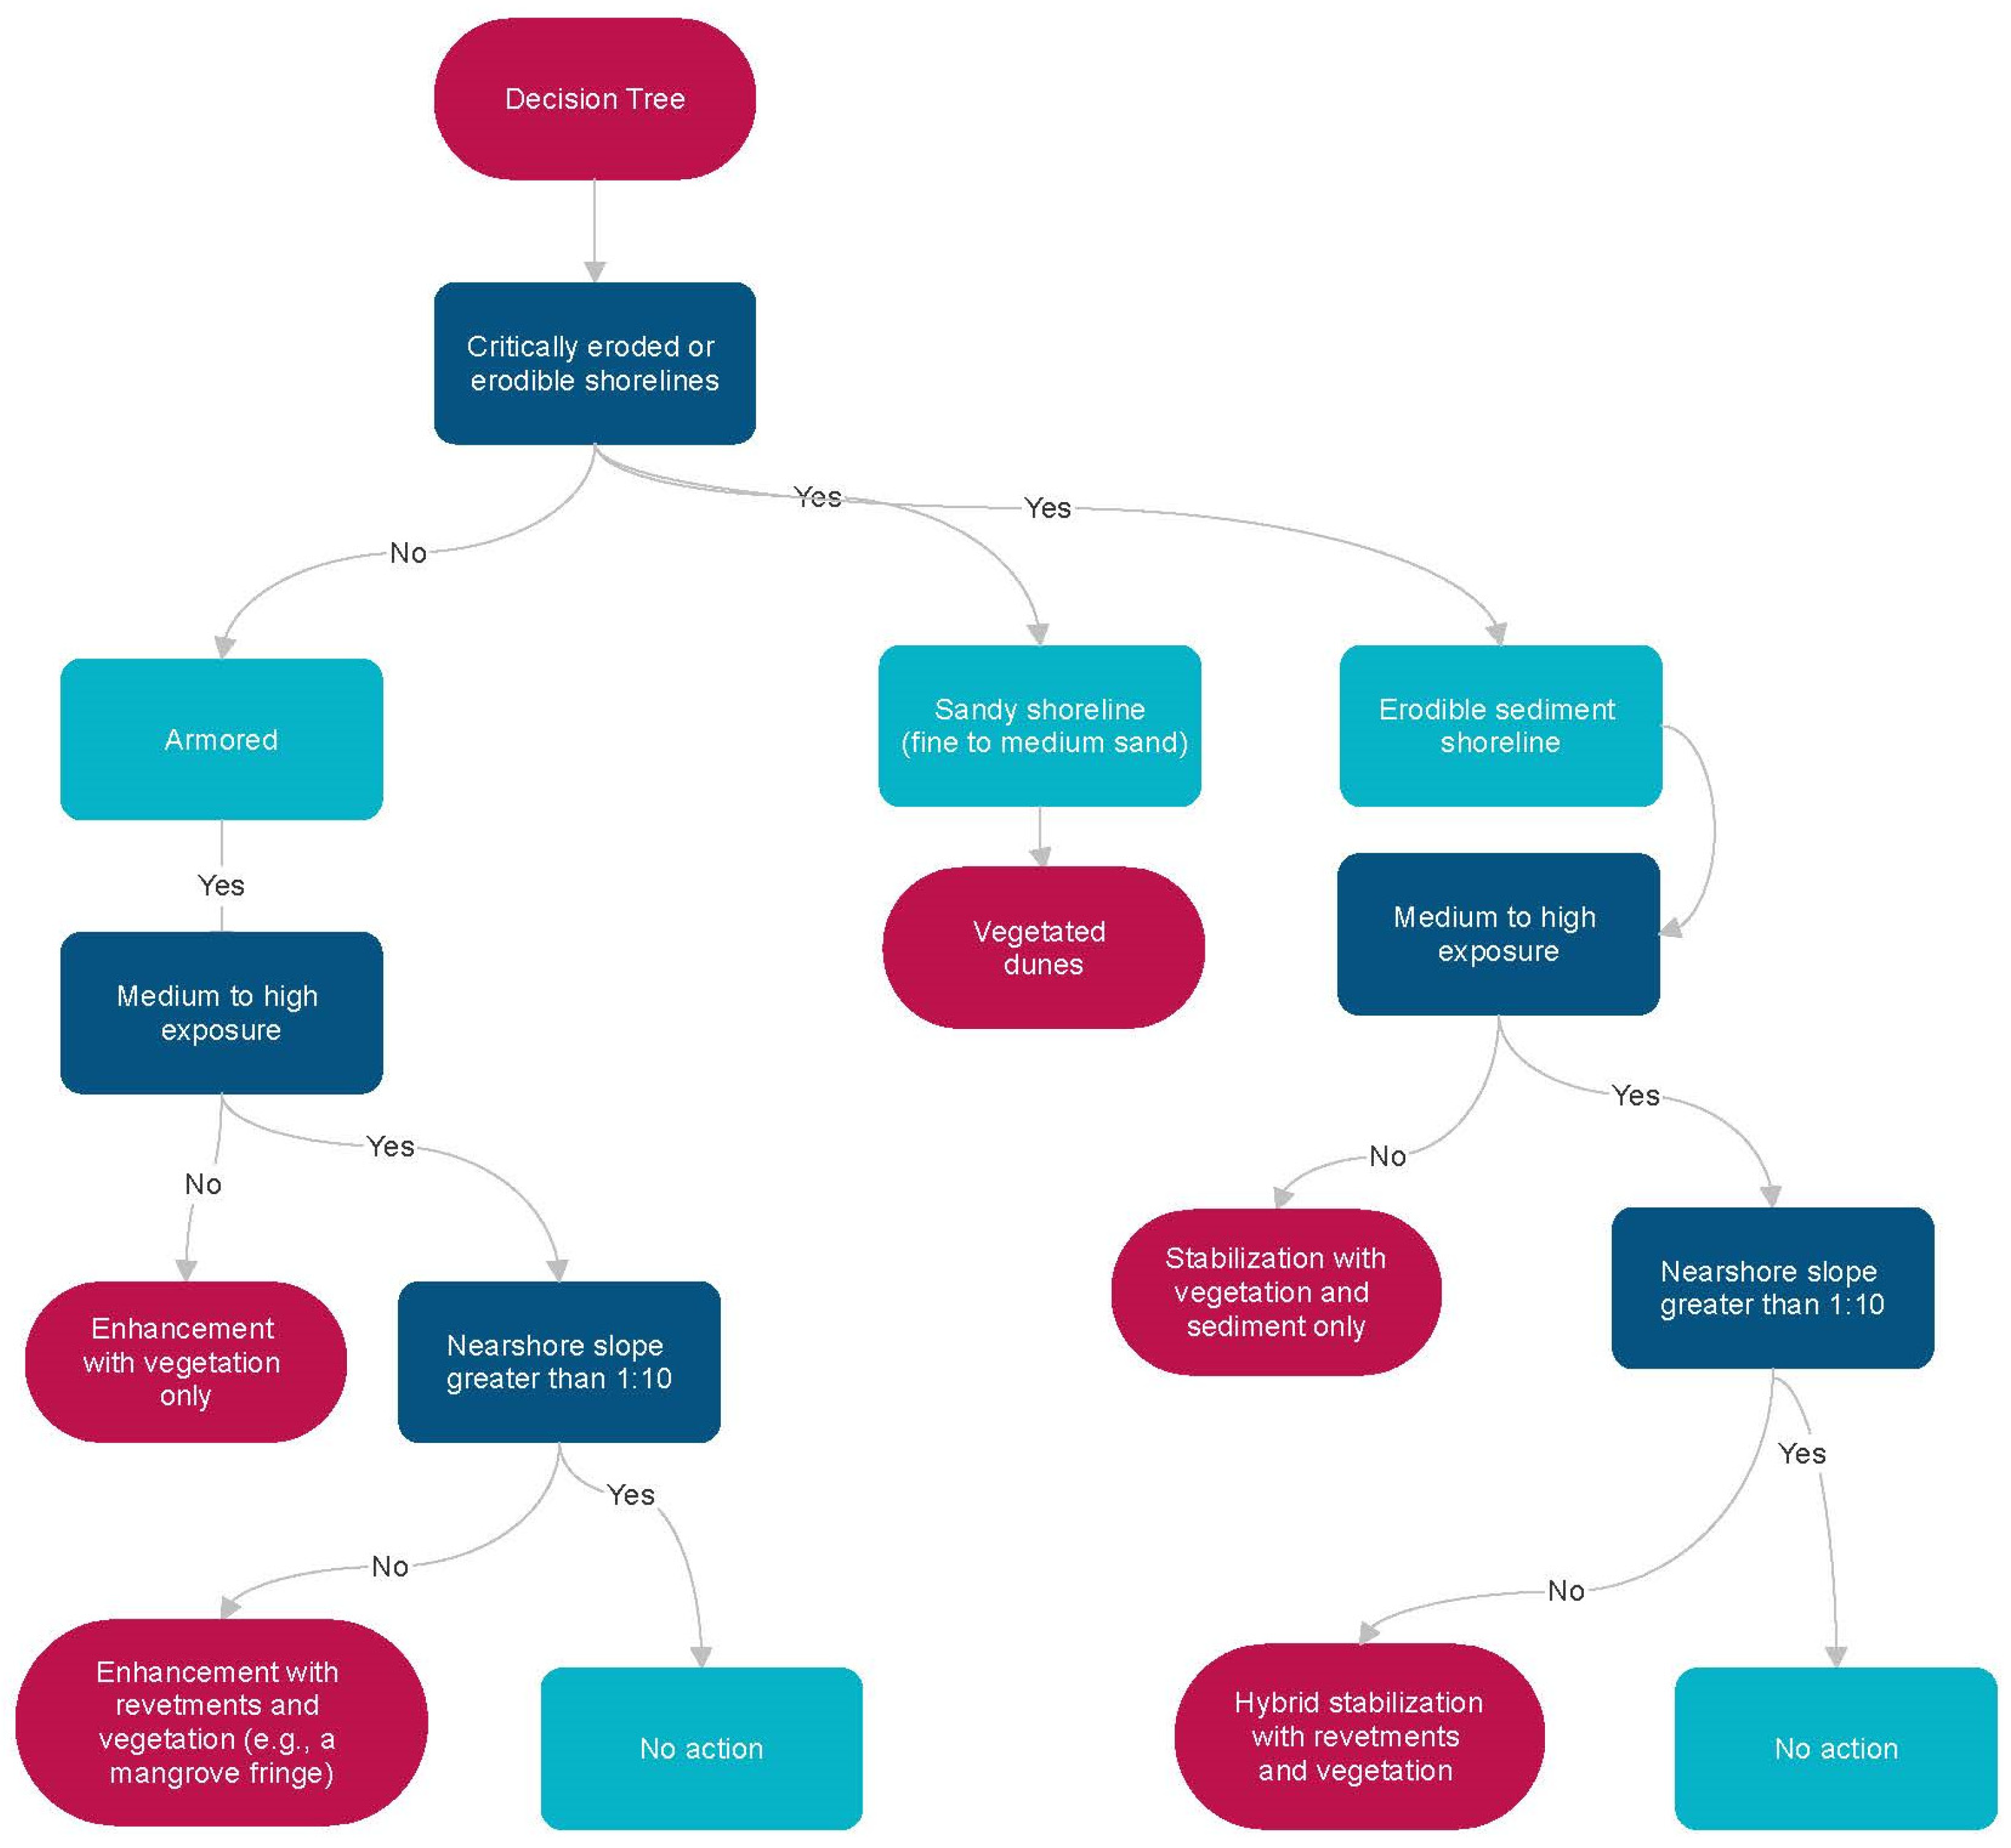
According to the study results, there are coastal areas throughout the Florida Keys where nature-based shoreline stabilization measures are appropriate (Figure 10). Approximately 72.4 km of the Florida Keys shoreline is suitable for enhancement with harder features and vegetation, whereas approximately 39.8 km is suitable for enhancement with vegetation only (Table 4). Coastal areas where enhancement with harder features and vegetation is favorable are generally armored (e.g., breakwaters, seawalls, etc.) and have higher exposure. Furthermore, we found that soft stabilization would be appropriate for roughly 90 km of the shoreline. While soft stabilization with vegetation and potential sediment are favorable in areas with existing soft manmade shorelines, soft stabilization with vegetation only is favorable in areas with soft natural shorelines. In total, approximately 7.9% of the total shoreline is suitable for nature-based solutions. On the other hand, approximately 642.7 km, or 25.2%, of shoreline is not appropriate for nature-based stabilization due to its water depth (>3.5 feet) and/or slope (>1:10). However, much of the study area is already vegetated or features some type of natural shoreline (~1709.2 km).

3.6. Decision Tree

Figure 11 pilots a decision tree for implementing various stabilization options for critically eroded shorelines. It indicates how the compound erodibility of various shoreline types and exposure levels can be integrated into the decision-making process relative to shoreline stabilization. The decision framework addresses the need for design guidance and provides a resource that can help decision-makers determine which types of shoreline enhancements—e.g., traditional hard, ecological, or hybrid—are most appropriate for different shoreline types in the Florida Keys.

4. Discussion

By 2050, sea levels along the contiguous U.S. are projected to rise approximately 0.25 to 0.30 m [72]. The frequency of unusually high king tides continues, inflicting tidal flooding throughout low-lying areas of the Florida Keys with the potential to damage infrastructure and property. Storm frequency, duration and intensity are also increasing [6], magnifying the effects of compound tidal flood events. The rainfall accompanying tropical storms and hurricanes also presents a flood threat. The combination of these flood drivers may be catastrophic for the Florida Keys and its residents. Accordingly, bolstering the regional shoreline using human-made, hybrid, and nature-based solutions is crucial where appropriate in order to mitigate the potential consequences of increased coastal flooding.
Numerous studies underscore the advantages of preserving and restoring natural infrastructure [8,9,10,11,12,13,14,15,73]. Recognizing the shortcomings of traditional coastline management practices has led to a transition toward more holistic and integrated approaches [1,2,3,8,74,75,76], as maintaining healthy natural ecosystems is essential for building resilient communities [8,9,11]. Deploying nature-based solutions in cities also increases human physical and visual interaction with natural environments, which improves mental and physical outcomes [77,78]. Simultaneously, methods such as soft armoring and living shorelines provide effective, site-specific solutions while delivering broader regional benefits [10,13]. Beyond the ecological and economic benefits, natural systems provide critical services that reduce local communities’ vulnerability to flooding and hurricane risks [32,33,34].
Figure 12 shows the impacts of Hurricane Irma on segments of U.S. Highway 1, the main transportation artery in the Florida Keys, and the protective role of natural infrastructure. The top image displays a segment of U.S. Highway 1 in Lower Matecumbe Key after the storm, where a narrower, degraded beach and dune led to considerable roadbed erosion compared to a nearby location with a wider beach and dune that prevented road network degradation. Similarly, in Scout Key (bottom image), Irma caused noticeable roadbed erosion.
Part of the road segment does not have a natural habitat. At the same time, a nearby mangrove patch mitigated the erosion risk and preserved both the shoreline and the adjacent infrastructure. Although images like the ones shown in Figure 2 can effectively communicate the significance of using natural and nature-based shoreline stabilization, systematic methods for evaluating the effectiveness and suitability of various techniques and an understanding of the protection and performance levels each method can provide are still in need of further development [79].
Nature-based waterfronts continue to play a critical role in protecting investments, dissipating wave action, and improving ecosystem services and overall quality of life. Decisions about shoreline management benefit from sound information on the existing geomorphologic, ecologic, and hydrologic conditions. Site-specific design incorporating factors like slope, sediment supply, wave action, and development pressure can ensure that the living shoreline environment is viable [17,23,32]. South Florida’s coastal ecosystems, including mangrove swamps and coastal strands, have already been incorporated into various shoreline management practices that reduce erosion potential and create appropriate habitat conditions. Mangroves are essential for sustaining estuarine and marine ecosystems in South Florida, providing critical habitat, stabilizing shorelines, and supporting biodiversity [80]. They provide nesting sites for hundreds of species while also contributing to the marine food web as a primary source of detritus [80]. Their intricate root systems prevent sediment loss, reduce turbidity, and promote siltation by trapping debris and suspended particles [35,80]. Examples from the Florida Keys demonstrate that dune planting, coastal strands, and mangroves can reinforce natural shorelines while improving habitats along existing hard structures.
Table 5 offers a summary of possible stabilization and enhancement strategies for different shoreline types. In disturbed or exposed environments, shoreline stabilization may include mangrove planter creation, mangrove swamp restoration, dune restoration, spoil islands, breakwater construction, oyster reef restoration or creation, or wetlands restoration [81]. High-wave energy environments near densely populated areas may require some structural armoring. Depending on site-specific conditions, such as shallower water depths and gentle slopes nearshore, vegetation enhancements may be considered. In medium-wave energy environments, hybrid options would provide the necessary protective services [81].
Limited data on the effectiveness of these options for decision-making pose a challenge to their application [82]. Furthermore, engaging property owners and contractors depends on the availability of design guidance. In many cases, practitioners have sought to integrate knowledge of potential threats, specific project goals, observed environmental conditions, and collective experience with the best management practices for living shorelines to inform future projects. In 2022, the U.S. Army Corps of Engineers (USACE) released Nationwide Permit 54—Living Shorelines, outlining general and site-specific conditions for incorporating native plants into engineered water resource projects [83]. In estuarine and tidally influenced environments, living shorelines effectively prevent erosion while providing superior environmental functions and critical habitats for commercially and ecologically important fish and macroinvertebrates [43]. However, their buffering capabilities are less predictable than those of hard structures like bulkheads and seawalls. Consequently, living shorelines often require a longer planning horizon and more meticulous design to achieve optimal effectiveness [43].
Furthermore, given the growing interest in living shorelines in flood-prone coastal areas nationally and internationally, this tool and the Shoreline Relative Exposure Index are models that can be used and replicated in other coastal regions seeking to implement living shorelines appropriate to their own unique settings. Data from this study are available on Coastal Resilience, a web-based data decision support tool that leverages GIS to enable users to visualize proposed shoreline stabilization approaches appropriate to specific stretches of the Florida Keys and to overlay these recommendations with local data, such as projected sea level rise, coastal habitats, and land use. Given the exposure of this region to sea level rise and flooding, as well as the challenges they will pose to residents and local governments in the coming decades, coastal resilience constitutes an important tool for building future resilience and sustainability in South Florida.
Presently, the SREI framework accounts for several compound events (storm surge, tide levels) driving the potential for coastal erosion/flooding in the Florida Keys. While the framework was based on past conditions, specifically sea levels and storm surge/tide under non-storm conditions as well as those associated with Hurricane Irma in September 2017, it could be extended and updated to reflect different storm surge heights, tidal conditions, and sea levels by adjusting the shoreline position and input variables/models. In that vein, reprocessing the model will ultimately be necessary as sea levels rise. However, one limitation of the SREI framework in potentially determining the susceptibility of compound flood events is its omission of rainfall data since the SREI framework is more tailored to gauging coastal erosion potential and alternative solutions to traditional hard armoring than for determining impacts of compound flood events.
We must acknowledge several additional limitations of this study. First, it serves as a preliminary screening tool for identifying potential management practices rather than a complete guide. Any proposed living shoreline project would further require detailed, site-specific analysis. Second, the study does not examine the policy implications of land development and planning practices. For successful large-scale implementation, nature-based alternatives must be incorporated into county and municipal comprehensive plans and supported by an appropriate permitting process and funding. Third, future research should focus on the site-specific feasibility of stabilization projects under diverse conditions to refine design requirements and enhance adaptive responses.

5. Conclusions

For this study, we designed a GIS-based multi-criteria decision tool that facilitates coastal restoration and integrates nature-based solutions into conventional shoreline armoring. We combined spatial analysis tools with expert input to develop a weighted suitability score for various types of shoreline reinforcement where feasible. By integrating data on existing shoreline types—sourced from an updated version of the NOS Environmental Sensitivity Index—along with wind and wave exposure and physical environmental factors, we generated a composite Shoreline Relative Exposure Index. Based on this assessment, broadly defined categories of project types were recommended for various combinations of shoreline features and flood risk conditions. The findings indicate that while engineered approaches continue to dominate shoreline fortification efforts, nature-based solutions offer a feasible alternative in suitable coastal environments. Ecological restoration efforts in South Florida demonstrate successful applications of living shorelines, helping to mitigate the harmful effects of erosion and frequent flooding [81].
Due to its unique geography and infrastructure network, the Florida Keys is particularly at risk of climate hazards (e.g., sea level rise and hurricanes) and compound flood events. Accordingly, we constructed the SREI using expert input to derive variable weights for selected characteristics influencing coastal erosion (e.g., wind-wave exposure, nearshore slope, etc.). SREI scores were then processed through a decision tree and applied to various shoreline types (e.g., developed, undeveloped, and protected) to determine the suitability of living shoreline stabilization. Our study found that nearly 8% of the approximately 2550 km shoreline in the Florida Keys is suitable for nature-based (e.g., mangrove planting, oyster reefs, and beach dune vegetation) or hybrid (e.g., some combination of hard structures and vegetation) solutions. Conversely, roughly 25.1% of the Florida Keys shoreline was deemed unsuitable for nature-based approaches, and approximately 67% is already vegetated or represents some other type of natural shoreline.
Coastal resource managers, decision-makers, and planners face significant challenges in the Florida Keys. Increased extreme weather events (e.g., hurricanes and tropical storms), regional tidal cycles, and rising sea levels are expected to result in more compound flood events throughout this region and other coastal communities statewide. Coastal flood control measures must be designed to withstand the effects of compound events since already extreme conditions may be aggravated by the concurring flood drivers (e.g., king tides and rain, wind, and storm surges from hurricanes). Although conventional seawall armoring is necessary along portions of the Florida Keys coastline, hybrid and living shorelines must be prioritized where possible, protecting people, habitats, and resources. This demands participation by private stakeholders in addition to coordination and collaboration across the necessary public entities to enhance coastal resilience.

Author Contributions

Conceptualization: D.M., C.B. and K.C.; methodology: D.M. and C.B.; software: D.M.; validation: D.M. and K.C.; formal analysis: D.M., K.C. and C.B.; investigation: D.M., K.C., C.B., M.M., S.W., K.F. and W.C.L.; data curation: D.M., K.C., C.B. and K.F.; writing—original draft preparation: D.M., K.C. and C.B.; writing—review and editing: D.M., K.C., C.B., M.M., S.W., K.F. and W.C.L.; visualization: D.M., K.C., C.B. and K.F. All authors have read and agreed to the published version of the manuscript.

Funding

This research received no external funding.

Institutional Review Board Statement

The study was conducted in accordance with the Declaration of Helsinki, and approved by the Institutional Review Board of Florida Atlantic University (protocol code 782756-1, determined as being non-human subjects research, 27 July 2015).

Informed Consent Statement

Informed consent was obtained from all subjects involved in the study.

Data Availability Statement

Data from this study are available on coastalresilience.org.

Acknowledgments

The authors are grateful to the SE Florida Climate Compact Shoreline Resilience Working Groups for their valuable insights and suggestions.

Conflicts of Interest

The authors declare no conflicts of interest.

References

  1. McGranahan, G.; Balk, D.; Anderson, B. The rising tide: Assessing the risks of climate change and human settlements in low elevation coastal zones. Environ. Urban. 2007, 19, 17–37. [Google Scholar] [CrossRef]
  2. Titus, J.G. Population in floodplains or close to sea level increased in US but declined in some counties—Especially among Black residents. Environ. Res. Lett. 2023, 18, 034001. [Google Scholar] [CrossRef]
  3. Adger, W.N.; Hughes, T.P.; Folke, C.; Carpenter, S.R.; Rockström, J. Social-ecological resilience to coastal disasters. Science 2005, 309, 1036–1039. [Google Scholar] [CrossRef] [PubMed]
  4. Adger, W.N. Vulnerability. Global Environ. Change 2006, 16, 268–281. [Google Scholar] [CrossRef]
  5. Beichler, S.A.; Hasibovic, S.; Davidse, B.J.; Deppisch, S. The role played by social-ecological resilience as a method of integration in interdisciplinary research. Ecol. Soc. 2014, 19, 4. [Google Scholar] [CrossRef]
  6. Carter, L.; Terando, A.; Dow, K.; Hiers, K.; Kunkel, K.E.; Lascurain, A.; Marcy, D.; Osland, M.; Schramm, P. Southeast. In Impacts, Risks, and Adaptation in the United States: Fourth National Climate Assessment, Volume II; Reidmiller, D.R., Avery, C.W., Easterling, D.R., Kunkel, K.E., Lewis, K.L.M., Maycock, T.K., Stewart, B.C., Eds.; U.S. Global Change Research Program: Washington, DC, USA, 2018; pp. 743–808. [Google Scholar]
  7. Hoffman, J.S.; McNulty, S.G.; Brown, C.; Dello, K.D.; Knox, P.N.; Lascurain, A.; Mickalonis, C.; Mitchum, G.T.; Rivers, L., III; Schaefer, M.; et al. Ch. 22. Southeast. In Fifth National Climate Assessment; Crimmins, A.R., Avery, C.W., Easterling, D.R., Kunkel, K.E., Stewart, B.C., Maycock, T.K., Eds.; U.S. Global Change Research Program: Washington, DC, USA, 2018. [Google Scholar] [CrossRef]
  8. Helderop, E.; Grubesic, T.H. Social, geomorphic, and climatic factors driving US coastal city vulnerability to storm surge flooding. Ocean Coast. Manag. 2019, 181, 104902. [Google Scholar] [CrossRef]
  9. Dobbs, B.N.; Volk, M.I.; Nawari, N.O. Living shoreline treatment suitability analysis: A study on coastal protection opportunities for Sarasota County. J. Sustain. Dev. 2017, 10, 55–70. [Google Scholar] [CrossRef]
  10. Boland, C.D.; O’Keife, K. Living Shoreline Suitability Model for Tampa Bay: A GIS Approach. In Final Report to the Gulf of Mexico Alliance, Habitat Resources Priority Issue Team; Florida Fish and Wildlife Conservation Commission: Saint Petersburg, FL, USA, 2018. [Google Scholar]
  11. Mitsova, D.; Bergh, C.; Guannel, G.; Lustic, C.; Renda, M.; Byrne, J.; Graves, A.; Cresswell, K.; Alhawiti, R.; Goldberg, A.; et al. Spatial decision support for nature-based shoreline stabilization options in subtropical estuarine environments. J. Environ. Plan. Manag. 2018, 61, 2468–2490. [Google Scholar] [CrossRef]
  12. Kibler, K.M.; Donnelly, M.; Cannon, D.; Walters, L.; Phagan, J.; McClenachan, G.; Roddenberry, A. Developing a Shoreline Restoration Suitability Model for North Indian River and Mosquito Lagoon, Phase II; Indian Rivers Lagoon National Estuaries Program Report IRL2018-017; University of Central Florida: Orlando, FL, USA, 2020. [Google Scholar]
  13. Nunez, K.; Rudnicky, T.; Mason, P.; Tombleson, C.; Berman, M. A geospatial modeling approach to assess site suitability of living shorelines and emphasize best shoreline management practices. Ecol. Eng. 2022, 179, 106617. [Google Scholar] [CrossRef]
  14. Boyd, C.; Niu, X.; Horn, T.R. A Step by Step Shoreline Attribute Analysis for Selected Waterbodies in the Gulf of Mexico to Promote the Use of Living Shorelines. J. Ext. 2024, 62, 2. Available online: https://open.clemson.edu/joe/vol62/iss3/2 (accessed on 5 December 2024). [CrossRef]
  15. Parkinson, R.W.; Juhasz, L.; Xu, J.; Fu, Z.J. Future shorelines: A living shoreline site selection and design decision support tool that incorporates future conditions induced by sea level rise. ESCO 2024, 47, 2641–2654. [Google Scholar] [CrossRef] [PubMed]
  16. Bilkovic, D.M.; Stanhope, D.; Angstad, K. Shallow Water Fish Communities and Coastal Development Stressors in the Lynnhaven River; Final Report to U.S. Army Corps of Engineers; Virginia Institute of Marine Science, Center for Coastal Resources Management: Gloucester Point, VA, USA, 2007. [Google Scholar]
  17. Bilkovic, D.M.; Mitchell, M.M. Ecological tradeoffs of stabilized salt marshes as a shoreline protection strategy: Effects of artificial structures on macrobenthic assemblages. Ecol. Eng. 2013, 61, 469–481. [Google Scholar] [CrossRef]
  18. Craft, C.; Clough, J.; Ehman, J.; Joye, S.B.; Park, R.; Pennings, S.; Guo, H.; Machmuller, M. Forecasting the effects of accelerated sea-level rise on tidal marsh ecosystem services. Front. Ecol. Environ. 2008, 7, 73–78. [Google Scholar] [CrossRef]
  19. Dong, W.S.; Ismailluddin, A.; Yun, L.S.; Ariffin, E.H.; Saengsupavanich, C.; Maulud, K.N.A.; Ramli, M.Z.; Miskon, M.F.; Jeofry, M.H.; Mohamed, J.; et al. The impact of climate change on coastal erosion in Southeast Asia and the compelling need to establish robust adaptation strategies. Heliyon 2024, 10, 4. [Google Scholar] [CrossRef]
  20. Berman, M.; Berquist, H.; Herman, J.; Nunez, K. The Stability of Living Shorelines—An Evaluation. In Final Report Submitted to National Oceanic and Atmospheric Administration; Chesapeake Bay Program Office: Annapolis, MD, USA, 2007. [Google Scholar]
  21. NOAA. What Is Shoreline Armoring? Available online: https://oceanservice.noaa.gov/facts/shoreline-armoring.html (accessed on 26 December 2024).
  22. Defeo, O.; McLachlan, A.; Schoeman, D.S.; Schlacher, T.A.; Dugan, J.; Jones, A.; Lastra, M.; Scapinil, F. Threats to sandy beach ecosystems: A review. Estuar. Coast. Shelf Sci. 2009, 81, 1–12. [Google Scholar] [CrossRef]
  23. Currin, C.A.; Chappell, W.S.; Deaton, A. Developing Alternative Shoreline Armoring Strategies: The Living Shoreline Approach in North Carolina. In Puget Sound Shorelines and the Impacts of Armoring—Proceedings of a State of the Science Workshop; Scientific Investigations Report; Shipman, H., Dethier, M.N., Gelfenbaum, G., Fresh, K.L., Dinicola, R.S., Eds.; USGS: Reston, VA, USA, 2010. Available online: http://pubs.usgs.gov/sir/2010/5254/pdf/sir20105254_chap10.pdf (accessed on 5 December 2015).
  24. Young, A.; Runting, R.K.; Kujala, H.; Konlechner, T.M.; Strain, E.M.; Morris, R.L. Identifying opportunities for living shorelines using a multi-criteria suitability analysis. Reg. Stud. Mar. Sci. 2023, 61, 102857. [Google Scholar] [CrossRef]
  25. USACE ERDC. Analysis of Potential Storm Surge Barrier Impacts During Normal Tidal Conditions; ERDC: Vicksburg, MS, USA, 2019. [Google Scholar]
  26. Kirshen, P.; Borrelli, M.; Byrnes, J.; Chen, R.; Lockwood, L.; Watson, C.; Starbuck, K.; Wiggin, J.; Novelly, A.; Uiterwyk, K.; et al. Integrated assessment of storm surge barrier systems under present and future climates and comparison to alternatives: A case study of Boston, USA. Clim. Change 2020, 162, 445–464. [Google Scholar] [CrossRef]
  27. Tognin, D.; D’Alpaos, A.; Marani, M.; Carniello, L. Marsh resilience to sea-level rise reduced by storm-surge barriers in the Venice Lagoon. Nat. Geosci. 2021, 14, 906–911. [Google Scholar] [CrossRef]
  28. Orton, P.; Ralston, D.; van Prooijen, B.; Secor, D.; Ganju, N.; Chen, Z.; Fernald, S.; Brooks, B.; Macell, K. Increased utilization of storm surge barriers: A research agenda on estuary impacts. Earth’s Future 2023, 11, e2022EF002991. [Google Scholar] [CrossRef]
  29. Moraca, S. Venice’s flood barriers are working overtime. How will they change the lagoon? Nat. Italy 2024. [Google Scholar] [CrossRef]
  30. Berman, M.R.; Rudnicky, T. Living Shoreline Suitability Model: Worcester County, Maryland. Center for Coastal Resources Management; Virginia Institute for Marine Sciences: Glouchester Point, VA, USA, 2008. [Google Scholar]
  31. McGuire, M. Living Shorelines: An Alternative for Preventing Coastal Erosion. Florida Sea Grant. 2010. Available online: http://www.flseagrant.org/index.php?option¼com_content&view¼article&id¼201:livingshorelines-an-alternate-for-preventing-coastal-erosion&catid¼51:research-summary&Itemid¼101 (accessed on 5 December 2015).
  32. Mitchell, M.; Bilkovic, D.M. Embracing dynamic design for climate-resilient living shorelines. J. Appl. Ecol. 2019, 56, 1099–1105. [Google Scholar] [CrossRef]
  33. Smith, C.S.; Rudd, M.E.; Gittman, R.K.; Melvin, E.C.; Patterson, V.S.; Renzi, J.J.; Wellman, E.H.; Silliman, B.R. Coming to terms with living shorelines: A scoping review of novel restoration strategies for shoreline protection. Front. Mar. Sci. 2020, 7, 434. [Google Scholar] [CrossRef]
  34. Swann, L. The Use of living shorelines to mitigate the effects of storm events on Dauphin Island, Alabama, USA. Am. Fish. Soc. Symp. 2008, 64, 47–57. [Google Scholar]
  35. Kirwan, M.L.; Magonigal, J.P. Tidal wetland stability in the face of human impacts and sea-level rise. Nature 2013, 503, 53–60. [Google Scholar] [CrossRef]
  36. Wamsley, T.V.; Cialone, M.A.; Smith, J.M.; Ebersole, B.A. Influence of landscape restoration and degradation on storm surge and waves in southern Louisiana. J. Nat. Hazards 2009, 51, 207–224. [Google Scholar] [CrossRef]
  37. Wamsley, T.V.; Cialone, M.A.; Smith, J.M.; Atkinson, J.H.; Rosati, J.D. The potential of wetlands in reducing storm surge. Ocean Eng. 2010, 37, 59–68. [Google Scholar] [CrossRef]
  38. Smith, J.; Bryant, M.; Wamsley, T. Wetland buffers: Numerical modeling of wave dissipation by vegetation. Earth Surf. Process Landf. 2016, 41, 847–854. [Google Scholar] [CrossRef]
  39. Yang, S.L. The Role of ScirpusMarsh in Attenuation of Hydrodynamics and Retention of Fine Sediment in the Yangtze Estuary. Estuar. Coast. Shelf Sci. 1998, 47, 227–233. [Google Scholar] [CrossRef]
  40. Morris, R.L.; Bilkovic, D.M.; Boswell, M.K.; Bushek, D.; Cebrian, J.; Goff, J.; Kibler, K.M.; La Peyre, M.K.; McClenachan, G.; Moody, J.; et al. The application of oyster reefs in shoreline protection: Are we over-engineering for an ecosystem engineer? J. Appl. Ecol. 2019, 56, 1703–1711. [Google Scholar] [CrossRef]
  41. Polk, M.A.; Eulie, D.O. Effectiveness of living shorelines as an erosion control method in North Carolina. ESCO 2018, 41, 2212–2222. [Google Scholar] [CrossRef]
  42. Hardaway, C.S., Jr.; Milligan, D.A.; Duhring, K. Living Shoreline Design Guidelines for Shore Protection in Virginia’s Estuarine Environments. In Special Report in Applied Marine Science and Ocean Engineering No. 421; Virginia Institute of Marine Science, College of William & Mary: Gloucester Point, VA, USA, 2010. [Google Scholar]
  43. National Oceanic and Atmospheric Administration (NOAA). Guidance for Considering the Use of Living Shorelines, A Report of the Living Shorelines Workgroup. 2015. Available online: https://www.habitatblueprint.noaa.gov/wp-content/uploads/2018/01/NOAA-Guidance-for-Considering-the-Use-of-Living-Shorelines_2015.pdf (accessed on 6 January 2025).
  44. Palinkas, C.M.; Orton, P.; Hummel, M.A.; Nardin, W.; Sutton-Grier, A.E.; Harris, L.; Gray, M.; Li, M.; Ball, D.; Burks-Copes, K.; et al. Innovations in coastline management with natural and nature-based features (NNBF): Lessons learned from three case studies. Front. Built Environ. 2022, 8, 814180. [Google Scholar] [CrossRef]
  45. Sale, P.F.; Agardy, T.; Ainsworth, C.H.; Feist, B.E.; Bell, J.D.; Christie, P.; Hoegh-Guldberg, O.; Mumby, P.J.; Feary, D.A.; Saunders, M.I.; et al. Transforming management of tropical coastal seas to cope with challenges of the 21st century. Mar. Pollution Bull. 2014, 85, 8–23. [Google Scholar] [CrossRef]
  46. Leatherman, S.P. Shoreline change mapping and management along the U.S. East Coast. J. Coast. Res. 2003, 38, 5–13. Available online: https://www.jstor.org/stable/25736596 (accessed on 5 December 2024).
  47. Burke, D.G.; Hardaway, C.S. South River Shore Erosion Management and Living Shoreline Guidelines. A report prepared by the Virginia Institute of Marine Science & Burke Environmental Associates. 2007. Available online: http://web.vims.edu/physical/research/shoreline/docs/SouthRiverManagementPlan/AppendixC.pdf (accessed on 9 September 2014).
  48. Rudnicky, T.; Berman, M. Shoreline Management Model Version 5.1 Handbook; Center for Coastal Resources Management, Virginia Institute of Marine Science, William & Mary: Gloucester Point, VA, USA, 2020. [Google Scholar]
  49. Wahl, T.; Jain, S.; Bender, J.; Meyers, S.D.; Luther, M.E. Increasing risk of compound flooding from storm surge and rainfall for major US cities. Nat. Clim. Change 2015, 5, 1093–1097. [Google Scholar] [CrossRef]
  50. Ruan, X.; Sun, H.; Shou, W.; Wang, J. The impact of climate change and urbanization on compound flood risks in coastal areas: A comprehensive review of methods. Appl. Sci. 2024, 14, 10019. [Google Scholar] [CrossRef]
  51. Leonard, M.; Westra, S.; Phatak, A.; Lambert, M.; van den Hurk, B.; McInnes, K.; Risbey, J.; Schuster, S.; Jakob, D.; Stafford-Smith, M. A compound event framework for understanding extreme impacts. WIREs Clim. Change 2014, 5, 113–128. [Google Scholar] [CrossRef]
  52. Xu, K.; Wang, C.; Bin, L. Compound flood models in coastal areas: A review of methods and uncertainty analysis. Nat. Hazards 2023, 116, 469–496. [Google Scholar] [CrossRef]
  53. Quick Facts Monroe County, Florida. Available online: https://www.census.gov/quickfacts/fact/table/monroecountyflorida/PST045223 (accessed on 26 December 2024).
  54. Transit. Available online: https://www.monroecounty-fl.gov/1295/Transit (accessed on 26 December 2024).
  55. Myszewski, M.A.; Alber, M. Living Shorelines in the Southeast: Research and Data Gaps; Report prepared for the Governor’s South Atlantic Alliance by the Georgia Coastal Research Council University of Georgia; Georgia Coastal Research Council University of Georgia: Athens, GA, USA, 2016. [Google Scholar]
  56. Toimil, A.; Álvarez-Cuesta, M.; Losada, I.J. Neglecting the effect of long-and short-term erosion can lead to spurious coastal flood risk projections and maladaptation. Coast. Eng. 2023, 179, 104248. [Google Scholar] [CrossRef]
  57. Unguendoli, S.; Biolchi, L.G.; Aguzzi, M.; Pillai, U.P.A.; Alessandri, J.; Valentini, A. A modeling application of integrated nature based solutions (NBS) for coastal erosion and flooding mitigation in the Emilia-Romagna coastline (Northeast Italy). Sci. Total Environ. 2023, 867, 161357. [Google Scholar] [CrossRef]
  58. Palermo, R.V.; Perron, J.T.; Soderblom, J.M.; Birch, S.P.; Hayes, A.G.; Ashton, A.D. NEWTS1. 0: Numerical model of coastal Erosion by Waves and Transgressive Scarps. GMD 2024, 17, 3433–3445. [Google Scholar] [CrossRef]
  59. Gittman, R.K.; Popowich, A.; Bruno, J.; Peterson, C. Marshes with and without sills protect estuarine shorelines from erosion better than bulkheads during a Category One hurricane. Ocean Coast. Manag. 2014, 102, 94–102. [Google Scholar] [CrossRef]
  60. Saaty, T. How to make a decision: The Analytic Hierarchy Process. Eur. J. Oper. Res. 1990, 48, 9–26. [Google Scholar] [CrossRef]
  61. Meng, Y.; Malczewski, J.; Boroushaki, S. A GIS-based multicriteria decision analysis approach for mapping accessibility patterns of housing development sites: A case study in Canmore, Alberta. J. Geogr. Inf. Sys 2011, 3, 50. [Google Scholar] [CrossRef]
  62. Sharp, R.; Tallis, H.T.; Ricketts, T.; Guerry, A.D.; Wood, S.A.; Chaplin-Kramer, R.; Nelson, E.; Ennaanay, D.; Wolny, S.; Olwero, N.; et al. InVEST 3.2.0 User’s Guide; The Natural Capital Project: Stanford, CA, USA, 2015; pp. 114–131. [Google Scholar]
  63. U.S. Army Corps of Engineers (USACE). Shore Protection Manual, Volume I; Department of the Army, U.S. Army Corps of Engineers: Washington, DC, USA, 1984; pp. 3–55. [Google Scholar]
  64. Luettich, R.; Westerink, J.; Scheffner, N. ADCIRC: An Advanced Three-Dimensional Circulation Model for Shelves, Coasts, and Estuaries; Report 2. User’s Manual for ADCIRC-2DDI; Coastal Engineering Research Center: Vicksburg, MS, USA, 1994. [Google Scholar]
  65. Environmental Sensitivity Index (ESI) for South Florida. Available online: http://geodata.myfwc.com/datasets/2910418e885f4d69823021720e0156e3_24 (accessed on 15 September 2015).
  66. Environmental Sensitivity Index (ESI) Maps and Data. Available online: https://response.restoration.noaa.gov/resources/environmental-sensitivity-index-esi-maps (accessed on 15 September 2015).
  67. South Florida Water Management District (SFWMD). GIS Data Catalog (2007 Broward 10-ft DEM in NAVD 1988, Release Version 1; 2007–2008 Miami-Dade 10-ft DEM in NAVD 1988, Release Version 1; 2007–2008 Palm Beach 10-ft DEM in NAVD 1988, Release Version 1). 2009. Available online: https://www.sfwmd.gov/science-data/gis (accessed on 9 December 2014).
  68. Fish and Wildlife Service (FWS). South Florida Multi-Species Recovery Plan (MSRP)—Coastal Communities; South Florida Ecological Services Field Office, U.S. Department of the Interior: Panama City, FL, USA, 1999. [Google Scholar]
  69. Coastal Emergency Risks Assessment: Storm Surge—Wind—Wave-Flood Guidance. Available online: http://cera.coastalrisk.live (accessed on 5 December 2024).
  70. Cangialosi, J.P.; Latto, A.S.; Berg, R. National Hurricane Center Tropical Cycline Report—Hurricane Irma (AL112017) 30 August–12 September 2017. 2018. Available online: https://www.nhc.noaa.gov/data/tcr/AL112017_Irma.pdf (accessed on 10 December 2024).
  71. Monroe County. Approximate Damage Assessment Results. 2018. Available online: https://www.monroecounty-fl.gov/DocumentCenter/View/12459/Approximate-Damage-Assessment-Results?bidId= (accessed on 5 December 2024).
  72. Sweet, W.V.; Hamlington, B.D.; Kopp, R.E.; Weaver, C.P.; Barnard, P.L.; Bekaert, D.; Brooks, W.; Craghan, M.; Dusek, G.; Frederikse, T.; et al. Global and Regional Sea Level Rise Scenarios for the United States: Updated Mean Projections and Extreme Water Level Probabilities Along U.S. Coastlines; NOAA Technical Report NOS 01, 2022; National Oceanic and Atmospheric Administration, National Ocean Service: Silver Spring, MD, USA, 2022; pp. 1–95. Available online: https://aambpublicoceanservice.blob.core.windows.net/oceanserviceprod/hazards/sealevelrise/noaa-nos-techrpt01-global-regional-SLR-scenarios-US.pdf (accessed on 18 December 2024).
  73. Guan, Q.; Chen, J.; Guan, C.; Li, H.; Zhou, X.; Meng, T. The responses of ecosystem services in coastal cities to urbanization in 30 years: A case study of Qingdao City, China. Ocean Coast. Manag. 2024, 258, 107415. [Google Scholar] [CrossRef]
  74. Leslie, H.M.; McLeod, K.L. Confronting the challenges of implementing marine ecosystem-based management. Front. Ecol. Environ. 2007, 5, 540–548. [Google Scholar] [CrossRef]
  75. United Nations Environment Programme (UNEP). Ecosystem Management Programme: A New Approach to Sustainability; Division of Environmental Policy Implementation: Nairobi, Kenya, 2009. [Google Scholar]
  76. Wing, O.E.; Lehman, W.; Bates, P.D.; Sampson, C.C.; Quinn, N.; Smith, A.M.; Kousky, C. Inequitable patterns of US flood risk in the Anthropocene. Nat. Clim. Change 2022, 12, 156–162. [Google Scholar] [CrossRef]
  77. Nesshöver, C.; Assmuth, T.; Irvine, K.N.; Rusch, G.M.; Waylen, K.A.; Delbaere, B.; Haase, D.; Jones-Walters, L.; Keune, H.; Kovacs, E.; et al. The science, policy and practice of nature-based solutions: An interdisciplinary perspective. Sci. Total Environ. 2017, 579, 1215–1227. [Google Scholar] [CrossRef]
  78. McPhearson, T.; Kabisch, N.; Frantzeskaki, N. Nature-based solutions for sustainable, resilient, and equitable cities. In Nature-Based Solutions for Cities; Elgar: Northampton, MA, USA, 2023; pp. 1–11. [Google Scholar]
  79. Kreeger, D.; Moody, J. A Framework for Standardized Monitoring of Living Shorelines in the Delaware Estuary and Beyond. Partnership for the Delaware Estuary Shoreline Monitoring Framework. 2014. Available online: https://s3.amazonaws.com/delawareestuary/sites/default/files/PDE%20Living%20Shoreline%20Monitoring%20Framework%204-23-14%20DRAFT.pdf (accessed on 6 January 2025).
  80. Herrera-Silveira, J.A.; Teutli-Hernandez, C.; Secaira-Fajardo, F.; Braun, R.; Bowman, J.; Geselbracht, L.; Musgrove, M.; Rogers, M.; Schmidt, J.; Robles-Toral, P.J.; et al. Hurricane Damages to Mangrove Forests and Post-Storm Restoration Techniques and Costs; The Nature Conservancy: Arlington, VA, USA, 2022. [Google Scholar]
  81. Coastal Resilience: Using Nature-Based Solutions to Protect Florida’s Coasts. Available online: https://www.nature.org/en-us/about-us/where-we-work/united-states/florida/stories-in-florida/florida-coastal-resilience/ (accessed on 6 January 2025).
  82. Prado, H.A.; Rodrigues, T.; Manes, S.; Kasecker, T.; Vale, M.M.; Scarano, F.R.; Pires, A.P.F. Designing nature to be a solution for climate change in cities: A meta-analysis. Sci. Total Environ. 2024, 954, 176735. [Google Scholar] [CrossRef]
  83. U.S. Army Corps of Engineers (USACE). Nationwide Permit 54—Living Shorelines (effective Date: February 25, NWP Final Notice, 86 FR 73522). 2022. Available online: https://www.swt.usace.army.mil/Portals/41/docs/missions/regulatory/2021%20NWP/NWP-54.pdf?ver=5LdLM2jDQyrn9GykSMxjKw%3D%3D (accessed on 6 January 2025).
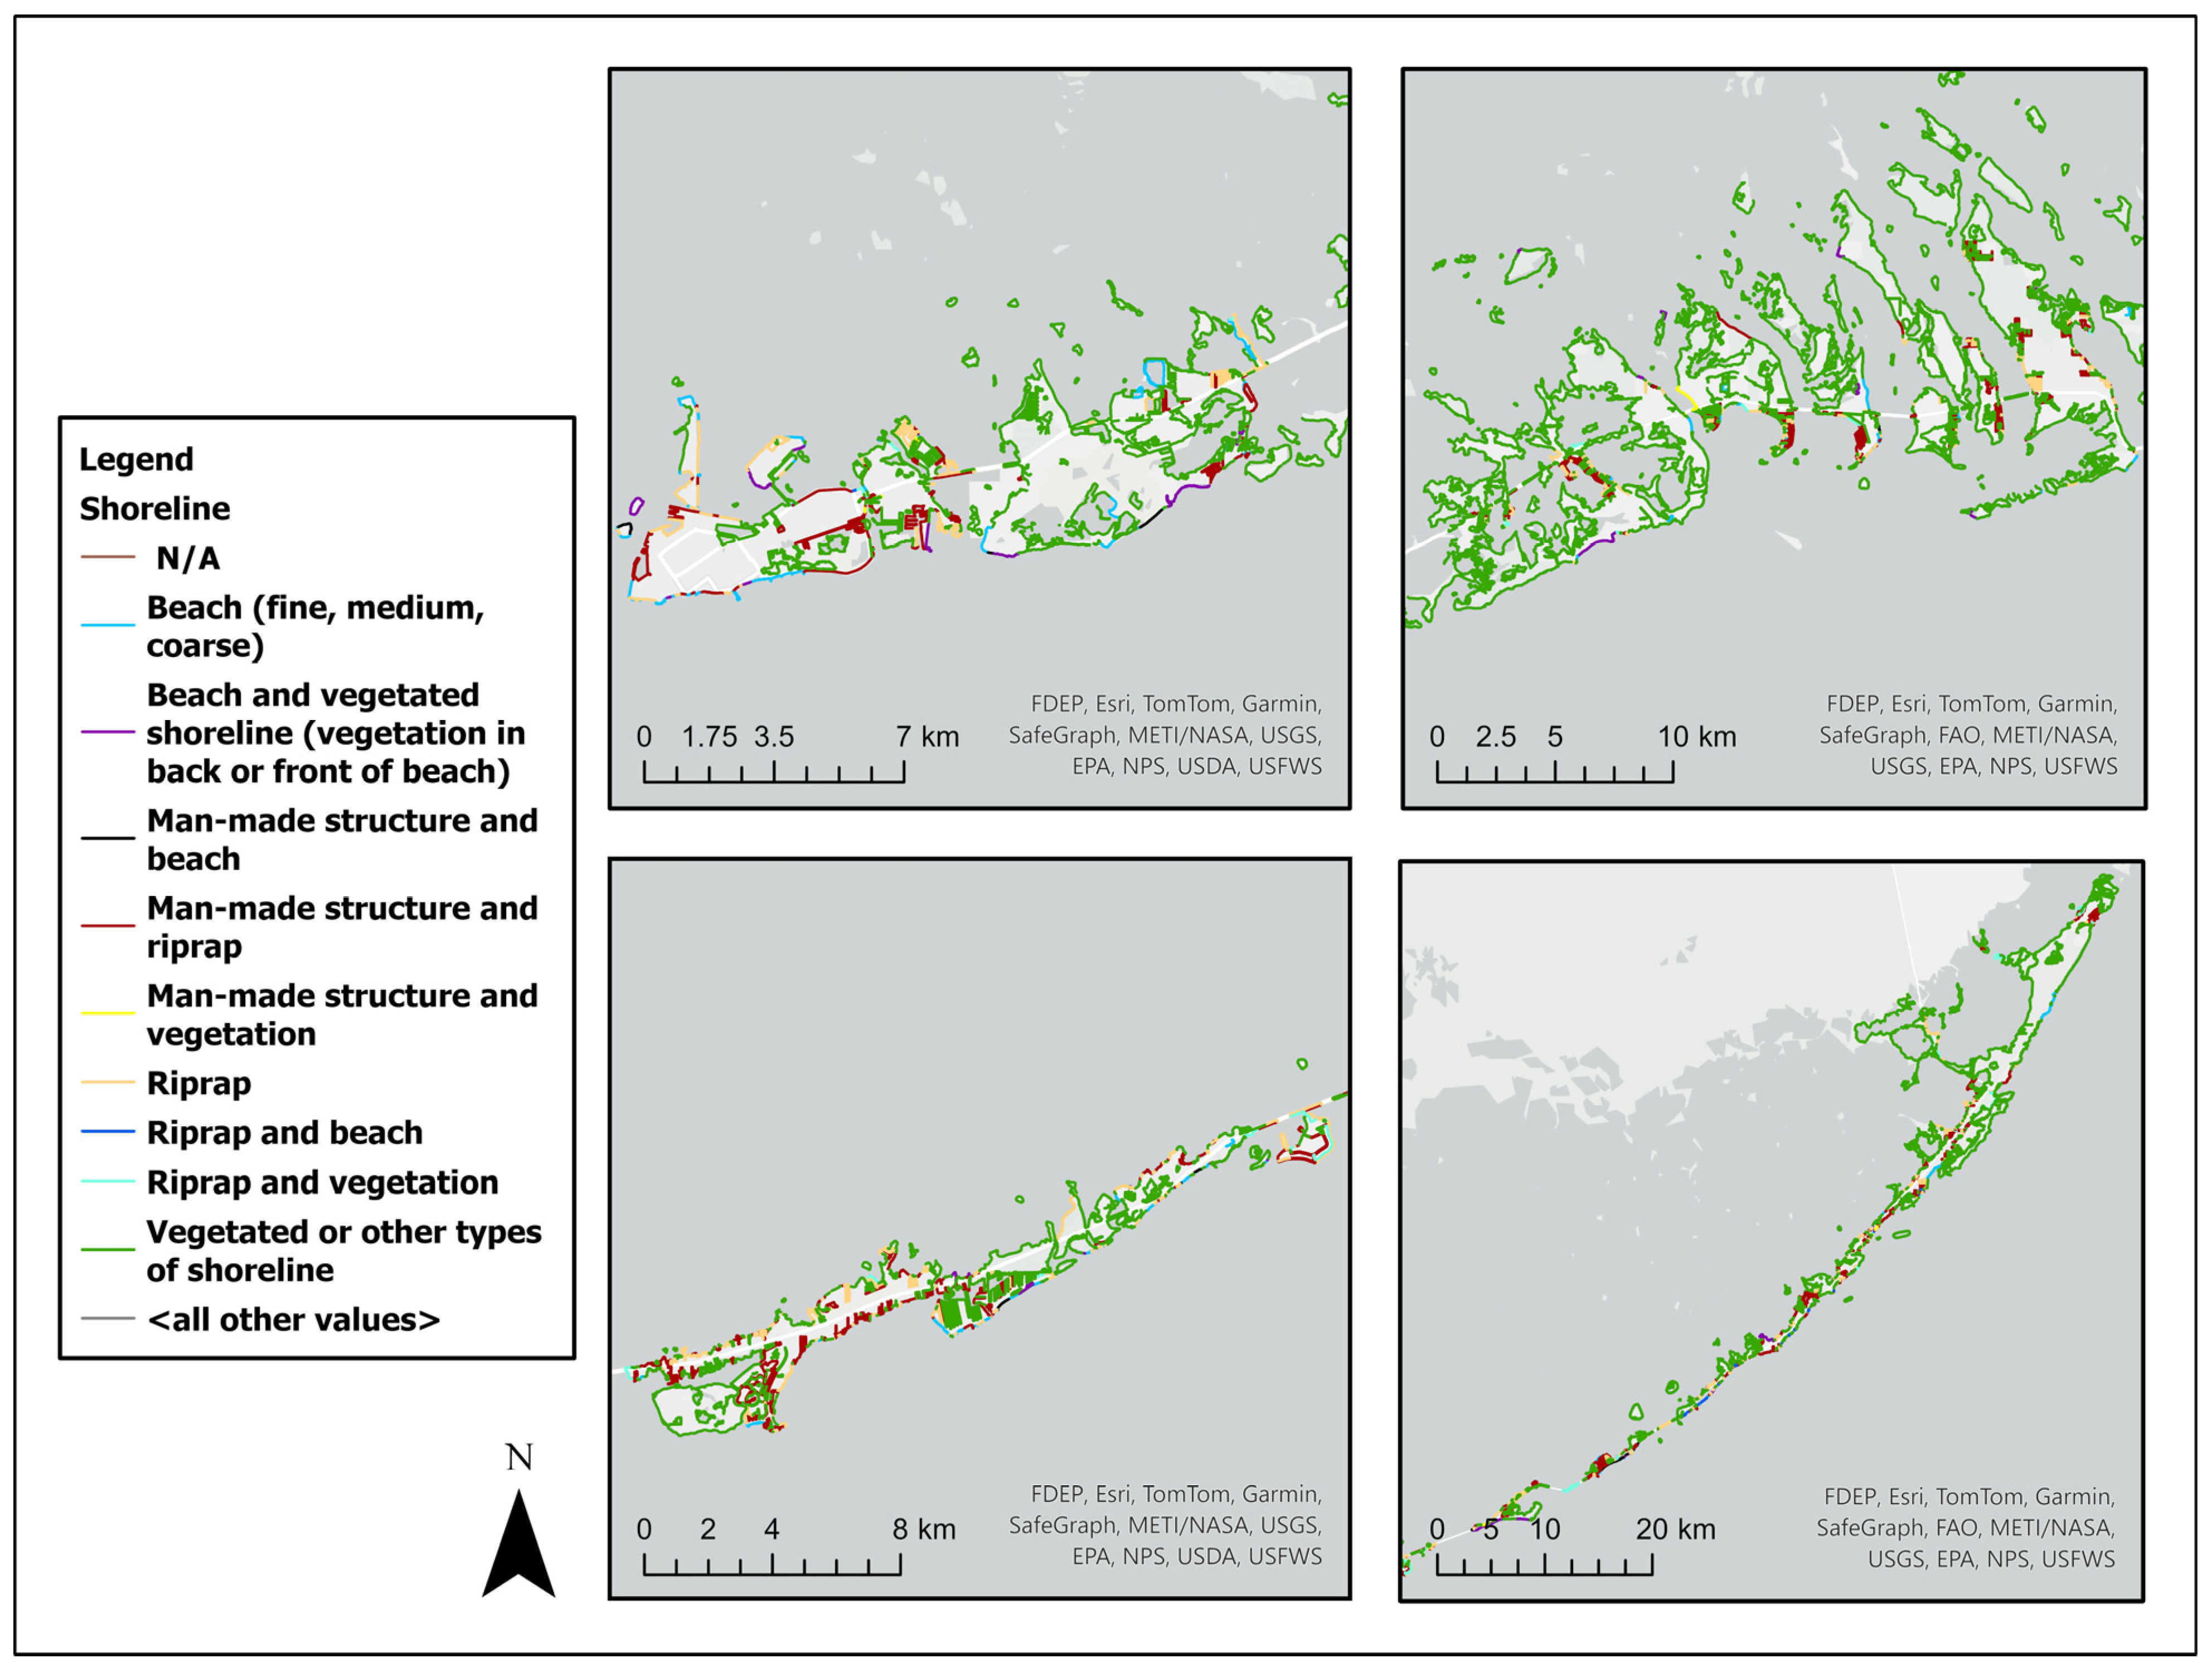
Figure 1. The Florida Keys Study Area.
Jmse 13 00543 g001
Figure 2. Conceptual suitability decision framework.
Jmse 13 00543 g002
Figure 3. SREI variables and categorization.
Jmse 13 00543 g003
Figure 4. Elevation map of the Florida Keys.
Jmse 13 00543 g004
Figure 5. Shoreline typology of the Florida Keys: (top-left image) Key West; (top-right image) Big Pine Key; (bottom-left image) Marathon; and (bottom-right image) Key Largo.
Jmse 13 00543 g005
Figure 6. Prevailing wind direction for May–October and November–April in the Florida Keys (based on 2015 and 2016 data).
Jmse 13 00543 g006
Figure 7. Wave exposure: Lower Keys (top image) and Upper Keys (bottom image).
Jmse 13 00543 g007
Figure 8. Shoreline Relative Exposure Index (SREI) scores: (top-left image) Key West; (top-right image) Big Pine Key; (bottom-left image) Marathon; and (bottom-right image) Key Largo.
Jmse 13 00543 g008
Figure 9. Storm surge generated by Hurricane Irma on 10 September 2017.
Jmse 13 00543 g009
Figure 10. Recommended nature-based shoreline stabilization option: (top-left image) Key West; (top-right image) Big Pine Key; (bottom-left image) Marathon; and (bottom-right image) Key Largo.
Jmse 13 00543 g010
Figure 11. Decision tree for implementing broadly defined stabilization categories for critically eroded shorelines in the Florida Keys (modified from the estuarine version in Mitsova et al. 2018 [11]).
Jmse 13 00543 g011
Figure 12. The protective role of natural infrastructure—evidence from Hurricane Irma: (top image) Lower Matecumbe Key near U.S. Highway 1, Florida Keys; (bottom image) Scout Key near U.S. Highway 1, Florida Keys.
Jmse 13 00543 g012
Table 1. Distribution of various types of shorelines in the Florida Keys based on the ESI classification.
Shoreline DescriptionLength (km)Length (%)
Salt- and brackish water marsh/Scrub-shrub wetlands27.731.09
Salt- and brackish water marsh273.4110.71
Scrub-shrub wetlands1552.4060.82
Exposed, solid human-made structures59.092.32
Exposed mud flats4.510.18
Fine- to medium-grain sand beaches8.390.33
Scarps and steep slopes in sand0.440.02
Coarse-grain sand beaches26.831.05
Mixed sand and gravel beaches16.060.63
Exposed riprap68.832.70
Exposed tidal flats; sand flats1.660.06
Sheltered rocky shores and scarps7.680.30
Sheltered solid human-made structures470.2618.42
Sheltered riprap33.041.29
Vegetated low banks2.160.08
Table 2. Wind characterization in the Florida Keys.
Wind Speed (mph)May–OctoberNovember–April
DIRAve HighDistributionP (X < X1)DIR
%
Cond. ProbExposure ScoreDIR
%
Cond. ProbExposure Score
N17.57Log Logistic (3P)0.9920.0340.0350.7010.1400.1424.652
NNE15.10Gen. Extreme0.9570.0180.0190.3830.1160.1223.997
NE14.80Weibull0.9500.0580.0611.2350.1020.1073.519
ENE13.53Weibull0.9030.0640.0701.4190.0740.0822.690
E18.40Weibull0.9960.2200.2204.4490.1520.1525.000
ESE18.43Weibull0.9960.2470.2485.0000.1480.1484.878
SE14.60Weibull0.9440.1020.1082.1740.0740.0782.575
SSE12.80Rayleigh0.8550.0600.0701.4140.0240.0280.924
S14.33Weibull0.9350.0620.0661.3320.0350.0381.235
SSW10.37Rayleigh0.6910.0250.0370.7420.0170.0240.791
SW10.07Weibull0.6650.0240.0360.7170.0130.0190.640
WSW8.30Weibull0.4980.0130.0260.5150.0130.0260.854
W8.77Weibull0.5430.0220.0400.8090.0090.0170.559
WNW12.53Weibull0.8510.0180.0210.4300.0130.0150.500
NW15.93Gen. Extreme0.9750.0160.0170.3380.0260.0270.873
NNW14.63Weibull0.9450.0180.0190.3880.0440.0471.544
Table 3. Results from the pairwise comparisons and eigenvector weights.
ParametersShoreline Type (ST)Nearshore SAVNearshore Slope (NS)Upland
Habitat (UpH)
Wind Wave
Exposure (WWE)
Eigenvector
Shoreline type (ST) 11.001.261.093.710.860.23
Nearshore SAV0.791.000.862.941.260.15
Nearshore slope (NS)0.921.161.003.411.090.20
Upland habitat (UpH)0.270.340.291.003.710.02
Wind Wave Exposure (WWE)1.161.461.264.291.000.32
1 Armored, natural, hybrid.
Table 4. Length and percentage of the proposed shoreline stabilization options.
Shoreline Stabilization OptionLength (km)Length (%)
Enhancement, with harder features and vegetation72.372.84
Enhancement, with vegetation only39.821.56
None, water depth > 3.5 feet, slope > 1:10642.6525.18
Soft, with vegetation and potentially sediment only45.231.77
Soft, with vegetation only43.201.69
Vegetated or other type of natural shoreline1709.2066.96
Table 5. A list of enhancement and stabilization options by shoreline type.
CategoryStabilization and Enhancement Options
Natural coastal and estuarine environments
Mangrove swamp
Saltwater marsh
Maritime hammock
Beach dune
Shoreline Restoration
Mangrove planter creation
Mangrove swamp, existing and restored
Mangrove swamp restoration
Hammock restoration
Dune hammock restoration
Dune restoration
Wetlands, hammock, and dune restoration
Wetlands restoration
Lagoon restoration
Spoil island restoration
Breakwater, oyster reef restoration
Oyster reef restoration
Mangrove, seagrass, and oyster reef restoration
Seagrass restoration
Shoreline Enhancement
Mangrove planting
Cordgrass planting
Riprap with mangrove fringe
Seawall with mangrove planting/fringe
Shoreline Stabilization/Armoring
Breakwater (permeable)
Riprap revetment (permeable)
Seawall with riprap (impermeable)
Seawall or bulkhead (impermeable)
Hybrid Options
Mangrove replanting/fringe near existing revetments or seawalls
Dune hammock restoration and shoreline stabilization (e.g., riprap or breakwaters)
Dune mangrove restoration and shoreline stabilization (e.g., breakwaters and oyster reefs)
Hammock mangrove restoration and shoreline stabilization (e.g., breakwaters and oyster reefs)
Disclaimer/Publisher’s Note: The statements, opinions and data contained in all publications are solely those of the individual author(s) and contributor(s) and not of MDPI and/or the editor(s). MDPI and/or the editor(s) disclaim responsibility for any injury to people or property resulting from any ideas, methods, instructions or products referred to in the content.

