Assessing the Resilience of Specialized Terminals Within Coastal Port Transportation Systems: An Improved RBOP Method

Abstract
1. Introduction
- (1)
- Robustness: The ability of specialized terminals to maintain a certain level of function in the face of major risk events such as natural disasters.
- (2)
- Redundancy: The facility (or handling equipment) of specialized terminals should have a certain amount of spare capacity or alternative solutions, such as substituting berths in nearby ports. When the functions of some facilities (or handling equipment) are damaged due to emergencies, the alternative solutions can be replenished in time, preventing the transport system from being completely paralyzed.
- (3)
- Recoverability: Specialized terminals can recover to a certain level of function in a short time after the emergency.
- (4)
- Adaptability: Specialized terminals can learn from past accidents and improve their adaptability to various emergencies by improving the management mechanism.
- (1)
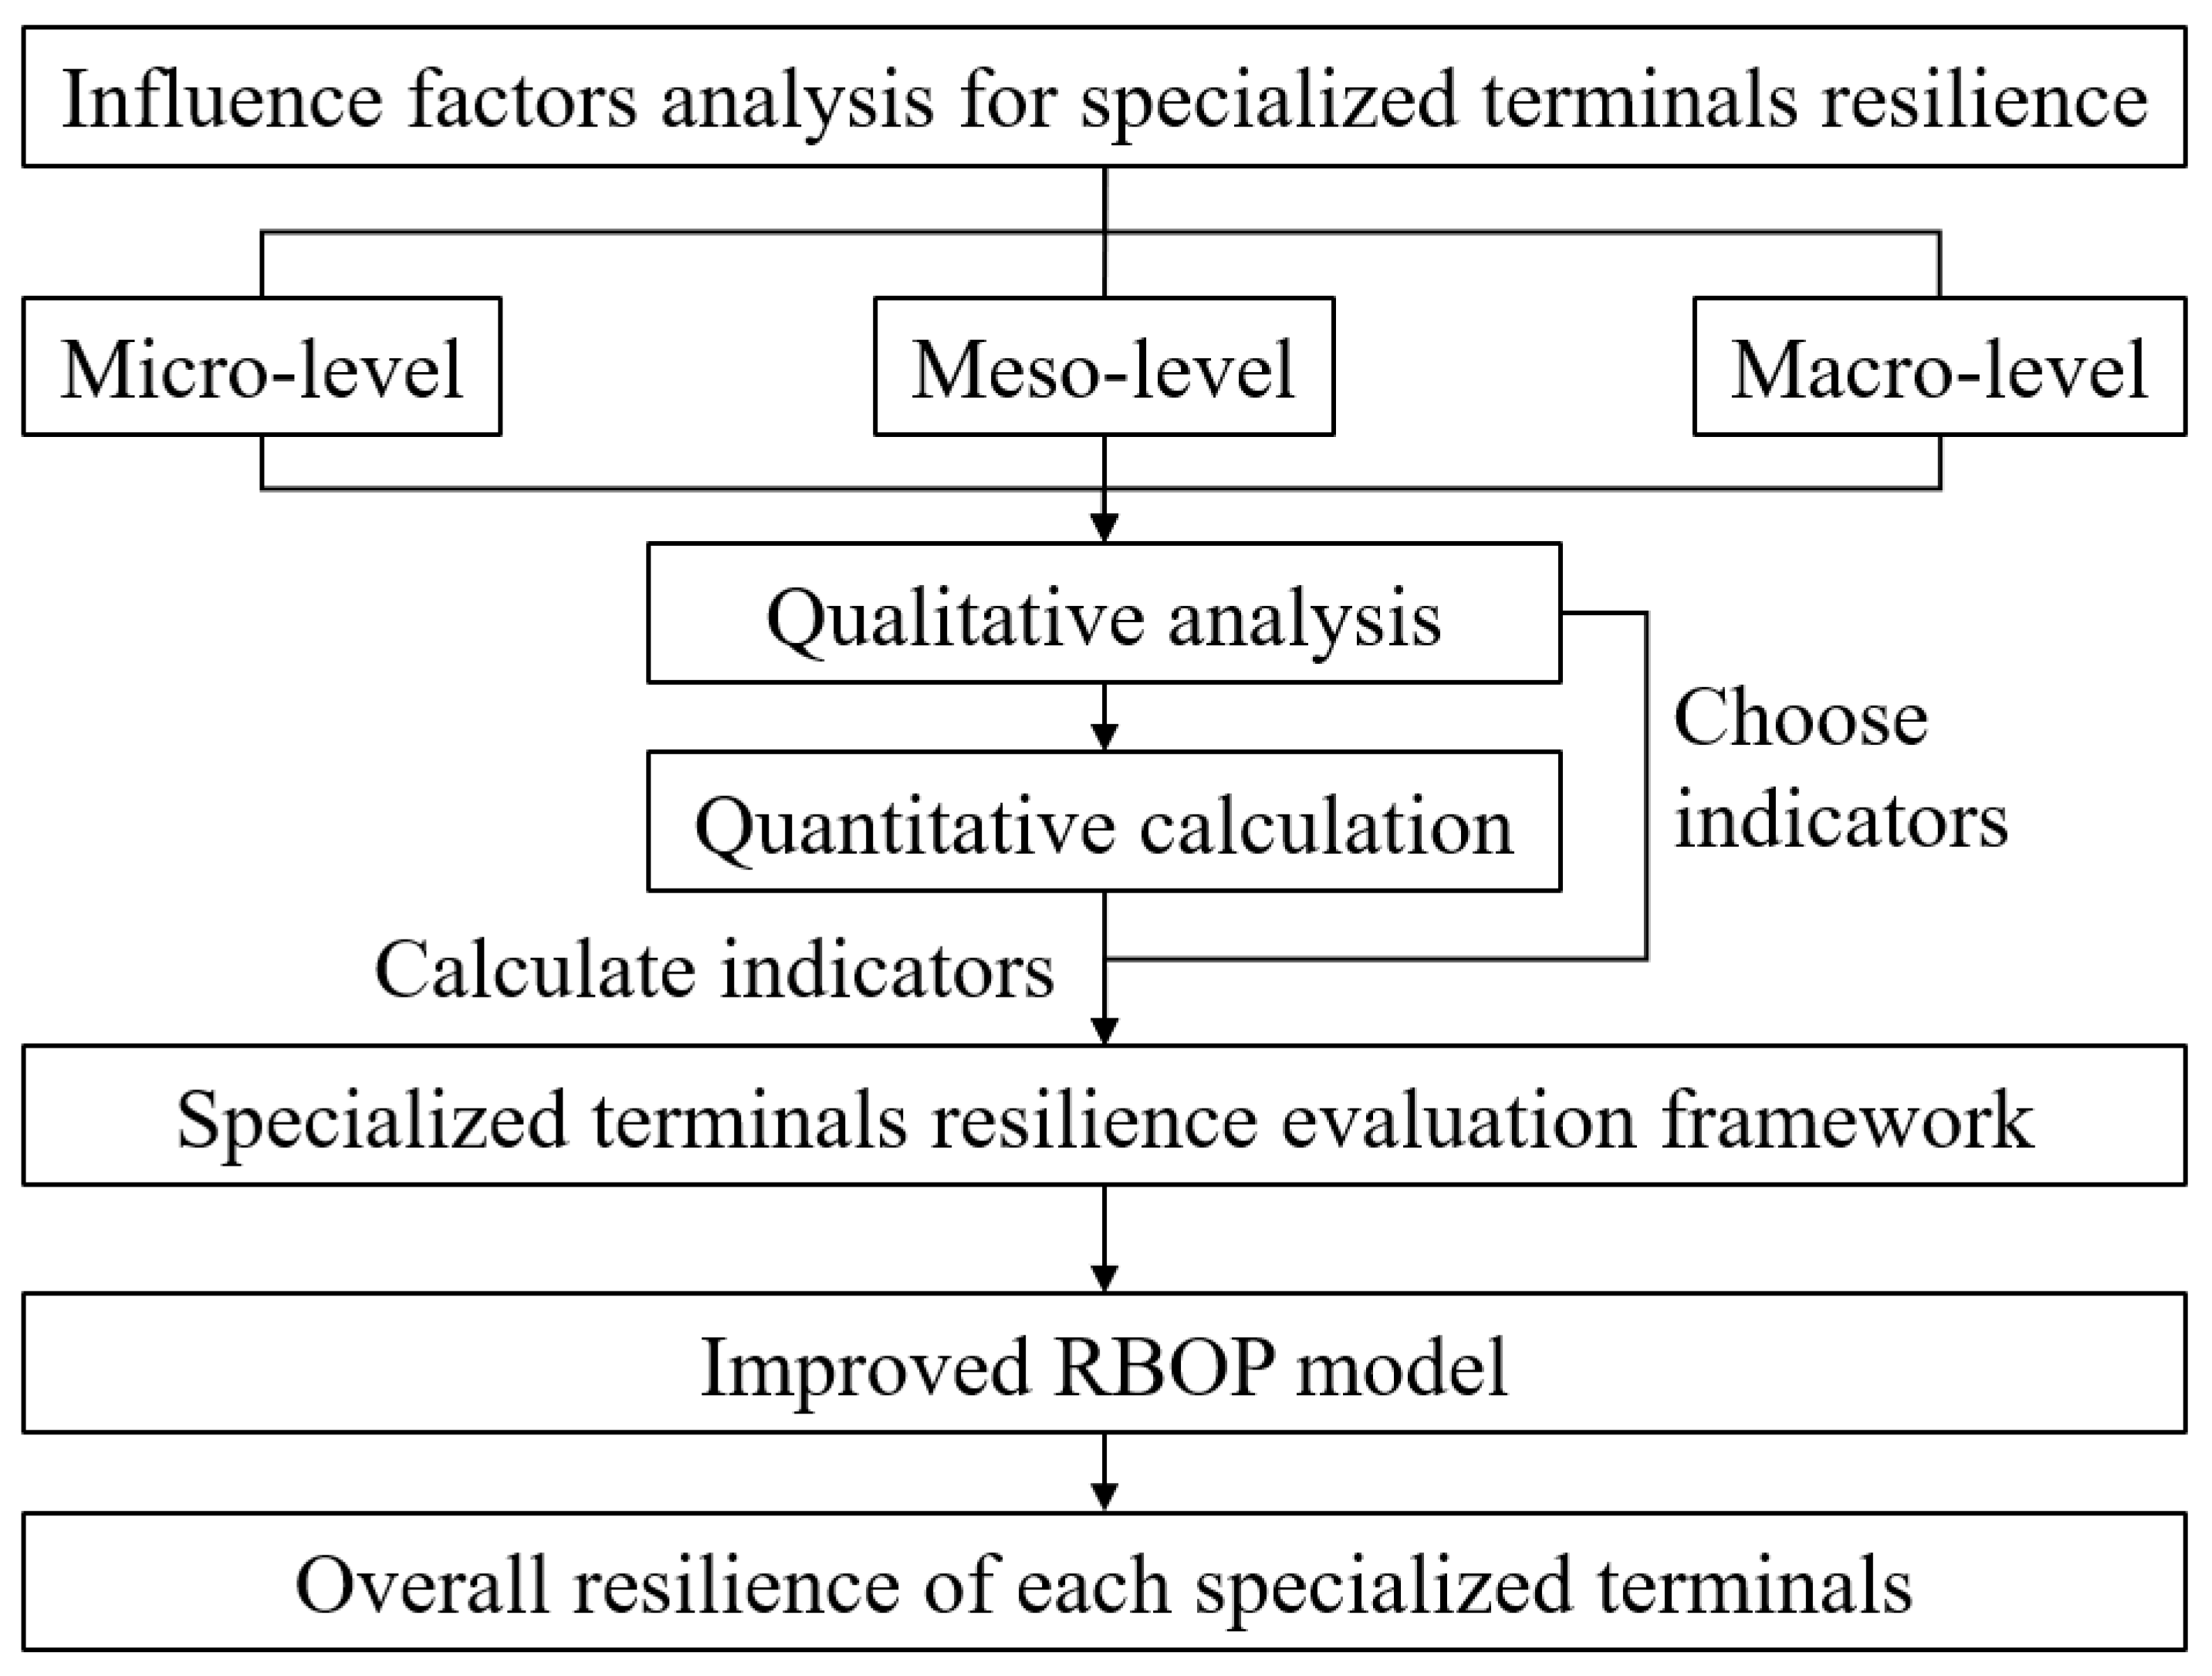
- From a comprehensive perspective of the coastal port transportation system, the factors affecting the resilience of specialized terminals at the micro-level, meso-level, and macro-level are qualitatively analyzed.
- (2)
- The quantitative calculation indicators of the influencing factors are proposed.
- (3)
- In view of the characteristics of specialized terminals and the coastal port transportation system, an improved RBOP method is proposed to evaluate the resilience of specialized terminals by fully considering the preferences of port stakeholders and the future development trend of ports.
2. Literature Review
2.1. Port System Resilience Evaluation
2.2. Port Transportation Network Resilience Evaluation
3. Methodology
3.1. Three-Level Resilience Evaluation Framework
3.1.1. Influence Factors Analysis
- (1)
- Micro-level: inside the specialized terminal
- (2)
- Meso-level: other port facilities
- (3)
- Macro-level: corridors and other ports within the transport system
3.1.2. Construction of Evaluation Framework
3.2. Improved RBOP Model
3.2.1. Optimum Alternative, Optimal Alternative, and the Improvement of RBOP
- (1)
- Optimum alternative
- (2)
- Optimal alternative
- (3)
- The improvement of RBOP
3.2.2. Calculation Procedure
4. Application and Results
4.1. Object-Specialized Terminal Selection
4.2. Results Analysis
- (1)
- Step 1
- (2)
- Step 2
- (3)
- Step 3
- (4)
- Step 4
- (5)
- Step 5
- (6)
- Step 6
- (7)
- Step 7
- (8)
- Step 8
- (9)
- Step 9
4.3. Comparison
4.3.1. Comparison of the Improved RBOP with Existing MCDM Methods
4.3.2. Influences of Experts’ Evaluation on Optimum Alternative for Each Object Port
4.4. Discussion
- (1)
- For qualitative indicators in the resilience evaluation framework, the experts will evaluate their condition into seven grades (i.e., from Very Good to Very Poor). For example, for indicator T25 (i.e., construction of collection and distribution system), the experts will consider whether there is an inland waterway, whether the port has an inbound railway, and the number of lanes on the inbound highway in specialized terminals. If the specialized terminals have neither an inland waterway nor inbound highway, its T25 value will be Very Poor.
- (2)
- The optimum alternative for each object port, which reflects the possible best condition of the object port, is also determined by experts’ evaluation. Different experts may have significant differences in their judgments on the future development trend of the same port, which is the reason why we need to consider various experts’ ideas to determine the optimum alternative matrix.
- (3)
- The weight of each evaluation criterion is obtained according to experts’ evaluation. The experts will consider the possible relationship between items in the same second-level indicator such as the number of alternative berths for largest berths (T34) and representative berths (T35). The weight of each evaluation criterion can be very important when we consider many criterions to calculate port resilience.
5. Conclusions
- (1)
- Since the improved RBOP method introduces expert evaluation when determining the optimum and optimal alternatives, compared with other MCDM methods, the proposed method takes into account the current status and future development trend of the specialized terminals in the object port. Therefore, the resilience assessment result shows some differences from the existing MCDM methods, which are more in line with experts’ expectations.
- (2)
- In the case study, the resilience ranking of specialized container terminals from highest to lowest is Guangzhou Port, Shanghai Port, Tianjin Port, Shenzhen Port, Xiamen Port, Ningbo Zhoushan Port, Dalian Port, and Qingdao Port. The bottleneck of the specialized terminals’ resilience in each object port can also be analyzed from the optimal point matrix. For example, the main factors leading to the poor resilience of specialized container terminals in Dalian Port are the high equipment failure rate, relatively backward collection and distribution system, and poor berth fungibility.
Author Contributions
Funding
Data Availability Statement
Conflicts of Interest
Appendix A. Calculation Method of Evaluation Indicators for Specialized Terminal Resilience
- (1)
- Based on the qualitative analysis of specialized terminals in seaports at the macro-level, meso-level, and micro-level in Section 3.1.1, the necessity of establishing each indicator was confirmed.
- (2)
- The specific calculation methods for the indicators were derived from practical investigations of domestic ports.
- (3)
- The calculation methods for all indicators were finalized after incorporating suggestions from the expert panel invited in this study.
Appendix A.1. Ship Tonnage
Appendix A.2. Dangerous Goods Vessel Control Level
Appendix A.3. Proportion of Dangerous Goods Handled at Terminal
Appendix A.4. Rate of Change in Cargo Throughput Due to Terminal Equipment Failure
Appendix A.5. Rate of Change in Cargo Throughput Due to Damage to Terminal Facilities
Appendix A.6. Mean Time to Repair Equipment Failure in Terminal
Appendix A.7. Mean Time to Repair Facility Damage in Terminal
Appendix A.8. Number of Particularly Major Accidents in Production Safety at Terminal

| Grade of Accident | Number of Deaths | Number of Seriously Injured | Financial Loss (Million CNY) |
|---|---|---|---|
| Particularly major accident | >30 | >100 | >100 |
| Major accident | 10~30 | 50~100 | 50~100 |
| Large accident | 3~10 | 10~50 | 10~50 |
| General accident | <3 | <10 | <10 |
Appendix A.9. Number of Major Accidents in Production Safety at Terminal
Appendix A.10. Number of Large Accidents in Production Safety at Terminal
Appendix A.11. Number of General Accidents in Production Safety at Terminal
Appendix A.12. Recovery Time of Particularly Major Accidents in Production Safety at Terminal
Appendix A.13. Recovery Time of Major Accidents in Production Safety at Terminal
Appendix A.14. Recovery Time of Large Accidents in Production Safety at Terminal
Appendix A.15. Recovery Time of General Accidents in Production Safety at Terminal
Appendix A.16. Average Berth Utilization Rate of Terminal
Appendix A.17. Number of Particularly Major Water Traffic Accidents
| Grade of Accident | Number of Deaths | Number of Seriously Injured | Ship’s Oil Spill (ton) | Financial Loss (Million CNY) |
|---|---|---|---|---|
| Particularly major accident | >30 | >100 | >1000 | >100 |
| Major accident | 10~30 | 50~100 | 500~1000 | 50~100 |
| Large accident | 3~10 | 10~50 | 100~500 | 10~50 |
| General accident | <3 | <10 | <100 | <10 |
Appendix A.18. Number of Major Water Traffic Accidents
Appendix A.19. Number of Large Water Traffic Accidents
Appendix A.20. Number of General Water Traffic Accidents
Appendix A.21. Recovery Time of Particularly Major Water Traffic Accidents
Appendix A.22. Recovery Time of Major Water Traffic Accidents
Appendix A.23. Recovery Time of Large Water Traffic Accidents
Appendix A.24. Recovery Time of General Water Traffic Accidents
Appendix A.25. Construction of Collection and Distribution System
- (1)
- Whether there is an inland waterway;
- (2)
- Whether the port has an inbound railway;
- (3)
- The number of lanes of the inbound highway.
Appendix A.26. Port Monitoring Coverage
Appendix A.27. Intelligent Monitoring and Management Rate of Port Pipe Network Pipeline
Appendix A.28. Construction of Port Fire Safety Facilities
- (1)
- Whether the layout meets the standard requirements;
- (2)
- Whether the construction scale meets the standard requirements;
- (3)
- The rate of facilities in good condition;
- (4)
- The rate of compliance of relevant equipment.
Appendix A.29. Construction of Port Emergency Communication Command Facilities
- (1)
- Whether the layout meets the standard requirements;
- (2)
- Whether the construction scale meets the standard requirements;
- (3)
- The rate of facilities in good condition;
- (4)
- The rate of compliance of relevant equipment.
Appendix A.30. Construction of Port Meteorological Disaster Monitoring System
- (1)
- Whether the wind and platform protection devices are working normally;
- (2)
- Whether the meteorological disaster monitoring and early warning system are operating normally;
- (3)
- Whether to adopt the corresponding level of lightning protection measures and carry out regular inspections.
Appendix A.31. Emergency Plan System
- (1)
- Whether to develop a sound emergency rescue plan;
- (2)
- Whether to achieve the coordination of plans among departments;
- (3)
- Whether to carry out emergency drills regularly;
- (4)
- Whether to conduct an emergency preparedness assessment.
Appendix A.32. Emergency Drill Carried Out
- (1)
- Safety education coverage;
- (2)
- Whether to carry out emergency avoidance drills;
- (3)
- Whether to organize professional emergency rescue teams to join training and exercises;
- (4)
- Whether to carry out emergency drills regularly for areas with a high frequency of emergencies or low frequency of emergencies but with great loss and impact after occurrence;
- (5)
- Whether to carry out cross-regional emergency drills regularly.
Appendix A.33. Port Integrated Risk Assessment
- (1)
- Whether to carry out security risk identification and assessment;
- (2)
- Whether to prepare risk assessment reports and update them in time;
- (3)
- Whether to establish a security risk management information platform;
- (4)
- Whether to conduct security risk assessments for each functional area.
Appendix A.34. The Number of Alternative Berths for Largest Berths
Appendix A.35. The Number of Alternative Berths for Representative Berths
Appendix A.36. The Number of Alternative Transport Channels
Appendix B. Methodology on Experts’ Evaluation
- Expert selection criteria and recruitment
- (1)
- Selected experts must have long-term professional experience in port-related industries.
- (2)
- For academics, they must hold a Ph.D. and a senior professional title, with at least five years of work experience.
- (3)
- For experts from enterprises or port design institutions, they must possess a master’s degree or higher and have at least ten years of work experience.
- 2.
- Procedures for collecting expert evaluations
- (1)
- Providing feedback on the rationality of the definitions and calculation methods for each indicator in the proposed resilience assessment framework (see Appendix A).
- (2)
- Assigning a seven-level score (from Very Good to Very Poor in Table 4) for each qualitative indicator involved in the case study analysis for every object port.
- (3)
- Based on their assessment of the current status and future development trends of each object port, specifying the best achievable indicator value for each port as determined by expert judgment to calculate the optimum alternative.
- (4)
- Providing expert-determined importance weights for all indicators involved in the case study analysis.
- 3.
- Methods for integrating expert opinions
- (1)
- Appendix A fully incorporates all expert suggestions regarding indicator calculation methods.
- (2)
- For qualitative indicators, the mode of all expert evaluation results will be adopted.
- (3)
- For quantitative indicators, the average of all expert evaluation results will be used.
- 4.
- Reliability and control subjectivity
References
- United Nations Conference on Trade and Development. Review of Maritime Transport 2022; United Nations Conference on Trade and Development: Geneva, Switzerland, 2022. [Google Scholar]
- Dui, H.; Zheng, X.; Wu, S. Resilience analysis of maritime transportation systems based on importance measures. Reliab. Eng. Syst. Saf. 2021, 209, 107461. [Google Scholar] [CrossRef]
- Liu, Q.; Yang, Y.; Ng, A.K.; Jiang, C. An analysis on the resilience of the European port network. Transp. Res. Part A Policy Pract. 2023, 175, 103778. [Google Scholar] [CrossRef]
- He, Y.; Yang, Y.; Wang, M.; Zhang, X. Resilience Analysis of Container Port Shipping Network Structure: The Case of China. Sustainability 2022, 14, 9489. [Google Scholar] [CrossRef]
- Kim, S.; Choi, S.; Kim, C. The framework for measuring port resilience in Korean port case. Sustainability 2021, 13, 11883. [Google Scholar] [CrossRef]
- Liu, J.; Qi, Y.; Lyu, W. Port resilience in the post-COVID-19 era. Ocean Coast. Manag. 2023, 238, 106565. [Google Scholar] [CrossRef]
- Al-Mutairi, A.; AlKheder, S.; Alzwayid, S.; Talib, D.; Heji, M.B.; Lambert, J.H. Scenario-based preferences modeling to investigate port initiatives resilience. Technol. Forecast. Soc. Change 2022, 176, 121498. [Google Scholar] [CrossRef]
- Justice, V.; Bhaskar, P.; Pateman, H.; Cain, P.; Cahoon, S. US container port resilience in a complex and dynamic world. Marit. Policy Manag. 2016, 43, 179–191. [Google Scholar] [CrossRef]
- Gu, B.; Liu, J. Port resilience analysis based on the HHM-FCM approach under COVID-19. Ocean. Coast. Manag. 2023, 243, 106741. [Google Scholar] [CrossRef]
- Ayaz, İ.S.; Bucak, U.; Mollaoğlu, M.; Esmer, S. Resilience Strategies of Ports against COVID-19 in Terms of Chaos Theory. Mar. Policy 2022, 146, 105323. [Google Scholar] [CrossRef]
- Almutairi, A.; Collier, Z.A.; Hendrickson, D.; Palma-Oliveira, J.M.; Polmateer, T.L.; Lambert, J.H. Stakeholder mapping and disruption scenarios with application to resilience of a container port. Reliab. Eng. Syst. Saf. 2019, 182, 219–232. [Google Scholar] [CrossRef]
- Kim, C.H.; Choi, S.G.; Kim, S.K. Perceptions of the Relationship between Port Security Level, Resilience, Cargo Operational Performance, and Sustainability Performance among Korean Port Operators and Shipping Companies. J. Korea Trade 2023, 27, 65–86. [Google Scholar] [CrossRef]
- Xu, L.; Yang, Z.; Chen, J.; Zou, Z. Spatial-temporal heterogeneity of global ports resilience under Pandemic: A case study of COVID-19. Marit. Policy Manag. 2023, 51, 1655–1668. [Google Scholar] [CrossRef]
- Lin, W.; Liu, W. Resilience Evaluation of Ports along the Maritime Silk Road from the Perspective of Investment and Construction. J. Adv. Transp. 2023, 2023, 8818667. [Google Scholar] [CrossRef]
- Wang, N.; Wu, M.; Yuen, K.F. Assessment of port resilience using Bayesian network: A study of strategies to enhance readiness and response capacities. Reliab. Eng. Syst. Saf. 2023, 237, 109394. [Google Scholar] [CrossRef]
- Hossain, N.U.I.; Nur, F.; Hosseini, S.; Jaradat, R.; Marufuzzaman, M.; Puryear, S.M. A Bayesian network based approach for modeling and assessing resilience: A case study of a full service deep water port. Reliab. Eng. Syst. Saf. 2019, 189, 378–396. [Google Scholar] [CrossRef]
- Liu, X.; Chen, Z. An integrated risk and resilience assessment of sea ice disasters on port operation. Risk Anal. 2021, 41, 1579–1599. [Google Scholar] [CrossRef]
- Xu, B.; Liu, W.; Li, J. Resilience Regulation Strategy for Container Port Supply Chain under Disruptive Events. J. Mar. Sci. Eng. 2023, 11, 732. [Google Scholar] [CrossRef]
- Chen, H.; Cullinane, K.; Liu, N. Developing a model for measuring the resilience of a port-hinterland container transportation network. Transp. Res. Part E Logist. Transp. Rev. 2017, 97, 282–301. [Google Scholar] [CrossRef]
- Qin, Y.; Guo, J.; Liang, M.; Feng, T. Resilience characteristics of port nodes from the perspective of shipping network: Empirical evidence from China. Ocean Coast. Manag. 2023, 237, 106531. [Google Scholar] [CrossRef]
- Gao, S.; Liu, N. Improving the Resilience of Port–Hinterland Container Logistics Transportation Systems: A Bi-Level Programming Approach. Sustainability 2021, 14, 180. [Google Scholar] [CrossRef]
- Chen, H.; Lam, J.S.L.; Liu, N. Strategic investment in enhancing port–hinterland container transportation network resilience: A network game theory approach. Transp. Res. Part B Methodol. 2018, 111, 83–112. [Google Scholar] [CrossRef]
- Li, W.; Asadabadi, A.; Miller-Hooks, E. Enhancing resilience through port coalitions in maritime freight networks. Transp. Res. Part A Policy Pract. 2022, 157, 1–23. [Google Scholar] [CrossRef]
- Verschuur, J.; Pant, R.; Koks, E.; Hall, J. A systemic risk framework to improve the resilience of port and supply-chain networks to natural hazards. Marit. Econ. Logist. 2022, 24, 489–506. [Google Scholar] [CrossRef]
- Ministry of Transport of the People’s Republic of China. Port Production Safety Accident Statistics Report System [Data Report]. 2016. Available online: http://www.mot.gov.cn/ (accessed on 27 October 2023).
- Standing Committee of the National People’s Congress of China. Maritime Traffic Safety Law of the People’s Republic of China; Standing Committee of the National People’s Congress of China: Beijing, China, 2016. [Google Scholar]
- Zakeri, S. Ranking based on optimal points multi-criteria decision-making method. Grey Syst. Theory Appl. 2019, 9, 45–69. [Google Scholar] [CrossRef]
- Chen, S.J.; Hwang, C.L.; Hwang, F.P. Fuzzy multiple attribute decision making (methods and applications). In Fuzzy Multiple Attribute Decision Making; Lecture Notes in Economics and Mathematical Systems; Springer: Berlin/Heidelberg, Germany, 1992; pp. 1–2. [Google Scholar]
- Opricovic, S. Multicriteria Optimization of Civil Engineering Systems; Faculty of Civil Engineering: Belgrade, Serbia, 1998; Volume 2, pp. 5–21. [Google Scholar]
- Brauers, W.K.M.; Zavadskas, E.K. Project management by MULTIMOORA as an instrument for transition economies. Technol. Econ. Dev. Econ. 2010, 16, 5–24. [Google Scholar] [CrossRef]
- Zavadskas, E.K.; Turskis, Z.; Antucheviciene, J.; Zakarevicius, A. Optimization of weighted aggregated sum product assessment. Elektron. Ir Elektrotechnika 2012, 122, 3–6. [Google Scholar] [CrossRef]
- Karuppiah, K.; Sankaranarayanan, B.; Gupta, N.; Pandey, S. An integrated Fermatean Fuzzy Set approach for examining the challenges to maritime supply chain resilience of Indian ports. Sustain. Futures 2025, 10, 101442. [Google Scholar] [CrossRef]
- Tseng, P.H.; Liou, J.J.H. A Hybrid Model to Assess Commercial Port Resilience in Taiwan. J. Mar. Sci. Technol.-Taiwan 2025, 33, 3. [Google Scholar] [CrossRef]



| No. | First-Level Indicator | Second-Level Indicator | Third-Level Indicator | Calculation Method | Indicator Type |
|---|---|---|---|---|---|
| 1 | Micro-level (F1) | Terminal (S1) | Ship tonnage (T1) | See Appendix A.1 | quantitative |
| 2 | Dangerous goods vessel control level (T2) | See Appendix A.2 | qualitative | ||
| 3 | Proportion of dangerous goods handled at terminal (T3) | See Appendix A.3 | quantitative | ||
| 4 | Rate of change in cargo throughput due to terminal equipment failure (T4) | See Appendix A.4 | quantitative | ||
| 5 | Rate of change in cargo throughput due to damage to terminal facilities (T5) | See Appendix A.5 | quantitative | ||
| 6 | Mean time to repair equipment failure in terminal (T6) | See Appendix A.6 | quantitative | ||
| 7 | Mean time to repair facility damage in terminal (T7) | See Appendix A.7 | quantitative | ||
| 8 | Number of particularly major accidents in production safety at terminal (T8) | See Appendix A.8 | quantitative | ||
| 9 | Number of major accidents in production safety at terminal (T9) | See Appendix A.9 | quantitative | ||
| 10 | Number of large accidents in production safety at terminal (T10) | See Appendix A.10 | quantitative | ||
| 11 | Number of general accidents in production safety at terminal (T11) | See Appendix A.11 | quantitative | ||
| 12 | Recovery time of particularly major accidents in production safety at terminal (T12) | See Appendix A.12 | quantitative | ||
| 13 | Recovery time of major accidents in production safety at terminal (T13) | See Appendix A.13 | quantitative | ||
| 14 | Recovery time of large accidents in production safety at terminal (T14) | See Appendix A.14 | quantitative | ||
| 15 | Recovery time of general accidents in production safety at terminal (T15) | See Appendix A.15 | quantitative | ||
| 16 | Average berth utilization rate of terminal (T16) | See Appendix A.16 | quantitative | ||
| 17 | Meso-level (F2) | Waterway (S2) | Number of particularly major water traffic accidents (T17) | See Appendix A.17 | quantitative |
| 18 | Number of major water traffic accidents (T18) | See Appendix A.18 | quantitative | ||
| 19 | Number of large water traffic accidents (T19) | See Appendix A.19 | quantitative | ||
| 20 | Number of general water traffic accidents (T20) | See Appendix A.20 | quantitative | ||
| 21 | Recovery time of particularly major water traffic accidents (T21) | See Appendix A.21 | quantitative | ||
| 22 | Recovery time of major water traffic accidents (T22) | See Appendix A.22 | quantitative | ||
| 23 | Recovery time of large water traffic accidents (T23) | See Appendix A.23 | quantitative | ||
| 24 | Recovery time of general water traffic accidents (T24) | See Appendix A.24 | quantitative | ||
| 25 | Collecting and distributing system (S3) | Construction of collection and distribution system (T25) | See Appendix A.25 | qualitative | |
| 26 | Port supporting facilities (S4) | Port monitoring coverage (T26) | See Appendix A.26 | quantitative | |
| 27 | Intelligent monitoring and management rate of port pipe network pipeline (T27) | See Appendix A.27 | quantitative | ||
| 28 | Construction of port fire safety facilities (T28) | See Appendix A.28 | qualitative | ||
| 29 | Construction of port emergency communication command facilities (T29) | See Appendix A.29 | qualitative | ||
| 30 | Construction of port meteorological disaster monitoring system (T30) | See Appendix A.30 | qualitative | ||
| 31 | Management system (S5) | Emergency plan system (T31) | See Appendix A.31 | qualitative | |
| 32 | Emergency drill carried out (T32) | See Appendix A.32 | qualitative | ||
| 33 | Port integrated risk assessment (T33) | See Appendix A.33 | qualitative | ||
| 34 | Marco-level (F3) | Port transportation system (S6) | The number of alternative berths for largest berths (T34) | See Appendix A.34 | quantitative |
| 35 | The number of alternative berths for representative berths (T35) | See Appendix A.35 | quantitative | ||
| 36 | The number of alternative transport channels (T36) | See Appendix A.36 | quantitative |
| No. | Institute | Education | Experience (Year) |
|---|---|---|---|
| 1 | Dalian University of Technology | Ph.D. | Professor (28) |
| 2 | Dalian Maritime University | Ph.D. | Professor (30) |
| 3 | Wuhan University of Technology | Ph.D. | Professor (20) |
| 4 | Shanghai Maritime University | Ph.D. | Professor (7) |
| 5 | Ningbo China Communications Water Transportation Design and Research Co., LTD | Master’s | Manager (10) |
| 6 | Zhoushan Pilot Station | Master’s | Director (19) |
| 7 | Ningbo Maritime Safety Administration | Master’s | Director (13) |
| 8 | Ningbo Port and Shipping Management Center | Master’s | Manager (16) |
| 9 | Transport Planning and Research Institute Ministry of Transport | Master’s | Manager (15) |
| 10 | Shandong Port Group Co., LTD | Master’s | Manager (10) |
| xij | − | − | − | − | − | − | + | + | + |
|---|---|---|---|---|---|---|---|---|---|
| T4 | T6 | T16 | T20 | T23 | T24 | T25 | T34 | T35 | |
| Dalian Port | 4.76% | 23.07 | 46% | 12 | 70 | 38 | F | 1 | 8 |
| Guangzhou Port | 1.42% | 22.33 | 57% | 12 | 89 | 21 | VG | 25 | 59 |
| Ningbo Zhoushan Port | 1.60% | 24.71 | 72% | 19 | 195 | 68 | G | 1 | 32 |
| Qingdao Port | 2.62% | 23.62 | 65% | 14 | 140 | 60 | F | 13 | 13 |
| Xiamen Port | 2.36% | 23.06 | 50% | 7 | 144 | 62 | MP | 10 | 10 |
| Shanghai Port | 1.08% | 23.53 | 81% | 14 | 80 | 68 | G | 25 | 42 |
| Shenzhen Port | 1.31% | 24.04 | 78% | 18 | 130 | 74 | VG | 1 | 59 |
| Tianjin Port | 1.98% | 24.11 | 53% | 13 | 144 | 4 | MG | 2 | 22 |
| Linguistic Variable | Numerical Variable |
|---|---|
| Very Poor (VP) | 1 |
| Poor (P) | 2 |
| Medium Poor (MP) | 3 |
| Fair (F) | 4 |
| Medium Good (MG) | 5 |
| Good (G) | 6 |
| Very Good (VG) | 7 |
| − | − | − | − | − | − | + | + | + | |
|---|---|---|---|---|---|---|---|---|---|
| T4 | T6 | T16 | T20 | T23 | T24 | T25 | T34 | T35 | |
| Dalian Port | 0.0476 | 23.07 | 0.46 | 12.00 | 70.00 | 38.00 | 4.00 | 1.00 | 8.00 |
| Guangzhou Port | 0.0142 | 22.33 | 0.57 | 12.00 | 89.00 | 21.00 | 7.00 | 25.00 | 59.00 |
| Ningbo Zhoushan Port | 0.0160 | 24.71 | 0.72 | 19.00 | 195.00 | 68.00 | 6.00 | 1.00 | 32.00 |
| Qingdao Port | 0.0262 | 23.62 | 0.65 | 14.00 | 140.00 | 60.00 | 4.00 | 13.00 | 13.00 |
| Xiamen Port | 0.0236 | 23.06 | 0.50 | 7.00 | 144.00 | 62.00 | 3.00 | 10.00 | 10.00 |
| Shanghai Port | 0.0108 | 23.53 | 0.81 | 14.00 | 80.00 | 68.00 | 6.00 | 25.00 | 42.00 |
| Shenzhen Port | 0.0131 | 24.04 | 0.78 | 18.00 | 130.00 | 74.00 | 7.00 | 1.00 | 59.00 |
| Tianjin Port | 0.0198 | 24.11 | 0.53 | 13.00 | 144.00 | 4.00 | 5.00 | 2.00 | 22.00 |
| − | − | − | − | − | − | + | + | + | |
|---|---|---|---|---|---|---|---|---|---|
| T4 | T6 | T16 | T20 | T23 | T24 | T25 | T34 | T35 | |
| Dalian Port | 0.0300 | 22.00 | 0.40 | 8.00 | 50.00 | 30.00 | 5.00 | 2.00 | 10.00 |
| Guangzhou Port | 0.0100 | 21.00 | 0.50 | 8.00 | 65.00 | 15.00 | 7.00 | 25.00 | 60.00 |
| Ningbo Zhoushan Port | 0.0100 | 23.00 | 0.65 | 12.00 | 120.00 | 50.00 | 7.00 | 2.00 | 35.00 |
| Qingdao Port | 0.0200 | 23.00 | 0.60 | 10.00 | 100.00 | 45.00 | 5.00 | 15.00 | 15.00 |
| Xiamen Port | 0.0200 | 22.00 | 0.45 | 5.00 | 100.00 | 45.00 | 4.00 | 13.00 | 13.00 |
| Shanghai Port | 0.0100 | 23.00 | 0.70 | 10.00 | 60.00 | 50.00 | 7.00 | 25.00 | 45.00 |
| Shenzhen Port | 0.0100 | 23.00 | 0.70 | 12.00 | 90.00 | 55.00 | 7.00 | 2.00 | 60.00 |
| Tianjin Port | 0.0100 | 23.00 | 0.45 | 10.00 | 100.00 | 3.00 | 6.00 | 3.00 | 25.00 |
| − | − | − | − | − | − | + | + | + | |
|---|---|---|---|---|---|---|---|---|---|
| T4 | T6 | T16 | T20 | T23 | T24 | T25 | T34 | T35 | |
| Dalian Port | 0.2269 | 0.9679 | 1.0000 | 0.5833 | 1.0000 | 0.1053 | 0.5714 | 0.0400 | 0.1356 |
| Guangzhou Port | 0.7606 | 1.0000 | 0.8070 | 0.5833 | 0.7865 | 0.1905 | 1.0000 | 1.0000 | 1.0000 |
| Ningbo Zhoushan Port | 0.6750 | 0.9037 | 0.6389 | 0.3684 | 0.3590 | 0.0588 | 0.8571 | 0.0400 | 0.5424 |
| Qingdao Port | 0.4122 | 0.9454 | 0.7077 | 0.5000 | 0.5000 | 0.0667 | 0.5714 | 0.5200 | 0.2203 |
| Xiamen Port | 0.4576 | 0.9683 | 0.9200 | 1.0000 | 0.4861 | 0.0645 | 0.4268 | 0.4000 | 0.1695 |
| Shanghai Port | 1.0000 | 0.9490 | 0.5679 | 0.5000 | 0.8750 | 0.0588 | 0.8571 | 1.0000 | 0.7119 |
| Shenzhen Port | 0.8244 | 0.9289 | 0.5897 | 0.3889 | 0.5385 | 0.0541 | 1.0000 | 0.0400 | 1.0000 |
| Tianjin Port | 0.5455 | 0.9262 | 0.8679 | 0.5385 | 0.4861 | 1.0000 | 0.7143 | 0.0800 | 0.3729 |
| − | − | − | − | − | − | + | + | + | |
|---|---|---|---|---|---|---|---|---|---|
| T4 | T6 | T16 | T20 | T23 | T24 | T25 | T34 | T35 | |
| Dalian Port | 0.3333 | 0.9545 | 1.0000 | 0.6250 | 1.0000 | 0.1000 | 0.7143 | 0.0800 | 0.1667 |
| Guangzhou Port | 1.0000 | 1.0000 | 0.8000 | 0.6250 | 0.7692 | 0.2000 | 1.0000 | 1.0000 | 1.0000 |
| Ningbo Zhoushan Port | 1.0000 | 0.9130 | 0.6154 | 0.4167 | 0.4167 | 0.0600 | 1.0000 | 0.0800 | 0.5833 |
| Qingdao Port | 0.5000 | 0.9130 | 0.6667 | 0.5000 | 0.5000 | 0.0667 | 0.7143 | 0.6000 | 0.2500 |
| Xiamen Port | 0.5000 | 0.9545 | 0.8889 | 1.0000 | 0.5000 | 0.0667 | 0.5714 | 0.5200 | 0.2167 |
| Shanghai Port | 1.0000 | 0.9130 | 0.5714 | 0.5000 | 0.8333 | 0.0600 | 1.0000 | 1.0000 | 0.7500 |
| Shenzhen Port | 1.0000 | 0.9130 | 0.5714 | 0.4167 | 0.5556 | 0.0545 | 1.0000 | 0.0800 | 1.0000 |
| Tianjin Port | 1.0000 | 0.9130 | 0.8889 | 0.5000 | 0.5000 | 1.0000 | 0.8571 | 0.1200 | 0.4167 |
| − | − | − | − | − | − | + | + | + | |
|---|---|---|---|---|---|---|---|---|---|
| T4 | T6 | T16 | T20 | T23 | T24 | T25 | T34 | T35 | |
| Dalian Port | 0.0324 | 0.1383 | 0.1429 | 0.0833 | 0.0714 | 0.0075 | 0.0816 | 0.0029 | 0.0097 |
| Guangzhou Port | 0.1087 | 0.1429 | 0.1153 | 0.0833 | 0.0562 | 0.0136 | 0.1429 | 0.0714 | 0.0714 |
| Ningbo Zhoushan Port | 0.0964 | 0.1291 | 0.0913 | 0.0526 | 0.0256 | 0.0042 | 0.1224 | 0.0029 | 0.0387 |
| Qingdao Port | 0.0589 | 0.1351 | 0.1011 | 0.0714 | 0.0357 | 0.0048 | 0.0816 | 0.0371 | 0.0157 |
| Xiamen Port | 0.0654 | 0.1383 | 0.1314 | 0.1429 | 0.0347 | 0.0046 | 0.0612 | 0.0286 | 0.0121 |
| Shanghai Port | 0.1429 | 0.1356 | 0.0811 | 0.0714 | 0.0625 | 0.0042 | 0.1224 | 0.0714 | 0.0508 |
| Shenzhen Port | 0.1178 | 0.1327 | 0.0842 | 0.0556 | 0.0385 | 0.0039 | 0.1429 | 0.0029 | 0.0714 |
| Tianjin Port | 0.0779 | 0.1323 | 0.1240 | 0.0769 | 0.0347 | 0.0714 | 0.1020 | 0.0057 | 0.0266 |
| − | − | − | − | − | − | + | + | + | |
|---|---|---|---|---|---|---|---|---|---|
| T4 | T6 | T16 | T20 | T23 | T24 | T25 | T34 | T35 | |
| Dalian Port | 0.0476 | 0.1364 | 0.1429 | 0.0893 | 0.0714 | 0.0071 | 0.1020 | 0.0057 | 0.0119 |
| Guangzhou Port | 0.1429 | 0.1429 | 0.1143 | 0.0893 | 0.0549 | 0.0143 | 0.1429 | 0.0714 | 0.0714 |
| Ningbo Zhoushan Port | 0.1429 | 0.1304 | 0.0879 | 0.0595 | 0.0298 | 0.0043 | 0.1429 | 0.0057 | 0.0417 |
| Qingdao Port | 0.0714 | 0.1304 | 0.0952 | 0.0714 | 0.0357 | 0.0048 | 0.1020 | 0.0429 | 0.0179 |
| Xiamen Port | 0.0714 | 0.1364 | 0.1270 | 0.1429 | 0.0357 | 0.0048 | 0.0816 | 0.0371 | 0.0155 |
| Shanghai Port | 0.1429 | 0.1304 | 0.0816 | 0.0714 | 0.0595 | 0.0043 | 0.1429 | 0.0714 | 0.0536 |
| Shenzhen Port | 0.1429 | 0.1304 | 0.0816 | 0.0595 | 0.0397 | 0.0039 | 0.1429 | 0.0057 | 0.0714 |
| Tianjin Port | 0.1429 | 0.1304 | 0.1270 | 0.0714 | 0.0357 | 0.0714 | 0.1224 | 0.0086 | 0.0298 |
| − | − | − | − | − | − | + | + | + | |
|---|---|---|---|---|---|---|---|---|---|
| T4 | T6 | T16 | T20 | T23 | T24 | T25 | T34 | T35 | |
| Dalian Port | 0.0576 | 0.1942 | 0.2020 | 0.1221 | 0.1010 | 0.0104 | 0.1307 | 0.0064 | 0.0153 |
| Guangzhou Port | 0.1795 | 0.2020 | 0.1623 | 0.1221 | 0.0786 | 0.0197 | 0.2020 | 0.1010 | 0.1010 |
| Ningbo Zhoushan Port | 0.1724 | 0.1835 | 0.1267 | 0.0795 | 0.0393 | 0.0060 | 0.1882 | 0.0064 | 0.0569 |
| Qingdao Port | 0.0926 | 0.1878 | 0.1389 | 0.1010 | 0.0505 | 0.0067 | 0.1307 | 0.0567 | 0.0238 |
| Xiamen Port | 0.0968 | 0.1942 | 0.1828 | 0.2020 | 0.0498 | 0.0066 | 0.1020 | 0.0469 | 0.0196 |
| Shanghai Port | 0.2020 | 0.1881 | 0.1151 | 0.1010 | 0.0863 | 0.0060 | 0.1882 | 0.1010 | 0.0739 |
| Shenzhen Port | 0.1851 | 0.1861 | 0.1173 | 0.0814 | 0.0553 | 0.0055 | 0.2020 | 0.0064 | 0.1010 |
| Tianjin Port | 0.1627 | 0.1858 | 0.1775 | 0.1050 | 0.0498 | 0.1010 | 0.1594 | 0.0103 | 0.0399 |
| − | − | − | − | − | − | + | + | + | Rank | ||
|---|---|---|---|---|---|---|---|---|---|---|---|
| T4 | T6 | T16 | T20 | T23 | T24 | T25 | T34 | T35 | |||
| Dalian Port | 0.100 | 0.172 | 0.172 | 0.180 | 0.110 | 0.059 | 0.137 | 0.046 | 0.046 | 1.023 | 7 |
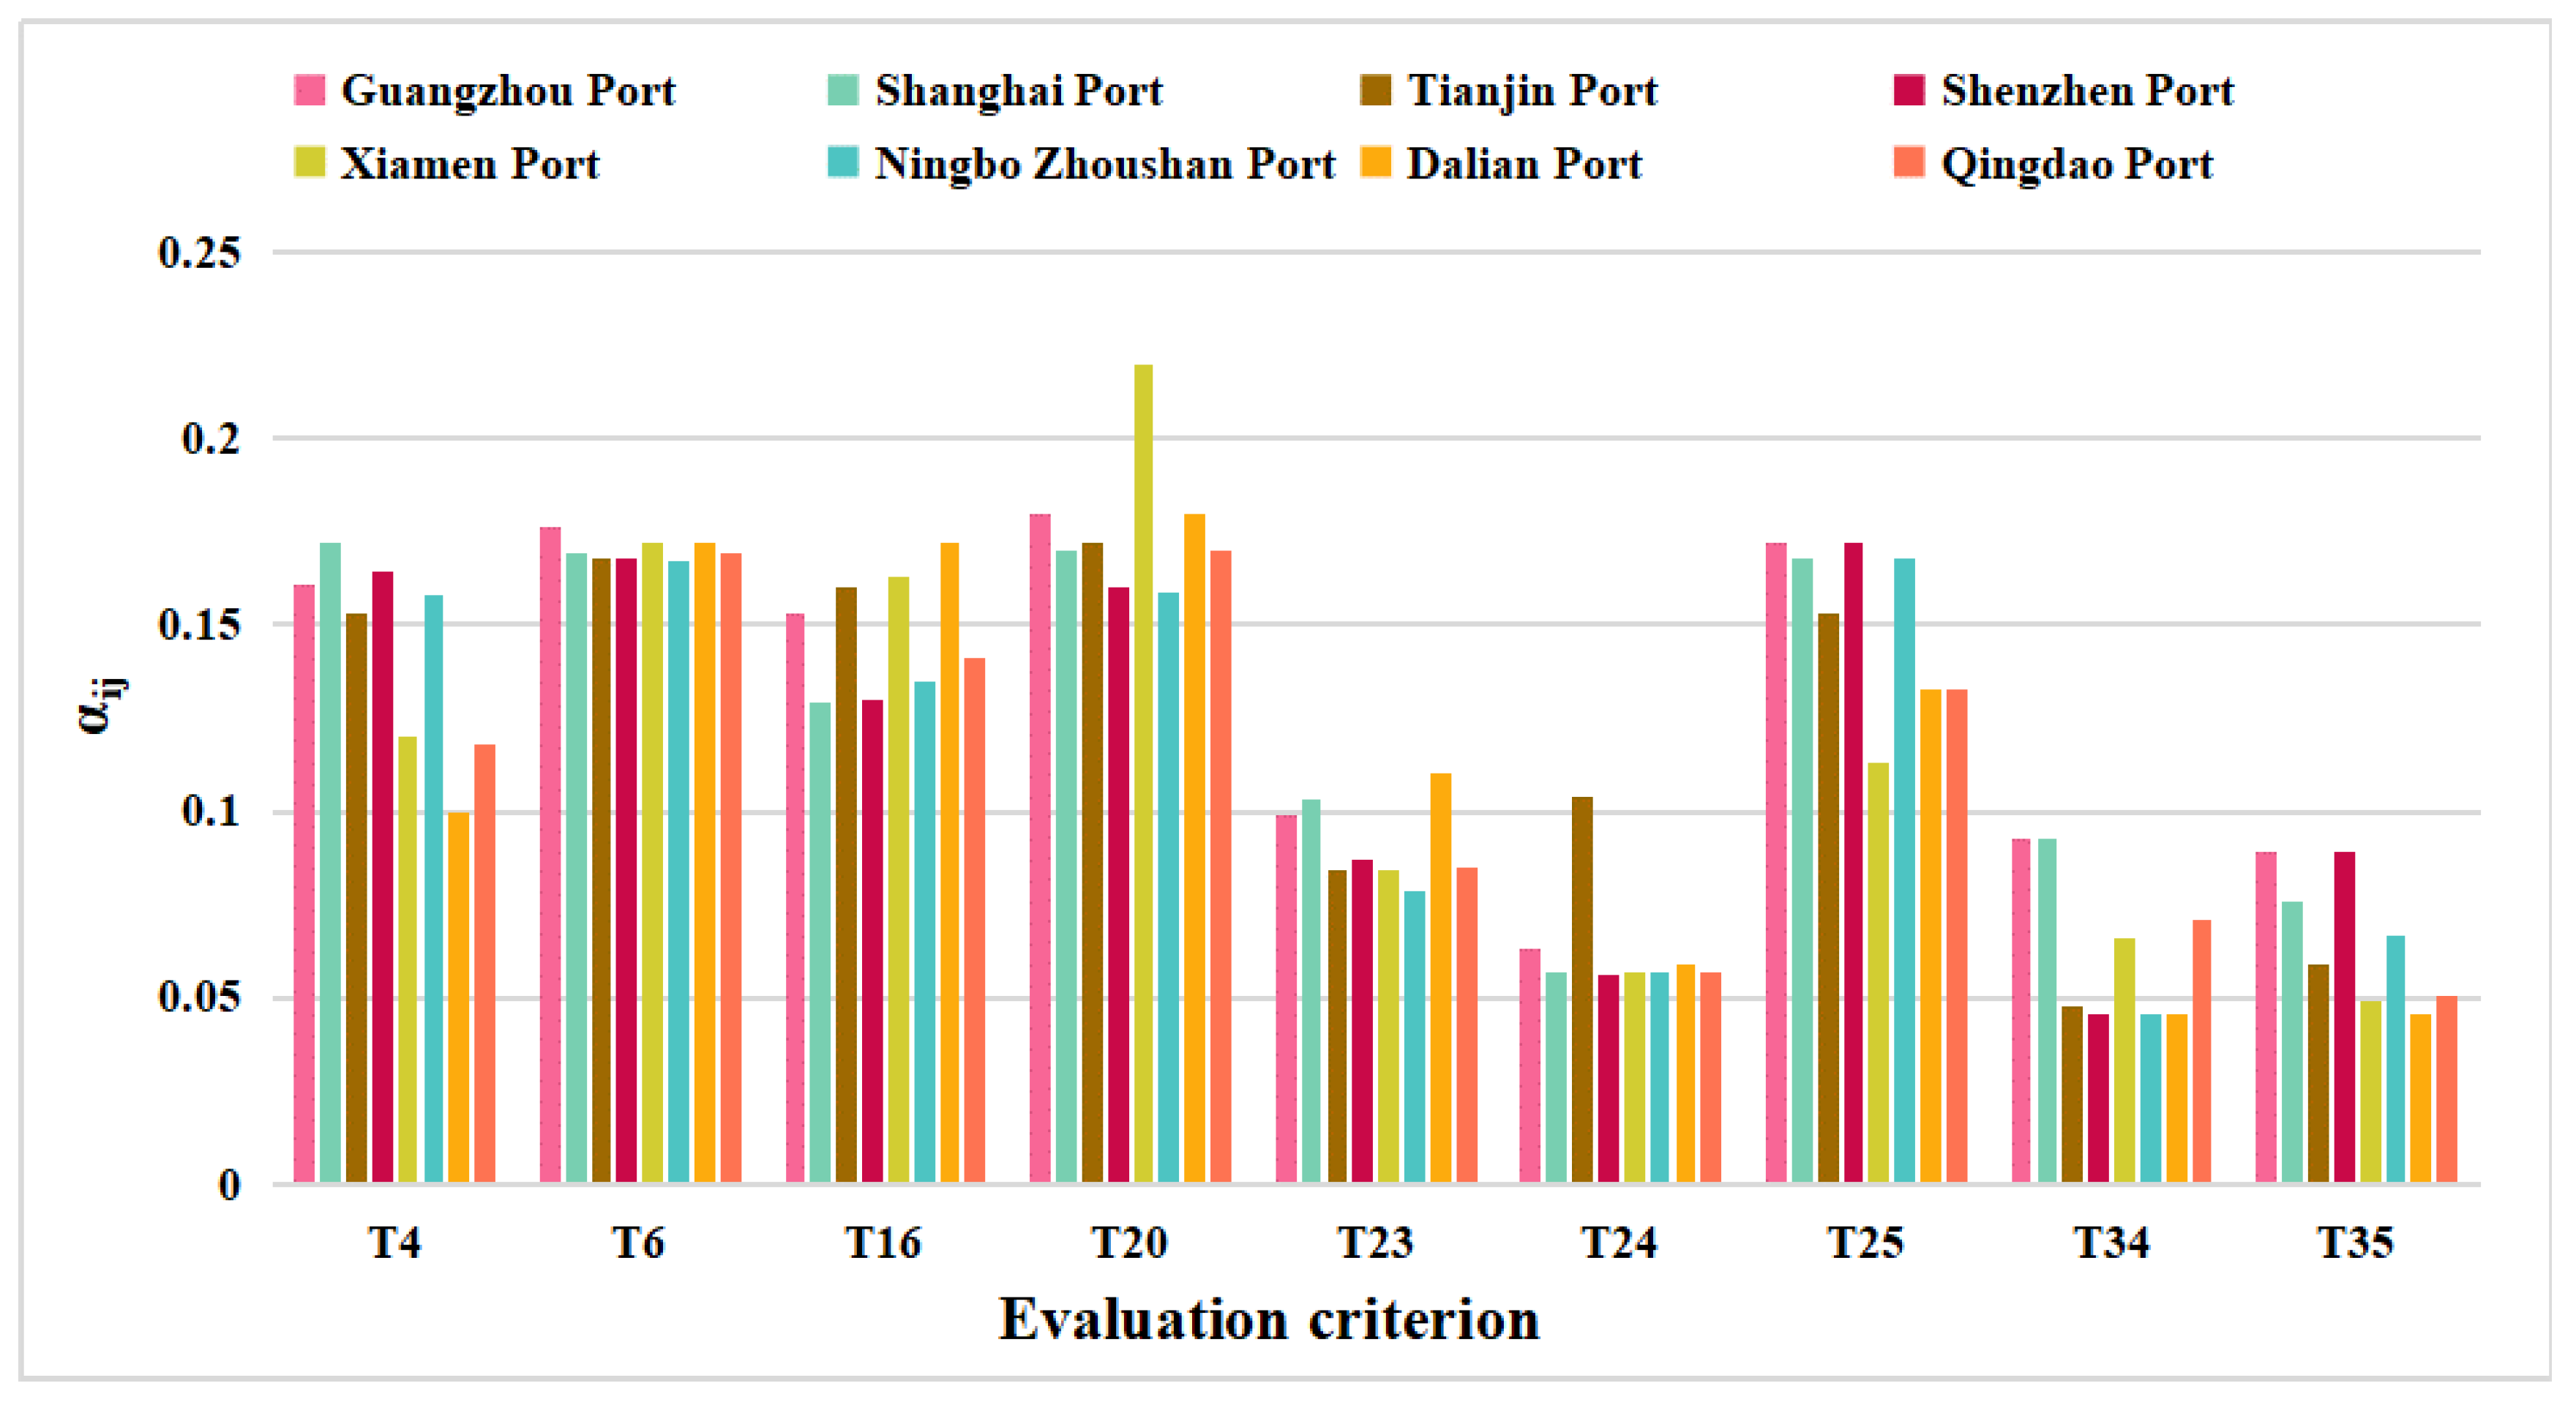
| Guangzhou Port | 0.161 | 0.176 | 0.153 | 0.180 | 0.099 | 0.063 | 0.172 | 0.093 | 0.089 | 1.187 | 1 |
| Ningbo Zhoushan Port | 0.158 | 0.167 | 0.135 | 0.159 | 0.079 | 0.057 | 0.166 | 0.046 | 0.067 | 1.032 | 6 |
| Qingdao Port | 0.118 | 0.169 | 0.141 | 0.170 | 0.085 | 0.057 | 0.137 | 0.071 | 0.051 | 0.997 | 8 |
| Xiamen Port | 0.120 | 0.172 | 0.163 | 0.220 | 0.084 | 0.057 | 0.122 | 0.066 | 0.049 | 1.053 | 5 |
| Shanghai Port | 0.172 | 0.169 | 0.129 | 0.170 | 0.103 | 0.057 | 0.166 | 0.093 | 0.076 | 1.134 | 2 |
| Shenzhen Port | 0.164 | 0.168 | 0.130 | 0.160 | 0.087 | 0.056 | 0.172 | 0.046 | 0.089 | 1.073 | 4 |
| Tianjin Port | 0.153 | 0.168 | 0.160 | 0.172 | 0.084 | 0.104 | 0.151 | 0.048 | 0.059 | 1.099 | 3 |
| Port | RBOP | TOPSIS | VIKOR | Multi-MOORA | WASPAS | |||||
|---|---|---|---|---|---|---|---|---|---|---|
| Rank | Rank | Rank | Rank | Rank | ||||||
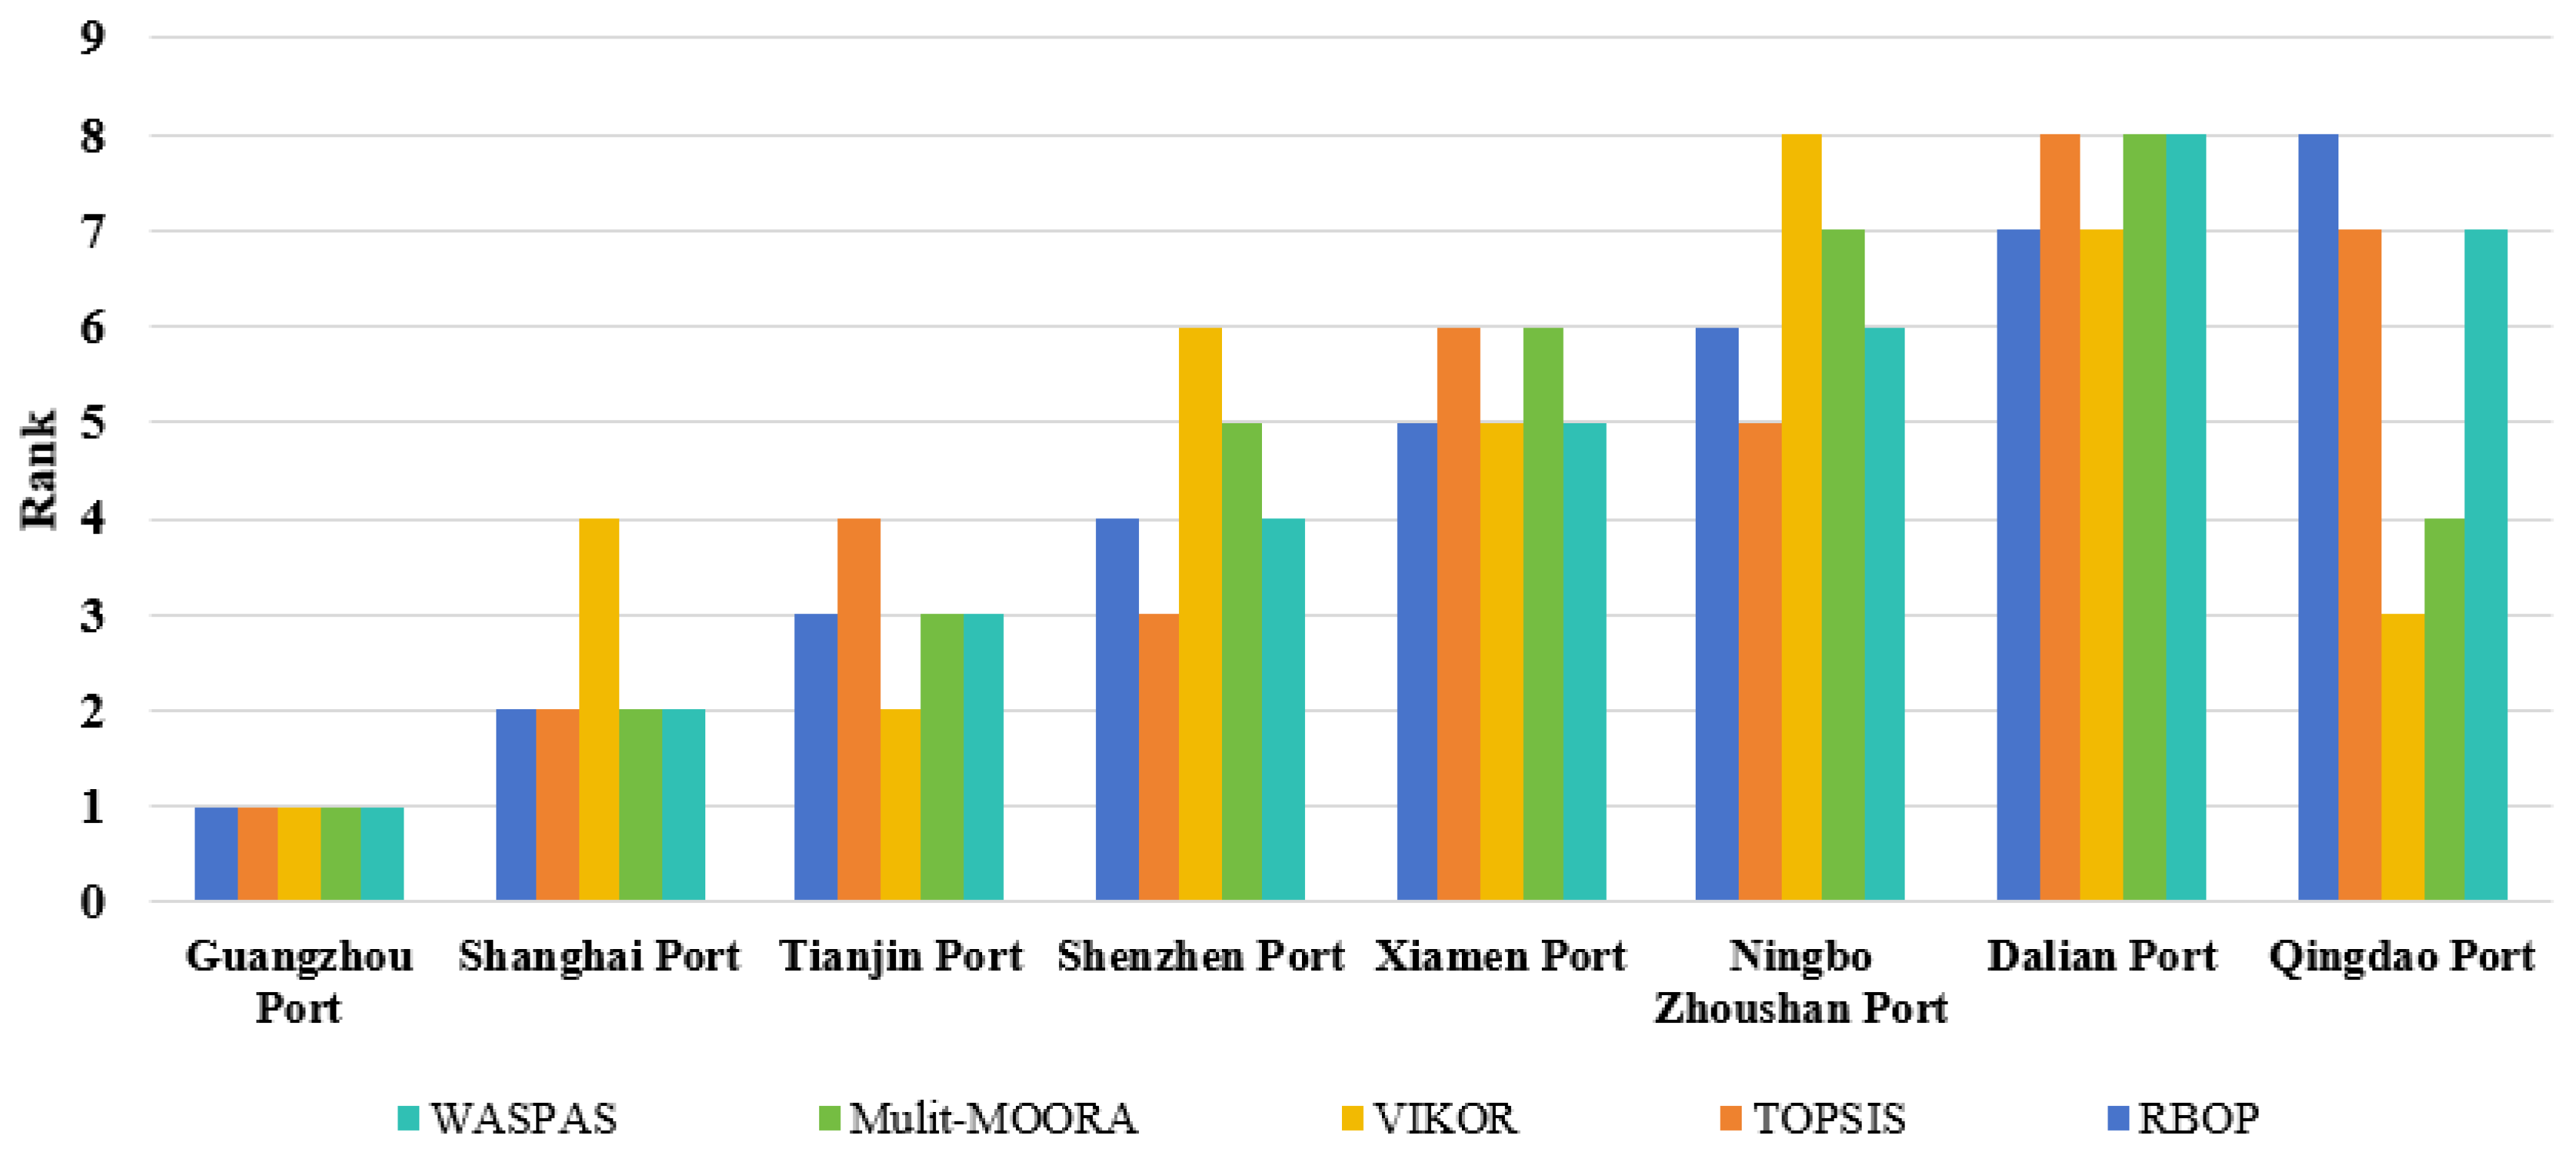
| Dalian Port | 1.023 | 7 | 0.323 | 8 | 0.857 | 7 | 24 | 8 | 0.478 | 8 |
| Guangzhou Port | 1.187 | 1 | 0.829 | 1 | 0 | 1 | 3 | 1 | 0.78 | 1 |
| Ningbo Zhoushan Port | 1.032 | 6 | 0.502 | 5 | 1 | 8 | 19 | 7 | 0.5 | 6 |
| Qingdao Port | 0.997 | 8 | 0.441 | 7 | 0.679 | 3 | 13 | 4 | 0.495 | 7 |
| Xiamen Port | 1.053 | 5 | 0.493 | 6 | 0.802 | 5 | 17 | 6 | 0.539 | 5 |
| Shanghai Port | 1.134 | 2 | 0.677 | 2 | 0.751 | 4 | 6 | 2 | 0.697 | 2 |
| Shenzhen Port | 1.073 | 4 | 0.562 | 3 | 0.808 | 6 | 16 | 5 | 0.566 | 4 |
| Tianjin Port | 1.099 | 3 | 0.559 | 4 | 0.584 | 2 | 10 | 3 | 0.611 | 3 |
| − | − | − | − | − | − | + | + | + | |
|---|---|---|---|---|---|---|---|---|---|
| T4 | T6 | T16 | T20 | T23 | T24 | T25 | T34 | T35 | |
| Dalian Port | 0.0100 | 21.00 | 25.00 | 60.00 | 0.40 | 5.00 | 50.00 | 3.00 | 7.00 |
| Guangzhou Port | 0.0100 | 21.00 | 25.00 | 60.00 | 0.40 | 5.00 | 50.00 | 3.00 | 7.00 |
| Ningbo Zhoushan Port | 0.0100 | 21.00 | 25.00 | 60.00 | 0.40 | 5.00 | 50.00 | 3.00 | 7.00 |
| Qingdao Port | 0.0100 | 21.00 | 25.00 | 60.00 | 0.40 | 5.00 | 50.00 | 3.00 | 7.00 |
| Xiamen Port | 0.0100 | 21.00 | 25.00 | 60.00 | 0.40 | 5.00 | 50.00 | 3.00 | 7.00 |
| Shanghai Port | 0.0100 | 21.00 | 25.00 | 60.00 | 0.40 | 5.00 | 50.00 | 3.00 | 7.00 |
| Shenzhen Port | 0.0100 | 21.00 | 25.00 | 60.00 | 0.40 | 5.00 | 50.00 | 3.00 | 7.00 |
| Tianjin Port | 0.0100 | 21.00 | 25.00 | 60.00 | 0.40 | 5.00 | 50.00 | 3.00 | 7.00 |
| Port | Improved RBOP Method | RBOP Without Experts’ Evaluation on Optimum Alternative | ||
|---|---|---|---|---|
| Rank | Rank | |||
| Dalian Port | 1.023 | 7 | 1.200 | 6 |
| Guangzhou Port | 1.187 | 1 | 1.252 | 1 |
| Ningbo Zhoushan Port | 1.032 | 6 | 1.190 | 7 |
| Qingdao Port | 0.997 | 8 | 1.181 | 8 |
| Xiamen Port | 1.053 | 5 | 1.207 | 5 |
| Shanghai Port | 1.134 | 2 | 1.236 | 2 |
| Shenzhen Port | 1.073 | 4 | 1.216 | 3 |
| Tianjin Port | 1.099 | 3 | 1.209 | 4 |
Disclaimer/Publisher’s Note: The statements, opinions and data contained in all publications are solely those of the individual author(s) and contributor(s) and not of MDPI and/or the editor(s). MDPI and/or the editor(s) disclaim responsibility for any injury to people or property resulting from any ideas, methods, instructions or products referred to in the content. |
© 2025 by the authors. Licensee MDPI, Basel, Switzerland. This article is an open access article distributed under the terms and conditions of the Creative Commons Attribution (CC BY) license (https://creativecommons.org/licenses/by/4.0/).
Share and Cite
Tian, Q.; Du, K.; Liang, Y. Assessing the Resilience of Specialized Terminals Within Coastal Port Transportation Systems: An Improved RBOP Method. J. Mar. Sci. Eng. 2025, 13, 2382. https://doi.org/10.3390/jmse13122382
Tian Q, Du K, Liang Y. Assessing the Resilience of Specialized Terminals Within Coastal Port Transportation Systems: An Improved RBOP Method. Journal of Marine Science and Engineering. 2025; 13(12):2382. https://doi.org/10.3390/jmse13122382
Chicago/Turabian StyleTian, Qi, Kun Du, and Yumei Liang. 2025. "Assessing the Resilience of Specialized Terminals Within Coastal Port Transportation Systems: An Improved RBOP Method" Journal of Marine Science and Engineering 13, no. 12: 2382. https://doi.org/10.3390/jmse13122382
APA StyleTian, Q., Du, K., & Liang, Y. (2025). Assessing the Resilience of Specialized Terminals Within Coastal Port Transportation Systems: An Improved RBOP Method. Journal of Marine Science and Engineering, 13(12), 2382. https://doi.org/10.3390/jmse13122382