Abstract
Starry flounder (Platichthys stellatus) is extensively farmed in Korea, and the importance of aquaculture technology in the economic and industrial sectors continues to grow. However, pigmentation anomalies, such as skin discoloration during farming, have resulted in significant economic losses. Despite continuous research to uncover the underlying causes, genomic research in this area remains insufficient. This study utilized RNA-seq with de novo assembly analysis to establish candidate genes in brain tissue related to pigmentation variation in P. stellatus. Genes associated with albinism and melanism were identified, with 1053 genes linked to albinism and 642 genes associated with melanism. Functional analysis of these genes was also conducted using gene ontology analysis, categorizing the genes according to biological processes, cellular components, and molecular functions. KEGG pathway analysis revealed significant associations with five pathways for albinism and two pathways for melanism in brain tissue. The large-scale gene expression profiles identified in this study provide valuable genomic resources for future studies of aquaculture species, including P. stellatus. While the findings provide valuable genomic insights, the study was limited to brain tissue analysis and requires further gene-level validation.
1. Introduction
Platichthys stellatus is a species of significant economic value that is currently undergoing active aquaculture development in Korea. Compared to other farmed fish, such as olive flounder (Paralichthys olivaceus), P. stellatus has been less extensively studied and is often found in natural habitats. However, its high commercial value has led to its recognition as an essential aquaculture species [1,2,3]. Unlike in natural environments, pigmentation anomalies such as darkening of the ventral skin occur during aquaculture, causing substantial economic losses [4,5]. Pigmentation anomalies such as pseudo-albinism and hypermelanosis in flatfish species, including Platichthys stellatus and Paralichthys olivaceus, can reduce market value by 30–50%, resulting in significant financial losses in hatchery and farm operations [6,7]. Although various studies have been conducted to identify the causes of these pigmentation anomalies, large-scale genetic studies identifying the underlying genes are lacking. Additionally, transcriptome-level studies exploring gene expression changes associated with pigmentation anomalies and their progression during P. stellatus growth are limited due to insufficient genomic information and the need for large-scale research [8,9]. Brain tissue, including the pituitary gland, was analyzed to investigate neuroendocrine regulation of pigmentation, as the hypothalamus–pituitary axis mediates melanophore activity and color adaptation under aquaculture stress [10,11]. Previous studies in Oncorhynchus mykiss and Oreochromis niloticus have demonstrated that neural signaling and hormonal control influence stress-induced pigmentation.
In recent years, next-generation sequencing (NGS) technology has emerged as a key tool in genomic research [12,13,14]. This technology offers significant advantages over traditional Sanger sequencing, including drastically reduced cost per base (less than 1/100) and the ability to rapidly sequence large volumes of data. NGS is widely used in biological research, medicine, and diagnostics [15,16]. Among the NGS technologies, RNA-seq has become a revolutionary tool for transcriptome analysis, replacing traditional microarray techniques. RNA-Seq identifies gene expression levels and differences without prior gene sequence information, making it highly suitable for transcriptome studies [17,18].
The objective of this study was to identify candidate genes associated with pigmentation variation in P. stellatus using RNA-seq and to explore molecular mechanisms underlying albinism and melanism in aquaculture conditions. Brain samples from normal, whitening and darkening individuals were collected and analyzed using RNA-seq. Differentially expressed genes (DEGs) specific to each condition were identified to establish candidate gene sets for further investigation. The results of this study are expected to provide valuable genomic resources for research on pigmentation variation and aquaculture development in P. stellatus.
2. Materials and Methods
2.1. Sample Collection
The P. stellatus samples were categorized into three groups: normal, whitening and darkening. Brain tissue was selected for transcriptome analysis. The samples, including the pituitary gland, were immediately frozen in liquid nitrogen after dissection to minimize RNA degradation. Each group included three males to standardize the comparisons (Figure 1). All animal experiments were conducted in accordance with the Guidelines for the Care and Use of Laboratory Animals of the National Institute of Fisheries Science (NIFS) and the Animal and Plant Quarantine Agency (APQA), Republic of Korea. The experimental protocol was reviewed and approved by the Institutional Animal Care and Use Committee (IACUC) of NIFS. To minimize animal suffering, fish were anesthetized with tricaine methanesulfonate (MS-222) prior to handling, and humane euthanasia procedures were applied at the end of the experiments. In addition, adult specimens reared for over 18 months and measuring more than 30 cm in total length were used. Nine adult P. stellatus individuals (three per group: normal, whitening, and darkening) were obtained from cultured stocks maintained at the National Institute of Fisheries Science (NIFS), Incheon, Republic of Korea.
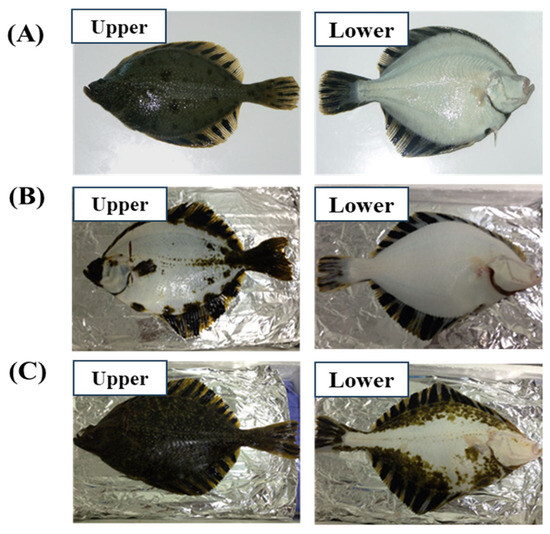
Figure 1.
Images of upper and lower tissues of Platichthys stellatus and tissue classification. Normal (A), whitening; shows white spots (more than 20%) on the upper skin, while the lower skin retains a normal color (B), darkening; shows dark spots (more than 20%) on the lower skin, while the upper skin retains a normal color (C).
2.2. RNA Extraction and Library Preparation
RNA was extracted from brain tissues using a Qiagen Tissuelyser (QIAGEN N.V., Venlo, The Netherlands) for tissue homogenization. The homogenized tissue was treated with TRIzol reagent, followed by the addition of chloroform and vortexing. After centrifugation, the aqueous phase was collected, and RNA was precipitated with isopropanol. The RNA pellet was washed with 75% ethanol, resuspended in RNase-free water, and analyzed using an Agilent 2100 Bioanalyzer (Agilent Technologies, Inc., Santa Clara, CA, USA).
RNA quality was evaluated using three metrics: BA (Bioanalyzer) concentration (ng/µL), RIN (RNA Integrity Number), and 28S/18S ratio. Only samples with RIN values ≥ 7 were used for RNA-seq experiments (Table 1). Libraries were prepared using the Illumina TruSeq RNA Sample Prep Kit (Illumina, Inc., San Diego, CA, USA), with paired-end reads of 100 bp. The mRNA was fragmented and reverse-transcribed into single-stranded cDNA, followed by the synthesis of double-stranded cDNA. The cDNA was end-repaired, A-tailed, adapter-ligated, and amplified using PCR. Libraries were quantified using the KAPA Library Quantification Kit (KAPA Biosystems, Basel, Switzerland) and sequenced on an Illumina HiSeq 2500 platform (Illumina, Inc., San Diego, CA, USA) (Supplementary Table S1).

Table 1.
List of commonly expressed genes with high expression levels in brain tissue sample.
2.3. NGS Data Analysis: Filtering, Assembly, and Clustering
Low-quality sequences were removed based on the following criteria: reads with more than 10% ambiguous bases (N), reads with over 20% of bases at Q20 quality or lower, and reads with an average quality score below Q20. The remaining sequences were trimmed to remove low-quality bases at both ends. De novo assembly was performed using Trinity [19,20], which involved three steps: inchworms, chrysalises, and butterflies. Inchworm group sequences into subgroups using overlapping k-mers. Chrysalis clusters contigs into de Bruijn graphs based on shared sequences, and Butterfly refines these graphs to predict transcripts. Clustering of assembled transcripts was conducted using the TIGR Gene Indices Clustering Tool (TGICL, Ver, 2.1) [21], which compares sequences to calculate similarities and clusters them at a threshold of 0.94 similarity. CAP3 [22] was used to reconstruct representative cluster sequences.
2.4. Analysis of Differentially Expressed Genes (DEGs)
DEG analysis was conducted using the TCC program and the DEGES/DESeq method. This method iteratively normalizes data to improve the accuracy of DEG identification. A p-value threshold of <0.001 was used to identify the significant DEGs.
2.5. Functional Analysis. Gene Ontology (GO), KEGG Pathway Analysis
Gene Ontology (GO) categorizes gene functions into biological processes (BP), cellular components (CC), and molecular functions (MF). GO annotation of tissue-specific genes was based on the highest homology in RefSeq sequences. GO frequency and trend analyses were performed using DAVID [23]. KEGG pathway analysis identified biological pathways associated with the differentially expressed genes. Fisher’s exact test [24] was used to calculate the probability of pathway enrichment. Pathways significantly associated with tissue-specific DEGs were identified using DAVID.
3. Results
3.1. RNA-Seq De Novo Assembly
The high-quality base ratio obtained through sequence filtering was the lowest in whitening brain samples at 86.3%, whereas darkening brain samples showed the highest quality at 89.1%. Libraries from the three samples (normal, whitening and darkening) were compared by principal component analysis based on the representative hit classification against the M5nr database (The non-redundant database developed at Argonne National Laboratory containing sequences and annotations from multiple sources. The database is based on the use of MD5 checksums of the sequences, separating sequence data from the annotation data from multiple publicly available databases.) in CLC genomics workbench (version 12.0.3, Qiagen, Inc., Hilden, Germany). As a result, normal pigmentation, whitening and darkening were found in distinct anatomical location (Figure 2).
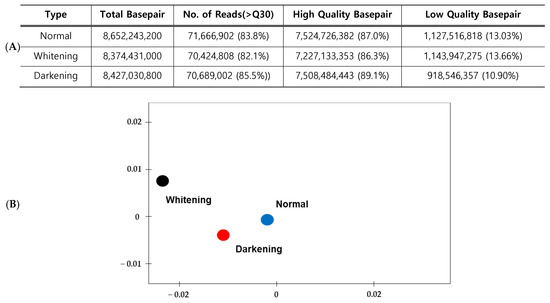
Figure 2.
Production volume and quality metrics of sequences generated from transcriptome analysis (A) and Principal component analysis of the three comparative sequences using an e value cut off 10−3 using the M5nr database in CLC genomics workbench (B).
A total of 43.8 Gbp of raw sequence data were generated across all samples. After filtering and de novo assembly, the total assembled transcript length was 517 Mbp following the Inchworm process, which was further reduced to 372 Mbp in the final assembly stage, corresponding to 1.18% and 0.85% of the raw data, respectively. The number of sequences decreased from 439,855,330 to 8,868,048 after inchworm processing, and ultimately to 259,254 (0.1%). The average sequence length was 1435.8 bp, with a maximum of 28,212 bp (Figure 3B). The length distribution of the assembled transcripts is shown in Figure 2A. Among the assembled transcripts, 84,084 (32.43%) were between 201 and 400 bp in length, whereas 36,132 (13.94%) were over 3000 bp long. To confirm the unigene sequences, redundancies in the assembled transcripts were eliminated using a clustering method. After clustering, the total number of sequences decreased from 259,254 to 198,835. This indicated that 77% of the transcripts assembled by Trinity were retained, whereas 23% were removed as redundant. On a nucleotide basis, 372.2 Mbp was reduced to 252.5 Mbp, indicating a 32% reduction (Figure 3B).
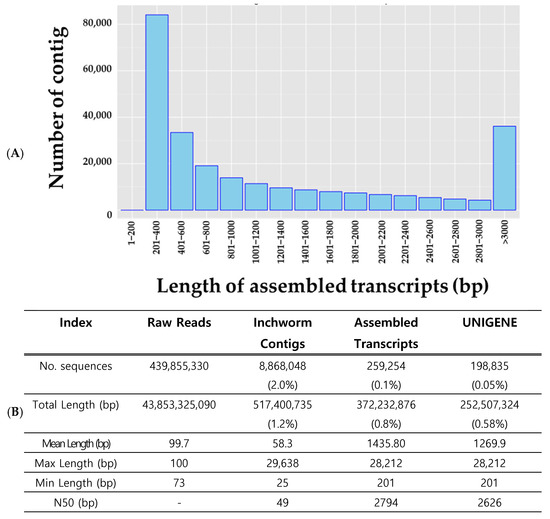
Figure 3.
Transcriptome sequence filtering and clustering results. Length distribution of contigs (A), and three-step filtering process (Inchworm, assembled transcripts, UNIGENE) (B).
3.2. DEGs Analysis
Of the 198,853 unigenes, the number of genes expressed in the normal brain tissue was 121,617, consisting of 59,239 novel genes and 62,379 known genes. Genes expressed with an FPKM value of ≥1 totaled 72,102, including 24,740 novel genes and 47,362 known genes. In the whitening brain tissue, 93,850 genes were expressed, with 44,329 novel genes and 49,521 known genes. Genes expressed with an FPKM value of ≥1 totaled 62,485, including 20,824 novel genes and 41,661 known genes. In the darkening brain tissue, 98,555 genes were expressed, consisting of 40,103 novel genes and 49,452 known genes. Genes expressed with an FPKM value of ≥1 totaled 62,156, including 25,187 novel genes and 36,969 known genes (Figure 4). The high-quality base ratio obtained through sequence filtering was the lowest in the whitening brain samples.
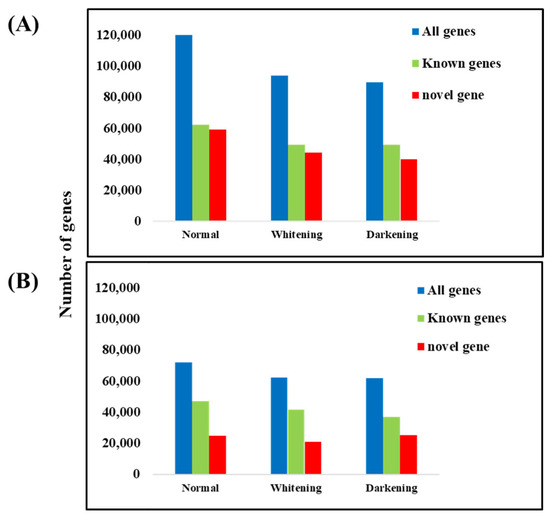
Figure 4.
Number of expressed genes across groups. Total number of expressed UNIGENE genes (A), and number of genes with FPKM ≥ 1 (B).
3.3. Commonly Expressed Genes in Brain Tissue
Among the highly expressed genes in the normal, whitening, and darkening brain tissues, 35 were expressed across all three groups (Table 1). Most of these genes encode ribosomal proteins, along with fatty acid-binding protein 7, brain (fabp7), ependymin 1, and s100 calcium-binding proteins, which are known to be expressed in brain tissue.
3.4. Differential Gene Expression Analysis
In total, 1053 DEGs were identified between normal and whitening brain tissues (Figure 5A). Of these, 517 genes were upregulated and 536 genes were downregulated in whitening tissues compared to normal tissues. Among these DEGs, 824 were expressed in only one sample group. The top 23 DEGs were selected for further analyses. The most significantly upregulated genes in the whitening brain tissue were GLTSCR2, ODZ1, and PPP1R11 (Figure 5B). Between normal and darkening brain tissues, 642 DEGs were identified, consisting of 335 upregulated and 307 downregulated genes. A total of 514 genes were expressed in only one tissue group. The top 24 statistically significant DEGs were selected (Figure 6A). The most highly expressed genes in darkening brain tissue included FRA10AC1, VPS13D, and PPP1R11 (Figure 6B).
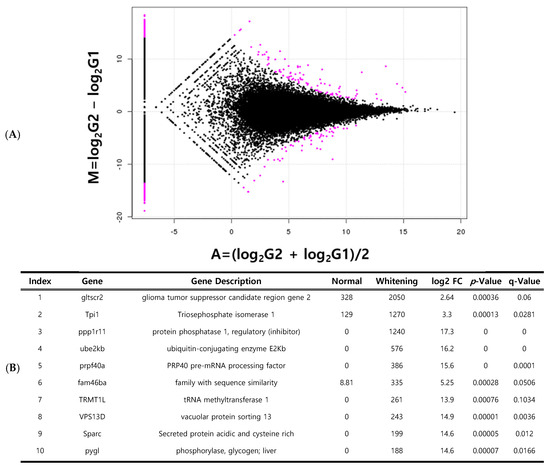
Figure 5.
Genes specifically expressed in whitening brain tissue compared to normal brain tissue. Volcano plot of differentially expressed genes (DEGs) (A); list of the top 10 expressed genes (B). red dots indicate specifically expressed genes.
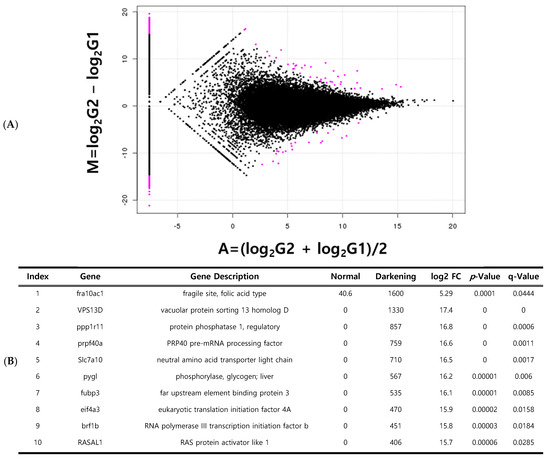
Figure 6.
Genes specifically expressed in darkening brain tissue compared to normal brain tissue. Volcano plot of differentially expressed genes (DEGs) (A); list of the top 10 expressed genes (B). red dots indicate specifically expressed genes.
3.5. Gene Ontology and KEGG Pathway Analysis
GO frequency analysis of the 1053 DEGs identified between normal and whitening brain tissues revealed changes in gene expression related to genetic functions. In the BP category, cellular processes were the most frequent, followed by biological regulation and response to stimuli (Figure 7A). The cell part had the highest frequency in the CC category, followed by the membrane and organelles (Figure 7A). In the MF category, binding was the most frequent, followed by catalytic activity (Figure 7A). Additional GO trend analysis using DAVID revealed 34 significant GO categories (p-value < 0.01), including mRNA metabolic processes, synapses, and RNA helicase activity (Supplementary Table S2).
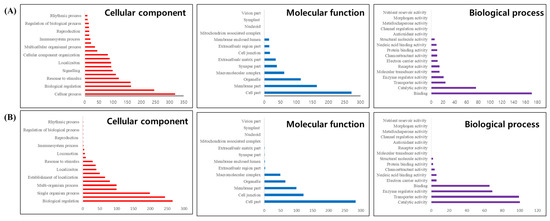
Figure 7.
Gene Ontology (GO) analysis of Platichthys stellatus transcriptomes. Correlations for Cellular Component, Molecular Function, and Biological Process in Whitening-Brain (A), and Darkening-Brain (B).
KEGG pathway analysis identified significantly enriched pathways using a threshold of p < 0.05. Pathways with a small number of associated genes (fewer than five) were interpreted cautiously due to the limited statistical power. Pathway analysis of genes expressed in normal and whitening brain tissues identified five significant pathways (p < 0.10): the ErbB, GnRH, Wnt, arrhythmogenic right ventricular cardiomyopathy, and spliceosome pathways. Each pathway involved 4–6 related genes (Table 2, Supplementary Figures S1–S5). Pathway analysis of genes expressed in normal and darkening brain tissues identified two significant pathways (p < 0.10): the spliceosome and N-glycan biosynthesis pathways. These involved 9 and 3 related genes, respectively (Table 2, Supplementary Figures S6 and S7).

Table 2.
KEGG pathway analysis showing trends in gene expression changes and lists of genes for normal vs. darkening and normal vs. whitening brain tissues.
4. Discussion
P. stellatus is a high-value aquaculture species in Korea, and pigmentation plays a significant role in market quality [2,9]. In this study, we conducted a transcriptome analysis to investigate the mechanisms underlying pigmentation variation. Although recent studies have explored tissue-specific expression patterns of mRNA and miRNAs in fish, genetic insights into albinism and melanism in P. stellatus remain limited [25,26]. High-quality RNA-seq technology enables extensive monitoring of genetic changes caused by environmental or external stress [27,28]. This study achieved high-quality sequencing through rapid runs, generating more than 8 Gbp of sequence data per brain tissue sample (Table 2). A total of 198,853 unigenes were constructed, serving as a foundational database for analyzing differences in expression in normal, whitening, and darkening brain tissues. Specifically, 121,617, 62,485, and 98,555 genes were identified in normal, whitening, and darkening samples, respectively (Figure 3). Normal pigmentation in P. stellatus is essential for survival in the natural environment. Albinism, a complex and permanent condition in flatfish, leads to irregular pigmentation, reduced ultraviolet (UV) protection, and increased vulnerability to environmental stress [29]. Additionally, albinism adversely affects immune function and increases susceptibility to disease [30]. Many studies have reported reduced survival in pigment-deficient fish compared to normal individuals [6,31]. Moreover, albinism in aquaculture has a negative impact on public perception of fishery management [32,33]. The transcriptome of whitening P. stellatus revealed genes that were differentially expressed during pigmentation-related processes and responses to environmental stress (Figure 5 and Figure 6). This study also highlighted the endocrine metabolic pathways related to pigmentation (Table 2), with the Wnt signaling pathway emerging as a key factor in skin color changes [34].
Beyond the Wnt pathway, which regulates melanocyte differentiation [35], our analysis revealed enrichment in ErbB and GnRH signaling. The ErbB pathway has been shown to influence the development of pigment progenitor cells derived from the neural crest, affecting pigmentation patterning in zebrafish. GnRH signaling may mediate stress-related pigment responses through hormonal regulation, suggesting coordinated control between neuroendocrine and cellular mechanisms.
Genes related to pigmentation variations are often associated with vascular and muscle formation, hypoxia, and phosphorylation. Genes highly expressed during vascular formation include lumican, which plays a role in epithelial cell generation and collagen fiber organization [36]. Notably, secreted protein acidic and cysteine-rich (SPARC) and TPI1 (triosephosphate isomerase 1), which are upregulated in whitening tissues, are critical for skin regeneration and stress response in fish (Figure 5). SPARC upregulation may reflect compensatory mechanisms that mitigate pigment loss caused by environmental stress. Increased TPI1 expression likely responds to elevated energy demands under stress [37]. Additional upregulated genes (GLTSCR2, PPP1R11, FRA10AC1, and VPS13D) may indirectly affect pigmentation by influencing oxidative mechanisms, cell proliferation, and apoptosis, thereby potentially affecting growth and disease susceptibility [38]. These genes are also implicated in skin aging, UV response, DNA repair, and cell death, underscoring their role in the stress response. Although the present study did not include experimental validation, we plan to perform quantitative RT-PCR and protein-level assays in future work to confirm the expression of key DEGs, such as GLTSCR2, PPP1R11, and VPS13D.
Albinism in fish, characterized by the absence or severe reduction in melanin, renders individuals highly vulnerable to ultraviolet (UV) radiation, particularly in the UV-B spectrum. This deficiency not only increases susceptibility to tissue damage and oxidative stress but also impairs visual performance. Consequently, whitening fish often exhibit reduced predator avoidance ability and decreased efficiency in prey detection, ultimately leading to lower survival rates. Several studies have demonstrated that juvenile fish exposed to UV radiation show diminished escape responses and higher mortality, supporting the protective role of melanin and chromatophores against photic stress [6,39]. In contrast, hypermelanosis (abnormal dark pigmentation) is frequently observed in cultured flatfish and other aquaculture species. This condition has been associated with metabolic alterations, endocrine imbalances such as cortisol fluctuations, and genetic factors including single-nucleotide polymorphisms and transcriptional regulation. Beyond its physiological implications, hypermelanosis substantially diminishes the market value of affected individuals due to their undesirable appearance. Multiple reports confirm that pigmentation anomalies such as pseudo-albinism or hypermelanosis directly contribute to price reductions and consumer rejection [25,26,40].
Although several pathways were identified as significant, the number of genes contributing to each pathway was relatively small. Therefore, these results should be interpreted with caution, as they may reflect partial or preliminary associations rather than definitive biological mechanisms. Future analyses incorporating larger sample sizes and complementary validation experiments will be necessary to confirm these findings.
In aquaculture systems, the repeated occurrence of pigmentation disorders can raise concerns about hatchery and farm management practices. Persistent production of whitening or hypermelanotic individuals undermines confidence in quality control, damages brand reputation, and ultimately leads to economic losses. Historical and recent evidence consistently highlight pigmentation abnormalities as one of the key quality issues affecting the commercial success of cultured fish [41]. We acknowledge that three biological replicates per group may limit statistical power. Future studies with larger sample sizes will enhance the robustness of differential expression analysis.
5. Conclusions
Hyperpigmentation in P. stellatus may reflect overactivation of melanogenic enzymes, particularly tyrosinase, driven by altered cortisol signaling and oxidative stress. The upregulation of FRA10AC1 and VPS13D suggests increased metabolic and mitochondrial activity, which may indirectly promote melanin biosynthesis. Such mechanisms align with hypermelanosis observed in other cultured flatfish under prolonged rearing stress. This study used de novo RNA-seq assembly to identify candidate genes associated with pigmentation variations in P. stellatus. Over 20 Gbp of reference data was generated from the brain tissues of the three groups (normal, whitening, and darkening), resulting in approximately 198,853 unigenes. Differential expression analysis identified genes associated with pigmentation-specific characteristics, as supported by GO and pathway analyses. These findings provide a foundation for future studies on P. stellatus and contribute to our understanding of pigmentation mechanisms in aquaculture. Although this transcriptomic analysis identified candidate pigmentation-related genes, the findings are limited by the small sample size and the lack of direct functional validation, which will be addressed in future research.
Supplementary Materials
The following supporting information can be downloaded at: https://www.mdpi.com/article/10.3390/jmse13112190/s1, Table S1. Quality assessment of RNA samples using the 2100 BioAnalyzer. Table S2. Gene Ontology Analysis. Figure S1. ErbB signaling pathway associated with whitening. Figure S2. GnRH signaling pathway associated with whitening. Figure S3. Wnt signaling pathway associated with whitening. Figure S4. Arrhythmogenic right ventricular cardiomyopathy associated with whitening. Figure S5. spliceosome signaling pathway associated with whitening. Figure S6. Spliceosome signaling pathway associated with darkening. Figure S7. N glycan biosynthesis pathway associated with darkening. In the supplementary figures, red stars indicate specifically expressed genes.
Author Contributions
Conceptualization, D.-Y.K.; Methodology, J.H. and D.-Y.K.; Field investigation, J.H.; Software, J.H.; writing—original draft preparation, J.H.; writing—review and editing. D.-Y.K.; Project administration. D.-Y.K. All authors have read and agreed to the published version of the manuscript.
Funding
This study was supported by the project ‘Fisheries by-product valuation and quality improvement research’ (R2025057) of the National Institute of Fisheries Science (NIFS), Incheon, Republic of Korea.
Institution Review Board Statement
Not applicable.
Informed Consent statement
Not applicable.
Data Availability Statement
The original contributions presented in the study are included in the article/Supplementary Material, further inquiries can be directed to the corresponding author.
Conflicts of Interest
The authors declare no conflicts of interest.
References
- Cho, J.-H.; Hamidoghli, A.; Hur, S.-W.; Lee, B.-J.; Lee, S.; Kim, K.-W.; Lee, S. Growth, Nutrient Deposition, Plasma Metabolites, and Innate Immunity Are Associated with Feeding Rate in Juvenile Starry Flounder (Platichthys stellatus). Animals 2024, 14, 3127. [Google Scholar] [CrossRef]
- Jung, H.-C.; Kim, J.-H.; Kang, J.-C. Toxic Impact of Dietary Cadmium on Bioaccumulation, Growth, Hematological Parameters, Plasma Components, and Antioxidant Responses in Starry Flounder (Platichthys stellatus). Fishes 2024, 9, 59. [Google Scholar] [CrossRef]
- An, H.S.; Nam, M.M.; Myeong, J.I.; An, C.M. Genetic diversity and differentiation of the Korean starry flounder (Platichthys stellatus) between and within cultured stocks and wild populations inferred from microsatellite DNA analysis. Mol. Biol. Rep. 2014, 41, 7281–7292. [Google Scholar] [CrossRef]
- Nakhawa, A.D.; Tandel, S.; Chellapan, A.; V, A.K.; Kumar, R. First Record of Hyperpigmentation in a Unicorn Cod, Bregmaceros Mcclellandi Thompson, 1840 (Gadiformes: Bregmacerotidae), From the North-west Coast of India. Thalass. Int. J. Mar. Sci. 2021, 37, 683–688. [Google Scholar] [CrossRef]
- Kang, D.-Y.; Kim, H.-C. Functional relation of agouti signaling proteins (ASIPs) to pigmentation and color change in the starry flounder, Platichthys stellatus. Comp. Biochem. Physiol. Part A Mol. Integr. Physiol. 2024, 291, 111524. [Google Scholar] [CrossRef] [PubMed]
- Bolker, J.A.; Hill, C.R. Pigmentation abnormalities in flatfish: A literature review. J. Fish Biol. 2000, 57, 1–20. [Google Scholar]
- Fernández-Díaz, C.; Yúfera, M. Pseudoalbinism in Senegal sole (Solea senegalensis): Implications for aquaculture. Aquaculture 1997, 154, 141–150. [Google Scholar]
- Li, H.; Chen, C.; Wang, Z.; Wang, K.; Li, Y.; Wang, W. Pattern of new gene origination in a special fish lineage, the flatfishes. Genes 2021, 12, 1819. [Google Scholar] [CrossRef] [PubMed]
- Kim, T.M.; Jang, H.S.; Park, J.Y.; bin Lee, H.; Lim, H.K. Effects of Environmental Factors on the Eye Direction in Juvenile Starry Flounder Platichthys stellatus. Korean J. Fish. Aquat. Sci. 2024, 57, 448–458. [Google Scholar]
- Kim, J.; Lee, S.H.; Park, C. Neuroendocrine regulation of pigmentation in fish under aquaculture stress. Aquaculture 2022, 555, 738217. [Google Scholar]
- Martínez, C.; López, M.; García, P. Neural and hormonal control of stress-induced pigmentation in teleosts. Comp. Biochem. Physiol. A Mol. Integr. Physiol. 2021, 256, 110940. [Google Scholar]
- Piredda, R.; Mottola, A.; Cipriano, G.; Carlucci, R.; Ciccarese, G.; Di Pinto, A. Next Generation Sequencing (NGS) approach applied to species identification in mixed processed seafood products. Food Control 2022, 133, 108590. [Google Scholar] [CrossRef]
- Satam, H.; Joshi, K.; Mangrolia, U.; Waghoo, S.; Zaidi, G.; Rawool, S.; Thakare, R.P.; Banday, S.; Mishra, A.K.; Das, G. Next-generation sequencing technology: Current trends and advancements. Biology 2023, 12, 997. [Google Scholar] [CrossRef]
- Pereira, R.; Oliveira, J.; Sousa, M. Bioinformatics and computational tools for next-generation sequencing analysis in clinical genetics. J. Clin. Med. 2020, 9, 132. [Google Scholar] [CrossRef]
- Arteche-López, A.; Ávila-Fernández, A.; Romero, R.; Riveiro-Álvarez, R.; López-Martínez, M.; Giménez-Pardo, A.; Vélez-Monsalve, C.; Gallego-Merlo, J.; García-Vara, I.; Almoguera, B. Sanger sequencing is no longer always necessary based on a single-center validation of 1109 NGS variants in 825 clinical exomes. Sci. Rep. 2021, 11, 5697. [Google Scholar] [CrossRef]
- Surányi, B.B.; Zwirzitz, B.; Mohácsi-Farkas, C.; Engelhardt, T.; Domig, K.J. Comparing the efficacy of MALDI-TOF MS and sequencing-based identification techniques (Sanger and NGS) to monitor the microbial community of irrigation water. Microorganisms 2023, 11, 287. [Google Scholar] [CrossRef]
- Saeidian, A.H.; Youssefian, L.; Vahidnezhad, H.; Uitto, J. Research techniques made simple: Whole-transcriptome sequencing by RNA-seq for diagnosis of monogenic disorders. J. Investig. Dermatol. 2020, 140, 1117–1126.e1111. [Google Scholar] [CrossRef] [PubMed]
- Negi, A.; Shukla, A.; Jaiswar, A.; Shrinet, J.; Jasrotia, R.S. Applications and challenges of microarray and RNA-sequencing. Bioinformatics 2022, 91–103. [Google Scholar] [CrossRef]
- Grabherr, M.G.; Haas, B.J.; Yassour, M.; Levin, J.Z.; Thompson, D.A.; Amit, I.; Adiconis, X.; Fan, L.; Raychowdhury, R.; Zeng, Q. Trinity: Reconstructing a full-length transcriptome without a genome from RNA-Seq data. Nat. Biotechnol. 2011, 29, 644. [Google Scholar] [CrossRef] [PubMed]
- Haas, B.J.; Papanicolaou, A.; Yassour, M.; Grabherr, M.; Blood, P.D.; Bowden, J.; Couger, M.B.; Eccles, D.; Li, B.; Lieber, M. De novo transcript sequence reconstruction from RNA-seq using the Trinity platform for reference generation and analysis. Nat. Protoc. 2013, 8, 1494–1512. [Google Scholar] [CrossRef] [PubMed]
- Pertea, G.; Huang, X.; Liang, F.; Antonescu, V.; Sultana, R.; Karamycheva, S.; Lee, Y.; White, J.; Cheung, F.; Parvizi, B. TIGR Gene Indices clustering tools (TGICL): A software system for fast clustering of large EST datasets. Bioinformatics 2003, 19, 651–652. [Google Scholar] [CrossRef]
- Huang, X.; Madan, A. CAP3: A DNA sequence assembly program. Genome Res. 1999, 9, 868–877. [Google Scholar] [CrossRef]
- Sun, J.; Nishiyama, T.; Shimizu, K.; Kadota, K. TCC: An R package for comparing tag count data with robust normalization strategies. BMC Bioinform. 2013, 14, 1–14. [Google Scholar] [CrossRef]
- Anders, S.; Huber, W. Differential expression analysis for sequence count data. Nat. Preced. 2010, 1. [Google Scholar] [CrossRef]
- Ryu, Y.-A.; Choi, C.Y.; Kang, J.-C.; Kim, J.-H. Effects on lethal concentration 50% hematological parameters and plasma components of Starry flounder, Platichthys stellatus exposed to hexavalent chromium. Environ. Toxicol. Pharmacol. 2024, 113, 104610. [Google Scholar] [CrossRef]
- Min, B.H.; Park, M.S.; Myeong, J.-l. Stress responses of starry flounder, Platichthys stellatus (Pallas) following water temperature rise. J. Environ. Biol. 2015, 36, 1057. [Google Scholar]
- Lee, H.B.; Yoon, J.H.; Park, J.Y.; Lee, I.Y.; Lim, H.K. A comparison of the physiological responses to heat stress of juvenile and adult starry flounder (Platichthys stellatus). Isr. J. Aquac. Bamidgeh 2021, 73, 1–15. [Google Scholar] [CrossRef]
- Lee, H.; Chung, J.S.; Yoon, J.; Park, J.Y.; Lim, H.K. Understanding Heat-Associated Adult Platichthys stellatus Mortality: Differential Transcriptome Analysis of Juvenile and Adult Starry Flounder Liver under Heat Stress. Aquac. Res. 2024, 2024, 9980817. [Google Scholar] [CrossRef]
- Blandon, I.R.; DiBona, E.; Battenhouse, A.; Vargas, S.; Mace, C.; Seemann, F. Analysis of the Skin and Brain Transcriptome of Normally Pigmented and Pseudo-whitening Southern Flounder (Paralichthys lethostigma) Juveniles to Study the Molecular Mechanisms of Hypopigmentation and Its Implications for Species Survival in the Natural Environment. Int. J. Mol. Sci. 2024, 25, 7775. [Google Scholar]
- Svitačová, K.; Slavík, O.; Horký, P. Pigmentation potentially influences fish welfare in aquaculture. Appl. Anim. Behav. Sci. 2023, 262, 105903. [Google Scholar] [CrossRef]
- Devi, N.K.; Kumar, A.T.; Balasubramanian, T. Pigment deficiency correction in captive clown fish, amphiprion ocellaris using different carotenoid sources. J. FisheriesSciences.Com 2016, 10, 4. [Google Scholar]
- Schaerlinger, B.; Żarski, D. Evaluation and improvements of egg and larval quality in percid fishes. In Biology and Culture of Percid Fishes: Principles and Practices; Springer: Dordrecht, The Netherlands, 2015; pp. 193–223. [Google Scholar]
- Bernáth, G.; Csenki, Z.; Bokor, Z.; Várkonyi, L.; Molnár, J.; Szabó, T.; Staszny, Á.; Ferincz, Á.; Szabó, K.; Urbányi, B. The effects of different preservation methods on ide (Leuciscus idus) sperm and the longevity of sperm movement. Cryobiology 2018, 81, 125–131. [Google Scholar] [CrossRef]
- Fan, Y.; Li, H.; Miguez-Macho, G. Global patterns of groundwater table depth. Science 2013, 339, 940–943. [Google Scholar] [CrossRef] [PubMed]
- Yamaguchi, Y.; Hearing, V.J. Physiological factors that regulate skin pigmentation. Biofactors 2010, 36, 193–199. [Google Scholar] [CrossRef]
- Matheson, S.; Larjava, H.; Häkkinen, L. Distinctive localization and function for lumican, fibromodulin and decorin to regulate collagen fibril organization in periodontal tissues. J. Periodontal Res. 2005, 40, 312–324. [Google Scholar] [CrossRef] [PubMed]
- Torres Núñez, E. Sparc (Osteonectin): New Insight into the Function and Regulation = Sparc (Osteonectin): Nuevos Conocimientos Sobre sus Funciones y Regulación. Ph.D. Thesis, Universitat de Barcelona, Barcelona, Spain, 2014. [Google Scholar]
- Li, C.-C.; Dong, H.-J.; Wang, P.; Meng, W.; Chi, X.-J.; Han, S.-C.; Ning, S.; Wang, C.; Wang, X.-J. Cellular protein GLTSCR2: A valuable target for the development of broad-spectrum antivirals. Antivir. Res. 2017, 142, 1–11. [Google Scholar] [CrossRef]
- Bjørgen, H.; Hansen, H.Ø.; Saevareid, O.; Edvardsen, R.B.; Øvergård, A.-C. Melanisation in Salmonid Skeletal Muscle: A Review. J. Fish Dis. 2024, 47, e14063. [Google Scholar] [CrossRef] [PubMed]
- Kang, D.-Y.; Lee, J.-H.; Kim, W.-J.; Kim, H.-C. Morphological specificity in cultured starry flounder Platichthys stellatus reared in artificial facility. Fish. Aquat. Sci. 2012, 15, 117–123. [Google Scholar] [CrossRef]
- Leclercq, E.; Taylor, J.F.; Migaud, H. Morphological skin color changes in teleosts. Fish Fish. 2010, 11, 159–193. [Google Scholar] [CrossRef]
Disclaimer/Publisher’s Note: The statements, opinions and data contained in all publications are solely those of the individual author(s) and contributor(s) and not of MDPI and/or the editor(s). MDPI and/or the editor(s) disclaim responsibility for any injury to people or property resulting from any ideas, methods, instructions or products referred to in the content. |
© 2025 by the authors. Licensee MDPI, Basel, Switzerland. This article is an open access article distributed under the terms and conditions of the Creative Commons Attribution (CC BY) license (https://creativecommons.org/licenses/by/4.0/).