Article

Research on Instantaneous Sediment Concentration in Muddy Coastal Waters Under Extreme Weather Conditions

1
State Key Laboratory of Water Cycle and Water Security, Key Laboratory of Hydrologic-Cycle and Hydrodynamic-System of Ministry of Water Resources, Hohai University, Nanjing 210024, China
2
China Design Group Co., Ltd., Nanjing 210014, China
3
School of Hydraulic Engineering, Anhui Water Conservancy Technical College, Hefei 231603, China
*
Author to whom correspondence should be addressed.
J. Mar. Sci. Eng. 2025, 13(11), 2188; https://doi.org/10.3390/jmse13112188
Submission received: 19 September 2025 / Revised: 13 November 2025 / Accepted: 13 November 2025 / Published: 18 November 2025
(This article belongs to the Section Coastal Engineering)

Abstract

This study addresses a fundamental limitation inherent in conventional sediment transport capacity formulas—their failure to accurately capture real-time fluctuations in suspended sediment concentration. Leveraging extensive synchronous field measurements of waves, currents, and sediment dynamics from muddy coastal zones, we integrate theoretical derivation with comprehensive data analysis to investigate the complex and transient behavior of instantaneous sediment concentration under extreme weather conditions. This study elucidates the dynamic response mechanisms of instantaneous sediment concentration to wave–current interactions, culminating in a novel formulation that incorporates the effects of velocity phase lag and wave energy dissipation. Validation against field measurements demonstrates that the proposed formula shows marked improvement over traditional sediment transport formulas in predicting sediment concentration during extreme events. This advancement provides more reliable sediment boundary conditions for numerical sediment transport modeling and establishes a new methodological framework for investigating sediment dynamics in muddy coastal environments.

1. Introduction

Muddy coasts are predominantly composed of silt or a mixture of silt and fine sand. They are mainly distributed along the coastlines adjacent to the mouths of large rivers that supply fine sediment. Well-known global examples encompass the coasts near the mouths of the Netherlands’ rivers, Suriname’s coastal areas, the Mississippi, Thames, and Amazon river mouths, as well as China’s Yangtze and Pearl River Estuaries and the Jiangsu coast [1,2,3,4]. Moreover, the fine sediments within these coastal systems possess a strong tendency to adsorb and disperse pollutants. Under extreme weather circumstances, waves and currents generate powerful hydrodynamic forces, which notably augment the transport and diffusion distances of suspended sediment. As a result, the spatial extent of the associated environmental impacts is considerably expanded. Therefore, examining the instantaneous sediment concentration and accurately forecasting the transport dynamics of suspended sediment on muddy coasts under such conditions is of great significance for guiding estuarine and coastal engineering and safeguarding the ecological environment. Instantaneous sediment concentration, which reflects real-time suspended sediment levels, is fundamentally distinct from the sediment-carrying capacity defined under bedform equilibrium. Despite this conceptual mismatch, the lack of a dedicated formula for the former necessitates the application of the latter, leading to significant predictive errors that are exacerbated under extreme weather. To bridge this gap, it is imperative to refine the sediment-carrying capacity formula by incorporating a wave–current enhancement factor. This refinement must further account for the environmental dichotomy: while riverine contexts permit simpler flow-based models, near-shore settings demand complex formulae that integrate the combined dynamics of waves and currents.
The study of sediment carrying capacity originated with Gilbert’s pioneering flume experiments [5], followed by foundational contributions from researchers including Bagnold [6] and Yang [7]. In estuarine and coastal environments, where wave–current interactions are significant, the corresponding formulas must account for these combined forces. Although these formulas calculate a time-averaged concentration and cannot resolve real-time fluctuations, they provide the essential theoretical basis for investigating instantaneous sediment concentration under extreme weather conditions. Owing to the combined impact of wave and tidal dynamics on the instantaneous sediment concentration in near-shore waters, it is imperative to consider the variations in wave and current dynamics when formulating the formula for instantaneous sediment concentration. Nevertheless, existing formulas for instantaneous sediment concentration fails to comprehensively consider the alterations in tidal flow velocity and wave energy loss, and their applicability is limited under conditions of strong wind and waves, requiring further investigation. Drawing upon comprehensive synchronous observational data of waves, currents, and sediment from muddy coasts, this research clarifies the intricacy and variability of instantaneous sediment concentration under extreme weather conditions. The applicability of diverse typical sediment concentration formulas under such circumstances was assessed, indicating that the existing formulas mainly reflect the time-averaged concentration within a computational period and are unable to depict the real-time variation process of in situ sediment concentration. By means of an integrated methodology that combines theoretical derivation and data analysis, the research pinpoints the time-varying characteristics of tidal current velocity and wave energy as the fundamental driving mechanisms, resulting in enhancements to the formulas for horizontal tidal current and wave velocities. A novel instantaneous sediment concentration formula was developed by integrating the phase-lagged velocity and wave energy dissipation effects, effectively capturing the response characteristics of sediment concentration to wave and current dynamics on muddy coasts.
This paper presents an in-depth investigation into the spatiotemporal correlations between sediment concentration and tidal current velocity as well as wave energy dissipation under extreme weather conditions. It effectively addresses the prevalent issue in conventional sediment concentration formulas where computed values exhibit temporal lag relative to variations in tidal dynamics. Through derivation of an instantaneous sediment concentration formula that incorporates phase-lagged velocity and wave energy dissipation effects, this research systematically examines the dynamic response characteristics of instantaneous sediment concentration in muddy coastal waters to wave and tidal forcing during severe storm conditions.

2. Materials and Methods

2.1. Data Sources and Monitoring Process

The Lianyungang coastal area is characterized by a silty coast, with extensive shallow shoals and a gentle underwater slope of approximately 1/1500. The shallow waters landward of the −5 m isobath (relative to the Lianyungang theoretical datum plane, same below) extend over 8 km [8]. Figure 1 shows the tidal distribution of the M2 constituent in the Lianyungang coastal waters. The coastal waters adjacent to Lianyungang are characterized by a regular semidiurnal tidal regime. Owing to shallow-water deformation of tidal waves, asymmetric tidal durations are observed between flood and ebb phases. Specifically, the mean duration of flood tide is 5.63 h, while that of ebb tide extends to 6.83 h, indicating a longer ebb duration compared to flood. The mean tidal range measures approximately 3.4 m. The M2 tidal constituent (principal lunar semidiurnal constituent) serves as the predominant forcing mechanism governing the tidal residual current dynamics in the Lianyungang coastal area [9]. Under high-wind conditions, waves replace tidal currents as the dominant mechanism for sediment resuspension, leading to a significant increase in sediment concentration compared to normal weather conditions. During such events, field measurements indicate that the near-bottom sediment concentration at the −5 m isobath in the Lianyungang coastal waters can exceed 5.0 kg/m3, with a pronounced vertical gradient observed in the water column [9]. Figure 2 shows the grain size distribution of the bed material. Bed sediment samples were collected using a conical bed-material sampler. The grain size of the samples was measured using a Malvern Mastersizer 2000 laser diffraction particle size analyzer. The sediment grain size is relatively fine, with a median diameter (d50) of approximately 0.009 mm, exhibiting characteristics typical of muddy, cohesive sediments. Muddy soils are classified into muddy clay and muddy silty clay based on the plasticity index. Muddy clay has a plasticity index (Ip) greater than 17, while muddy silty clay has a plasticity index ranging from 10 to 17 (10 < Ip ≤ 17). Grain-size analysis of suspended sediments indicates that the median particle size (D50) ranges from 0.004 mm to 0.007 mm, and D98 ranges from 0.029 mm to 0.067 mm, confirming their nature as fine-grained, cohesive sediments. To investigate the sediment transport patterns under extreme weather conditions, hydrological and sediment observation campaigns were conducted in the Lianyungang sea area of China in September 2007 [10], December 2008 [11], and August-November 2009 on windy and typhoon-affected days [12]. The long-term observational data have provided a data basis for the research on instantaneous sediment concentration during windy days. Observations were carried out by synchronized ad hoc stations during each high-wind event.
During Typhoon “Wipha” from 18 to 20 September 2007, two measurement stations were established at water depths of S1 (−3 m) and S2 (−5 m) to collect data on tidal levels, waves, current velocities, and sediment concentrations [10]. The instruments deployed included Norwegian AWAC (Nortek AS, Norway; manufacturer address information unavailable) acoustic wave and current profilers, Canadian RBR turbidimeters (RBR Ltd.; manufacturer address information unavailable), and Japanese COMPACT-CTD sensors (ALEC Electronics Co., Ltd.; manufacturer address information unavailable) for measuring temperature, salinity, depth, and sediment concentration. At the S1 (−3 m) station, one AWAC profiler, two RBR turbidimeters, and one COMPACT-CTD sensor were deployed. Similarly, at the S2 (−5 m) station, one AWAC profiler, two RBR turbidimeters, and one COMPACT-CTD sensor were installed. Continuous observations of waves, tidal levels, sediment concentration, salinity, and temperature were conducted throughout the storm event. The AWAC profilers were fixed to the seabed using frames, while the COMPACT-CTD sensors and RBR turbidimeters were secured with frames and buoys. At each station, two RBR turbidimeters and one CTD sensor were positioned to measure sediment concentrations at 0.5 m above the seabed, 1.5 m above the seabed, and 0.5 m below the water surface (−3 m) or 1.0 m below the water surface (−5 m), as required by the monitoring program.
During a cold wave event from December 3 to 8, 2008 [11], continuous observations of waves, tidal levels, sediment concentration, salinity, and temperature were conducted at four stations with water depths of S1 (−3 m), S2 (−5 m), S5 (−7.9 m), and S6 (−10 m). The instruments used included Japanese ADCP for directional wave spectra, Canadian RBR turbidimeters, Japanese COMPACT-CTD sensors, and Norwegian AWAC profilers. The S1 (−3 m) station was equipped with one ADCP, two RBR turbidimeters, and one COMPACT-CTD sensor. The S2 (−5 m) station deployed one AWAC profiler, two RBR turbidimeters, and one CTD sensor. The S5 (−7.9 m) station installed one AWAC profiler, two RBR turbidimeters, and one CTD sensor. The S6 (−10 m) station deployed one AWAC profiler, two RBR turbidimeters, and one CTD sensor.
From August to November 2009, short-term continuous automatic observations of waves, currents, and sediment were carried out along the proposed navigation channel in the Xuwei sea area [12]. Three stations were established along the channel axis at water depths of S1 (−3 m), S3 (−5.5 m), and S4 (−7 m). The instruments deployed included In Situ tide gauges, Norwegian AWAC profilers, Norwegian Aquadopp Profiler 2 MHz acoustic Doppler current profilers (Nortek AS, Norway; manufacturer address information unavailable), OBS-3A turbidimeters (Campbell Scientific, Inc.; manufacturer address information unavailable), and Canadian RBR turbidimeters. At the S1 (−3 m) station, an ADCP was placed on the seabed to observe waves and currents. OBS-3A, OBS-3A, and ALEC ATU75W self-recording turbidimeters (Alec Electronics; manufacturer address information unavailable) were deployed at 0.5 m below the water surface, 1.5 m above the seabed, and 0.5 m above the seabed, respectively, to measure sediment concentrations at these layers. At the S3 (−5.5 m) station, an ADCP was placed on the seabed to observe waves and currents. RBR, OBS-3A, and OBS-3A turbidimeters were deployed at 0.5 m below the water surface, 1.5 m above the seabed, and 0.5 m above the seabed, respectively, for sediment concentration measurements. One In Situ tide gauge was installed on the seabed for tidal level observations. The S4 (−7 m) station utilized a tripod-mounted seabed observation system. An AWAC profiler measured current velocity profiles and wave processes in the upper water column. An Aquadopp Profiler 2 MHz (Nortek AS; manufacturer address information unavailable) measured near-bottom current velocity profiles, and an RBR turbidimeter measured sediment concentration and water depth variations.
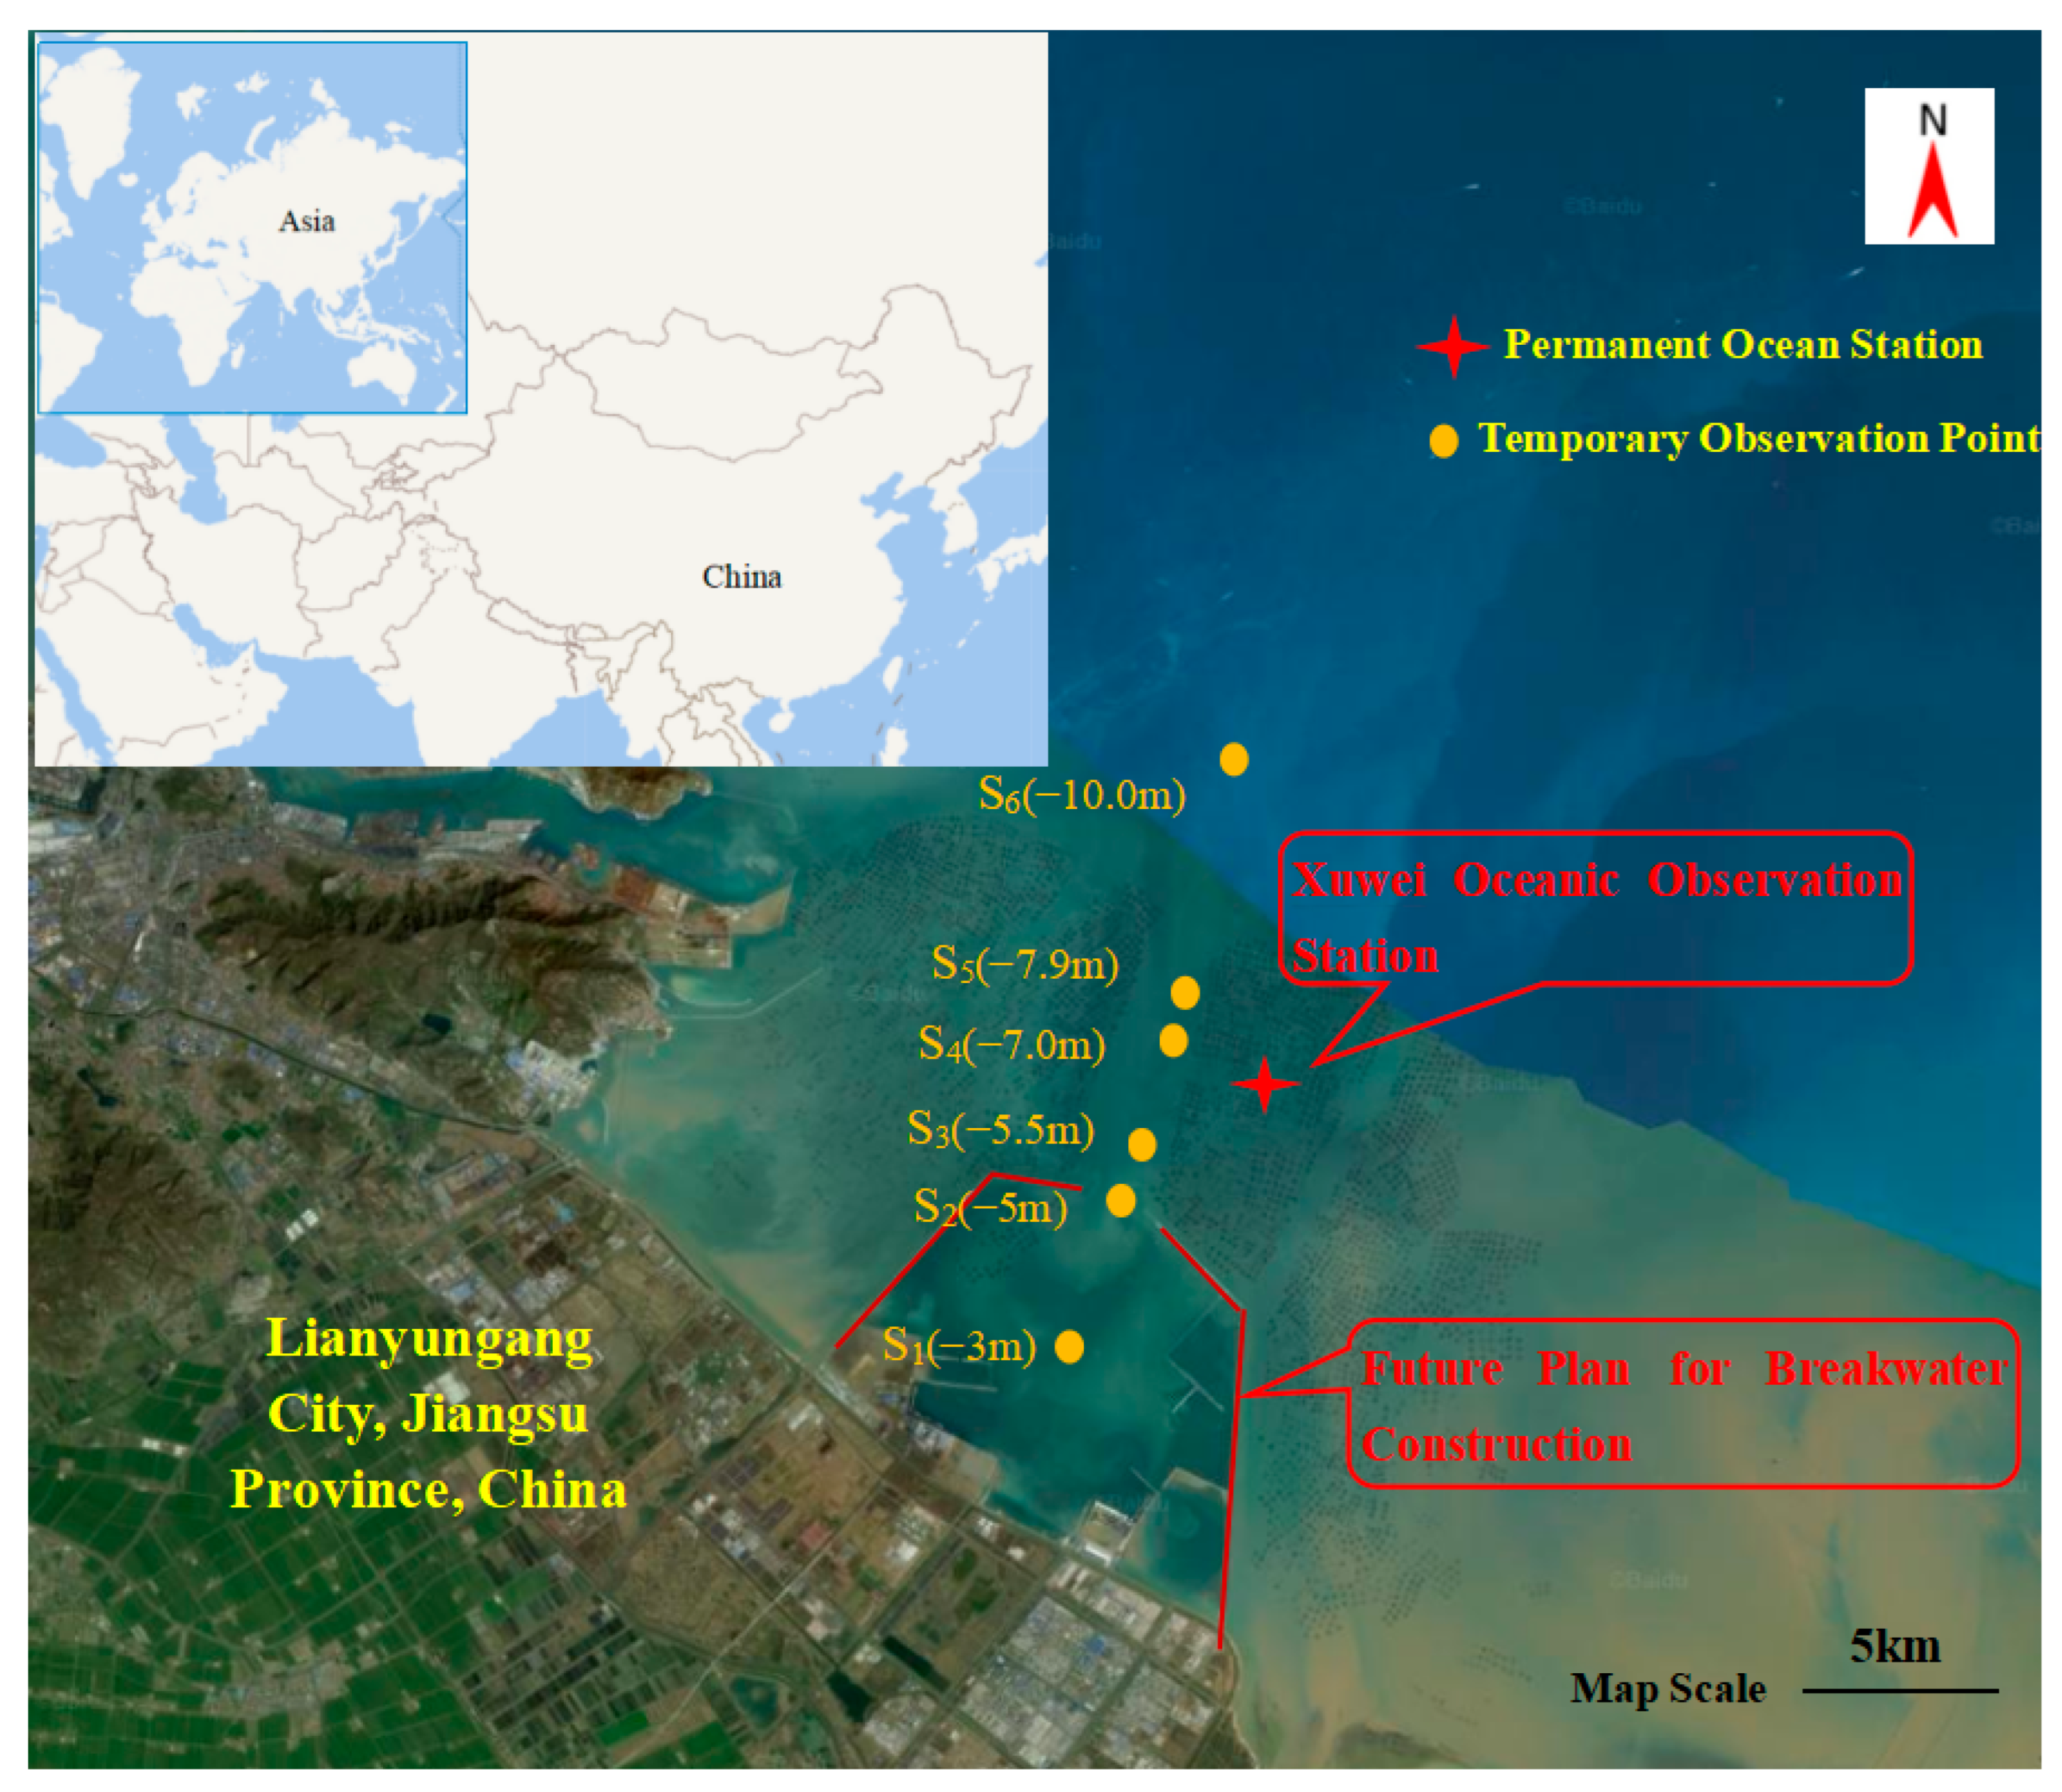
The accuracy of each instrument is as follows: wave measurements were conducted using the Norwegian Nortek AWAC with an accuracy of 1% of the measured value or 0.5 cm/s, and a measurement range of 0–10 m/s. Current velocity measurements used the Japanese ADCP with an accuracy of ±0.01 m/s. Temperature, depth, and salinity measurements employed the Japanese COMPACT-CTD sensor, with a temperature accuracy of ±0.02 °C. Sediment concentration measurements used the Canadian RBR turbidimeter with an accuracy of ±1%. Velocity data collected by the ADCP were processed using the built-in software “WinRiverV1.04” and a self-developed “ADCP Data Processing SystemV1.0” to derive vertical velocity profiles, flow direction, and sectional discharge. The vertical average velocity and direction were calculated based on the vector method. The velocities at each measurement point were projected onto the north and east directions, and their vertical averages were computed using a weighted average method. These values were then synthesized to determine the vertical average velocity and direction. An ADCP was deployed on the seafloor to observe waves and currents. OBS-3A and ALEC ATU75W self-contained turbidimeters were installed at 0.5 m below the surface, 1.5 m above the seabed, and 0.5 m above the seabed, respectively, to measure sediment concentration at corresponding layers. An In Situ tide gauge was placed on the seafloor for tidal level observation. A Nortek AWAC 1 MHz (Wave Dragon, Nortek AS, Norway; manufacturer address information unavailable) was used to measure velocity profiles and wave processes in the upper water column, while a Nortek Aquadopp Profiler 2 MHz (Current Dragon, Nortek AS, Norway; manufacturer address information unavailable) measured near-bottom velocity profiles. An OBS-3A turbidimeter monitored sediment concentration and water depth variations, and an OBS-3plus turbidimeter was employed for sediment concentration measurements. A description of the observational data obtained during the storm periods is provided in Table 1, In the table, V denotes flow velocity, Z water level, C concentration, and W wave height. Station Instrument Measurement Range and Accuracy in Table 2. while the spatial distribution of the monitoring points is illustrated in Figure 3.

2.2. Relationship Between Sediment Concentration and Tidal Dynamics

The tidal waves in the Lianyungang sea area are classified as regular semi-diurnal tides. Under normal weather conditions, the tidal power is feeble, insufficient to suspend the sediment in the shallow waters adjacent to the coast. The range of flow velocity variations during flood and ebb tides is generally consistent, with the ebb tide velocity being marginally higher than the flood tide velocity. At the slack water moment, the flow velocity is relatively low, and the corresponding sediment concentration in the water body is also low. At the moment of rapid flow, the velocity is high, and the sediment near the shore has not yet been compacted, facilitating its suspension and increasing the sediment concentration in the water.
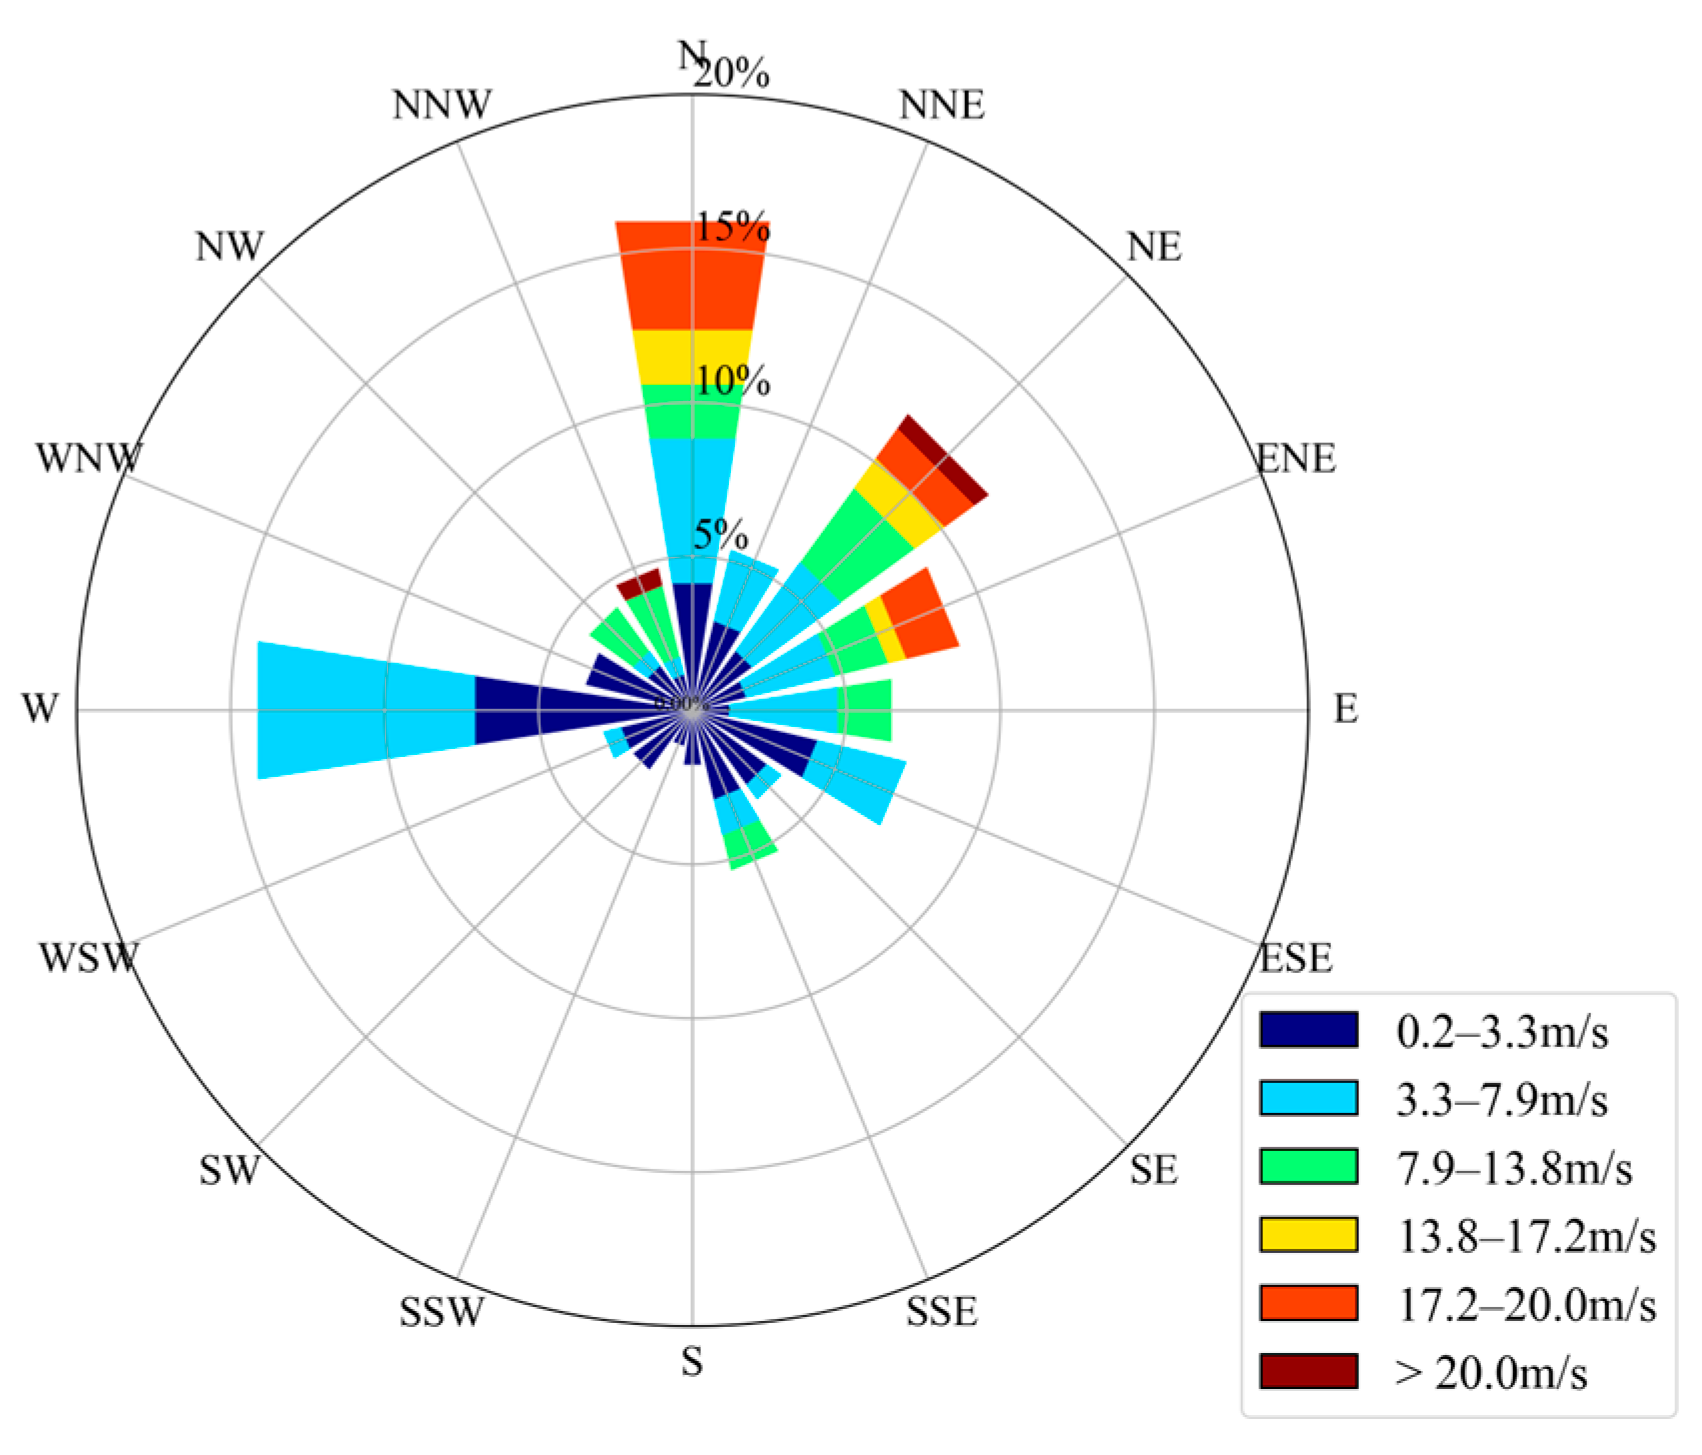
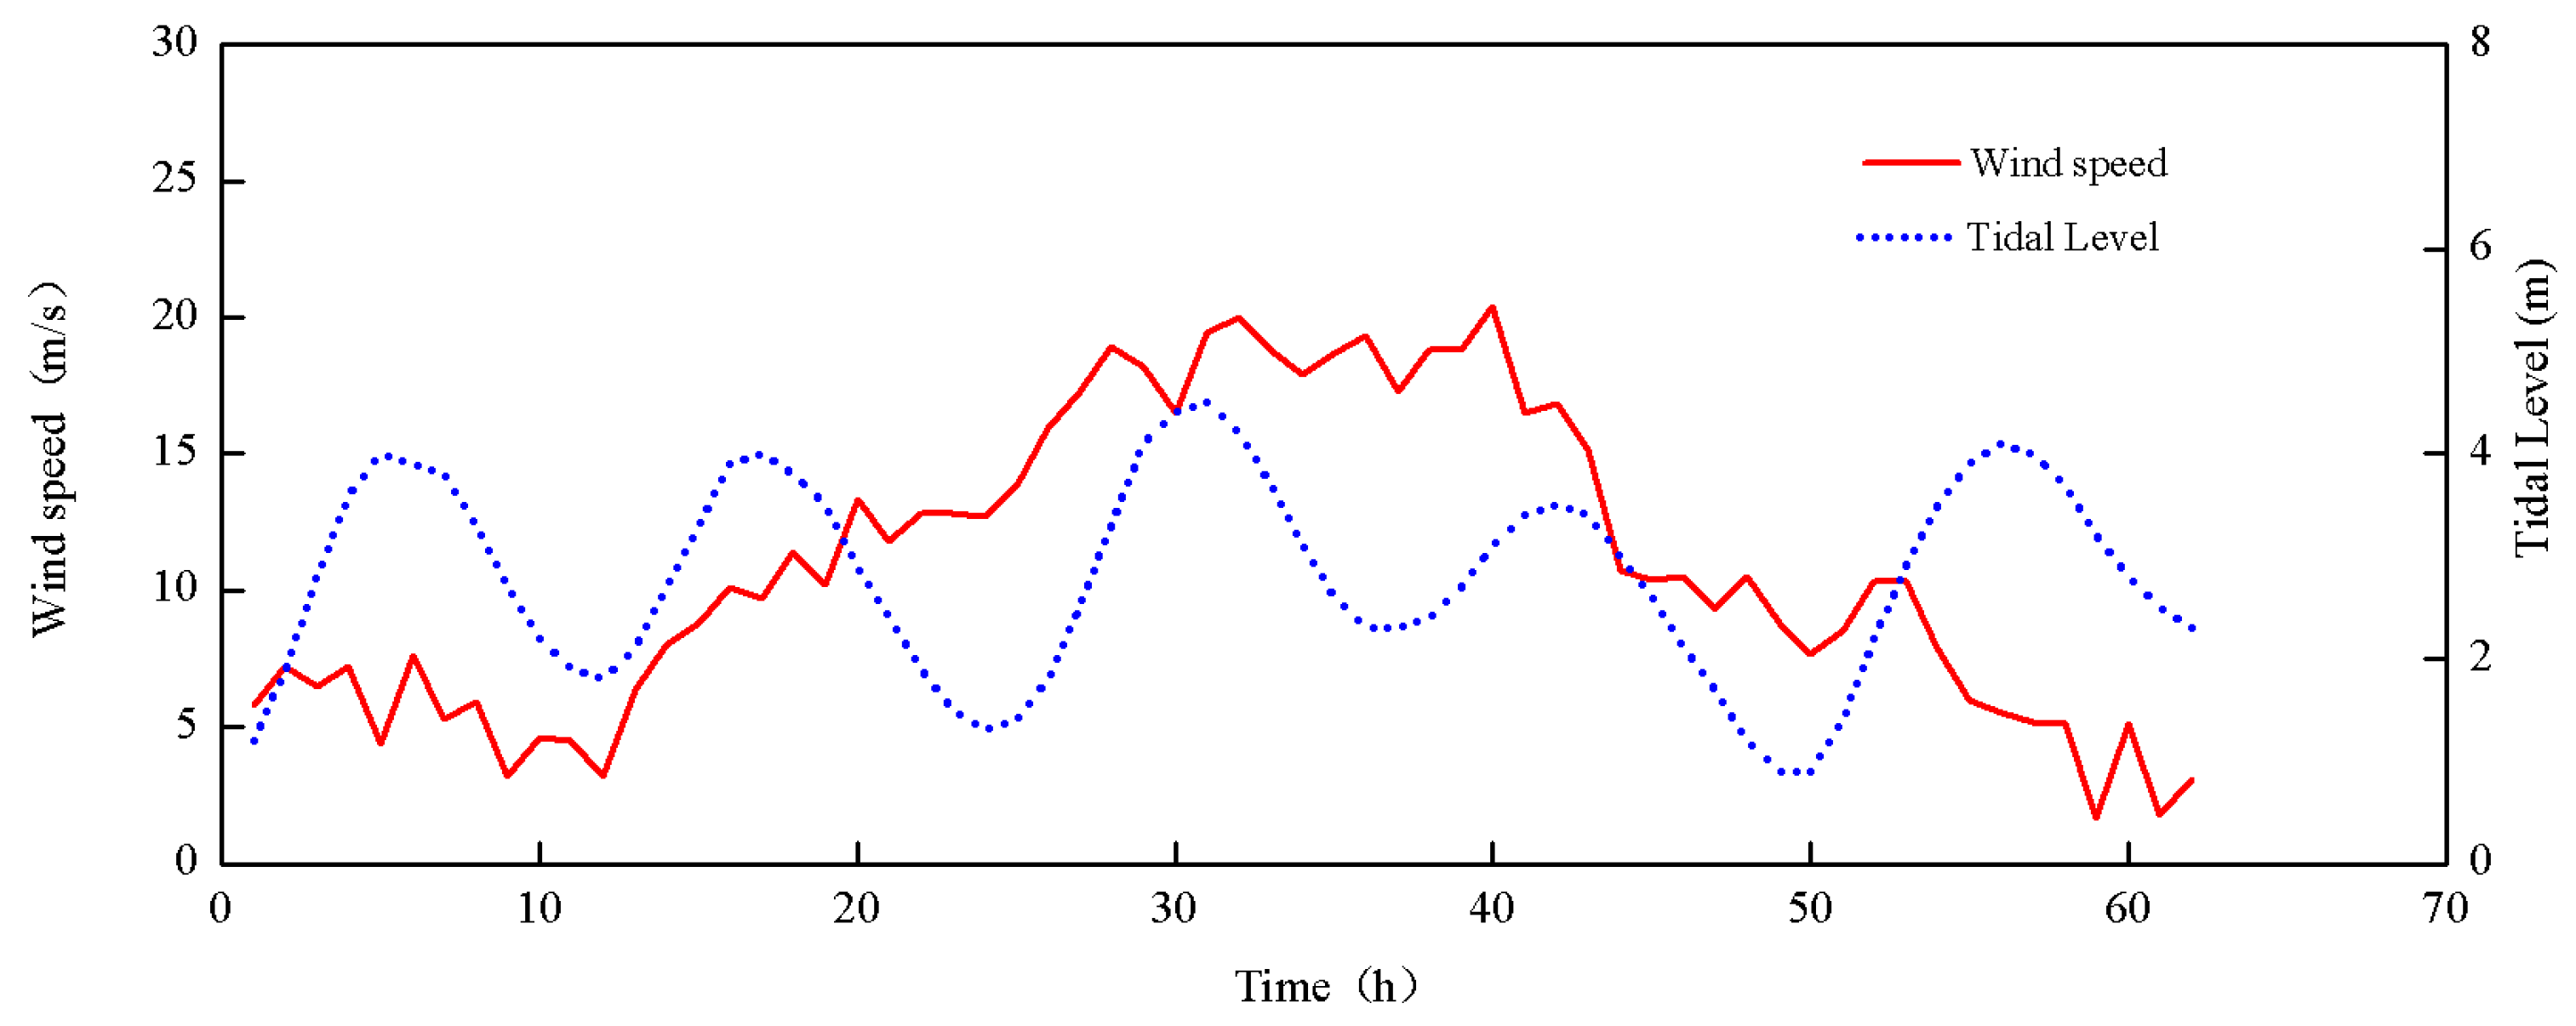
Figure 4, Figure 5, Figure 6 and Figure 7 show the wind rose diagram and tidal level variation chart during Typhoon Wipha, respectively. The oceanic circulation in the Lianyungang coastal waters is dominated by semi-diurnal tides, with the M2 tidal constituent serving as the core dynamic force, which shapes the strong rectilinear tidal current field in this area. Due to the superposition of the S2 and M2 tidal constituents, the current velocity in the area exhibits periodic variations between spring and neap tides. Under the wind stress generated by the sustained NNW-NNE winds (with a maximum wind speed of 20.4 m/s) during Typhoon Wipha, the wind-induced current effect modified the regional tidal current structure, significantly increasing the vertically averaged current velocity at the −5 m isobath to 0.77 m/s. Under extreme weather conditions such as typhoons, wind stress strongly interferes with and intensifies the tidal dynamic effects. During Typhoon Wipha from 18 to 20 September 2007, northwesterly winds prevailed. Strong winds greater than 15 m/s were mainly concentrated on 19–20 September, with the maximum wind speed of 20.4 m/s coming from the northwest. On 21 September, wind directions gradually became dispersed, and wind force weakened. The maximum current velocity occurred at 09:00 on 20 September, reaching 0.77 m/s, while the peak sediment concentration occurred at 10:00 on 20 September, showing a certain time lag. Current velocity determines the horizontal transport capacity of sediment, and compared to the peak current velocity, the peak sediment concentration exhibits a certain hysteresis. The results indicate a statistically significant positive correlation between these two parameters, with a Pearson correlation coefficient of 0.624. The t-test results demonstrate an extremely significant relationship. This statistically confirms that tidal dynamics are a key controlling factor for variations in water sediment concentration in this region. Increased flow velocity effectively enhances bed shear stress, thereby promoting the resuspension and transport of bottom sediments.
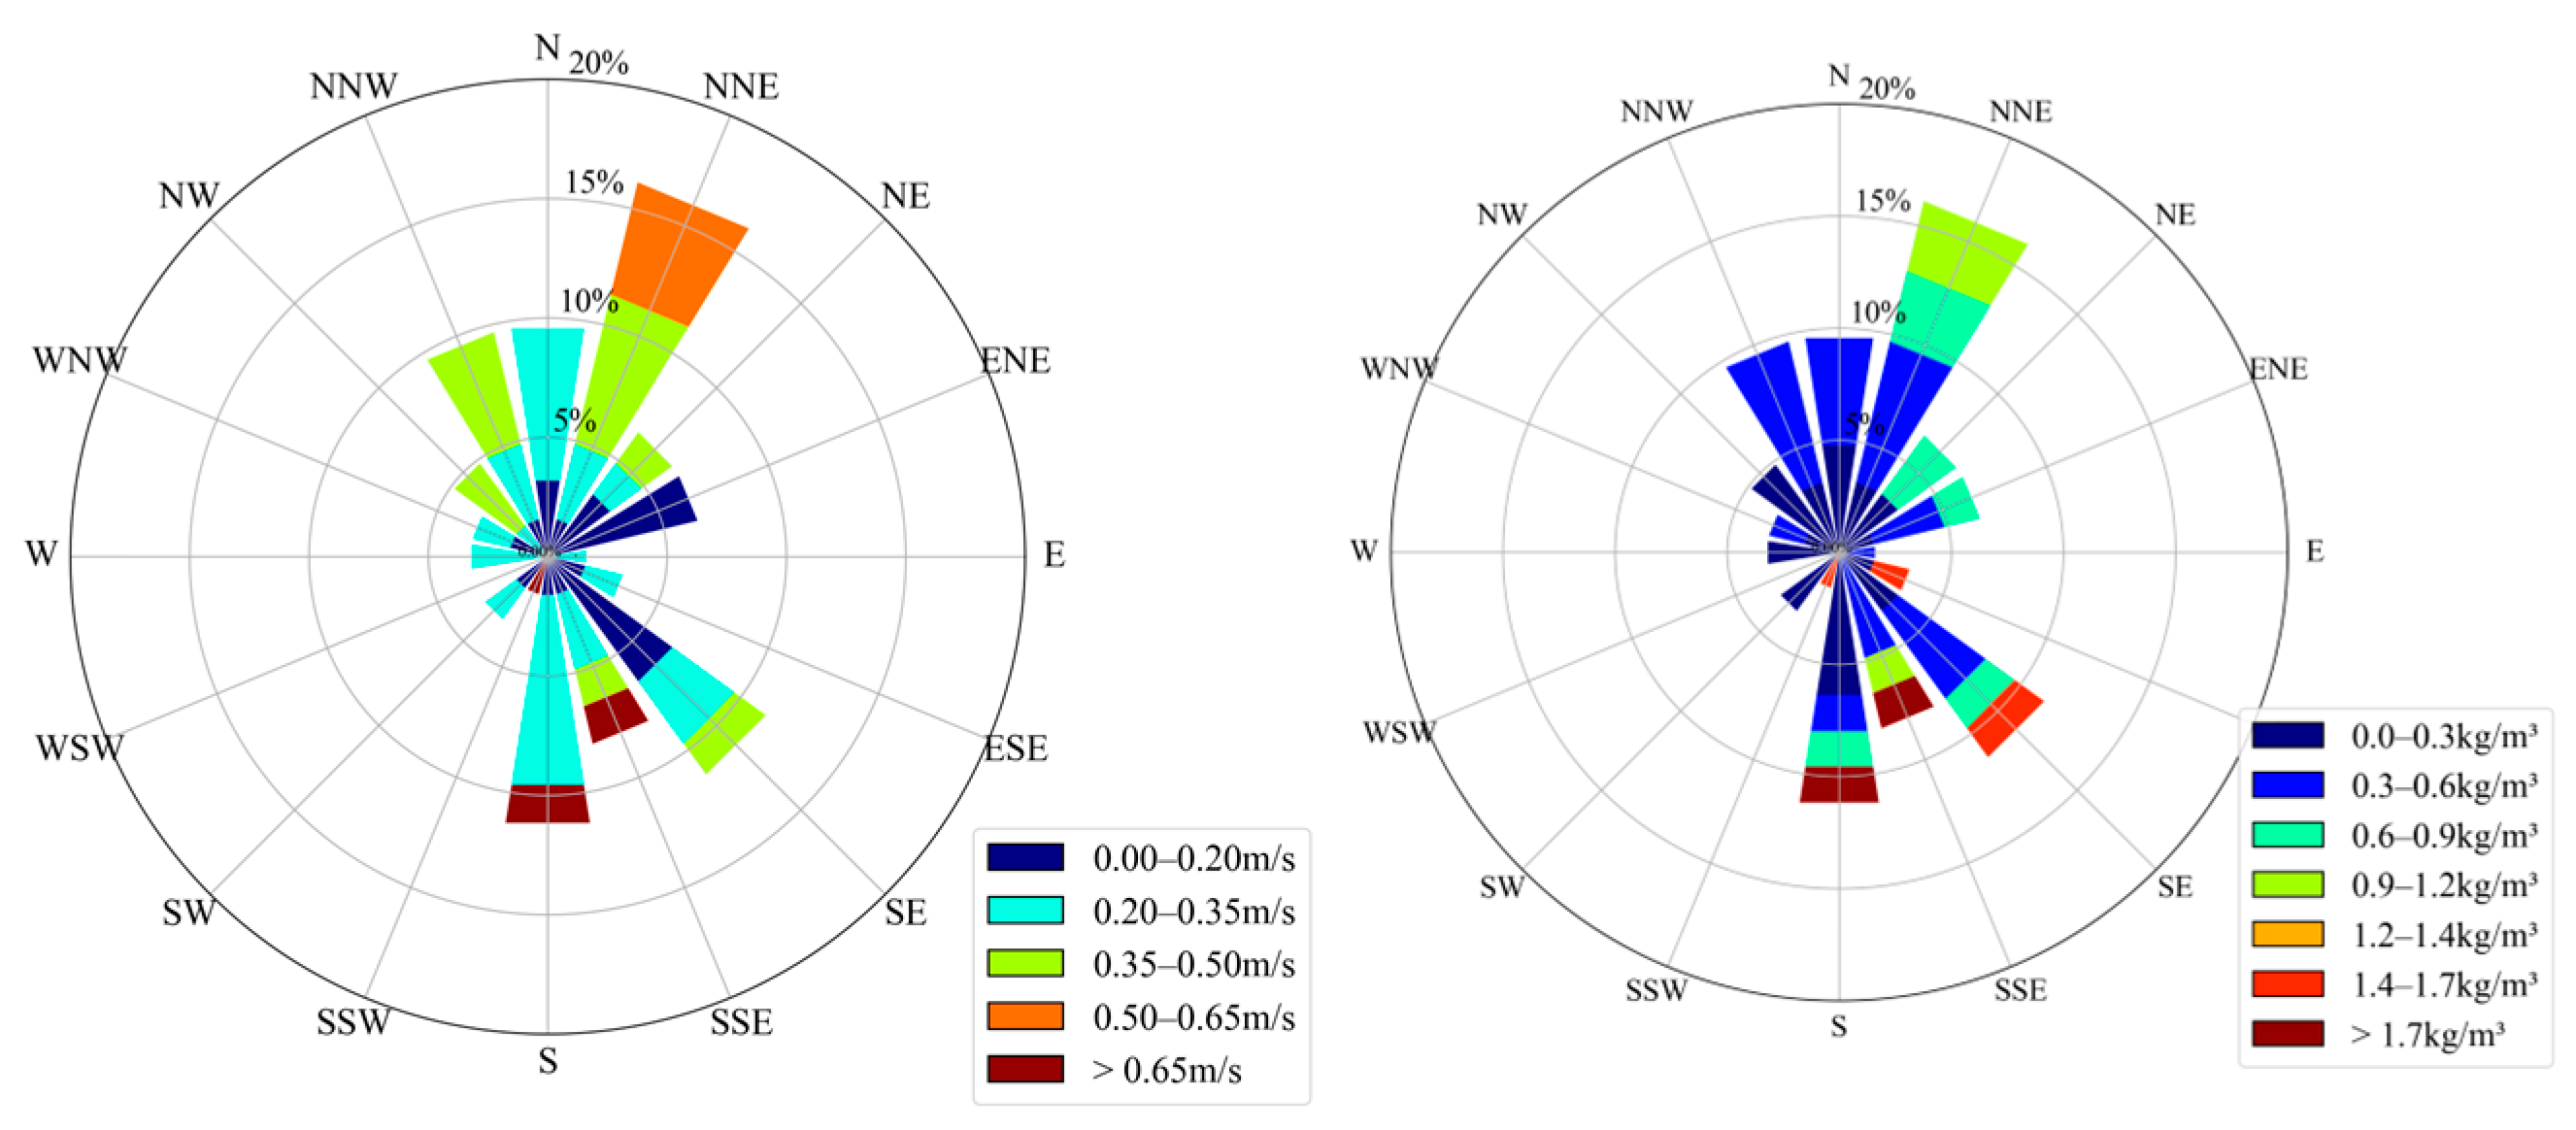
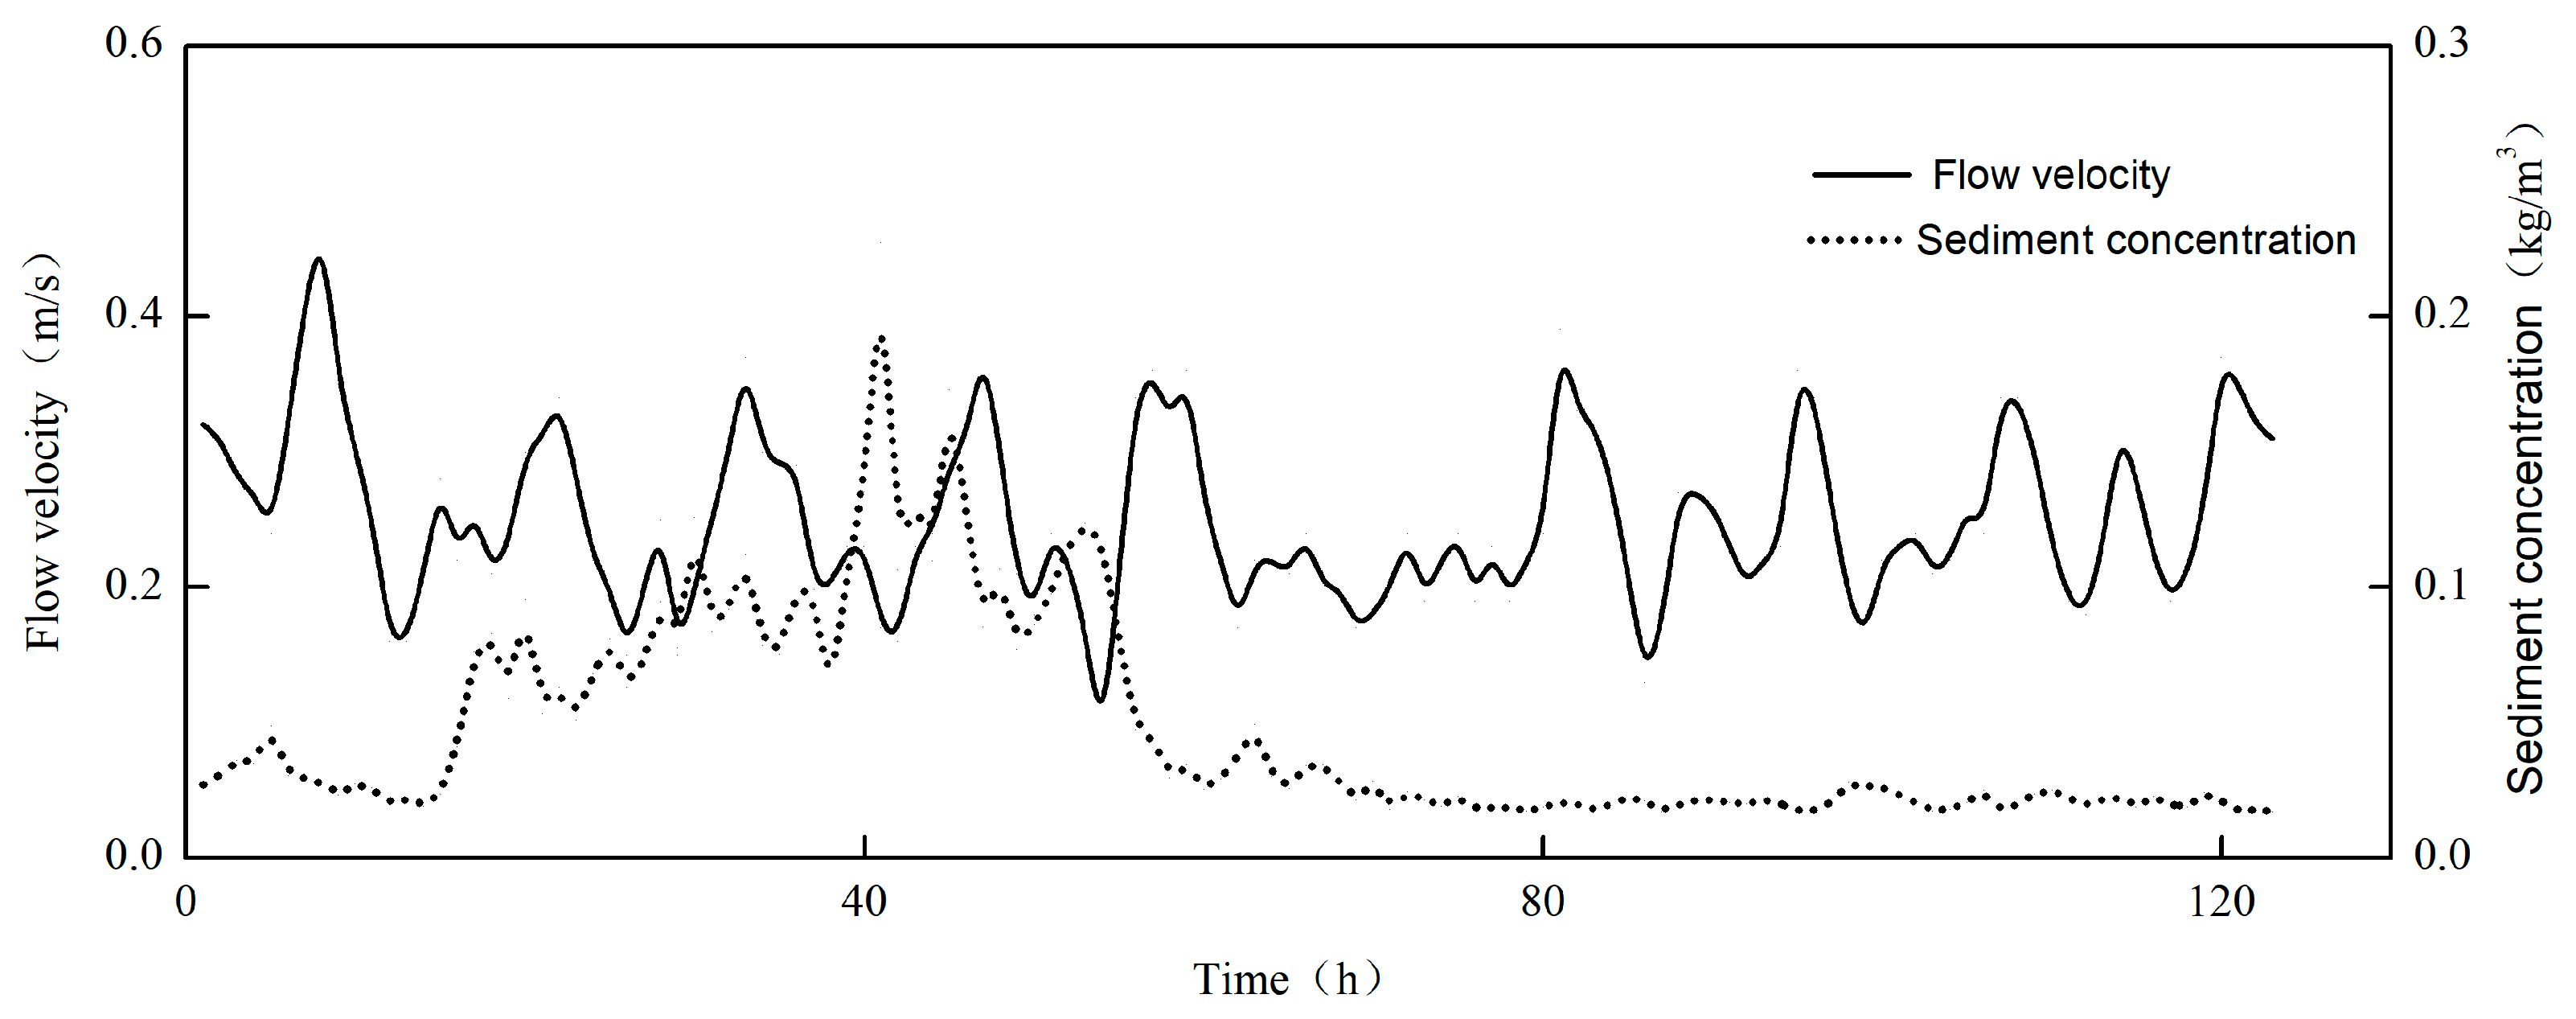
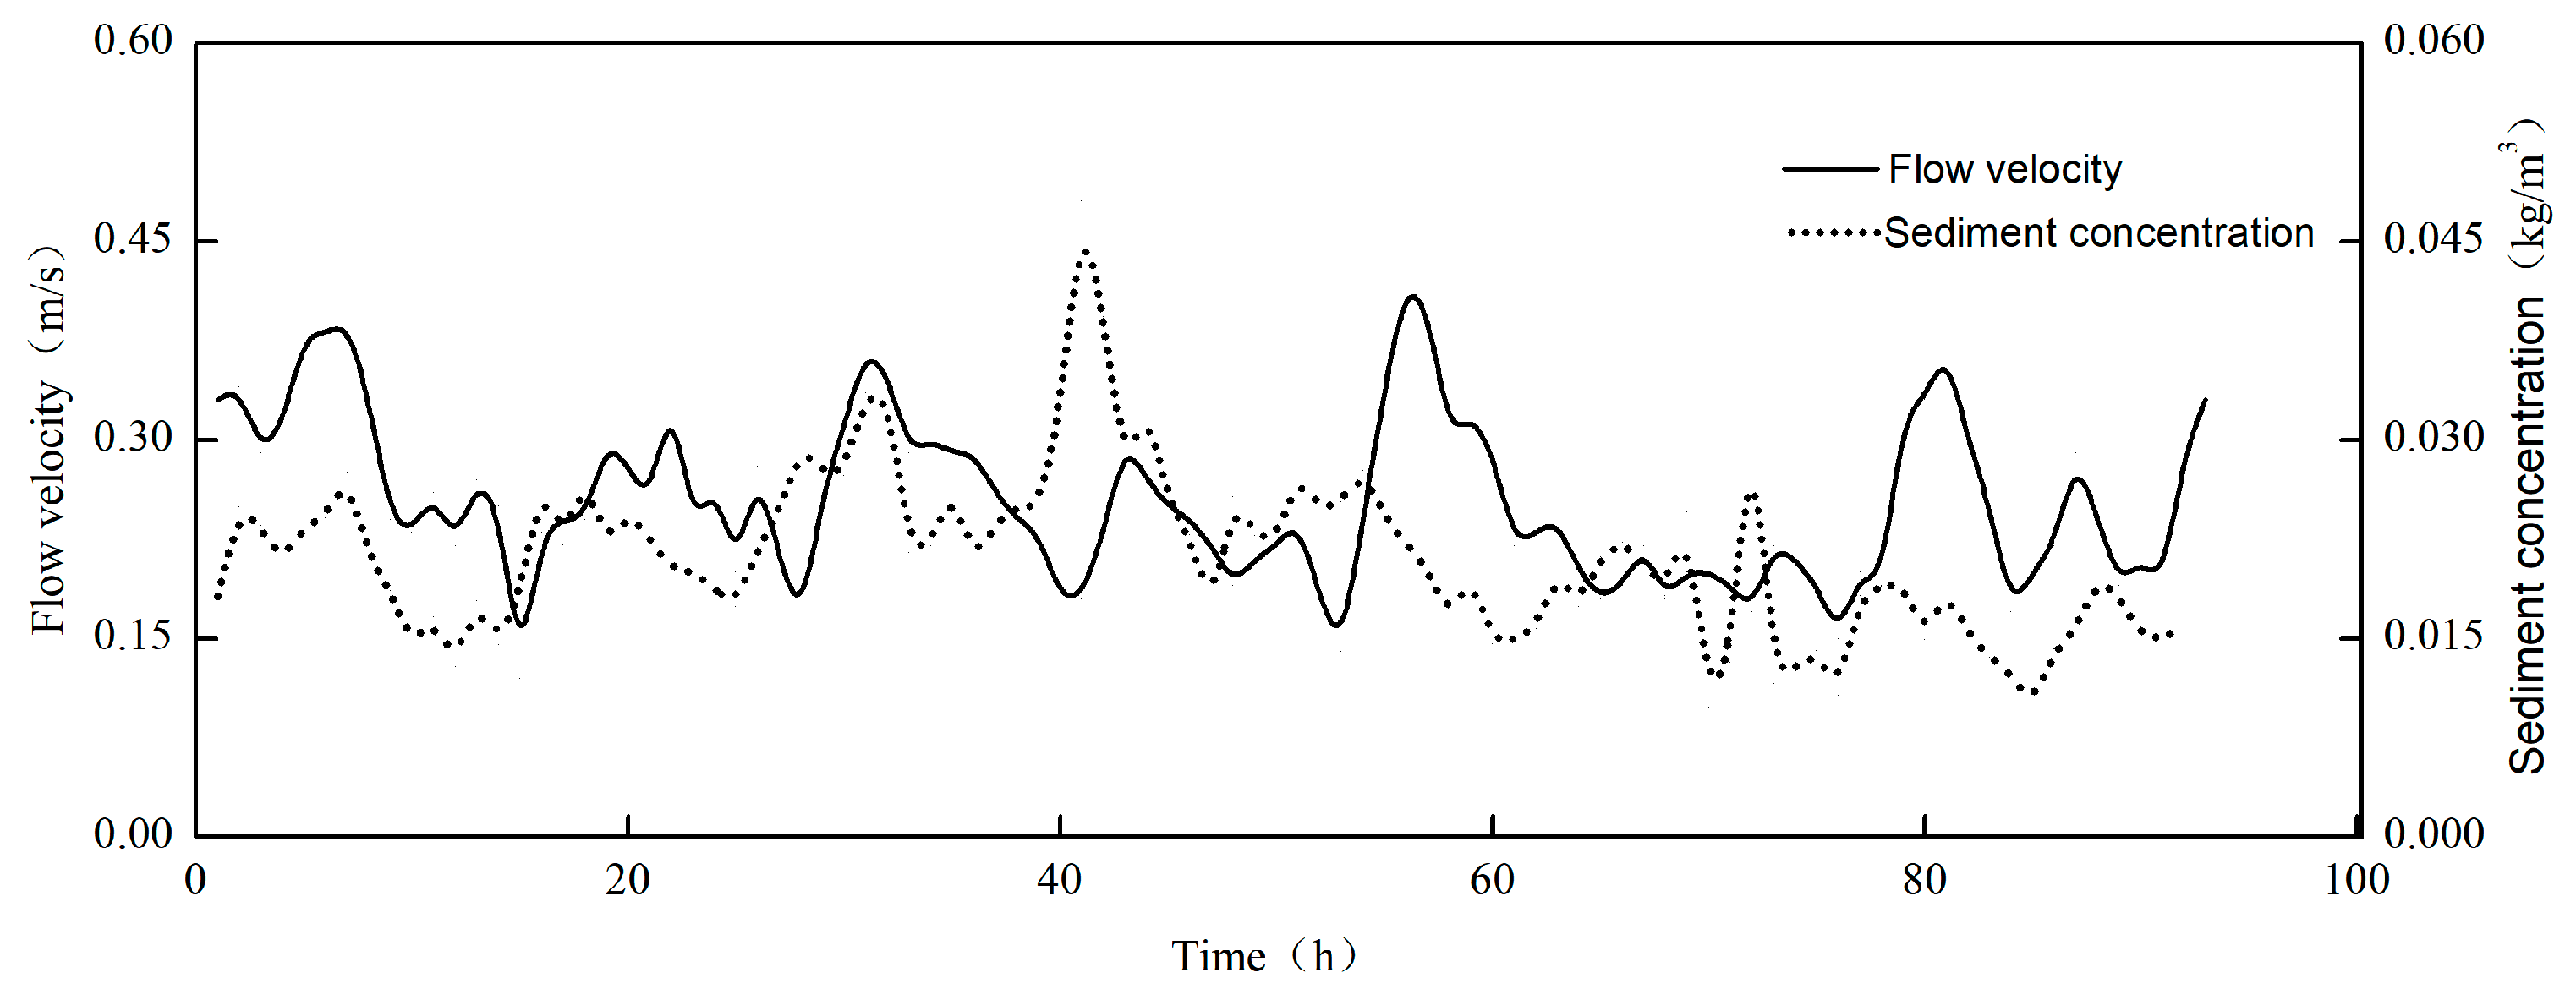
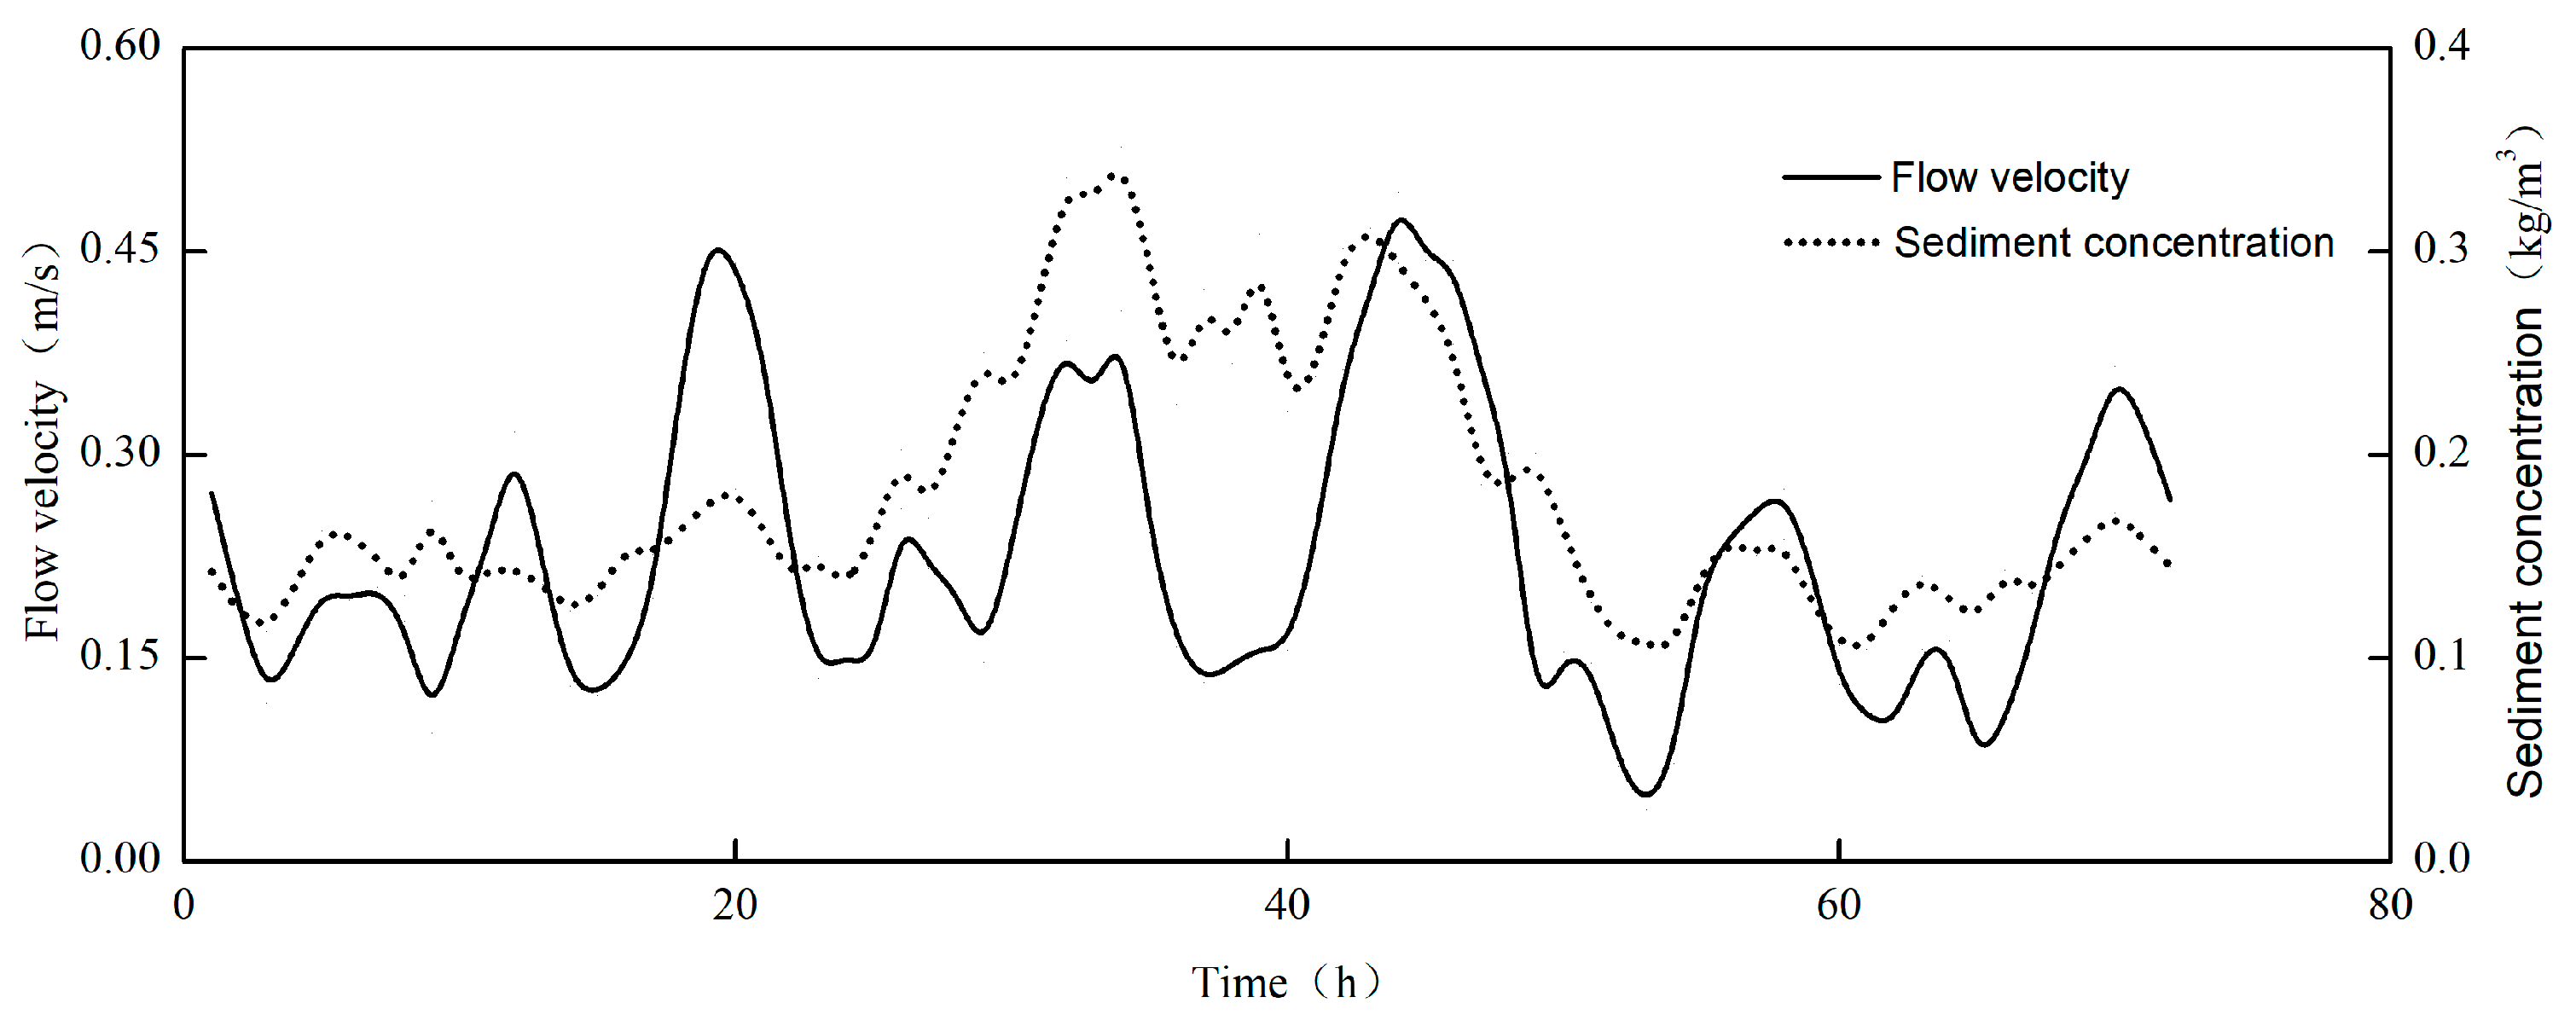
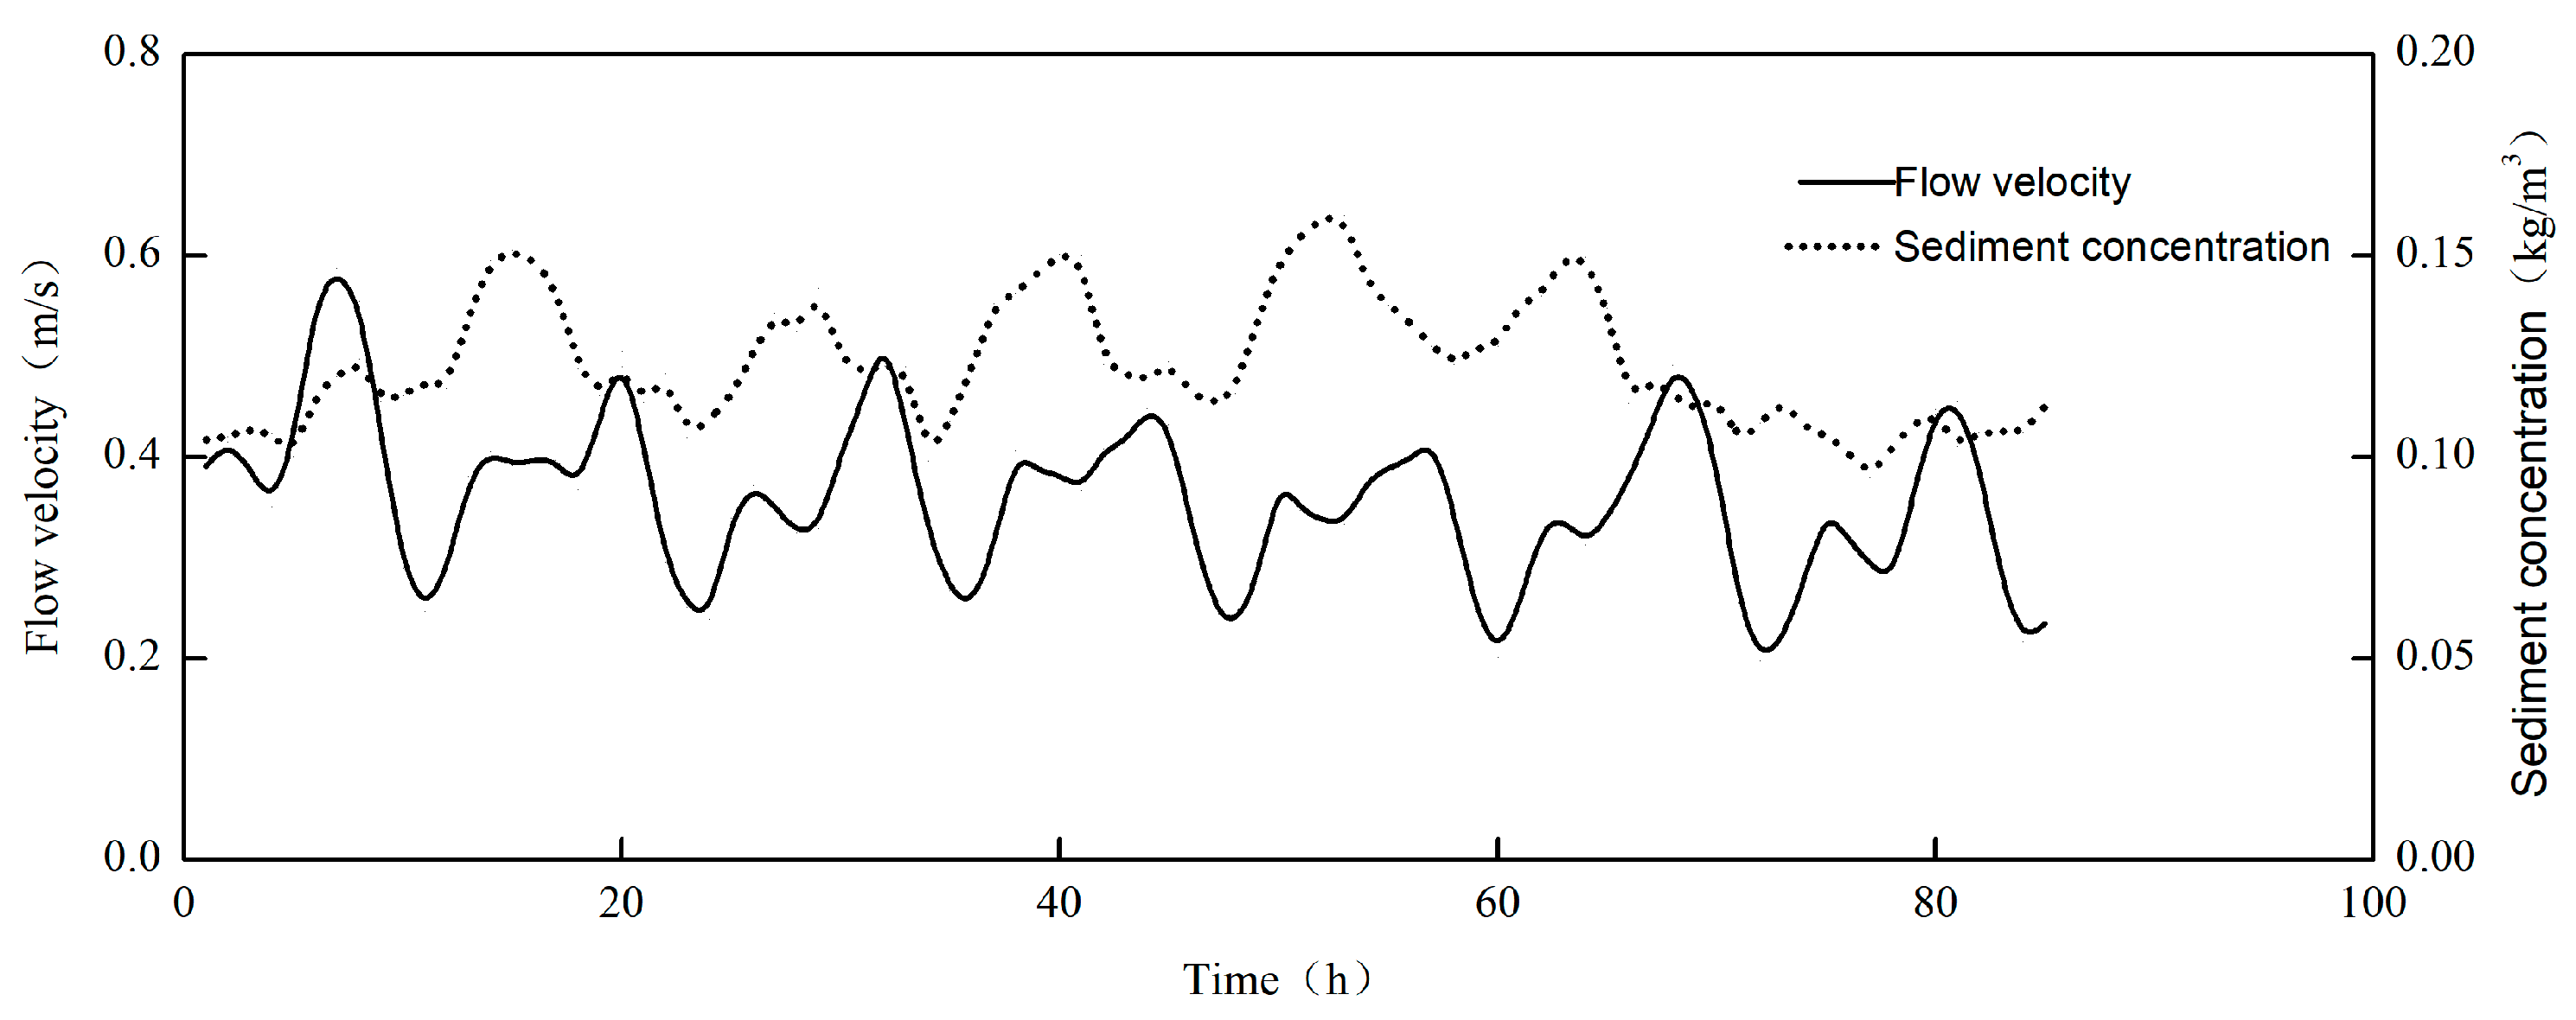
Figure 6, Figure 7, Figure 8, Figure 9, Figure 10, Figure 11, Figure 12, Figure 13 and Figure 14 illustrate the correlation between tidal dynamics and sediment concentration within the Lianyungang sea area under extreme weather circumstances. It can be observed from Figure 6, Figure 7, Figure 8, Figure 9, Figure 10, Figure 11, Figure 12, Figure 13 and Figure 14 that a distinct relationship exists between the flow velocity and sediment concentration. The fluctuation of sediment concentration in water bodies is affected by tidal dynamics, and the peak sediment concentration typically emerges in the vicinity of the maximum flow velocity. The temporal variation in water sediment concentration is governed by tidal hydrodynamic forcing, with sediment concentration peaks generally occurring in proximity to maximum current velocity. However, due to the inertial effect of sediment particles, a pronounced phase lag exists between the peak sediment concentration and peak tidal forcing, resulting in sediment concentration maxima typically occurring 1–2 h after the peak current velocity.

2.3. Correlation Between Sediment Concentration and Wave Dynamics

(1)
Correlation between sediment concentration and wave height response
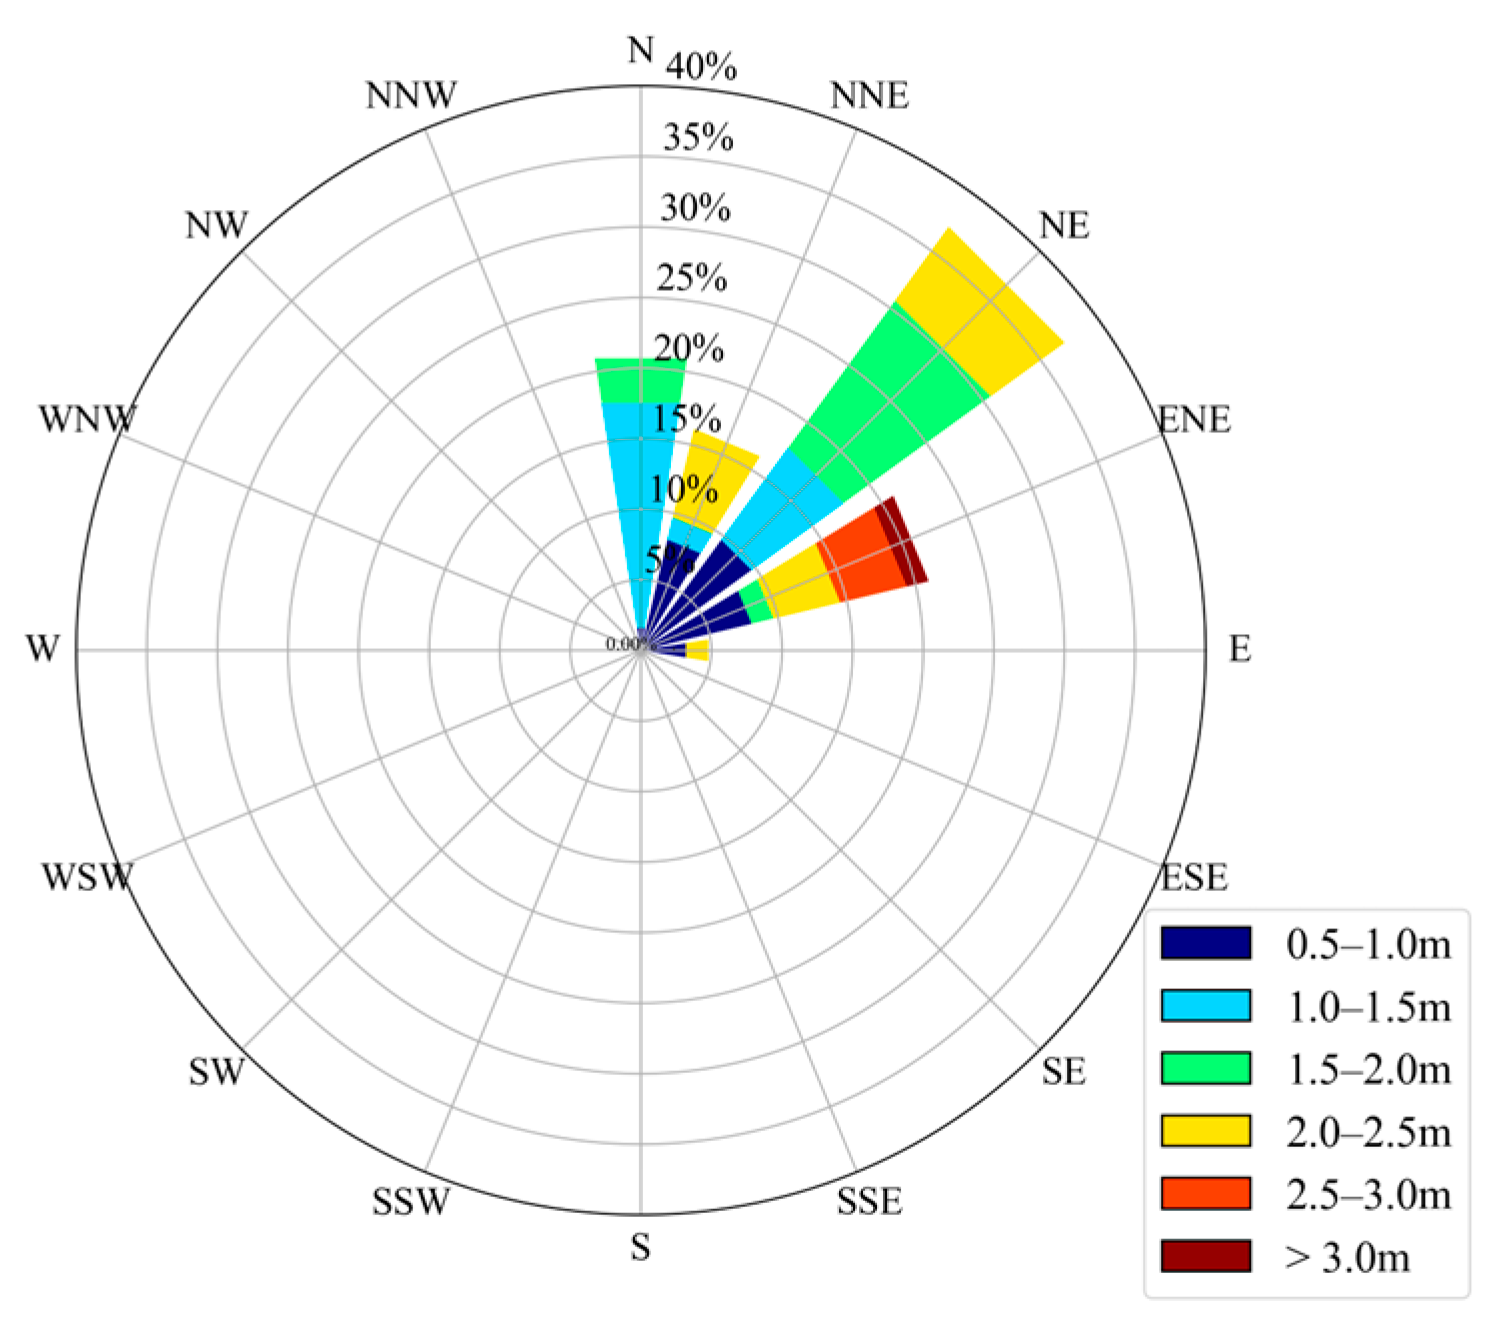
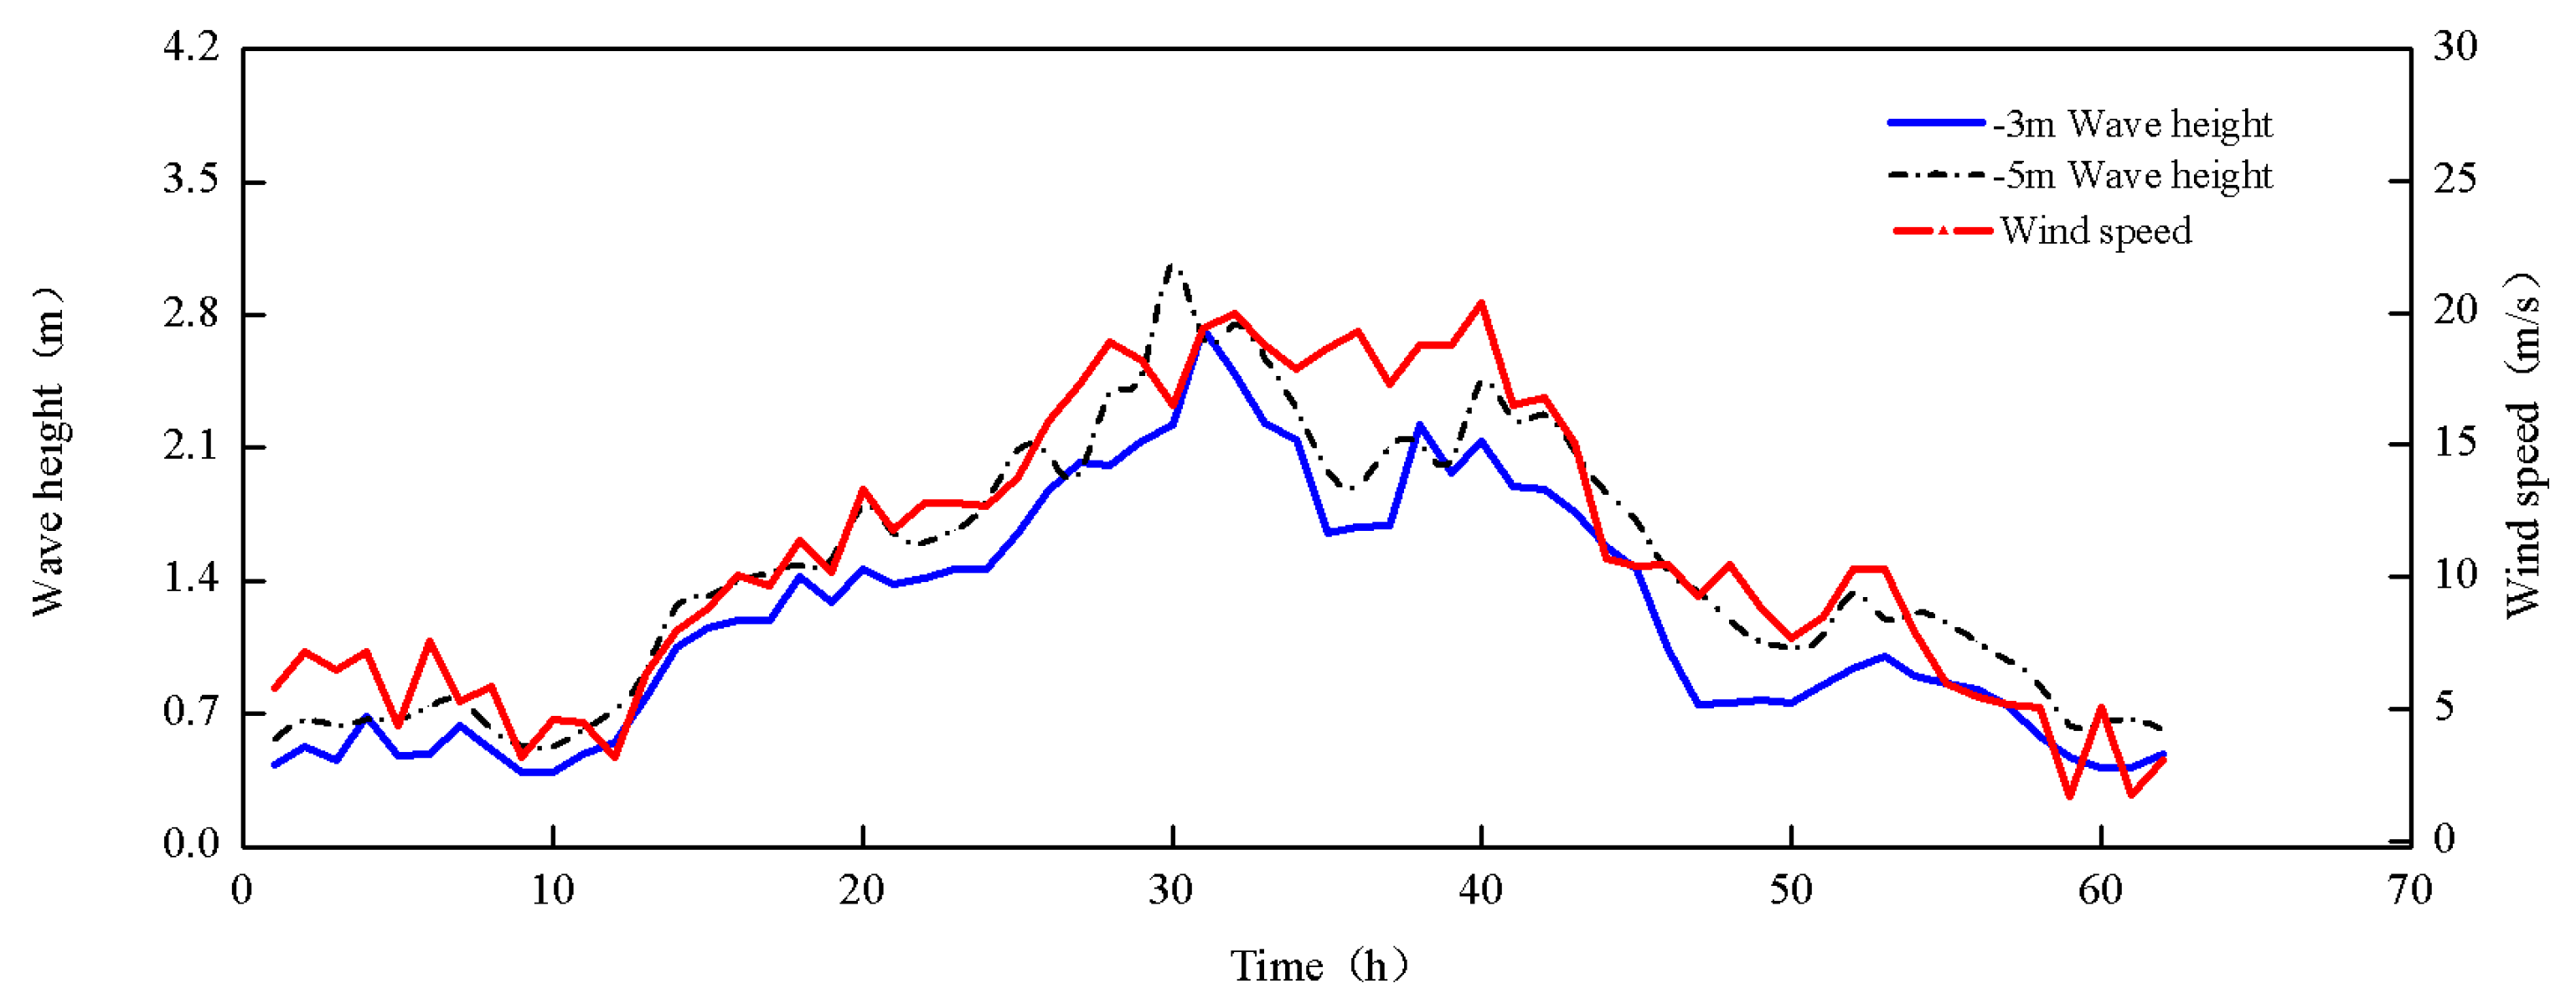
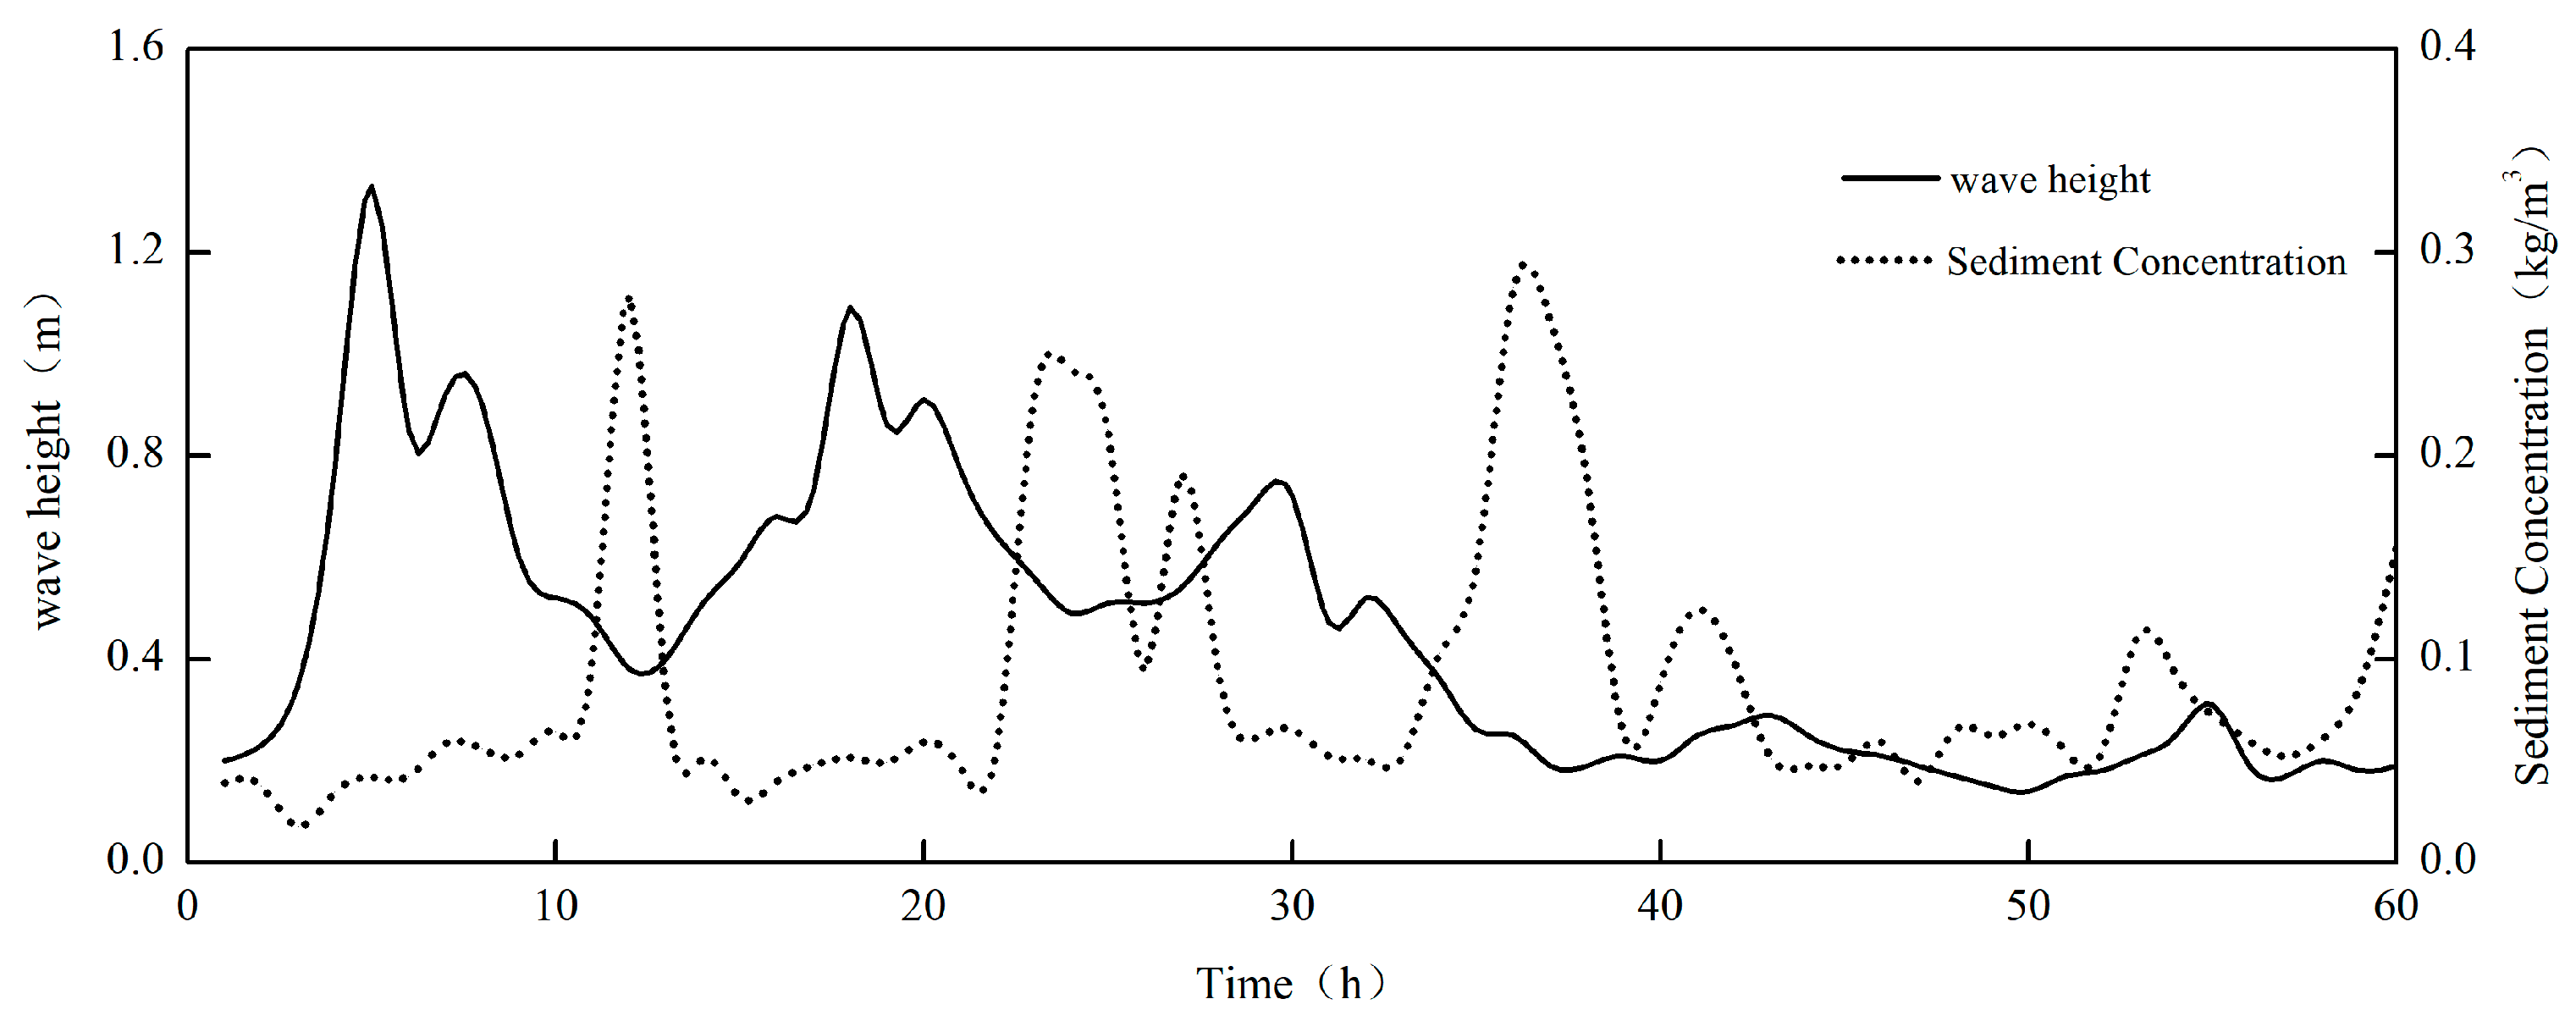
Figure 15, Figure 16, Figure 17, Figure 18, Figure 19, Figure 20, Figure 21, Figure 22, Figure 23, Figure 24, Figure 25 and Figure 26 present the comparison between the instantaneous sediment content and the measured wave height variations in water bodies during September 2007, December 2008, and from August to November 2009. The wave height variations in the silty near-shore area exert a significant influence on the sediment content of the water body. Under the continuous action of wind and waves, the sediment content of the water body increases rapidly. In the continuous hydrological and sediment observations conducted from August to November 2009, the wind speed reached its maximum from 31 October to 3 November. Nevertheless, some observation instruments were damaged during the strong-wind period, and only complete wave and sediment observation data were acquired at −3 m observation point. Figure 15 depicts the relationship between waves and sediment concentration in the Lianyungang sea area from 31 October to 3 November 2009. Figure 16 and Figure 17, respectively, present the wave rose diagram during Typhoon Wipha and the comparative plot of wave parameter variations between adjacent monitoring stations. Analysis of the wave rose diagram reveals a significant concentration in wave direction distribution during the typhoon. During periods unaffected by the typhoon, wave directions were relatively dispersed. However, with the input of typhoon energy, the wave directions converged rapidly and stabilized within the Northeast (NE) to North-Northeast (NNE) sector (approximately 50–80°). It is particularly noteworthy that all extreme wave events (H1/3 > 2.0 m) throughout the observation period were concentrated within this directional sector. As the typhoon system approached and intensified, wave energy accumulated rapidly. The most severe sea state during this event was observed from the night of 19 September to the early morning of 20 September, with a maximum significant wave height of 3.07 m and a corresponding spectral peak period of up to 9.62 s. The subsequent decaying phase was equally rapid, with the significant wave height returning to below 1.0 m by the morning of 21 September. This complete sequence of “gradual increase-sharp increase-peak-decay” typically reflects the forcing effect of a mobile cyclonic system on the local wave field.
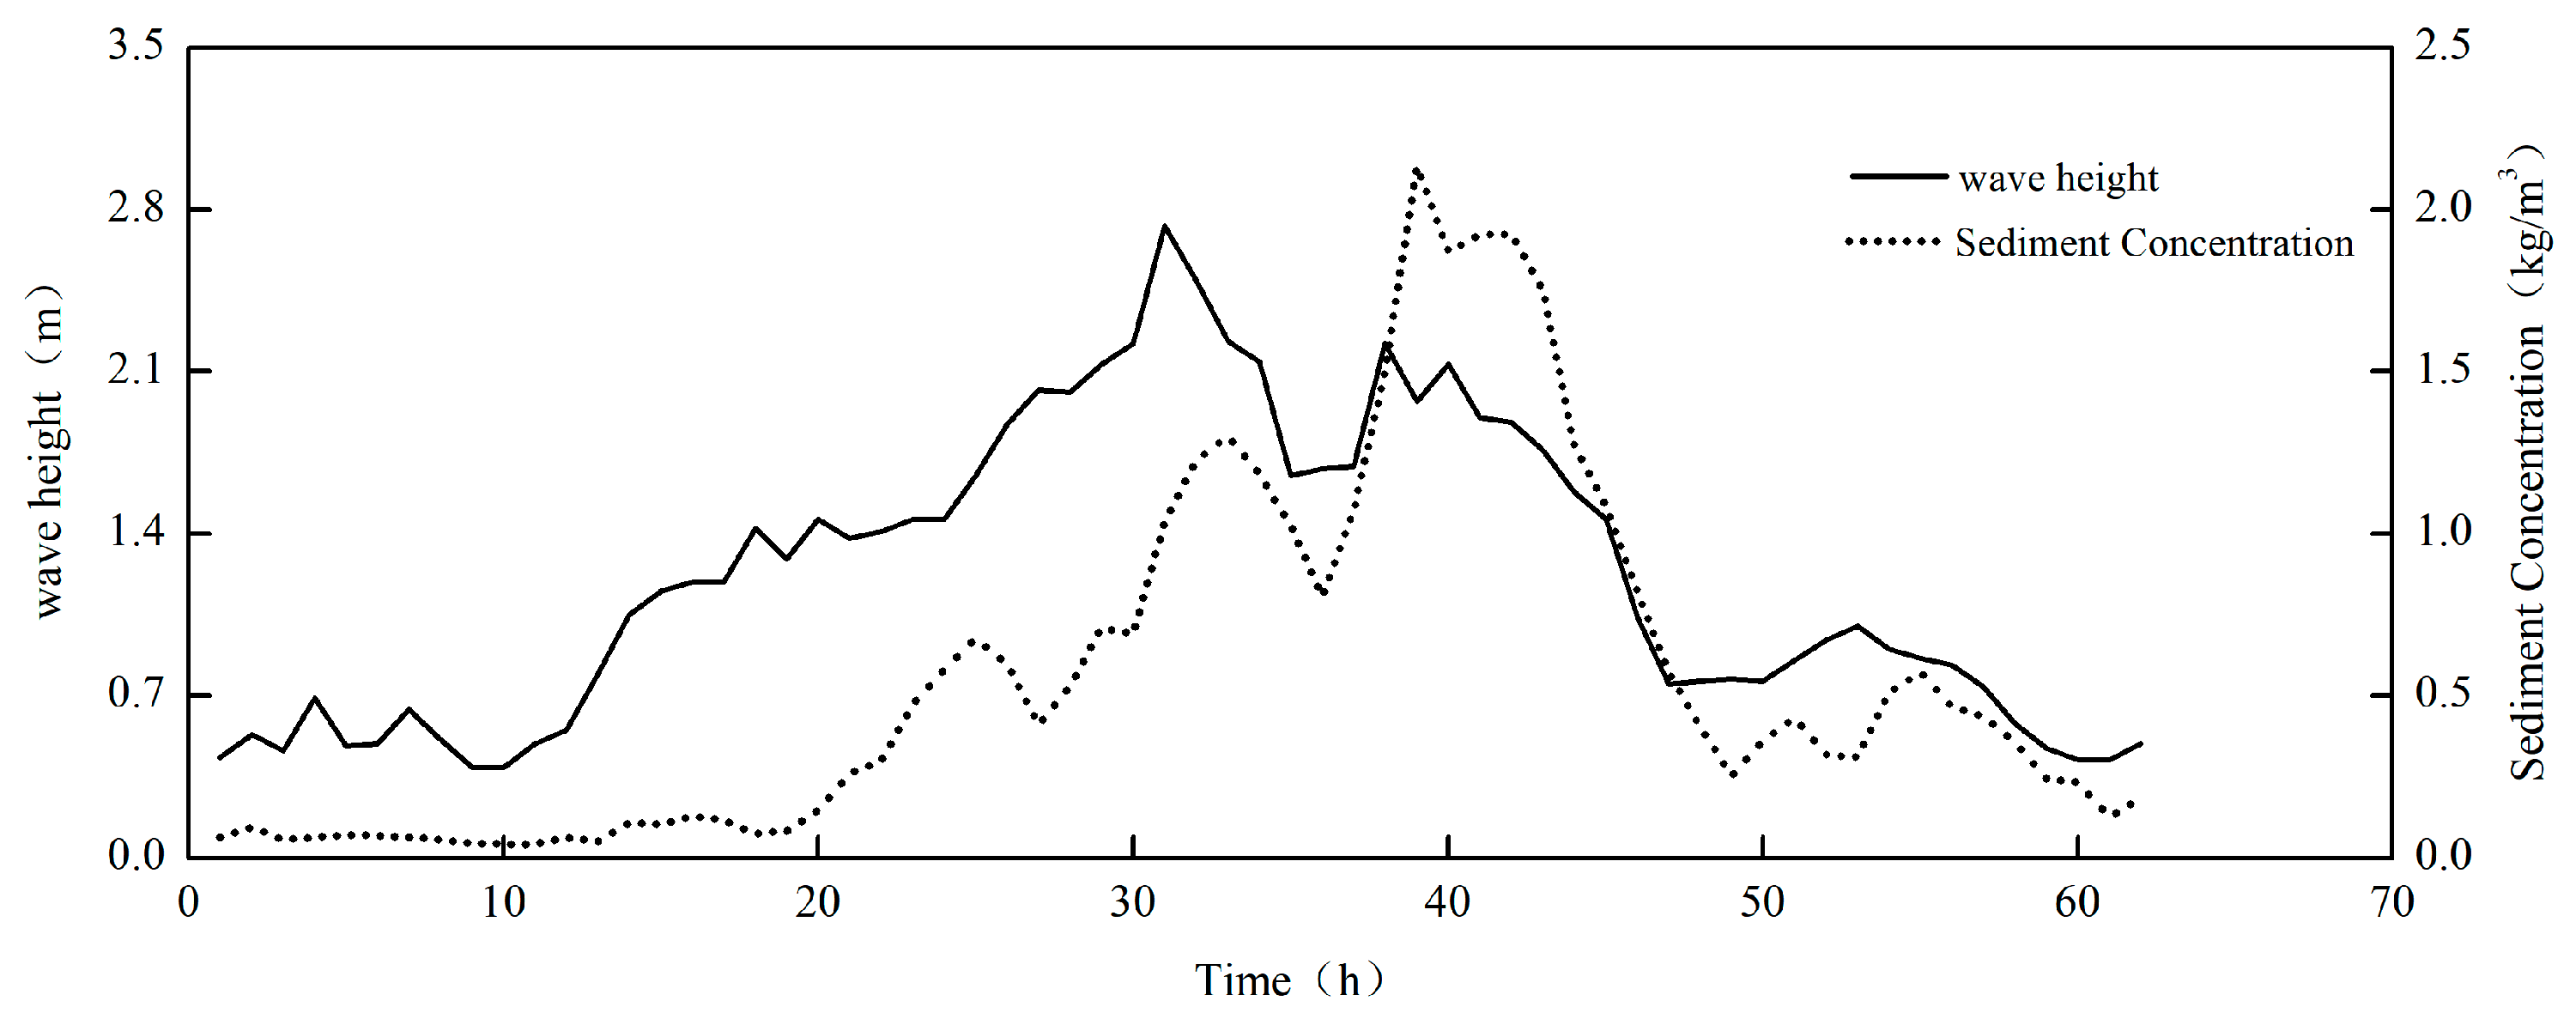
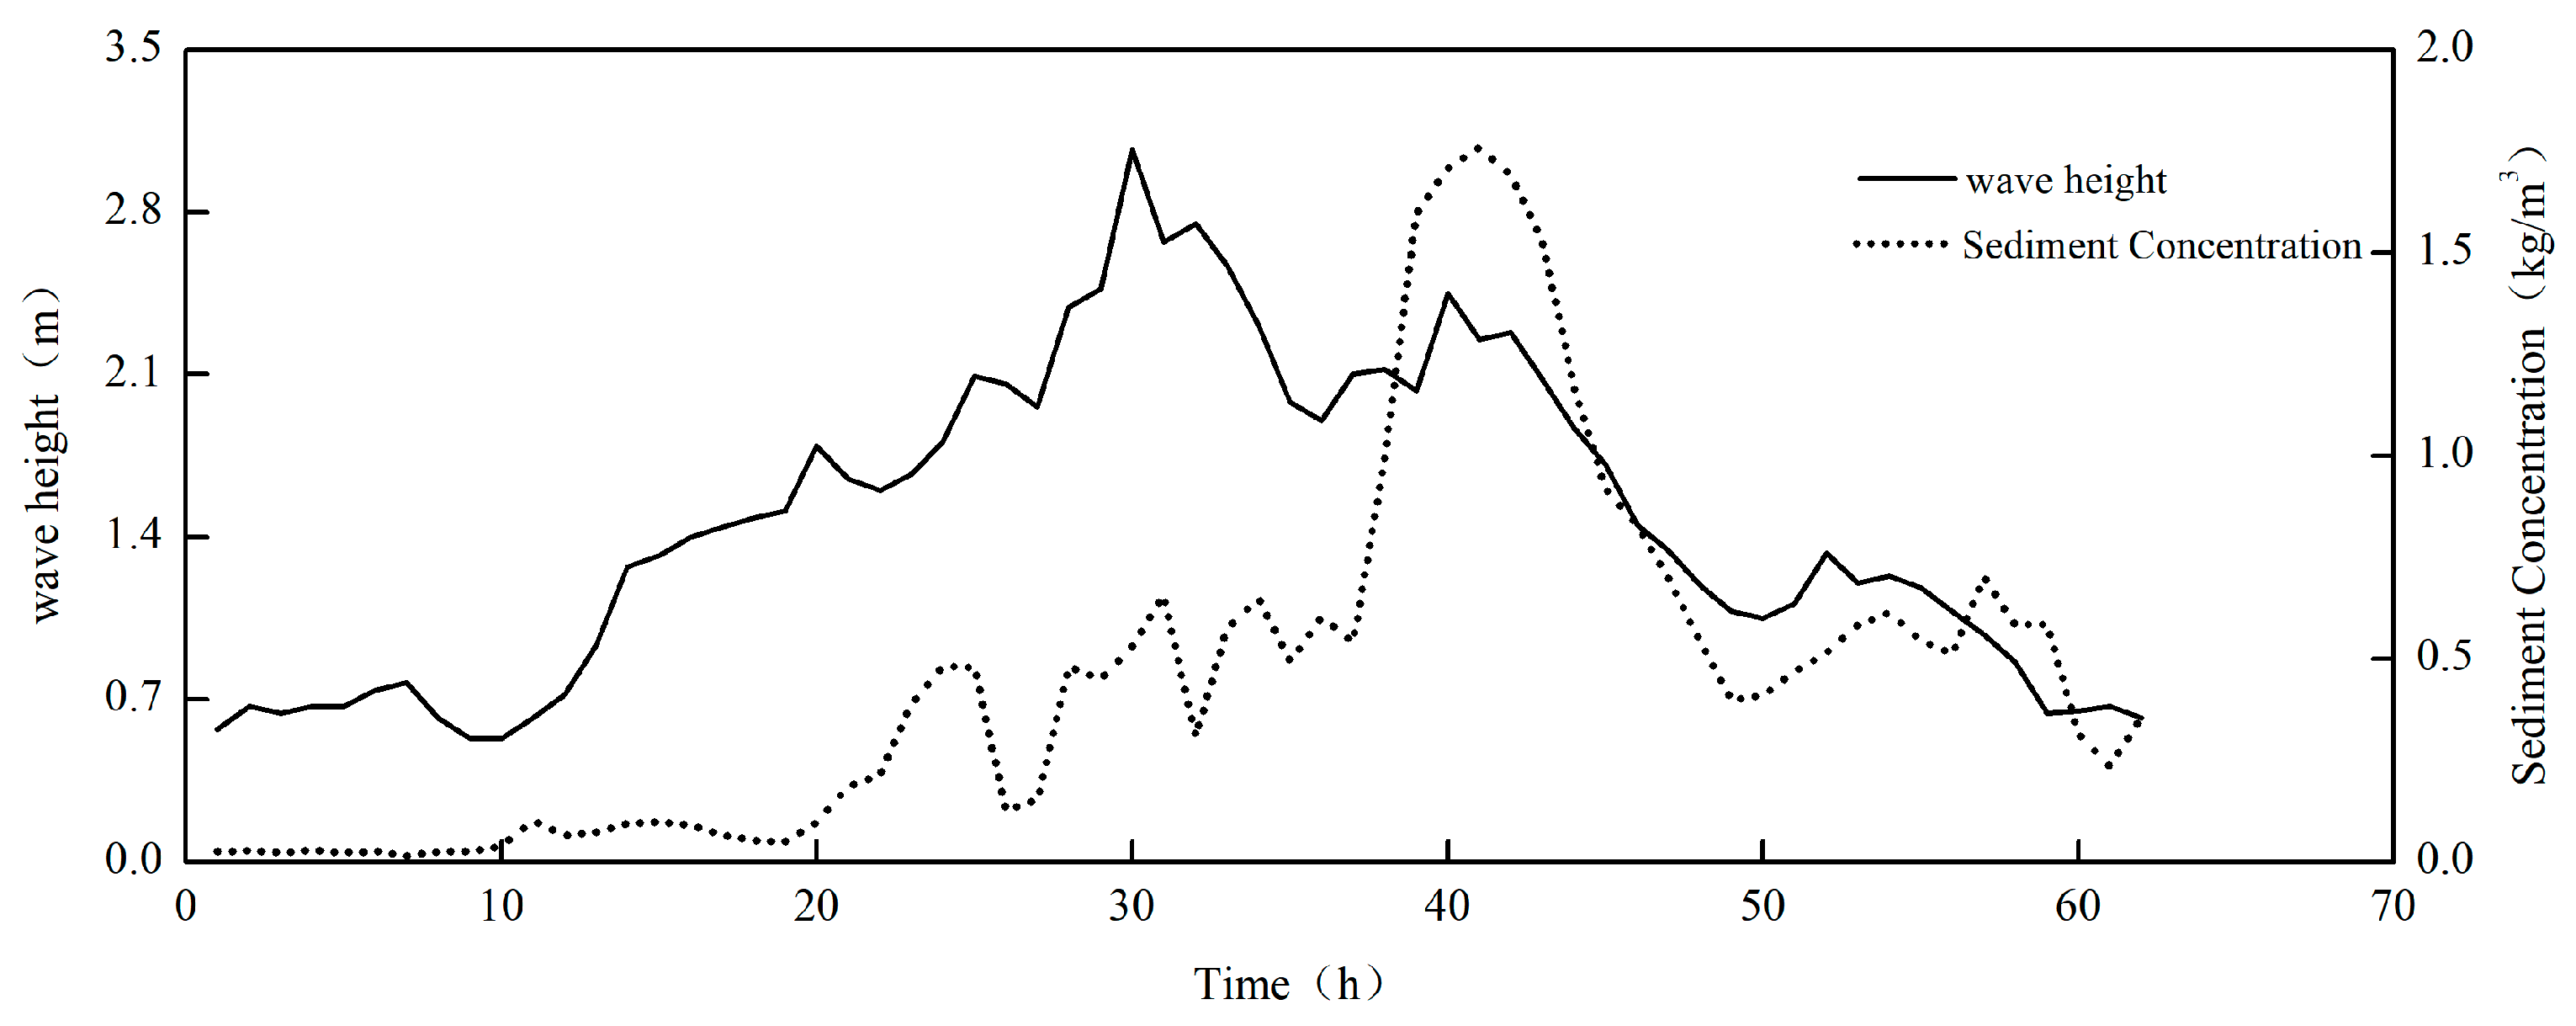
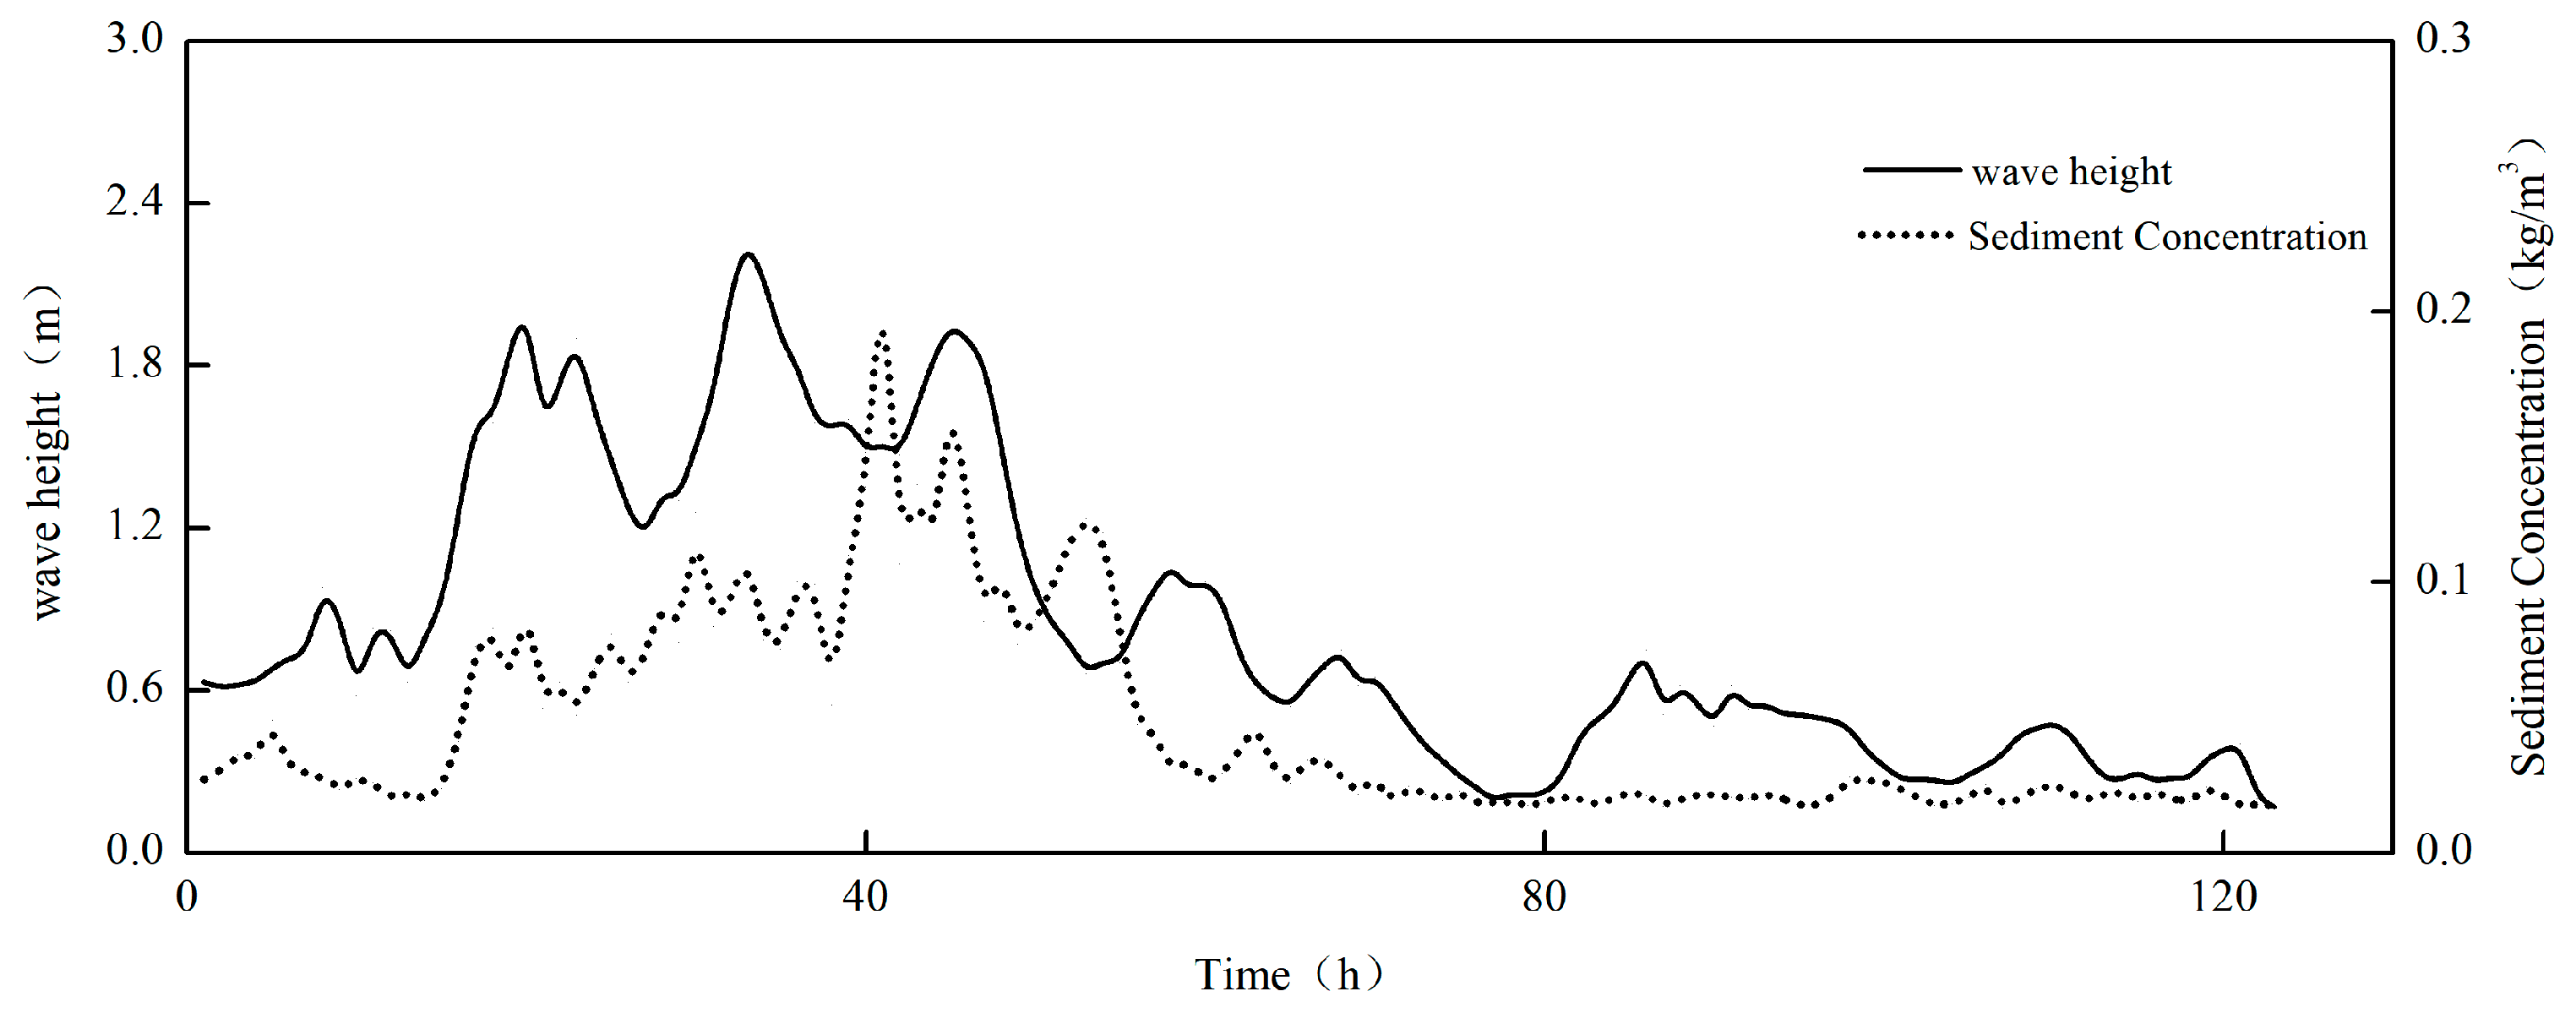
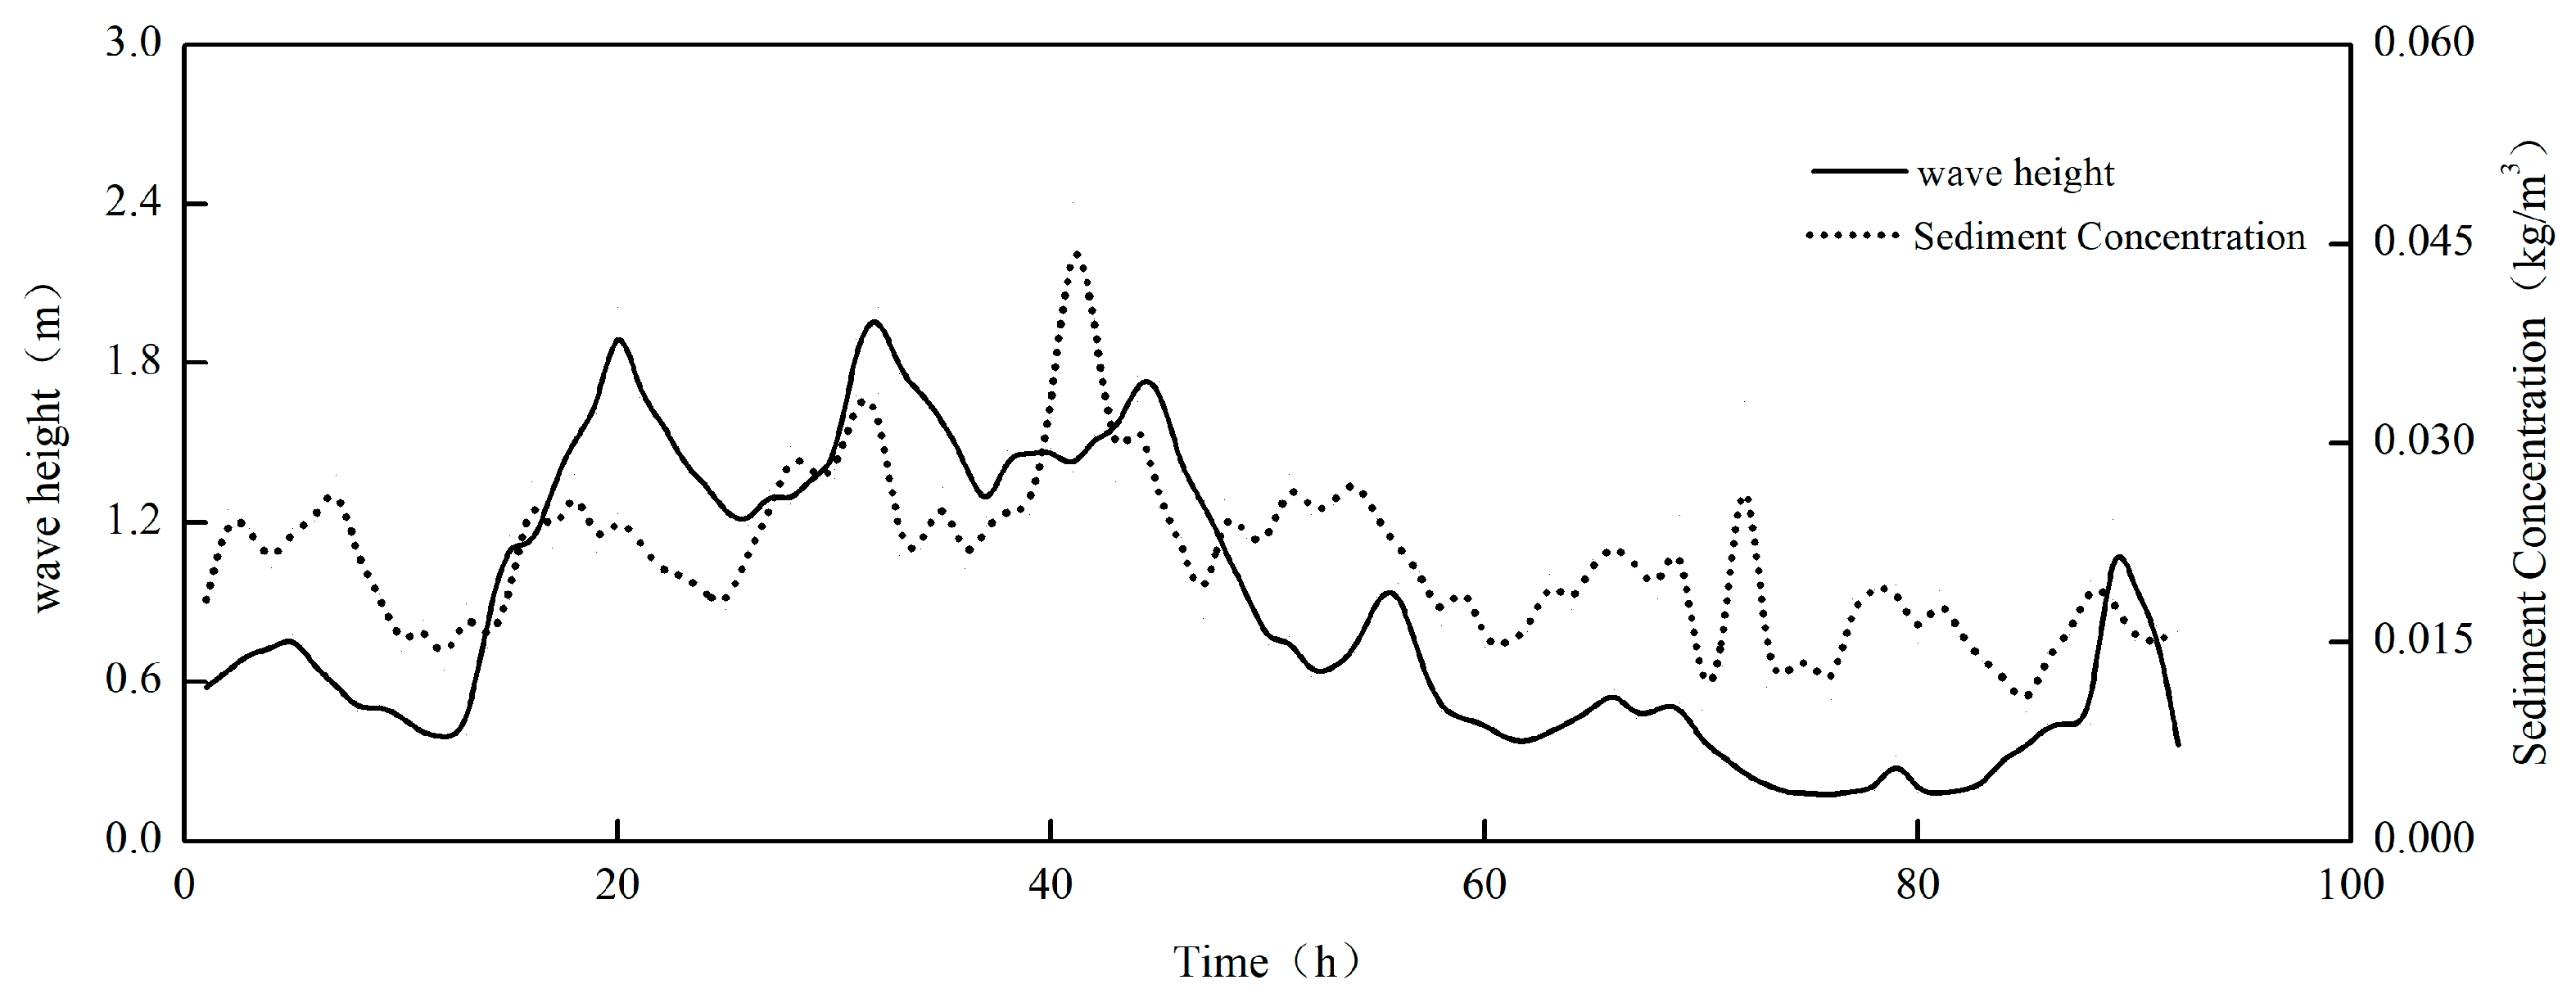
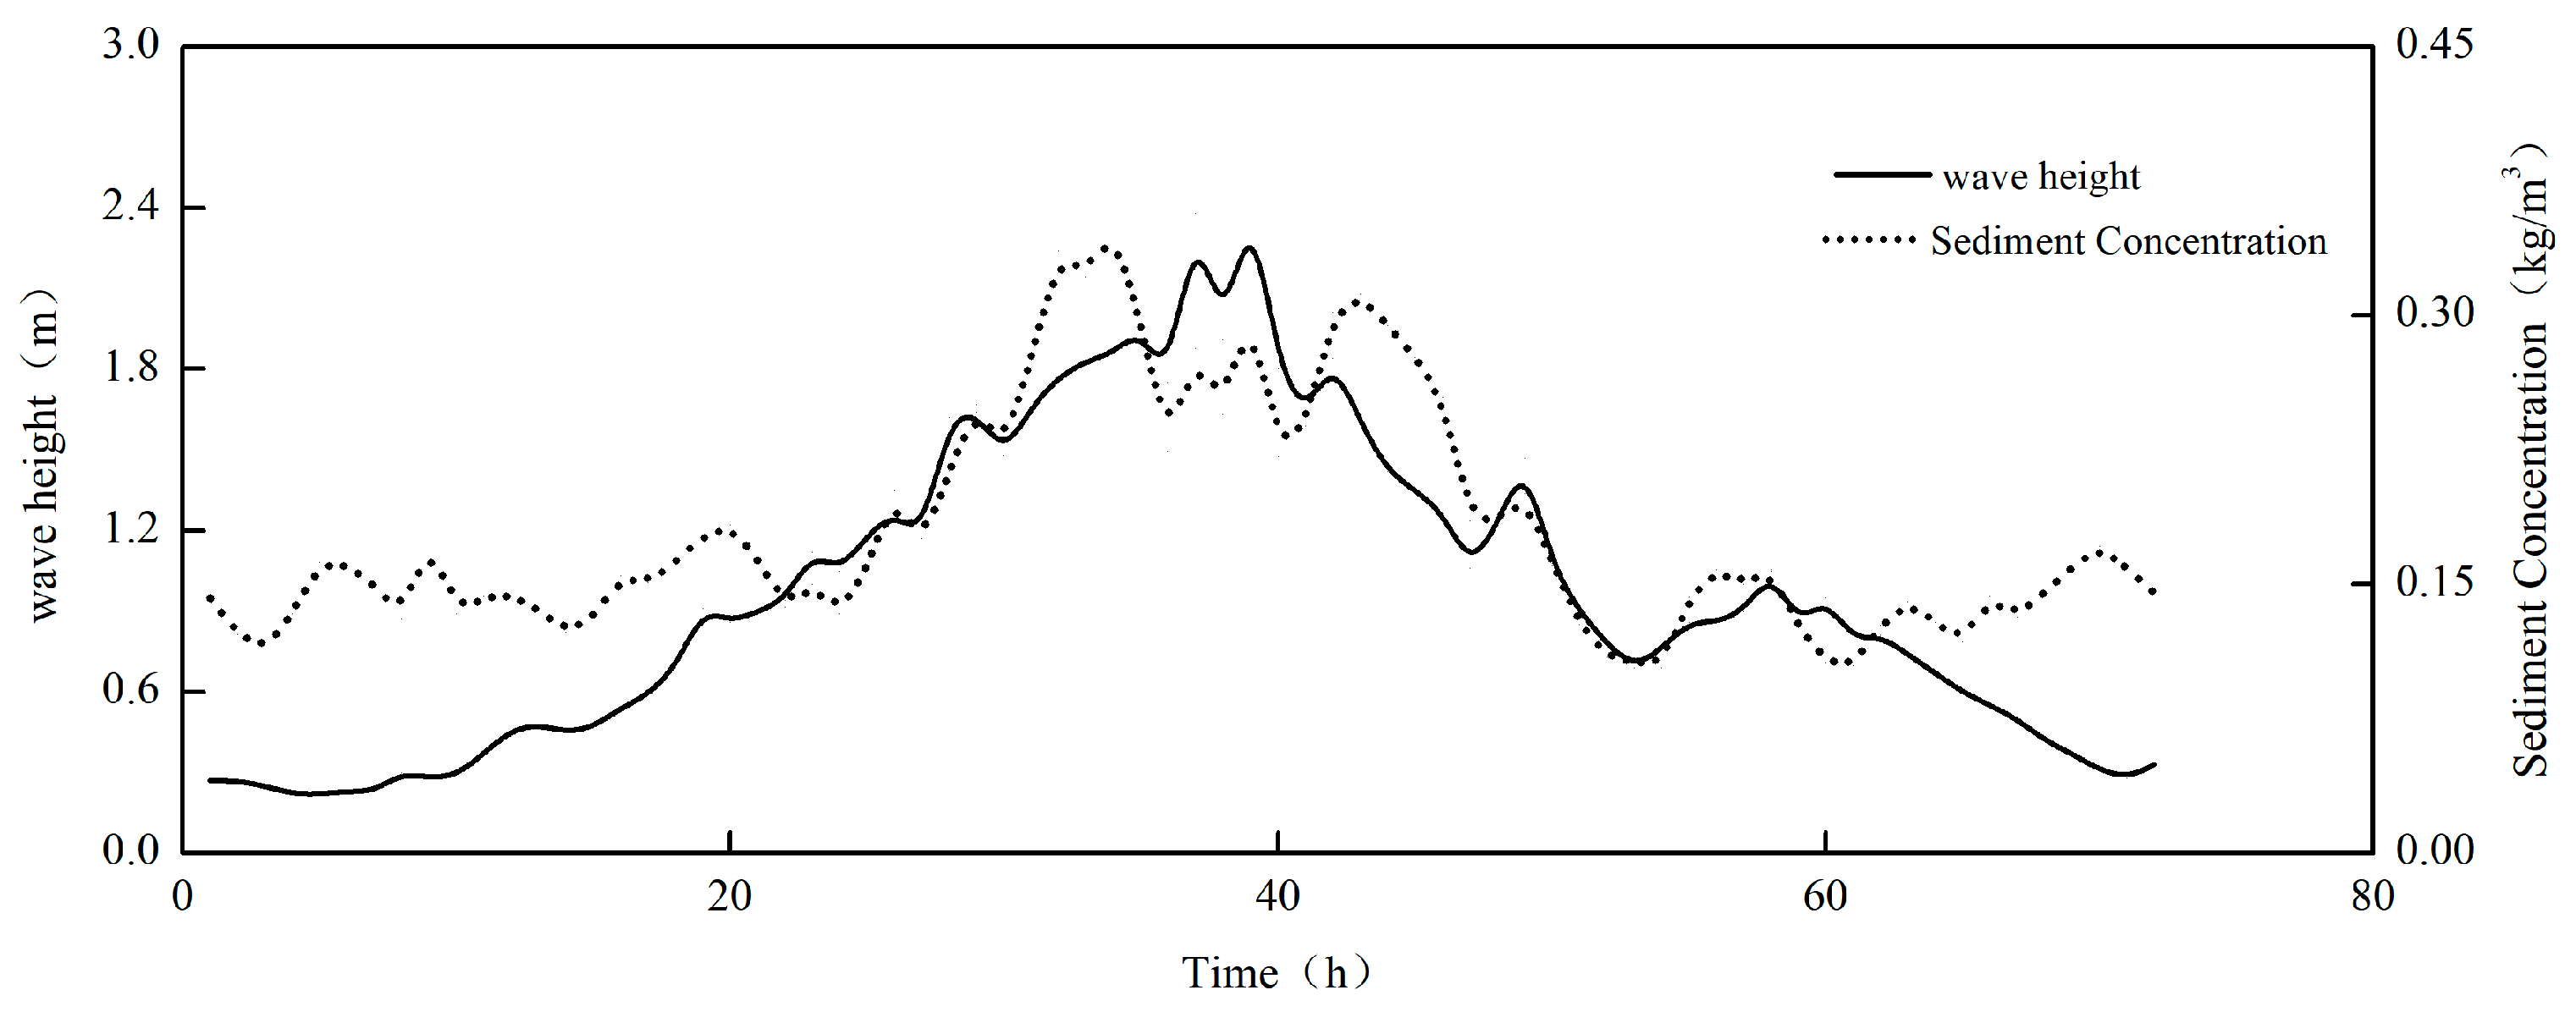
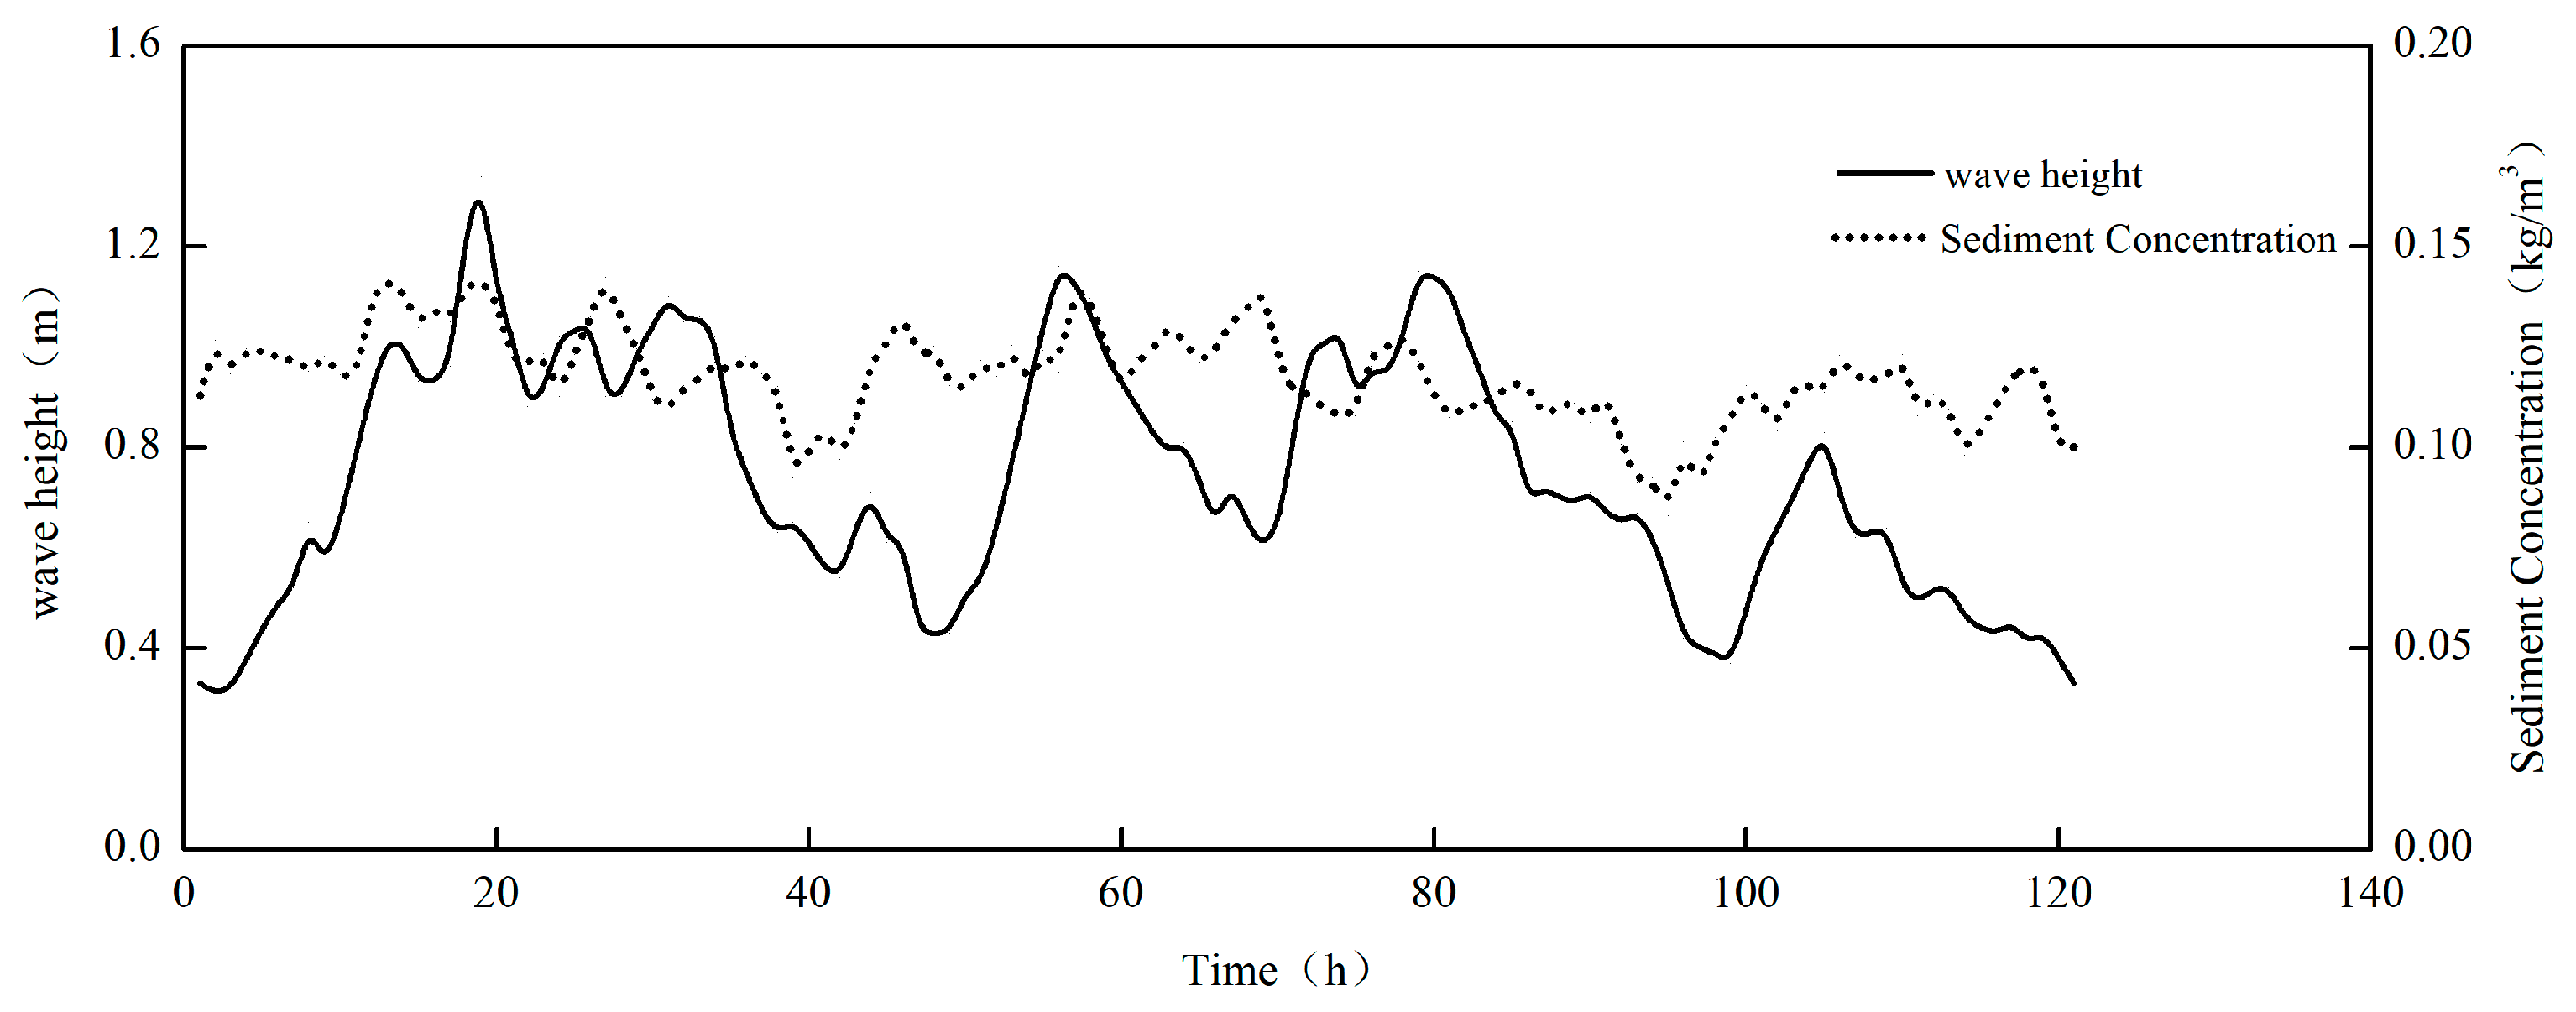
Under normal weather conditions, the wave height in the near-shore waters is approximately 0.5 m, and the vertical average sediment concentration of the water is around 0.2 kg/m3. On 27 October, the peak wave height was 1.53 m, and one hour later, the vertical average sediment concentration reached a peak of 0.26 kg/m3, which is 1.3 times that of a normal day. At 5:00 am on 2 November, the peak wave height was 2.6 m, and two hours later, the peak vertical average sediment concentration of the water body was 0.6 kg/m3, which was three times that of a normal day. During Typhoon Wipha, wave parameters demonstrated a statistically significant positive correlation with depth-averaged sediment concentration. Specifically, the significant wave height (H/3) exhibited the strongest correlation with sediment concentration, with a correlation coefficient of 0.712. The mean wave period (T/mean) also showed a significant positive correlation, yielding a coefficient of 0.598. t-test results confirmed both correlations reached the highest level of statistical significance. These findings provide robust evidence that wave-induced disturbance serves as the primary mechanism driving sediment resuspension in the study area. Increased wave height directly enhances bed sediment agitation, while prolonged wave periods facilitate the maintenance and diffusion of suspended sediments in the water column. Based on the comprehensive analysis of wave-sediment relationships presented in Figure 15, Figure 16, Figure 17, Figure 18, Figure 19, Figure 20, Figure 21, Figure 22, Figure 23, Figure 24, Figure 25 and Figure 26, it can be concluded that under extreme weather conditions, instantaneous sediment concentration shows a positive correlation with wave height. Furthermore, sediment concentration increases rapidly with growing wave height, demonstrating that wave action constitutes the dominant dynamic factor controlling seabed sediment resuspension.
(2)
Correlation between sediment concentration and wave energy dissipation
During typhoon events, the conditions of the sea surface are complex, and in situ measurement data are extremely scarce. In September 2007, during Typhoon Wipha, two temporary observation stations were established at the−3 m and −5 m isobaths in the southern sea area of Lianyungang Port. These stations were set up to acquire observational data on wave characteristics and sediment concentration under typhoon conditions, thereby furnishing fundamental data for analyzing the relationship between wave energy dissipation and sediment concentration along muddy coasts. During Typhoon Wipha, energy dissipation takes place during the wave propagation towards the shore, and there is a significant difference in the measured wave heights at the −3 m and −5 m measurement points (Figure 17). Zhao Zidan et al. [13] proposed that the attenuation rate of wave height in muddy near-shore waters is one order of magnitude higher than that in sandy coasts. When the coastal slope is less than a certain critical slope, wave breaking may not occur, and the bottom friction loss corresponds to the sediment entrainment process. During Typhoon Wipha, the wave height H 1 / 3 difference between the −3 m and −5 m measuring points was approximately 0.3 m, and the distance between the two measuring points was about 3.0 km. The wave height H 1 / 3 attenuation rate was 0.1 m/km, which is in line with the wave attenuation law of muddy coasts [14]. Wave energy dissipation serves as a crucial energy source for the incipient motion of sediment on muddy coasts, and the sediment concentration in the water increases rapidly under strong wind conditions.
Compute the wave energy loss in accordance with the formula proposed by Suhayda J.N. [15]
E = β γ H 2 / T
In the formula, E represents the wave energy loss, γ represents the bulk density of water, T represents the period, β represents a coefficient less than 1. Due to the difficulty in determining the value and the fact that it does not affect the trend of wave energy loss. The variable γ H 2 / T can be directly employed to represent the process of wave energy dissipation.
The Bagnold energy principle [16] gives the energy, E, required to sustain the sediment-carrying capacity and concentration of a water body as:
E * = γ s γ h S * ω γ S
In the formula, E * represents the wave energy loss, h denotes the water depth, S * signifies the sediment-carrying capacity and sediment concentration of the water body, and ω indicates the settling velocity.
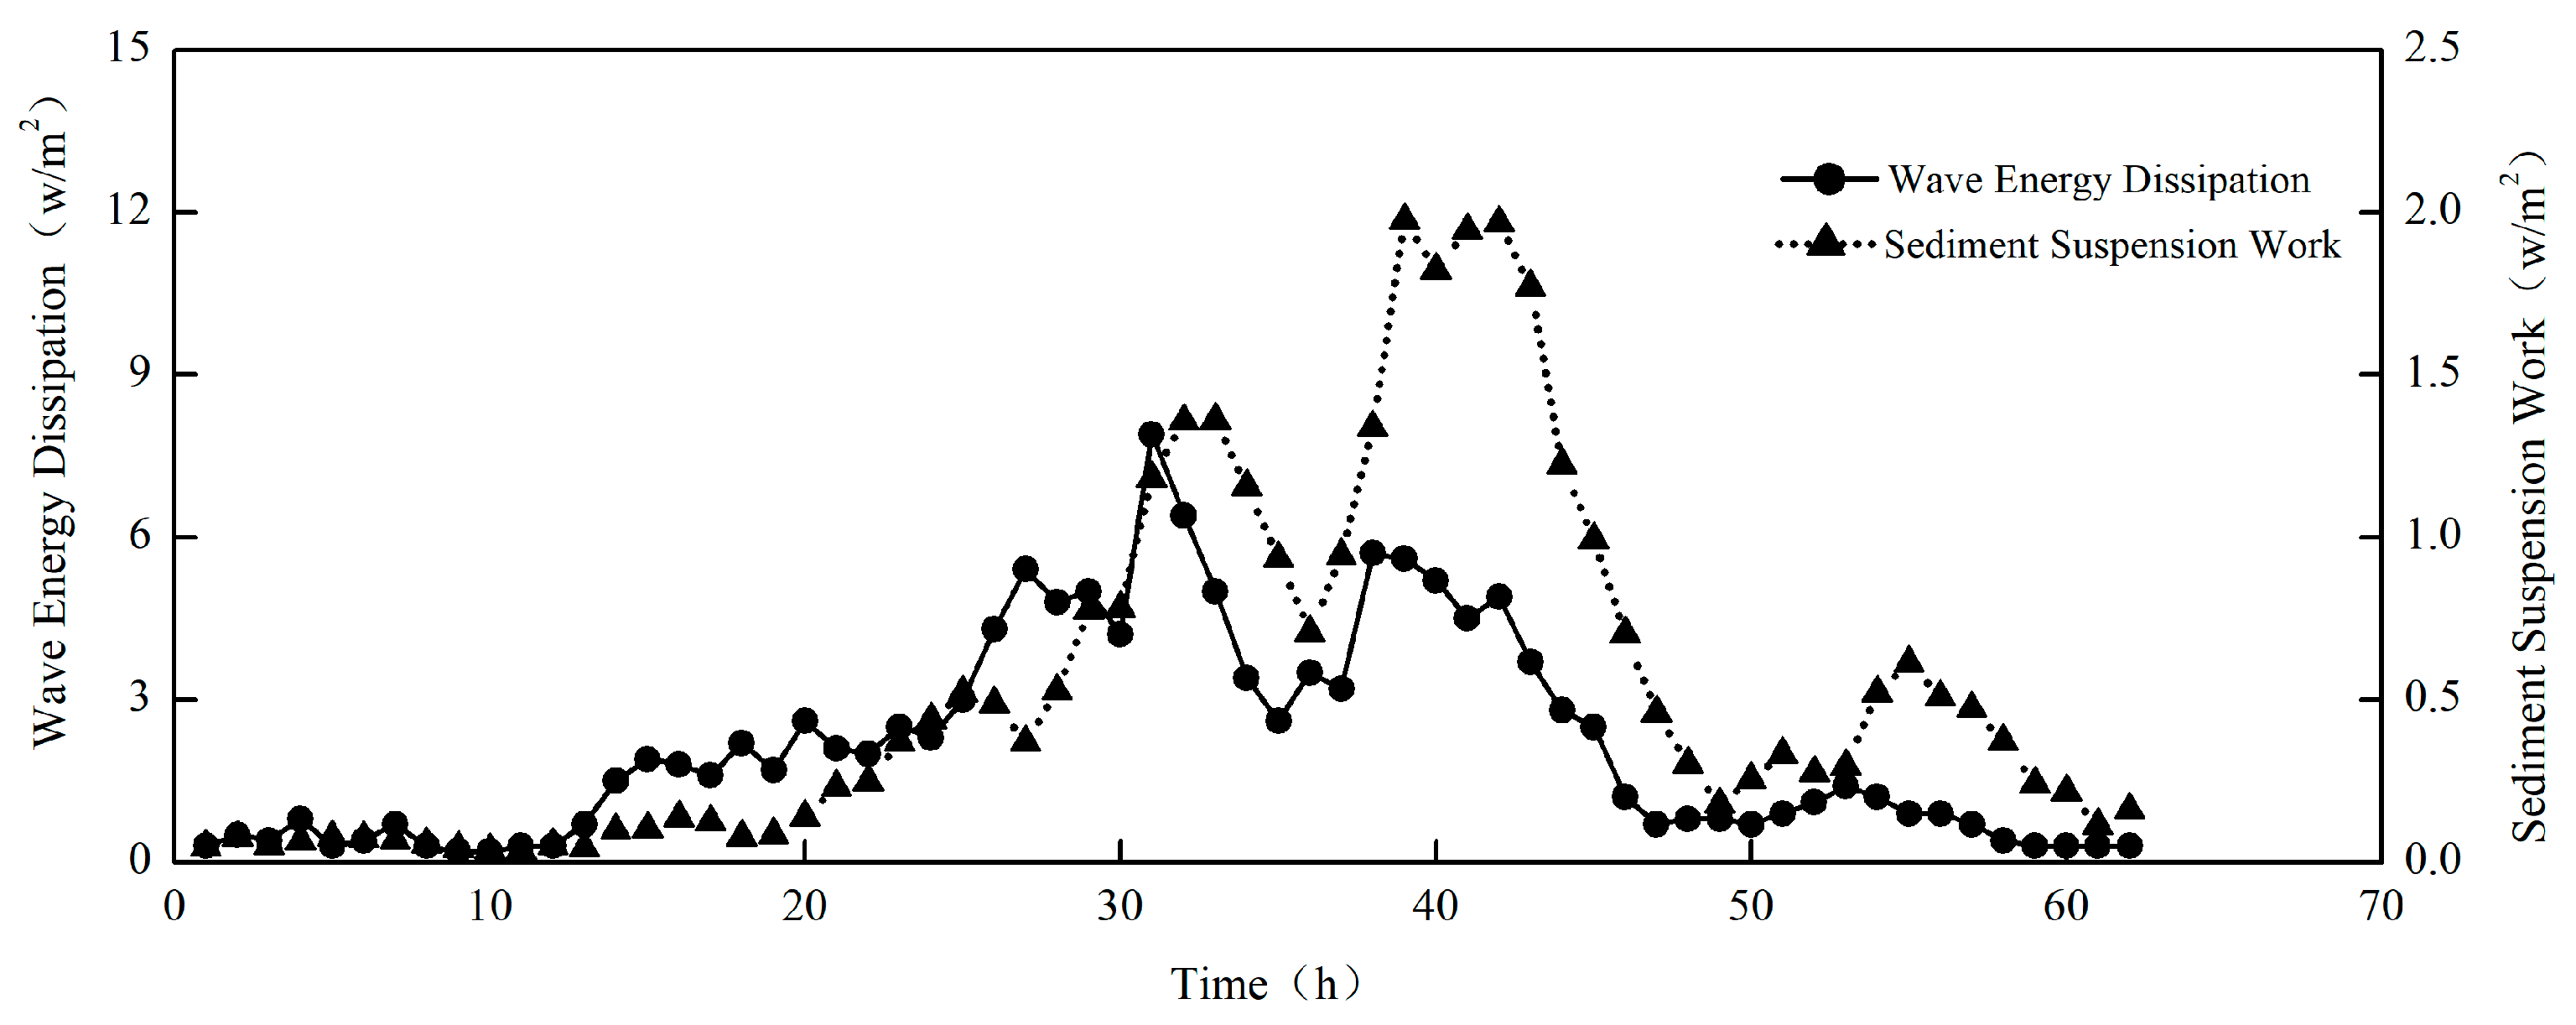
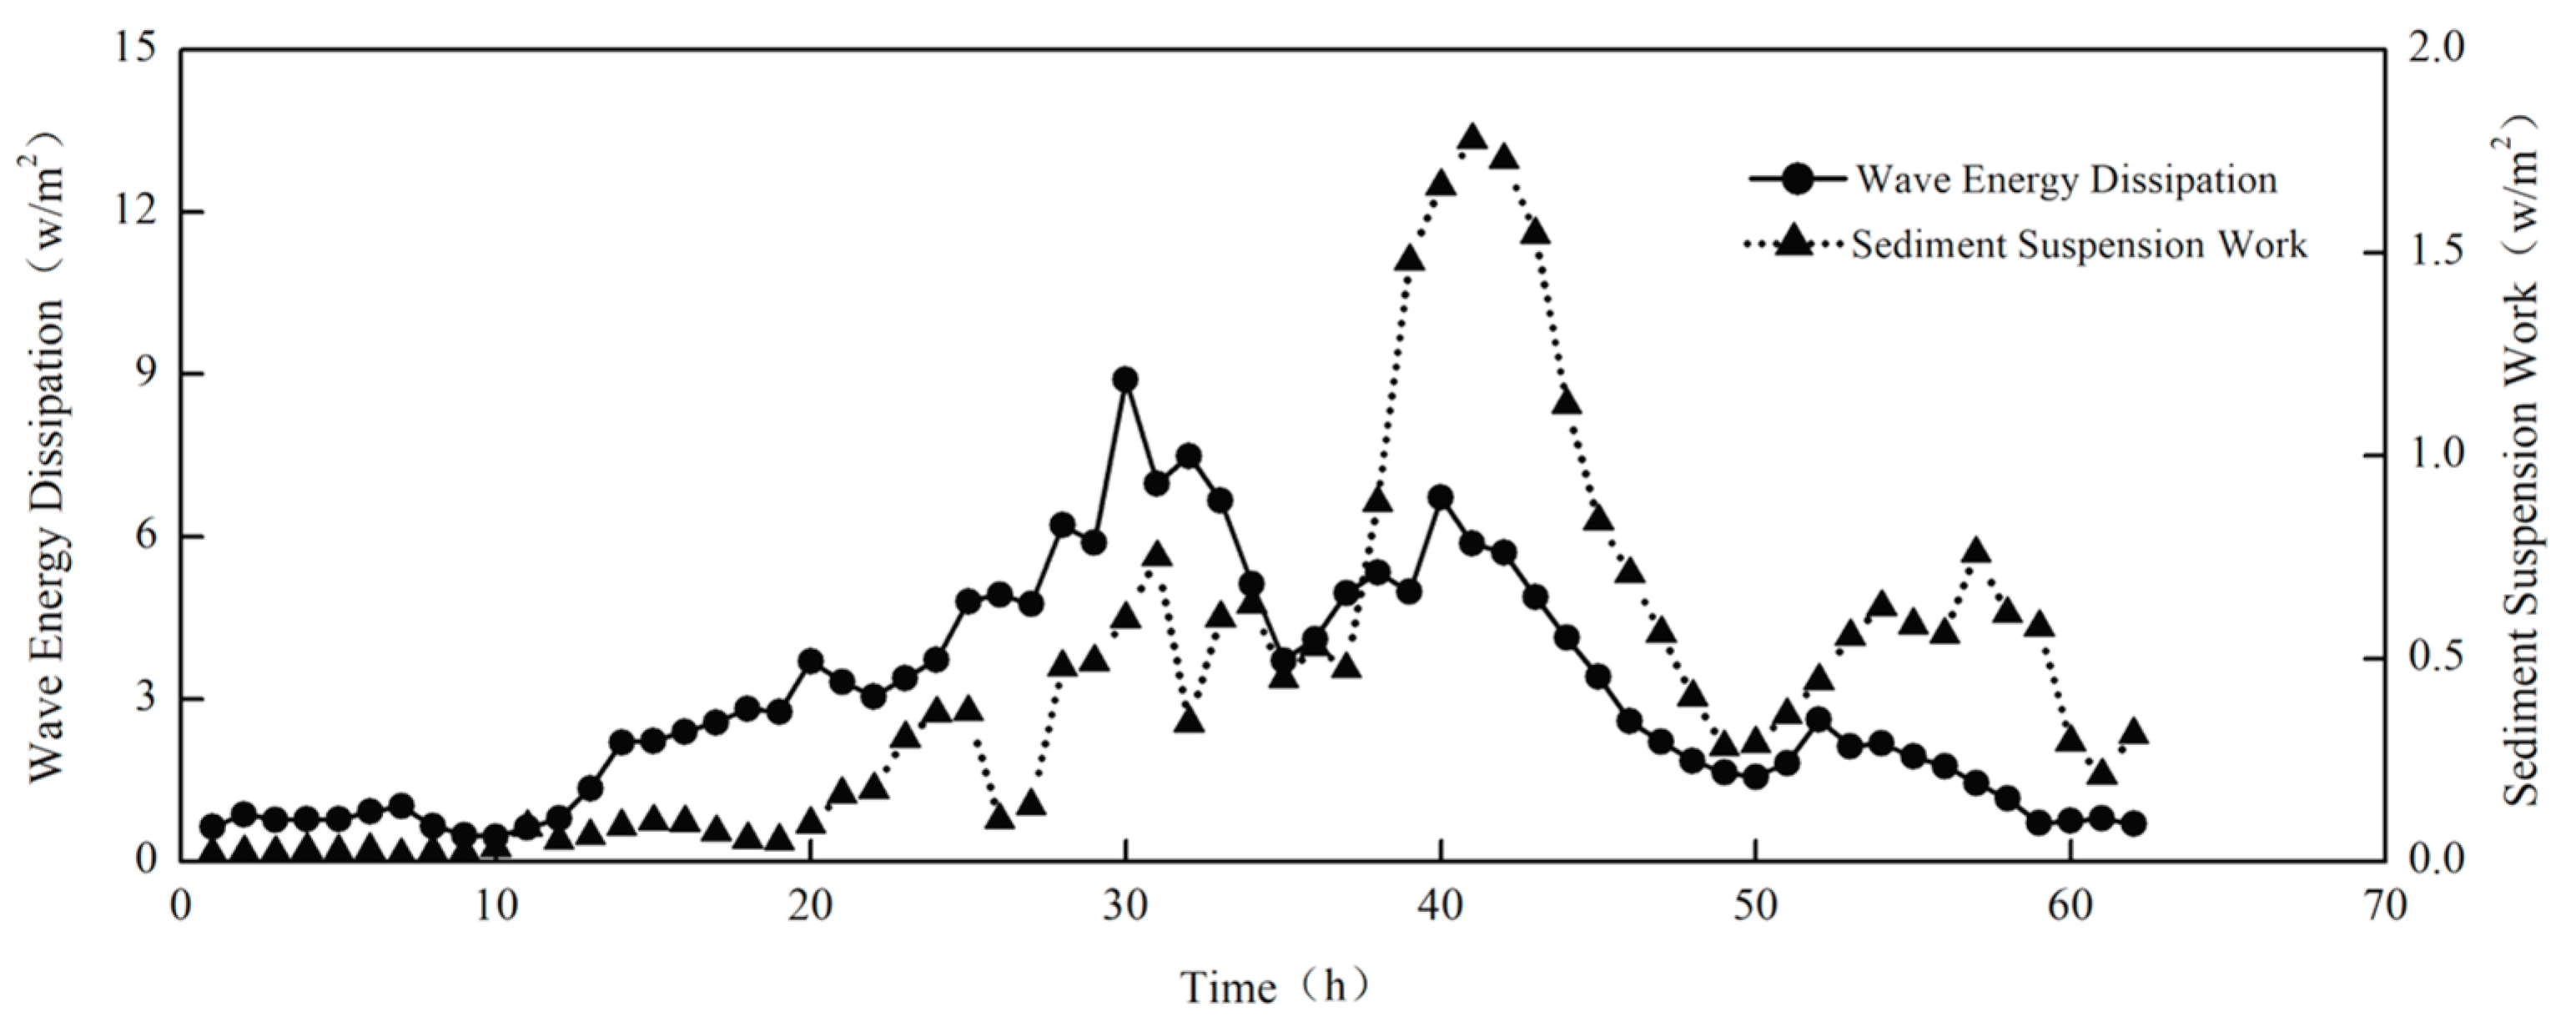
Figure 27 illustrate variation in wave height and wave height difference at −3 m and −5 m observation points during typhoon”Weipa”. Figure 28 and Figure 29 illustrate the correlation between wave energy loss and sediment suspension energy at diverse measuring points during Typhoon Wipha, with the quantity of wave energy loss denoted by γ H 2 / T . Evidently, the wave energy loss at each measuring point is substantially consistent with the distribution tendency of sediment suspension work (the energy consumed by suspended sediment). The energy loss during the on-shore propagation of waves enhances the turbulence capacity of the water [17], resulting in a rapid rise in sediment concentration within the water. The loss of wave energy serves as a crucial energy source for the initiation of sediment in the bottom bed and exhibits a distinct correspondence with the variations in sediment concentration in the water body.
During Typhoon Wipha, two distinct stages of wave energy dissipation were observed in the near-shore waters. In the second stage, although the magnitude of wave energy loss was relatively small, the sediment concentration in the water column was higher than that in the first stage. This phenomenon is associated with the varying degrees of sediment mobilization in the seabed during these two stages. The time interval between the two peak wave energy losses is approximately 8 h. After prolonged hydrodynamic disturbance, liquefaction occurs on the seabed, facilitating the suspension of sediment in the second stage. Typhoon wind speed serves as the key driving factor for variations in wave height and sediment concentration. Both wave height and wave period increase with rising wind speed, with their peaks slightly lagging behind those of wind speed. The first wave height peak of 3.07 m occurred at 23:00 on 19 September, followed by a second peak of 2.45 m at 09:00 on 20 September. Correspondingly, the first sediment concentration peak of 0.66 kg/m3 was observed at 00:00 on 20 September, while the second peak reached 1.76 kg/m3 at 10:00 on 20 September. During the typhoon, the vertically averaged sediment concentration increased sharply, revealing specific spatiotemporal correlations between instantaneous sediment concentration in the water column and the dynamics of waves and tides. The variation in instantaneous sediment concentration demonstrates a significant time lag in comparison to tidal dynamics, with the peak sediment concentration occurring approximately 1–2 h after the rapid fluctuations. There exists a positive correlation between wave energy dissipation and the instantaneous sediment concentration in water, and wave energy is the primary energy source for the incipient motion and suspension of sediment in the bottom bed. When conducting research on the instantaneous sediment concentration in water bodies, it is essential to take into account the phenomenon that the temporal variation in instantaneous sediment concentration lags behind the changes in tidal dynamics, as well as the energy dissipation resulting from wave-induced sand resuspension.

3. Results

3.1. Analysis of Factors Influencing Instantaneous Sediment Concentration

The formulation presented in this study is conceptually derived from the theoretical framework of Liu, J. J.’s [18] renowned sediment-carrying capacity formula for cohesive sediment. During the development of the formula, a critical assumption was made that the seabed is in a state of erosion-deposition equilibrium. Given the practical constraints in obtaining spatially and temporally complex salinity field data and flocculation dynamics parameters, the formula structure does not explicitly incorporate salinity and turbulence mechanisms. For parameter calibration, field observation data (including suspended sediment concentration, flow velocity, water depth, etc.) were employed. These data inherently and systematically encompass the aggregate effects of contemporaneous environmental factors-such as salinity, water temperature, and sediment mineral composition-on the flocculation process. This study focuses on establishing a statistical relationship between the system input variables (depth-averaged flow velocity, water depth) and the output variable (suspended sediment concentration). Consequently, all complex internal mechanisms (e.g., salinity, turbulence, particle characteristics) are effectively and implicitly embedded within the empirical coefficients of the formula. Upon analyzing measured data of waves, currents, sediment, and other factors under extreme weather conditions, it was discovered that the instantaneous sediment concentration in water demonstrates a quasi-periodic (statistical regularity with varying periods and amplitudes) distribution characteristic, which is closely associated with the dynamic conditions of waves and currents. Owing to the complex wave–current dynamic conditions at the site and the incomplete theory of sediment movement, current research primarily concentrates on the relationship between instantaneous sediment concentration and wave–current dynamic elements from the perspective of statistical analysis of measured data. Moreover, other factors, including settling velocity, sediment particle density, and water depth, among others, need to be taken into account. The formula for the instantaneous sediment concentration [19] in water can be presented as:
S s = f ( U , U w , h , ω , γ s , γ , g )
In the formula, S s represents the instantaneous sediment concentration of the water body, U denotes the vertically averaged velocity, U w signifies the average horizontal velocity of the wave water-quality point, h stands for the water depth, γ s represents the particle density, γ denotes the bulk density of the water body, and g is the acceleration due to gravity; ω represents settling velocity.
The investigation of instantaneous sediment concentration in near-shore waters necessitates the consideration of factors including waves, currents, and water depth. Particular attention should be accorded to the impact of wave dynamics under extreme weather conditions. Based on prior research findings, the formulation of the instantaneous sediment concentration formula requires taking into account the energy loss resulting from wave-induced sediment suspension, as well as the time-lag effect arising from the discrepancy between the velocity of sediment particles and the velocity of tidal currents.

3.2. Instantaneous Sediment Concentration in the Context of Tidal Currents

In both domestic and international research, the formula for the sediment-carrying capacity of tidal currents based on the principle of energy balance primarily exists in two forms: U 2 g h or U 3 g h ω [20], which are presented as follows:
S v = M 1 γ s γ γ s γ U 2 g h
S v = N 1 γ s γ γ s γ U 3 g h ω
In the formula, S v represents the sediment-carrying capacity of the water flow, M 1 and N 1 signify undetermined coefficients, U represents the 19. the Vertically averaged velocity, h stands for water depth, γ s represents particle density, γ denotes water bulk density, g represents gravitational acceleration, and ω represents settling velocity.
U 3 g h ω denotes the comparative relationship between turbulence and gravity. Within river water bodies, the water flow typically exhibits a unidirectional pattern, and the sediment particle size is relatively large, necessitating the consideration of the influence of gravity. U 3 g h ω comprehensively reflects the dynamic factors influencing the transport of suspended sediment and finds extensive application in inland water bodies.
Muddy coasts consist of viscous fine sediment particles, which are inclined to undergo flocculation and sedimentation during the suspended sediment deposition process. The settling velocity is typically denoted by the settling velocity of flocs with an equivalent particle size of 0.03 mm, this paper adopts the classical approach of Liu, J. J., setting the sediment settling velocity ω = 0.0008 m/s [18]. U 2 g h represents the ratio of kinetic energy to potential energy, which reflects the sediment-carrying capacity of near-shore waters. Consequently, the U 2 g h form has been extensively employed in the research on the sediment-carrying capacity of muddy coasts [20].
The sediment transport capacity denotes the sediment concentration corresponding to the spatiotemporal average hydrodynamic conditions of the flow, rather than the measured instantaneous sediment concentration. When the sediment model lacks data on the instantaneous sediment concentration at the boundary, Li, R. [19] substitute the measured instantaneous flow velocity for the average tidal velocity and utilize the sediment transport capacity formula to calculate the instantaneous sediment concentration. Nevertheless, this approach overlooks the time-lag effect between the variation period of the instantaneous sediment concentration in the water body and tidal dynamics, and there exists a certain discrepancy between the calculated results and the actual sediment concentration. Under extreme weather conditions, this discrepancy will further expand.
Based on the above discussion, a formula for the instantaneous sediment concentration in silty coastal waters under tidal currents is established using the S v = M 1 γ s γ γ s γ U 2 g h form [20]. Taking into account the time-lag effect between the variation period of the instantaneous sediment concentration in the water body and the tidal dynamics, Equation (4) is re-written as follows:
S v s = M 1 γ s γ γ s γ U v s 2 g h
In the formula, S v s denotes the instantaneous sediment concentration under the influence of tidal currents, M 1 represents the undetermined coefficient, U v s signifies the corrected water flow velocity, and h stands for the water depth.
Concerning the revised water flow velocity U v s and the velocity change rate U t , it can be formulated as follows [21]:
U v s = U U v l
In the formula, U v l denotes the lag velocity proposed to account for the phenomenon where the instantaneous sediment concentration in water lags behind the temporal dynamic changes in the tidal current. U v l = M 2 U t T , T signify the tidal cycle, and M 2 represents the undetermined coefficient.
Substitute Equation (7) into Equation (6) to derive the revised formula for calculating instantaneous sediment concentration:
S v s = M 1 γ s γ γ s γ ( U M 2 U t T ) 2 g h

3.3. Instantaneous Sediment Concentration in the Presence of Wave Action

Wave dynamics exert a significant influence on the initiation and suspension of seabed sediment under extreme weather conditions. Commencing from the principle of energy balance, scholars have employed the method of dimensional analysis, in conjunction with the characteristics of viscous fine sediment particles, to derive the formula for wave sediment carrying capacity on muddy coasts. This formula has been calibrated and validated using a substantial amount of measured hydrological and sediment data from Lianyungang and Tianjin ports. The formula is presented as follows [18]:
S w = M 3 γ s γ γ s γ U w 2 g h
In the formula, S w denotes the sediment-carrying capacity under wave action, M 3 represents the undetermined coefficient, h signifies the water depth, and U w indicates the average horizontal velocity of wave water quality points [19].
U w = 0.2 H h C
In the formula, the variable H denotes wave height, while the variable C denotes wave velocity.
Wave power serves as the primary driving force for sediment initiation in muddy near-shore waters. A significant correlation exists between the instantaneous sediment concentration and the time-varying characteristics of wave energy. When formulating the expression for instantaneous sediment concentration under wave action, the energy loss process resulting from wave-induced sediment suspension must be taken into account. Rewrite Equation (9) as follows:
S w s = M 3 γ s γ γ s γ U w s 2 g h
In the formula, S w s denotes the instantaneous sediment concentration under the influence of waves, M 3 represents the undetermined coefficient, U w s represents the corrected average horizontal velocity of the wave, and h denotes the water depth.
The corrected mean horizontal velocity of waves is associated with the energy dissipation resulting from wave-induced sediment suspension, and its formulation is presented as follows [21]:
U w s = U w U w l
U w l represents the loss induced by waves lifting sand, which is correlated with the wave initiation speed U w c , U w l = M 3 U w c , U w c = 0.2 H c h C . H c denotes the initiation wave height. The formula for calculating the initiation wave height of sediment on muddy coasts is presented as follows [22]:
H c = 0.12 ( L d ) 1 / 3 L sinh ( 2 k h ) π g ρ s ρ ρ g d + 0.02 ( d d 0 ) 0.5 2.56 d
In the formula, L and k denote wavelength and wave number, respectively; h represents the water depth; d signifies the particle size of sediment; d 0 stands for the specific particle size of sediment, which is set as 0.015 mm; ρ s and ρ represent the density of sediment particles and the density of water, respectively.
Consequently, by substituting Equation (12) into Equation (11), the formula for calculating the instantaneous sediment concentration under wave action can be derived, which is as follows:
S w s = M 1 γ s γ γ s γ ( U w M 3 U w c ) 2 g h

3.4. Research on Instantaneous Sediment Concentration Under the Combined Effect of Waves and Currents

3.4.1. Formula Establishment and Parameter Calibration

Through the analysis of measured data on waves, currents, sediment, and other factors under extreme weather conditions, the instantaneous sediment concentration distribution in the water column demonstrates a quasi-periodic distribution characteristic, which is closely associated with wave and current dynamics. When calculating the sediment concentration in near-shore water bodies under extreme weather conditions, it is necessary to take into account the combined effects of waves and currents. The formula for the instantaneous sediment concentration in water bodies consists of two components: the instantaneous sediment concentration under the influence of tidal dynamics and the instantaneous sediment concentration under the influence of wave dynamics.
Under extreme weather conditions, waves and tidal currents interact, and the hydrodynamic structure of the sea area is complex. Waves serve as the primary driving force for the initiation of sediment on the seabed, whereas tidal currents act as the main driving force for sediment transport. Scholars such as Dou, G. [23], Ma, J. [24], and Yan, B. [25] have indicated that the sediment-carrying capacity of water under the combined action of waves and currents can be composed of the sediment-carrying capacities under individual currents and waves. This concept can also be used as a reference when formulating the formula for the instantaneous sediment concentration in water bodies. Additionally, the instantaneous sediment concentration within water bodies is associated with the sediment concentration in the earlier stage or upstream, necessitating the introduction of the concept of background sediment concentration. The background sediment concentration is related to the near-shore tidal current, wave dynamic conditions, and the sediment characteristics of the seabed. In this study, the minimum value of sediment concentration in water under normal weather conditions is regarded as the background sediment concentration, and the instantaneous sediment concentration under extreme weather conditions is formed by the superposition of the background sediment concentration and the suspended sediment under the combined action of waves and currents [9]. Considering the influence of tides, waves, and background sediment concentration, this paper constructs a formula for calculating the instantaneous sediment concentration under extreme weather conditions, which takes the following two forms:
Formula 1: Adopting a structural form analogous to Liu, J. J. [18] and taking into account the impact of background sediment concentration, a formula for calculating the instantaneous sediment concentration under the combined effect of waves and currents is established, as presented below:
S s = M 1 γ s γ γ s γ ( U M 2 U t T + U w M 4 U w c ) 2 g h + M 0
Formula 2: The proposed methodology incorporates the instantaneous sediment concentration due to wave–current action, while accounting for the influence of background sediment concentration [24]. Subsequently, an integrated formula for estimating the instantaneous sediment concentration under combined wave–current conditions is established as follows:
S s = M 1 γ s γ γ s γ ( U M 2 U t T ) 2 g h + M 3 γ s γ γ s γ ( U w M 4 U w c ) 2 g h + M 0
In the formula, M 1 , M 2 , M 4 , M 1 , M 2 , M 3 , M 4 are all undetermined coefficients; M 0 is the background sediment concentration, taking the minimum value of the normal daily sediment concentration as 0.02~0.1 k g / m 3 [18]. This article calibrates the coefficients in the formula for instantaneous sediment concentration under extreme weather conditions based on hydrological and sediment data measured during three consecutive months of strong winds from August to November 2009. The values of the coefficients in Equation (15) are presented as follows: the value range of M 1 is from 0.2 to 0.55, M 2 ranges from 0.08 to 0.25, and M 4 ranges from 0.09 to 0.15. The values of the coefficients in Equation (16) are as follows: M 1 ranges from 0.1 to 0.5, M 2 ranges from 0.08 to 0.12, M 3 ranges from 0.36 to 1.61, and M 4 ranges from 0.09 to 0.14. Among the undetermined coefficients, the values of coefficients M 2 and M 2 of the lagged velocity term and coefficient M 4 of the wave energy loss term remain largely consistent in different temporal and spatial ranges. the values of coefficients M 1 , M 1 , M 3 are substantially identical in different temporal and spatial ranges. However, as the dynamics of waves and currents intensify, the values of these coefficients increase.

3.4.2. Verification of Formulas

To validate the applicability of the formula, hydrological data measured during Typhoon Wipha in 2007 and the cold wave and gales in December 2008 were employed to verify the formula.
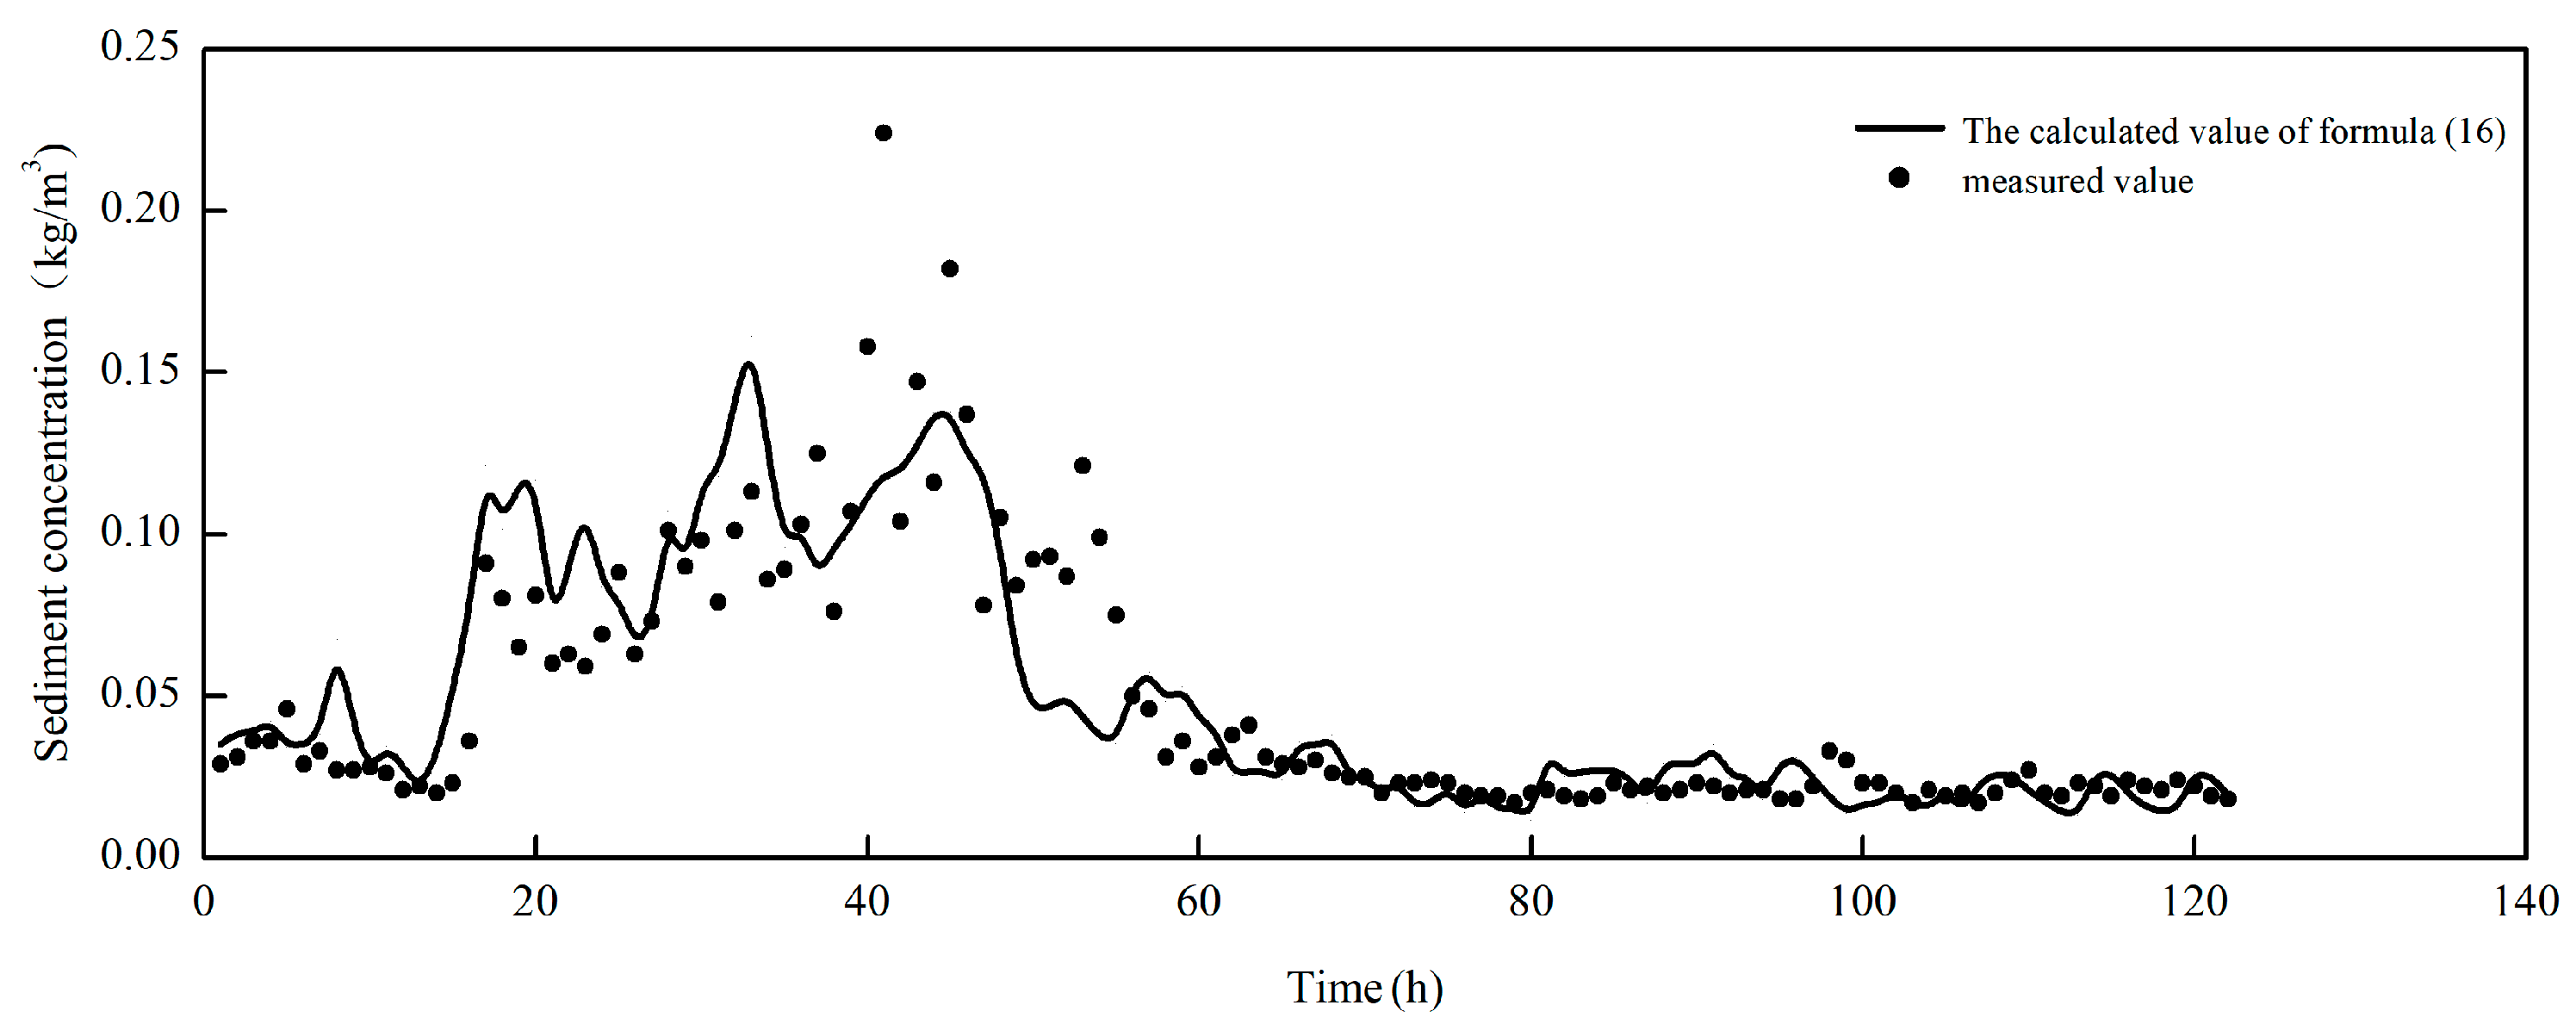
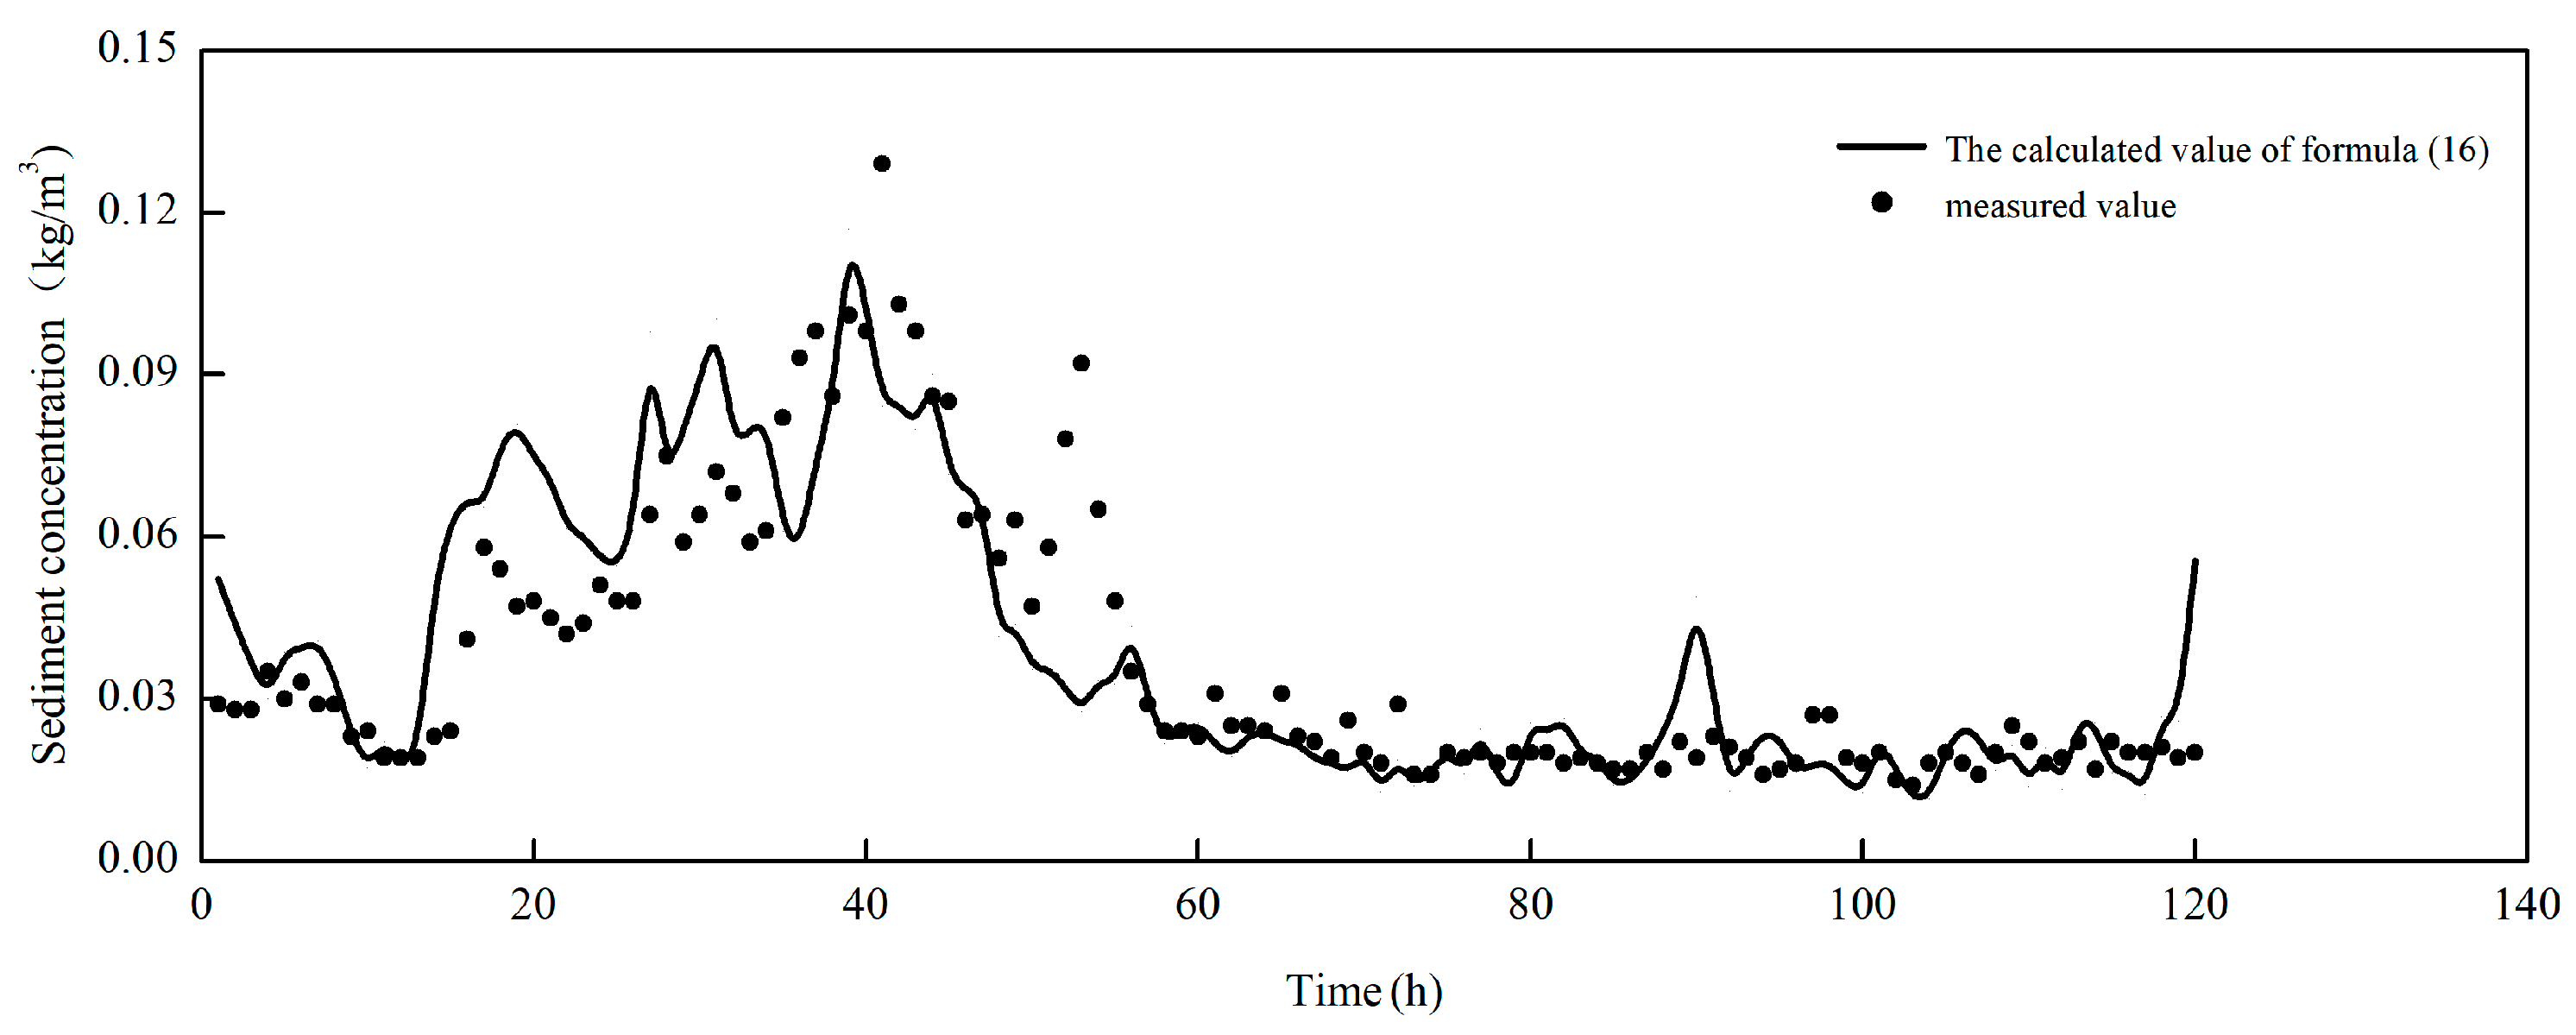
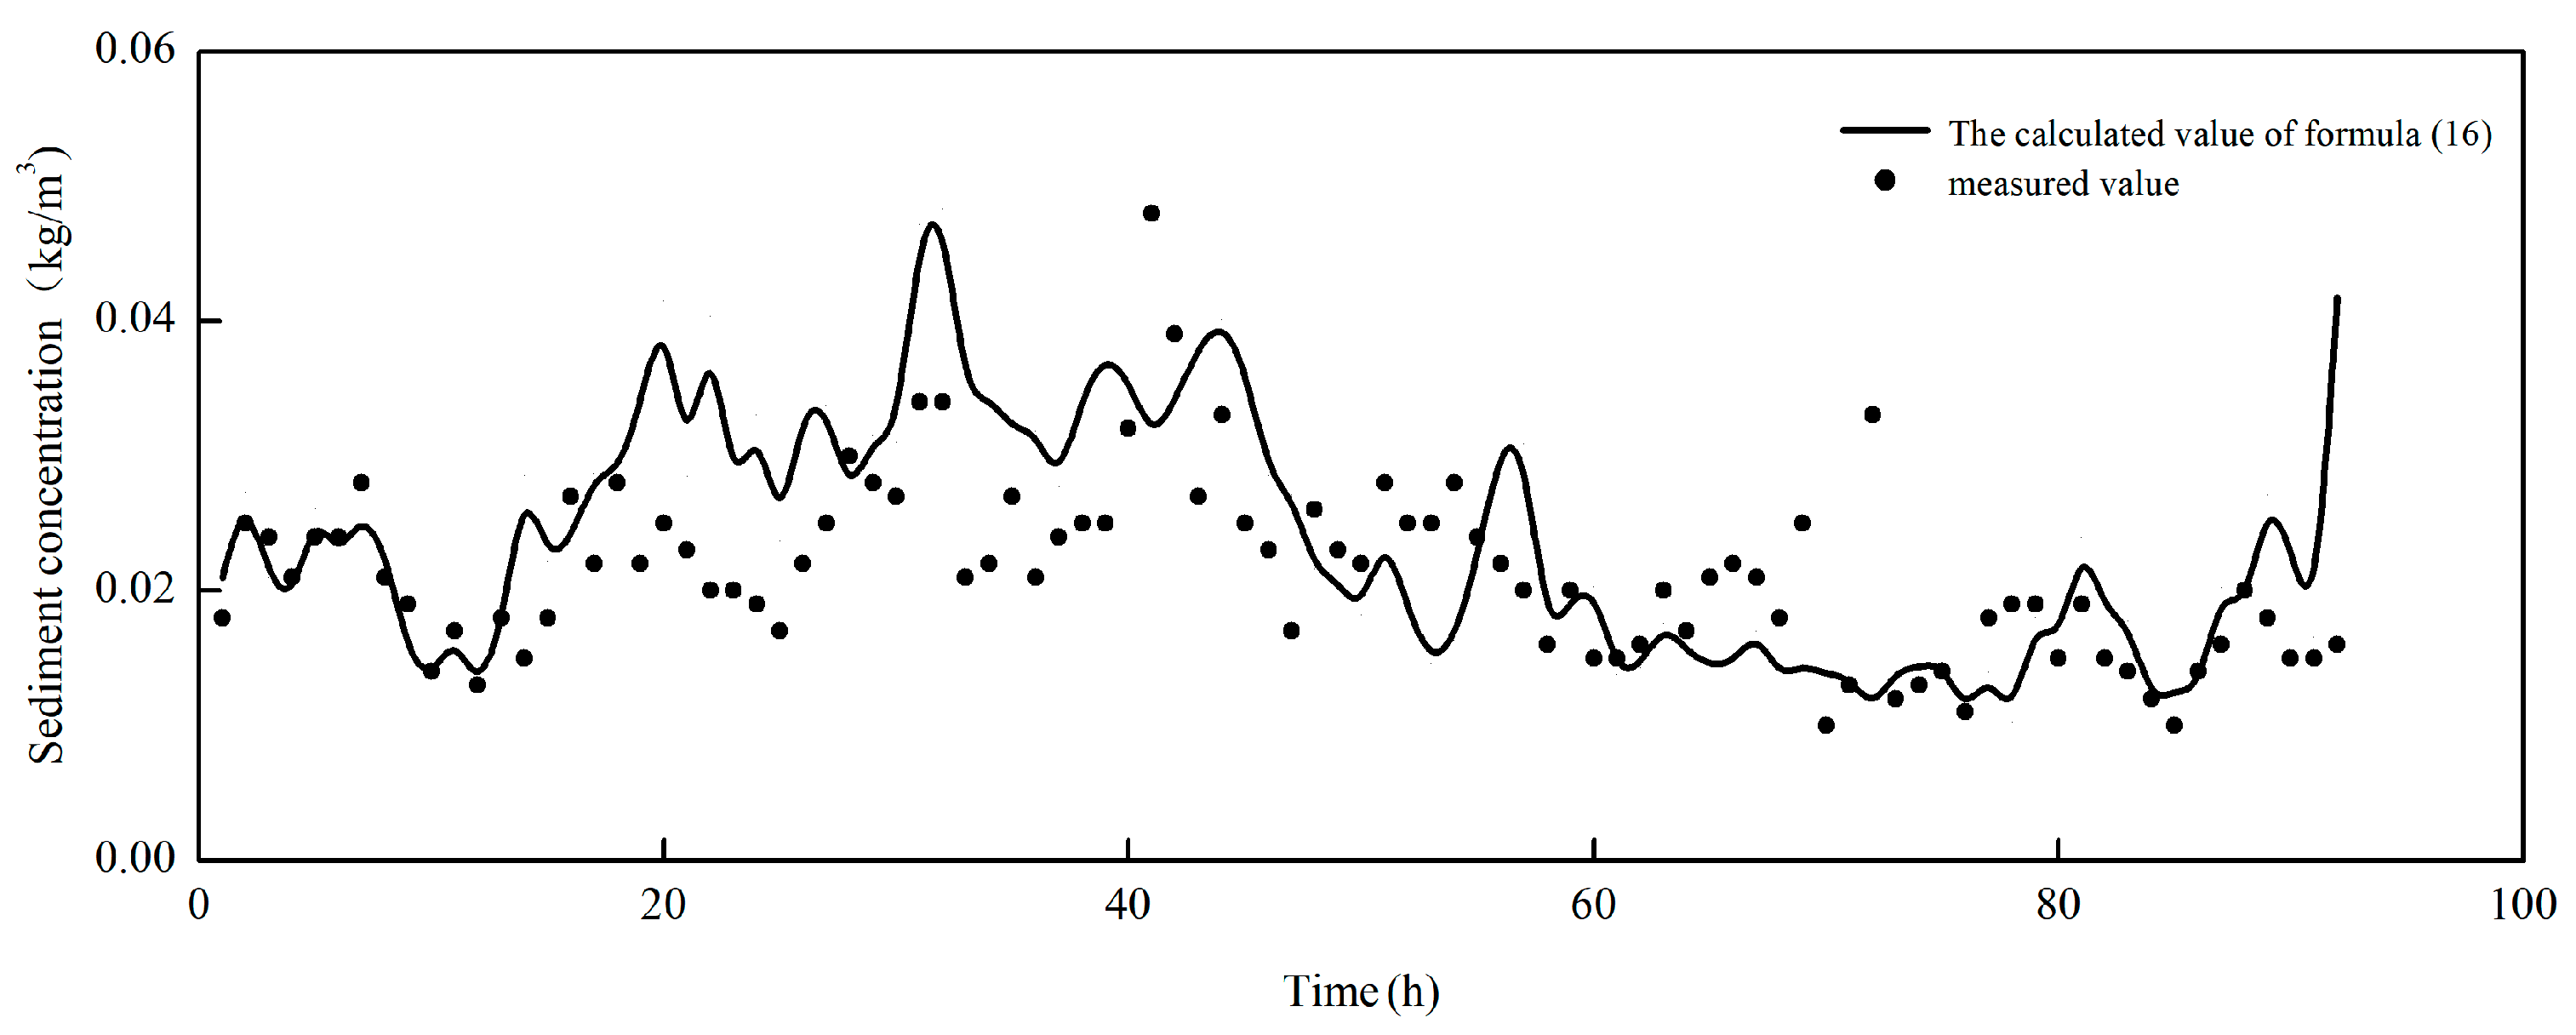
By utilizing Equations (15) and (16), the instantaneous sediment concentration in the water during Typhoon Wipha in 2007, the cold wave and gale in December 2008, and the cold wave and gale in November 2009 were computed. The comparisons between the calculated values and the measured vertical average sediment concentration are presented in Figure 30 and Figure 31, respectively. Based on the comparison between the calculated and measured values, the correlation coefficient between the calculated and measured values in Equation (15) is 0.7, and that in Equation (16) is 0.8. The calculation results of Equation (16) are relatively superior. Therefore, Equation (16) is suggested as the computational formula for instantaneous sediment concentration under extreme weather conditions. Figure 32, Figure 33, Figure 34 and Figure 35 display the verification of the recommended computational Equation (16) for instantaneous sediment concentration under extreme weather conditions. By comparing the calculated values with the measured values, it can be noted that the newly developed Equation (16) for instantaneous sediment concentration under the combined influence of waves and currents demonstrates a high level of consistency with the measured values, and the phase coherence is also satisfactory. The feasibility of predicting instantaneous sediment concentration in water bodies under extreme weather conditions using the formula has been preliminarily verified. Consequently, this research integrates the modified tidal current velocity U v s = U U v l and the modified average horizontal wave velocity U w s = U w U w l into the commonly used sediment carrying capacity formula, significantly improving the accuracy of the computational results of instantaneous sediment concentration under extreme weather conditions, and providing a novel method for sediment research on muddy coasts.

4. Discussion

4.1. Comparison with Previous Studies

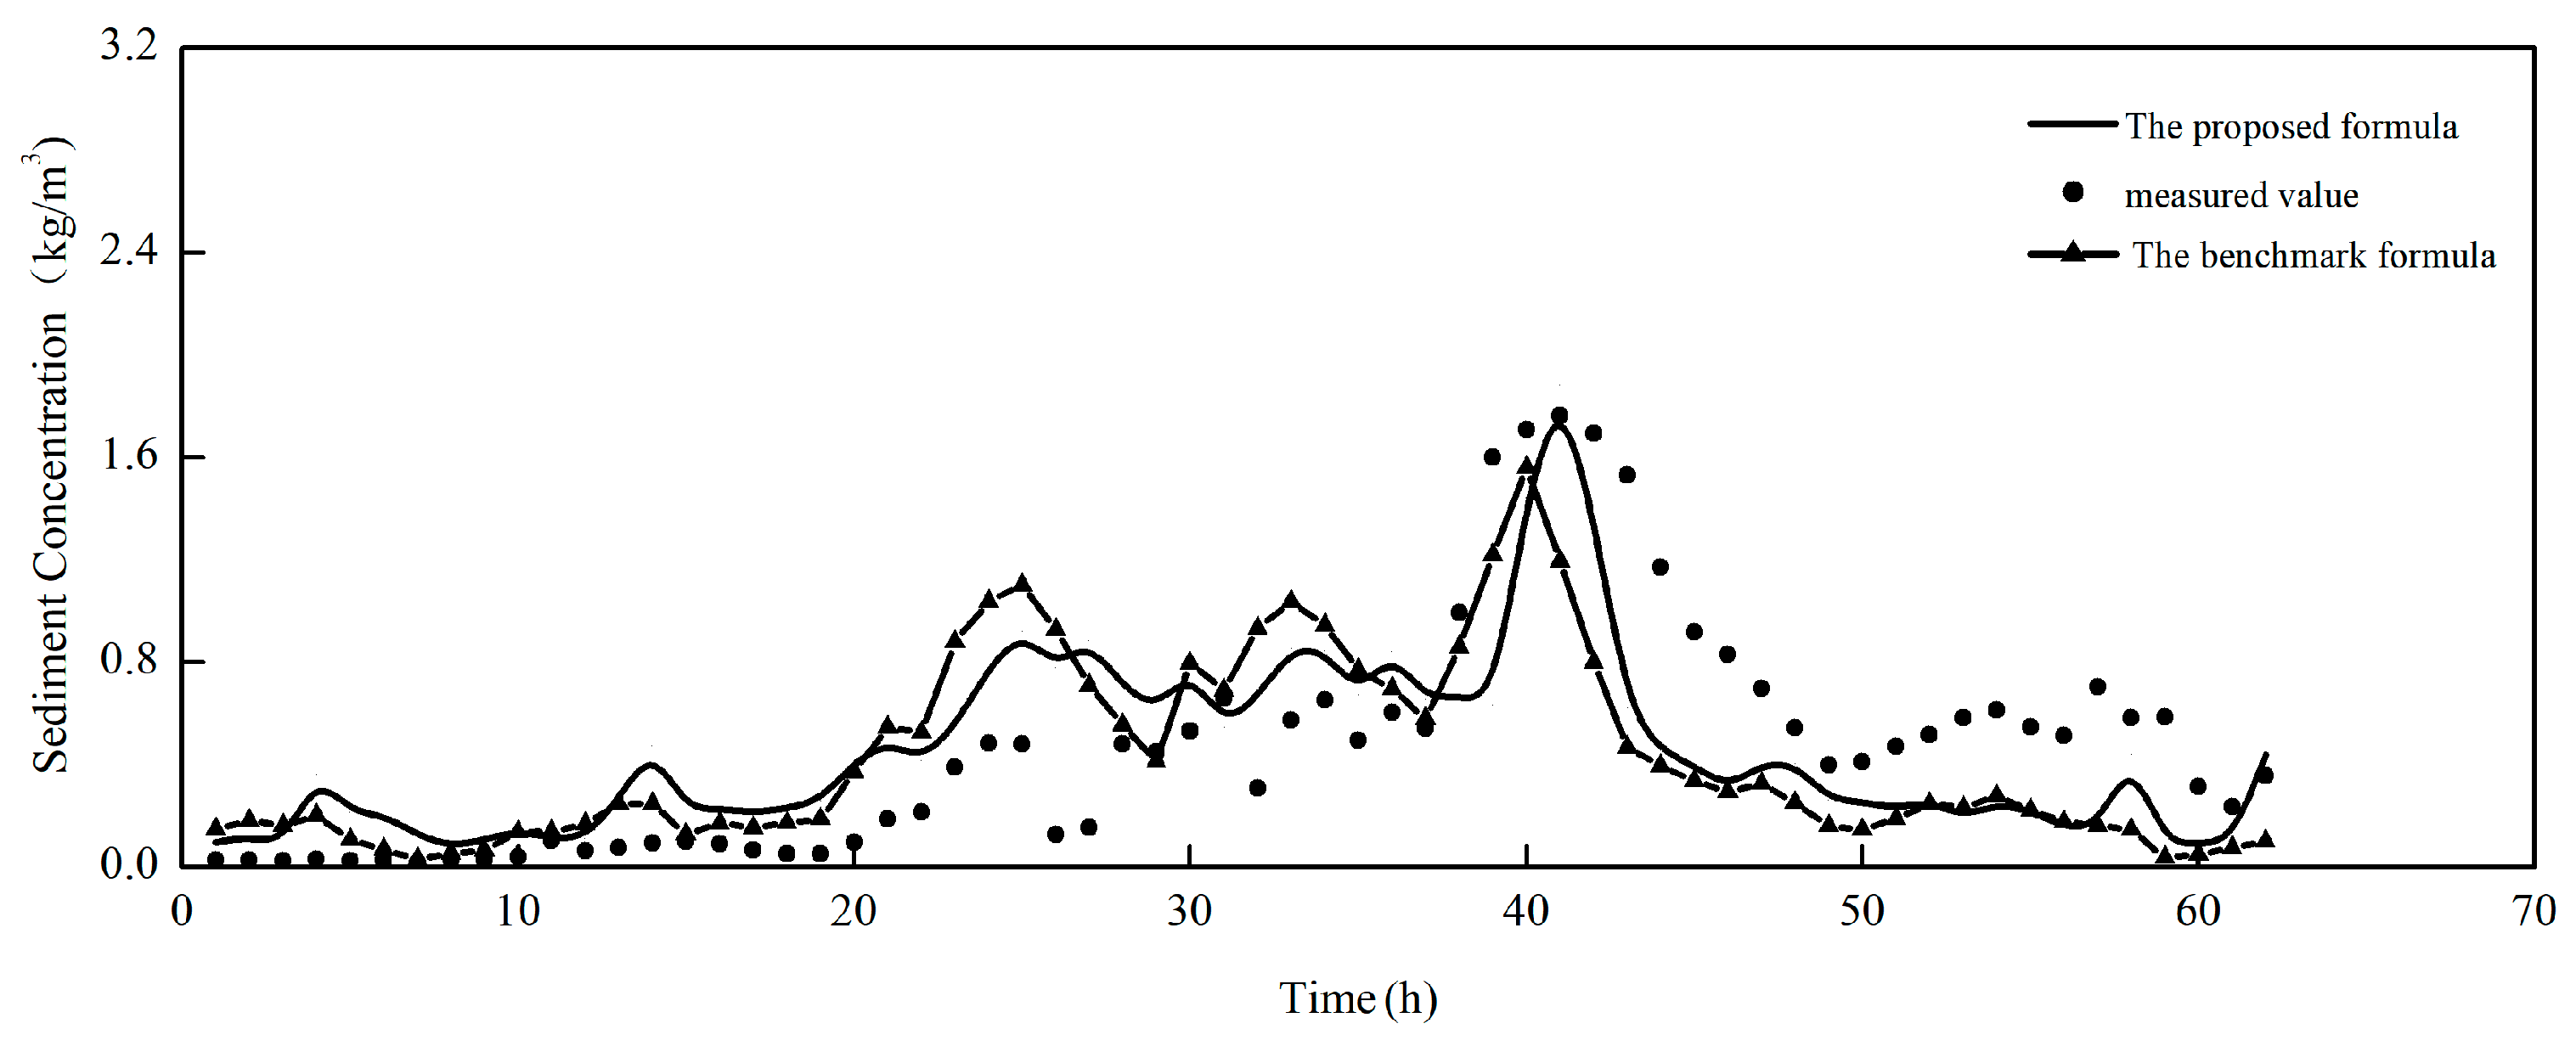
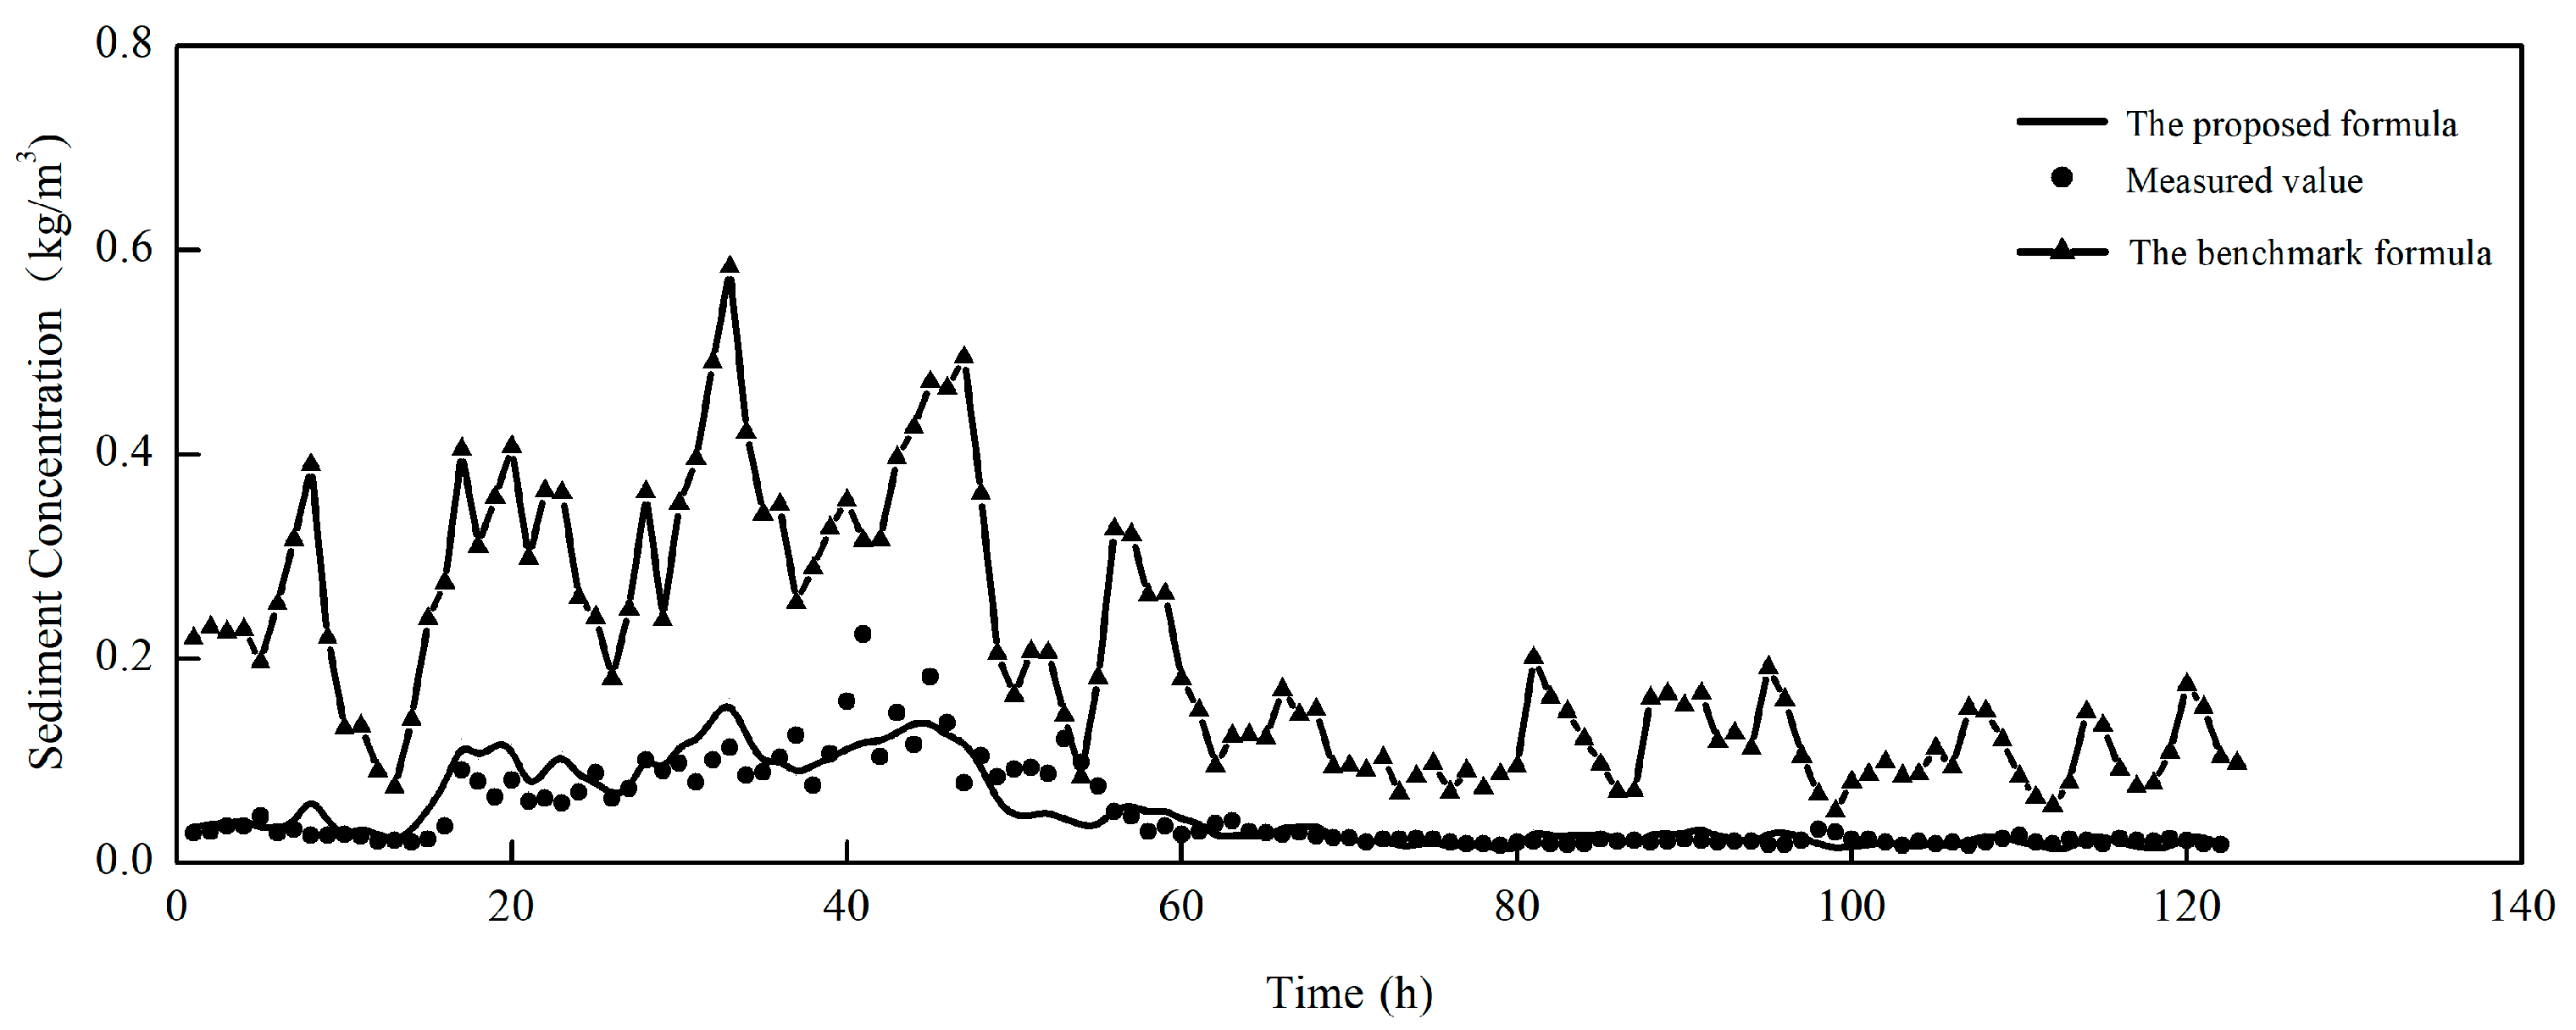
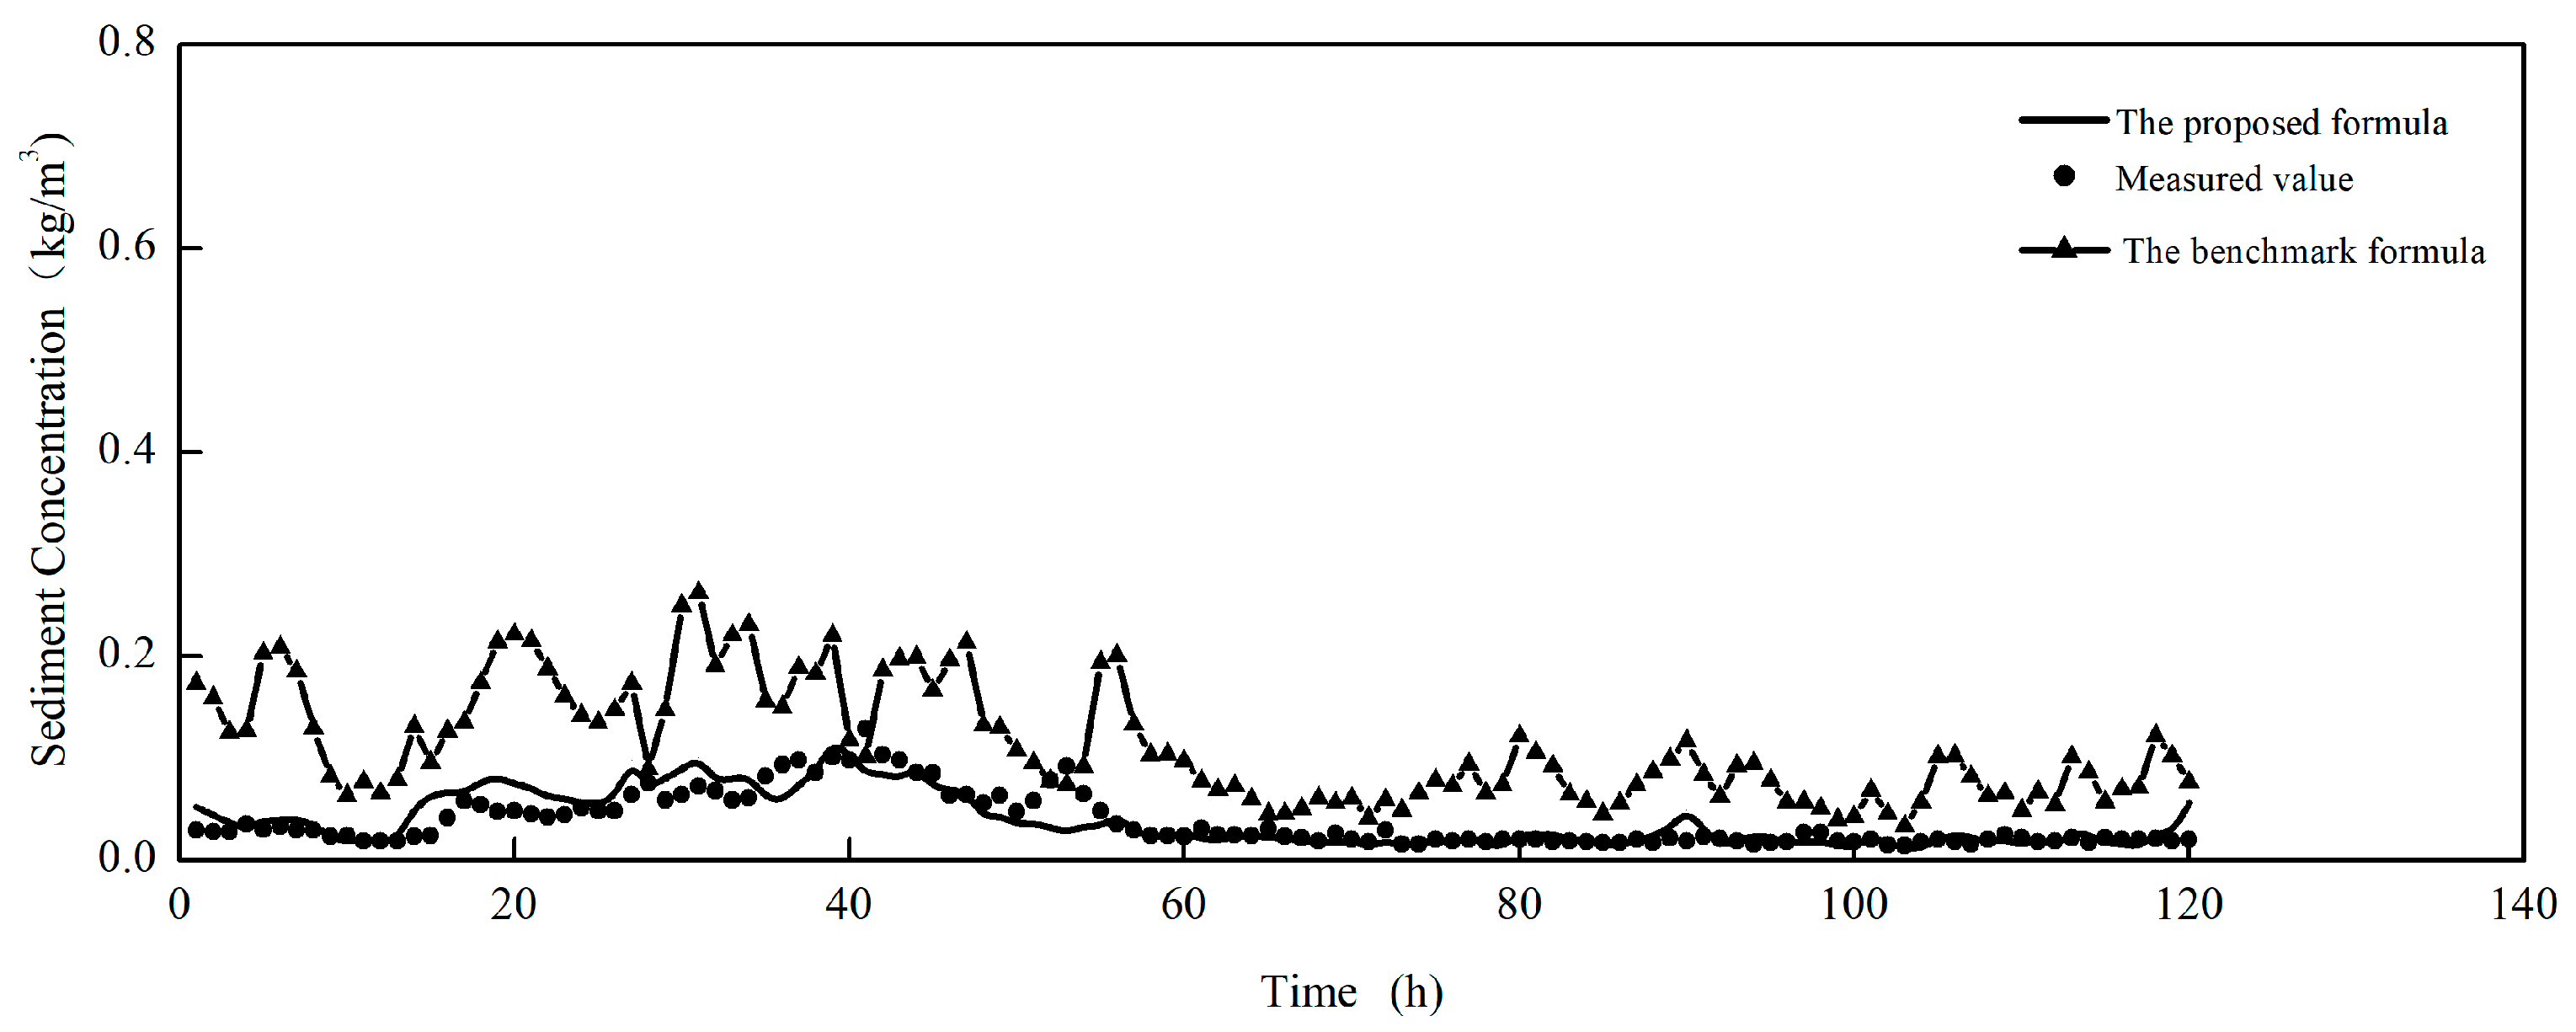
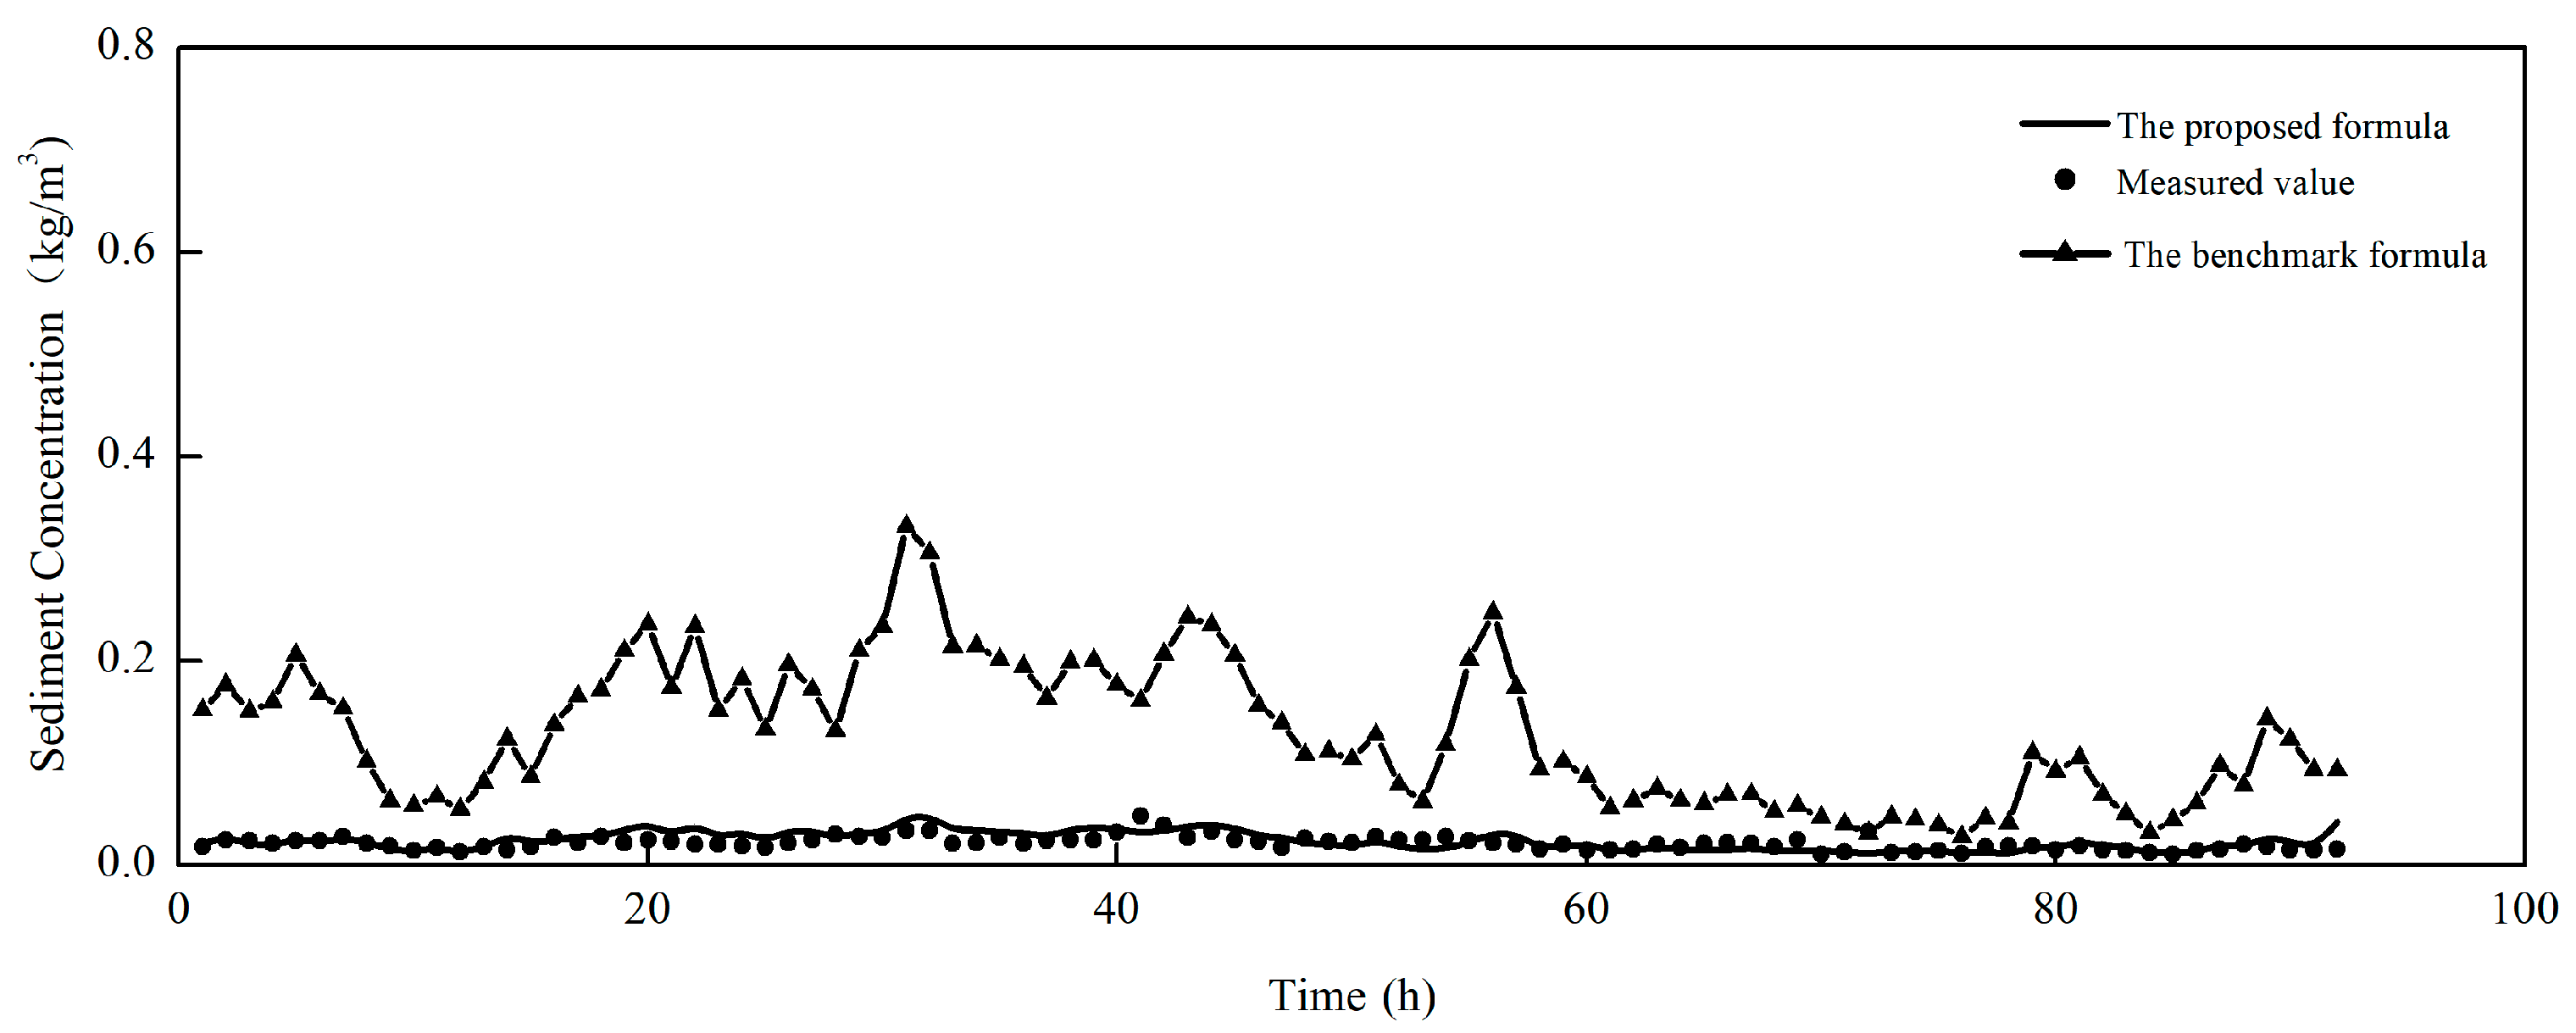
The sediment transport capacity formula proposed by Liu, J. J. [20], which has demonstrated good applicability in muddy coastal environments, is adopted as the benchmark in this study. Equation (16) represents the formula proposed in this study. A comparative analysis between the benchmark formula and the proposed Equation (16) is conducted to further evaluate the applicability of the latter under high-wind and wave conditions. Figure 36, Figure 37, Figure 38 and Figure 39 present comparative results between the proposed formula and the benchmark formula. During Typhoon Wipha passing through the Lianyungang area in September 2007, wind speeds ranged from 0 to 12 m/s between 00:00 on 17 September and 12:00 on 19 September. From 12:00 on 19 September to 23:00 on 20 September, wind speeds increased to 12–22 m/s. During a cold wave event from 13:00 on 3 December to 15:00 on 8 December 2008, wind speeds in the Lianyungang coastal area mostly remained between 0 and 12 m/s. As shown in Figure 36, Figure 37, Figure 38 and Figure 39, during periods of relatively low wind speeds (17 September, 00:00–19 September 2007 12:00, and 3 December 13:00–8 December 2008, 15:00), the sediment concentration calculated by the benchmark formula is significantly higher than the measured values. However, during the period from 12:00 on 19 September to 23:00 on 20 September 2007, when the typhoon center reached the Lianyungang area and measured wind speeds exceeded 20 m/s, the sediment concentration calculated by the benchmark formula was lower than the measured values, with a noticeable phase difference. Waves and currents exhibit distinct dynamic characteristics and play different roles in sediment initiation and suspension, contributing differently to the sediment concentration in the water. However, the benchmark model treats the effects of waves and currents equivalently, i.e., they appear with the same weight in the formula, which does not align with the actual dynamic interactions of waves and currents [25]. Therefore, the benchmark formula is primarily suitable for estimating the average sediment-carrying capacity over a specific period under equilibrium hydrodynamic conditions and cannot accurately reflect the actual temporal variation in sediment concentration in the water.
The proposed instantaneous sediment concentration formula (Equation (16)) for extreme weather conditions incorporates the lag effect of tidal currents and energy dissipation during wave-induced sediment resuspension. It also assigns specific weight coefficients to wave and current dynamics based on their respective roles in sediment initiation and transport, aligning with the response relationship between instantaneous sediment concentration and wave–current dynamics. Therefore, the proposed formula (Equation (16)) effectively captures the dynamic evolution of sediment concentration under extreme weather conditions and is recommended as a suitable formula for estimating boundary suspended sediment concentration under high-wind and wave conditions.

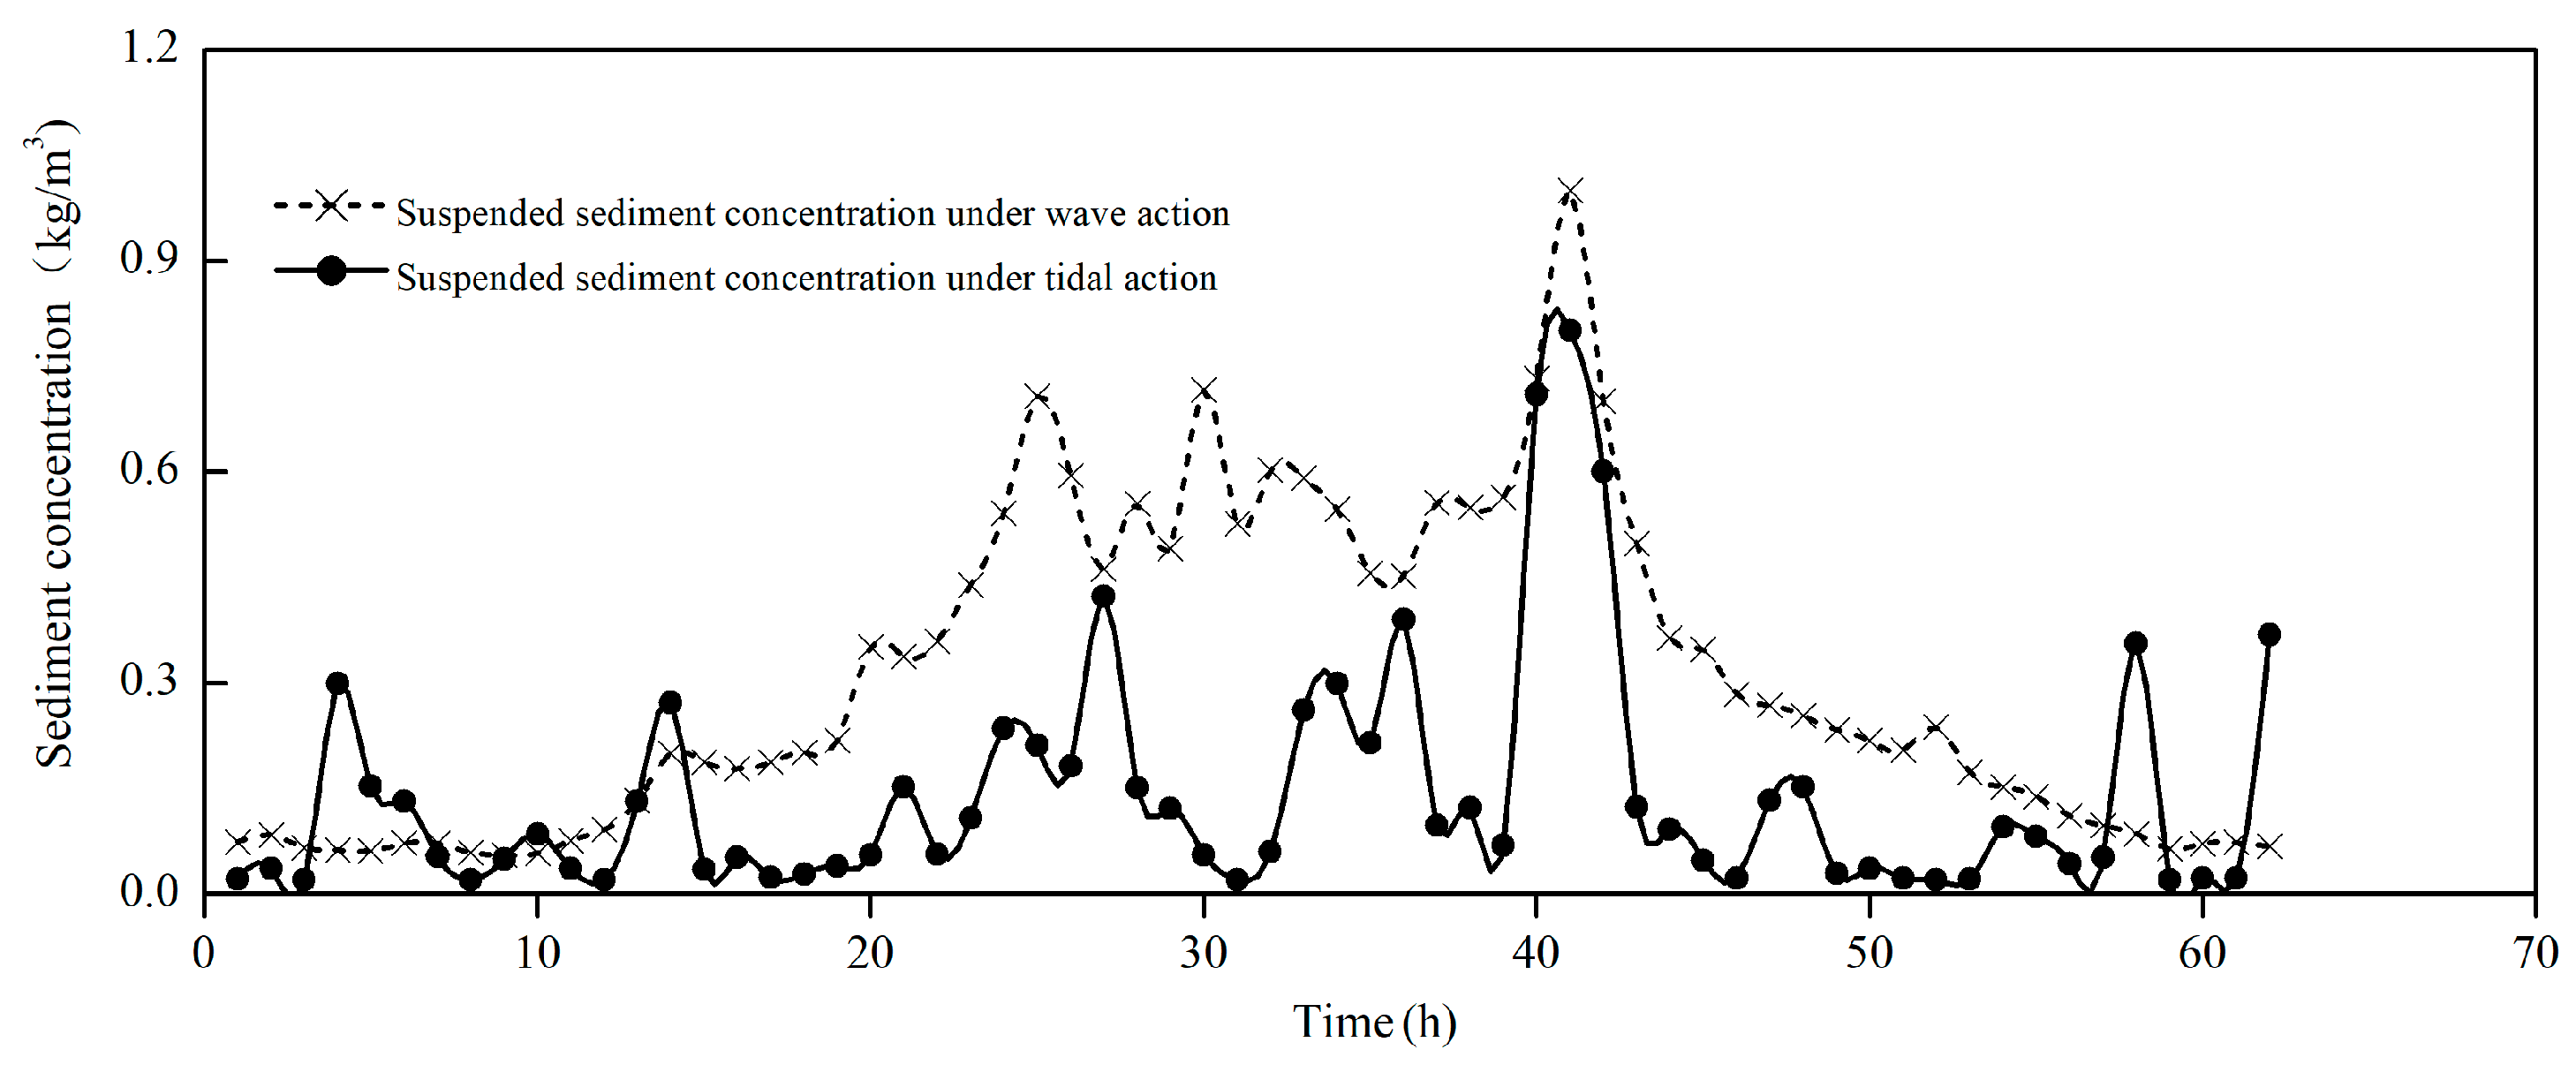
4.2. Research on the Influence Mechanism of Four Wave Flow Dynamics

Employing Equation (16) for instantaneous sediment concentration under extreme weather conditions, the wave-induced suspended sediment concentration and tidal-induced suspended sediment concentration under the influence of Typhoon Wipha are calculated. Moreover, in combination with the variations in shear stress at the bottom of the wave flow, the response characteristics of instantaneous sediment concentration and wave flow dynamics under extreme weather conditions are investigated. The bed shear stress is typically generated by the combined action of tidal currents and waves, comprising a relatively stable component induced by tidal currents and a periodic oscillatory component caused by waves. The formula for calculating the bed shear stress is as follows [14].
τ c w = [ ( τ m + τ w c o s φ ) 2 + ( τ w s i n φ ) 2 ] 1 / 2 τ m = τ c [ 1 + α ( τ w τ c + τ w ) β ]
τ c = ρ u c 2 τ w = 1 2 ρ f w u w 2     u w = π H T s i n h ( k h )
In the equation, z 0 denotes the bed roughness length, which was calculated using the DRENNAN parameterization scheme proposed by Drennan et al. [22], ρ represents the seawater density, u w stands for the amplitude of wave orbital velocity, f w indicates the wave friction coefficient, H refers to the wave height, L symbolizes the wavelength, T represents the wave period, τ c denotes the current-induced shear stress, τ w indicates the wave-induced shear stress, τ m stands for the mean shear stress under combined wave–current action, and τ c w represents the total shear stress under combined wave–current conditions.
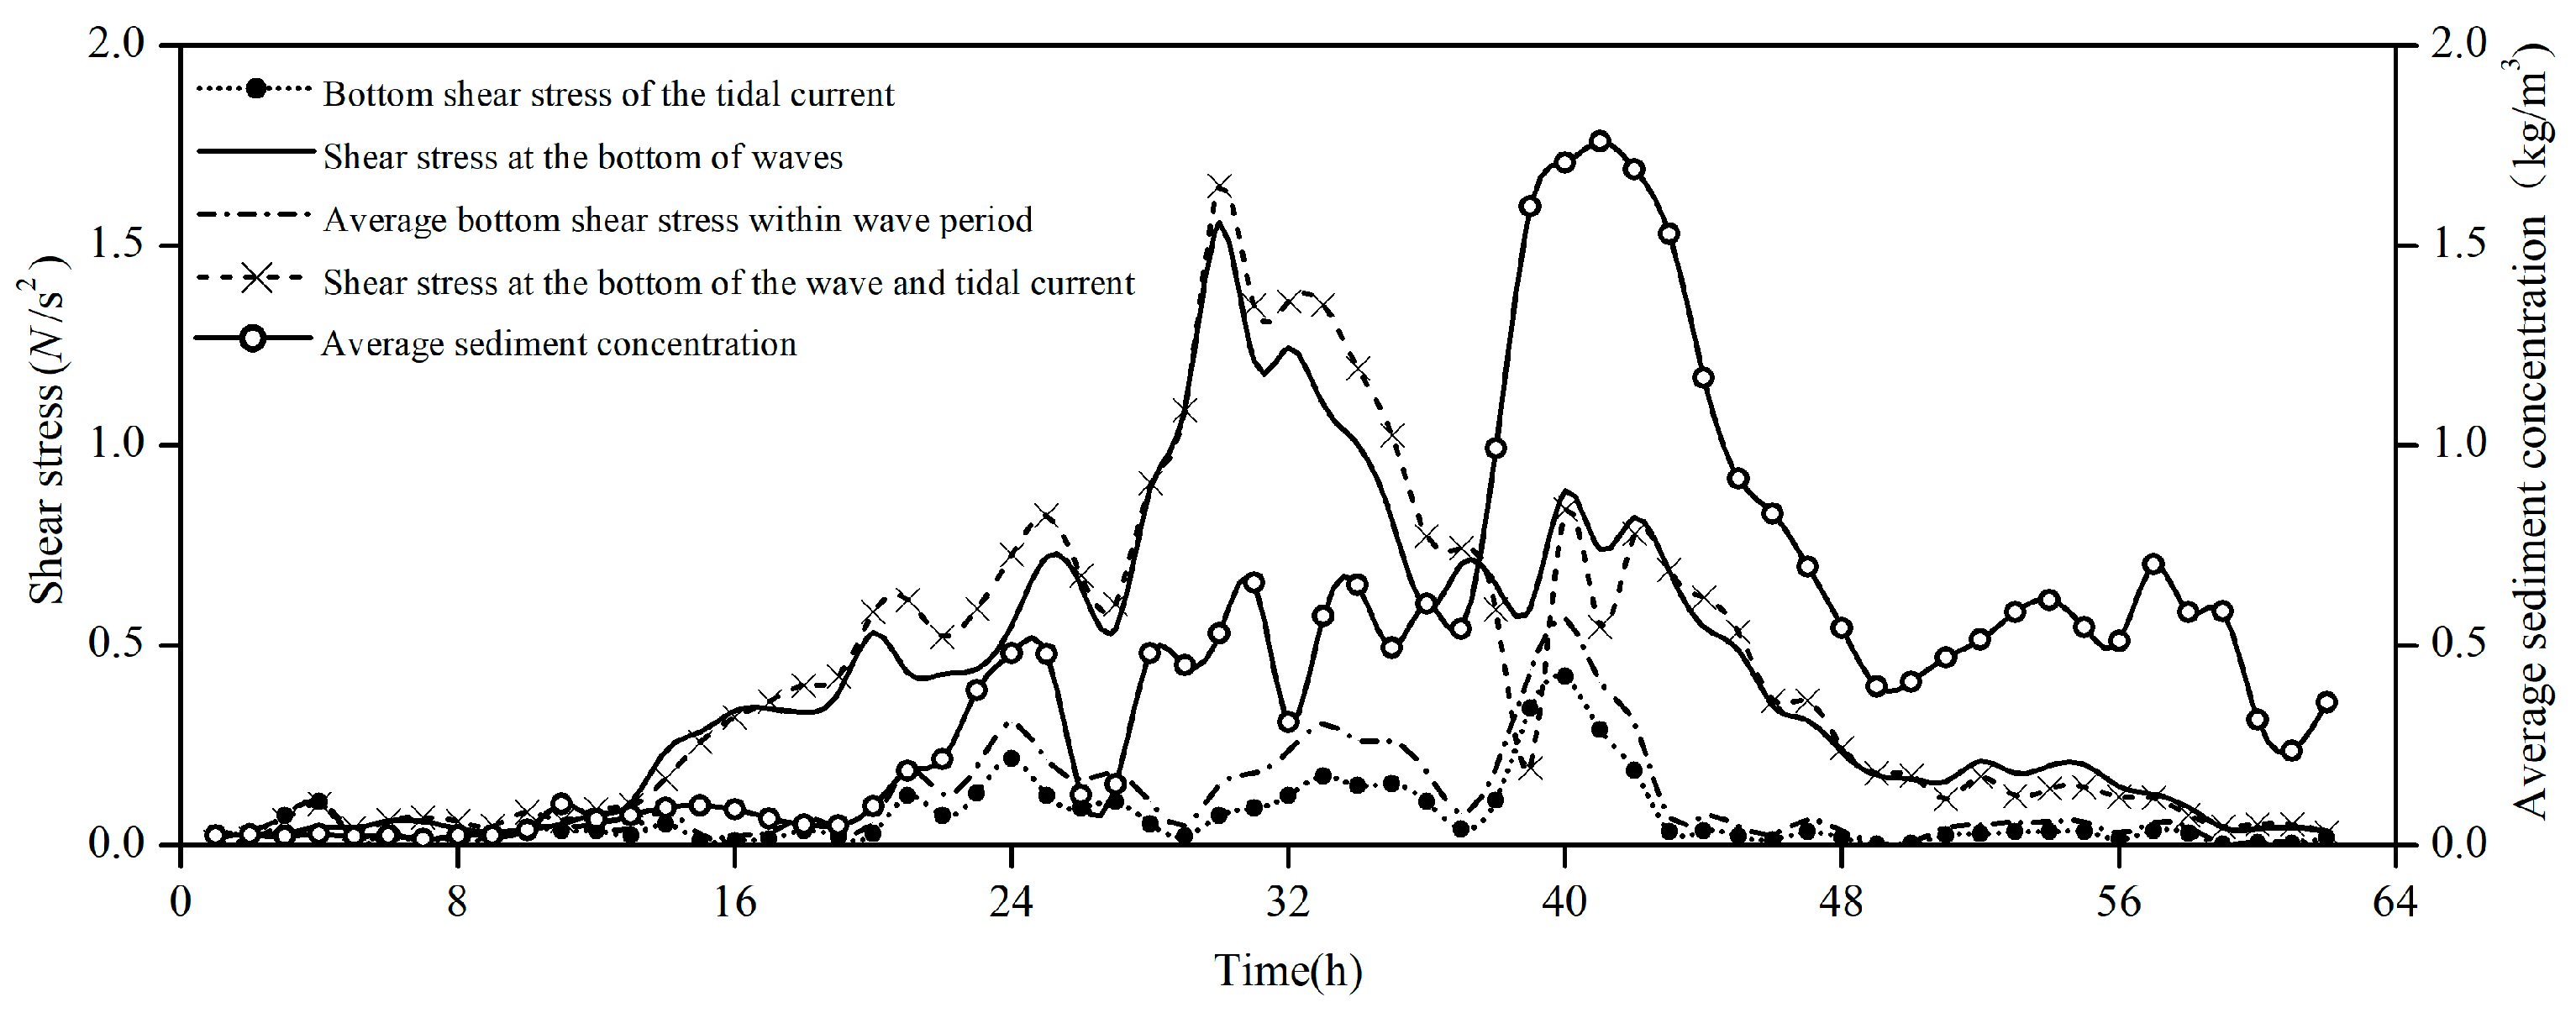
Figure 40 and Figure 41 depict the variation curves of bottom shear stress and sediment concentration in the Lianyungang sea area during Typhoon Wipha. Under the influence of storm surges and typhoon waves, extreme weather conditions give rise to strong wave and flow forces, leading to the resuspension of a substantial amount of sediment from the bottom bed and the formation of high-concentration sediment-laden water bodies. During Typhoon Wipha, two distinct strong dynamic processes were observed. In the first stage, the maximum wave height reached 3.1 m, the peak period was 8 s, the bottom shear stress of the waves ranged from 1.2 to 1.5 N/m2, and the instantaneous sediment concentration induced by the waves was between 0.5 and 0.7 kg/m3. At this juncture, it was approaching the time of flood slack, yet due to the influence of storm surges, the current velocity could still attain 0.35 m/s. The bottom shear stress of the tide was in the range of 0.1–0.15 N/m2, and the instantaneous sediment concentration caused by the tide was 0.05–0.1 kg/m3. In the second period, the maximum effective wave height H 1 / 3 is 2.45 m, the shear stress at the wave bottom ranges from 0.8 to 0.9 N/m2, and the instantaneous sediment concentration induced by the wave is between 0.55 and 0.6 kg/m3. At this juncture, approaching the moment of rapid increase, the current velocity attains 0.77 m/s, which represents the maximum velocity throughout the entire typhoon period. The bottom shear stress of the current reaches 0.4–0.45 N/m2, and the instantaneous sediment concentration caused by the tide is within the range of 0.5–0.55 kg/m3. The maximum sediment concentration during the typhoon period (1.71 kg/m3) did not occur during the first strong wind-wave process with the highest wave height, but rather during the second strong wind-wave process. This phenomenon is associated with the fact that the second strong wind-wave event coincided with a period of rapid increase, and the shear stress at the bottom of the waves and currents was relatively high.
Table 3 presents the alterations in sediment concentration induced by waves and currents during Typhoon Wipha. Throughout the typhoon observation period, the average instantaneous sediment concentration was calculated using Formula (16), which was substantially consistent with the measured average. The average wave-induced suspended sediment concentration during the entire typhoon period (from 18:00 on the 18th to 7:00 on the 21st) was 0.29 kg/m3, while the average tidal-induced suspended sediment concentration was 0.14 kg/m3. Waves play a pivotal role in the initiation and suspension of sediment, and the wave-induced suspended sediment concentration is 2.1 times that of the tidal-induced suspended sediment concentration. During the high-wave period (from 12:00 on the 19th to 15:00 on the 20th), the average concentration of wave-induced suspended sediment was 0.42 kg/m3, and the average concentration of tide-induced suspended sediment was 0.21 kg/m3. Overall, the concentration of wave-induced suspended sediment was twice that of tide-induced suspended sediment. The ratio of suspended sediment concentration generated by wave and current dynamic factors is associated with the wave height of wind-driven waves, as well as the ebb and flow periods. The ratio during the resting time is 5–10 times, and that during the rapid-flow time is 1–1.2 times. During the passage of Typhoon Wipha, it coincided with the low-tide period, which, to a certain extent, mitigated the impact of the typhoon on the instantaneous sediment concentration of water bodies. Under extreme weather conditions, the dynamics of wind and waves are intense, and the spatiotemporal variation characteristics of suspended sediment concentration exhibit substantial disparities compared to normal days. Waves and flow forces exert a notable influence on the instantaneous sediment concentration of water bodies, which aligns with the dynamic mechanism of “waves suspending sediment and waves and currents jointly transporting sediment” along muddy coasts.

5. Conclusions

Based on an extensive volume of measured hydrological and sedimentary data from muddy coasts, the response relationship between the instantaneous sediment concentration in water bodies and wave and flow dynamic elements was analyzed. A formula for the instantaneous sediment concentration under extreme weather conditions was put forward, which effectively reflects the real-time variation process of sediment concentration in water bodies under the influence of strong winds and waves, as presented below:
(1)
Under extreme weather conditions, the instantaneous sediment concentration demonstrates a quasi-periodic distribution, which corresponds to the dynamic factors of waves and currents within a specific spatio-temporal domain. The temporal variation period of the instantaneous sediment concentration shows a notable lag in comparison to the dynamic factors of currents. There exists a positive correlation between wave energy loss and the instantaneous sediment concentration in the water body. Wave energy serves as the primary energy source for the initiation and suspension of sediment in the bottom bed.
(2)
In light of the phenomenon where the instantaneous sediment concentration in water during extreme weather exhibits a significant time lag in relation to the temporal variations in tidal dynamics, the analysis indicates that the time-varying characteristics of tidal flow velocity and wave energy serve as its intrinsic driving forces. Moreover, the formulas for tidal and wave horizontal velocity are refined. A computational formula for instantaneous sediment concentration under extreme weather conditions has been formulated, uncovering the response characteristics of instantaneous sediment concentration in muddy coastal waters to wave and tidal dynamics. The computed values of the formula exhibit a high degree of consistency with the measured values, which can offer precise sediment open boundary conditions for sediment mathematical models.
(3)
The parameterized formula for instantaneous sediment concentration under extreme wind conditions, as developed in this study, achieves an integrated representation and reasonable simplification of multiple physical processes including turbulence, flocculation, and salinity effects. To advance the understanding of sediment transport mechanisms, subsequent research will leverage controlled experimental data to systematically decouple the multi-physical field interactions, with the ultimate goal of establishing a three-dimensional formula for instantaneous sediment concentration grounded in well-defined physical principles.

Author Contributions

Q.Q., coastal sediment dynamics-related research, writing—original draft preparation. D.X., review and editing. Y.D., data curation. All authors have read and agreed to the published version of the manuscript.

Funding

This research was funded by National Natural Science Foundation of China (NSFC): grant No. 52179076; U2443219. Science and Technology Research and Development Project of China Communications Construction Group Co., Ltd. (824115716).

Data Availability Statement

The original contributions presented in this study are included in the article. Further inquiries can be directed to the corresponding author.

Acknowledgments

Upon completion of this manuscript, we wish to express our sincere gratitude to Ji Zezhou and Wang Yuhong. We extend our thanks for their expert guidance and invaluable assistance throughout the data collection and manuscript preparation process.

Conflicts of Interest

The authors declare that this research was funded by the Science and Technology Research and Development Project of China Communications Construction Group Co., Ltd. (Grant No. 824115716). The funder’s contributions to this study included participation in research data collection and manuscript preparation. Author Qinghui Qi was employed by the company China Design Group Co., Ltd. The remaining authors declare that the research was conducted in the absence of any commercial or financial relationships that could be construed as a potential conflict of interest.

References

  1. Corbett, D.R.; Dail, M.; McKee, B. High-frequency time-series of the dynamic sedimentation processes on the western shelf of the Mississippi River Delta. Cont. Shelf Res. 2007, 27, 1600–1615. [Google Scholar] [CrossRef]
  2. Baugh, J.; Feates, N.; Littlewood, M.; Spearman, J. The fine sediment regime of the Thames Estuary—A clearer understanding. Ocean. Coast. Manag. 2013, 79, 10–19. [Google Scholar] [CrossRef]
  3. Kineke, G.C.; Sternberg, R.W. Distribution of fluid muds on the Amazon continental shelf. Mar. Geol. 1995, 125, 193–233. [Google Scholar] [CrossRef]
  4. Cui, J.; Xia, Y. Analysis on the Application of Seaworthy Depth Technology in the Pearl River Estuary Channel and Port. Value Eng. 2012, 9, 65–66. [Google Scholar]
  5. Gilbert, G.K. The Transportation of Debris by Running Water; Professional Paper 86; U.S. Geological Survey: Washington, DC, USA, 1914; 263p. [Google Scholar]
  6. Bagnold, R.A. An Approach to the Sediment Transport Problem from General Physics; Professional Paper 422-1; U.S. Geological Survey: Washington, DC, USA, 1966; 37p. [Google Scholar]
  7. Yang, C.T. Unit Stream Power Equation and Sediment Transport. J. Hydraul. Div. 1972, 98, 1805–1826. [Google Scholar] [CrossRef]
  8. Ding, J.; Zhang, J.; Gao, Z.; Zhang, W.; Yu, Z. Study on layout schemes of entrance channel in enclosed harbor basin along muddy coasts. Hydro-Sci. Eng. 2014, 1, 17–23. [Google Scholar]
  9. Yang, F.; Zhang, W. Effects of Typhoon Wipha on wave energy dissipation and suspended sediment concentration in typical waters of Lianyungang. Ocean Eng. 2012, 30, 82–89. [Google Scholar] [CrossRef]
  10. Dong, H.; Lu, Z. Field Observation Report on Waves, Tidal Currents, and Sediment in Lianyungang During the Passage of Typhoon “Wipha” in September 2007; Tianjin Research Institute for Water Transport Engineering; Ministry of Communications: Tianjin, China, 2008. [Google Scholar]
  11. Dong, H.; Lu, Z. Field Observation Results and Analysis of Waves, Tidal Currents, and Sediment in Lianyungang During a Cold Wave and Gale in December 2008; Tianjin Research Institute for Water Transport Engineering, Ministry of Communications: Tianjin, China, 2008. [Google Scholar]
  12. Pang, Q.; Yang, H. Report on Short-Term Continuous Observation and Analysis of Waves, Tidal Currents, and Sediment in the Xuwei Port Area of Lianyungang; Tianjin Research Institute for Water Transport Engineering, Ministry of Transport: Tianjin, China, 2010. [Google Scholar]
  13. Yang, F. Research on Wind-induced Waves and Wave-Induced Current Movement on Muddy Coast: A Case Study of Lianyungang. Master’s Thesis, Hohai University, Nanjing, China, 2012. [Google Scholar]
  14. Pang, Q. Study on the Formation and Movement Characteristics of Fluid Mud and Its Countermeasures. Ph.D. Dissertation, Tianjin University, Tianjin, China, 2011. [Google Scholar]
  15. Suhayda, J.N. Interaction of Surface Waves with Muddy Bed Sediments. Sci. Tech. Inf. Hohai Univ. 1988, 2, 16–29. [Google Scholar]
  16. Gao, Z. Study on Sediment Movement and Channel Siltation in the Surf Zone of Muddy Coasts; Nanjing Hydraulic Research Institute: Nanjing, China, 2014. [Google Scholar]
  17. Dou, G.; Dong, F.; Dou, X. Sediment transport capacity in fluvial and coastal environments. Chin. Sci. Bull. 1995, 40, 443–446. [Google Scholar]
  18. Liu, J.J. Study and Application of Coastal Sediment Movement; China Ocean Press: Beijing, China, 2009. [Google Scholar]
  19. Feng, Q.; Li, R.J.; Luo, F. A preliminary study on the estimation of instantaneous sediment concentration in tidal river reaches. J. Wuhan Univ. 2013, 46, 273–277. [Google Scholar]
  20. Li, R.; Zheng, J.; Zhang, W.; Cao, H. A general form of sediment-carrying capacity formula and its analysis. J. Sediment Res. 2014, 1, 1–7. [Google Scholar]
  21. Li, C. Study on Vertical Distribution of Nearshore Water-Sediment and Instantaneous Sediment Concentration; Hohai University: Nanjing, China, 2016. [Google Scholar]
  22. Drennan, W.M.; Donelan, M.A.; Terray, E.A.; Katsaros, K.B. On Waves, Oceanic Turbulence, and Their Interaction. Geophysical 1997, 33, 17–27. [Google Scholar]
  23. Dou, G.; Dou, X.; Li, T. Incipient motion of sediment under wave action. Sci. China Technol. Sci. 2001, 31, 566–573. [Google Scholar]
  24. Ma, J. Research on the Mathematical Model for Sediment Transport Under Joint Action of Waves and Currents in Muddy Coasts. PhD. Dissertation, Hohai University, Nanjing, China, 2009. [Google Scholar]
  25. Yan, B. Study on Sediment Movement and Channel Siltation Mechanism on Sandy Coasts. PhD. Dissertation, Tianjin University, Tianjin, China, 2008. [Google Scholar]
Figure 1. Tidal distribution of the M2 constituent in the Lianyungang coastal waters.
Jmse 13 02188 g001
Figure 2. Bed Material Grain Size Distribution Plot.
Jmse 13 02188 g002
Figure 3. Observation point location (The base map was obtained from the National Platform for Common Geospatial Information Services, Tianditu).
Jmse 13 02188 g003
Figure 4. Wind rose for the period of typhoon Wipha from 06:00 PM, 18 September to 07:00 AM, 21 September 2007.
Jmse 13 02188 g004
Figure 5. Flow velocity-sediment and flow direction-sediment rose diagrams during typhoon Wipha from 06:00 PM, 18 September to 07:00 AM, 21 September 2007.
Jmse 13 02188 g005
Figure 6. Wind speed and tidal level variation chart during typhoon Wipha from 06:00 PM, 18 September to 07:00 AM, 21 September 2007.
Jmse 13 02188 g006
Figure 7. The relationship between sediment concentration and tidal current velocity from 06:00 pm, 18 September to 07:00 am, 21 September 2007 (S1, −5 m).
Jmse 13 02188 g007
Figure 8. The relationship between sediment concentration and tidal current velocity from 01:00 pm, 3 December to 03:00 pm, 8 December 2008 (S1, −5 m).
Jmse 13 02188 g008
Figure 9. The relationship between sediment concentration and tidal current velocity from 01:00 pm, 3 December to 03:00 pm, 8 December 2008 (S6, −10 m).
Jmse 13 02188 g009
Figure 10. The relationship between sediment concentration and tidal current velocity from 0:00 am, 28 August to 11:00 pm, 30 August 2009 (S1, −3 m).
Jmse 13 02188 g010
Figure 11. The relationship between sediment concentration and tidal current velocity from 12:00 am, 16 October to 11:00 pm, 17 October 2009 (S1, −3 m).
Jmse 13 02188 g011
Figure 12. The relationship between sediment concentration and tidal current velocity from 0:00 am, 7 September to 12:00 am, 10 September 2009 (S3, −5.5 m).
Jmse 13 02188 g012
Figure 13. The relationship between sediment concentration and tidal current velocity from 0:00 am, 7 October to 11:00 pm, 11 October 2009 (S3, −5.5 m).
Jmse 13 02188 g013
Figure 14. The relationship between sediment concentration and tidal current velocity from 12:00 am, 20 September to 11:00 pm, 22 September 2009 (S4, −7 m).
Jmse 13 02188 g014
Figure 15. The relationship between sediment concentration and wave height from 00:00 am, 31 October to 11:00 pm, 3 November 2009 (S1, −3 m).
Jmse 13 02188 g015
Figure 16. Wave rose for the period of typhoon Wipha, from 06:00 pm, 18 September to 07:00 am, 21 September 2007.
Jmse 13 02188 g016
Figure 17. Wind speed and wave height variation chart during typhoon Wipha from 06:00 pm, 18 September to 07:00 am, 21 September 2007.
Jmse 13 02188 g017
Figure 18. The relationship between sediment concentration and wave height from 06:00 pm on 18 September to 07:00 am, 21 September 2007 (S1, −3 m).
Jmse 13 02188 g018
Figure 19. The relationship between sediment concentration and wave height from 06:00 pm, 18 September to 07:00 am, 21 September 2007 (S2, −5 m).
Jmse 13 02188 g019
Figure 20. The relationship between sediment concentration and wave height from 01:00 pm, 3 December to 03:00 pm on 8 December 2008 (S2, −5 m).
Jmse 13 02188 g020
Figure 21. The relationship between sediment concentration and wave height from 01:00 pm, 3 December to 03:00 pm, 8 December 2008 (S6, −10 m).
Jmse 13 02188 g021
Figure 22. The relationship between sediment concentration and wave height from 00:00 am, 28 August to 11:00 pm, 30 August 2009 (S1, −3 m).
Jmse 13 02188 g022
Figure 23. The relationship between sediment concentration and wave height from 12:00 am, 16 October to 11:00 pm, 17 October 2009 (S1, −3 m).
Jmse 13 02188 g023
Figure 24. The relationship between sediment concentration and wave height from 0:00 am, 7 September to 12:00 am, 10 September 2009 (S2, −5 m).
Jmse 13 02188 g024
Figure 25. The relationship between sediment concentration and wave height from 00:00 am, 7 October to 11:00 pm, 11 October 2009 (S2, −5 m).
Jmse 13 02188 g025
Figure 26. The relationship between sediment concentration and wave height from 12:00 am, 20 September to 11:00 pm, 22 September 2009 (S4, −7 m).
Jmse 13 02188 g026
Figure 27. Variation in wave height and wave height difference at −3 m and −5 m observation points during typhoon “Weipa” (S1 and S2 September 2007).
Jmse 13 02188 g027
Figure 28. Distribution curve of wave energy loss γ H 2 / T and sediment suspension power at S1 observation point (−3 m, September 2007).
Jmse 13 02188 g028
Figure 29. Distribution curve of wave energy loss γ H 2 / T and sediment suspension power at S2 observation point (−5 m, September 2007).
Jmse 13 02188 g029
Figure 30. Comparison between calculated value of Equation (15) and measured sediment concentration.
Jmse 13 02188 g030
Figure 31. Comparison between calculated value of Equation (16) and measured sediment concentration.
Jmse 13 02188 g031
Figure 32. Comparison between calculated value and measured value of instantaneous sediment concentration from 06:00 pm, 18 September to 07:00 am 21 September 2007 (S2, −5 m).
Jmse 13 02188 g032
Figure 33. Comparison between calculated value and measured value of instantaneous sediment concentration from 01:00 pm, 3 December to 03:00 pm 8 December 2008 (S2, −5 m).
Jmse 13 02188 g033
Figure 34. Comparison between calculated value and measured value of instantaneous sediment concentration from 01:00 pm, 3 December to 03:00 pm 8 December 2008 (S5, −7.9 m).
Jmse 13 02188 g034
Figure 35. Comparison between calculated value and measured value of instantaneous sediment concentration from 01:00 pm, 3 December to 03:00 pm 8 December 2008 (S6, −10 m).
Jmse 13 02188 g035
Figure 36. Comparison between the proposed formula and the benchmark formula for model validation at the S2 measurement site (−5 m, 18:00, 18 September–07:00, 21 September 2007).
Jmse 13 02188 g036
Figure 37. Comparison between the proposed formula and the benchmark formula at the S2 measurement site (−5 m, 13:00, 3 December–15:00, 8 December 2008).
Jmse 13 02188 g037
Figure 38. Comparison between the proposed and benchmark formulas based on measurements at the S5 site (−7.9 m, 13:00, 3 December –15:00, 8 December 2008).
Jmse 13 02188 g038
Figure 39. Comparison between the proposed formula and the benchmark formula at the S6 measurement site (−10 m, 13:00, 3 December–15:00, 8 December 2008).
Jmse 13 02188 g039
Figure 40. Variation in shear stress and sediment concentration in Lianyungang sea area during typhoon “Weipa”.
Jmse 13 02188 g040
Figure 41. Variation in suspended sediment concentration caused by wave and tide in Lianyungang sea area during typhoon “Weipa”.
Jmse 13 02188 g041
Table 1. Measured data in windy days.
Event NameTemporary StationWater DepthObservation EquipmentObservation
Period
Data Type
Typhoon “Wipha”S1−3 m1 wave and tide gauge, 2 RBR
turbidity meters, 1 CTD
instrument (sediment concentration)
19 September 2007~21 September 2007W, Z, V, C
S2−5 m1 wave dragon, 2 RBR turbidity
meters, 1 CTD instrument
(sediment concentration)
19 September 2007~21 September 2007W, Z, V, C
Cold Wave and Strong Wind in December 2008S1−3 m1 ADCP (for wave measurement),
2 RBR turbidity meters, 1 CTD instrument (sediment concentration)
3 December 2008~8 December 2008W, Z, V, C
S2−5 m1 wave dragon (for measuring waves and ocean currents), 2 RBR turbidity meters, 1 CTD instrument (sediment concentration)3 December 2008~8 December 2008W, Z, V, C
S5−7.9 m1 wave dragon, 2 RBR turbidity meters, 1 CTD instrument (sediment concentration)3 December 2008~8 December 2008W, Z, V, C
S6−10 m1 wave dragon, 2 RBR turbidity meters, 1 CTD instrument (sediment concentration)3 December 2008~8 December 2008W, Z, V, C
Cold Wave and Strong Wind (August to November 2009)S1−3 mADCP, OBS-3A self-contained turbidity meter13 August 2009~6 November 2009W, Z, V, C
S3−5.5 mADCP, OBS-3A self-contained turbidity meter, In Situ tide gauge2 September 2009~28 October 2009W, Z, V, C
S4−7 mNortek AWAC 1 MHz (wave dragon), Nortek Aquadopp Profiler 2 MHz (broad dragon), OBS3A turbidity meter, OBS3plus turbidity meter5 August 2009~5 November 2009W, Z, V, C
Table 2. Station instrument measurement range and accuracy.
Instrument NameModelTechnical Specifications
In Situ Tide GaugeLEVEL TROLL 500Measurement accuracy: ±6 cm Measurement range: 0–60 m
“OBS-3A” TurbidimeterOBS-3AMeasurement accuracy: ±2% of the measured value Measurement range: 0.2–4000 NTU
RBR TurbidimeterXR-420Measurement accuracy: ±1% of the measured value Measurement range: 0–2500 FTU
ALEC ATU75W Self-Contained TurbidimeterALEC ATU75WMeasurement accuracy: ±0.3 FTU Measurement range: 0–1000 FTU
Acoustic Doppler Current Profiler (ADCP)Junma Sentinel Self-Contained ADCP (1200 KHz)Current direction error: ±2 °Current velocity error: ±0.25% of the measured value ±2.5 mm/s Wave height accuracy: 1% of the measured value; Wave direction accuracy: ±2°Measurement range: Current velocity: 0.01–20 m/s; Current direction: 0–360°; Wave height: 0–20 m; Period: 2–30 s
Nortek AWAC 1 MHz (Wave Dragon)Nortek AWAC 1 MHzMeasurement accuracy: Current velocity: 1% of the measured value ±0.5 cm/s Measurement range: Horizontal current velocity: ±10 m/s; Along-beam current velocity: ±5 m/s
Nortek Aquadopp Profiler 2 MHz (Broad Dragon)Aquadopp ProfilerMeasurement range: Current velocity: ±10 m/s (range extension required) Measurement accuracy: 1% of the measured value ±0.5 cm/s
Japanese COMPACT-CTD Temperature-Depth-Salinity-Sediment GaugeCOMPACT-CTDSuspended sediment concentration: 0–5000 ppm Measurement accuracy: ±2% of the measured value
Table 3. Variation in sediment concentration induced by waves and tides during typhoon “Weipa”.
TimeMean Value of the Measured Sediment Concentration
(kg/m3)
Equation (16) Computes the Mean (kg/m3)Mean Sediment Concentration Induced by Waves (kg/m3)Mean Concentration of Tidal Sediment (kg/m3)The Ratio of Sediment Concentration Induced by Waves and Currents
During the typhoon event spanning (8:00 on the 18th to 7:00 on the 21st0.460.430.290.142.1
During the period of big waves ( H 1 / 3 > 1.5   m , From 12:00 on the 19th to 15:00 on the 20th)0.700.730.420.212.0
Disclaimer/Publisher’s Note: The statements, opinions and data contained in all publications are solely those of the individual author(s) and contributor(s) and not of MDPI and/or the editor(s). MDPI and/or the editor(s) disclaim responsibility for any injury to people or property resulting from any ideas, methods, instructions or products referred to in the content.