Article

Attitude Control Method and Model Test for the Wave-Absorbing Buoy of the Sharp Eagle Wave Energy Converter Under All-Sea-State Operations

1
School of Energy Science and Engineering, University of Science and Technology of China, Guangzhou 510640, China
2
Guangzhou Institute of Energy Conversion, Chinese Academy of Sciences, Guangzhou 510640, China
*
Author to whom correspondence should be addressed.
J. Mar. Sci. Eng. 2025, 13(11), 2184; https://doi.org/10.3390/jmse13112184
Submission received: 14 October 2025 / Revised: 7 November 2025 / Accepted: 8 November 2025 / Published: 18 November 2025
(This article belongs to the Special Issue Control and Optimization of Marine Renewable Energy Systems)

Abstract

As a critical component of marine renewable energy, wave energy has long remained a focal point in research on development and use. The Sharp Eagle wave energy converter (hereafter, Sharp Eagle WEC) exhibits wave energy capture efficiency-related advantages, which are attributed to the unique structural configuration of its Sharp Eagle wave-absorbing buoy (hereafter, buoy). Operational observations reveal that under severe sea conditions, buoy motion amplitude increases significantly. Consequently, the downstream hydraulic and power generation systems experience excessive power loads, and the converter exceeds displacement limits, causing collisions with end-stop structures, which compromises operational safety. Research findings indicate that the attitude of the buoy directly governs its motion characteristics. We proposed a ballast-and-load-based attitude control method for the buoy. This approach provides safe and efficient operation across all sea conditions. Via scaled model tests, converter operational data covering various ballast configurations were compared and analyzed, focusing on the effects of ballast on the capture width ratio (hereafter, CWR) and piston displacement range of energy conversion hydraulic cylinders. Herein, the feasibility of adjusting capture efficiency and motion displacement by controlling the buoy attitude is validated, providing a technical framework for efficient and safe operation of the WEC under all sea conditions.

1. Introduction

With the accelerated global energy transition, wave energy, which is an abundant, clean, and renewable marine energy source, has become a research focus in the field of marine energy development and utilization. According to the Guiding Opinions on Promoting the Large-Scale Utilization of Marine Energy, which was jointly released by China’s Ministry of Natural Resources and five other central ministries and commissions on 5 February 2025, the development of marine energy is conducive to advancing new productive forces. It holds great significance for alleviating power shortages in eastern coastal areas and island regions of China, as well as for promoting the construction of a renewable energy system and the development of the marine economy. Globally, numerous countries are supporting the development of wave energy technologies and the deployment of WECs through policy guidance and financial support, which is driving the vigorous advancement in this green power generation technology [1]. Marine renewable energy includes mainly wave energy, tidal energy, ocean thermal energy conversion (OTEC), salinity gradient energy (SGE), and ocean current energy [2]. As a clean and renewable energy source, wave energy exhibits a global theoretical reserve of 20–26 PWh per year, with that in nearshore areas alone ranging from 1.4 to 1.7 PWh per year [3]. This substantial resource scale endows it with substantial decarbonization potential [4], thereby providing a crucial practical pathway for the world to address climate change and achieve the essential goal of the Paris Agreement. Moreover, the number of governments that have committed to reducing greenhouse gas emissions to net zero by the mid-21st century is rapidly increasing [5].
WECs are critical for wave energy utilization. On the basis of differences in their operating principles, they can be categorized into three types: oscillating water columns (OWCs), oscillating body systems, and overtopping devices [6]. Among these systems, oscillating body systems capture wave energy through the reciprocating motion of buoys that is driven by wave action. As a variant of the oscillating body type, the Sharp Eagle WEC is modified from the Edinburgh Duck WEC [7]. It features a reduced moment of inertia for its buoys and is articulated on a semisubmersible platform to both optimize wave energy capture efficiency and enhance deep-sea adaptability. To date, multiple Sharp Eagle WECs with power ratings that range from 10 kW to 1000 kW have been developed, and a grid-connected power supply for remote islands has been successfully achieved [8,9]. The megawatt-scale floating WEC, denoted Nankun, was designed to operate in a wave height range of 0.5–5 m and can achieve effective power generation. However, wave heights in the South China Sea during autumn and winter often exceed the 5 m safe operating threshold, which directly results in a significant increase in the protective shutdown duration of the device [10].
As a renewable energy source, wave energy is susceptible to weather-induced fluctuations and exhibits strong seasonality. For instance, in the sea area of the planned offshore wind power site in eastern Guangdong, the average wave power density can reach 8–12 kW/m in the winter but ranges from 3 to 4 kW/m in the summer. Additionally, influenced by typhoons, wave parameters in this sea area exhibit significant volatility from July to October [11,12]. This characteristic is not exclusive to China’s sea areas; wave energy in other regions also exhibits seasonal fluctuation patterns. In contrast, the offshore waters of the northern Oman Gulf have a higher average wave power density (0.26–11.88 kW/m) in summer than in winter (0.17–1.51 kW/m) [13]. Given these characteristics of wave energy, WECs must possess all-sea-states adaptability: maintaining high efficiency in energy capture under moderate to rough sea conditions, reducing capture efficiency and limiting the piston movement range of the energy conversion hydraulic cylinders under severe sea conditions to ensure operational safety, and submerging the buoy as well as locking it under extreme sea conditions. The demand for all-sea-state operations poses new challenges for the structural design [14,15] and dynamic control strategies [16] of WECs. Therefore, in this study, we proposed an optimization method that is based on the attitude control of buoys:
  • Under moderate to rough sea conditions, the wave energy capture efficiency can be maximized by adjusting the ballast and static angle;
  • Under severe sea conditions, the static angle is reduced by increasing the ballast to proactively lower the wave energy capture efficiency, restrict the piston movement range of the energy conversion hydraulic cylinders, avoid overpower operation of the generator set, and prevent rigid collisions between the buoys and end-stop structures;
  • Under extreme sea conditions, since conventional adjustments can no longer meet safety requirements, we adopted a special control method of buoy submersion and locking to achieve emergency safety protection for the converter.
Furthermore, scaled model tests were conducted to adjust the static attitude of the buoys of the Sharp Eagle WEC by controlling their ballast. The correlations between variables (e.g., incident wave height, incident wave period, and load) and key performance indicators (i.e., CWR and piston movement range of the energy conversion hydraulic cylinders) under different static attitudes of the buoys in still water were investigated. Ultimately, this research provides data support for the attitude control strategy of the Sharp Eagle WEC under real-world sea conditions.

2. Attitude Control Method for the Buoys

2.1. Attitude Characteristics of the Buoys

The Sharp Eagle WEC captures wave energy via its buoys, which are shaped like an eagle’s beak. The motion of the buoys drives the hydraulic cylinders, which in turn inject hydraulic oil into high-pressure accumulators. Afterward, the high-pressure oil in the accumulators drives a hydraulic motor, which further drives a generator to convert hydraulic energy into electrical energy [17]. The attitude of the buoys is a key factor that influences their motion response under wave forces and can be categorized into two types: static attitude and dynamic attitude.
The static attitude of the buoys is an adjustable variable for attitude control research. By modifying the ballast and its distribution inside the buoys, the static draft depth and static angle of the buoys can be adjusted, thereby regulating the energy capture efficiency. In contrast, the dynamic attitude includes six degrees of freedom (6-DOF) motion state quantities, namely, roll, pitch, yaw, heave, sway, and surge.
The Sharp Eagle buoys are connected to a semisubmersible platform via hinges at their bottom, and they can rotate around the hinges under the action of wave forces. Therefore, the motion of the buoys relative to the platform is dominated by the pitch direction. There is a geometric correspondence between the pitch angle of the buoys relative to the platform and the piston positions of the energy conversion hydraulic cylinders, i.e., the pitch angle of the buoys is geometrically correlated with the piston positions of the energy conversion hydraulic cylinders. Thus, by measuring the piston movement positions of the energy conversion hydraulic cylinders, the pitch angle of the buoys relative to the semisubmersible platform can be indirectly inverted, which allows for the intuitive evaluation of the actual effect of the dynamic attitude control strategy for the buoys.
To quantify the static attitude of the Sharp Eagle buoys, the hinge between each buoy and the platform is taken as the center of rotation. The upward movement direction of the buoys relative to the water surface is defined as positive, and the static angle of the buoys under the rated ballast is set to 0°, as shown in Figure 1a. Increasing the ballast inside the buoys increases the draft depth of the buoys, which causes the static angle to increase in the negative direction and reach −3° and −6°, as shown in Figure 1b and c, respectively.
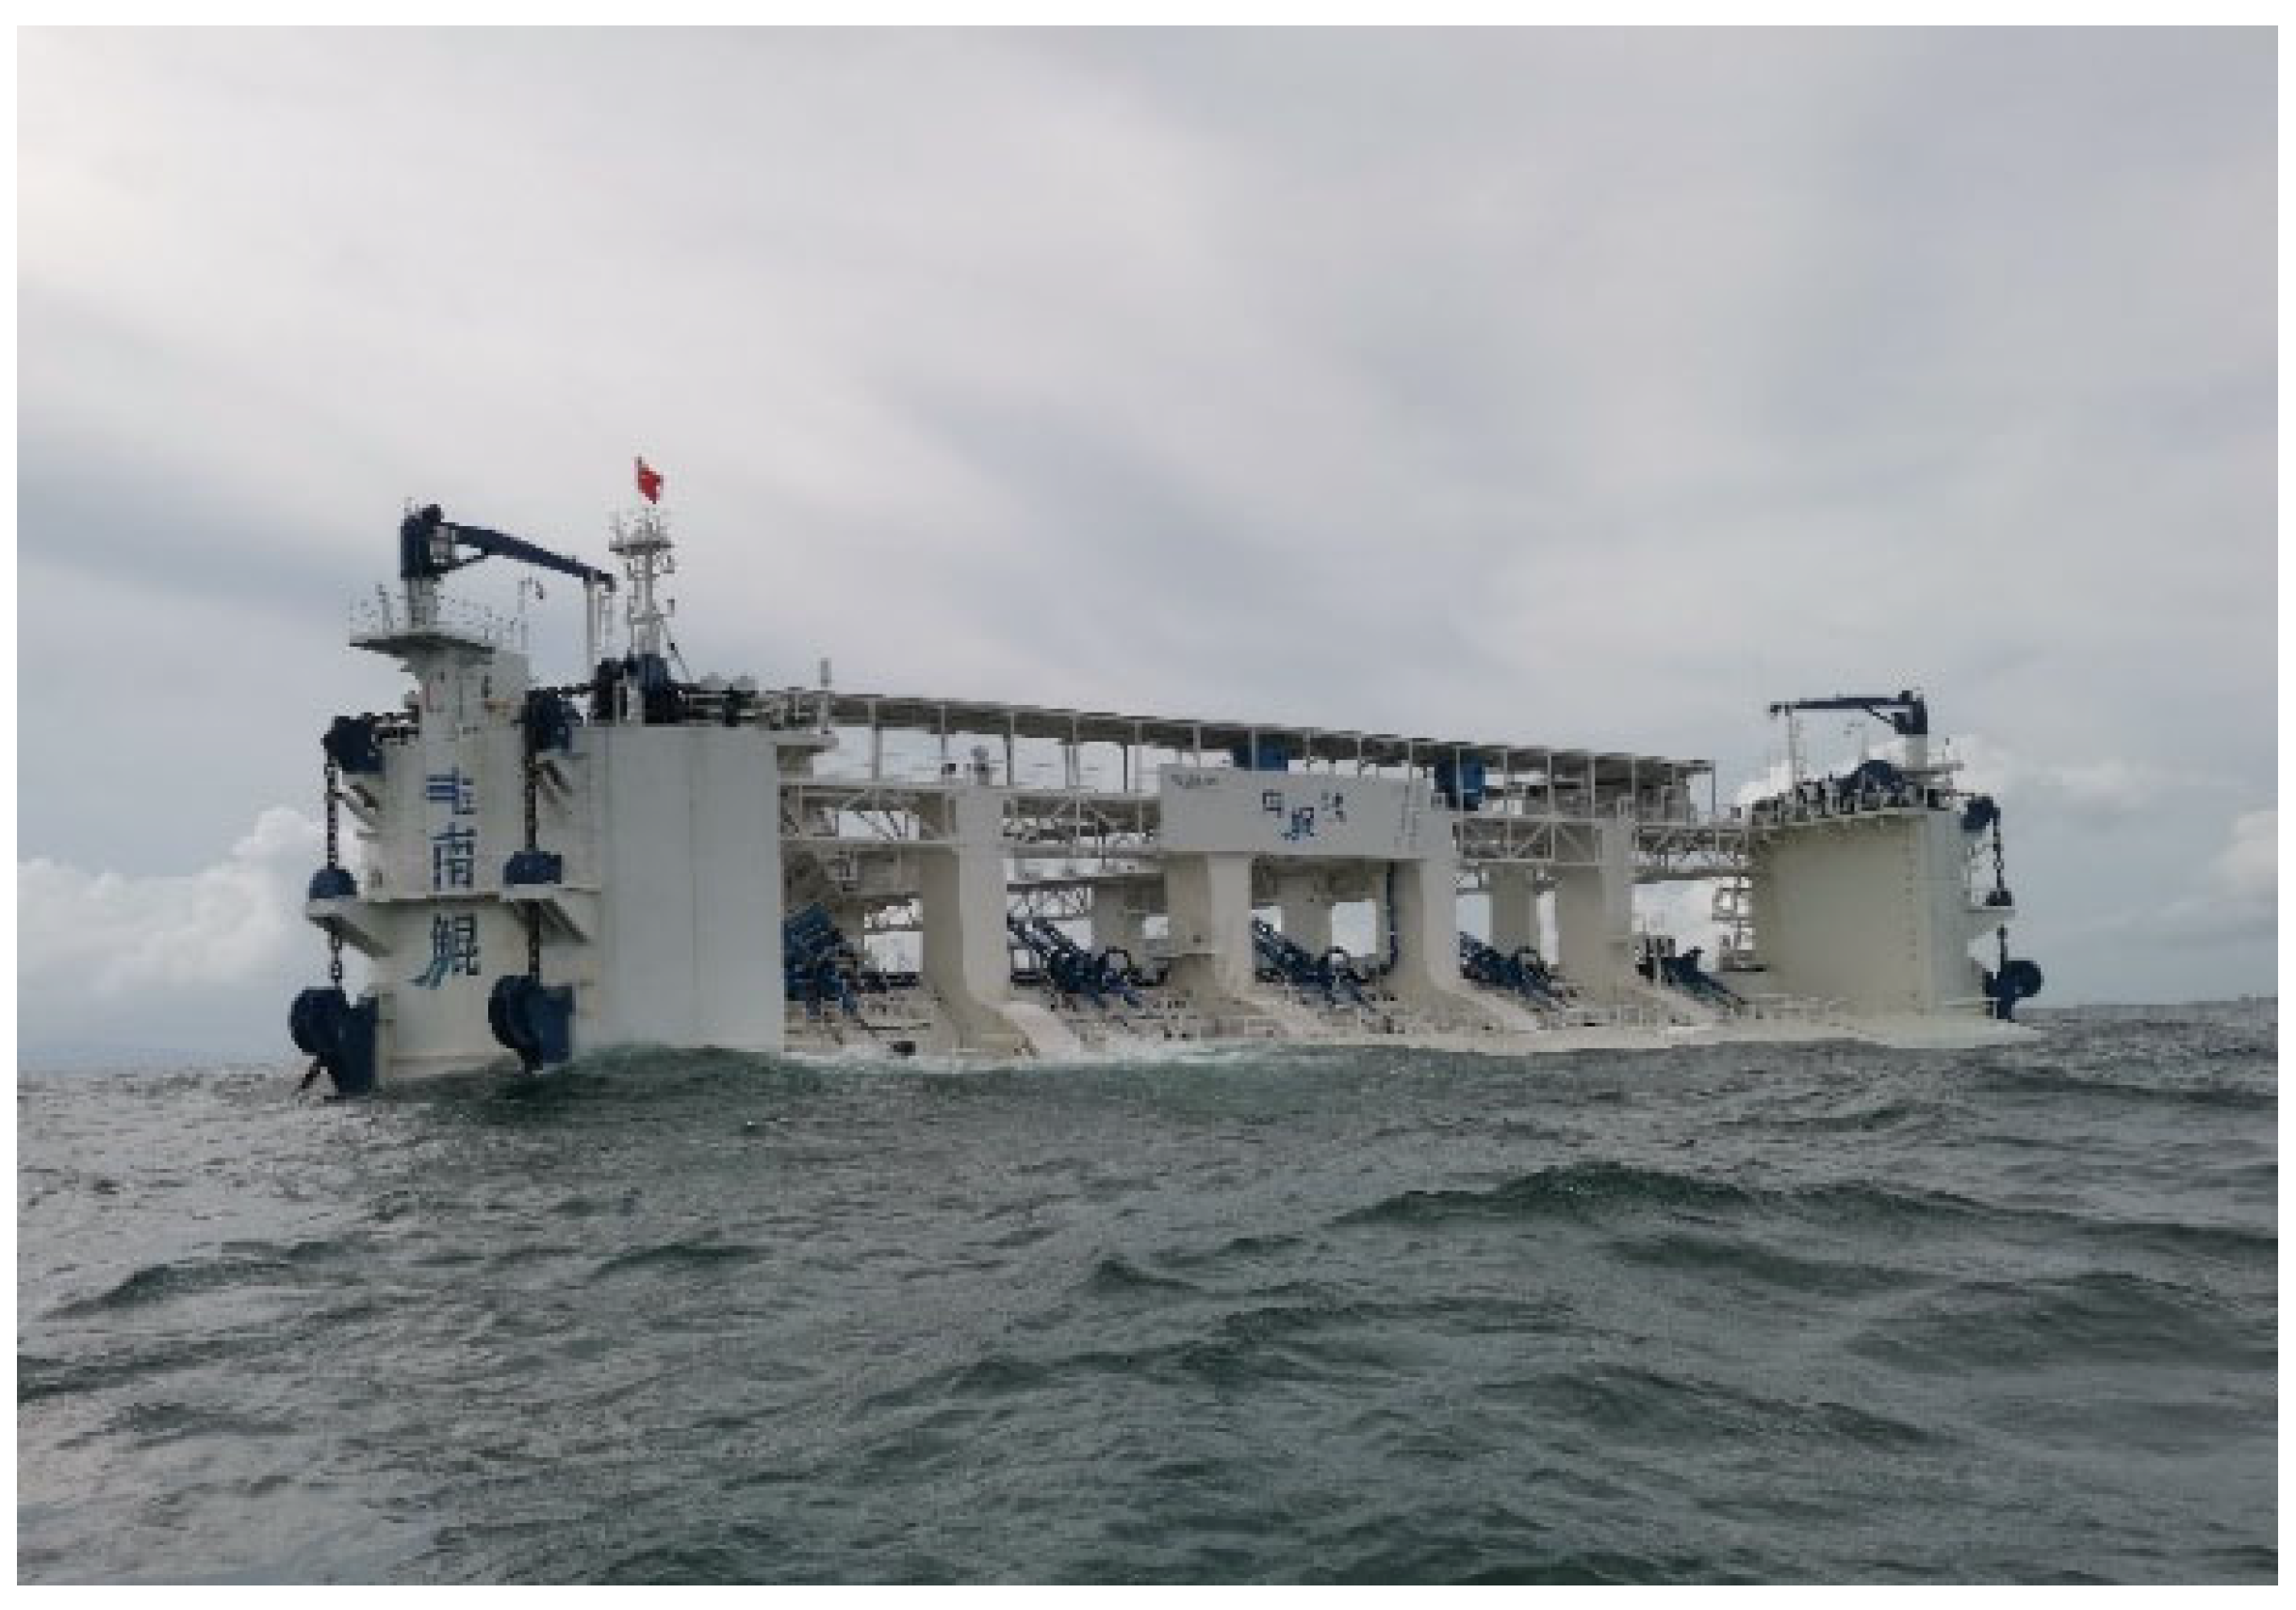
The static angle of the Sharp Eagle buoys is reduced by increasing their ballast. On the basis of the principle of rigid body dynamics, the greater an object’s inertia is, the more difficult it is to change its motion state; an increase in the inertia of the buoys will lead to a weakened motion response and reduced wave energy capture efficiency. Thus, reducing the static angle of the Sharp Eagle buoys to submerge them more deeply in water helps restrict the buoys’ motion range under severe sea conditions and increases safety; however, this requires sacrificing a certain degree of energy capture efficiency. This is illustrated using the 1 MW Nankun WEC, which is shown in Figure 2, as an example.
The designed rated power generation capacity of a single buoy is 100 kW. From the perspective of structural safety, the piston movement range of the device’s energy conversion hydraulic cylinders is 6.7 m, whereas the effective movement range before the activation of the anticollision limit buffer device is 5.4 m. To reserve safety redundancy for transient load fluctuations under complex sea conditions, the upper limit of the piston movement range should not exceed 4.5 m during actual operation.
The motion of the Sharp Eagle buoys is driven by the combined action of the wave excitation force, the damping force of the energy conversion hydraulic cylinders, the buoys’ own gravity, and the hydrostatic buoyancy. This constitutes a complex dynamic process with multiforce coupling, and the motion state of the buoys is affected by three main categories of parameters:
  • Wave parameters (e.g., significant wave height and peak period);
  • Buoy structural parameters (e.g., draft depth and wave-facing area);
  • Hydraulic cylinder operating parameters (e.g., accumulator pressure and damping coefficient).
During the research, development, and operation of engineering equipment, wave input parameters can be obtained through short-term weather forecasts or real-time measurements from the device; the static angle of the buoys can be adjusted by controlling the ballast water level; and the accumulator pressure can be regulated via a hydraulic autonomous system. Therefore, we adopted a feedforward–feedback composite control strategy to achieve dual-variable coordinated optimization control. This strategy not only addresses predictable wave disturbances in advance through feedforward control but also corrects real-time deviations via feedback control.

2.2. Feedforward Hysteresis Control of the Static Angle for the Buoys

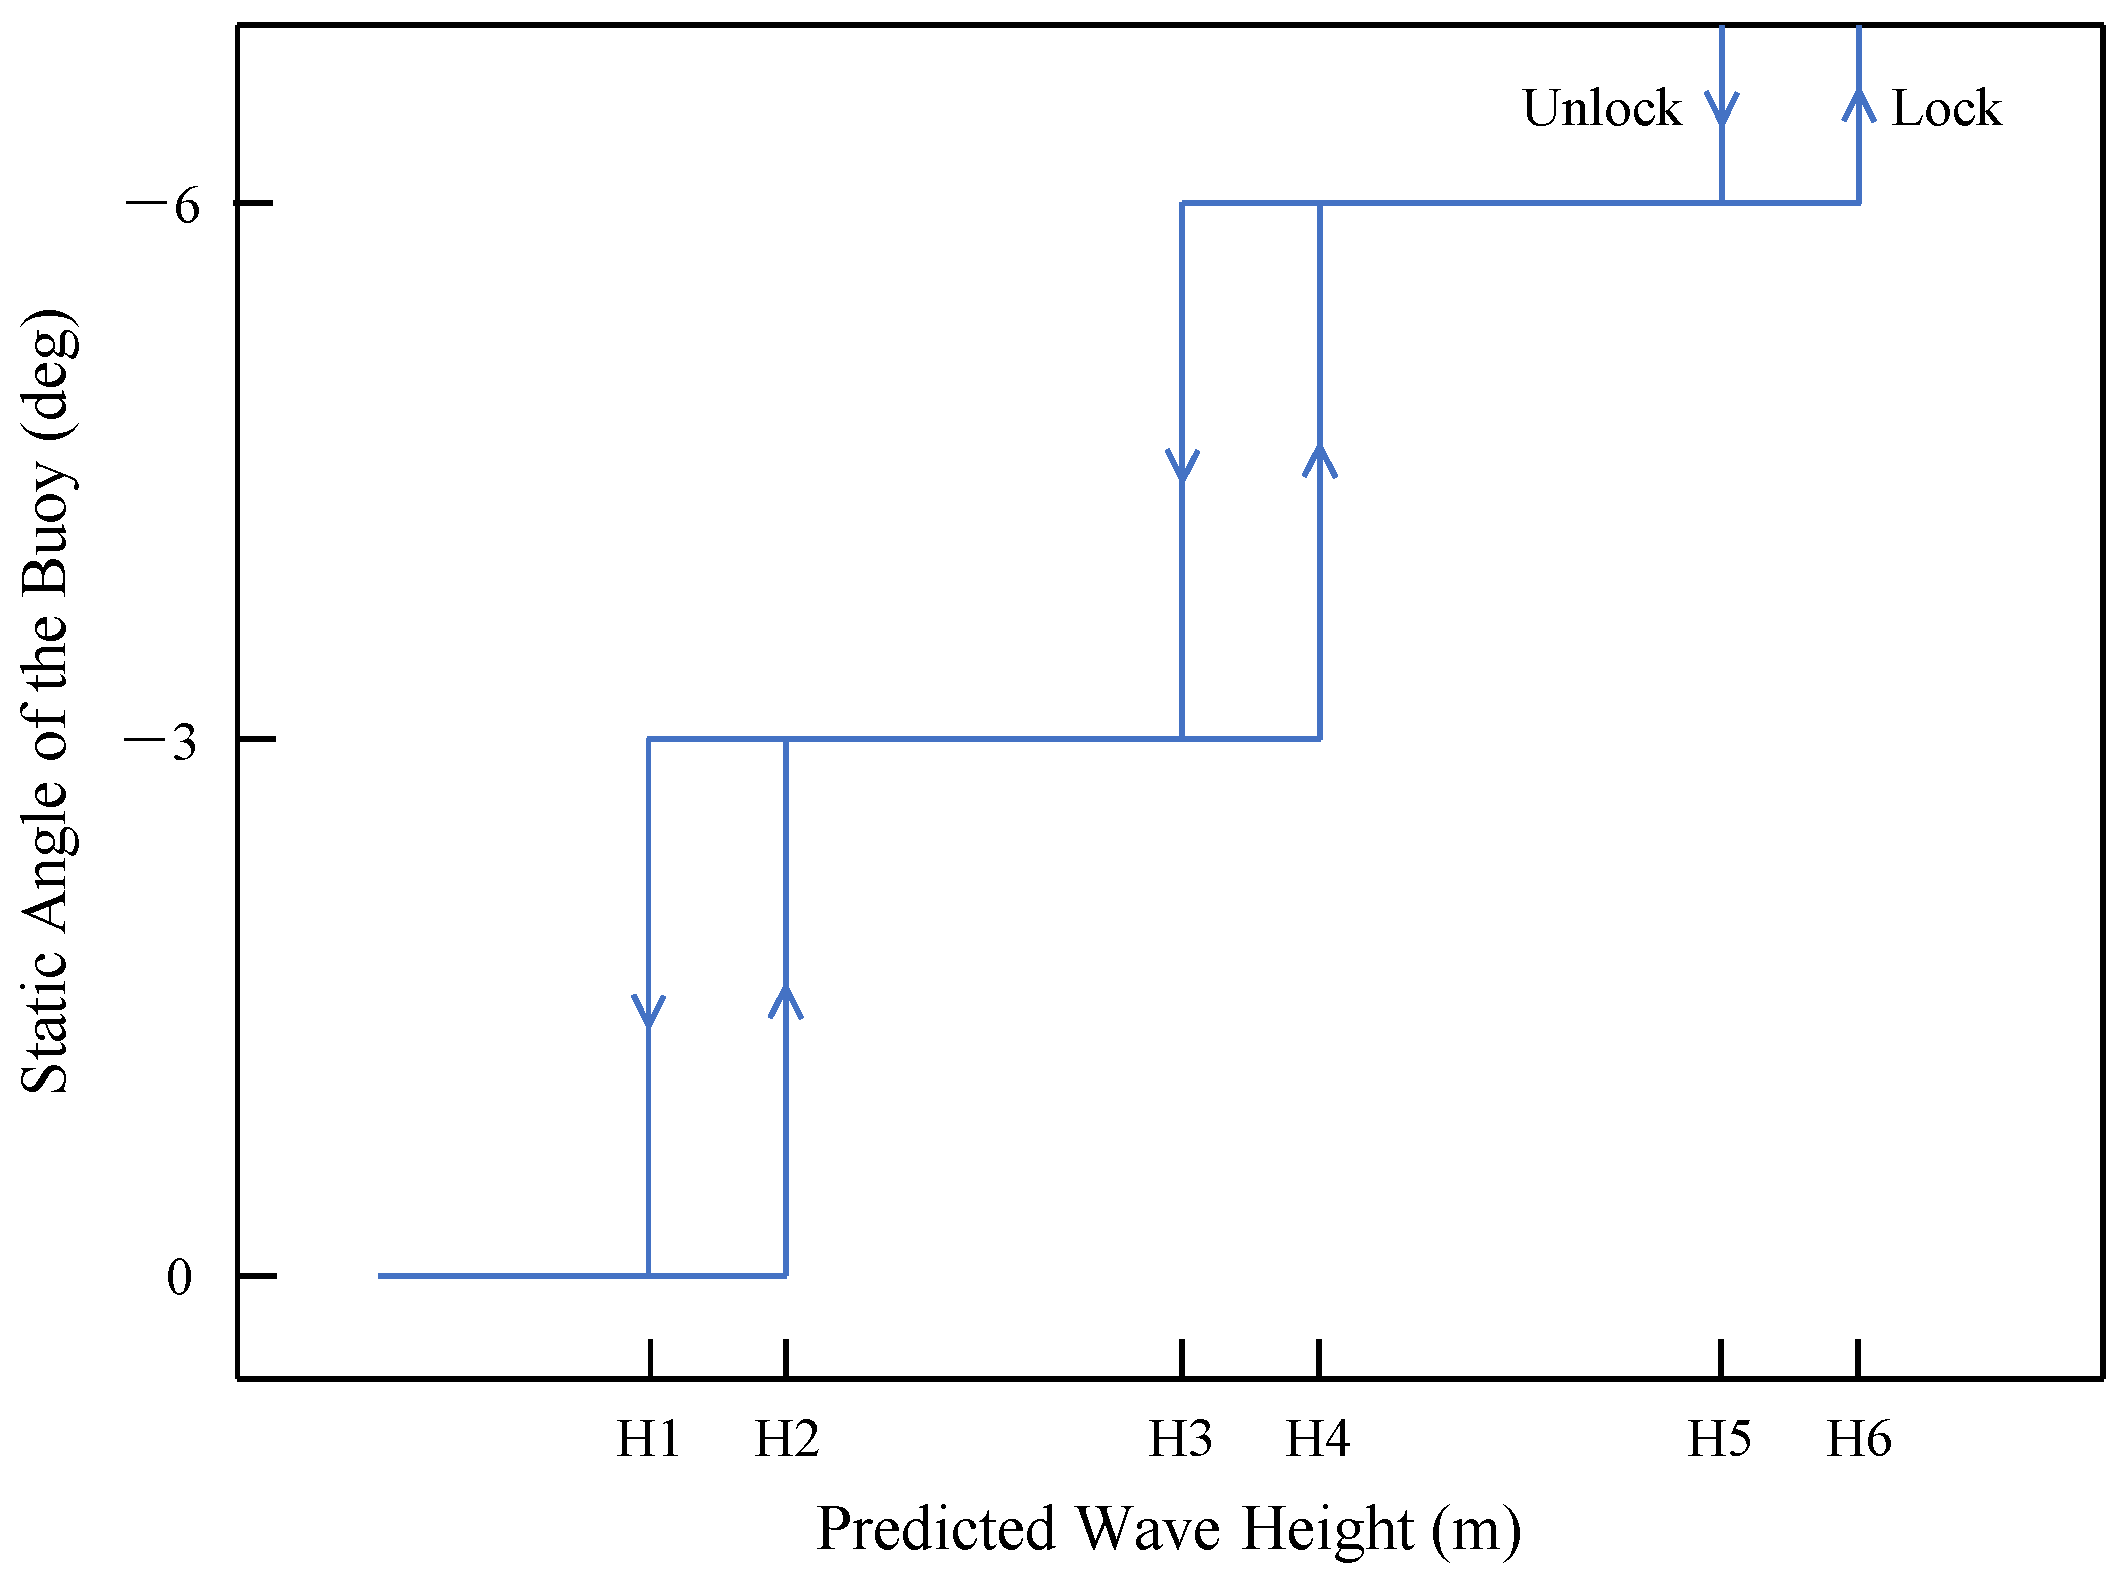
We adopted a feedforward hysteresis control strategy for the static angles of the buoys. We developed a differentiated adjustment scheme on the basis of the significant wave height parameters from short-term ocean wave forecasting [18], as shown in Table 1, and the hysteresis curve of predicted wave height and the static angle of the Sharp Eagle buoy is shown in Figure 3. Since the adjustment of the static angle relies on ballast water for actuation, it results in a relatively long adjustment delay. Therefore, planning the adjustment timing in advance on the basis of the actual adjustment rate and reserving sufficient time to ensure that the attitude adjustment is properly achieved are necessary.
Owing to the randomness of waves, a hysteresis control strategy is implemented to avoid chattering ballast adjustments of the buoys. Thus, the parameters satisfy H1 < H2 < H3 < H4 < H5 < H6, where H1 to H6 represent special control parameters for the buoys. The values of these parameters vary across different devices; however, their specific data must be continuously adjusted and optimized through numerical calculations, model tests, and actual sea-state operations. The output of the feedforward controller can be expressed by the following piecewise function.
C o u t k = 0           H H 2 C o u t k 1 = 0 H H 1 C o u t k 1 = 3 3     H > H 2 C o u t k 1 = 0 H 1 < H < H 4 C o u t k 1 = 3 H H 3 C o u t k 1 = 6 6     H > H 4 C o u t k 1 = 3 H 3 < H < H 6 C o u t k 1 = 6 H H 5 C o u t k 1 = L o c k L o c k H > H 6 C o u t k 1 = 6 H > H 5 C o u t k 1 = L o c k ,
where
  • C o u t ( k ) represents the output of the controller (unit: deg except Lock);
  • C o u t ( k 1 ) represents the controller’s previous output (unit: deg except Lock); and
  • H represents the weather forecast wave height, while H 1 to H 6 was shown in Figure 3.

2.3. Feedback Control of the Load Pressure of the Hydraulic Cylinders

The load pressure of the hydraulic cylinders, i.e., the pressure of the accumulators, is controlled by a feedback strategy, with the movement ranges of the hydraulic cylinders serving as the feedback signal. Specifically, the positions of the displacement sensor sample and the pistons are recorded at a set frequency, and the frequencies at which the pistons reach the motion boundaries are periodically measured.
  • If the pistons frequently reach the upper-limit protection points, the pressure of the accumulators is too low, which leads to insufficient load damping of the hydraulic cylinders; thus, a pressure increase command needs to be issued.
  • If the pistons frequently reach the lower-limit protection points, the pressure of the accumulators is too high, which inhibits the normal motion of the buoys; thus, a pressure decrease command needs to be issued.
  • If the pistons always move within the preset safe ranges without frequent contact with the protection boundaries, the current pressure is maintained.
In addition, safety constraints for the hydraulic system must be integrated: the upper-limit thresholds of the pressure of the accumulators should be clearly defined, and pressure relief valves should be configured. Multiple methods can be used to adjust the load pressure of hydraulic cylinders in full-scale devices, such as switching accumulators with different pressures and capacities and actively controlling the accumulators’ air pressure via an air pump; these methods will not be elaborated upon further here. The formula for determining the system pressure setpoint via displacement control is as follows.
P c m d ( k ) = P c m d ( k 1 ) + Δ P x X u p P c m d ( k 1 ) Δ P x X d o w n P c m d ( k 1 ) X d o w n < x < X u p ,
where
  • P c m d ( k ) represents the setpoint of the controller;
  • P c m d ( k 1 ) represents the previous setpoint of the controller;
  • Δ P represents the adjustment step of the controller; and
  • X u p and X d o w n are, respectively, the upper and lower protection limits for the displacement x of the hydraulic cylinder piston.

3. Experimental Design

3.1. Experimental Model

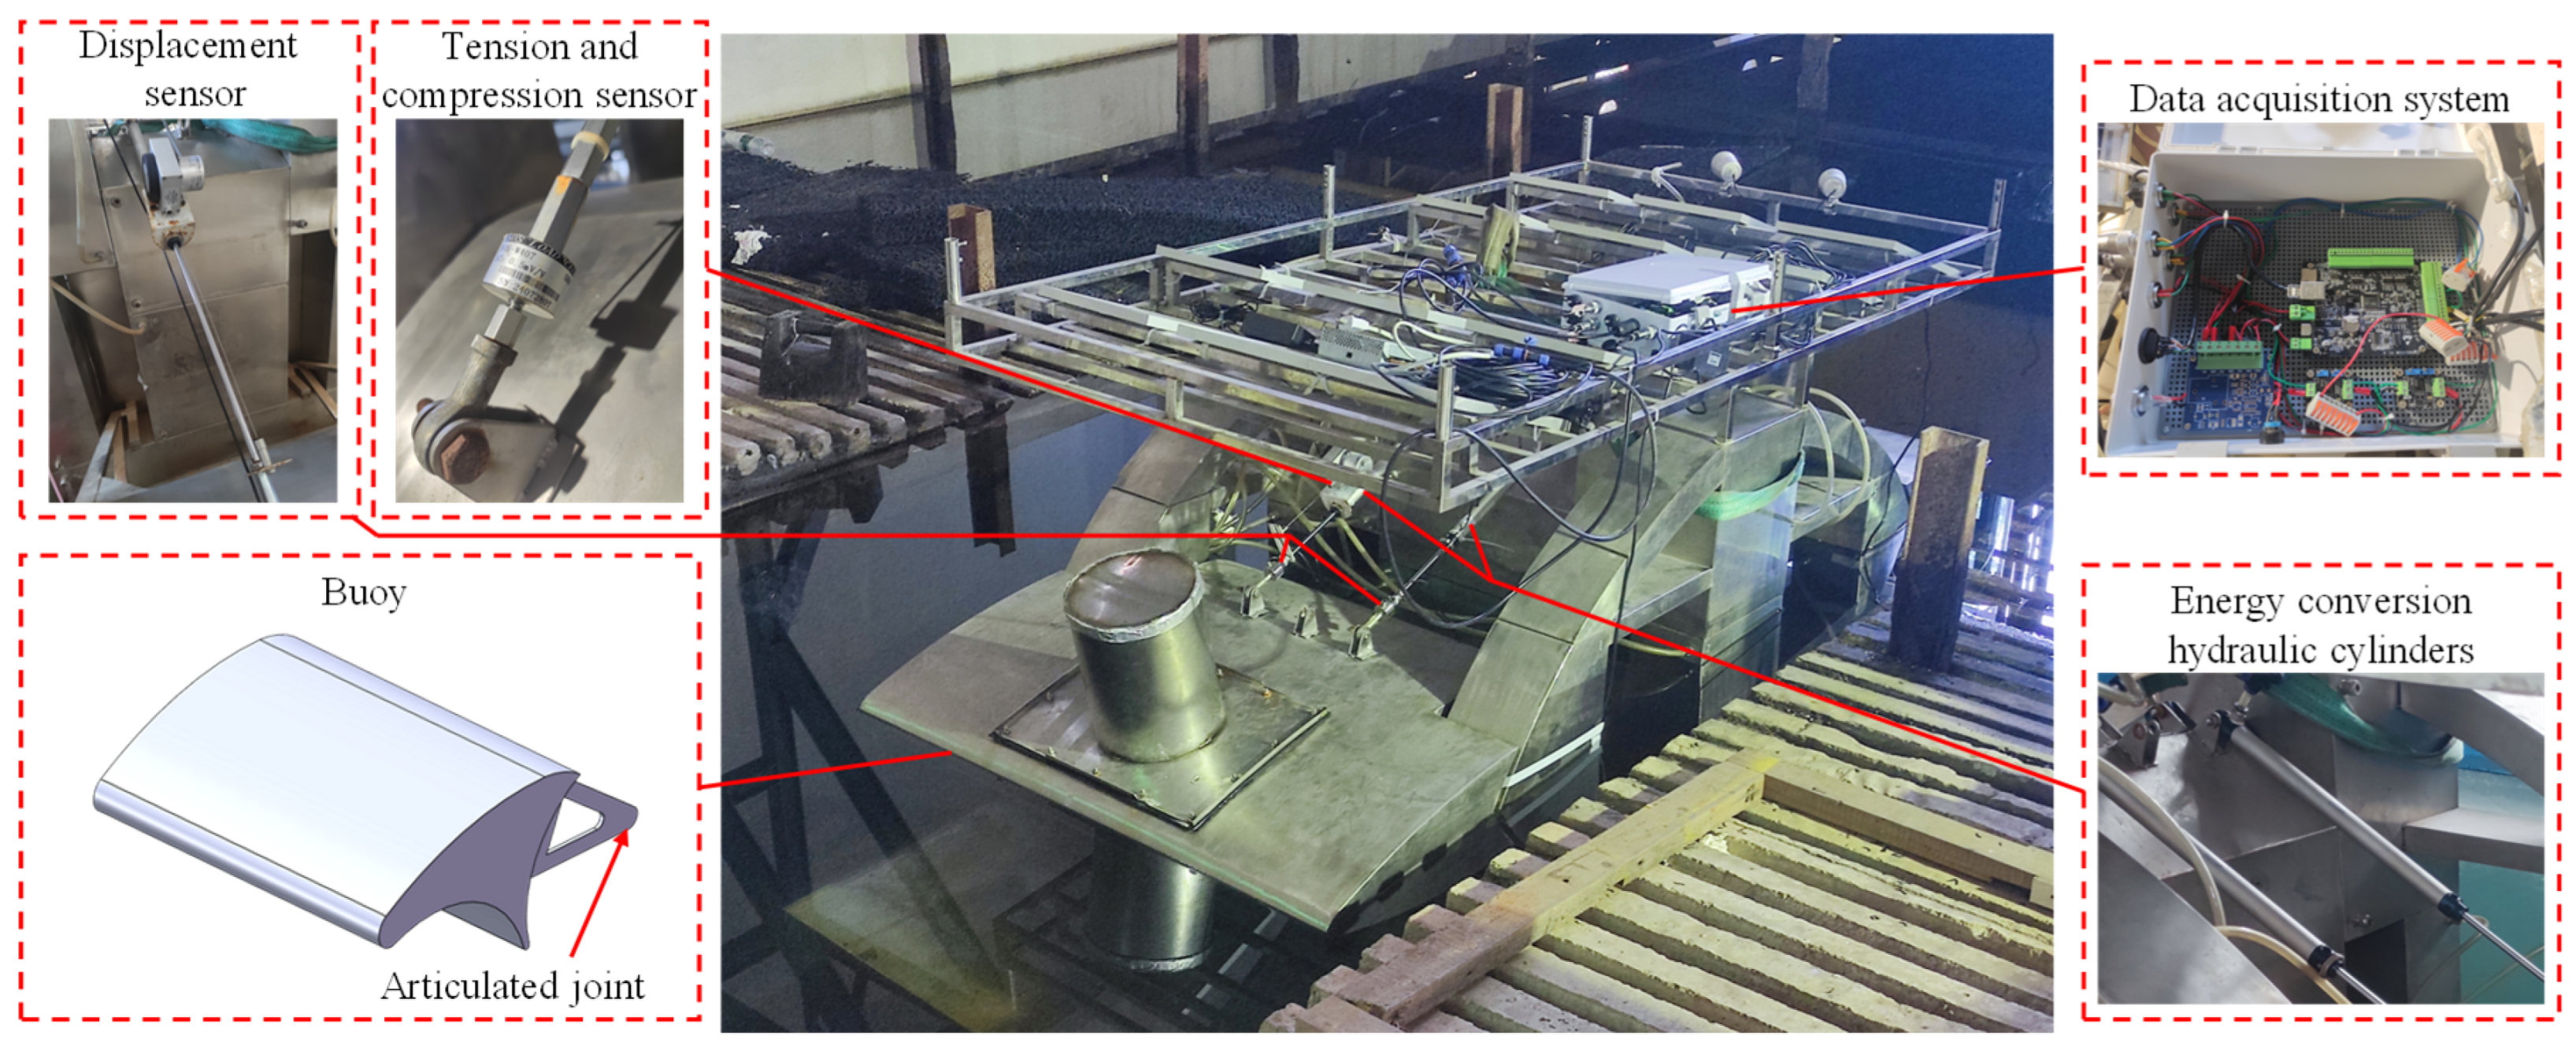
To verify the attitude control method of the buoy, a test model structure was designed, as shown in Figure 4.
The model comprises a semisubmersible platform, Sharp Eagle buoys, and energy conversion hydraulic cylinders, among other components. The semisubmersible platform is equipped with six hollow buoyancy tanks, each fitted with a valve that is connected to the external environment. By adjusting the water level inside the buoyancy tanks, the draft depth and attitude of the model can be controlled.
Two Sharp Eagle buoys are arranged symmetrically at the front and rear of the model. Each Sharp Eagle buoy is coupled to two hydraulic cylinders: the piston rod of each hydraulic cylinder is connected to the Sharp Eagle buoy via a rod-end spherical plain bearing, and the cylinder barrel is connected to the top of the semisubmersible platform through a hinge. This configuration enables power transmission from the wave-induced rotational motion of the buoy to the linear motion of the piston. The upper and lower limit points of the buoy are shown in Figure 5.
The cylindrical structure on the Sharp Eagle buoy provides a restoring moment when the buoy exhibits a relatively notable draft depth, thereby stabilizing the attitude of the buoy. A physical model of the WEC is shown in Figure 6.
Sensors and a data acquisition system are installed on the model. An NOS-W407 tension–compression sensor (0 ± 500 N, accuracy: ±0.3% FS) that was manufactured by NOS-SENSOR in Changsha, China is mounted between the hydraulic rod of each energy conversion hydraulic cylinder and the Sharp Eagle buoy to measure the axial force that is exerted by the buoy to push or pull the piston. Additionally, an ATS-S cable-type displacement sensor (frequency range: 1000 mm; accuracy: ±0.3% FS) that was produced by ANTAI in Jiangmen, China is mounted on the outside of the cylinder barrel of one energy conversion hydraulic cylinder to measure the piston displacement of the cylinder.
Both the tension–compression sensor and displacement sensor output analog signals in the range of 0–10 V. The sensor signals are input into an eight-channel data acquisition system, which communicates with a PC host computer via Ethernet. Power is supplied to the data acquisition system and sensors from a power supply, which is installed in a waterproof equipment box. This equipment box is fixed to a bracket on the top of the semisubmersible platform. Prior to data collection, the sensors and data acquisition system were calibrated to verify the accuracy of their measurements.
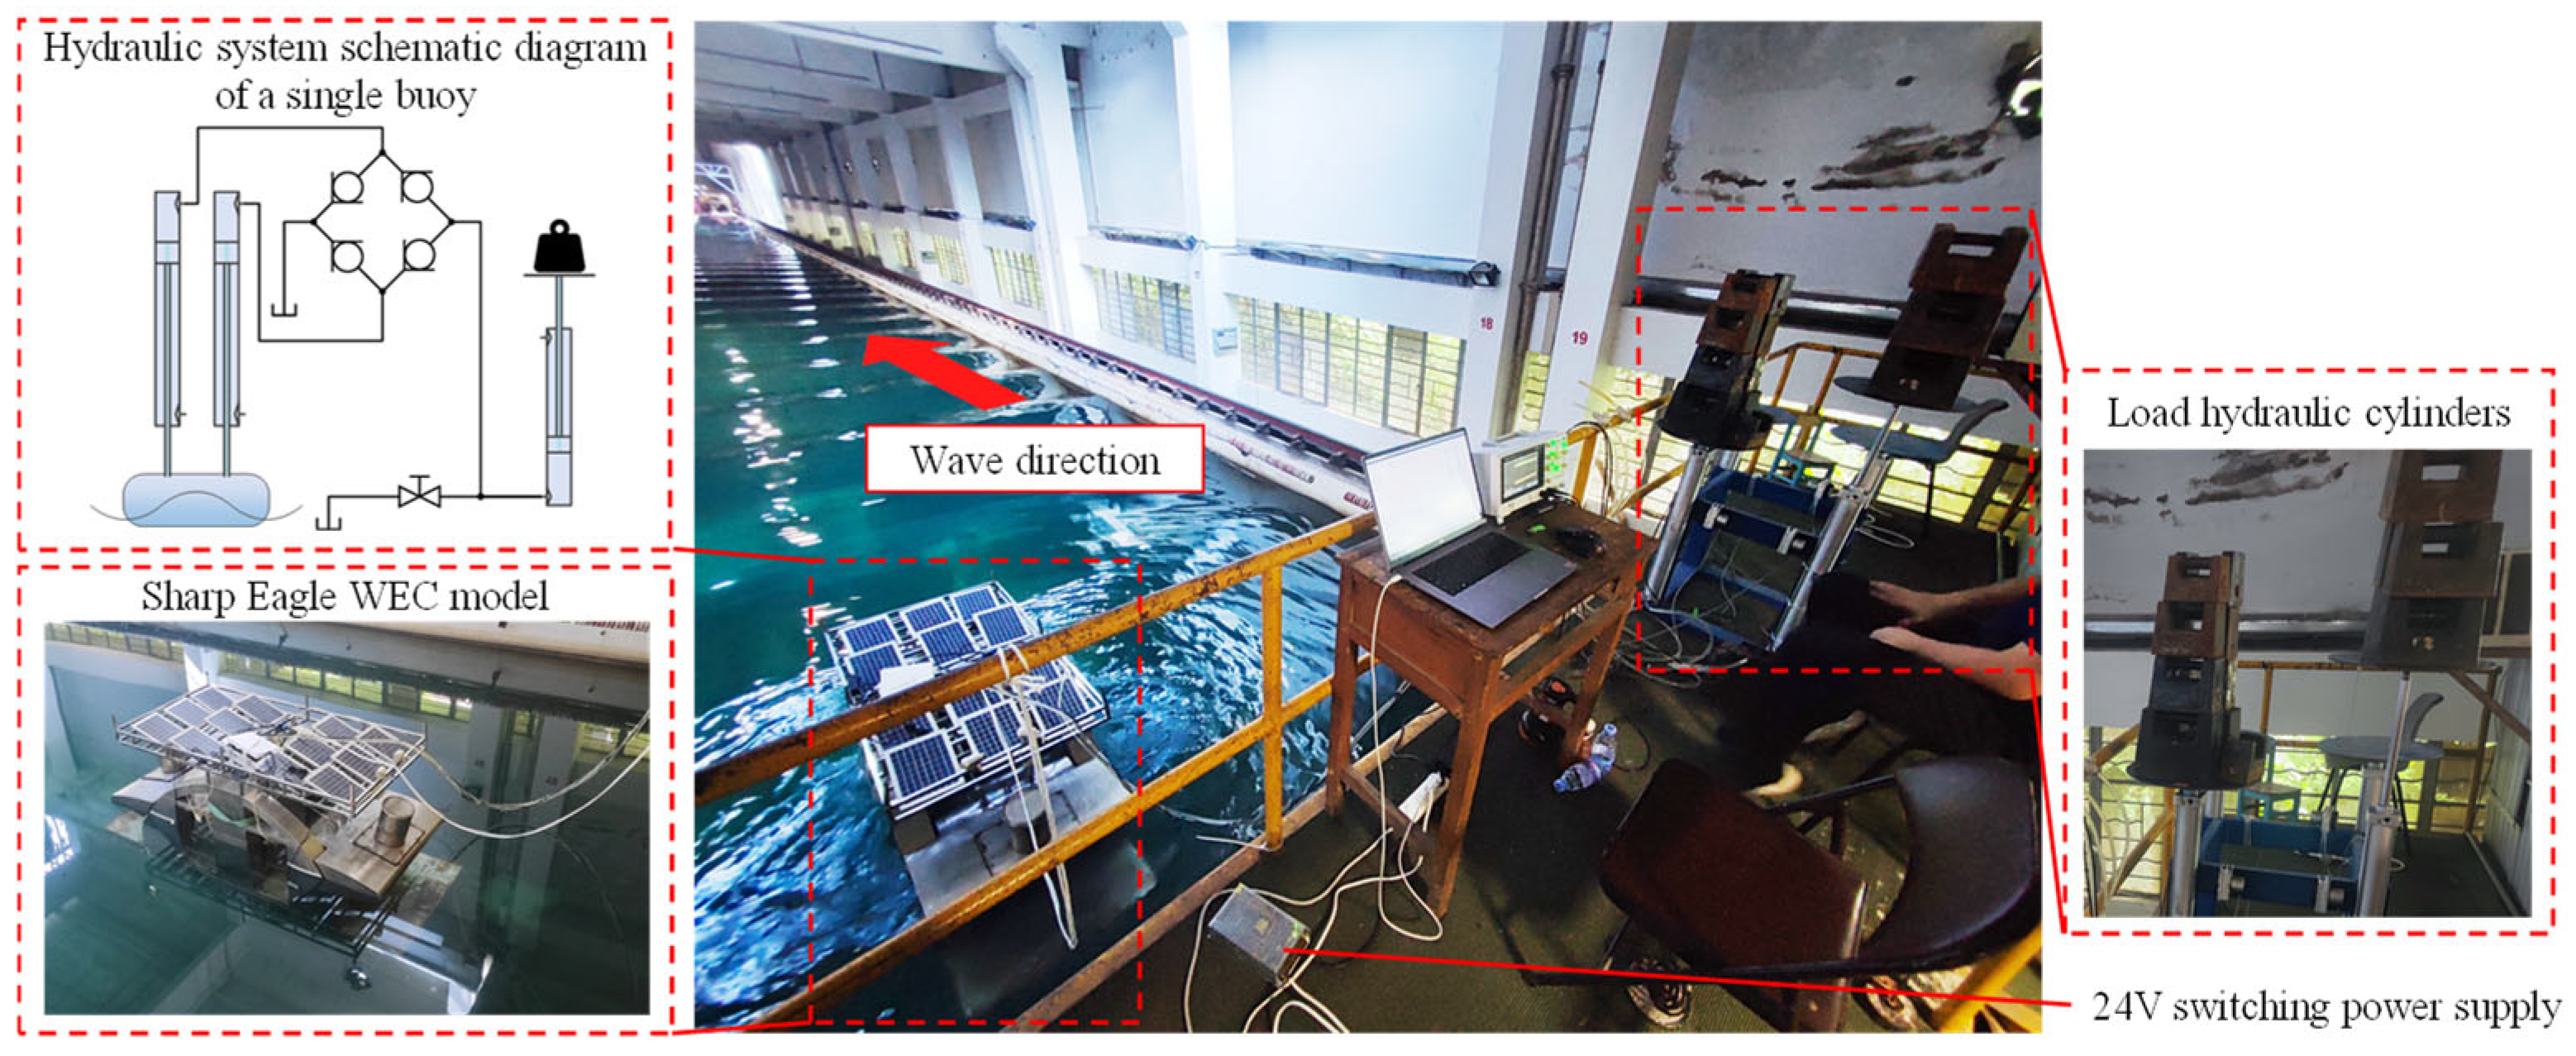
The energy conversion hydraulic cylinders have a bore diameter of 20 mm and a stroke of 300 mm, whereas the load hydraulic cylinders feature a bore diameter of 63 mm and a stroke of 600 mm, with power transmission realized through their rodless chambers. The hydraulic fluid from the two energy conversion hydraulic cylinders of each Sharp Eagle buoy flows through its respective one-way valve first before converging to connect to the load hydraulic cylinder that corresponds to that buoy. The hydraulic systems for the front and rear buoys are independent, as shown in Figure 7.
The cylinder barrel of the load hydraulic cylinder is vertically fixed on the horizontal ground, and a horizontal tray is mounted on its piston rod. The load pressure of the hydraulic cylinder is controlled by adjusting the counterweights on the tray. The energy conversion process of each Sharp Eagle buoy within one oscillation cycle is as follows:
  • During the downward movement phase of the buoy, the energy conversion hydraulic cylinders complete fluid replenishment;
  • During the upward movement phase of the buoy, the energy conversion hydraulic cylinders are pressurized, thereby displacing the hydraulic fluid through a one-way valve into the load hydraulic cylinder and driving the latter’s piston upward, thereby realizing the conversion of wave energy into gravitational potential energy of the counterweights and tray.
The model is moored by a two-point mooring system at the front and rear. Longitudinally, it is positioned 20 m away from the zero position of the wavemaker; transversely, it is positioned at the central axis along the width of the tank. The wave-facing width of the model is 1 m, with a scale ratio of 1:18. A SINDASTONG YWH201-A (Chengdu, China) digital capacitive wave height gauge is installed on the sidewall of the tank, 5 m away from the zero position of the wavemaker. This gauge collects incident wave sequences and calculates incident wave power, with a measurement range of 1000 mm (±0.3% FS) and a sampling frequency of 1 kHz.

3.2. Experimental Data Processing Methods

The calculation method for the incident regular wave power is as follows [19]:
P w = 1 8 ρ g H 2 B C g ,
where
  • P w represents the incident wave power (unit: W);
  • ρ represents the water density (unit: kg/m3);
  • H represents the wave height (unit: m);
  • B represents the wave-facing width of the device (unit: m);
  • C g represents the group velocity (unit: m/s).
Since the ratio of the tank depth to the maximum wavelength under the test conditions is greater than 0.5, the waves can be approximated as deep-water waves, and C g is adopted as C g = g T / ( 4 π ) , where g represents the gravitational acceleration and T represents the incident wave period (unit: s).
The calculation method for the instantaneous absorbed power of the Sharp Eagle buoy at time t is as follows:
P b ( t ) = F ( t ) v ( t ) ,
where
  • F ( t ) represents the axial force of the piston that is exerted by the buoy on the energy conversion hydraulic rod;
  • v ( t ) represents the movement velocity of the hydraulic cylinder piston that is driven by the buoy.
This variable can be calculated via the backward difference in the displacement sensor data [20] as follows:
v t = x t x t T s T s ,
where
  • x ( t ) represents the displacement output of the sensor at time t ;
  • T s represents the sampling period.
The average power of the energy conversion hydraulic rod that is driven by the buoy can be calculated using the numerical integration method:
P b ¯ = 1 N T s k = 0 N 1 P ( k T s ) ,
where N represents the number of sampling points within the calculation interval. The CWR is used to evaluate the efficiency of the buoy in converting incident wave energy into the energy of piston motion in the hydraulic system and is calculated as follows:
C W R = P b ¯ p w ,
To evaluate the motion state of the energy conversion hydraulic cylinder piston under different input conditions, the displacement sensor data can be segmented on the basis of peak values. We let the original displacement time series be x ( t ) and the identified peak time instants be t 1 , t 2 , , t N (which satisfy, i.e., local maximum values, where T s represents the sampling period). The local peak-to-peak displacement value within each cycle is defined as follows:
H p p ( t k ) = max x ( t ) min x ( t ) , x [ t k , t k + 1 ) ,
By calculating the arithmetic mean of all local peak-to-peak displacement values within the calculation interval, the average peak-to-peak displacement of the piston motion of the energy conversion hydraulic cylinder driven by the buoy can be obtained.

3.3. Experimental Operating Conditions

To systematically investigate the relationship between the CWR and the average movement range of the energy conversion hydraulic cylinder piston under various attitudes of the Sharp Eagle buoy, four influential variables that affect the Sharp Eagle WEC were selected. These variables are the static angle of the Sharp Eagle buoy, incident wave height, wave period, and load counterweight mass of the load hydraulic cylinder. Among them, the static angle of the Sharp Eagle buoy was the main independent variable of interest in the test, whereas the other parameters served as input variables.
To better control the incident wave power and eliminate interference from random factors, we adopted regular wave tests and the full factorial test method, and equated the wave height and period of regular waves to the significant wave height (Hs) and peak period (Tp) of irregular waves, respectively, based on the JONSWAP spectrum with a peak factor γ = 3.3. According to the statistics on the annual wave height and period distribution in the target sea area of this study, the South China Sea [21], 98.97% of the wave heights are within 3.5 m, and 98.93% of the wave periods are within 9 s. Guided by the Froude similarity criterion and considering the 1:18 model scale ratio as well as the output capacity of the wavemaker, we scaled down the prototype wave parameters to the model scale and designed the test conditions listed in Table 2. Since the model scale is relatively large and the hydrodynamic forces are dominated by form drag and wave radiation damping, the Froude similarity law can be used for approximate scaling, where the prototype wave heights range from 1.8 m to 3.6 m and the prototype periods range from 4.67 s to 8.91 s.
To simulate various load pressure states of the energy conversion hydraulic cylinder and cover a wider range of pressure conditions, for each test condition, at least 5 different load counterweight masses were adopted for repeated tests, with the counterweight mass ranging from 10 kg to 90 kg.

4. Results and Analysis

4.1. Analysis of the Influence of the Static Angle of the Buoy

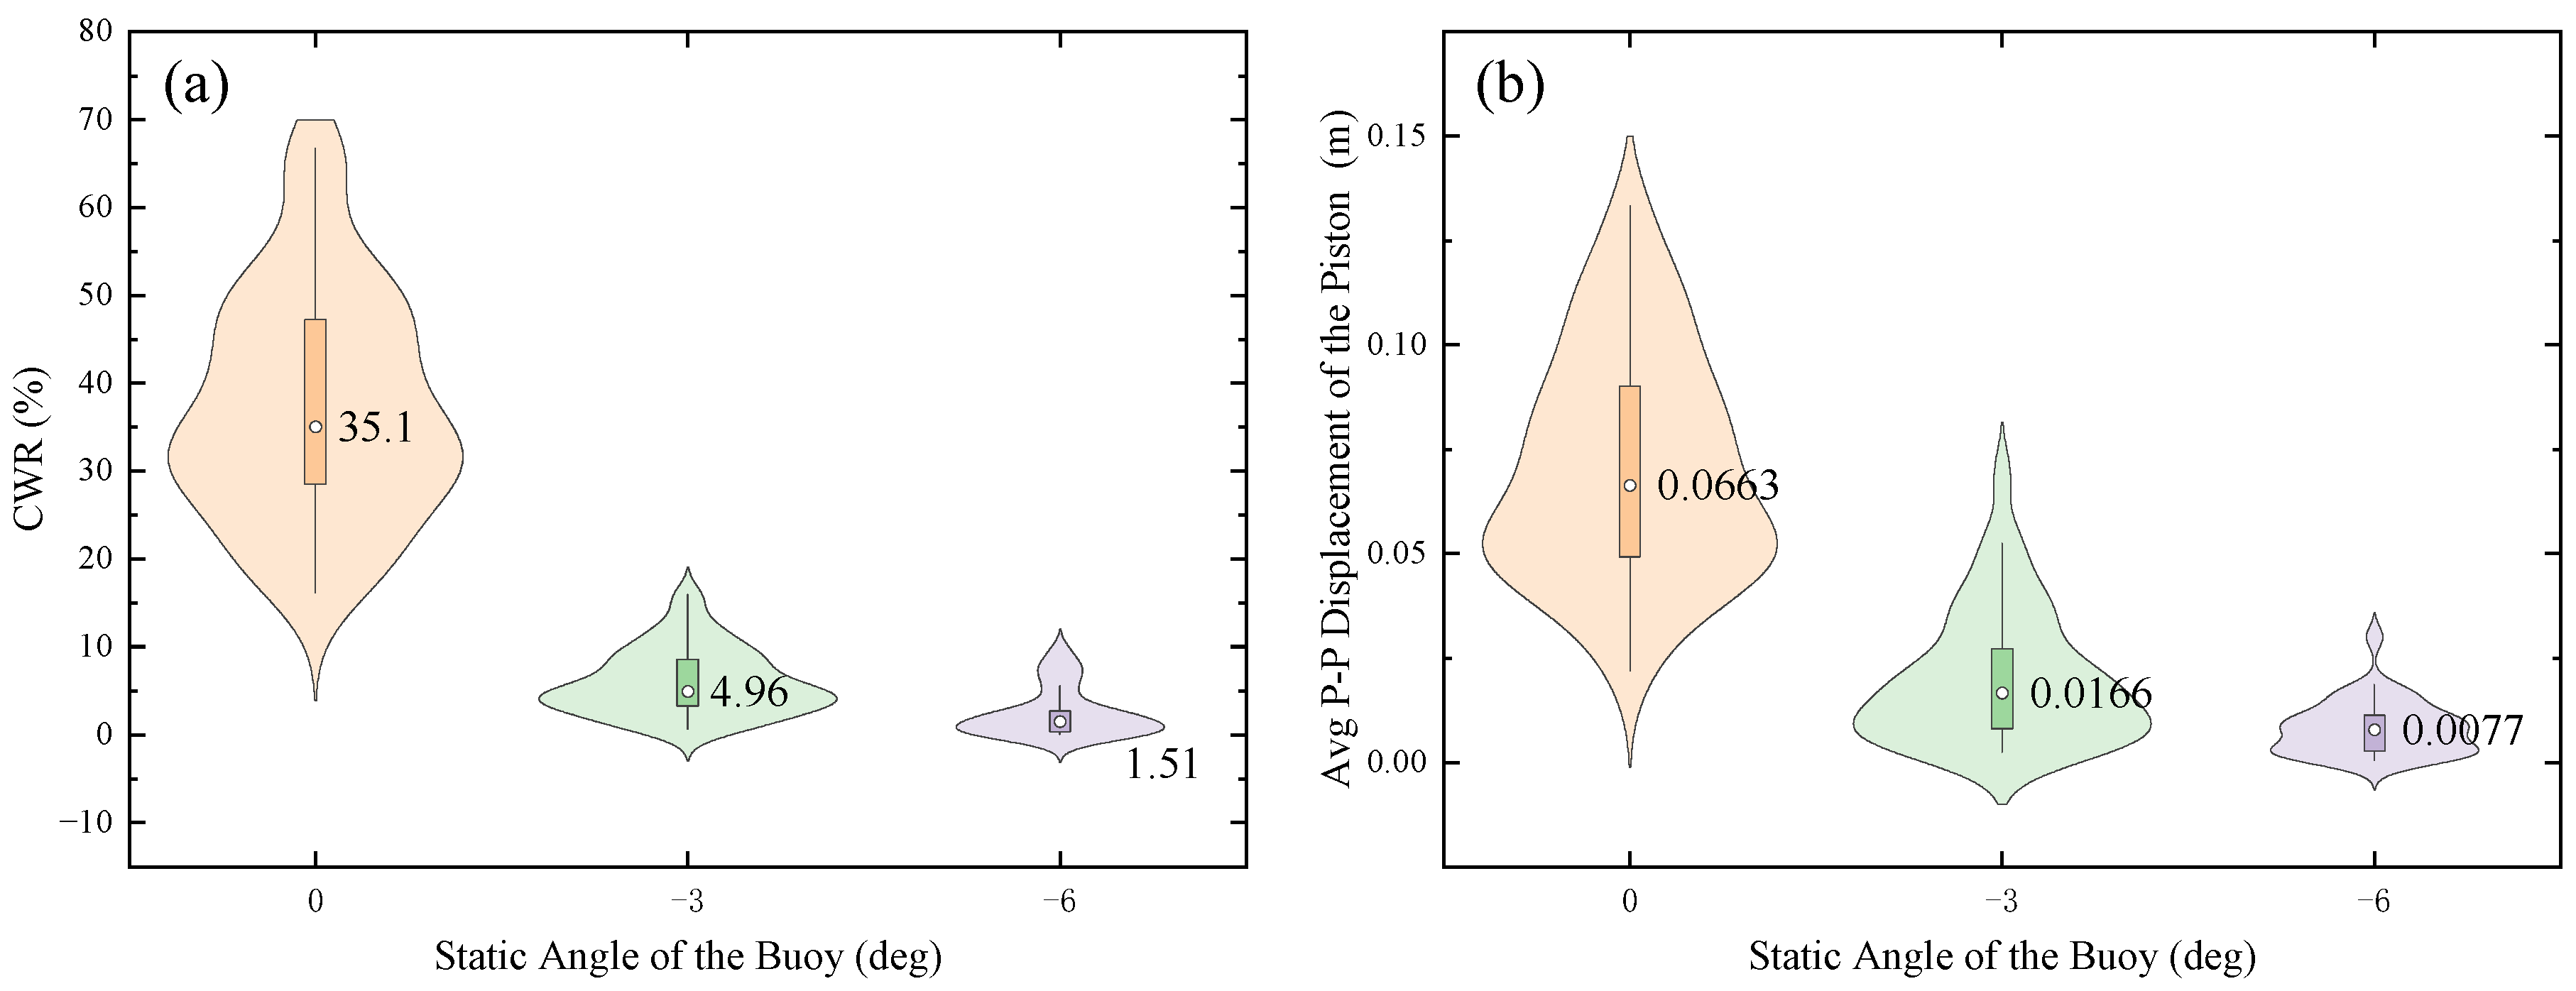
A violin plot is shown in Figure 8 to intuitively present the distribution characteristics of the CWR and the average peak-to-peak displacement of the energy conversion hydraulic cylinder piston under various static angles of the buoy. The width of the violin plot reflects the data distribution density, and the circles along with the numbers next to them indicate the median—this format allows for intuitive observation of the central tendency and dispersion degree of the CWR and the average peak-to-peak piston displacement as the static angle of the buoy changes.
As the static angle of the buoy changed from 0° to 6°, the medians of both the CWR and the average peak-to-peak displacement of the energy conversion hydraulic cylinder piston tended to decrease, and the data distribution intervals gradually narrowed. These results indicate that when the static angle was close to 0°, the conversion efficiency of the WEC and the average peak-to-peak displacement of the buoy were relatively high; when the attitude of the buoy tilted downward (i.e., the buoy was submerged deeper into the water), both their overall levels decreased, and their fluctuations diminished.

4.2. Analysis of the Influence of the Incident Wave Height

The distribution of the CWR at varying incident wave heights is shown in Figure 9, where (a), (b), and (c) correspond to the violin plots for the buoy at static angles of 0°, −3°, and −6°, respectively. The influence of the incident wave height on the CWR varies with the static angle of the buoy.
Specifically, when the buoy’s static angle was 0°, as the incident wave height increased from 0.10 m to 0.20 m, the median CWR tended to decrease. When the static angle was −3°, the CWR remained essentially stable, with no obvious upward or downward trend. When the static angle was −6°, the CWR distribution tended to increase. These findings verify that the static angle of the Sharp Eagle buoy is a key parameter for regulating the characteristics of the response of its energy capture to incident wave heights.
The variation in the average peak-to-peak displacement of the energy conversion hydraulic cylinder piston with the incident wave height under three static angles of the Sharp Eagle buoy is shown in Figure 10, where subfigures (a–c) correspond to the Sharp Eagle buoy at static angles of 0°, −3°, and −6°, respectively.
The figure shows that under the three static angles of the Sharp Eagle buoy, as the incident wave height increased, both the median displacement and the distribution of the average peak-to-peak displacement of the energy conversion hydraulic cylinder piston increased. However, the smaller (i.e., the more negative) the static angle was, the smaller the peak-to-peak displacement. This finding verifies that under severe sea conditions, lowering the attitude of the buoy (i.e., submerging it deeper into the water) can effectively reduce the motion amplitude of the buoy and enhance its safety. However, adjusting the ballast water level of the full-scale WEC requires pumping water in or out of the buoy, and such a process can take tens of minutes, thus exhibiting hysteresis behavior under stochastic sea-state transitions.

4.3. Analysis of the Influence of the Counterweight Mass of the Load Hydraulic Cylinder

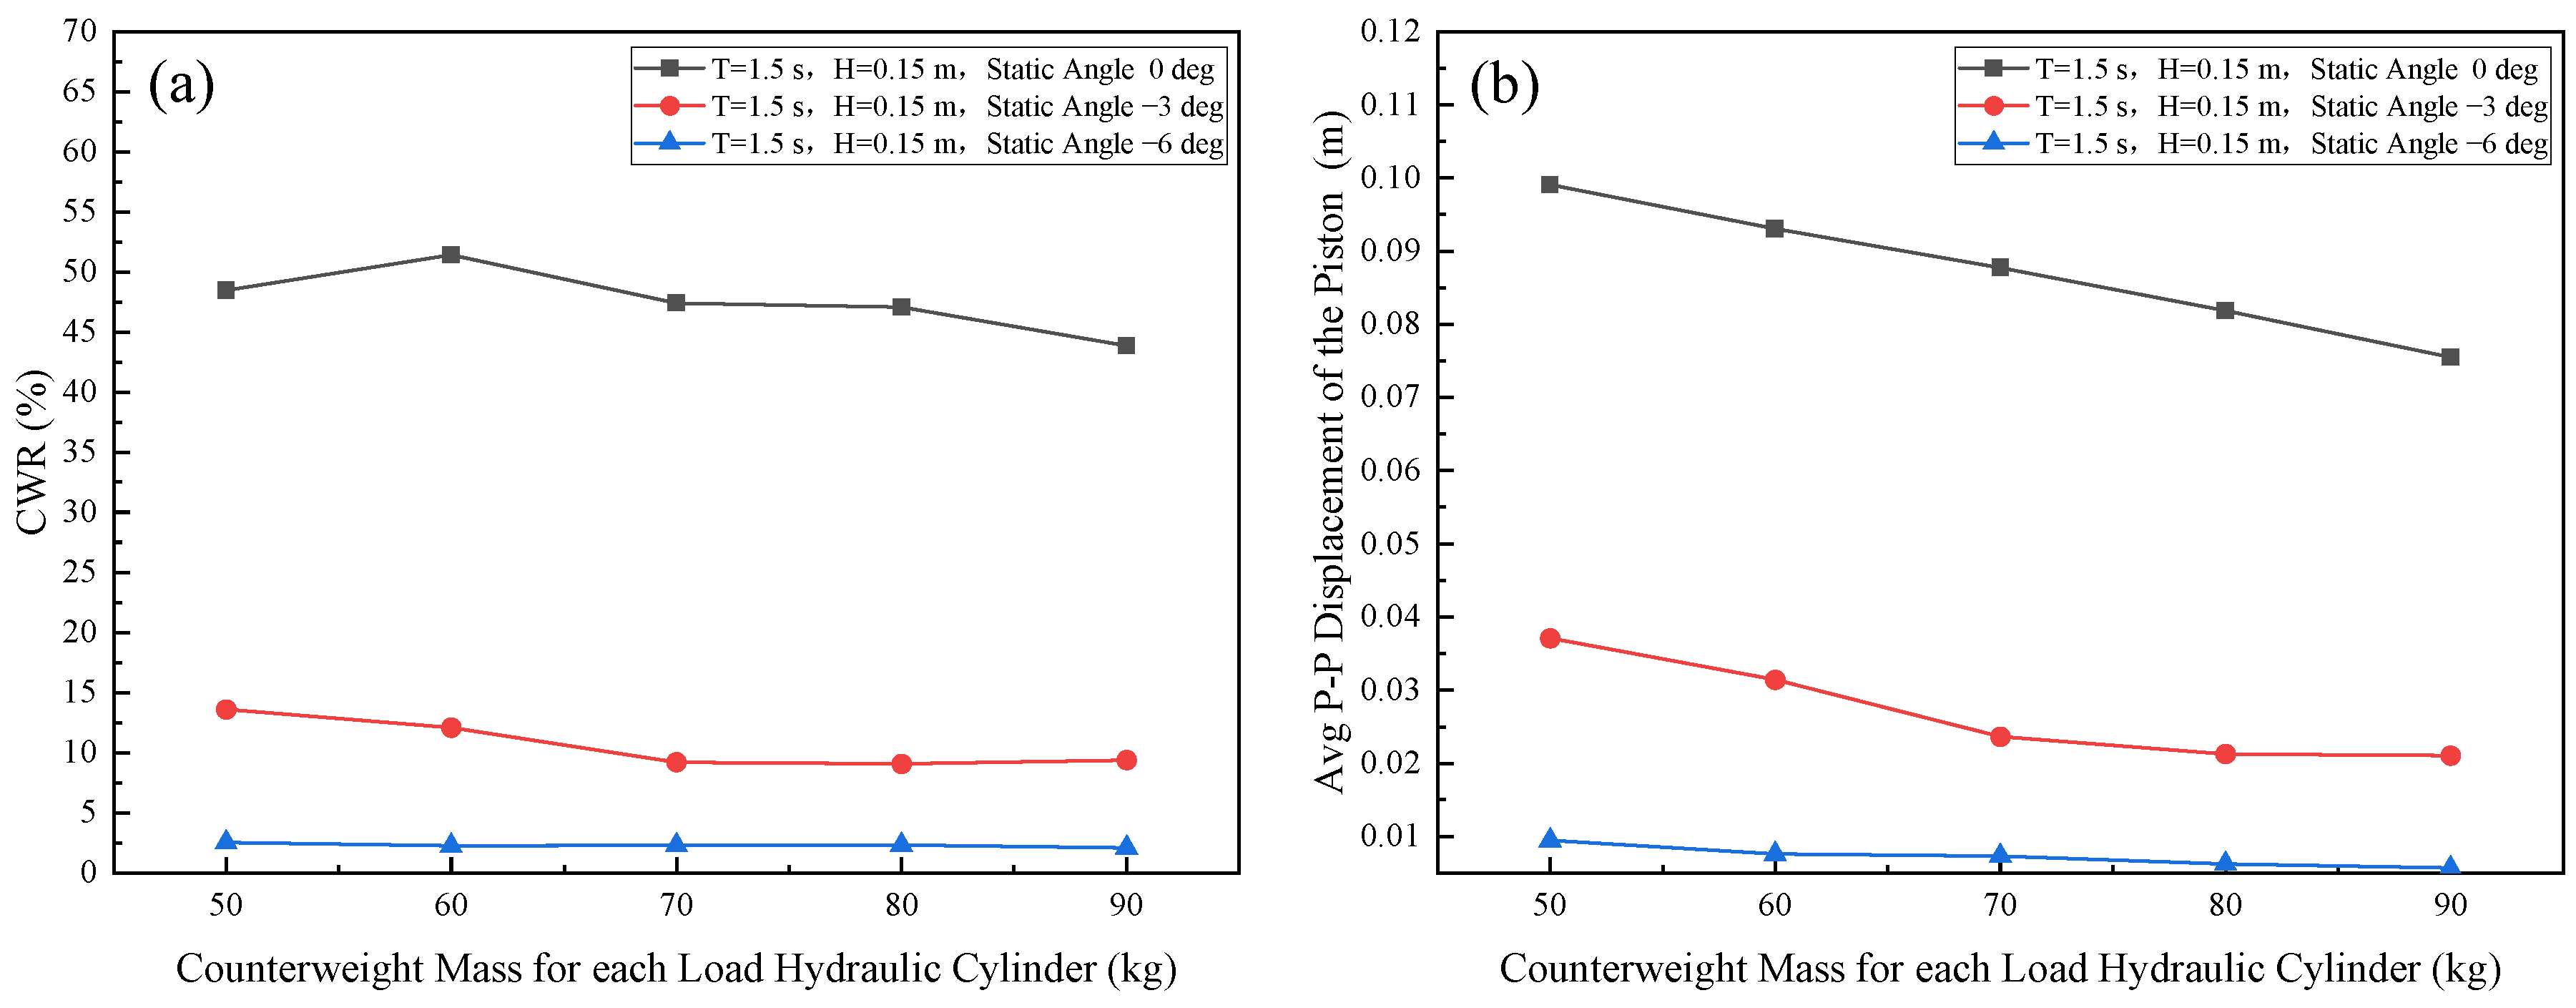
By adjusting the counterweight mass of the load hydraulic cylinder, the pressure of the hydraulic system can be regulated to simulate the load effect of the accumulator pressure in the hydraulic system. Under the conditions of a fixed incident wave period, wave height, and static angle of the buoy, the load counterweight mass of the load hydraulic cylinder has little influence on the CWR and the average peak-to-peak displacement of the energy conversion hydraulic cylinder piston.
Taking the incident wave conditions of a wave height of 0.20 m and a period of 1.5 s as an example, as shown in Figure 11, under various load conditions, the CWR of the WEC and the average peak-to-peak displacement of the energy conversion hydraulic cylinder piston showed little variation. However, they varied significantly with different static angles. Thus, controlling the static angle of the buoy rather than adjusting the hydraulic cylinder load is key.
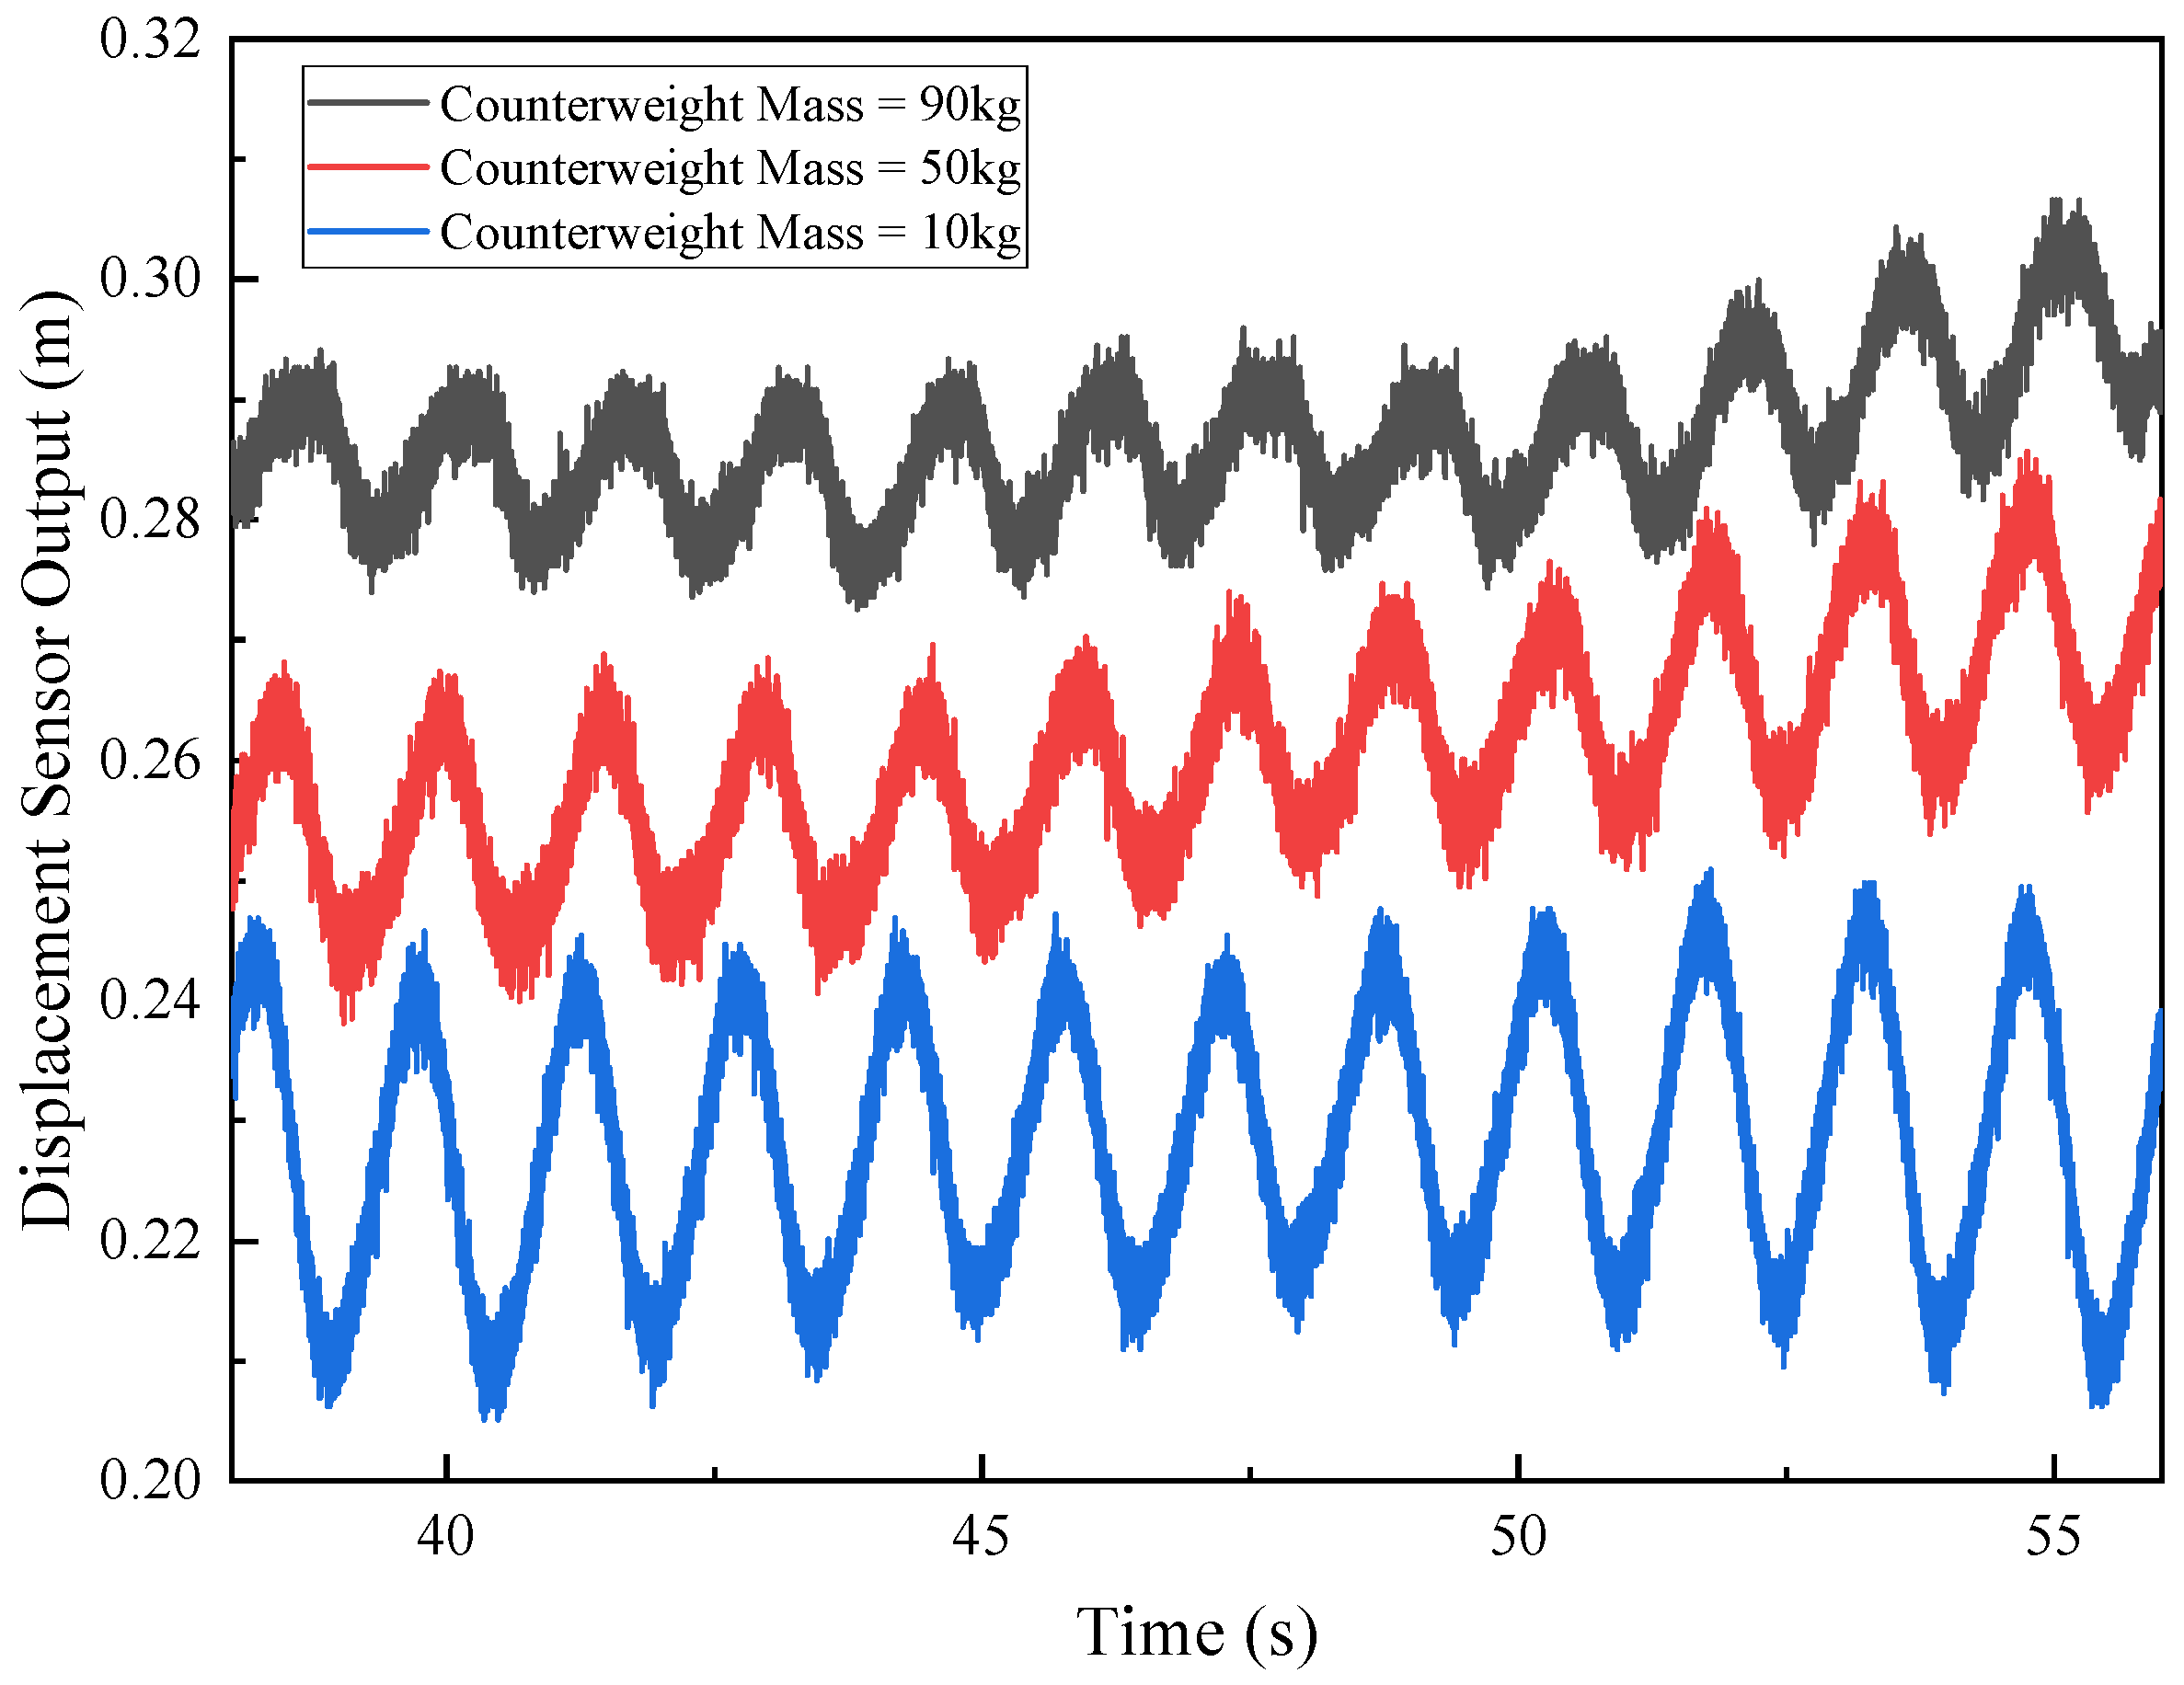
Although the load counterweight mass of the load hydraulic cylinder has a limited influence on the average peak-to-peak displacement of the energy conversion hydraulic cylinder piston, it significantly affects the average position of the piston.
Under the conditions of a wave height of 0.20 m, a period of 1.5 s, and a static angle of the Sharp Eagle buoy of −6°, the real-time output curve of the piston displacement sensor for the energy conversion hydraulic cylinder of the wave-facing Sharp Eagle buoy is shown in Figure 12. As the load counterweight mass of the load hydraulic cylinder increased, the motion amplitude of the energy conversion hydraulic cylinder piston decreased slightly; however, owing to the downward shift in the oscillation center point, its maximum elongation increased instead. This easily caused the hydraulic cylinder piston to reach its design limit, which made fully utilizing the stroke of the energy conversion hydraulic cylinder impossible. Therefore, the hydraulic system pressure needs to be adjusted in coordination with the adjustment of the Sharp Eagle buoy’s static angle.

4.4. Verification and Analysis of the Attitude Control Strategy for Sharp Eagle Buoys

To verify the feasibility of the attitude control strategy for the Sharp Eagle buoy, a scaled-down model was used for experimental verification. To ensure the safe operation of the Sharp Eagle WEC model, two main constraint conditions must be satisfied:
  • After conversion by wave-to-electricity efficiency, the wave energy that is captured by the buoy should not exceed the rated installed capacity for an extended period;
  • The motion range of the Sharp Eagle buoy must be within the safe stroke of the energy conversion hydraulic cylinder.
In the model test, the total stroke of the hydraulic cylinder was 0.3 m, with the corresponding safe stroke set to 0.2 m and a 0.05 m protective zone reserved at each end. This ensured consistency between the model and the actual device in terms of safety redundancy design.
Analysis of the influence of the buoy’s static angle on the CWR of the Sharp Eagle WEC and the piston displacement distribution characteristics of the energy conversion hydraulic cylinder revealed that making the Sharp Eagle buoy’s static angle more negative can reduce the energy capture efficiency and the range of motion of the energy conversion hydraulic cylinder piston under the same sea conditions. However, this causes the average position of the piston to shift toward the extension direction. Therefore, to determine whether the energy conversion hydraulic cylinder operates within the safe range, verifying that the piston’s motion remains within the safe zones of both the upper and lower limit points simultaneously is necessary.
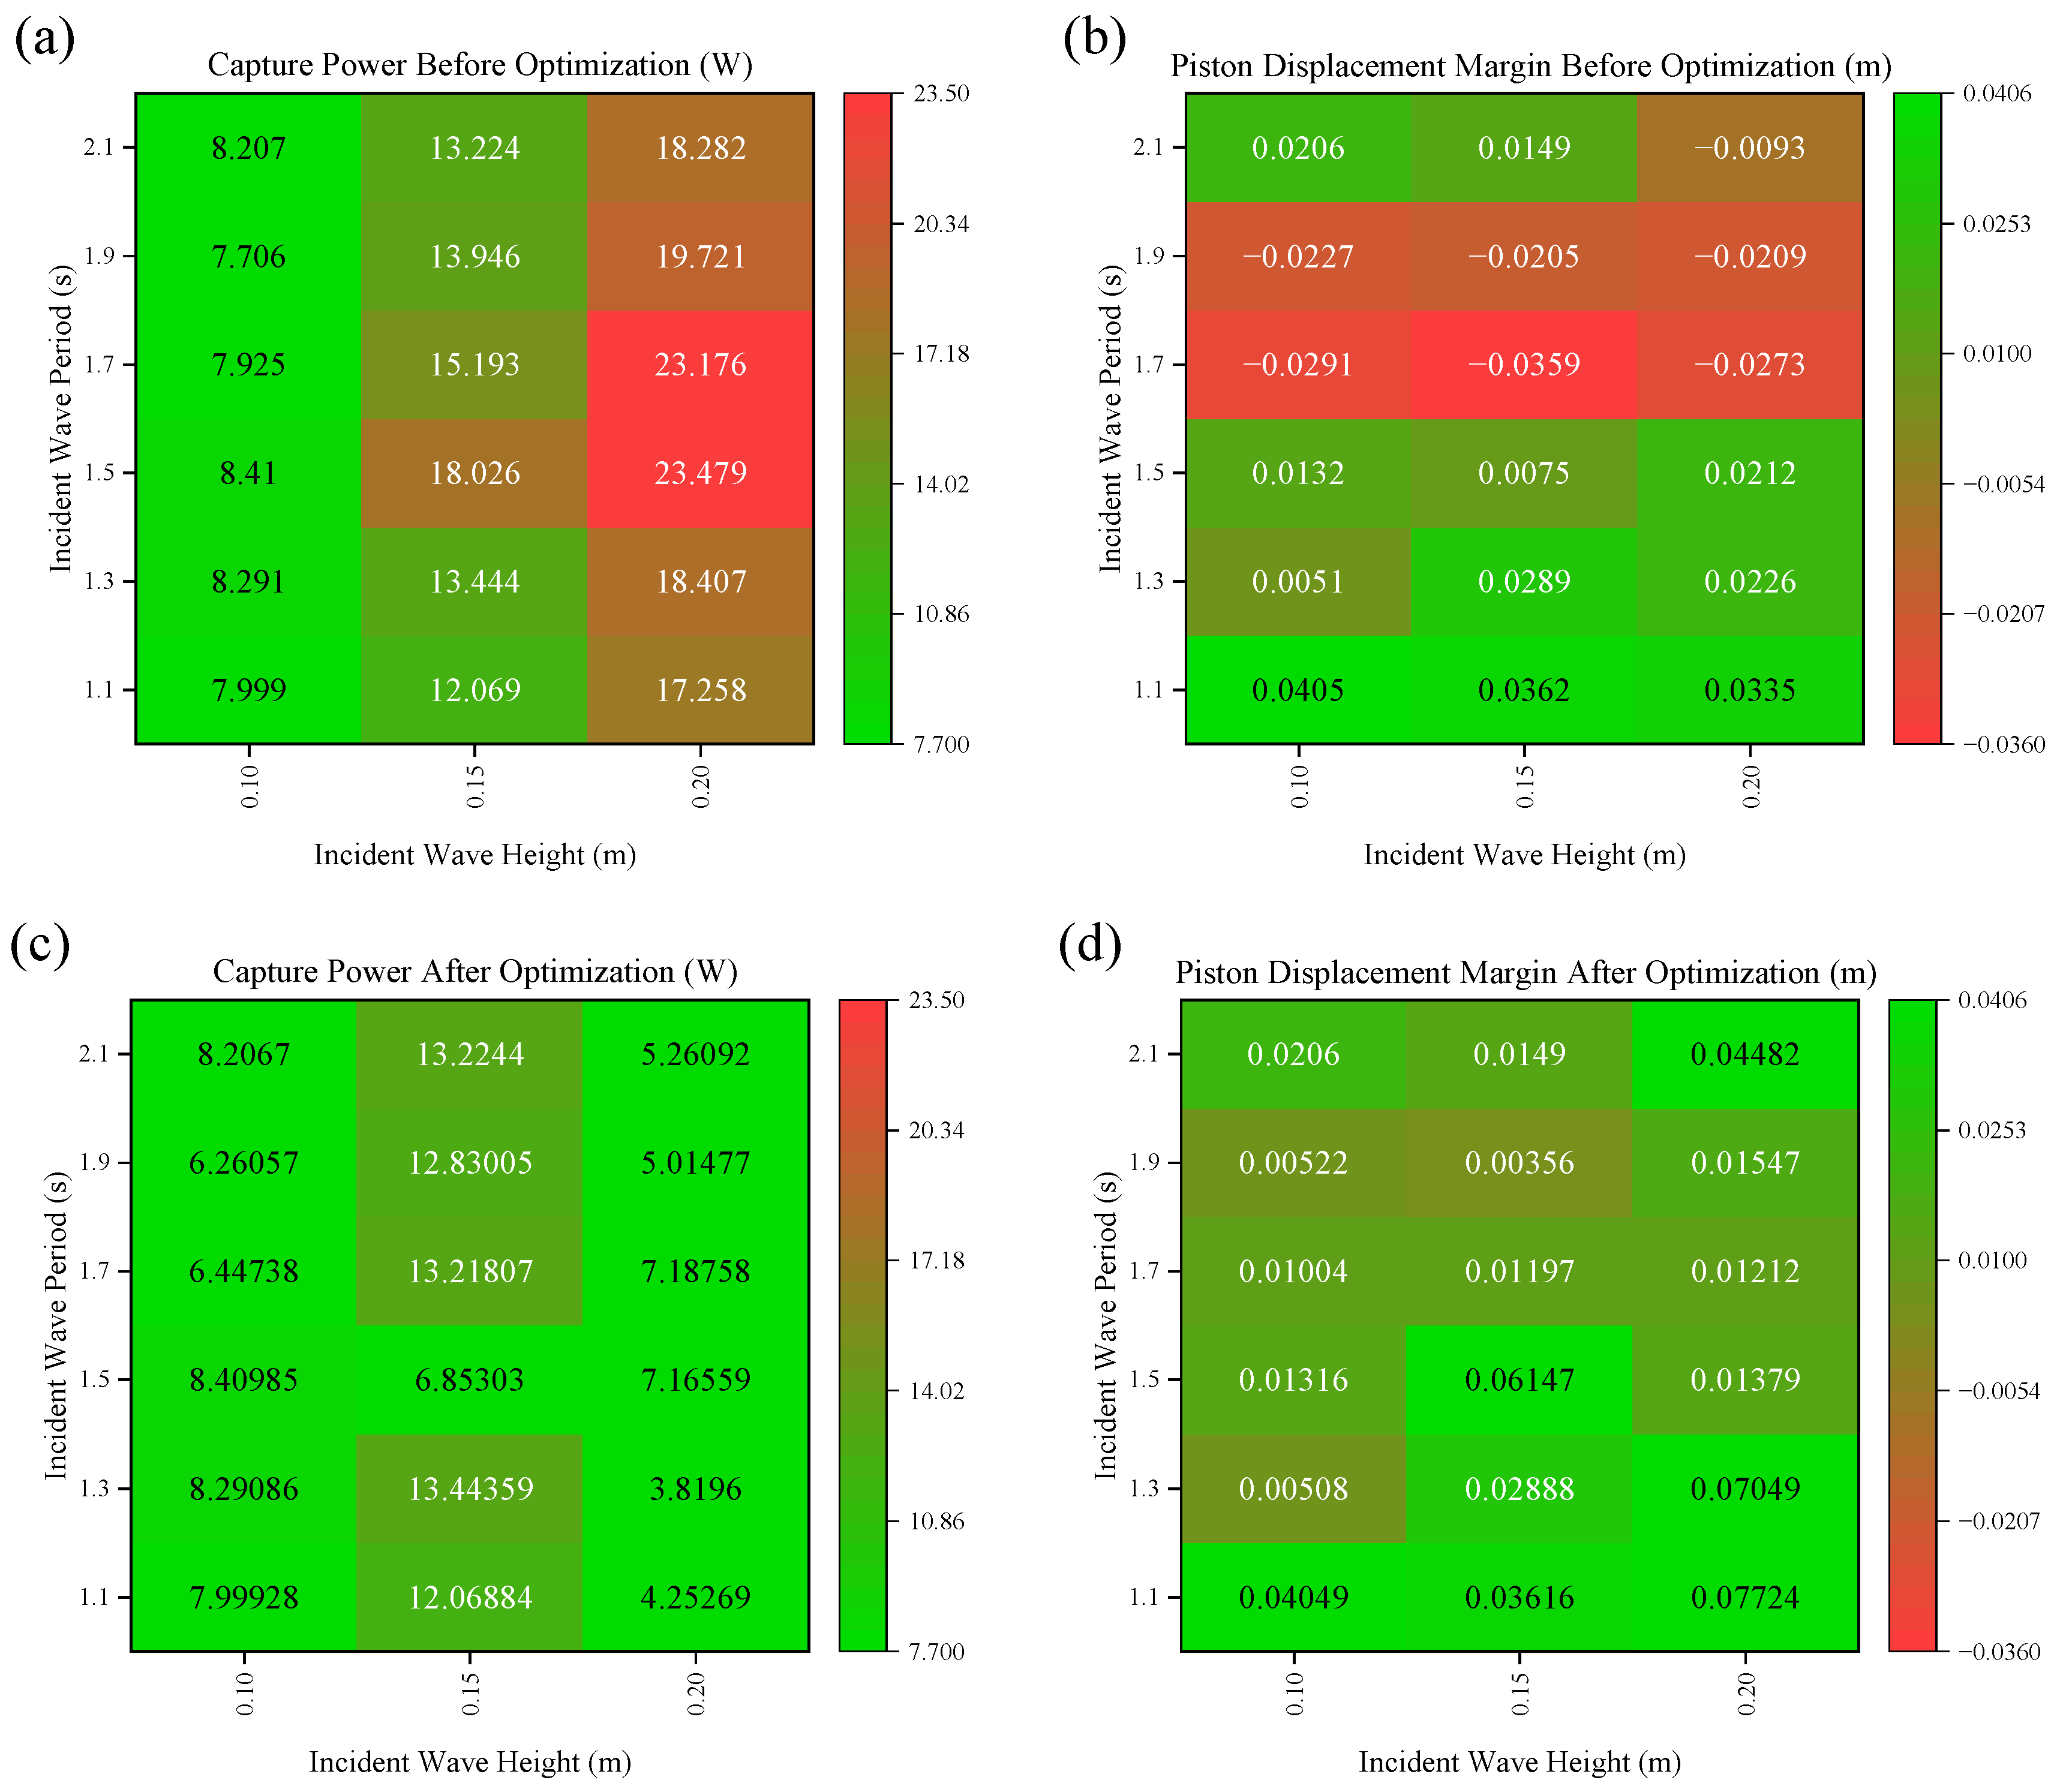
To quantify the safety redundancy of the hydraulic cylinder, for the front and rear Sharp Eagle buoys, the minimum distance from the upper and lower limit points of the working piston’s movement to the boundary of the protective zone is defined as the piston margin of the energy conversion hydraulic cylinder. If this margin is greater than 0, the hydraulic cylinder piston moves within the safe stroke without the risk of limit contact; otherwise, the piston has entered the protective zone, thus posing a risk of contacting the end-stop structures.
In the model test, the rated power capture capacity of the buoy of 15 W was set as the target. The incident wave period and wave height were set as environmental input variables, whereas the static angle of the Sharp Eagle buoy and the hydraulic system load were set as controllable variables. The effects of the two regulation strategies were compared:
  • When the static angle of the buoy was 0°, the power capture capacity and the minimum distance from the hydraulic cylinder’s motion range to the boundary of the safe zone were as shown in Figure 13.
  • When the angle of the Sharp Eagle buoy remained unchanged, dual risk events (exceeding the rated power capture capacity and the hydraulic cylinder exceeding the safe stroke) occurred under severe sea conditions.
After the Sharp Eagle buoy’s static angle was optimized, the buoy’s power capture capacity was controlled within the rated range, and the hydraulic cylinder stroke never exceeded the range of the protective zone throughout the process; thus, efficient operation of the system under safety constraints was realized.
Compared with the previous hydraulic autonomous system with a constant setpoint, the new control strategy incorporates the displacement of the hydraulic cylinder piston into the generation of hydraulic setpoints. This can fully utilize the hydraulic cylinder stroke and reduce the risk of the end-stop problem of the hydraulic power take-off system. The buoy attitude control based on incident wave height prediction and ballast adjustment further reduces the CWR under large waves, avoiding the risk of the piston simultaneously triggering the top and bottom limits. Compared with the previous method of single buoy ballast or hydraulic pressure control, it is more conducive to prolonging the continuous working time of the Sharp Eagle WEC under all sea states. The next step will involve the design and commissioning of the controller for the full-scale WEC device.
The optimized operating parameters under various wave conditions are detailed in Table 3.

5. Limitations

This study has several limitations:
  • More extreme sea conditions experimental conditions are required, and the response and transition under irregular wave input should be considered. The submersion and locking protection strategy of the buoy under extreme conditions requires further verification.
  • Pipeline losses and leakage of the hydraulic system were not considered, and the power conversion efficiency of the full-scale device needs further correction on the basis of the results of this study.
  • The adjustment step size of the static angle of the Sharp Eagle buoy was relatively large; hence, further refined zoning between 0° and -6° is needed, and more integration with simulations is needed to increase the precision of controlling the power capture capacity and the motion range of the energy conversion hydraulic cylinder piston.

6. Conclusions

Given the significant seasonal variations in the temporal distribution of wave energy resources, WECs must be operated safely under a wide range of sea conditions, and the duration of protective shutdowns must be minimized. To address this issue, we proposed a method for adjusting the static angle by modifying the ballast of the Sharp Eagle buoy, thereby reducing the CWR of the buoy and the motion range of the hydraulic cylinder piston under severe sea conditions.
On the basis of scaled-model test data, we verified the feasibility of the optimized attitude control method for buoys from the perspectives of the rated power capture capacity and the safe operation range of the energy conversion hydraulic cylinder piston. This provides an optimized scheme and data support for the engineering parameter regulation of offshore WECs.
Through a scaled-model test, the CWR and average motion range of the energy conversion hydraulic cylinder piston were measured at incident wave heights of 0.10 m, 0.15 m, and 0.20 m and incident wave periods of 1.1 s, 1.3 s, 1.5 s, 1.7 s, 1.9 s, and 2.1 s. The effects of the static angle of the Sharp Eagle buoy, incident wave height, and counterweight mass of the load hydraulic cylinder were analyzed. We proposed a method for adjusting the static angle of the Sharp Eagle buoy and the counterweight mass of the load hydraulic cylinder according to the incident wave height and period, which achieves the goals of keeping the power capture capacity within the rated value range and the hydraulic cylinder piston motion within the safe range under severe sea conditions.
The conclusions are as follows:
  • When the static angle of the Sharp Eagle buoy is 0°, the highest CWR can be obtained. However, the motion range of the energy conversion hydraulic cylinder piston is also larger, which may easily lead to excessive power capture capacity or the piston exceeding the safe operation range.
  • Reducing the static angle of the Sharp Eagle buoy helps decrease the CWR and narrow the motion range of the energy conversion hydraulic cylinder piston under severe sea conditions, which is conducive to improving the safety margin and avoiding the risk of limit contact.
  • The counterweight mass affects the average oscillation position of the hydraulic cylinder piston. When the static angle of the Sharp Eagle buoy is reduced, the pressure of the load hydraulic cylinder must be adjusted downward to ensure that the range of motion of the energy conversion hydraulic cylinder remains within the safe zone.
  • A new control strategy adjusts the buoy’s ballast based on incident wave height and incorporates the displacement of the hydraulic cylinder piston into the generation of hydraulic setpoints. This can reduce the risk of the end-stop problem of the hydraulic power take-off system.
The academic and engineering significance of this study lies in the clarification of the key relationships among the static angle of the Sharp Eagle buoy, the CWR, and the motion range of the energy conversion hydraulic cylinder. The static angle of the buoy was confirmed to significantly affect the CWR and the motion range of the energy conversion hydraulic cylinder, and the adjustment of this angle provides a feasible path for subsequent control of the buoy’s power capture capacity and the energy conversion hydraulic cylinder piston position, thereby ultimately enabling full-sea-condition, high-efficiency, and high-safety operation of the WEC.

Author Contributions

Conceptualization, K.W. and Y.Y.; methodology, K.W., P.C. and Y.Y.; software, P.C.; validation, K.W., Y.Y., W.W. and Y.Z.; formal analysis, P.C.; investigation, P.C.; resources, K.W., S.S. and Y.Y.; data curation, P.C.; writing—original draft preparation, P.C.; writing—review and editing, K.W., Y.Y. and Y.Z.; visualization, P.C.; supervision, K.W. and S.S.; project administration, K.W.; funding acquisition, K.W. and S.S. All authors have read and agreed to the published version of the manuscript.

Funding

This research was funded by the 2024 Marine Economy Development Project of Guangdong Province, grant number GDNRC [2024]21.

Data Availability Statement

Data are contained within the article.

Acknowledgments

The authors express their sincere gratitude to the ship model towing tank laboratory of South China University of Technology for providing its laboratory facilities to support the model tests.

Conflicts of Interest

The authors declare that they have no known competing financial interests or personal relationships that could have appeared to influence the work reported in this paper.

Abbreviations

The following abbreviations are used in this manuscript:
WECWave energy converter
CWRCapture width ratio
OTECOcean thermal energy conversion
SGESalinity gradient energy
6-DOFSix degrees of freedom
Avg P-PAverage peak to peak

References

  1. Su, X.; Chen, J.; Yuan, L.; Xu, W.; Xiong, C.; Wang, X. Current status of development and application of ocean renewable energy technology. Sustainability 2025, 17, 5648. [Google Scholar] [CrossRef]
  2. Tang, E.; Gao, J.; Huang, W.; Qian, Y. Marine renewable energy: Progress, challenges, and pathways to scalable sustainability. Energy 2025, 335, 138083. [Google Scholar] [CrossRef]
  3. Shao, Z.; Gao, H.; Liang, B.; Lee, D. Potential, trend and economic assessments of global wave power. Renew. Energy 2022, 195, 1087–1102. [Google Scholar] [CrossRef]
  4. Wen, Y.; Low, Y.M. Long-term resource assessment and decarbonization potential of wave energy. Renew. Energy 2025, 256, 124287. [Google Scholar] [CrossRef]
  5. Bouckaert, S.; Pales, A.F.; McGlade, C.; Remme, U.; Wanner, B.; Varro, L.; D’Ambrosio, D.; Spencer, T. Net Zero by 2050: A Roadmap for the Global Energy Sector. Available online: https://trid.trb.org/View/1856381 (accessed on 29 September 2025).
  6. Aderinto, T.; Li, H. Ocean wave energy converters: Status and challenges. Energies 2018, 11, 1250. [Google Scholar] [CrossRef]
  7. Zhou, B.; Wang, Y.; Zhang, H.; Jin, P.; Wang, L.; Zhou, Z. Wave Extraction and Attenuation Performance of A Hybrid System of An Edinburgh Duck WEC and A Floating Breakwater. China Ocean Eng. 2022, 36, 167–178. [Google Scholar] [CrossRef]
  8. Mo, L.; Bu, Y. Sharp Eagle Wave Absorbing Floats of Wave Power Generation Device. J. Shanghai Ship Shipp. Res. Inst. 2023, 46, 15–21. [Google Scholar]
  9. Sheng, S.; Wang, K.; Lin, H.; Zhang, Y.; You, Y.; Wang, Z.; Chen, A.; Jiang, J.; Wang, W.; Ye, Y. Model research and open sea tests of 100 kW wave energy convertor Sharp Eagle Wanshan. Renew. Energy 2017, 113, 587–595. [Google Scholar] [CrossRef]
  10. Chen, M.; Sheng, S.; Zhang, Y.; Wang, Z.; Wang, K.; Jiang, J. Model test and sea trial of a multi-absorber 1 MW wave energy converter. Energies 2025, 18, 4711. [Google Scholar] [CrossRef]
  11. Wei, J.; Changjie, L.; Jie, X.; Xun, G.; Lining, Z.; Wenjun, O. Characterization and assessment of wave energy resources in guangdong offshore area. Acta Energiae Solaris Sin. 2025, 46, 476–482. [Google Scholar]
  12. Shi, H.; Zhang, X.; Du, W.; Li, Q.; Qu, H.; You, Z. Assessment of wave energy resources in China. J. Mar. Sci. Eng. 2022, 10, 1771. [Google Scholar] [CrossRef]
  13. Mahmoodi, K.; Saybani, M.; Azad, S.T. A temporal and spatial resolution wind and wave power resource assessment in the Oman Gulf. Ocean Eng. 2022, 249, 110881. [Google Scholar] [CrossRef]
  14. Zhang, D.; Li, C.; Bi, R.; Huang, X.; Sun, Z.; Lan, T.; Wang, Y.; Huang, T.; Qian, P. Conversion mechanism for solving the end-stop problem of hydraulic power take-off system for wave energy. Ocean Eng. 2024, 294, 116776. [Google Scholar] [CrossRef]
  15. McGilton, B.; Nakhai, A.Y.; McNally, J. On the Optimal Sizing of Power Take-off Systems for Wave Energy Converters. Renew. Energy 2025, 252, 123375. [Google Scholar] [CrossRef]
  16. Zeinali, S.; Wiktorsson, M.; Forsberg, J.; Lindgren, G.; Lindström, J. Optimizing the hydraulic power take-off system in a wave energy converter. Ocean Eng. 2024, 310, 118636. [Google Scholar] [CrossRef]
  17. Leon-Quiroga, J.A.; Bacelli, G.; Forbush, D.D.; Spencer, S.J.; Coe, R.G. An Efficient and Effective WEC Power Take-Off System. IEEE Trans. Sustain. Energy 2023, 14, 1526–1539. [Google Scholar] [CrossRef]
  18. Shifat, T.A.; Coe, R.; Bacelli, G.; Brekken, T. Real-time sea state estimation for wave energy converter control via machine learning. Appl. Sci. 2025, 15, 5772. [Google Scholar] [CrossRef]
  19. Dean, R.G.; Dalrymple, R.A. Water Wave Mechanics for Engineers and Scientists; World Scientific Publishing Company: Singapore, 1991; ISBN 978-981-4365-69-7. [Google Scholar]
  20. Åström, K.J.; Wittenmark, B. Computer-Controlled Systems: Theory and Design, 3rd ed.; Courier Corporation: Chelmsford, MA, USA, 2013. [Google Scholar]
  21. Lin, C.; Zhang, Q.; Sheng, S.; Zhou, B.; Xiang, R.; Wu, X.; Zhou, Z.; Jin, P. Novel design and performance evaluation of a hybrid system of floating offshore wind turbine and Sharp-Eagle WECs. Ocean Eng. 2025, 340, 122387. [Google Scholar] [CrossRef]
Figure 1. Schematic illustrations of the static angle for a single buoy (a WEC has multiple buoys): (a) 0°; (b) −3°; (c) −6°.
Jmse 13 02184 g001
Figure 2. The megawatt-scale floating WEC, Nankun.
Jmse 13 02184 g002
Figure 3. The hysteresis curve of predicted wave height and static angle of the Sharp Eagle buoy, and the arrows indicate the hysteretic output characteristics.
Jmse 13 02184 g003
Figure 4. Structural design diagram of the Sharp Eagle WEC model.
Jmse 13 02184 g004
Figure 5. The upper and lower limit points of the buoy: (a) Upper limit point; (b) lower limit point.
Jmse 13 02184 g005
Figure 6. Physical diagram and main structures of the Sharp Eagle WEC model.
Jmse 13 02184 g006
Figure 7. Physical model and hydraulic power system of the Sharp Eagle WEC.
Jmse 13 02184 g007
Figure 8. Effects of the Sharp Eagle buoy static angle on the CWR and Avg P-P displacement of the energy conversion cylinder piston: (a) Distribution of the CWR vs. the buoy static angle; (b) distribution of the Avg P-P piston displacement vs. the buoy static angle.
Jmse 13 02184 g008
Figure 9. Distributions of CWR vs. the incident wave height: (a) Static angle: 0°; (b) static angle: −3°; (c) static angle: −6°.
Jmse 13 02184 g009
Figure 10. Distribution characteristics of the Avg P-P displacement of the energy conversion cylinder piston vs. the incident wave height: (a) Static angle: 0°; (b) static angle: −3°; (c) static angle: −6°.
Jmse 13 02184 g010
Figure 11. Effects of the counterweight mass of load hydraulic cylinders on CWR and piston displacement: (a) CWR variation vs. counterweight mass for load hydraulic cylinders; (b) Avg P-P displacement variation in the energy conversion cylinder piston vs. the counterweight mass of load hydraulic cylinders.
Jmse 13 02184 g011
Figure 12. Impact characteristics of various counterweight masses of load cylinders on the hydraulic cylinder displacement of the wave-facing Sharp Eagle buoy.
Jmse 13 02184 g012
Figure 13. Thermodynamic diagrams of the wave energy capture power and energy conversion cylinder piston displacement margin for the Sharp Eagle buoy under severe sea conditions (before and after static angle optimization): (a) Before optimization: wave energy capture power; (b) before optimization: energy conversion cylinder piston displacement margin; (c) after optimization: wave energy capture power; (d) after optimization: energy conversion cylinder piston displacement margin.
Jmse 13 02184 g013
Table 1. Static angle control of the Sharp Eagle buoys on the basis of weather forecasts.
Predicted Wave Height (m)Static Angle of the Sharp Eagle Buoy (Deg)Control Target
0–H20Maximize Wave Absorption Efficiency
H1–H4−3Balance Efficiency and Stability
H3–H6−6Prioritize Safeguarding Structural Safety
>H5Submersion LockingEmergency Safety Protection
Table 2. Operating conditions for the model tests.
CaseIncident Wave Period (s)Incident Wave Height (m)Static Angle of the Buoy (Deg)
1~61.1, 1.3, 1.5, 1.7, 1.9, 2.10.100
7~121.1, 1.3, 1.5, 1.7, 1.9, 2.10.150
13~181.1, 1.3, 1.5, 1.7, 1.9, 2.10.200
19~241.1, 1.3, 1.5, 1.7, 1.9, 2.10.10−3
25~301.1, 1.3, 1.5, 1.7, 1.9, 2.10.15−3
31~361.1, 1.3, 1.5, 1.7, 1.9, 2.10.20−3
37~421.1, 1.3, 1.5, 1.7, 1.9, 2.10.10−6
43~481.1, 1.3, 1.5, 1.7, 1.9, 2.10.15−6
49~541.1, 1.3, 1.5, 1.7, 1.9, 2.10.20−6
Table 3. Optimized operating parameters (counterweight mass for load hydraulic cylinders and static angle of the Sharp Eagle buoy) under wave conditions.
Incident Wave Period (s)Incident Wave Height
0.10 m
Incident Wave Height
0.15 m
Incident Wave Height
0.2 m
Load (kg)Static Angle (deg)Load (kg)Static Angle (deg)Load (kg)Static Angle (deg)
1.160080050−3
1.320050010−3
1.550010−310−3
1.780090030−3
1.990080030−3
2.190090030−3
Disclaimer/Publisher’s Note: The statements, opinions and data contained in all publications are solely those of the individual author(s) and contributor(s) and not of MDPI and/or the editor(s). MDPI and/or the editor(s) disclaim responsibility for any injury to people or property resulting from any ideas, methods, instructions or products referred to in the content.